Article

Developing a Composite Hydrological Drought Index Using the VIC Model: Case Study in Northern Thailand

by
Duangnapha Lapyai
1,
Chakrit Chotamonsak
1,2,*,
Somporn Chantara
1 and
Atsamon Limsakul
3
1
Environmental Science Research Center, Faculty of Science, Chiang Mai University, Chiang Mai 50200, Thailand
2
Department of Geography, Faculty of Social Sciences, Chiang Mai University, Chiang Mai 50200, Thailand
3
Climate Change and Environmental Research Center, Pathum Thani 12120, Thailand
*
Author to whom correspondence should be addressed.
Water 2025, 17(18), 2732; https://doi.org/10.3390/w17182732
Submission received: 7 August 2025 / Revised: 11 September 2025 / Accepted: 13 September 2025 / Published: 16 September 2025
(This article belongs to the Section Hydrology)

Abstract

Hydrological drought indices, while critical for monitoring, are often limited by their reliance on single variables, failing to capture the multidimensional complexity of water scarcity, particularly in data-scarce and climate-sensitive regions. This study addresses this critical gap by introducing a Composite Hydrological Drought Index (CHDI) for a northern watershed in Thailand, a region where drought risk is intensified by climatic shifts and intensive land use. The proposed methodology integrates multiple outputs from the Variable Infiltration Capacity (VIC) hydrological model, including precipitation, runoff, evapotranspiration, baseflow, and soil moisture layers, and employs Principal Component Analysis (PCA) to synthesize the dominant drivers of water-level variability. The first principal component (PC1), which accounted for over 50% of the total variance, served as the basis for the CHDI, and was strongly correlated with precipitation, surface runoff, and surface soil moisture. The performance of CHDI was rigorously evaluated against observed data from eight hydrological stations. The index demonstrated significant predictive skill, with Pearson’s correlation coefficients (R) ranging from 0.49 to 0.79 (p < 0.05), a maximum Nash–Sutcliffe Efficiency (NSE) of 0.63, and F1-scores for drought detection as high as 0.92. It effectively captured seasonal and interannual variability, including the accurate identification of low-flow events reported by the National Hydro Informatics Data Center (NHC). While the CHDI showed robust performance, particularly under high-flow conditions and in drought classification, some limitations were observed in complex or anthropogenically influenced sub-catchments. These findings highlight the potential of CHDI as a reliable and integrative tool for hydrological drought monitoring and for supporting water resource management in data-scarce and climate-sensitive regions.

1. Introduction

Drought, a widespread natural hazard, is characterized by prolonged periods of abnormally dry weather that create hydrological imbalances due to insufficient precipitation [1]. In Thailand, the northern watershed is particularly vulnerable, a condition exacerbated by both climate change and the recurrent El Niño–Southern Oscillation (ENSO) phenomenon [2]. These drivers frequently reduce rainfall, leading to recurrent and severe droughts [3]. Changes in precipitation patterns, reflected in increasing consecutive dry days (CDDs) and declining consecutive wet days (CWDs), have intensified water scarcity [4,5]. Rainfall has also shifted away from primary catchments, limiting inflow into reservoirs and contributing to reduced post-rainy season storage volumes [6]. Together, these factors underscore the urgent need for robust drought monitoring in this region, which is critical for agriculture and hydrology [7]. Over the past few decades, the northern watershed has experienced widespread persistent drought conditions. Historical water level records from the National Hydro Informatics Data Center highlight frequent drought classifications (Figure 1), indicating heightened exposure and catchment sensitivity. Projections from the National Oceanic and Atmospheric Administration (NOAA) suggest a new El Niño phase beginning in 2023, which could further intensify the drought risk. These developments highlight the importance of understanding the mechanisms and spatiotemporal patterns of hydrological droughts in the northern watershed.
Hydrological drought indices are essential for monitoring, assessing, and managing droughts. Traditional indices such as the Surface Water Supply Index (SWSI), Standardized Streamflow Index (SSFI), Streamflow Drought Index (SDI), and Standardized Reservoir Supply Index (SRSI), rely primarily on streamflow and reservoir data [8]. Conversely, the SSFI, SDI, and SRSI were developed to capture multi-scalar drought characteristics using streamflow and reservoir data from gauging stations [9,10]. Although useful, they often neglect key variables such as precipitation, evapotranspiration, and soil moisture, limiting their ability to capture multi-scalar drought dynamics. Data scarcity further compromises their accuracy, and many indices overlook processes such as groundwater dynamics and land-use changes. These limitations emphasize the need for integrated, physically based approaches that account for both short- and long-term variability.
Recent advances in drought research have shifted from single-variable indices to the development of composite indices and model-driven approaches that more effectively capture the complex dynamics of drought. For example, ref. [11] integrated TRMM, GLDAS-2.1, and MODIS data into multivariate composite drought indices (MCDIs) using multiple linear regression, demonstrating improved performance over single indices in distinguishing meteorological and agricultural droughts. Similarly, ref. [12] developed a composite drought index (CDI) from evapotranspiration, water balance, and rainfall, which showed strong correlations with PDSI, SRI, and crop yields, outperforming both PDSI and EIDI in detecting soil moisture. Other efforts include the development of a drought composite index (DCI) that combines rainfall, temperature, evapotranspiration, wind, humidity, and sunlight weighted by AHP, which proved more effective in capturing drought severity and frequency [13], and a CDI for West Africa using CHIRPS and MODIS with entropy-based weights, which was highly correlated with SPI and SPEI and demonstrated greater sensitivity for drought detection [14]. In India, ref. [15] developed a site- and crop-specific CDI that integrates meteorological indices, vegetation indices, and consecutive dry days with PCA-derived weights, which showed strong correlations with cotton and groundnut yields and effectively captured major agricultural droughts.
Machine learning (ML) and deep learning (DL) techniques have also been increasingly applied to enhance the predictive power of composite indices. For instance, ref. [16] demonstrated that SVM- and ANF-PSO–based indices outperformed conventional MSDI, ADI, and JDI in reflecting soil moisture variability. A SHAP-based composite index integrating TCI, PCI, VCI, SMCI, GPP, and NDWI achieved the highest correlation with reference indices, surpassing SPEI and scPDSI [17]. Similarly, an Integrated Drought Index (IDI) using a BP Neural Network with rainfall, LST, NDVI, soil water storage, and elevation successfully captured nonlinear and lagged relationships of NDVI, enabling robust monitoring of drought onset, duration, and severity [18]. Deep learning approaches have also gained traction, with [19] applying ConvLSTM to MODIS and CHIRPS data to generate a CDI that was highly correlated with multi-scale SPEI, while [20] proposed a multivariate drought composite index (MDCI) based on remote sensing and crop yield data with Random Forest weighting, which outperformed traditional indices in agricultural drought assessment.
Despite these global advancements, a significant research gap persists in Thailand, where drought assessments continue to rely predominantly on single-variable indices (such as SPI, NDVI, and soil moisture index) and limited observational datasets. To address this deficit, this study aimed to develop a Composite Hydrological Drought Index (CHDI) specifically adapted for northern Thailand’s watersheds. The CHDI attempts to integrate multiple hydrological variables to provide a comprehensive evaluation of drought conditions and enhance regional response strategies. To achieve this objective, the study employs the Variable Infiltration Capacity (VIC) model, a physically based, distributed hydrological model widely utilized in both research and operational applications [21,22,23,24]. The VIC model divides watersheds into grid cells to represent spatial differences in climate, land cover, and topography. It simulates essential land surface processes, including the energy balance, soil moisture dynamics, and vegetation interactions. Each grid cell was parameterized based on specific attributes such as soil texture, land use, and vegetation type. The model utilizes historical and projected climate data, enabling it to capture both current and future scenarios with high spatiotemporal resolutions.

2. Materials and Methods

2.1. Study Area

The northern watershed of Thailand, including four major sub-watersheds—Ping, Wang, Yom, and Nan—is the designated study area (Figure 1, left panel). Geographically situated between 15°41′52″ N and 20°27′47″ N latitude and 97°20′42″ E and 101°21′22″ E longitude, this region covers approximately 107,000 square kilometers, shaping nearly one-quarter of Thailand’s total land area. Its vulnerability to hydrological extremes is driven by climate variability and land use changes in the agricultural sector [25,26]. Each of the four tributaries has unique hydrological characteristics and faces distinct challenges in water management. The Ping River (Station P), which drains the steep northern terrain, is regulated by the Bhumibol Dam. This dam stabilizes river flows but also creates a dependency on reservoir operations during droughts. The Wang River (Station W), with a smaller catchment and moderate topography, generally has a stable flow. However, it is highly sensitive to seasonal water shortages as demand continues to increase. The Yom River (Station Y) lacks major reservoirs, leading to flashy and unregulated flows that often cause flooding downstream. Groundwater extraction in its sub-watershed further increases the drought risk. The Nan River (Station N), the largest tributary, is regulated by the Sirikit Dam. This dam helps mitigate floods and secure dry season flows, but, like the Ping, its management highlights the region’s reliance on large-scale infrastructure for water security [27]. In summary, the four tributary basins exhibit distinct physical characteristics and water management infrastructures that directly influence runoff dynamics and the risk of drought and flooding. The Ping and Nan basins rely heavily on large dams to regulate the water balance, the Wang basin faces constraints from limited storage capacity and rising demand, and the Yom basin lacks major reservoirs and depends on intensive groundwater use. These contrasts create significant challenges for integrated water resource management across northern watersheds.
The bar chart in Figure 1 (right panel) illustrates the historical classification of hydrological drought and flood conditions at eight gauging stations: N.64, P.67, P.76, P.77, P.81, P.82, W.10A, and Y.20. Droughts and floods were classified into four categories based on the Low Negative Water Level (LNWL) recorded at each station, as shown in Table 1. The frequency of drought across all stations highlights the chronic nature of low-flow conditions and water scarcity in this region. Drought conditions are represented by red bars (water level less than 10%), while drought risk is indicated by yellow bars (water level 10–30%). Specifically, stations such as P.77 and P.82 exhibited exceptionally high proportions of months classified as drought, suggesting a heightened exposure to prolonged dry periods or underlying catchment sensitivities. Conversely, flood risk (blue bars) was rarely identified, with negligible representation across all stations, indicating the infrequent occurrence of high-flow extreme events in the observed record. The “normal” water level class (green) appeared more prominently at stations such as Y.20, which may suggest greater interannual variability or more balanced hydrological regimes in those respective basins.

2.2. Model and Data

This study utilized the Variable Infiltration Capacity (VIC) model to simulate key hydrological processes within the watershed, including surface runoff, evapotranspiration, and soil moisture dynamics. The VIC is a semi-distributed, grid-based hydrological model that accounts for spatial heterogeneity in climate, topography, and land cover by partitioning the study area into individual grid cells [28]. The model was configured in a water-balance mode for the baseline period of 1976–2005. It was forced by regional climate data from the Weather Research and Forecasting (WRF) model coupled with the Community Earth System Model (CESM). The simulations produced hydrological fluxes including precipitation, evapotranspiration, runoff, baseflow, and soil moisture at a spatial resolution of 0.0625°. For the model setup, default values were used for the soil parameters without further calibration. Instead, calibration efforts focused on vegetation parameters, which were refined using high-resolution land use/land cover (LULC) data based on the International Geosphere–Biosphere Program (IGBP) classification scheme, replacing the default template. A subgrid approach with nearest-neighbor resampling was adopted to ensure consistency between the new grid resolution and input data. Details regarding the specific input datasets utilized in the VIC model are provided in the subsequent sections.

2.2.1. Climate Data

The VIC climatic input data were provided by the Weather Research and Forecasting (WRF) model, which was used as a regional climate model to dynamically downscale the Community Earth System Model (WRF-CESM) for the historical period spanning 1976 to 2005. This dataset contains daily values of precipitation, maximum temperature, minimum temperature, and horizontal wind components (U and V directions). These variables served as the primary meteorological drivers in the VIC simulations.

2.2.2. Spatial Data

Spatial datasets were compiled to characterize the land surface properties relevant to water storage and flow dynamics. The key parameters included the leaf area index, rooting depth, and surface roughness, all of which significantly influenced infiltration and evapotranspiration processes. Elevation data, sourced from the Advanced Spaceborne Thermal Emission and Reflection Radiometer (ASTER) Global Digital Elevation Model (GDEM) version 3 [29], were used to calculate the slope and flow direction. This dataset has a spatial resolution of 30 m at the equator.
Soil data were obtained from the Harmonized World Soil Database (HWSD) version 1.2 [30], developed by the Food and Agriculture Organization (FAO), which provides essential information on soil texture and structure for estimating infiltration capacity. Land cover classifications were derived from the Moderate Resolution Imaging Spectroradiometer (MODIS) product, using the International Geosphere–Biosphere Program (IGBP) classification scheme [31]. These spatial and climate datasets collectively formed the foundation for simulating watershed hydrology and analyzing drought characteristics using the VIC model in this study.

2.3. Methodology

This section outlines the methodology employed to develop the Composite Hydrological Drought Index (CHDI). This process integrates parameters obtained from hydrological modeling with Principal Component Analysis (PCA) to generate a robust drought assessment tool.

2.3.1. VIC Model Simulation and Parameter Extraction

The study methodology relied on the VIC model to simulate monthly hydrological outputs based on predefined climate and spatial datasets. Full calibration of soil parameters was not undertaken because of significant time and computational limitations; global sensitivity methods, such as the Sobol method, were deemed computationally prohibitive for the scale of this study. Instead, calibration efforts have focused on refining vegetation parameters using high-resolution land use/land cover (LULC) data. A sub-grid and nearest-neighbor resampling technique was implemented to ensure that each grid cell accurately captured the vegetation class, fractional cover, and root distribution, thereby enhancing the representation of land surface heterogeneity. The model produced seven key hydrological variables, precipitation (ppt), evapotranspiration (evap), baseflow (base), surface runoff, and soil moisture at three distinct layers (SL0, SL1, SL2), which were subsequently used as inputs to construct the CHDI using PCA.
Prior to this construction, data preprocessing involved removing extreme values from the VIC outputs using a standard outlier-removal technique to mitigate uncertainty. A Sobol sensitivity analysis was then conducted to identify the most influential parameters of the model. This analysis, based on uniform priors, yielded first-order (S1) and total-order (ST) indices for both the individual VIC variables and PCA-derived PC1. To assess the robustness of the PCA methodology, we compared a fixed loadings approach (constant loading across runs) with a re-fit PCA approach (loading recalculated per run). The outputs of this analysis provided insights into the sensitivity of individual variables and PC1, as well as the stability of the PCA loadings. The VIC outputs were validated against the observed water-level data from the National Hydro Informatics Data Center (NHC). The principal component explaining over 50% of the variance was selected as the foundation for the CHDI, a decision supported by correlation and significance testing to confirm the representativeness of drought conditions.

2.3.2. Development of the Composite Hydrological Drought Index (CHDI)

The CHDI was constructed by integrating selected hydrological variables using Principal Component Analysis (PCA). PCA is a multivariate statistical technique employed to reduce the dimensionality of datasets while preserving essential information. It transforms the original correlated variables into a set of uncorrelated variables, known as principal components. The weights for each parameter in the CHDI were derived from the squared loadings (eigenvector weights) of the dominant principal component (PC1). This study formulated the CHDI using a simple linear regression model:
CHDI = β0 + (β1 × PC1)
where
  • CHDI represents the Composite Hydrological Drought Index, which reflects the water level values at the gauge.
  • β0 is the intercept, representing the expected water level when PC1 equal to 0.
  • β1 is the slope coefficient of PC1.
The CHDI can be used to classify water levels at any given time relative to the Low Negative Water Level (LNWL) recorded at each station. This criterion aligns with the classification employed by Thailand’s Royal Irrigation Department, which categorizes water levels into four categories: flood risk, normal, drought risk, and drought. Furthermore, the characteristics of drought events, including duration (the length of the longest continuous drought episode) and frequency (the number of drought occurrences within a period), can be analyzed using the CHDI.

2.3.3. Assessing the Performance of the CHDI

The performance of the Composite Hydrological Drought Index (CHDI) was assessed by comparing its outputs with observed water level data obtained from the NHC. This evaluation aimed to determine the accuracy of CHDI in capturing real-world hydrological drought conditions. To quantify the model performance, a suite of statistical metrics was applied to the data. The Pearson correlation coefficient (r) was used to assess the strength and direction of the linear relationship between the CHDI values and the observed data. The coefficient of determination (R2) indicates the proportion of variance in the observed data explained by the index. The Nash–Sutcliffe efficiency (NSE) was employed to evaluate the predictive performance of the CHDI relative to the mean of the observations. The standard deviation (S.D.), confidence levels (p-value), and root mean square error (RMSE) were computed to capture the variability and magnitude of the prediction errors. The mean absolute error (MAE) measures the average absolute difference between the predicted and actual values. The index of agreement (IOA) served as a normalized indicator of predictive accuracy, which was sensitive to both systematic and random errors.
Furthermore, a confusion matrix was used to evaluate the CHDI’s categorical performance in classifying drought severity levels across predefined categories, including “Drought”, “Drought Risk”, “Normal”, and “Flood Risk”. The analysis included key classification metrics such as precision, recall, and F1-score for each severity class, as well as the overall classification accuracy. The results demonstrated strong model performance, reflected in high r, R2, NSE, and IOA values, along with high classification accuracy. These outcomes, complemented by low RMSE and MAE values, confirm the robustness of the CHDI and underscore its practical utility as an operational tool for regional drought monitoring and water resource management.

2.3.4. Computational Requirements

The VIC model requires a Linux-based operating system (e.g., Ubuntu 20.04 or later) and several key dependencies, including gfortran, zlib, curl, java, HDF5, and NetCDF4. Post-processing and visualization require a suite of tools, such as Panoply and QGIS (version 2.14), along with Python (version 3) libraries, such as Numpy, GDAL, Scipy, Xarray, Pandas, Matplotlib, PyProj, netCDF4, Basemap, and RVIC. The essential input data for the model included elevation, land cover, soil characteristics, meteorological forcings (e.g., precipitation, maximum and minimum temperature, and wind), and basin boundary. In this study, the VIC v4.2 model was run on a 72-CPU computer server to establish a 30-year baseline (1976–2005). The simulation produced outputs for seven key hydrological parameters: precipitation, evapotranspiration, runoff, baseflow, and three soil moisture layers. Without a comprehensive soil-parameter sensitivity calibration, the full simulation required approximately 3 months of continuous computation.

3. Results

3.1. Correlation Between Observed and VIC-Simulated Hydrological Variables

The correlation analysis between the observed water levels and hydrological variables simulated by the VIC model provides insights into the dominant processes governing runoff generation in northern Thailand. Figure 2 shows that, in most stations. water levels are strongly associated with surface-based processes, particularly surface runoff, surface soil moisture, and precipitation. For example, stations N.64, P.77, P.81, and Y.20 exhibited high correlations with surface runoff (r = 0.80, 0.62, 0.76, 0.64, respectively), surface soil moisture (r = 0.79, 0.62, 0.70, 0.73, respectively), and precipitation (r = 0.70, 0.51, 0.67, 0.54, respectively). These results highlight the critical role of rainfall–runoff–soil interactions in driving immediate hydrological responses at these sites.
In contrast, other stations demonstrated weaker linkages with precipitation and runoff, with water levels being more influenced by subsurface processes. For instance, stations P.76 and P.82 showed correlations with surface soil moisture (r = 0.53, 0.56, respectively), baseflow (r = 0.53, 0.48, respectively), first-layer soil moisture (r = 0.54, 0.43, respectively), and second-layer soil moisture (r = 0.45, 0.44, respectively), implying contributions from deeper storage components to short-term fluctuations. Similarly, stations such as P.67 and W.10A reflected a strong dependence on surface-driven processes, where runoff and surface soil moisture dominated water-level variability. These contrasting relationships demonstrate that no single variable universally explains hydrological responses across all the stations. This heterogeneity provides a rationale for developing a composite hydrological drought index (CHDI), which integrates multiple variables to capture both spatial and temporal dynamics more comprehensively than single-variable indices.

3.2. Development of the Composite Hydrological Drought Index

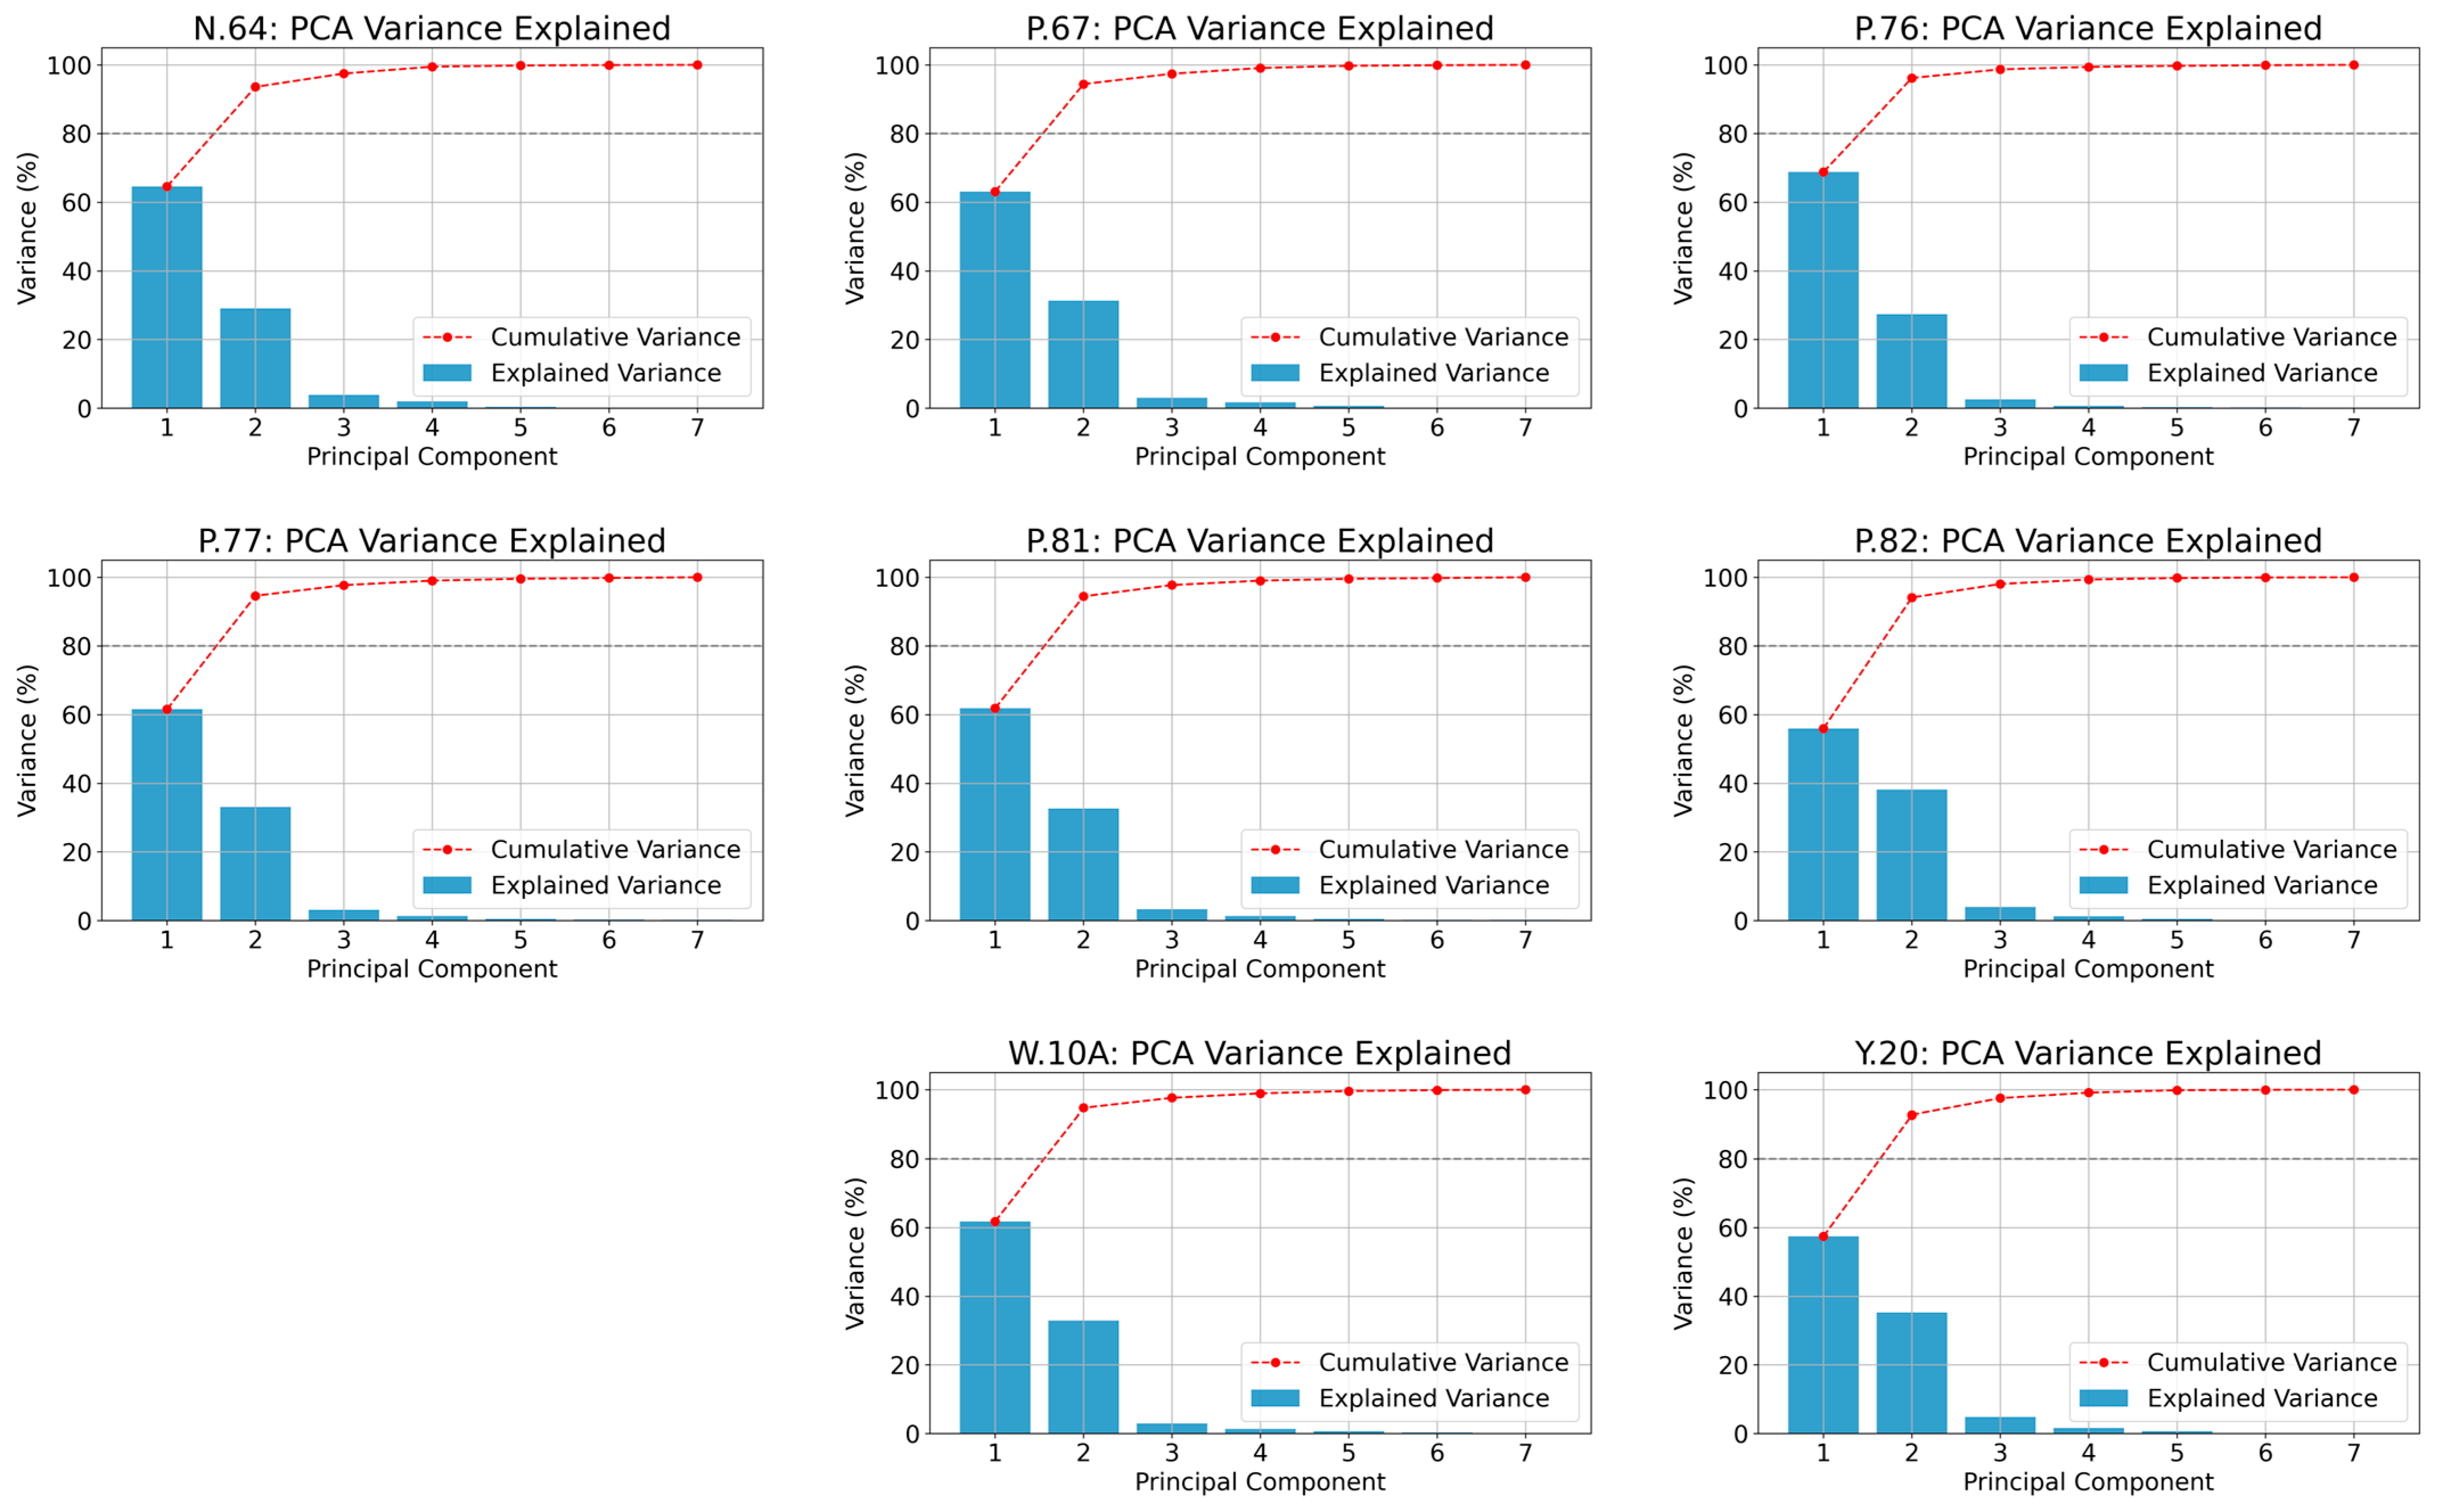
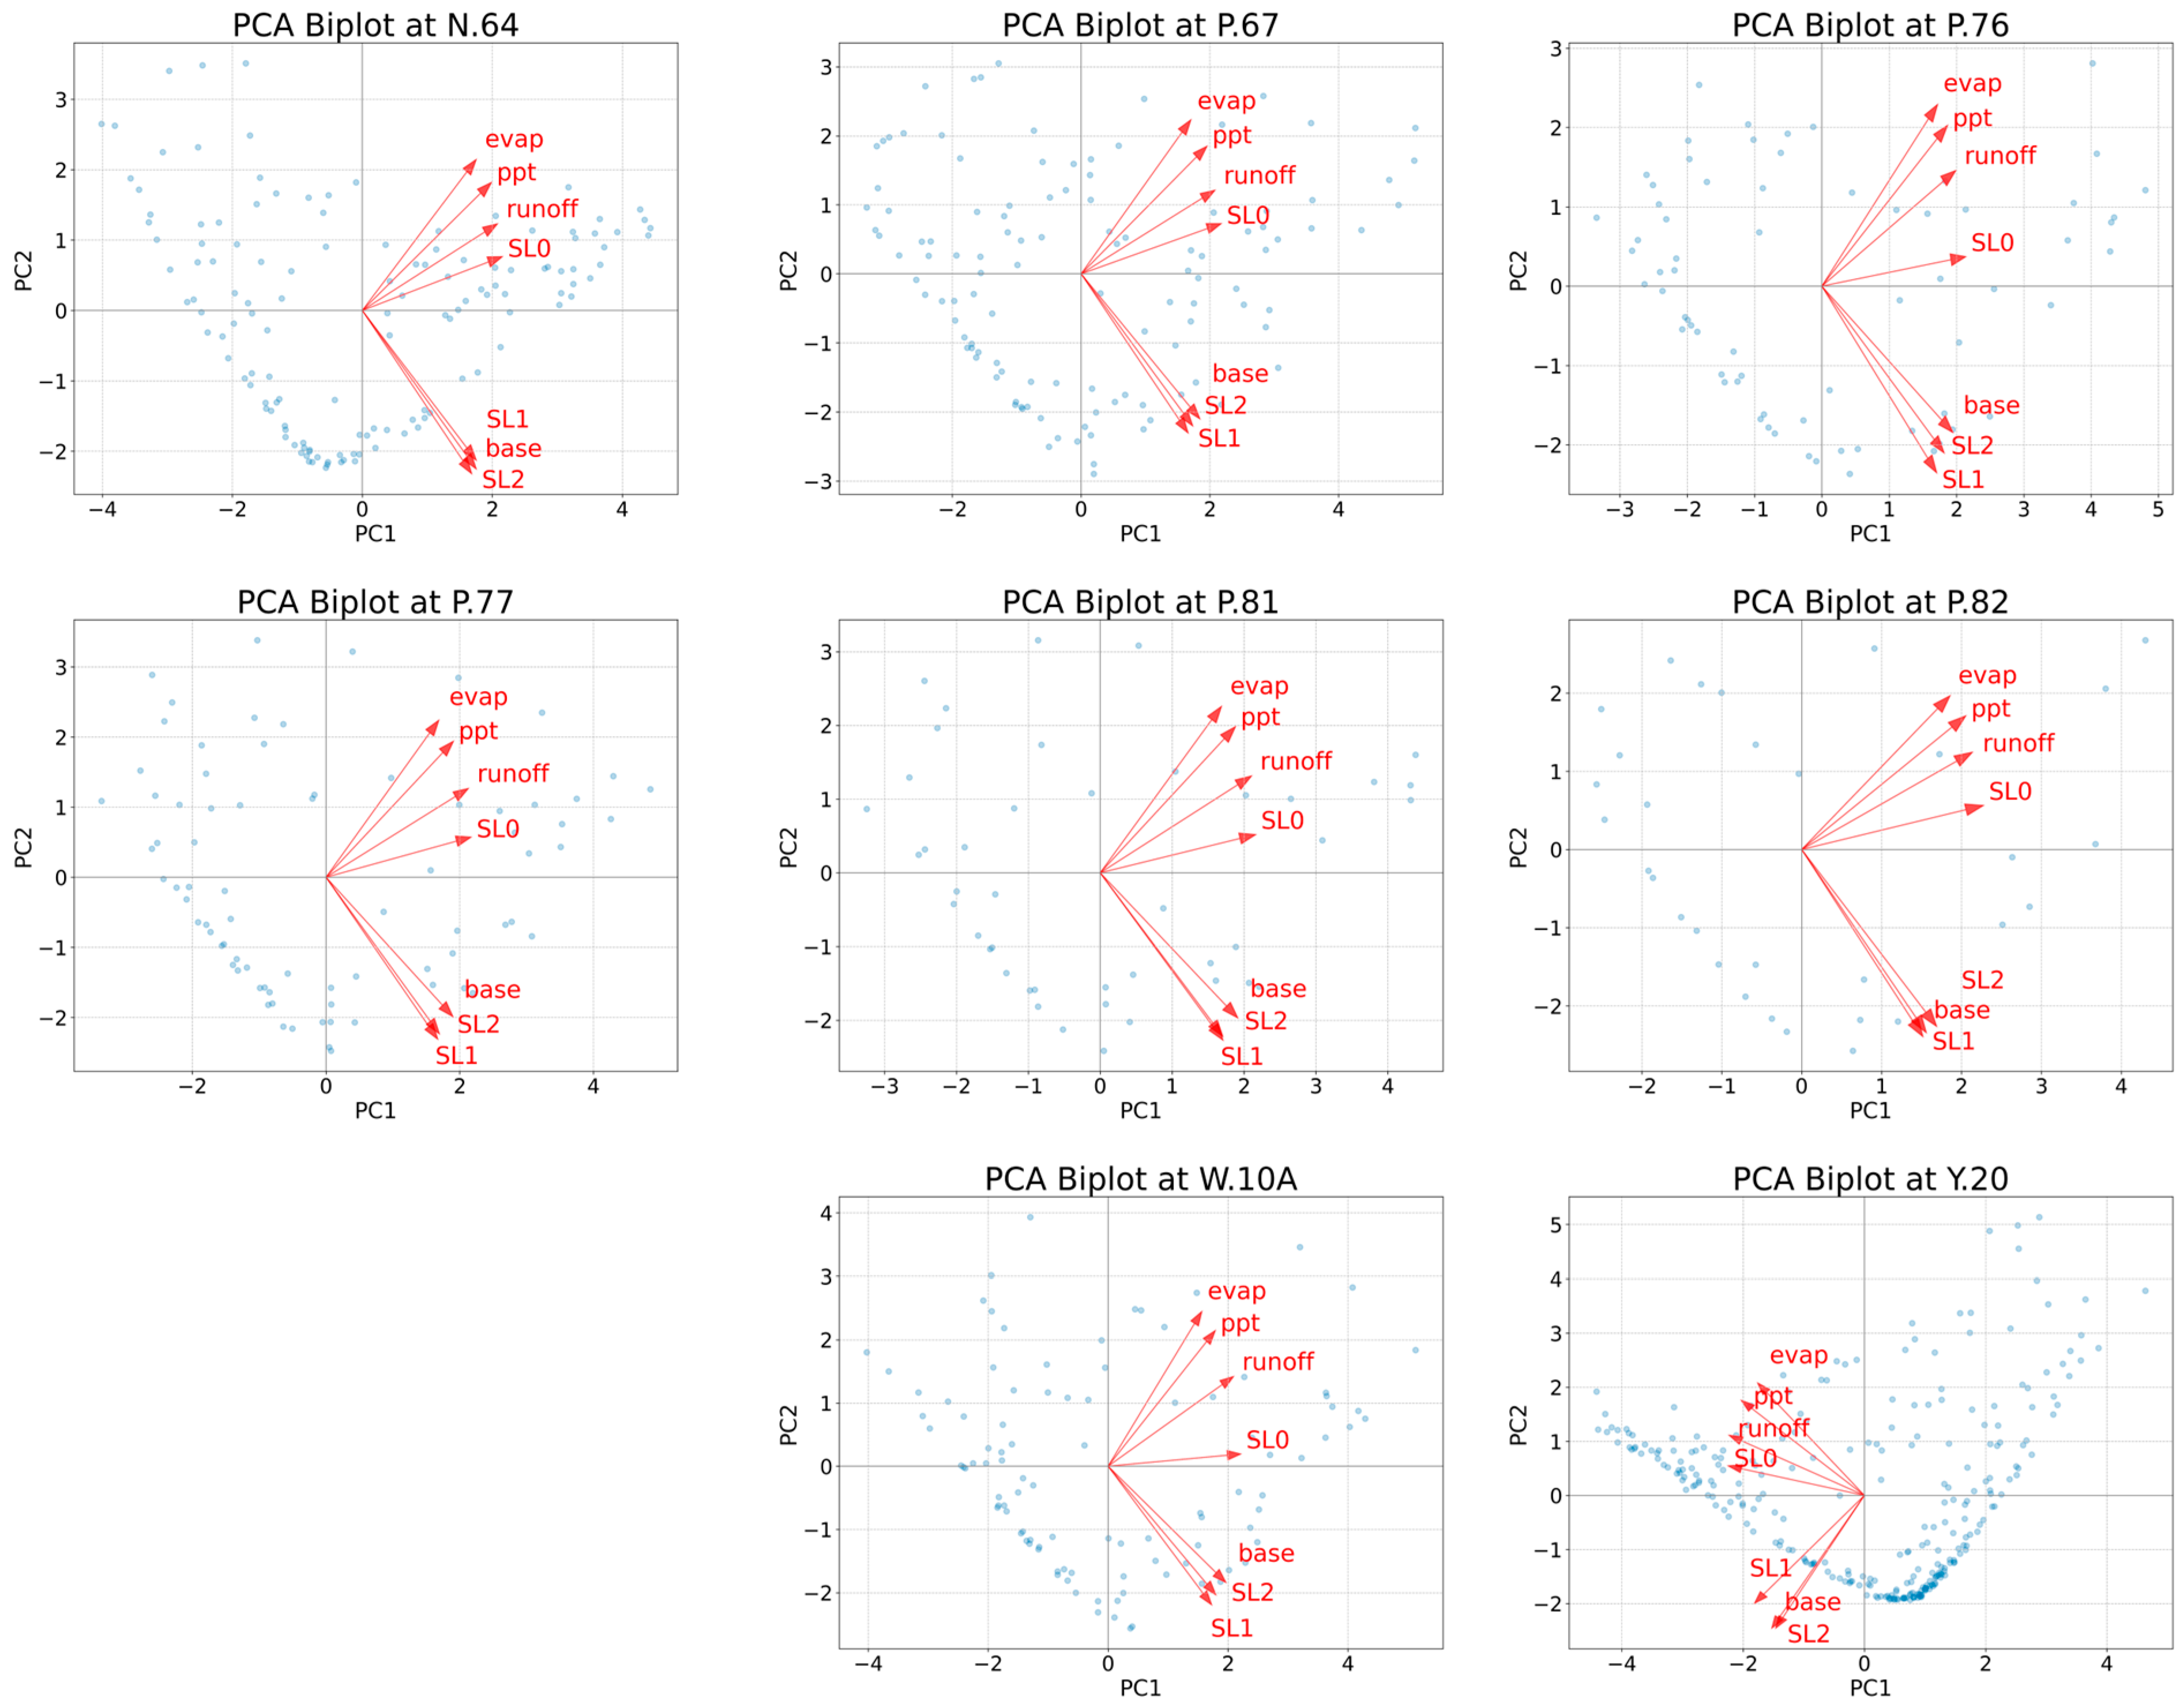
Principal Component Analysis (PCA) was employed to integrate VIC-simulated hydrological variables and identify those most strongly associated with observed water level variability. The analysis confirmed that surface-driven processes—precipitation, surface runoff, and shallow soil moisture (SL0)—were the dominant contributors, whereas baseflow, evapotranspiration and deeper soil layers (SL1 and SL2) provided more localized or secondary influences. As illustrated in Figure 3, the first principal component (PC1) consistently explained 56–69% of the total variance across stations, confirming the sufficiency of this dominant mode in retaining key hydrological signals while reducing the dimensional complexity. The PCA biplots in Figure 4 visually summarize the variable loadings and clustering patterns of the parameters. At all stations, the vectors representing precipitation (ppt), surface runoff (runoff), and surface soil moisture (SL0) were consistently aligned with the PC1 axis, highlighting their dominant contribution to the composite signal. Conversely, deeper soil layers, baseflow, and evapotranspiration contributed minimally, with shorter vector lengths and dispersed orientations. These visual and quantitative PCA outputs validated the decision to construct the CHDI using leading components derived from surface-responsive variables. This approach ensured that the CHDI was grounded in the most informative and hydrologically relevant features, thereby enhancing its interpretability for drought monitoring in the study area.
Based on the eigenvector weights of PC1 (Table 2), the dominant variables driving the Composite Hydrological Drought Index (CHDI) were precipitation, surface runoff, and surface soil moisture (SL0). These variables consistently showed the highest loadings across most stations, effectively capturing the short-term hydrological responses stemming from rainfall–runoff–soil interactions. Specifically, SL0 had the strongest influence at stations W.10A (0.45) and Y.20 (0.51). While baseflow and evapotranspiration had positive but lower contributions, deeper soil layers (SL1 and SL2) showed more variable and generally minimal influence. Interestingly, the hydrology of Station Y.20 in the Yom Basin presents a notable divergence. It exhibits high loadings for evapotranspiration (0.44), precipitation (0.43), and runoff (0.43), in addition to the dominant SL0 (0.51). The minimal contribution from deeper soil moisture (0.17) at this location reflects the unique characteristics of the basin, which may be influenced by steep terrain, a lack of major reservoirs, and susceptibility to flash floods [27,32]. Overall, PC1 explained 50–70% of the total variance across all stations. This confirms its robustness as a composite representation of surface-driven hydrological dynamics, making it a suitable foundation for CHDI development. The variability observed in certain sub-basins, such as the Yom, underscores the need for localized consideration within a broader basin-scale assessment. This also highlights the ability of CHDI to capture the complex, multi-faceted nature of drought, outperforming single-variable indices by integrating diverse hydrological processes.
Following the derivation of the principal component analysis results indicative of drought occurrence at each gauge station, the CHDI was constructed using a regression equation related to the measured water level, as detailed in Table 3. The resulting equations demonstrated strong predictive capability, with regression coefficients (slopes) varying in magnitude across stations, reflecting the local volumetric sensitivity to surface hydrological drivers. For instance, N.64 and P.67 displayed large positive slopes (87.289 and 26.310, respectively), indicating a robust response of the observed water level to PC1 variation. Conversely, Y.20 displayed a negative slope (−37.400), highlighting its atypical hydrological behavior, which was likely influenced by its downstream location or other unique catchment-scale factors. These regression relationships not only enable site-specific water level estimation from the CHDI but also underscore the index’s flexibility and adaptability to spatial differences in hydrological systems. Consequently, the CHDI derived from PC1 serves as a drought condition assessment across a diverse set of watershed environments.
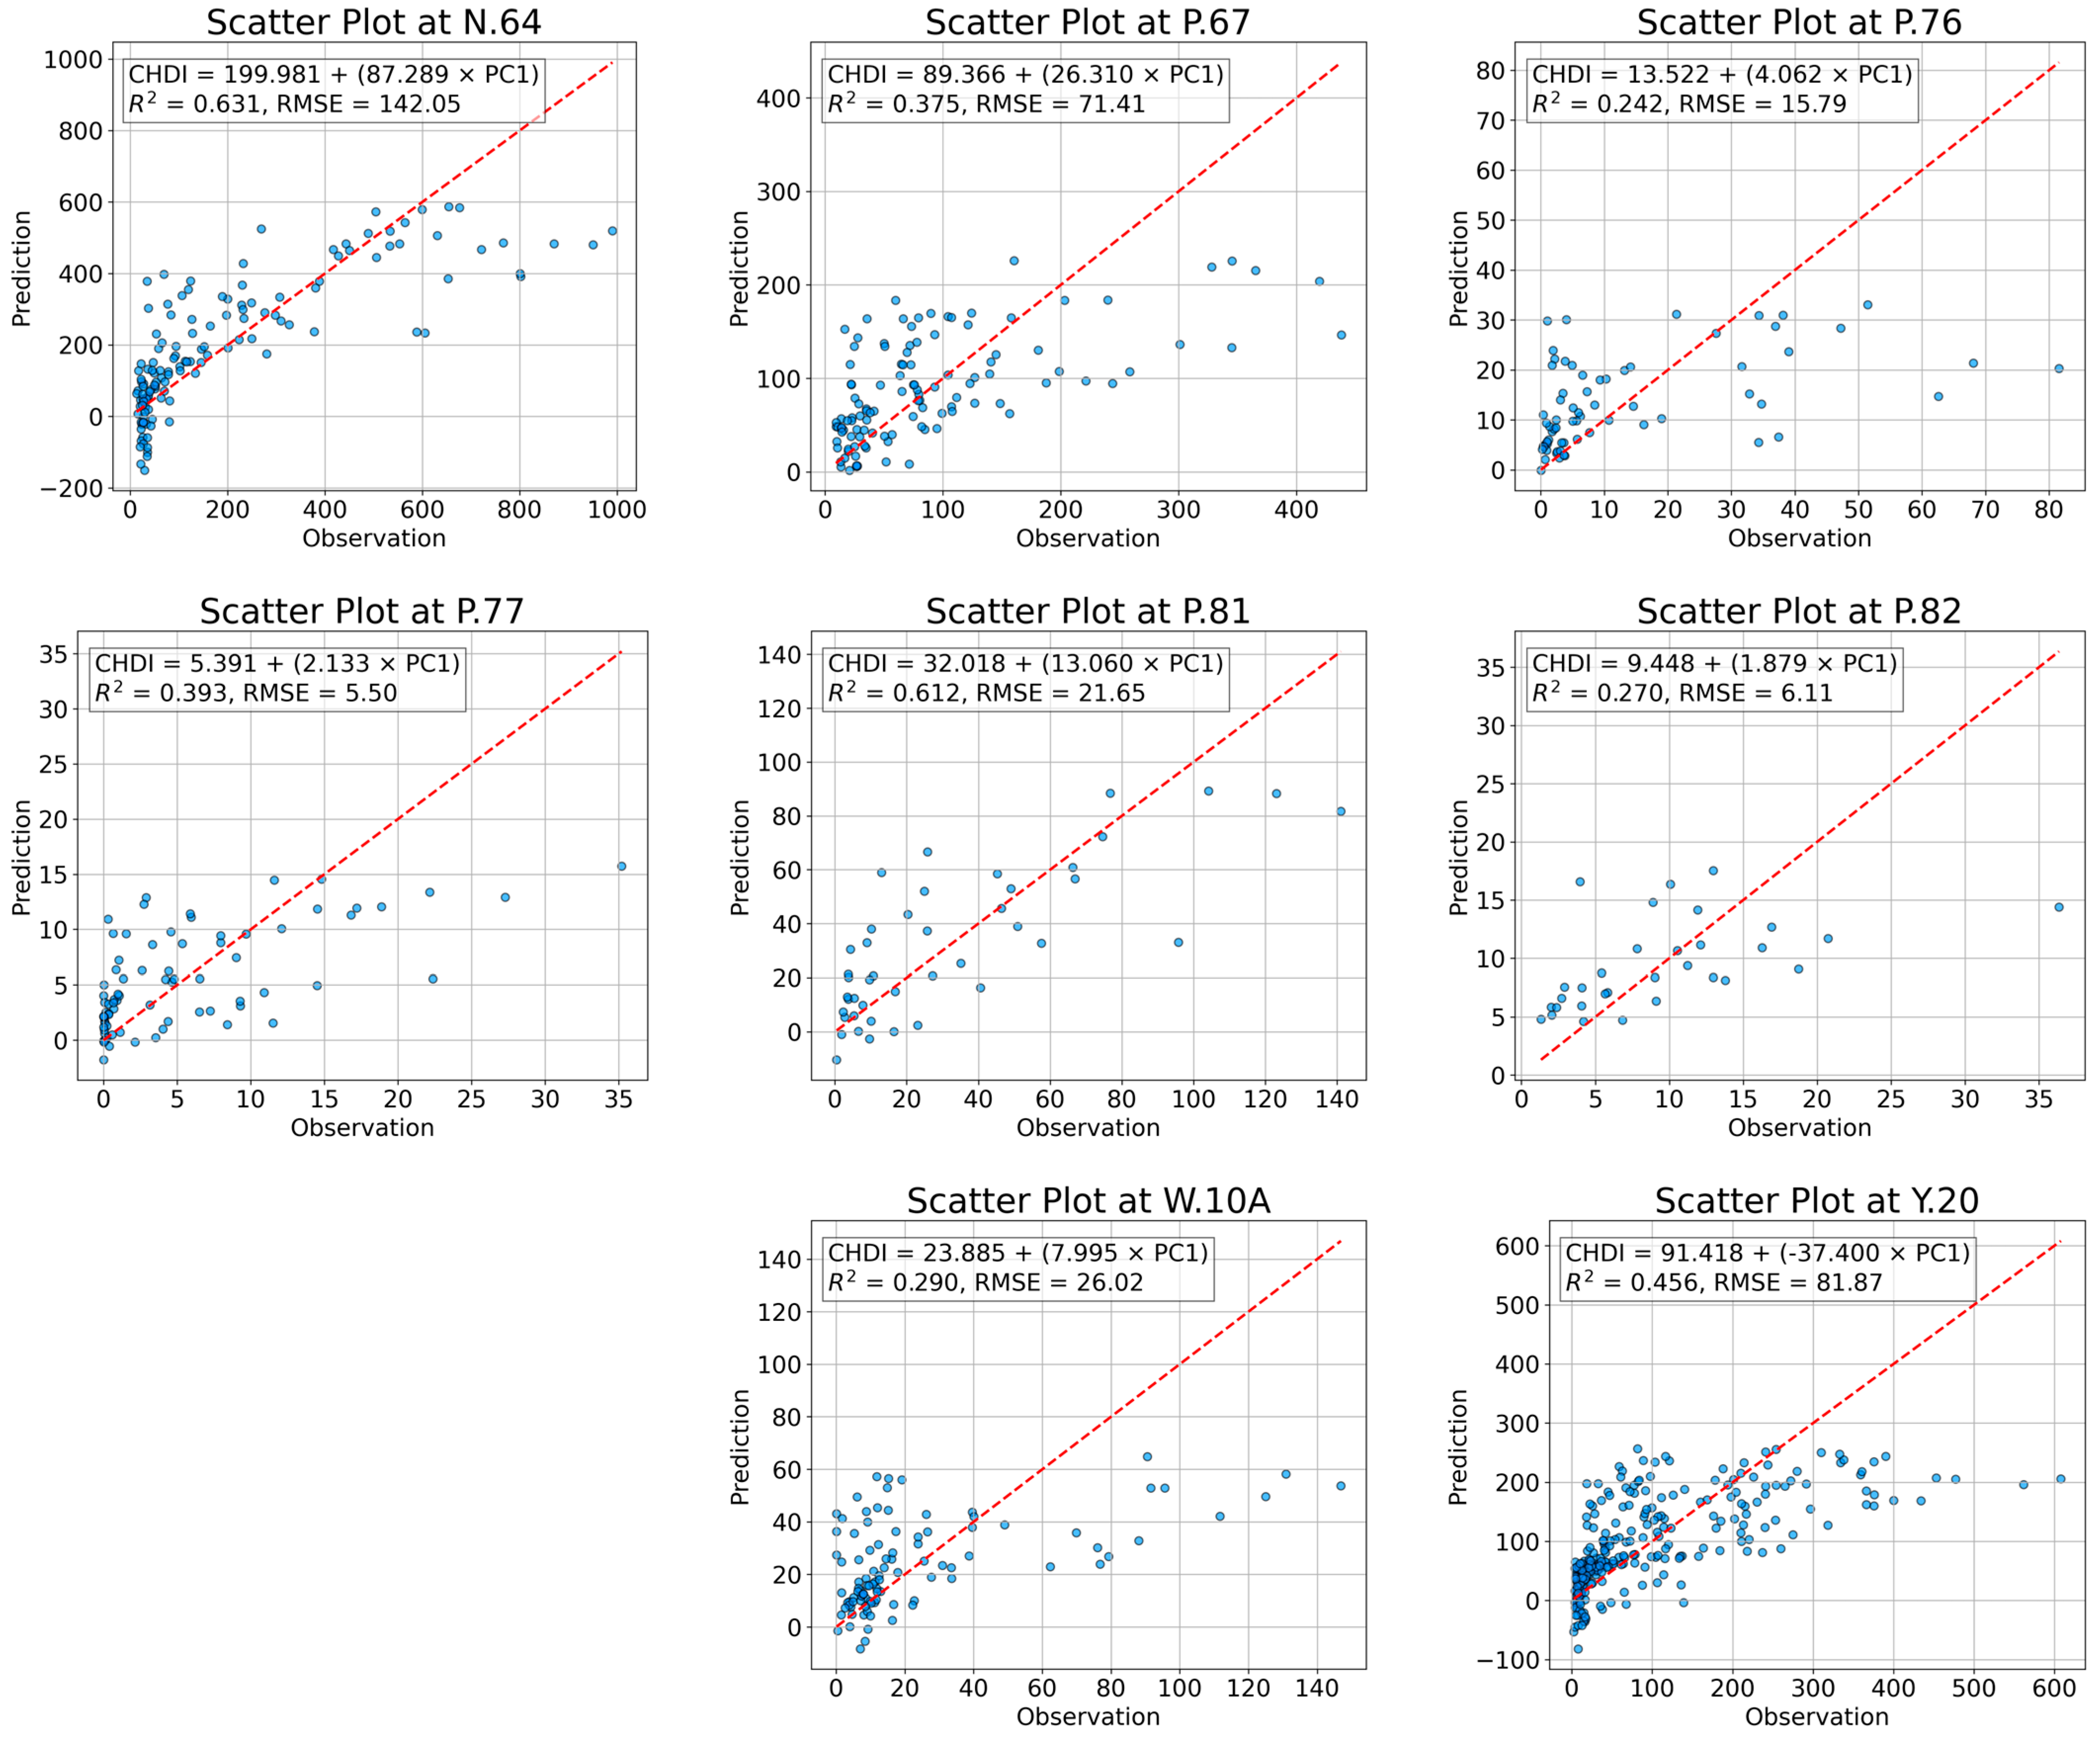
Figure 5 illustrates scatter plots comparing the observed water level with the predicted values derived from the first principal component (PC1) at the eight hydrological gauge stations. These plots were used to evaluate the effectiveness of the CHDI, constructed from the VIC model outputs, in capturing the spatial variability in surface water conditions across the Upper Northern Region. The predictive capacity of PC1 differed markedly across stations, reflecting the spatial heterogeneity of the hydrological processes influencing water level generation. Notably, stations N.64 (R2 = 0.631) and P.81 (R2 = 0.612) exhibited relatively strong performance. At these locations, the predicted values closely aligned with the observed water levels, indicating that PC1 effectively encapsulated the key surface hydrological drivers.
Moderate predictive performance was observed at stations P.67 (R2 = 0.375) and Y.20 (R2 = 0.456), which may suggest the influence of localized factors, such as land use variation or microclimatic conditions, that are not fully captured by the principal component. Weaker predictive performance was evident at stations W.10A (R2 = 0.290), P.82 (R2 = 0.270), and P.76 (R2 = 0.242), where a more dispersed distribution of data points and notable divergence were apparent. In particular, the negative regression coefficient at Y.20 implies an inverse response to PC1, potentially resulting from complex catchment characteristics, anthropogenic modifications, or groundwater-dominated flow regimes [33,34]. These findings underscore the necessity of accounting for local hydrological dynamics when applying regionally constructed drought indices. The consistent explanatory power of PC1 at several key stations confirms the utility of the CHDI as a reliable and integrative metric for characterizing short-term hydrological drought conditions. Its multivariate nature allows for a more comprehensive assessment of drought impacts, thereby enhancing the capacity for monitoring and informing water resource management.
This study conducted a Sobol global sensitivity analysis to evaluate the robustness of the Composite Hydrological Drought Index (CHDI) against model uncertainty. We defined uniform priors for seven hydrological parameters, and the analysis involved approximately N × (2k + 2) simulations with sample sizes ranging from N = 500 to 1000. As shown in Figure 6 illustrates, surface soil moisture and surface runoff had the largest total-order (ST) sensitivity indices, confirming their primary role in driving the variability of the first principal component (PC1). In contrast, baseflow, evapotranspiration, and deeper soil layers (SL1 and SL2) consistently showed low sensitivity values, suggesting a limited contribution to short-term, basin-scale drought dynamics. These findings affirm that the CHDI effectively represents the key drivers of surface hydrological drought.
The robustness of the CHDI was further validated using statistical testing. Regression models at most stations demonstrated significant relationships (p < 0.05), confirming that PC1 was a reliable explanatory factor for the observed water levels. Despite spatial variations in predictive performance, the consistent explanatory power observed at multiple key stations highlights the integrative strength of CHDI. This spatial heterogeneity underscores the necessity of a multivariate index, as a single variable cannot uniformly explain drought dynamics across watersheds.

3.3. Performance of the Composite Hydrological Drought Index

Figure 7 presents time series comparisons between the observed water levels and the CHDI, calculated using PC1, for the eight gauge stations across the Upper Northern Region. Overall, the CHDI demonstrates strong alignment with observed water level dynamics at several stations, particularly N.64, P.67, and P.81, where both the timing and magnitude of peak flows are well captured across multiple years. These stations exhibited high correlation coefficients (R = 0.79, 0.61, and 0.78, respectively), indicating that the CHDI effectively tracked surface hydrological responses during both wet and dry periods. Notably, the index successfully captured sharp water level peaks during the monsoon season and low-flow conditions during dry periods, suggesting a strong sensitivity to short-term hydrological fluctuations. Moderate performance was observed at stations P.76 (R = 0.49, NSE = 0.24) and W.10A (R = 0.54, NSE = 0.29), where the CHDI generally reproduces the temporal pattern of streamflow but tends to underestimate or lag during peak flow periods. This discrepancy may reflect the influence of localized factors such as sub-catchment storage or anthropogenic regulation that are not fully captured by the PCA-derived index. At stations P.77 (R = 0.63, NSE = 0.39) and P.82 (R = 0.52, NSE = 0.27), the predictive capability was more variable, with reasonable temporal alignment but weaker magnitude representation. At Station Y.20, the model exhibited a mixed performance. Although the correlation was relatively high (R = 0.68) and the NSE was moderate (0.46), the prediction errors remained substantial (RMSE = 81.87). This outcome reflects the complex hydrological behavior of the station, which is less responsive to surface-driven indicators captured by the first principal component (PC1).
As shown in Table 4, the performance of the CHDI as a predictor of observed water levels is summarized across the gauge stations using multiple statistical indicators. The CHDI demonstrated strong predictive performance at several stations, particularly N.64 (NSE = 0.63, IOA = 0.88) and P.81 (NSE = 0.61, IOA = 0.87), where both seasonal timing and streamflow magnitudes were well captured. These stations also exhibited relatively low RMSE and MAE values (e.g., RMSE = 142.05, MAE = 97.50 at N.64), indicating the suitability of CHDI for reproducing high-flow variability associated with rainfall-driven events. Moderate performance was observed at stations P.76 (NSE = 0.24, IOA = 0.61) and W.10A (NSE = 0.29, IOA = 0.66), where predictions aligned with observed trends but with noticeable underestimation in streamflow amplitude (e.g., S.D. obs = 30.87 vs. S.D. pred = 16.63 at W.10A). P.67 (NSE = 0.37, IOA = 0.73) also showed an acceptable performance with reduced but consistent prediction spread. At stations P.77 (NSE = 0.39, IOA = 0.75) and P.82 (NSE = 0.27, IOA = 0.63), the performance was more variable, with moderate predictive capability reflected in low RMSE and MAE but underrepresented standard deviation values.
Notably, station Y.20 displays a somewhat higher NSE (0.46) and IOA (0.78) than expected yet still exhibits substantial prediction error (RMSE = 81.87), suggesting that surface-driven indicators alone cannot fully explain water-level variability in this basin. Overall, these results highlight that CHDI performs robustly at stations dominated by surface hydrological processes, whereas its predictive skill diminishes in sub-catchments where subsurface storage, groundwater abstraction, or anthropogenic regulation exert stronger influences.

3.4. Drought Analysis in the Baseline Period

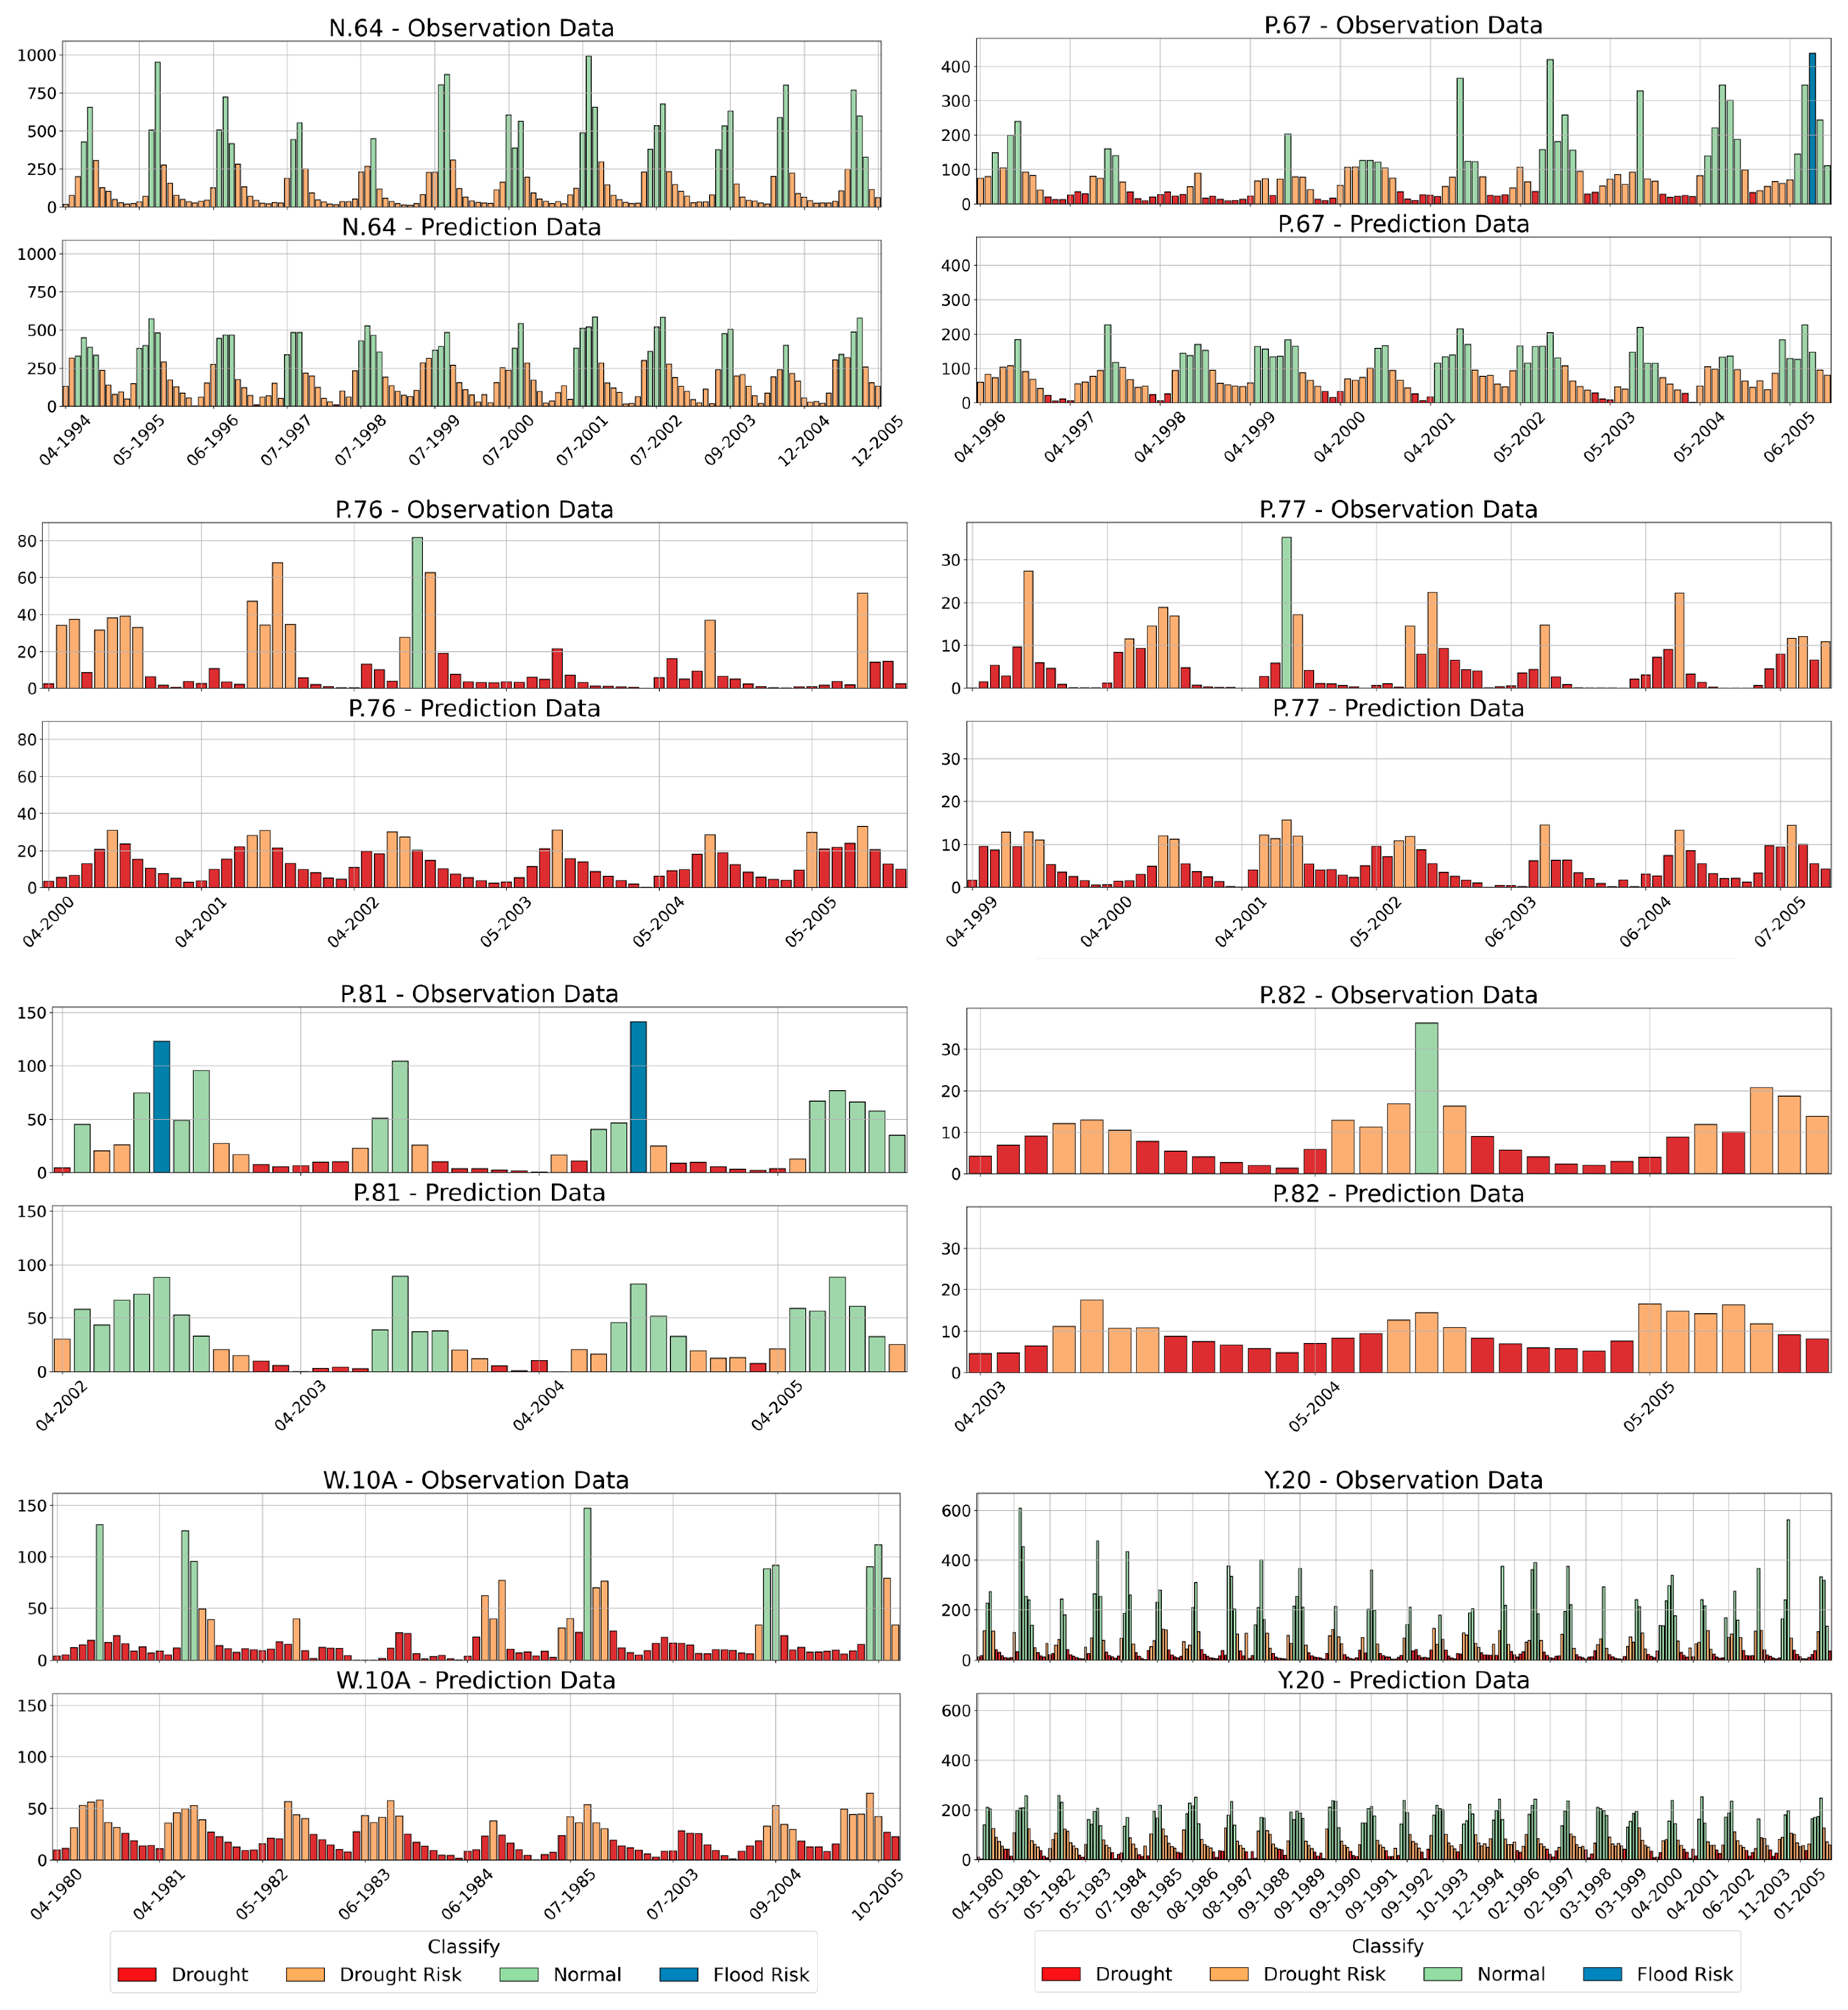
Figure 8 illustrates the monthly comparison of observed water levels and the CHDI derived from the predicted water levels estimated using the first principal component (PC1) during the baseline period. This comparison was presented for eight hydrological stations: N.64, P.67, P.76, P.77, P.81, P.82, W.10A, and Y.20. Each subplot compares drought classification categories, such as drought, drought risk, normal, and flood risk, between the observed and predicted values, thereby assessing the temporal and categorical consistency of the PC1-based drought monitoring approach. At stations such as N.64 and Y.20, the CHDI predicted from PC1 demonstrated a high categorical agreement with the observed water level. The seasonal progression and frequency of drought events were well reproduced, including the accurate identification of both dry and wet periods. Station N.64 showed reliable tracking of recurrent annual drought signals, indicating strong model fidelity and responsiveness to surface runoff variability. Stations P.67 and W.10A also exhibited acceptable alignment, with most drought categories consistently captured in both the observed and predicted CHDI series. Although some discrepancies exist, such as the overestimation of drought risk events or misclassification of drought events, the CHDI retains reasonable skill in detecting drought onset and termination phases.
In contrast, stations such as P.76, P.77, P.81, and P.82 showed moderate agreement between the observed and predicted CHDI. At these locations, the CHDI tended to underestimate drought severity or misclassify non-drought periods as drought events. These limitations likely stem from complex local hydrological processes, such as small catchment areas, high inter-annual variability, or subsurface flow influence, which are not fully represented in the surface-variable-dominated PC1. Despite these station-level discrepancies, the overall regional pattern suggests that the PC1-based CHDI approach can capture broad-scale hydrological drought dynamics, particularly in larger or more responsive watersheds. The consistency between the observed water level and predicted CHDI classes supports the potential utility of this method as a proxy for water level-based drought conditions, with relevance to regional drought early warning and planning systems.
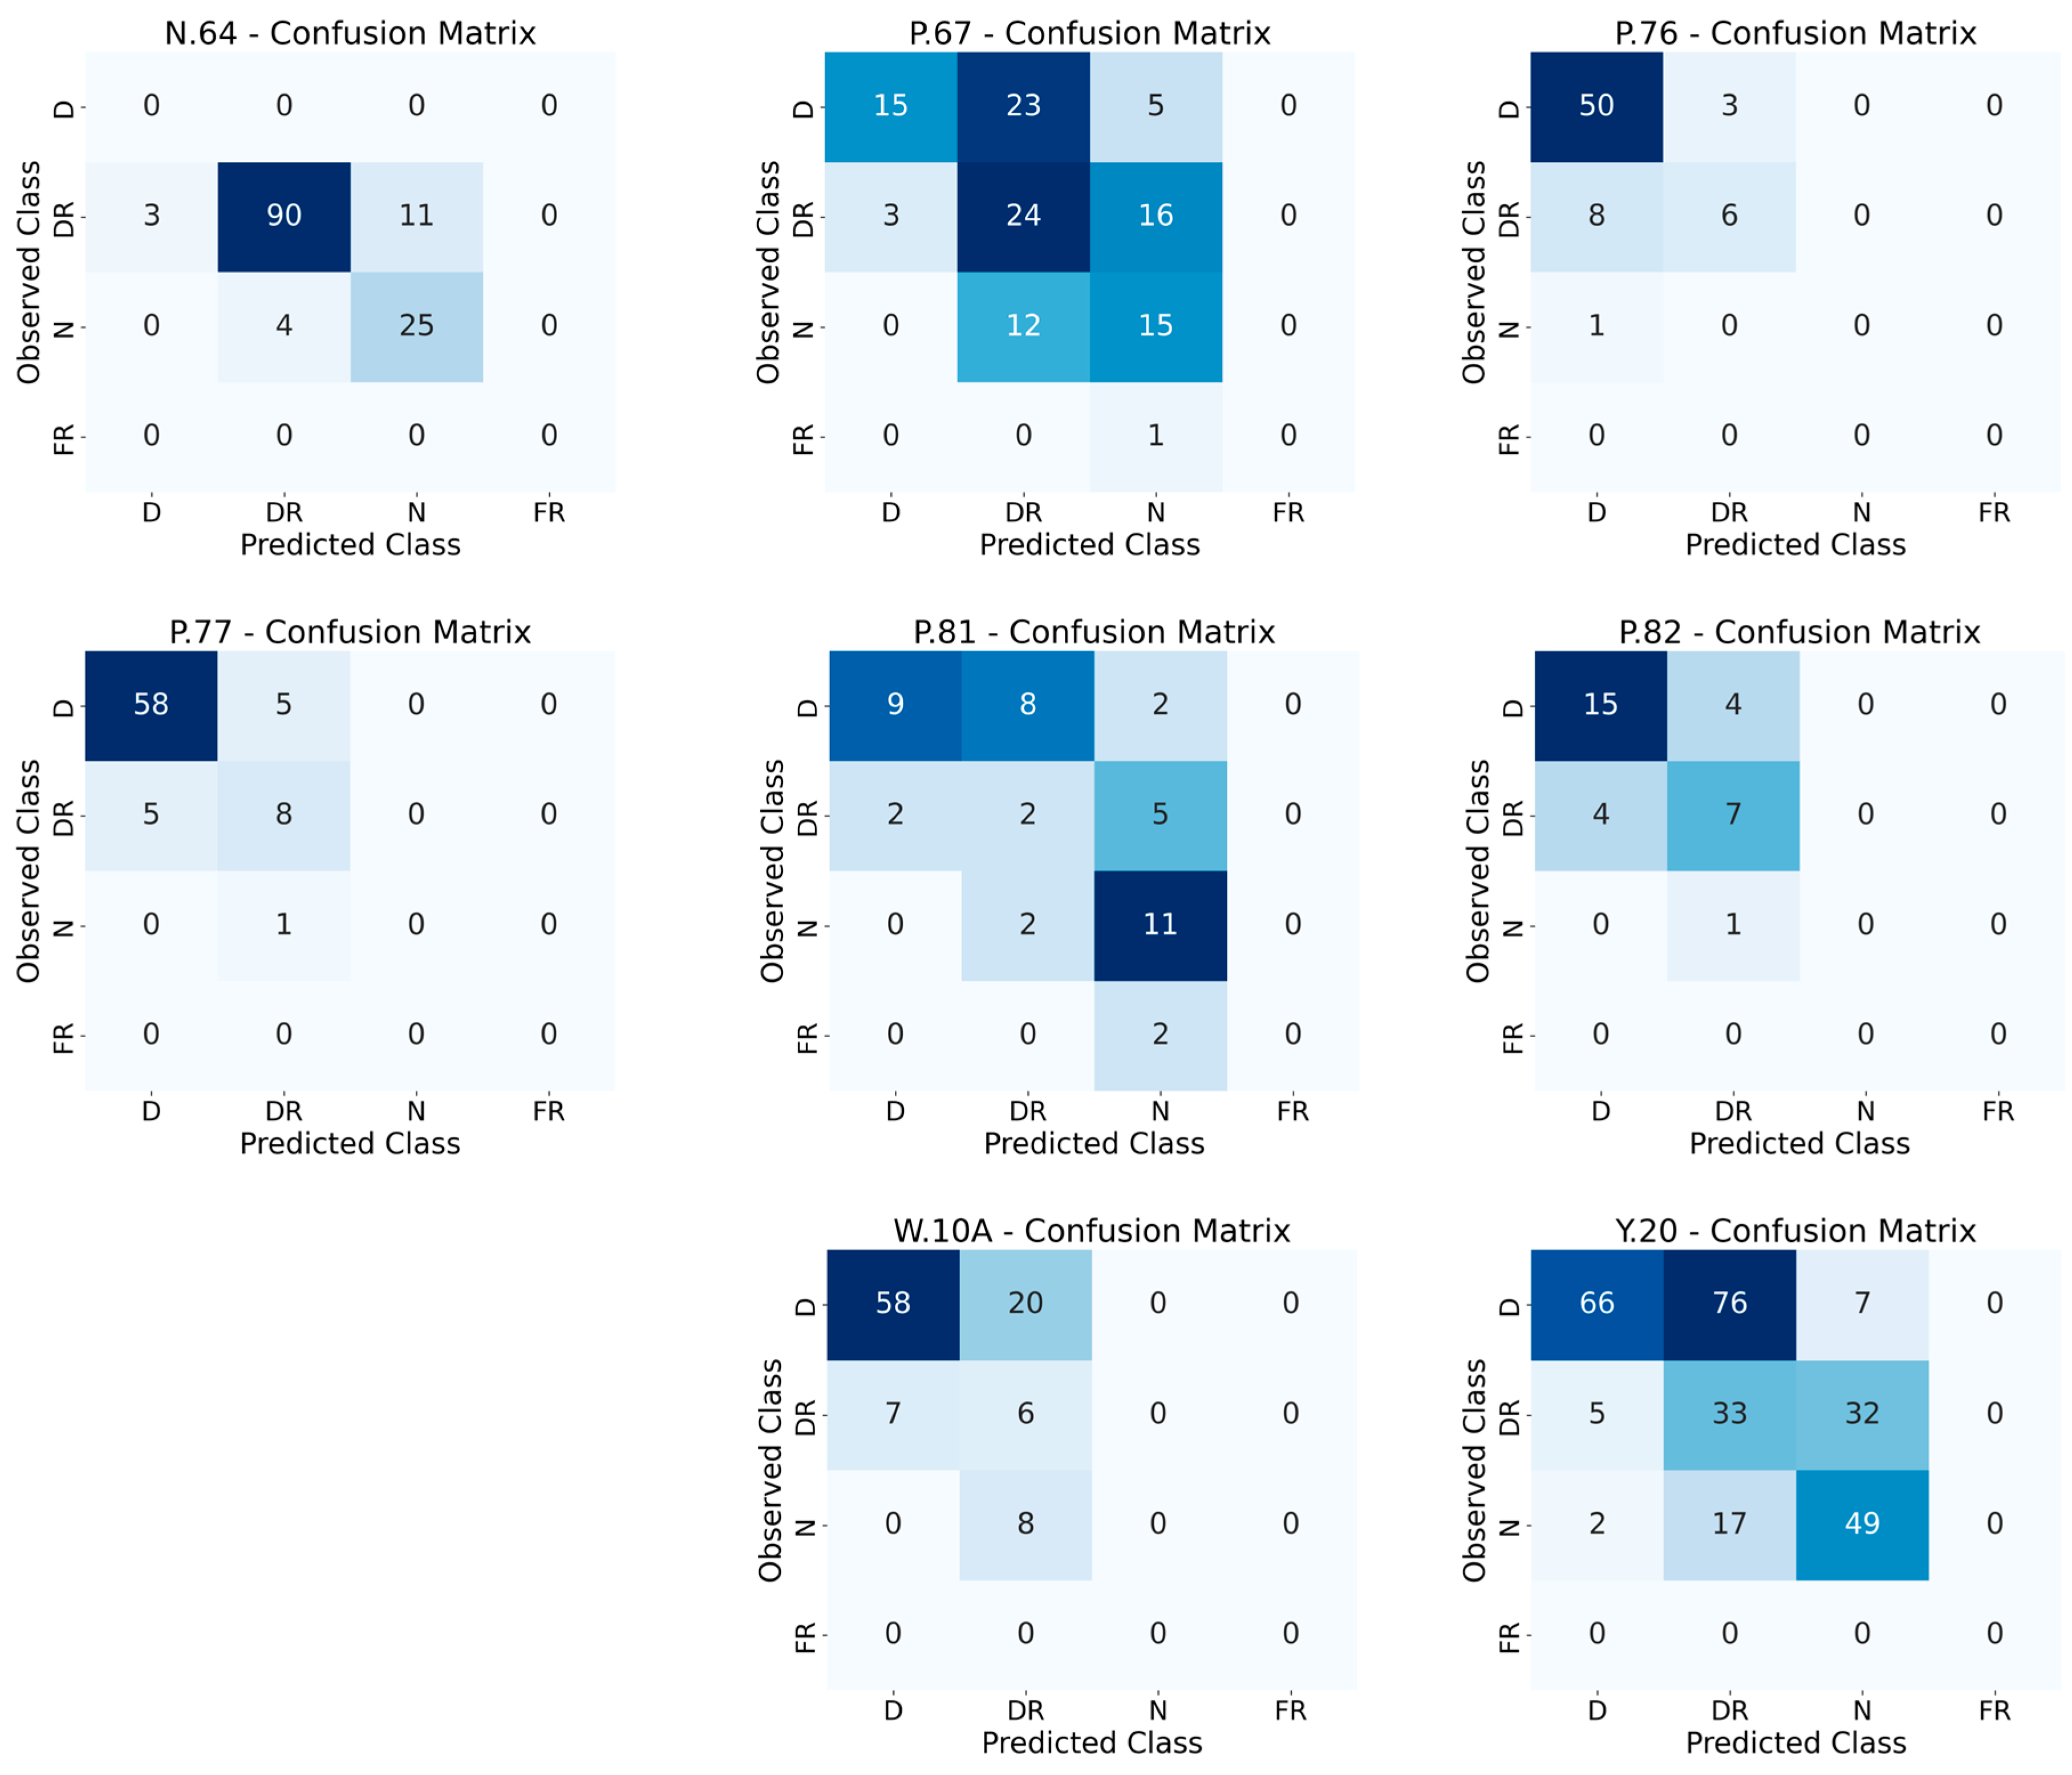
Figure 9 and Table 5 (the associated classification metrics table) present a detailed evaluation of the CHDI’s performance in classifying drought conditions at the eight hydrological stations (N.64, P.67, P.76, P.77, P.81, P.82, W.10A, and Y.20). This evaluation used confusion matrices and statistical indicators, including precision, recall, F1-score, and overall accuracy. The CHDI demonstrates notably high classification accuracy at stations such as N.64 (0.865), P.76 (0.824), and P.77 (0.857), indicating that the model captures the dynamics of drought risk with substantial reliability. For instance, P.76 shows high F1-scores for drought (0.89) and moderate performance in the drought-risk category (0.52), suggesting that the CHDI robustly identifies drought events but has moderate challenges in discriminating between adjacent risk levels. Conversely, stations such as P.67 (0.474) and P.81 (0.512) revealed moderate accuracy, with weaker recall and F1-scores in the “Normal” class. Y.20, with an accuracy of 0.516, shows moderate capability in capturing normal (F1-score = 0.63) and drought (F1-score = 0.59) conditions. Interestingly, despite an overall accuracy of 0.646 at W.10A, the F1-score for drought remained relatively strong (0.81), indicating that misclassifications may be localized to transitional periods between categories.
The consistently strong performance in detecting drought-risk events across most stations underscores the utility of the CHDI as a reliable drought monitoring index. However, its limited effectiveness in flood detection highlights this key limitation. In summary, these findings affirm the CHDI’s competency in classifying drought-related hydrological states, particularly at stations with well-defined seasonal water level patterns. Enhancing predictive resolution, especially for the “Normal” and “Flood” categories, may require the incorporation of additional predictive variables, handling of class imbalance, or implementation of ensemble classification methods to improve discrimination across all hydrological regimes.

4. Discussion

This study developed and evaluated the Composite Hydrological Drought Index (CHDI) for the northern watershed of Thailand, a region critically susceptible to hydrological extremes. By integrating key hydrological variables simulated from the Variable Infiltration Capacity (VIC) model with Principal Component Analysis (PCA), the CHDI introduces a novel multivariate approach to drought monitoring that addresses the limitations of traditional single-variable indices. This approach aligns with contemporary developments in drought research, which advocate for integrated indices capable of capturing the multifaceted nature of drought phenomena [35,36,37,38]. Correlation analysis highlighted the dominant influence of surface-driven hydrological processes, specifically precipitation, surface runoff, and surface soil moisture (SL0), which strong affect water level variability in the northern Thailand. These relationships informed the variable selection for PCA, ensuring that the CHDI remained responsive to the most significant drivers of short-term hydrological drought in the region. Strong positive correlations at stations such as N.64, P.67, and P.76 suggest rapid hydrological responses to rainfall events, whereas weaker associations with deeper soil moisture layers and baseflow indicate their limited influence on surface water dynamics over short time scales. This is consistent with findings from other regions where surface runoff, precipitation [39,40,41,42] and soil moisture [43,44] are the principal determinants of hydrological behavior, reinforcing the suitability of surface-based indicators for drought detection in such environments.
Performance assessments showed that the CHDI effectively reproduced seasonal and interannual water-level dynamics at stations in the Nan (N.64), Ping (P.67, P.81), and Wang (W.10A) basins. The index accurately captured both monsoonal peaks and dry-season lows, confirming its ability to model the surface-driven hydrological processes that dominate these regions. However, the analysis also highlighted the limitations of relying solely on surface indicators in more complex subbasins. For instance, the CHDI showed weaker predictive skills at some stations in Ping Basin (P.76, P.82) and, most notably, in the Yom Basin (Y.20). The negative regression slope at station Y.20 emphasizes its atypical hydrological behavior, which is shaped by both geomorphological and anthropogenic factors. Located in the midstream of the Yom Basin, this station reflects contrasting physiographic conditions: steep headwaters upstream and wide floodplains downstream, where heavy rainfall generates rapid runoff and short-lived flash floods. Despite frequent flooding, the Yom Basin remains the only major basin in northern Thailand without a storage dam, owing to decades of local opposition, leaving it without adequate water storage infrastructure. The basin serves as a key rice-growing area, where water-intensive agriculture drives a heavy reliance on both surface and groundwater. Intensive groundwater use creates imbalances between recharge and pumping, compounding the challenges of managing floods and droughts [27,45,46,47,48]. These combined influences play a stronger role than surface processes alone. Such complexities are not fully captured by CHDI. This variability suggests that while the CHDI provides a valuable regional framework, local calibration or interpretation is essential for accurate assessment in hydrologically diverse sub-catchments [49,50]. Overall, the responsiveness of the CHDI underscores its utility as a tool for early warning and seasonal water management in the region [51,52]. The index’s ability to capture the complex, multi-faceted nature of drought makes it a significant improvement over single-variable approaches for regions such as Northern Thailand.
Categorical performance evaluations using confusion matrices further affirmed the CHDI’s ability to identify hydrological drought states, especially the “drought” and “drought risk” categories. The high classification accuracy at stations such as N.64, P.76, and P.77 suggests the CHDI’s reliability in detecting water-scarce conditions. The consistent classification of drought-risk events across most stations indicates the potential of the index for operational drought monitoring and early warning. These results align with the findings of other composite indices that effectively delineate drought severity classes [53,54]. Nevertheless, the model exhibited limitations in distinguishing between the “normal” and “flood risk” categories, occasionally leading to misclassifications. This may be due to an imbalance in class representation within the training data or the model’s inherent bias toward drought conditions. This limitation reflects a broader trade-off in drought index design, where optimization for water scarcity may come at the expense of accuracy in wetter hydrological regimes [55,56]. This aligns with the broader hydrological drought literature emphasizing the need for groundwater-sensitive indices [57,58,59,60,61,62]. Furthermore, addressing class imbalance and adopting ensemble classification techniques could strengthen the ability of the CHDI to capture the full spectrum of hydrological states, thereby increasing its effectiveness as a comprehensive tool for drought monitoring and early warning.

Limitations and Future Work

The operational application of the VIC model presents both opportunities and challenges. Its process-based framework and ability to simulate multiple hydrological variables enabled the development of the Composite Hydrological Drought Index (CHDI), which represents a clear improvement over traditional single-variable indices in capturing basin-scale variability in Thailand. However, its use is constrained by significant computational requirements, including the need for a Linux-based computer server or High-Performance Computer (HPC) environment, extensive datasets, and long runtimes even without full parameter calibration. Therefore, the wider application of CHDI for drought monitoring and forecasting will depend on reducing computational demands and improving data accessibility. This study also relied on a 1976–2005 climate dataset, which provided a robust baseline but may not fully reflect recent climate change impacts. Methodologically, this study applied a simple linear regression with PC1, supported by observed, modeled linear relationships. Although suitable for the present analysis, future studies should consider nonlinear methods and multiple PCs to enhance robustness. Moreover, CHDI showed limited performance in detecting floods, partly due to the small number of observed events, highlighting the need for caution when extending its use to multi-hazard contexts. Future work should update the framework with more recent, high-resolution data and conduct comprehensive sensitivity analyses of the VIC model input parameters, particularly soil properties to strengthen reliability. Additionally, future research should apply the CHDI to climate projections, using downscaled datasets such as CMIP6 to evaluate future drought risks and inform climate-resilient water management strategies in Northern Thailand.

5. Conclusions

This study successfully developed and evaluated the Composite Hydrological Drought Index (CHDI) for northern Thailand’s watershed, leveraging the Variable Infiltration Capacity (VIC) model outputs and Principal Component Analysis (PCA). The study demonstrated that a multivariate approach, focusing on surface-driven hydrological variables (precipitation, surface runoff, and surface soil moisture) can effectively capture the complex dynamics of hydrological drought in this susceptible region. Key findings indicate that the chosen surface hydrological variables exhibit strong correlations with observed water levels, affirming their dominant role in influencing short-term hydrological responses within the watershed. PCA effectively reduced data dimensionality, with the first principal component (PC1) consistently explaining a significant portion of the hydrological variance, thereby providing a robust basis for CHDI. The CHDI demonstrated strong predictive performance in reproducing observed water level variations, particularly capturing the timing and magnitude of high-flow events during the rainy season, thus proving its utility for drought monitoring. Nonetheless, some stations, such as Y.20, revealed atypical hydrological behavior, underscoring the need for localized consideration. These patterns emphasize the challenges of applying a uniform drought index across hydrologically diverse sub-catchments. Overall, the CHDI represents a significant advancement in regional drought monitoring in northern Thailand. Its capacity to integrate multiple hydrological signals into a single, interpretable index enhances water resource management and strengthens regional drought preparedness efforts. Future research should explore incorporation of additional hydrological components, such as groundwater dynamics or lagged responses, and apply advanced machine learning techniques to further refine the predictive capabilities of the index across all hydrological regimes, ensuring even greater robustness and applicability in diverse catchment environments.

Author Contributions

All authors contributed to the study conceptualization and design. Data collection and analysis were conducted by D.L., who also interpreted the results. D.L. and C.C. drafted the original version of the manuscript. All authors have read and agreed to the published version of the manuscript.

Funding

This research was supported by the Thailand–China collaborative research project “Climate Change and Climate Variability Research in Monsoon Asia (CMON3)”, funded by the National Research Council of Thailand (NRCT), grant numbers N10A640315 and N10A650843, with partially supported by Chiang Mai University (CMU).

Data Availability Statement

The original contributions presented in this study are included in the article materials. Further inquiries should be directed to the corresponding author.

Acknowledgments

The authors would also like to express their sincere gratitude to Wang Lin from the Institute of Atmospheric Physics (IAP), Chinese Academy of Sciences (CAS), for supporting a visiting scholar position that enabled collaborative research on drought studies in the Southeast Asia.

Conflicts of Interest

The authors declare no conflicts of interest.

References

  1. Trenberth, K.; Dai, A.; van der Schrier, G.; Jones, P.D.; Barichivich, J.; Briffa, K.R.; Sheffield, J. Global warming and changes in drought. Nat. Clim. Change 2014, 4, 17–22. [Google Scholar] [CrossRef]
  2. Beule, L.; Lanhenke Buareal, K.; Buajan, S.; Preechamart, S.; Muangsong, C.; Pumijumnong, N. A 177 years extended of teak chronology revealing to the climate variability in phrae province, northern of thailand. Appl. Environ. Res. 2020, 42, 85–100. [Google Scholar] [CrossRef]
  3. Kume, T.; Takizawa, H.; Yoshifuji, N.; Tanaka, N.; Tanaka, K.; Tantasirin, C.; Suzuki, M. Severe drought resulting from seasonal and interannual variability in rainfall and its impact on transpiration in a hill evergreen forest in northern thailand. In Forest Environments in the Mekong River Basin; Springer: Tokyo, Japan, 2007; pp. 45–55. [Google Scholar] [CrossRef]
  4. Beule, L.; Lanhenke, J.-F.; Tantanee, S. Trends in precipitation in Thailand from 1964 to 2012. Asia-Pac. J. Sci. Technol. 2017, 21, 1–5. [Google Scholar] [CrossRef]
  5. Gosling, S.N.; Arnell, N.W. A global assessment of the impact of climate change on water scarcity. Clim. Change 2013, 134, 371–385. [Google Scholar] [CrossRef]
  6. Jitanugoon, S. Water resources development in thailand. In Proceedings of the 4th International Conference on Research in Social Sciences, Brussels, Belgium, 29–31 October 2021. [Google Scholar] [CrossRef]
  7. Bangkok Post. Assessing Drought Impact. 18 March 2020. Available online: https://www.bangkokpost.com/business/general/1881185/assessing-drought-impact (accessed on 3 November 2024).
  8. Hao, Z.; Singh, V.P. Drought characterization from a multivariate perspective: A review. J. Hydrol. 2015, 527, 668–678. [Google Scholar] [CrossRef]
  9. Gusyev, M.A.; Magome, J.; Hasegawa, A.; Takeuchi, K.; Fukushima, Y. Drought risk assessment with the use of ensemble hydrological predictions. J. Hydrol. 2015, 526, 502–516. [Google Scholar] [CrossRef]
  10. Nalbantis, I.; Tsakiris, G. Assessment of hydrological drought revisited. Water Resour. Manag. 2009, 23, 881–897. [Google Scholar] [CrossRef]
  11. Liu, Q.; Zhang, S.; Zhang, H.; Bai, Y.; Zhang, J. Monitoring drought using composite drought indices based on remote sensing. Sci. Total Environ. 2020, 711, 134585. [Google Scholar] [CrossRef] [PubMed]
  12. Faiz, M.A.; Zhang, Y.; Zhang, X.; Ma, N.; Aryal, S.K.; Ha, T.T.V.; Baig, F.; Naz, F. A composite drought index developed for detecting large-scale drought characteristics. J. Hydrol. 2022, 605, 127308. [Google Scholar] [CrossRef]
  13. Bravo, R.Z.B.; Cunha, A.P.M.D.A.; Leiras, A.; Cyrino Oliveira, F.L. A new approach for a drought composite index. Nat. Hazards 2021, 108, 755–773. [Google Scholar] [CrossRef]
  14. Abdourahamane, Z.S.; Garba, I.; Boukary, A.G.; Mirzabaev, A. Spatiotemporal characterization of agricultural drought in the Sahel region using a composite drought index. J. Arid. Environ. 2022, 204, 104789. [Google Scholar] [CrossRef]
  15. Pandya, P.; Gontia, N.K.; Parmar, H.V. Development of PCA-based composite drought index for agricultural drought assessment using remote-sensing. J. Agrometeorol. 2022, 24, 384–392. [Google Scholar] [CrossRef]
  16. Sharafi, S.; Ghaleni, M.M. Enhancing drought monitoring and prediction in diverse climates by using composite drought indices. Stoch. Environ. Res. Risk Assess. 2023, 38, 1–21. [Google Scholar] [CrossRef]
  17. Başakın, E.E.; Stoy, P.C.; Demirel, M.C.; Ozdogan, M.; Otkin, J.A. Combined drought index using high-resolution hydrological models and explainable artificial intelligence techniques in Türkiye. Remote Sens. 2024, 16, 3799. [Google Scholar] [CrossRef]
  18. Liu, X.; Zhu, X.; Zhang, Q.; Yang, T.; Pan, Y.; Sun, P. A remote sensing and artificial neural network-based integrated agricultural drought index: Index development and applications. Catena 2020, 186, 104394. [Google Scholar] [CrossRef]
  19. Zhang, Y.; Xie, D.; Tian, W.; Zhao, H.; Geng, S.; Lu, H.; Ma, G.; Huang, J.; Choy Lim Kam Sian, K.T. Construction of an integrated drought monitoring model based on deep learning algorithms. Remote Sens. 2023, 15, 667. [Google Scholar] [CrossRef]
  20. Hanadé Houmma, I.; Gadal, S.; El Mansouri, L.; Garba, M.; Gbetkom, P.G.; Mamane Barkawi, M.B.; Hadria, R. A new multivariate agricultural drought composite index based on random forest algorithm and remote sensing data developed for Sahelian agrosystems. Geomat. Nat. Hazards Risk 2023, 14, 2223384. [Google Scholar] [CrossRef]
  21. Hamman, J.; Nijssen, B.; Bohn, T.J.; Gergel, D.R.; Mao, Y. The variable infiltration capacity model version 5 (vic-5): Infrastructure improvements for new applications and reproducibility. Geosci. Model Dev. 2018, 11, 3481–3496. [Google Scholar] [CrossRef]
  22. Luong, N.D.; Hiep, N.H.; Bui, T.H. Investigating the spatio-temporal variation of soil moisture and agricultural drought towards supporting water resources management in the red river basin of vietnam. Sustainability 2021, 13, 4926. [Google Scholar] [CrossRef]
  23. Apurv, T.; Cai, X. Impact of droughts on water supply in u.s. watersheds: The role of renewable surface and groundwater resources. Earth’s Future 2020, 8, e2020EF001648. [Google Scholar] [CrossRef]
  24. Zhu, B.; Xie, X.; Wang, Y.; Zhao, X. The benefits of continental-scale high-resolution hydrological modeling in the detection of extreme hydrological events in china. Remote Sens. 2023, 15, 2402. [Google Scholar] [CrossRef]
  25. Thanapakpawin, P.; Boonya-aroonnet, S.; Chankarn, A.; Chitradon, R.; Snidvongs, A. Chapter 7 thailand drought risk management: Macro and micro strategies. In Droughts in Asian Monsoon Region; Community, Environment and Disaster Risk Management; Emerald Group Publishing Limited: Braffo, UK, 2011; pp. 121–140. [Google Scholar] [CrossRef]
  26. Goodwin, D.; Holman, I.; Sutcliffe, C.; Salmoral, G.; Pardthaisong, L.; Visessri, S.; Ekkawatpanit, C.; Rey, D. The contribution of a catchment-scale advice network to successful agricultural drought adaptation in northern thailand. Philos. Trans. R. Soc. A Math. Phys. Eng. Sci. 2022, 380, 20210293. [Google Scholar] [CrossRef]
  27. Gopalan, S.P.; Hanasaki, N.; Champathong, A.; Tebakari, T. Impact assessment of reservoir operation in the context of climate change adaptation in the Chao Phraya River basin. Hydrol. Process. 2020, 35, e14005. [Google Scholar] [CrossRef]
  28. Liang, X.; Lettenmaier, D.P.; Wood, E.F.; Burges, S.J. A Simple hydrologically Based Model of Land Surface Water and Energy Fluxes for GSMs. J. Geophys. Res. 1994, 99, 14415–14428. [Google Scholar] [CrossRef]
  29. Abrams, M.; Yamaguchi, Y.; Crippen, R. ASTER GLOBAL DEM (GDEM) VERSION 3. Int. Arch. Photogramm. Remote Sens. Spat. Inf. Sci. 2022, XLIII-B4-2022, 593–598. [Google Scholar] [CrossRef]
  30. FAO; IIASA; ISRIC; ISSCAS; JRC. Harmonized World Soil Database (Version 1.2). 2012. Available online: https://www.fao.org/soils-portal/data-hub/soil-maps-and-databases/harmonized-world-soil-database-v12/en/ (accessed on 10 August 2023).
  31. Friedl, M.; Sulla-Menashe, D. MCD12C1 MODIS/Terra+Aqua Land Cover Type Yearly L3 Global 0.05Deg CMG V006 [Data Set]; NASA Land Processes Distributed Active Archive Center: Sioux Falls, SD, USA, 2015. [Google Scholar] [CrossRef]
  32. Pratoomchai, W.; Ekkawatpanit, C.; Yoobanpot, N.; Lee, K.T.A. Dilemma between Flood and Drought Management: Case Study of the Upper Chao Phraya Flood-Prone Area in Thailand. Water 2022, 14, 4056. [Google Scholar] [CrossRef]
  33. Kongmuang, C.; Tantanee, S.; Seejata, K. Urban flood hazard map using gis of muang sukhothai district, thailand. Geogr. Tech. 2020, 15, 143–152. [Google Scholar] [CrossRef]
  34. Srisuk, K.; Chusanatus, S.; Munyou, S.; Archwichai, L.; Pholkern, K.; Boonsongka, P. Ranking the suitability of sub-watersheds for ponding-based methods of managed aquifer recharge in lower yom river basin, thailand. J. Geol. Resour. Eng. 2014, 2, 158–166. [Google Scholar] [CrossRef][Green Version]
  35. Zhang, L.; Jiao, W.; Zhang, H.; Huang, C.; Tong, Q. Studying drought phenomena in the continental united states in 2011 and 2012 using various drought indices. Remote Sens. Environ. 2017, 190, 96–106. [Google Scholar] [CrossRef]
  36. Heim, R.R.; Bathke, D.J.; Bonsal, B.; Cooper, E.W.T.; Hadwen, T.; Kodama, K.; McEvoy, D.; Muth, M.; Nielsen-Gammon, J.W.; Weight, E. A review of user perceptions of drought indices and indicators used in the diverse climates of north america. Atmosphere 2023, 14, 1794. [Google Scholar] [CrossRef]
  37. Otkin, J.A.; Zhong, Y.; Ford, T.W.; Anderson, M.C.; Hain, C.; Hoell, A.; Svoboda, M.; Wang, H. Multivariate evaluation of flash drought across the united states. Water Resour. Res. 2024, 60, e2024WR037333. [Google Scholar] [CrossRef]
  38. Rajsekhar, D.; Singh, V.P.; Mishra, A.K. Multivariate drought index: An information theory based approach for integrated drought assessment. J. Hydrol. 2015, 526, 164–182. [Google Scholar] [CrossRef]
  39. Strohmeier, S.; López, P.L.; Haddad, M.; Nangia, V.; Karrou, M.; Montanaro, G.; Boudhar, A.; Linés, C.; Veldkamp, T.; Sterk, G. Surface runoff and drought assessment using global water resources datasets—From oum er rbia basin to the moroccan country scale. Water Resour. Manag. 2019, 34, 2117–2133. [Google Scholar] [CrossRef]
  40. Jarihani, B.; Sidle, R.C.; Bartley, R.; Roth, C.; Wilkinson, S. Characterisation of hydrological response to rainfall at multi spatio-temporal scales in savannas of semi-arid australia. Water 2017, 9, 540. [Google Scholar] [CrossRef]
  41. Vichta, T.; Deutscher, J.; Hemr, O.; Tomášová, G.; Žižlavská, N.; Brychtová, M.; Bajer, A.; Shukla, M.K. Combined effects of rainfall-runoff events and antecedent soil moisture on runoff generation processes in an upland forested headwater area. Hydrol. Process. 2024, 38, e15216. [Google Scholar] [CrossRef]
  42. Cui, A.; Li, J.; Zhou, Q.; Zhu, H.; Liu, H.; Yang, C.; Wu, G.; Li, Q. Propagation dynamics from meteorological drought to grace-based hydrological drought and its influencing factors. Remote Sens. 2024, 16, 976. [Google Scholar] [CrossRef]
  43. Brunner, M.I.; Stahl, K. Temporal hydrological drought clustering varies with climate and land-surface processes. Environ. Res. Lett. 2023, 18, 034011. [Google Scholar] [CrossRef]
  44. Hao, Z.; AghaKouchak, A. A nonparametric multivariate multi-index drought monitoring framework. J. Hydrometeorol. 2014, 15, 89–101. [Google Scholar] [CrossRef]
  45. Liu, J.; Yang, H.; Gosling, S.N.; Kummu, M.; Flörke, M.; Pfister, S.; Hanasaki, N.; Wada, Y.; Zhang, X.; Oki, T. Water scarcity assessments in the past, present, and future. Earth’s Future 2017, 5, 545–559. [Google Scholar] [CrossRef]
  46. Kong, X.; Li, Z.; Liu, Z. Flood prediction in ungauged basins by physical-based topkapi model. Adv. Meteorol. 2019, 2019, 1–16. [Google Scholar] [CrossRef]
  47. Muhebwa, A.; Gleason, C.J.; Feng, D.; Taneja, J. Improving discharge predictions in ungauged basins: Harnessing the power of disaggregated data modeling and machine learning. Water Resour. Res. 2024, 60, e2024WR037122. [Google Scholar] [CrossRef]
  48. Zhang, W.; Deng, Q.; Ye, M.; Hao, W.; Chen, Y.; Zheng, Y.; Zhong, Z.; Yan, J.; Sun, X.; Li, F. The ancient lithospheric parameters of impact basins on the far side of the moon based on the mantle and mare basalt load model. J. Geophys. Res. Planets 2024, 129, e2023JE008006. [Google Scholar] [CrossRef]
  49. Chen, J.; Wang, W. Pca−arma-based control charts for performance monitoring of multivariable feedback control. Ind. Eng. Chem. Res. 2010, 49, 2228–2241. [Google Scholar] [CrossRef]
  50. Maneechot, L.; Chang, J.H.-W.; He, K.; Hu, M.; Wan-Mohtar, W.A.A.Q.I.; Ilham, Z.; García Castro, C.; Wong, Y.J. Adaptive Neuro-Fuzzy Optimization of Reservoir Operations Under Climate Variability in the Chao Phraya River Basin. Water 2025, 17, 1740. [Google Scholar] [CrossRef]
  51. Chagas, V.B.P.; Chaffe, P.L.B.; Blöschl, G. Drought-rich periods are more likely than flood-rich periods in brazil. Water Resour. Res. 2024, 60, e2023WR035851. [Google Scholar] [CrossRef]
  52. Lun, D.; Fischer, S.; Viglione, A.; Blöschl, G. Detecting flood-rich and flood-poor periods in annual peak discharges across europe. Water Resour. Res. 2020, 56, e2019WR026575. [Google Scholar] [CrossRef]
  53. Ndayiragije, J.M.; Li, F. Effectiveness of drought indices in the assessment of different types of droughts, managing and mitigating their effects. Climate 2022, 10, 125. [Google Scholar] [CrossRef]
  54. Kim, S.; Parhi, P.; Jun, H.; Lee, J. Evaluation of drought severity with a bayesian network analysis of multiple drought indices. J. Water Resour. Plan. Manag. 2018, 144, 05017016. [Google Scholar] [CrossRef]
  55. Damkjaer, S.; Taylor, R.G. The measurement of water scarcity: Defining a meaningful indicator. Ambio 2017, 46, 513–531. [Google Scholar] [CrossRef]
  56. Lee, T.; Kong, Y.; Singh, V.P.; Lee, J. Autoencoder-based composite drought indices. Environ. Res. Lett. 2024, 19, 074007. [Google Scholar] [CrossRef]
  57. Leelaruban, N.; Padmanabhan, G.; Oduor, P.G. Examining the relationship between drought indices and groundwater levels. Water 2017, 9, 82. [Google Scholar] [CrossRef]
  58. Briones, J.V.; Sutanudjaja, E.H.; Jong, S.d.; Wanders, N. Modelling groundwater hydrological drought and its recovery given natural and anthropogenic scenarios in south america. Hydrol. Process. 2024, 38, e15340. [Google Scholar] [CrossRef]
  59. Sutanto, S.J.; Lanen, H.V. Hydrological drought characteristics based on groundwater and runoff across europe. Proc. Int. Assoc. Hydrol. Sci. 2020, 383, 281–290. [Google Scholar] [CrossRef]
  60. Bloomfield, J.P.; Marchant, B.P.; McKenzie, A. Changes in groundwater drought associated with anthropogenic warming. Hydrol. Earth Syst. Sci. 2019, 23, 1393–1408. [Google Scholar] [CrossRef]
  61. Birk, S.; Griebler, C.; Haas, J.C.; Retter, A.; Kokimova, A.; Englisch, C.; Gaviria, S.; Grath, J.; Brielmann, H.; Stumpp, C. Impact of Extreme Hydrological Events on the Quantity and Quality of Groundwater in Alpine Regions—Multiple-Index Application for an Integrative Hydrogeo-Ecological Assessment. 2023. Available online: https://epub.oeaw.ac.at/?arp=0x003e7b83 (accessed on 20 May 2025).
  62. Ochoa-Tocachi, B.F.; Buytaert, W.; Bièvre, B.D. Regionalization of land-use impacts on streamflow using a network of paired catchments. Water Resour. Res. 2016, 52, 6710–6729. [Google Scholar] [CrossRef]
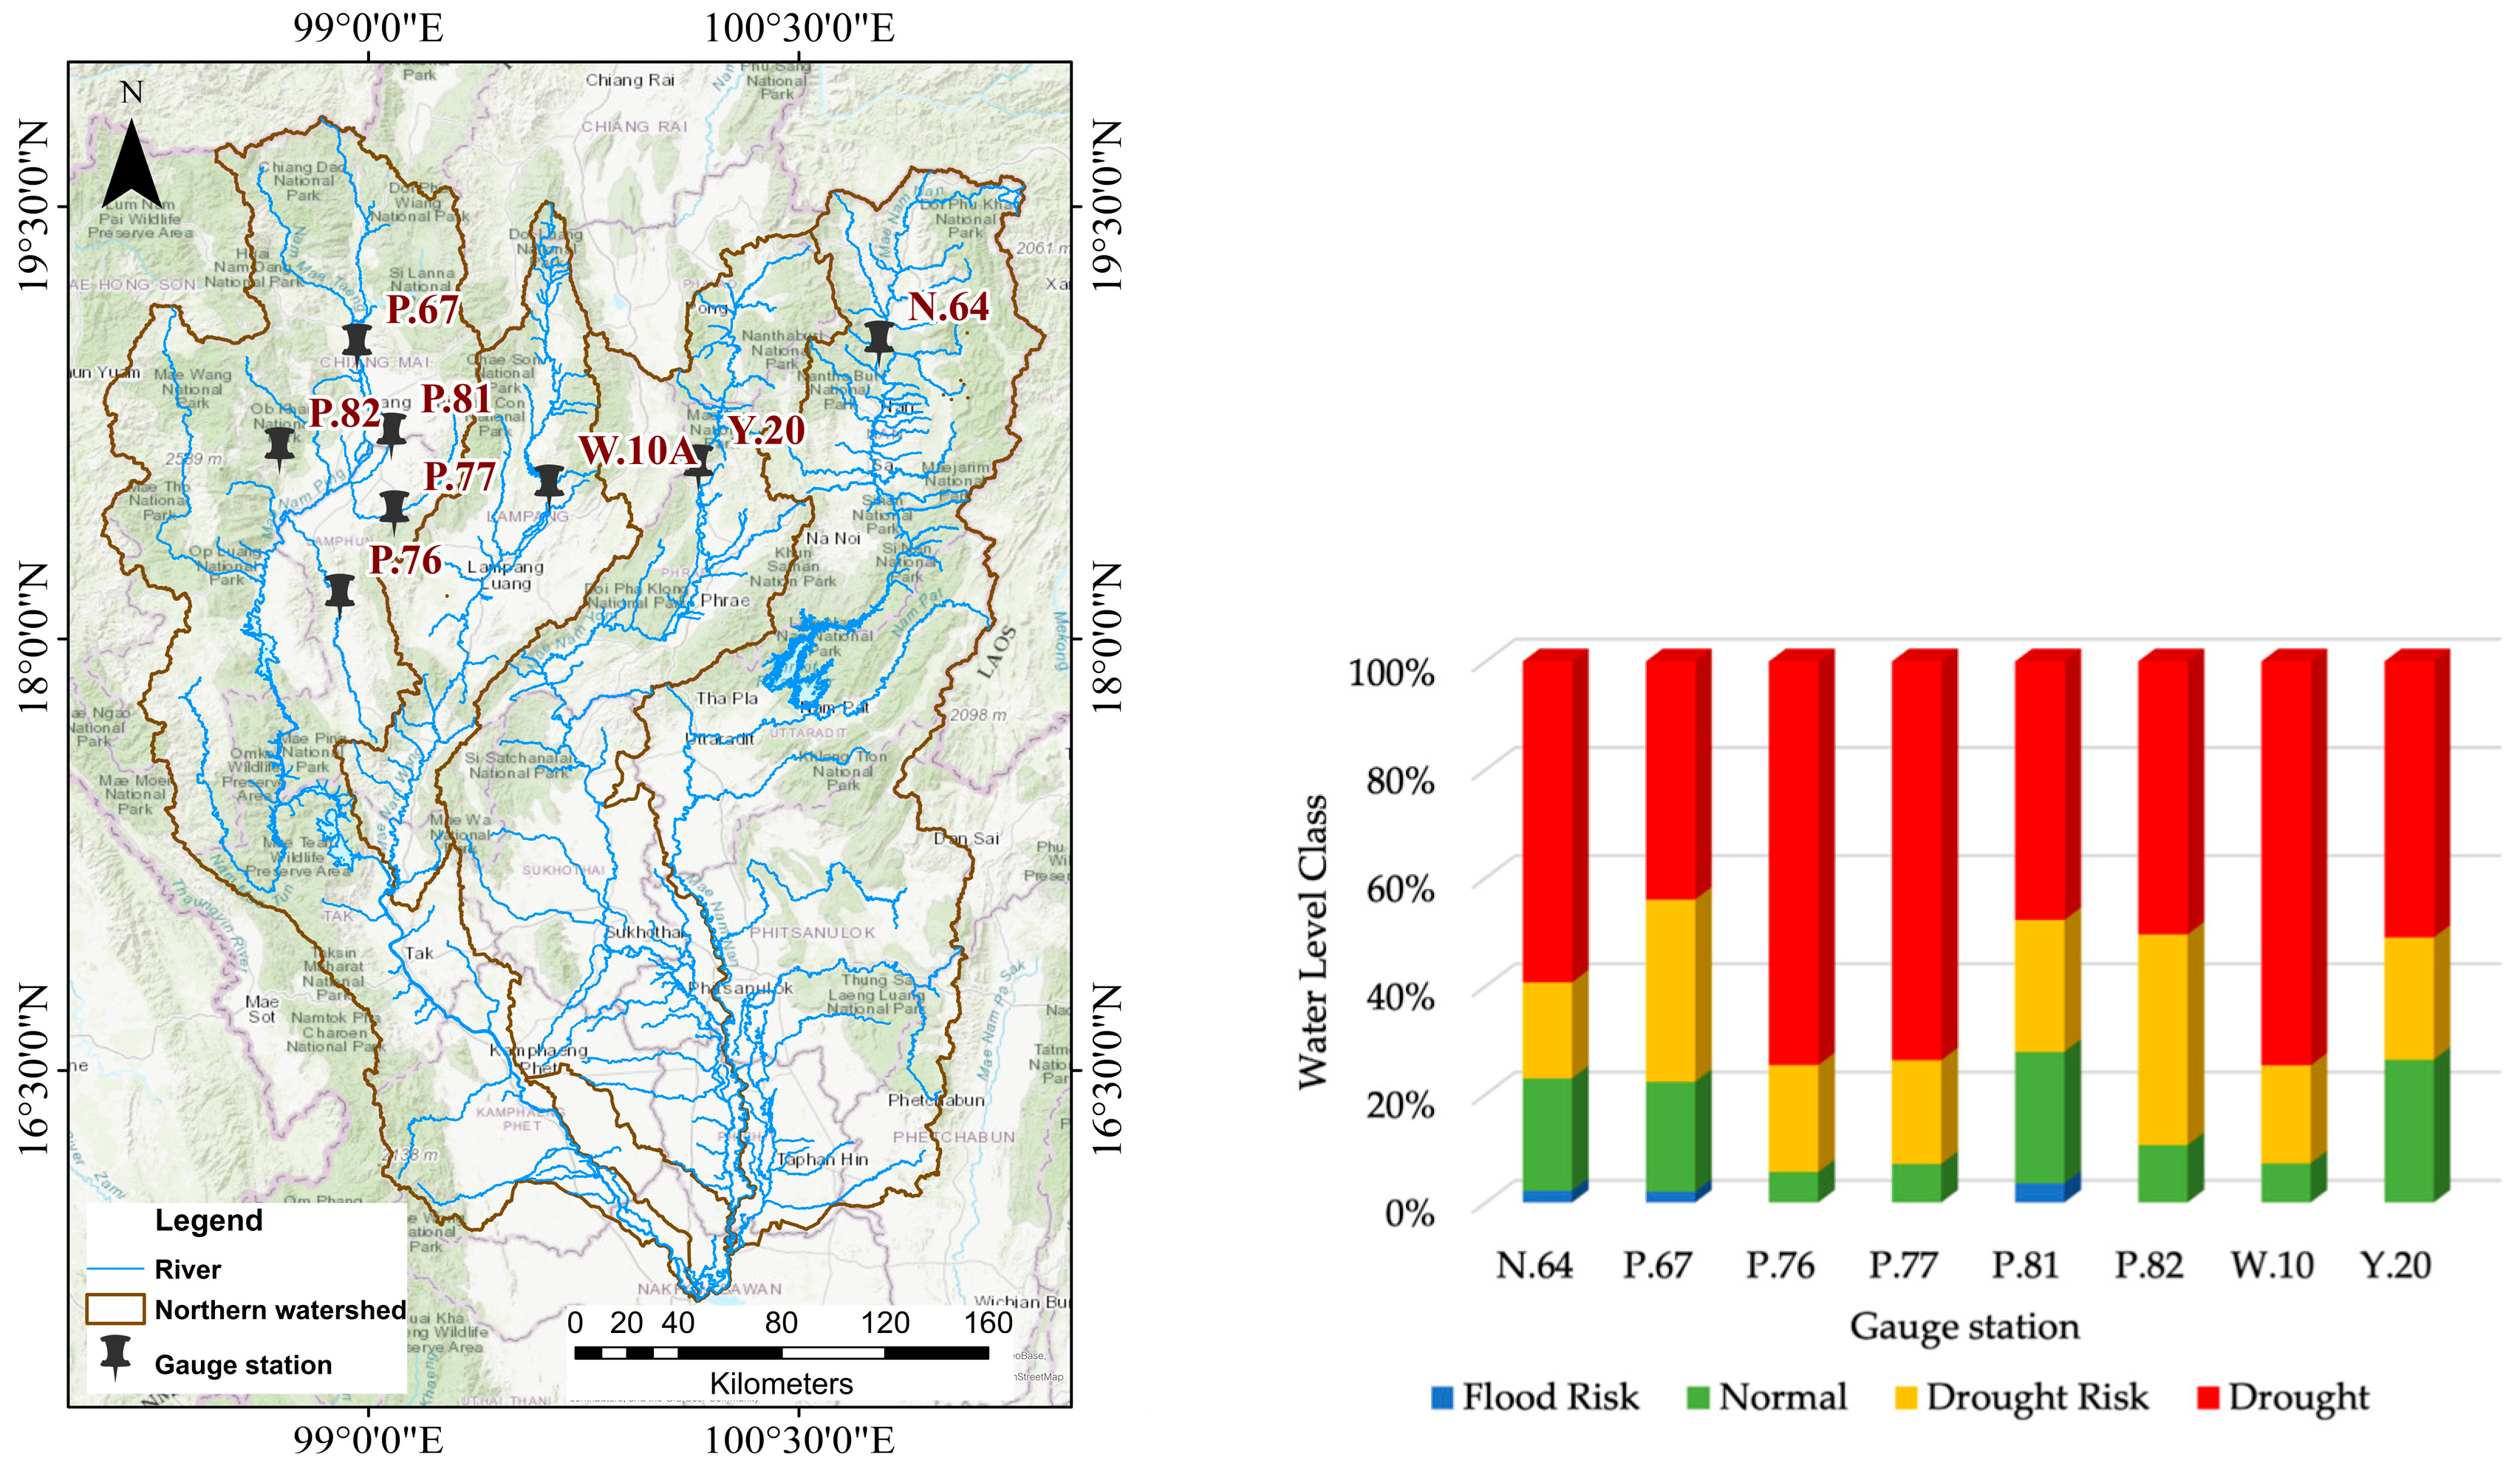
Figure 1. Geographic distribution of hydrological gauge stations (left) and historical classification of water level conditions (right) across the northern watershed of Thailand. The bar chart illustrates the proportion of time each station experienced flood risk, normal conditions, drought risk, and drought, based on historical water level records.
Water 17 02732 g001
Figure 2. Pearson correlation coefficients between observed water levels at eight hydrological gauge stations and key simulated variables from the VIC model. Higher correlation values (close to ±1) indicate stronger linear association.
Water 17 02732 g002
Figure 3. Scree plots displaying the explained variance and cumulative variance (%) of principal components (PCs) derived from the hydrological variables at each gauge station. The first principal component (PC1) consistently explained the largest proportion of variance, supporting its use in constructing the CHDI.
Water 17 02732 g003
Figure 4. Principal Component Analysis (PCA) biplots illustrating the contributions of key hydrological variables to the first two principal components (PC1 and PC2) for each gauge station (red vectors represent variable loadings, indicating the direction and magnitude of each variable’s contribution, while blue dots represent individual observations projected in the reduced PCA space).
Water 17 02732 g004
Figure 5. Scatter plots illustrating the relationship between observed water levels and predicted values derived from the first principal component (PC1) at the gauge stations. Each regression equation represents the CHDI, with the 1:1 red dashed line indicating the perfect agreement between the observations and predictions.
Water 17 02732 g005
Figure 6. First-order Sobol indices (S1, blue) and total-order Sobol indices (ST, orange), with 95% confidence intervals, for hydrological parameters at eight gauge stations in northern Thailand’s watershed. The results highlighted the parameter sensitivities and interactions that influence the observed water levels.
Water 17 02732 g006
Figure 7. Time-series comparison between observed water levels and predicted values from the first principal component (PC1), proposed as the CHDI, at selected gauge stations. The Pearson correlation coefficient (R) and Nash–Sutcliffe Efficiency (NSE) were used to assess the prediction performance at each station.
Water 17 02732 g007
Figure 8. Comparison between observed (top) and predicted (bottom) hydrological drought categories based on the CHDI classification using the first principal component (PC1) at each gauge station. The model performance was assessed by comparing the CHDI-derived predicted categories with the observed water level classifications across multiple time steps.
Water 17 02732 g008
Figure 9. Confusion matrices showing the classification performance of the CHDI derived from the first principal component (PC1) at each gauge station. The observed hydrological categories (Drought, Drought Risk, Normal, and Flood Risk) were compared with CHDI-based predictions. The diagonal elements represent the correctly classified instances, whereas the off-diagonal elements indicate misclassifications. The results illustrated the station-specific performance and highlighted the classification accuracy of the CHDI in replicating observed drought conditions.
Water 17 02732 g009
Table 1. Classification scheme for hydrological drought index categories based on observed water level percentages relative to maximum discharge (Qmax).
CategoriesWater Level
DroughtLess than 10%
Drought risk10–30%
Normal30–70%
Flood riskMore than 70%
Table 2. Eigenvector weights of the first principal component (PC1) for each hydrological variable across the gauge stations in the Northern watershed of Thailand.
VariableEigen Vector (PC1)
N.64P.67P.76P.77P.81P.82W.10AY.20
Baseflow0.350.370.390.380.380.340.39−0.31
Evaporation0.350.340.340.340.340.370.31−0.35
Precipitation0.400.390.370.380.380.410.36−0.41
Runoff0.410.420.400.430.420.430.42−0.45
Surface layer soil moisture0.430.440.430.430.430.450.44−0.45
First-layer soil moisture0.350.330.340.330.340.300.35−0.36
Second-layer soil moisture0.340.350.360.340.340.310.36−0.29
PC1 Variance Explained64.6%63.1%68.8%61.5%61.8%55.9%61.8%57.4%
Table 3. Regression equations for predicting observed water levels from the first principal component (PC1) at each gauge station.
StationEquation
N.64Predicted water level = 199.981 + (87.289 × PC1)
P.67Predicted water level = 89.366 + (26.310 × PC1)
P.76Predicted water level = 13.522 + (4.062 × PC1)
P.77Predicted water level = 5.391 + (2.133 × PC1)
P.81Predicted water level = 32.018 + (13.060 × PC1)
P.82Predicted water level = 9.448 + (1.879 × PC1)
W.10APredicted water level = 23.885 + (7.995 × PC1)
Y.20Predicted water level = 91.418 + (−37.400 × PC1)
Table 4. Evaluation of the CHDI performance at each gauge station using statistical indicators.
STATIONRp-ValueNSES.D. ObsS.D. PredRMSEMAEIOAR2
N.640.794.12 × 10−300.63234186142970.880.63
P.670.614.56 × 10−130.37905571510.730.37
P.760.492.07 × 10−50.2418916100.610.24
P.770.631.03 × 10−90.3974540.750.39
P.810.785.90 × 10−100.61352722160.870.61
P.820.522.72 × 10−30.2774640.630.27
W.10A0.548.96 × 10−90.29311726180.660.29
Y.200.681.42 × 10−390.461117582580.780.46
Notes: IOA = Index of Agreement, S.D. obs = standard deviation of observed, S.D. pred = standard deviation of predicted.
Table 5. Classification performance metrics for the CHDI derived from the first principal component (PC1), evaluated against the observed hydrological conditions at each gauge station. Metrics include precision, recall, and F1-score for each severity class (Drought, Drought Risk, Normal, and Flood Risk), as well as overall classification accuracy.
GaugeStatisticalDroughtDrought RiskNormalFlood RiskAccuracy
N.64precision0.000.960.690.000.865
recall0.000.870.860.00
f1-score0.000.910.770.00
P.67precision0.830.410.000.410.474
recall0.350.560.000.56
f1-score0.490.470.000.47
P.76precision0.850.670.000.000.824
recall0.940.430.000.00
f1-score0.890.520.000.00
P.77precision0.920.570.000.000.857
recall0.920.620.000.00
f1-score0.920.590.000.00
P.81precision0.820.170.000.550.512
recall0.470.220.000.85
f1-score0.600.190.000.67
P.82precision0.790.580.000.000.710
recall0.790.640.000.00
f1-score0.790.610.000.00
W.10Aprecision0.890.180.000.000.646
recall0.740.460.000.00
f1-score0.810.260.000.00
Y.20precision0.900.260.560.000.516
recall0.440.470.720.00
f1-score0.590.340.630.00
Disclaimer/Publisher’s Note: The statements, opinions and data contained in all publications are solely those of the individual author(s) and contributor(s) and not of MDPI and/or the editor(s). MDPI and/or the editor(s) disclaim responsibility for any injury to people or property resulting from any ideas, methods, instructions or products referred to in the content.