Article

Radionuclide Distribution and Hydrochemical Controls in Groundwater of the Nile Valley, Upper Egypt: Health and Environmental Implications

by
Khaled Ali
1,*,
Zinab S. Matar
2,
Clemens Walther
3,
Khaled Salah El-Din
1,
Shaban Harb
1,
Mahmoud Kilany
1 and
Karem Moubark
4
1
Physics Department, Faculty of Science, South Valley University, Qena 83523, Egypt
2
Physics Department, College of Science, Umm Al-Qura University, Makkah 21231, Saudi Arabia
3
Institute for Radioecology and Radiation Protection, Leibniz University Hanover, 30419 Hannover, Germany
4
Geology Department, Faculty of Science, South Valley University, Qena 83523, Egypt
*
Author to whom correspondence should be addressed.
Water 2025, 17(18), 2730; https://doi.org/10.3390/w17182730
Submission received: 30 July 2025 / Revised: 6 September 2025 / Accepted: 9 September 2025 / Published: 15 September 2025
(This article belongs to the Section Hydrogeology)

Abstract

This study provides a comprehensive evaluation of naturally occurring radionuclides—radium-226 (226Ra), thorium-232 (232Th), and potassium-40 (40K)—in groundwater systems across the Nile Valley regions of Upper Egypt, based on the analysis of 85 groundwater wells. Measured mean activity concentrations were 0.74 ± 0.3 Bq/L for 226Ra, 0.24 ± 0.1 Bq/L for 232Th, and 13 ± 4 Bq/L for 40K, with 226Ra displaying low correlations with salinity indicators including chloride (Cl), sodium (Na+), electrical conductivity (EC), and total dissolved solids (TDS). Notably, approximately 30% of sampled wells exceeded the World Health Organization (WHO) guidance level of 1 Bq/L for 226Ra, primarily in central and eastern zones influenced by elevated salinity and evaporite dissolution processes. Geospatial mapping combined with multivariate statistical analysis identified four principal components accounting for over 85% of total data variability, demonstrating that depth-dependent processes, including prolonged water–rock interaction and redox evolution, are the primary controls on 226Ra mobilization, with salinity-driven ion exchange as a secondary factor. Minor anthropogenic influences, potentially linked to agricultural activities in shallow aquifers, were also detected. Radiological risk assessment confirmed that calculated annual effective doses remain well within international safety limits (<1 mSv/year), although infants and children demonstrated relatively higher exposure levels due to increased water intake per unit body weight. Lifetime cancer risk estimates via ingestion pathways yielded values below 1 × 10⁻⁴, aligning with global health organization benchmarks and reinforcing the general safety of groundwater use in the region. The study highlights potential risks posed by saline groundwater to ancient monuments and archaeological sites, as the cycles of salt forming and breaking down might speed up damage to buildings made of limestone and sandstone. These findings establish a robust scientific foundation for future groundwater quality management and cultural heritage conservation efforts in the Nile Valley region of southern Egypt.

1. Introduction

Groundwater is a critical global resource for drinking water supply, particularly in arid and semi-arid regions where surface water is limited. It supports domestic, agricultural, and industrial needs for billions of people worldwide [1]. In regions such as Luxor Governorate in the Nile Valley of Upper Egypt, groundwater constitutes the principal freshwater source, serving as the backbone of local water security [2,3]. The study was conducted in Upper Egypt, a region where geological and hydrogeological conditions may favor the mobilization of naturally occurring radionuclides into groundwater. Geological formations rich in phosphates and uranium are known to contribute to elevated levels of natural radionuclides in groundwater systems [4,5,6]. Previous investigations in arid regions with similar geological settings have documented elevated natural radioactivity in groundwater, primarily of geogenic origin [7,8,9]. The environmental behavior of natural radionuclides such as 226Ra, 232Th, and 40K is governed by their geochemical affinity and the hydrogeological characteristics of aquifer systems [10,11]. These radionuclides originate primarily from the decay of uranium and thorium series within aquifer materials, with their mobilization influenced by (1) the mineralogical composition of host rocks—especially phosphate-rich formations known for elevated uranium content—and (2) key geochemical processes including redox reactions, pH, and cation exchange [12]. Radionuclide release into groundwater occurs mainly via mineral dissolution, ion exchange, and redox-driven desorption, with 226Ra being particularly mobile under reducing conditions [13,14]. The distribution of radionuclides in groundwater is controlled not only by their source rock composition and local geochemical conditions—such as redox potential, pH, and ion exchange—but also by groundwater flow dynamics, which govern the transport of dissolved species and their potential accumulation in discharge zones far from the source. For instance, 226Ra, due to its high solubility and chemical similarity to calcium and barium, can remain mobile over long distances under reducing conditions, whereas 232Th is typically immobile due to its low solubility and rapid adsorption onto mineral surfaces. Understanding these environmental behaviors is essential for interpreting spatial patterns of contamination and identifying areas at higher risk of radiological exposure [15,16,17,18]. Chronic ingestion of naturally occurring radionuclides in drinking water is associated with elevated risks of cancer and other radiological health effects, particularly due to internal alpha radiation exposure [1,19]. Radium-226 (226Ra) and thorium-232 (232Th) are of particular concern due to their long half-lives and high radiotoxicity. 226Ra, in particular, shows potential for bioaccumulation in bone tissues due to its chemical similarity to calcium [20,21,22,23,24,25]. Regulatory frameworks, including the World Health Organization (WHO) guidelines [1], recommend a screening level of 1 Bq/L for gross alpha activity in drinking water, with specific activity limits for individual radionuclides to minimize radiological risks. National standards in several countries further impose stricter thresholds, underscoring the importance of routine monitoring. Quantitative assessment of 226Ra, 232Th, and 40K is therefore critical not only for regulatory compliance but also for estimating age-dependent effective doses and lifetime cancer risks. Despite growing awareness of groundwater quality issues related to natural radioactivity, integrated studies combining radiometric assessment, detailed hydrochemical analysis, and advanced geospatial modeling remain limited in the region, particularly in Upper Egypt. This study presents a comprehensive evaluation of natural radionuclide occurrence in 85 groundwater wells across the eastern floodplain of Luxor, integrating: (1) gamma spectrometric analysis of 226Ra, 232Th, and 40K; (2) hydrochemical characterization of major ions and trace elements; (3) geostatistical and GIS-based spatial modeling of contamination patterns; and (4) radiological risk assessment for different age groups (infants, children, adults). The primary objectives are to: (i) determine radionuclide concentrations and their spatial distribution, (ii) identify geochemical controls on radionuclide mobilization, and (iii) assess health risks in accordance with international guidelines. The findings provide essential baseline data for sustainable groundwater management in arid regions and offer a transferable methodological framework for similar hydrogeochemical assessments globally.

2. Experimental Procedures

2.1. Description of the Study Area

The study was conducted in the eastern floodplain of Luxor Governorate, located in Upper Egypt approximately 721 km south of Cairo. The region lies along the eastern bank of the River Nile, within a latitudinal range of 25°49′ to 25°20′ N and a longitudinal extent of 32°47′ to 32°38′ E, encompassing a representative segment of the cultivated and reclaimed alluvial plains (Figure 1).
The topography of the area is characterized by a gentle slope toward the north and northwest, with elevations decreasing from the desert margins toward the river valley, reflecting the regional geomorphological evolution driven by fluvial processes. The landscape is bounded by elevated structural plateaus composed of Eocene limestone, underlain by Paleocene shale, which form the geological boundaries of the Nile Valley in this sector. Geologically, the area is underlain by a sequence of sedimentary formations spanning the Upper Cretaceous, Tertiary, and Quaternary periods [26]. The surface and near-surface geology are dominated by Pliocene to Holocene alluvial deposits that unconformably overlie marine sediments of Late Cretaceous to Early Eocene age. These Quaternary deposits are genetically linked to successive phases of the ancestral Nile River system, including the Eonile, Paleonile, Protonile, Prenile, and Neonile, and are differentiated into two main geomorphological units: a younger, intensively cultivated plain in the central part of the valley covered by Holocene silt and clay, and an older, partially reclaimed plain at the margins composed of Pleistocene sand and gravel terraces. Of particular geochemical significance are the Upper Cretaceous marine phosphate-rich formations, which are known to contain elevated concentrations of uranium due to the affinity of phosphate minerals for uranium incorporation during diagenesis [27]. These deep geological units are considered a potential geogenic source of radionuclides that may contribute to the long-term enrichment of uranium decay products in the overlying aquifers. The hydrogeological system comprises three principal aquifers, arranged stratigraphically from base to top: the Upper Cretaceous Nubian Sandstone Aquifer, the Eocene Fissured Limestone Aquifer, and the Quaternary Alluvial Aquifer, which is the primary focus of this investigation. The Quaternary aquifer consists of unconsolidated to semi-consolidated deposits of graded sand and gravel with intercalated clay lenses, deposited during the Pleistocene and Holocene epochs. Its thickness shows considerable spatial variability, ranging from approximately 95 m in the central valley to <5 m near the eastern margins. The aquifer is semi-confined in proximity to the Nile River by a low-permeability silty clay layer of Holocene age, averaging 13 m in thickness, which gradually thins and disappears toward the desert fringes, resulting in a transition to unconfined conditions in the distal parts of the floodplain. Groundwater levels exhibit a marked spatial gradient, with depths to water ranging from about 5 m below ground surface in the western sector to nearly 30 m or more in the eastern floodplain. This variation corresponds to a decrease in hydraulic head from the desert margins toward the river, indicating a regional groundwater flow direction oriented towards the northwest, with the Nile acting as the primary discharge zone (Figure 1). The combination of prolonged water–rock interaction, variable redox conditions associated with changes in aquifer confinement, and the presence of uranium-enriched source rocks creates a favorable environment for the mobilization of naturally occurring radionuclides, particularly 226Ra and 232Th. Given the reliance of local communities on groundwater for domestic and agricultural purposes, understanding the spatial distribution and controlling factors of radionuclide occurrence is essential for assessing public health risks and ensuring sustainable water resource management [26,28,29,30,31]. For a schematic representation of the stratigraphic sequence and the vertical relationship between the deep uranium-bearing formations and the overlying Quaternary aquifer, see the geological cross-section in Figure 2.

2.2. Field Sampling

A total of 85 groundwater samples were collected from production wells distributed across the eastern floodplain of Luxor Governorate, Upper Egypt (Figure 1a). The sampling network was designed to capture spatial variability in hydrogeological conditions, with deliberate selection based on aquifer depth, proximity to the Nile River, and prevailing land use patterns. All sampled wells are part of the Quaternary alluvial aquifer system, which serves as the primary source of groundwater for domestic and agricultural use in the region. The selection process was guided by a combination of geographical coverage, accessibility, and existing well inventory data obtained from the Egyptian Ministry of Water Resources and Irrigation, ensuring that the sampling sites spanned both central and peripheral zones of the floodplain [32,33]. Well depths ranged from 59 m to 117 m, with an average depth of 83.4 m and a standard deviation of 11.6 m (Table S1 in the Supplementary Materials). This wide range in depth allowed for the evaluation of vertical heterogeneity in groundwater chemistry and radionuclide concentrations, particularly in relation to redox conditions and residence time. Deeper wells (≥90 m) were predominantly located in the central and western parts of the study area, where the aquifer is thicker and more confined, while shallower wells (<80 m) were concentrated in the eastern margins, corresponding to areas of unconfined conditions and higher recharge rates. This distribution reflects the regional hydraulic gradient, with groundwater flow directed northwestward toward the Nile River, which acts as the primary discharge zone. These sampling locations, as shown in Figure 1b, were selected to capture variations in groundwater quality across different hydrochemical environments. Specific attention was paid to areas with known or suspected elevated natural radioactivity, based on previous studies indicating the presence of uranium-rich phosphate-bearing sediments in the underlying Upper Cretaceous formations. Additionally, wells were chosen to ensure adequate spatial density for geostatistical analysis, with a minimum inter-well distance of approximately 1 km to avoid spatial autocorrelation. Precise geographic coordinates (latitude and longitude) of each sampling site were recorded using a handheld GPS device (Garmin eTrex @ 20× sourced from Garmin Ltd., Olathe, KS, USA, and all sampling events were conducted during the dry season months (February–April) to minimize seasonal fluctuations in water levels and chemical composition. Prior to sampling, each well was purged for at least 20 min using a stainless-steel-bailer to remove stagnant water from the casing and ensure representative sampling of the aquifer [8]. Groundwater samples were collected into pre-cleaned 1.4-L Marinelli beakers, which had been rinsed with diluted hydrochloric acid and deionized water to prevent cross-contamination [34]. Containers were filled completely to exclude atmospheric air, thereby minimizing radon loss during transport. Each sample was immediately sealed, labeled with its unique identifier, GPS coordinates, collection date, and well depth, and transported under refrigerated conditions (4 °C) to the analytical laboratory within 24 h. To validate the field data, depth information was cross-checked against official records [32] and verified through direct measurement during sampling. Depth data were used in subsequent analyses to assess potential correlations between well depth and key parameters such as redox-sensitive ions (e.g., Fe2+, SO42−), dissolved oxygen, and 226Ra activity, which are known to be influenced by prolonged water–rock interaction and reducing conditions often found at greater depths. This systematic approach to well selection and field sampling ensured comprehensive spatial and hydrogeological representation, enabling robust interpretation of radionuclide distribution and geochemical controls in the Quaternary alluvial aquifer.

2.3. Laboratory Analyses

2.3.1. Radiometric Analysis

Radiometric analysis of naturally occurring radionuclides was performed using a gamma spectrometry system equipped with a low-background NaI(Tl) scintillation detector (ORTEC 5510 Norland model S-1212-I), featuring a 3 in × 3 in crystal coupled to a 1024-channel multichannel analyzer, all sourced from ORTEC, Waltham, MA, USA. The detector was operated at a bias voltage of 805 V and housed within a 50 cm thick graded lead shield to minimize external background radiation interference. The system demonstrated a peak efficiency of 2.3 × 10⁻² at 1332 keV and an energy resolution of 7.5% at the 662 keV photopeak of 137Cs, ensuring high sensitivity for low-activity measurements [35]. Prior to sample analysis, comprehensive energy and efficiency calibrations were conducted weekly using certified reference materials: International Atomic Energy Agency (IAEA)-385 (marine sediment) and IAEA-434 (water standard), along with a multi-radionuclide solution (QCY48) containing ten radionuclides spanning an energy range of 60–2614 keV. This rigorous calibration protocol ensured accurate quantification across the full energy spectrum [36]. Each sample, collected in pre-cleaned 1.4-L Marinelli beakers, was counted for a minimum of 24 h in face-to-face geometry with the detector to achieve sufficient counting statistics. Background radiation was measured weekly under identical conditions and subtracted from all sample spectra to correct for instrumental and environmental contributions. Activity concentrations (A, in Bq/L) were calculated using the standard equation [8,35,37,38]:
A = ( N T n t ) ( ε × P γ × V )
where N is the net counts in the photopeak, T is the sample counting time (s), n is the background counts, t is the background counting time (s), ε is the detector efficiency at the specific energy, Pγ is the gamma emission probability per disintegration, and V is the sample volume (L). The activity of 226Ra was determined from the gamma emissions of its short-lived progeny, assuming secular equilibrium: 351.9 keV (214Pb), 609.3 keV, and 1120 keV (214Bi). 232Th activity was derived from the 238.6 keV line (212Pb) and 911.2 keV peak (228Ac). 40K was quantified directly via its characteristic 1460.8 keV gamma-ray emission [35,39,40,41]. Minimum detectable activities (MDA) were calculated according to Currie (1968) [42], with detection limits ranging from 0.05 to 0.12 Bq/L depending on the radionuclide and counting duration. Combined standard uncertainties, propagated through all measurement parameters (efficiency, emission probability, counting time), were maintained below 15% at a 95% confidence level (k = 2). All analytical procedures adhered to ISO 5667-3 standards [43], and method accuracy was verified through regular analysis of certified reference materials (IAEA-434, NIST SRM 1640a) [44]. It should be noted that the gamma spectrometry system employed in this study, while highly sensitive for 226Ra, 232Th, and 40K, is not optimized for direct detection of uranium isotopes (238U and 234U) due to their low gamma emission probabilities and energies. Consequently, uranium concentrations were not quantified in this work. However, the presence of elevated 226Ra in certain zones suggests potential uranium enrichment in the source rocks, consistent with previous regional studies [45,46,47,48].

2.3.2. Hydrochemical Analysis

Hydrochemical characterization was conducted to assess the physicochemical controls on radionuclide mobility and to provide context for radiological findings. Field measurements were performed at the time of sampling using calibrated portable instruments. pH and electrical conductivity (EC) were determined with a Hach HQ40d multi-parameter meter (Loveland, CO, USA), while temperature and total dissolved solids (TDS) were measured using a Jenway 4520 conductivity meter sourced from Jenway (Cole-Parmer), Staffordshire, UK. In the laboratory, major cations (Na+, K+) were quantified using flame atomic absorption spectrometry PerkinElmer SpectrAA-55 (Waltham, MA, USA), with detection limits ranging from 0.01–0.1 mg/L. Anions, including chloride (Cl), nitrate (NO3), sulfate (SO42−), and phosphate (PO43−), were analyzed using titration and spectrophotometric methods with a Hach DR/2400 spectrophotometer (Loveland, CO, USA). Trace elements such as iron (Fe2+) and aluminum (Al3+) were determined by inductively coupled plasma optical emission spectrometry (ICP-OES) after filtration through 0.45-μm membrane filters to separate dissolved species. This method achieved detection limits below 1 μg/L, ensuring high sensitivity for redox-sensitive elements. To ensure data reliability, stringent quality assurance/quality control (QA/QC) protocols were implemented throughout the analytical process. These included analysis of duplicates (10% of the total samples), procedural blanks (one per 10 samples), and certified reference materials (NIST SRM 1640a, IAEA-434) in each analytical batch. Relative standard deviations for replicate analyses were consistently below 5%, confirming high analytical precision. All procedures followed ISO/IEC 17025 [44] and APHA guidelines [49], ensuring compliance with international standards for water quality assessment.

2.4. Data Processing and Statistical Analysis

2.4.1. Statistical and Multivariate Analysis

To elucidate the relationships between radionuclide concentrations and hydrochemical parameters, a comprehensive statistical analysis was conducted using XLSTAT tool version 2024 (Addinsoft, Paris, France). The dataset, comprising activity concentrations of 226Ra, 232Th, and 40K, alongside physicochemical variables (pH, EC, TDS, major ions, and trace elements), was first assessed for suitability for multivariate analysis. The Kaiser-Meyer-Olkin (KMO) measure of sampling adequacy yielded a value of 0.78, exceeding the recommended threshold of 0.6, and Bartlett’s test of sphericity was statistically significant (p < 0.001), confirming the presence of sufficient correlations among variables for principal component analysis (PCA). PCA was performed to reduce data dimensionality and identify underlying geochemical processes controlling radionuclide mobility. Varimax rotation was applied to enhance interpretability, and PCA were retained based on eigenvalues > 1 and scree plot inspection. The analysis enabled the identification of factor loadings and clustering patterns, highlighting associations between radionuclides (particularly 226Ra) and redox-sensitive parameters (e.g., Fe2+, SO42−), ionic strength (TDS, Cl), and aquifer confinement indicators. In addition, Pearson correlation coefficients were calculated to assess bivariate relationships between variables, with statistical significance evaluated at p < 0.05 and p < 0.01. These correlations provided insight into potential mechanisms of radionuclide release, such as ion exchange (e.g., Ra2+/Ca2+ or Ra2+/Ba2+ competition) and solubility controls under varying redox and salinity conditions. All statistical procedures were based on log-transformed data (natural logarithm) to meet assumptions of normality and homoscedasticity, and outliers were examined using boxplots to ensure robustness of the results.

2.4.2. Geospatial Modeling

To visualize the spatial distribution of radionuclides and identify contamination hotspots, geospatial analysis was performed using ArcGIS version 10.8 (ESRI, Redlands, CA, USA). The GPS coordinates of the 85 sampling sites were imported and projected in a consistent coordinate system [WGS 1984/UTM zone 36N (EPSG:32636)] to ensure accurate spatial representation. Inverse Distance Weighting (IDW) interpolation was applied to generate continuous surface maps of 226Ra, 232Th, and 40K activity concentrations. IDW was selected due to its simplicity and effectiveness in representing local variability, particularly in datasets with uniform spatial coverage and its widespread use in environmental mapping. The power parameter was set to 2, and the search radius was optimized to balance smoothing and detail preservation. This technique enabled the detection of localized anomalies that may pose elevated radiological risks to local populations. The resulting maps were overlaid with key hydrogeological features, including the regional groundwater flow direction (northwestward toward the Nile River) and the transition zone between semi-confined and unconfined conditions, to assess the influence of aquifer dynamics on radionuclide distribution. These geospatial tools provided a robust framework for linking radiological data with environmental drivers, supporting both scientific interpretation and water resource management decisions.

3. Results

3.1. Descriptive Statistics of Measured Parameters

Descriptive statistics for all measured parameters are summarized in Table 1. Full datasets are available in the Supplementary Material with this research (Table S1).
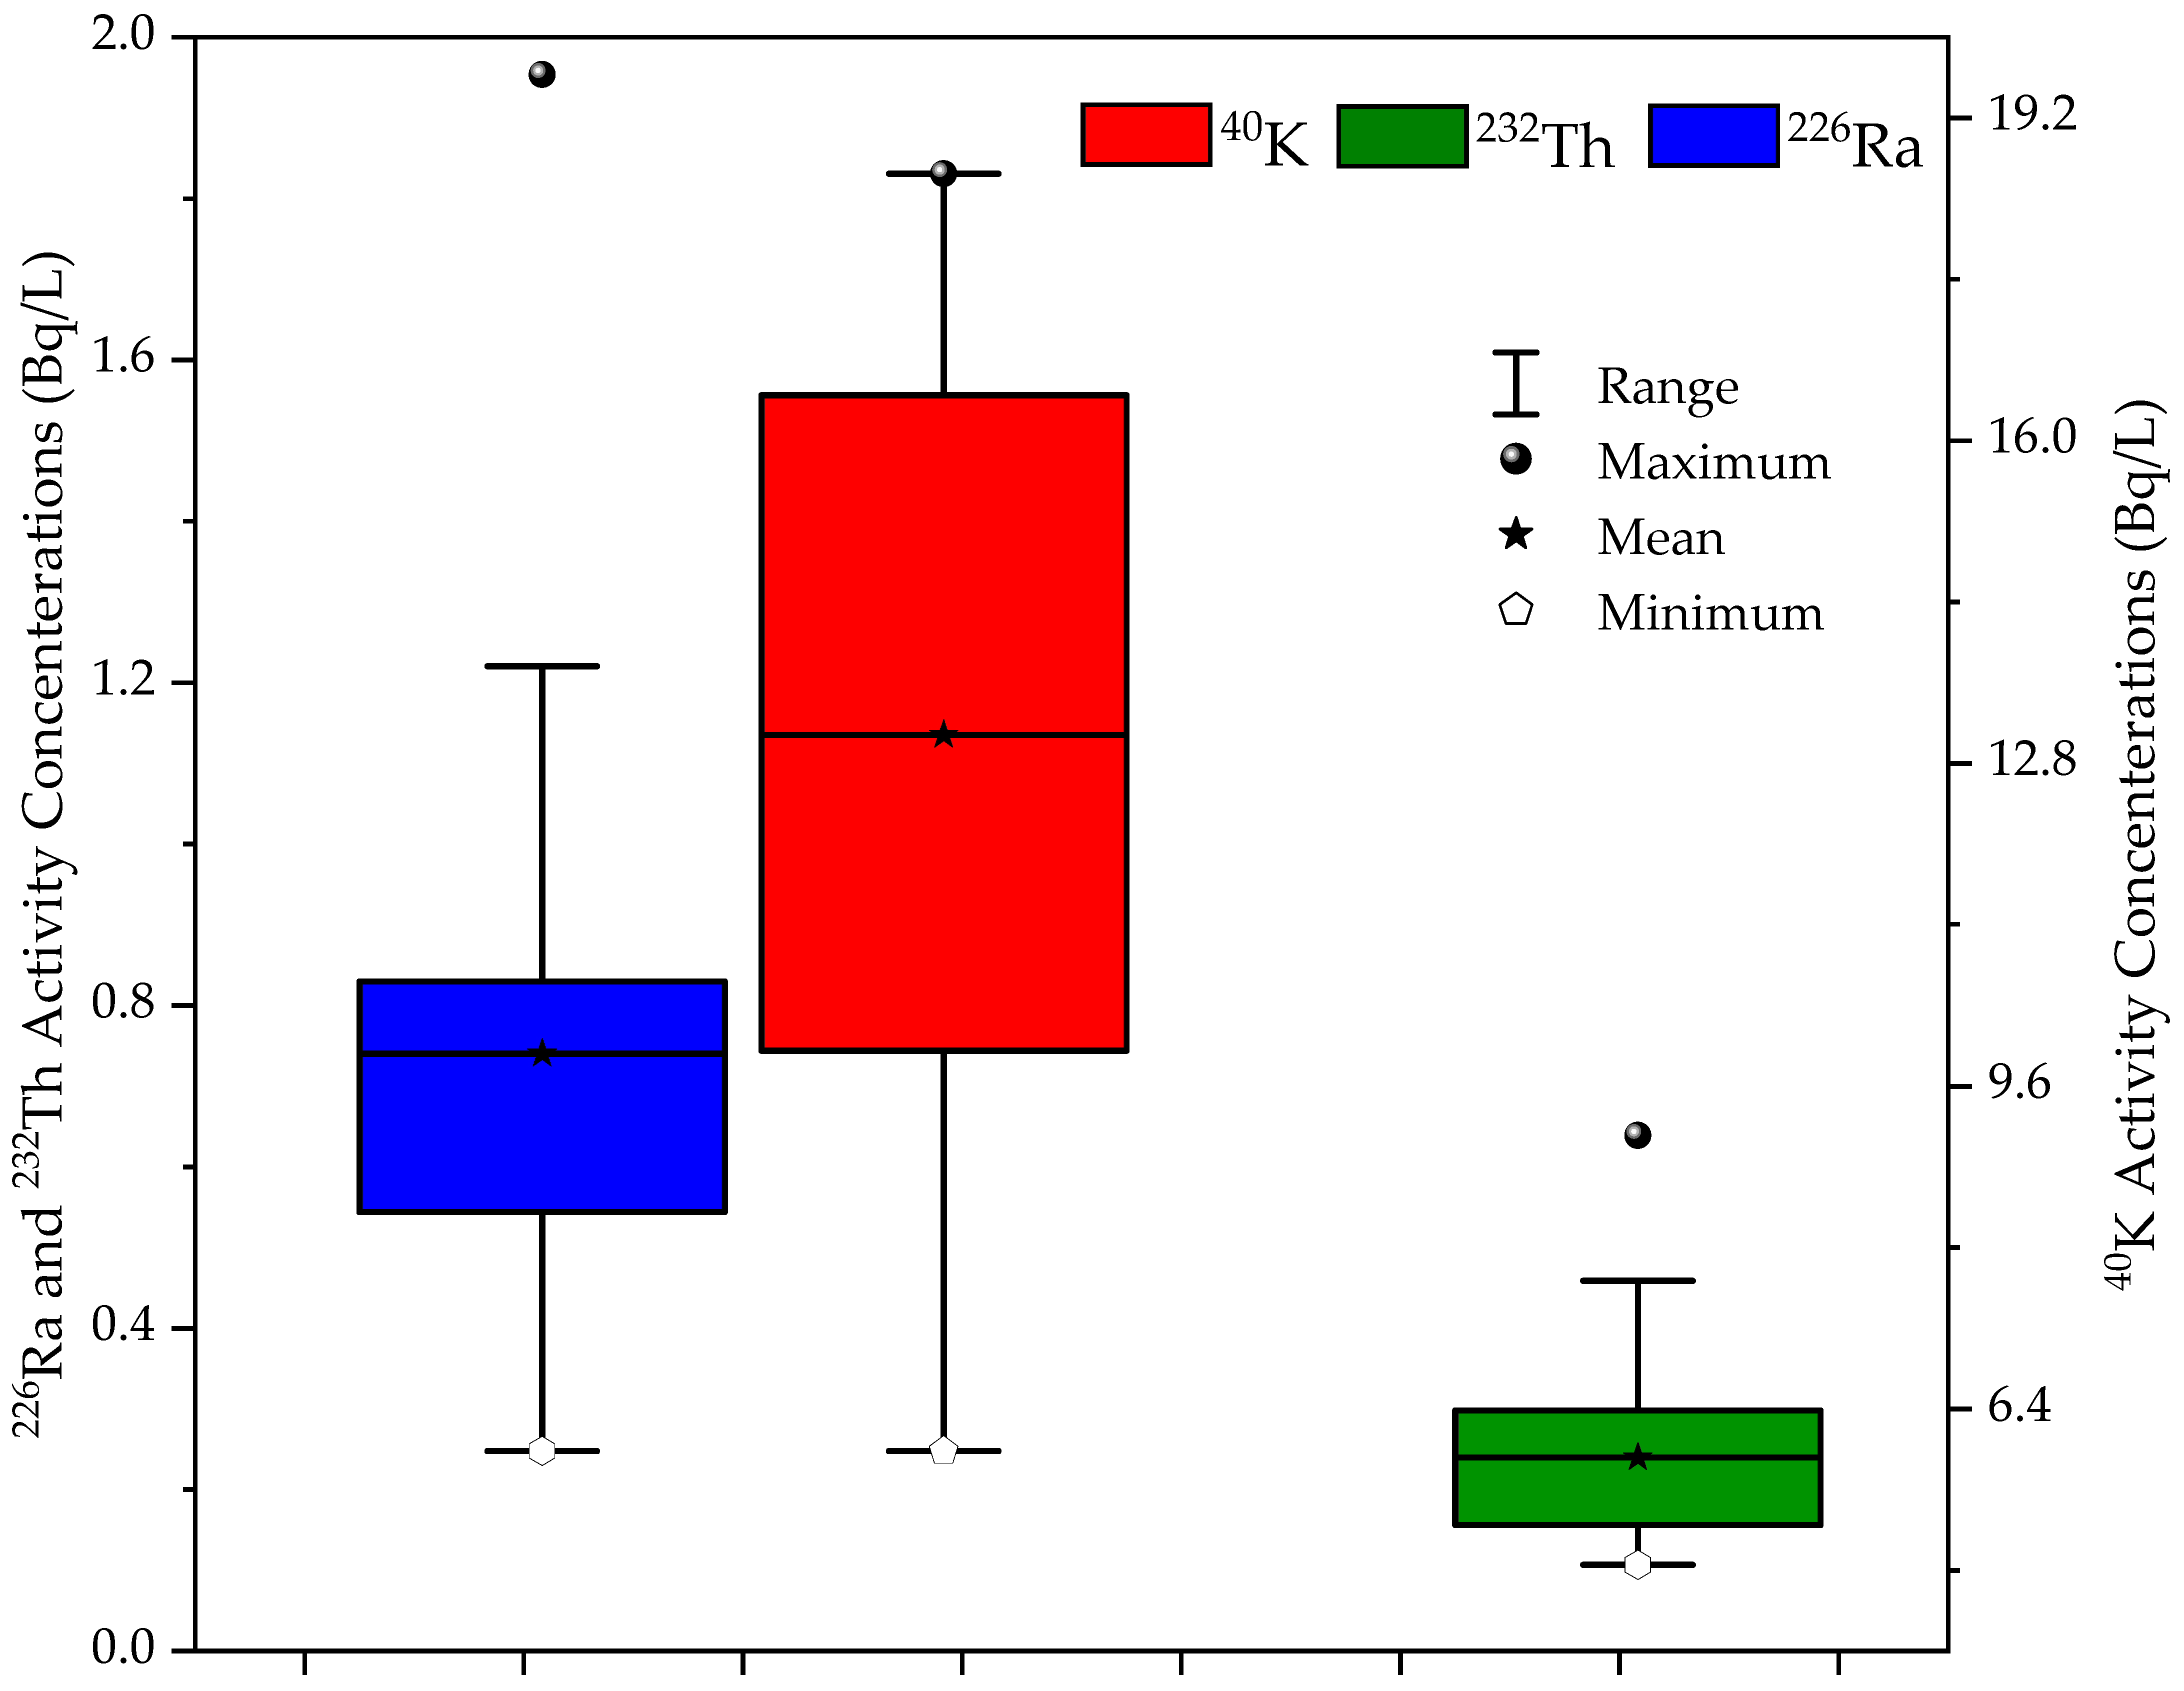
The following sections detail the spatial and statistical characteristics of key parameters, highlighting patterns of variability and potential controlling factors. The radiometric and hydrochemical parameters obtained from 85 groundwater wells in Luxor Governorate underwent comprehensive statistical analysis to assess spatial distribution patterns and geochemical variability [27]. The activity concentrations of naturally occurring radionuclides exhibited distinct spatial patterns, reflecting the influence of regional geology and aquifer heterogeneity. 226Ra concentrations showed moderate spatial variability, with values ranging over an order of magnitude across the study area. These values further show that approximately 30% of sampled wells exceeded the WHO guidance level of 1 Bq/L for 226Ra, highlighting localized radiological concerns within specific zones of the study area [20]. 232Th concentrations showed low spatial variability and did not pose a radiological concern, as all values were well below regulatory thresholds. These findings suggest minimal radiological risk associated with 232Th in the study area. Potassium-40 (40K) displayed relatively higher activity concentrations, with moderate spatial variability (CV = 27.1%). The moderate dispersion of 40K aligns with its strong correlation to local lithology, particularly potassium-rich minerals such as feldspars, indicating a primarily geogenic origin with limited influence from anthropogenic sources. Figure 3 shows box plots of 226Ra, 232Th, and 40K activity concentrations, highlighting differences in dispersion and the presence of outliers. This visualization highlights the spatial variability and dispersion characteristics of each radionuclide, with 226Ra showed moderate spread (CV = 42.05%), while 232Th showed similar dispersion (CV = 42.08%), reflecting spatial heterogeneity rather than geochemical stability, and 40K displaying stable geochemical behavior across the study area.
Physical water properties indicated slightly alkaline conditions across most sites, reflecting stable geochemical conditions throughout the aquifer system. The low coefficient of variation further supports minimal spatial variability in pH, suggesting uniform buffering capacity and limited influence from external contamination sources. EC showed considerable spatial variability, reflecting substantial heterogeneity in aquifer mineralization across the study area. TDS exhibited a distribution pattern similar to EC, indicating moderate to high salinity levels primarily attributed to natural geochemical processes such as evaporite dissolution, with potential anthropogenic contributions in certain zones. EC was omitted from multivariate analysis to avoid multicollinearity with TDS, as their correlation exceeded 0.95. The spatial variability of Physicochemical properties (pH and TDS) is illustrated in Figure 4, highlighting the influence of mineralization and aquifer heterogeneity on groundwater composition.
Total hardness displayed marked variability, highlighting its strong dependence on carbonate mineral dissolution and variations in aquifer lithology. Alkalinity values exhibited considerable variability. This dispersion supports the presence of carbonate-rich minerals such as calcite and dolomite, alongside contributions from evaporite dissolution processes. Hydrochemical characteristics, including total hardness and alkalinity, are presented in Figure 5 to demonstrate the role of carbonate mineral dissolution in shaping water chemistry.
Chemical analyses revealed notable spatial variability in the distribution of major ions and trace elements across the study area. High spatial variability in Na+ (CV = 69.7%) suggests significant ion exchange processes, particularly Na+/Ca2+ exchange in clay-rich zones. Cl displayed high spatial variability, consistent with localized contamination sources or evaporite dissolution processes. SO42− concentrations varied considerably, intricately linked to sulfate-rich geological formations and secondary mineral dissolution. NO3 concentrations suggest potential influence from agricultural activities in shallow aquifers (Table 1). PO43− concentrations remained relatively low, indicating limited mobilization and minimal anthropogenic contributions. The distribution of major cations and anions is shown in Figure 6, reflecting the influence of evaporite dissolution, ion exchange, and anthropogenic inputs on groundwater composition.
Trace element behavior showed distinct patterns. Fe2+ exhibited low concentrations, consistent with oxidizing conditions where ferrous iron oxidizes to insoluble Fe3+, while Al3+ showed moderate levels, primarily associated with clay minerals and silicate weathering. Elevated Al3+ levels in specific wells point to localized leaching from aluminosilicate minerals under slightly acidic conditions. NO2 concentrations were generally low but exhibited high variability (CV = 300%), consistent with transient redox fluctuations or episodic contamination. These descriptive statistics provide a foundation for subsequent multivariate and geospatial analyses, highlighting significant spatial heterogeneity in radionuclide and geochemical composition across the study area. Trace element concentrations, particularly Fe2+ and Al3+, are displayed in Figure 7, indicating localized weathering of silicate and aluminosilicate minerals under variable redox conditions. Well depths ranged from 59 to 117 m, with deeper wells (>90 m) predominantly located in the central and western parts of the floodplain, while shallower wells (<80 m) were concentrated in the eastern margins. The depth distribution is further examined in Section 3.2 in relation to key hydrochemical and radiological parameters.

3.2. Depth-Dependent Variation of Key Radionuclides and Hydrochemical Parameters

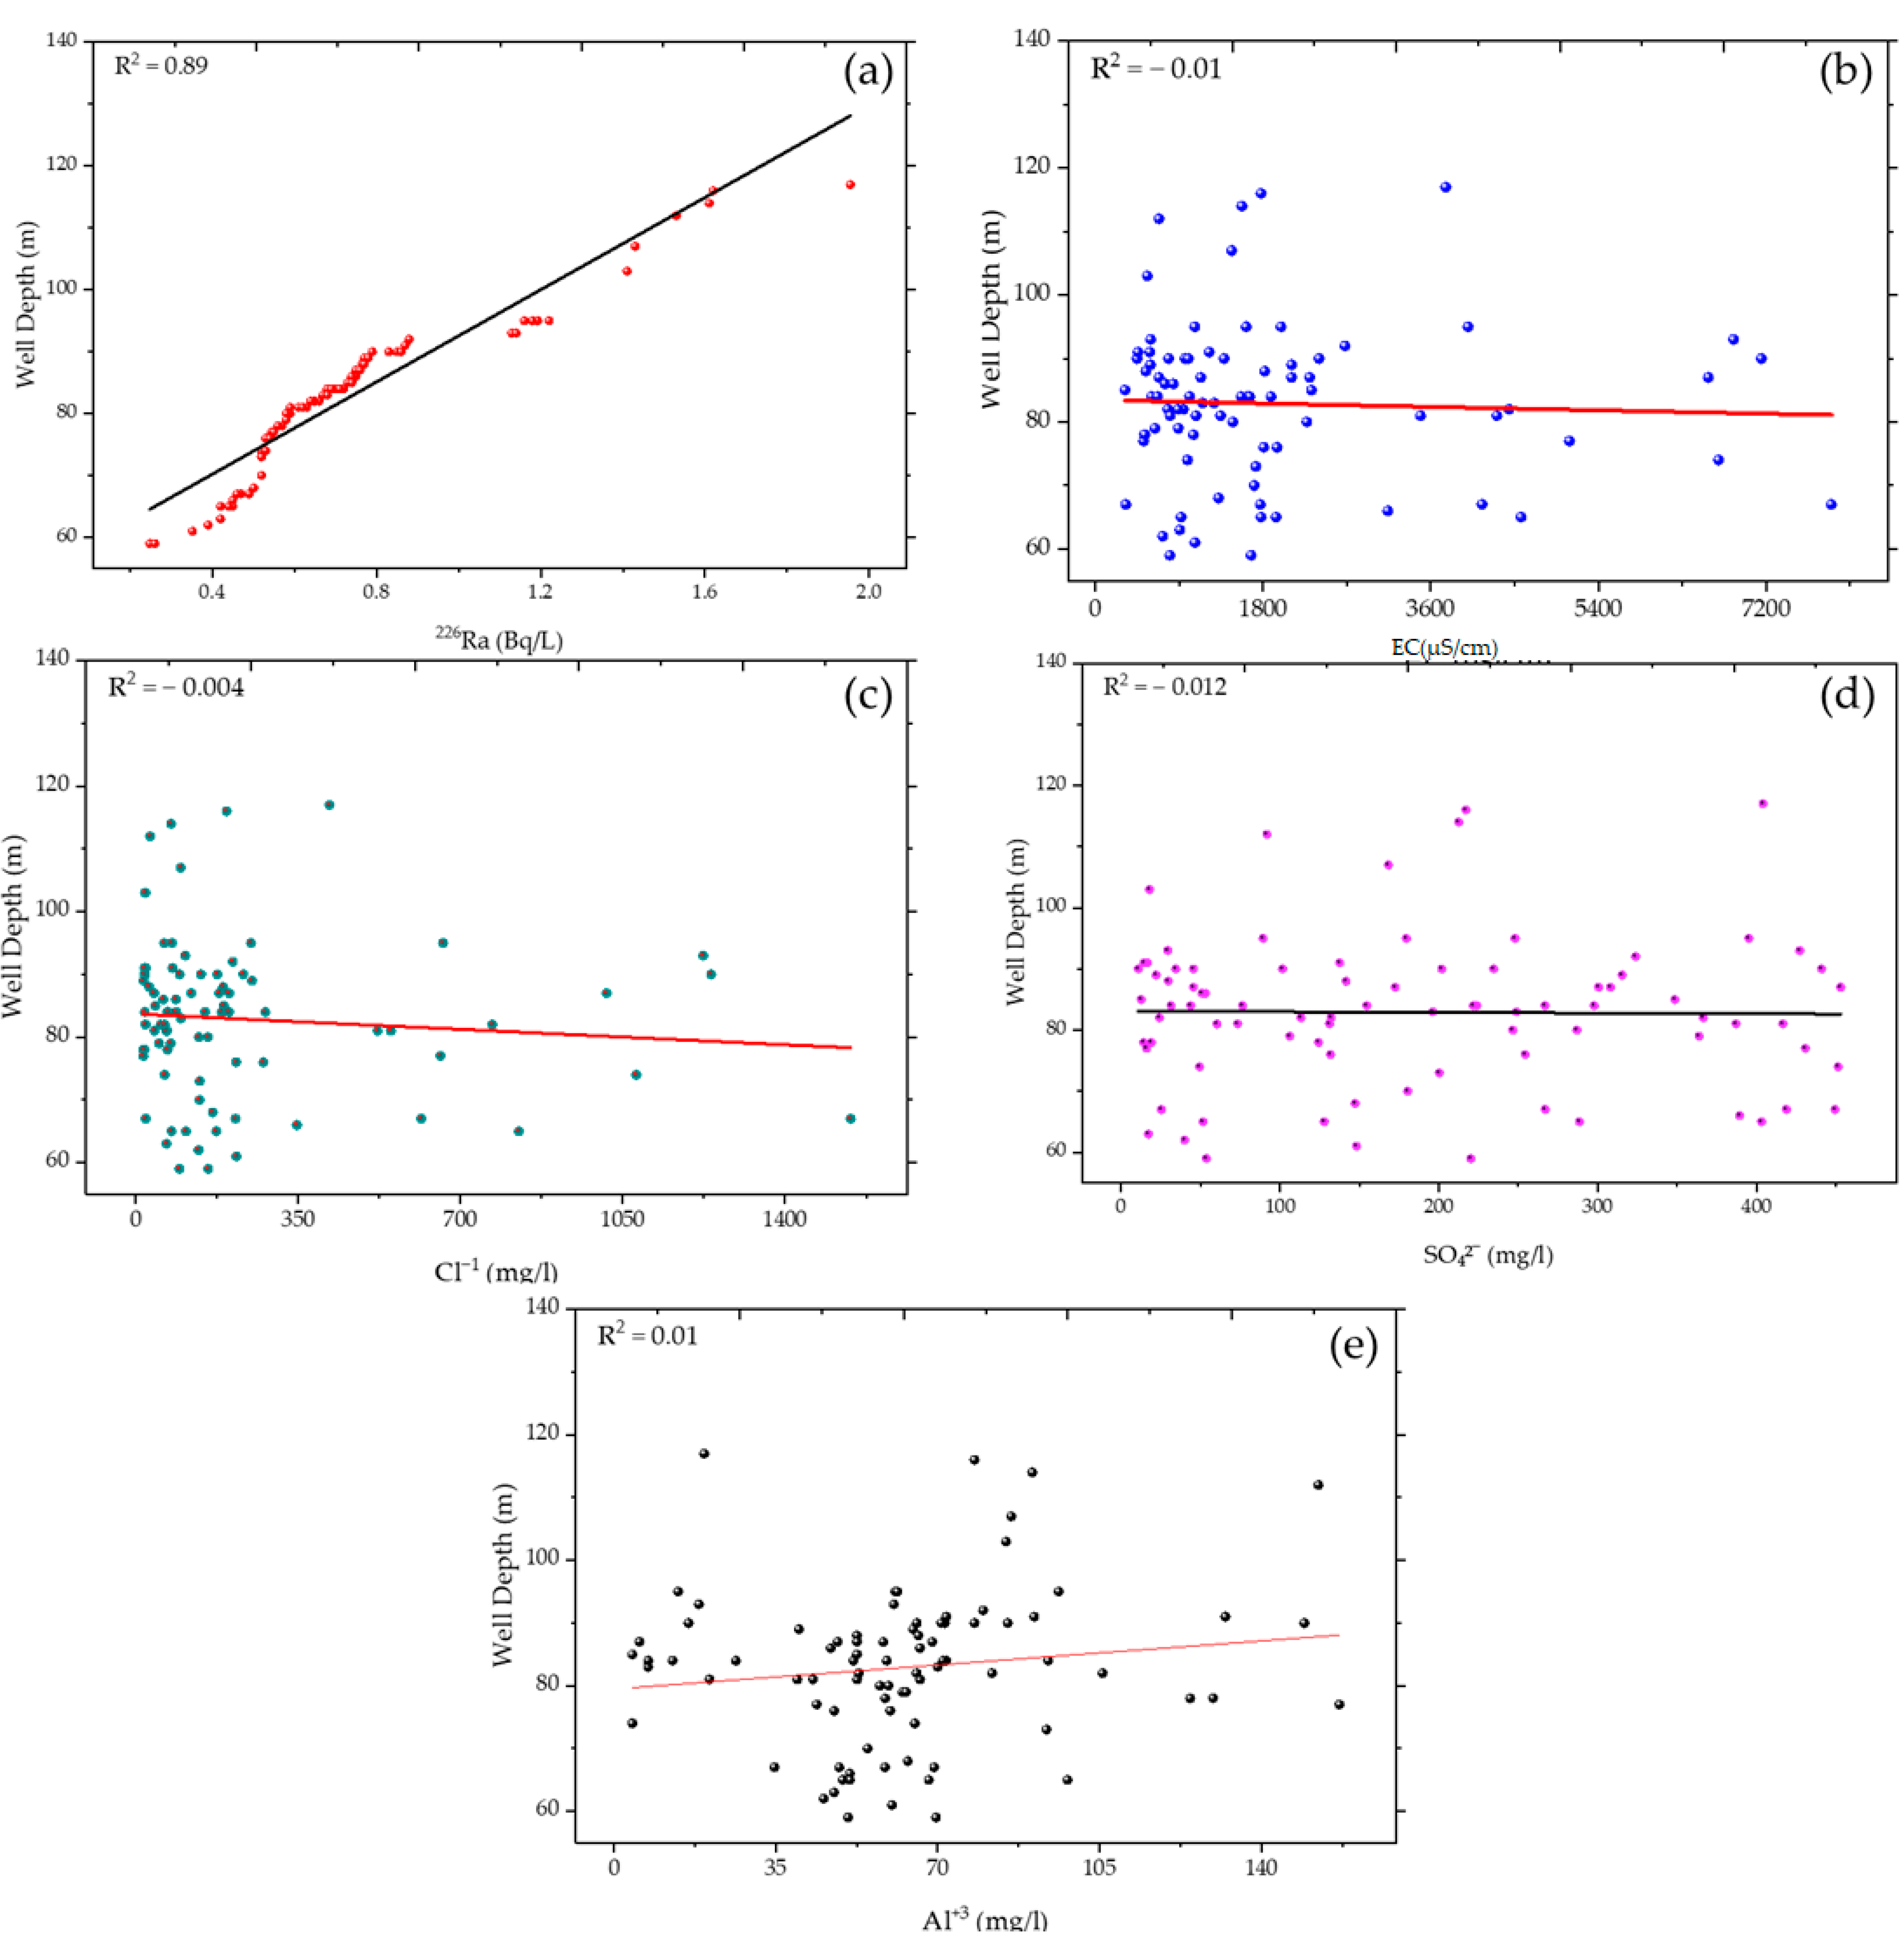
To investigate vertical controls on groundwater composition and radionuclide mobilization, depth profiles of selected parameters were examined across the 85 sampled wells. The well depths, ranging from 59 to 117 m with a mean of 83.4 m, are detailed in Table S1 of the Supplementary Material. Five key parameters—226Ra, electrical conductivity (EC), chloride (Cl), sulfate (SO42−), and aluminum (Al3+)—were selected based on their geochemical relevance: (i) 226Ra due to its radiological significance and observed correlation with depth in statistical analyses, (ii) EC, Cl, and SO42− as indicators of salinization and evaporite dissolution, and (iii) Al3+ as a proxy for clay mineral weathering and redox-sensitive processes under oxidizing conditions. Figure 8 illustrates the variation of these parameters with well depth (Y-axis) and concentration (X-axis), including linear regression fits to assess depth-dependent trends. A strong positive relationship was observed between 226Ra and depth, with an adjusted R2 of 0.89, confirming a systematic increase in 226Ra concentration with depth. This trend is consistent with enhanced mobilization under prolonged water–rock interaction, reducing conditions, and ion exchange processes prevalent in deeper, more confined zones of the Quaternary alluvial aquifer. The high correlation supports the role of aquifer stratification and residence time in controlling 226Ra distribution. In contrast, EC, Cl, and SO42− exhibited no significant depth dependence, with adjusted R2 values of −0.01, −0.004, and −0.012, respectively. This suggests that while salinity is a key factor in 226Ra mobilization, it is not uniformly correlated with depth across the aquifer. Instead, salinization appears to be influenced by localized processes such as evaporite dissolution and lateral groundwater flow, rather than a consistent vertical gradient. Similarly, Al3+ showed negligible correlation with depth (adjusted R2 = 0.01), indicating that its release is governed more by mineralogical composition and local redox conditions than by vertical hydrogeological zonation. This behavior aligns with the known immobility of Al3+ under alkaline, oxidizing conditions, where it tends to precipitate or adsorb onto mineral surfaces. These findings highlight that while 226Ra mobilization is strongly depth-dependent, other hydrochemical parameters reflect more complex, spatially variable processes. The observed decoupling between salinity indicators and depth underscores the heterogeneity of the aquifer system and the need for integrated spatial and depth-based assessments in groundwater quality monitoring.

3.3. Spatial Distribution of Radionuclide Activity Concentrations

Figure 9, Figure 10 and Figure 11 illustrate the spatial distribution patterns of 226Ra, 232Th, and 40K activity concentrations, respectively, across the study area, derived using inverse distance weighting (IDW) interpolation in ArcGIS version 10.8. Sampling locations are marked as black circles to distinguish measured values from interpolated areas. This mapping approach was employed to identify zones with elevated radionuclide levels and evaluate regional heterogeneity in groundwater radiochemistry. Elevated 226Ra concentrations (>1 Bq/L) were observed in multiple wells within the eastern and central zones of Luxor Governorate, primarily in areas characterized by high sulfate content and salinity exceeding 5000 µS/cm. These samples were predominantly drawn from deeper sections of the Quaternary alluvial aquifer (depths > 90 m), where prolonged groundwater residence time, combined with reducing conditions and evaporite dissolution, enhances 226Ra mobilization. The strong correlation between 226Ra and TDS/SO42− suggests that ion exchange processes—particularly the displacement of Ra2+ from aquifer matrices by competing cations under saline conditions—are a key control on its mobilization. Furthermore, the northwestward regional groundwater flow, terminating at the Nile River discharge zone, promotes the accumulation of dissolved 226Ra in these areas, consistent with findings from regional discharge systems where long-residence waters exhibit elevated natural radionuclide levels [15,16,17,50]. These observations indicate that the spatial distribution of 226Ra is governed not only by lithological factors but also by hydrogeochemical and hydrodynamic processes, including depth-dependent redox conditions and flow path evolution. These findings suggest increased 226Ra mobility under saline conditions, potentially facilitated by ion exchange mechanisms linked to evaporite mineral dissolution. 232Th displayed relatively homogeneous spatial distribution, with marginally elevated concentrations observed in areas underlain by clay-rich geological units. This pattern supports its association with immobile phases, as Th4+ adsorbs strongly onto clay and aluminosilicate surfaces primarily influenced by weathering processes under oxidizing aquifer conditions. In contrast, 40K exhibited a consistent spatial distribution closely correlated with feldspar-rich bedrock and alluvial sedimentary layers, suggesting negligible anthropogenic impact and strong lithological control over its occurrence. An overlay analysis integrating radionuclide distribution with hydrochemical data revealed that elevated 226Ra concentrations frequently co-occur with high Cl, Na+, and TDS levels, further substantiating the influence of salinization on 226Ramobilization in this region. Conversely, no significant correlation was found between 40K and salinity indicators (EC, TDS), consistent with their lithological control rather than solubility-driven mobilization, implying distinct geochemical controls governing its distribution compared to other radionuclides. These spatial observations corroborate the earlier statistical findings from descriptive and correlation analyses, aiding in the differentiation between naturally occurring geochemical signatures and potential localized anomalies. A more detailed interpretation of these spatial patterns will be provided in the subsequent section, incorporating geological framework and aquifer-specific characteristics. The identification of high-radionuclide zones in this analysis will be further interpreted in relation to health and environmental implications in the following Section 4.

3.4. Inter-Variable Correlations in Groundwater Chemistry

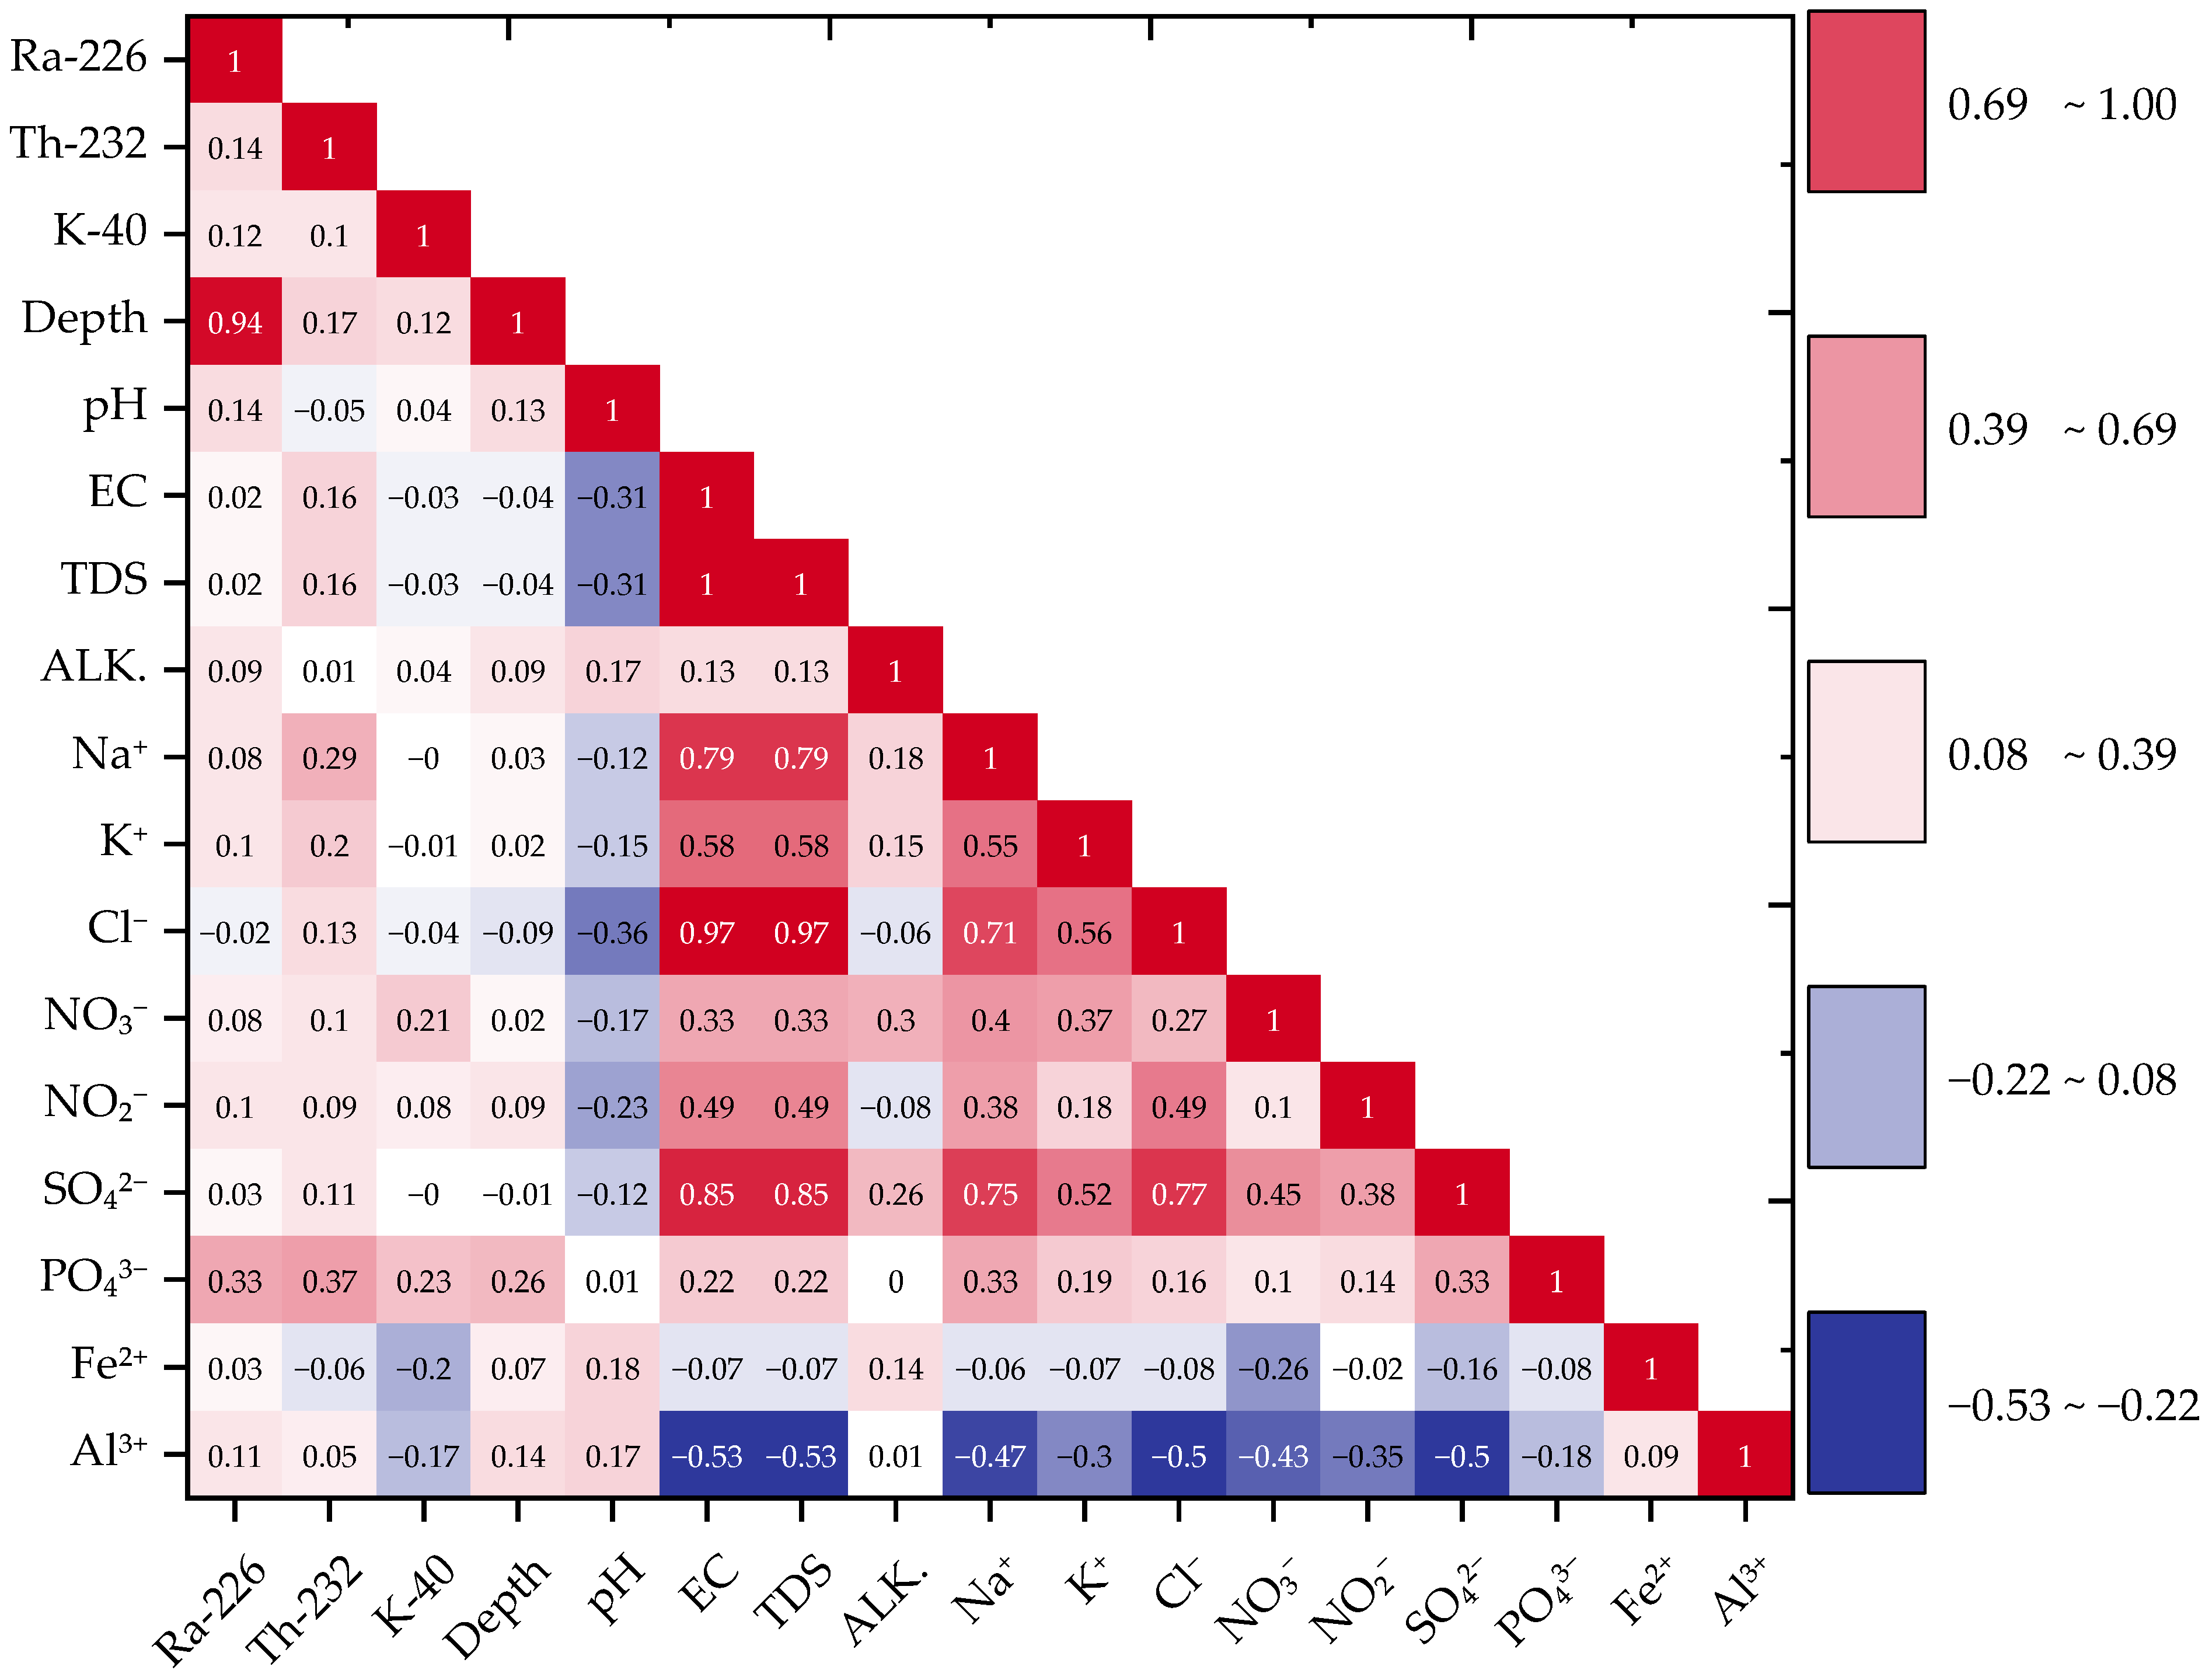
A Pearson correlation analysis was conducted to identify key geochemical and hydrological controls on radionuclide distribution in the Quaternary alluvial aquifer. This statistical approach offers insights into geochemical controls on radionuclide mobility, mineralization trends, and potential anthropogenic influences affecting groundwater quality. 226Ra showed a weak correlation with phosphate (PO43−; r = 0.33), possibly reflecting indirect association via co-precipitation with calcium phosphates or carbonate phases. More significantly, it exhibited a strong positive correlation with well depth (r = 0.94), indicating enhanced mobilization in deeper, more confined zones with prolonged water–rock interaction and reducing conditions. The lack of significant correlation with Cl, NO3, or pH suggests minimal anthropogenic influence on 226Ra mobilization, supporting a geogenic origin under reducing, depth-dependent conditions. 232Th showed a low correlation with PO43− (r = 0.37), consistent with its association with immobile phases such as aluminosilicate minerals and clay weathering products, but exhibited weak relationships with major ions, indicating lithological control over its distribution. Its weak correlation with most major ions suggests limited interaction with mobile anions and a lithological rather than hydrochemical control on its distribution. 40K showed a negligible correlation with PO43− (r = 0.23) and a weak negative correlation with Al3+ (r = −0.17), reflecting their contrasting mineral hosts: K+ in feldspars and Al3+ in clay minerals. EC and TDS exhibited a near-perfect linear correlation (r ≈ 1.00) indicating that TDS is an excellent proxy for salinity in this aquifer system. This relationship confirms that both parameters are robust indicators of mineralization processes. Strong associations with SO42− and Cl highlight the influence of evaporite dissolution and ion exchange on groundwater salinity. Al3+ exhibited a moderate negative correlation with EC and TDS (r = −0.53), likely due to adsorption onto clay surfaces or precipitation as hydroxides under alkaline, saline conditions. This behavior aligns with known geochemical properties of Al3+ in oxidizing environments. Moderate to strong correlations among Na+, Cl, SO42−, and TDS suggest a common origin in evaporite dissolution and ion exchange, consistent with natural salinization processes. NO3 showed a moderate correlation with SO42− (r = 0.45), suggesting possible co-occurrence from agricultural sources such as sulfate-containing fertilizers or irrigation return flow, as both ions may originate from fertilizer application and irrigation return flow, but its lack of correlation with radionuclides suggests minimal impact on their mobility. The full correlation matrix and heatmap are provided in Figure 12, illustrating the relationships between radionuclides and hydrochemical parameters across all wells. A summary of selected Pearson correlation coefficients is presented in Table 2, emphasizing key associations, including the strong positive correlation between 226Ra and well depth (r = 0.94), which underscores the role of hydrogeological depth in radionuclide mobilization. The full data set of correlations is available in Table S2 of the Supplementary Material. These correlation patterns provide a foundation for subsequent PCA and geospatial modeling, enabling differentiation between natural geochemical controls and localized anomalies.
While 226Ra shows an exceptionally strong correlation with well depth (r = 0.94), the weak associations between depth and salinity indicators (EC, Cl, SO42−; adjusted R2 ≈ 0) suggest that salinization is not systematically depth-dependent across the aquifer. Instead, the mobilization of 226Ra appears to be driven by a combination of ion exchange in saline zones and progressive reducing conditions with depth, rather than salinity alone.

3.5. Principal Component Analysis

PCA was conducted on standardized hydrochemical and radiological parameters derived from 85 groundwater wells in the study area to identify the dominant geochemical controls and reduce data complexity. The dataset included key variables such as 226Ra, 232Th, 40K, pH, EC, total dissolved solids (TDS), alkalinity (ALK), sodium (Na+), chloride (Cl), sulfate (SO42−), nitrate (NO3), phosphate (PO43−), iron (Fe2+), and aluminum (Al3+). The PCA model extracted four principal components (PCs) with eigenvalues exceeding 1.0, collectively explaining 85.1% of the total variance, indicating an elevated level of data representation and explanatory power. A detailed summary of the PCA, including its eigenvalues and explained variance percentages is provided in the Supplementary Material. These components reflect major natural and anthropogenic processes shaping radionuclide distribution across the study area. The first principal component (PC1) explained 32% of the total variance and exhibited strong positive loadings on salinity indicators (Cl, Na+, EC, TDS), suggesting that ion exchange and evaporite dissolution influence 226Ra mobility. Although 226Ra correlates strongly with depth (r = 0.94, Section 3.2), depth-related processes—such as prolonged residence time and redox evolution—appear to be dominant controls, rather than salinity alone. 226Ra showed moderate association with PC1, consistent with its observed behavior in saline environments and areas affected by evaporite dissolution. The second component (PC2) accounted for an additional 27% of the variance and was primarily defined by sulfate (SO42−), nitrate (NO3), and phosphate (PO43−), suggesting localized anthropogenic inputs, likely from agricultural runoff or septic systems, given the co-occurrence of NO3, PO43−, and SO42−. While these ions do not directly control 232Th or 226Ra concentrations, they may affect secondary processes like redox reactions and mineral dissolution rates. The third component (PC3) contributed 15% of the total variance and was dominated by potassium (K+), aluminum (Al3+), and 232Th, confirming a geogenic origin and lithological control, with 232Th and Al3+ associated with immobile phases such as clay minerals and aluminosilicates under oxidizing conditions. This aligns with earlier correlation and spatial analyses, which indicated minimal influence from salinity and stronger links to aquifer composition. The fourth component (PC4) explained 11% of the variance and highlighted the influence of pH and alkalinity on element speciation and adsorption/desorption processes, particularly for redox-sensitive and amphoteric elements. 40K showed a weak negative loading on PC4, consistent with its stability in feldspar-rich matrices and limited sensitivity to pH-driven processes and limited involvement in salinity-driven transport mechanisms. Together, these results confirm that the spatial distribution of naturally occurring radionuclides in the study area is controlled by a combination of lithological composition, water–rock interaction, redox zonation, and localized anthropogenic inputs. The full PCA output—including eigenvalues, explained variance, and detailed factor loadings—is available in the Supplementary Material accompanying this research (Table S3). Figure 13 presents a screen plot illustrating the cumulative variance explained by each PCA, offering a visual summary of the model’s performance.

3.6. Radiological Health Risk Assessment

The radiological health risks associated with groundwater consumption in the study area were evaluated by estimating the annual effective dose (AFD) and excess cancer risk (CR) based on measured activity concentrations of naturally occurring radionuclides. This assessment follows internationally accepted methodologies to ensure alignment with safety standards recommended by WHO [1], IAEA [51], and the United Nations Scientific Committee on the Effects of Atomic Radiation (UNSCEAR) [52]. The AFD was calculated using the formula [8,35]:
A F D = K × G × A
where K is the dose conversion factor for each radionuclide (Sv/Bq), G represents the annual water consumption rate (L/year), and A denotes the measured radionuclide concentration in Bq/L [35,53]. Age-dependent parameters were applied to reflect variations in water intake and radiation sensitivity among adults (>17 years), children (2–7 years), and infants (<2 years) [54]. Adults are assumed to consume approximately 730 L of water annually, while children and infants consume 350 and 150 L respectively per year [55]. Dose conversion factors for 226Ra were set at 2.8 × 10⁻⁷ Sv/Bq for adults, 6.2 × 10⁻⁷ Sv/Bq for children, and 9.6 × 10⁻⁷ Sv/Bq for infants [56]. For 232Th, these values were 2.3 × 10⁻⁷, 3.5 × 10⁻⁷, and 4.5 × 10⁻⁷ Sv/Bq respectively, while 40K contributes minimally due to its very low dose conversion factor of 6.2 × 10⁻⁹ Sv/Bq for adults and limited mobility through drinking water pathways [57]. Table 3 presents a summary of the estimated annual effective doses for different age groups in the groundwater. The complete dataset for all sampling locations is provided in the Supplementary Material (Table S1).
The calculated annual effective doses showed significant variation across different age groups, ranging from 48.2 µSv/year to 292.7 µSv/year for adults, from 68.2 µSv/year to 444.4 µSv/year for children, and from 42.1 µSv/year to 280.9 µSv/year for infants, with mean values of 131.2 µSv/year, 190.1 µSv/year, and 118.4 µSv/year, respectively. These estimates for adults remain below the WHO reference level of 100 µSv/year for the public; however, children and infants exceed this benchmark in some wells due to higher water intake per unit body weight. This indicates that while groundwater consumption poses minimal radiological risk to the general population under current conditions, targeted monitoring is warranted for vulnerable age groups in high-activity zones [20]. However, approximately 30% of wells exceeded the WHO screening level of 1 Bq/L for 226Ra, indicating a need for further radiological evaluation in these zones primarily in central and eastern zones where salinity levels are relatively high. These findings suggest that although overall exposure remains within safe limits, localized areas may require targeted monitoring due to elevated radionuclide concentrations. Figure 14 shows the distribution of annual effective dose by age group, highlighting elevated exposure in children and identifying hotspots in central and eastern zones. This reinforces the need for focused surveillance near residential and educational facilities, particularly in zones with higher-than-average 226Ra concentrations.
The CR estimates were computed using the equation [55]:
C R = A R a × R C × W R × L E
where ARa is the activity concentration of 226Ra, RC is the risk coefficient, WR refers to the annual water consumption rate, and LE corresponds to life expectancy [35]. Table 4 summarizes the minimum, maximum, mean, and standard deviation of cancer risk estimates for males and females based on 226Ra concentrations in groundwater. The complete dataset for all sampling locations is provided in the Supplementary Material (Table S1).
The excess lifetime cancer risk was estimated using the nominal risk coefficients recommended by ICRP: 5.5 × 10⁻² Sv−1 for fatal cancer and 1.1 × 10⁻¹ Sv−1 for total cancer incidence [56]. Risk values were calculated by multiplying the cumulative effective dose (AFD) by life expectancy (70 years) and then by the respective risk coefficient (per sievert). These estimates exceed the acceptable benchmark of 1 × 10⁻⁴ for lifetime cancer risk, as recommended by regulatory bodies including WHO and ICRP [20,56]. Nevertheless, certain wells exhibited significantly higher individual risk estimates, emphasizing the importance of continued monitoring in these locations. Figure 15 shows the spatial distribution of excess lifetime cancer risk (mortality and morbidity), highlighting hotspots where risk values exceed 6 × 10⁻⁴ in specific wells. These spatial anomalies align with areas showing elevated 226Ra concentrations and highlight the necessity for enhanced surveillance and potential intervention strategies. Given the higher relative dose per body weight in infants and young children, special attention should be paid to water quality near schools, residential zones, and public water supply points. Although the population-average risk is moderate, infants and children exhibit higher relative exposure due to greater water intake per unit body weight. These findings support the conclusion that groundwater in Luxor Governorate poses minimal radiological risk to the general population under current conditions; however, certain locations exhibit above average 226Ra concentrations that may warrant mitigation measures or alternative water sources for sensitive groups. The full dataset including detailed dose calculations and cancer risk estimates for each well is provided in the Supplementary Material accompanying this research.

4. Discussion

The results of this study provide a comprehensive insight into spatial distribution, geochemical behavior, and radiological implications of naturally occurring radionuclides in groundwater from the study area. Measured activity concentrations of 226Ra, 232Th, and 40K were generally within the range of global averages reported for similar alluvial aquifer systems. However, approximately 30% of wells exceeded the WHO screening level of 1 Bq/L for 226Ra, indicating localized enrichment under specific hydrogeochemical conditions, rather than pervasive contamination [20]. The observed spatial distribution of 226Ra, particularly its enrichment in deeper, saline zones, is consistent with mobilization from uranium-bearing phosphate-rich formations of Upper Cretaceous age, as previously documented in similar geological settings across Egypt [46,47]. Although uranium isotopes were not directly measured in this study due to methodological constraints (see Section 2.3.1), the strong depth-dependent trend of 226Ra (r = 0.94) supports a geogenic origin linked to prolonged water–rock interaction with uranium-enriched host rocks. Regional studies have reported detectable 238U and 234U in groundwater from the Nubian Aquifer and Sinai Peninsula, with isotopic ratios indicating both paleo-recharge and modern water–rock interaction processes [45,48]. These findings reinforce the interpretation that 226Ra in the Quaternary aquifer of Luxor is likely derived from in-situ decay of uranium within deeper sedimentary units, with mobilization controlled by redox conditions and ion exchange processes. This finding is consistent with previous statistical and spatial analyses which identified elevated Ra levels in central and eastern zones—areas located along the regional groundwater flow path toward the Nile River, where prolonged residence time and evaporite dissolution promote 226Ra accumulation. Compared to regional studies, 226Ra concentrations in Luxor are comparable to or slightly higher than those in Qena and Safaga-Quseir [9], but lower than values reported in coastal or evaporite-rich aquifers globally. These comparisons suggest that the Quaternary alluvial aquifer system in Luxor exhibits moderate 226Ra mobilization, primarily controlled by salinity and regional flow dynamics. Although 226Ra correlates with salinity indicators (Cl, Na+, EC, TDS), these parameters show no significant correlation with depth (Section 3.2), suggesting that salinity-driven mobilization is spatially heterogeneous rather than depth-controlled. The exceptional correlation between 226Ra and depth (r = 0.94) points to an additional, depth-driven mechanism—likely prolonged water–rock interaction under reducing conditions—as the primary control on radium mobilization. From a radiological risk perspective, while mean annual effective doses for adults remain below the WHO reference level of 100 µSv/year, approximately 30% of wells exceed this benchmark—particularly for children and infants [1,51]. Nevertheless, children and infants showed relatively higher dose estimates due to increased water consumption rates per unit body weight. Figure 14 illustrates the variation in annual effective dose across age groups, highlighting the elevated exposure levels observed in children, particularly in deep wells (>90 m) located in central and eastern zones where 226Ra exceeds 1 Bq/L and groundwater residence time is longest [1]. These findings reinforce the necessity for continuous monitoring near residential and educational facilities serving young populations. PCA identified four principal components explaining 85% of the total variance, reflecting major geochemical processes. PC1 accounted for 32% of variance and was dominated by salinity indicators, strongly associating 226Ra with mineralization processes, ion exchange, and evaporite dissolution. This supports earlier correlation and spatial analyses, confirming the influence of saline conditions and prolonged water–rock interaction under regional flow conditions on 226Ra mobility. PC2 (27% of variance) was characterized by high loadings on SO42−, NO3, and PO43−, suggesting minor anthropogenic inputs, likely from agricultural runoff or septic systems in shallow aquifers. PC3 highlighted lithological controls through strong associations between 232Th, Al3+, and K+, consistent with their known behavior in clay-rich and aluminosilicate formations under oxidizing conditions. Finally, PC4 reflected redox-sensitive parameters such as pH and alkalinity, which may regulate element speciation and adsorption dynamics in certain aquifer zones. Estimated excess lifetime cancer risks exceed the commonly applied benchmark of 1 × 10⁻⁴, with mean values ranging from 2.37 × 10⁻⁴ (mortality, males) to 3.60 × 10⁻⁴ (morbidity, females) [20,56]. However, Figure 15 shows the spatial distribution of cancer risk, identifying localized hotspots where risk values exceed 6.5 × 10⁻⁴ for females and 6.2 × 10⁻⁴ for males. These anomalies correspond to areas showing elevated 226Ra concentrations and emphasize the importance of ongoing surveillance in these locations. Environmentally, the coexistence of elevated 226Ra and SO42− levels raises concerns about long-term impacts on Pharaonic monuments and archaeological structures due to salt crystallization cycles—not directly from 226Ra, but from associated SO42− and Cl ions. Salt crystallization cycles driven by fluctuating groundwater levels can accelerate weathering and surface deterioration, particularly in calcareous and sandstone-based constructions. This mechanism is well-documented in arid regions, where capillary rise and evaporation of saline groundwater accelerate deterioration of limestone and sandstone heritage structures [29]. Therefore, alongside public health considerations, there is a pressing need to assess the cumulative effects of groundwater chemistry on historical buildings and temples located near high-radon zones. The absence of significant correlation between 40K and salinity indicators (EC, TDS) supports its lithological control, likely sourced from K-feldspar in alluvial or bedrock units, rather than hydrochemical mobilization. In contrast, Al3+ showed a moderate negative correlation with EC and TDS (r = −0.53), consistent with decreased solubility and adsorption onto mineral surfaces under saline, oxidizing conditions. Overall, the distribution of naturally occurring radionuclides in Luxor Governorate is primarily controlled by natural geological, geochemical, and hydrodynamic processes, with minor anthropogenic influences in shallow zones. The stratigraphic complexity, with Pliocene–Holocene alluvial deposits unconformably overlying Late Cretaceous to Early Eocene marine formations, explains the observed geochemical variability, particularly in deep wells. Future research should include isotopic tracing (e.g., 226Ra/238U), mineralogical analysis, and long-term monitoring to improve source apportionment and trend assessment. Such investigations will enhance understanding of the interplay between groundwater chemistry, human exposure, and environmental impacts on cultural heritage in the Nile Valley region. Table 5 compares measured radionuclide concentrations and radiological parameters with international guidelines and regional studies.

5. Conclusions

This study provides a comprehensive assessment of naturally occurring radionuclide activity concentrations and their associated health and environmental implications in groundwater from the Nile Valley of Upper Egypt. Measured concentrations of radium-226 (226Ra), thorium-232 (232Th), and potassium-40 (40K) are generally within or slightly above typical global ranges for alluvial aquifers. Approximately 30% of wells exceeded the World Health Organization (WHO) screening level of 1 Bq/L for 226Ra, particularly in central and eastern zones characterized by saline conditions and active evaporite dissolution. The exceptionally strong correlation between 226Ra and well depth (r = 0.94) suggests that depth-dependent processes—particularly prolonged water–rock interaction under reducing conditions—are the dominant controls on radium mobility, with salinity-driven ion exchange playing a secondary, localized role. Principal component analysis (PCA) confirmed this association, with salinity-related parameters loading strongly on the first component. In contrast, 232Th and Al3+ exhibit strong associations with clay minerals and aluminosilicate phases under oxidizing conditions, reinforcing their geogenic origin and lithological control, with limited mobility in the aquifer system. Radiological risk assessment shows that annual effective doses remain below the ICRP public dose limit of 1 mSv/year; however, mean doses exceed the WHO screening reference level of 100 µSv/year in ~30% of wells. However, infants and children exhibit higher relative exposure due to greater water intake per unit body weight, highlighting the need for targeted monitoring. From an environmental perspective, elevated SO42− and Cl levels (often co-occurring with 226Ra) may accelerate salt-induced deterioration of Pharaonic monuments and archaeological structures—particularly limestone and sandstone edifices vulnerable to capillary rise and evaporation cycles. While overall radiological risk to the general population remains low, the co-occurrence of radiological and geochemical stressors in hotspot zones necessitates integrated monitoring and mitigation strategies. Future geoarchaeological studies should explicitly assess the cumulative impact of groundwater chemistry on heritage site integrity, especially in areas with high 226Ra and salinity. While this study provides a robust assessment of key natural radionuclides (226Ra, 232Th, 40K) in the Quaternary alluvial aquifer of Luxor, it is subject to methodological limitations: the gamma spectrometry system used cannot directly quantify uranium isotopes (238U, 234U) or other alpha-emitting radionuclides, which may contribute to the total radiological burden. To address this gap, future investigations should: (i) Employ alpha spectrometry or ICP-MS techniques to fully characterize the uranium decay series; (ii) Integrate isotopic tracers (e.g., 226Ra/238U activity ratios) to elucidate mobilization mechanisms and groundwater residence times; (iii) Combine mineralogical analysis and geoarchaeological assessments to evaluate long-term impacts on both human health and cultural heritage.

Supplementary Materials

The following supporting information can be downloaded at: https://www.mdpi.com/article/10.3390/w17182730/s1: Table S1: Descriptive statistics of all measured parameters (radionuclide activity concentrations, physicochemical properties, hydrochemical composition, major cations, trace elements, and well depths) for the 85 groundwater samples from the eastern floodplain of Luxor Governorate, Upper Egypt. Table S2: Full Pearson correlation matrix between all measured parameters. Table S3: Complete PCA output including eigenvalues, explained variance, and factor loadings.

Author Contributions

Conceptualization, K.A. and Z.S.M.; Methodology, K.A., Z.S.M. and C.W.; Validation, K.A., Z.S.M. and C.W.; Formal Analysis, K.A., S.H. and M.K.; Investigation, K.A., M.K., K.S.E.-D. and K.M.; Resources, Z.S.M.; Data Curation, K.M. and K.A.; Writing—Original Draft, K.A.; Writing—Review and Editing, K.A., Z.S.M., C.W., K.S.E.-D., S.H. and K.M.; Visualization, K.A.; Supervision, K.A. and S.H.; Project Administration, Z.S.M.; Funding Acquisition, Z.S.M. All authors have read and agreed to the published version of the manuscript.

Funding

This research work was funded by Umm Al-Qura University, Saudi Arabia, under grant number: 25UQU4331074GSSR01NI.

Data Availability Statement

The data presented in this study are available from the corresponding author upon reasonable request.

Acknowledgments

The authors extend their appreciation to Umm Al-Qura University, Saudi Arabia for funding this research work through grant number: 25UQU4331074GSSR01NI.

Conflicts of Interest

The authors declare no conflict of interest.

References

  1. World Health Organization (WHO). Guidelines for Drinking-Water Quality: Fourth Edition Incorporating the First and Second Addenda; WHO: Geneva, Switzerland, 2022.
  2. Abdelkareem, M.; El-Baz, F. Analyses of optical images and radar data reveal structural features and predict groundwater accumulations in the central Eastern Desert of Egypt. Arab. J. Geosci. 2014, 8, 2653–2666. [Google Scholar] [CrossRef]
  3. Alezabawy, A.K.; Eissa, M.; Salem, Z.E.-S. Hydrogeochemical and isotopic investigations of groundwater in the reclaimed desert located between EL Nasr canal and Mariut Tableland, NW Coast, Egypt. Sci. Rep. 2024, 14, 21172. [Google Scholar] [CrossRef]
  4. Ray, C.; Shamrukh, M. NATO Science for Peace and Security Series-C: Environmental Security. In Riverbank Filtration for Water Security in Desert Countries; Springer: Dordrecht, The Netherlands, 2011. [Google Scholar]
  5. Zhuo, W.; Iida, T.; Yang, X. Occurrence of 222Rn, 226Ra, 228Ra and U in groundwater in Fujian Province, China. J. Environ. Radioact. 2001, 53, 111–120. [Google Scholar] [CrossRef]
  6. Saqan, S.; Kullab, M.; Ismail, A. Radionuclides in hot mineral spring waters in Jordan. J. Environ. Radioact. 2001, 52, 99–107. [Google Scholar] [CrossRef]
  7. El-Din, K.S.; Ali, K.; Harb, S.; Abbady, A.E.-B. Measurement of 222Rn concentration levels in drinking water samples from Qena city (Egypt) and evaluation of the annual effective doses. Int. J. Radiat. Res. 2020, 18, 227–233. [Google Scholar]
  8. Din, K.S.; Ali, K.; Harb, S.; Abbady, A.B. Natural radionuclides in groundwater from Qena governorate, Egypt. Environ. Forensics 2021, 22, 48–55. [Google Scholar]
  9. Ahmed, N.K. Natural Radioactivity of Ground and Drinking Water in Some Areas in Upper Egypt. Arab. J. Nucl. Sci. Appl. 2004, 36, 571–580. [Google Scholar]
  10. Carvalho, F.; Chambers, D.; Fernandes, S.; Fesenko, S.; Goulet, R.; Howard, B.; Kim, C.K.; Martin, P.; Moore, W.S.; Phaneuf, M.; et al. The Environmental Behaviour of Radium: Revised Edition; International Atomic Energy Agency: Vienna, Austria, 2014; 267p.
  11. Pérez-Moreno, S.; Guerrero, J.; Mosqueda, F.; Gázquez, M.; Bolívar, J. Hydrochemical behavior of long-lived natural radionuclides in Spanish groundwaters. CATENA 2020, 191, 104558. [Google Scholar] [CrossRef]
  12. Vengosh, A.; Coyte, R.M.; Podgorski, J.; Johnson, T.M. A critical review on the occurrence and distribution of the uranium- and thorium-decay nuclides and their effect on the quality of groundwater. Sci. Total Environ. 2022, 808, 151914. [Google Scholar] [CrossRef]
  13. Stackelberg, P.E.; Szabo, Z.; Jurgens, B.C. Radium mobility and the age of groundwater in public-drinking-water supplies from the Cambrian-Ordovician aquifer system, north-central USA. Appl. Geochem. 2018, 89, 34–48. [Google Scholar] [CrossRef]
  14. Faraj, T.; Ragab, A.; El Alfy, M. Geochemical and hydrogeological factors influencing high levels of radium contamination in groundwater in arid regions. Environ. Res. 2020, 184, 109303. [Google Scholar] [CrossRef]
  15. Erőss, A.; Mádl-Szőnyi, J.; Surbeck, H.; Horváth, Á.; Goldscheider, N.; Csoma, A.É. Radionuclides as natural tracers for the characterization of fluids in regional discharge areas, Buda Thermal Karst, Hungary. J. Hydrol. 2012, 426–427, 124–137. [Google Scholar] [CrossRef]
  16. Gainon, F.; Surbeck, H.; Zwahlen, F. Natural radionuclides in groundwater as pollutants and as useful tracers. In Proceedings of the 12th Symposium on Water Rock Interaction, Kunming, China, 31 July–5 August 2007. [Google Scholar]
  17. Gainon, F.; Goldscheider, N.; Surbeck, H. Conceptual model for the origin of high radon levels in spring waters–the example of the St. Placidus spring, Grisons, Swiss Alps. Swiss J. Geosci. 2007, 100, 251–262. [Google Scholar] [CrossRef]
  18. Tóth, J. Groundwater as a geological agent: An overview of the causes, processes, and manifestations. Hydrogeol. J. 1999, 7, 1–14. [Google Scholar] [CrossRef]
  19. Canu, I.G.; Laurent, O.; Pires, N.; Laurier, D.; Dublineau, I. Health effects of naturally radioactive water ingestion: The need for enhanced studies. Environ. Health Perspect. 2011, 119, 1676–1680. [Google Scholar] [CrossRef]
  20. World Health Organization’s (WHO). Guidelines for Drinking-Water Quality: Fourth Edition Incorporating the First Addendum; WHO Library Cataloguing-in-Publication Data: Geneva, Switzerland, 2017. [Google Scholar]
  21. Kitto, M.E.; Kim, M.S. Naturally occurring radionuclides in community water supplies of New York state. Health Phys. 2005, 88, 253–260. [Google Scholar] [CrossRef] [PubMed]
  22. Godoy, J.M.; Godoy, M.L. Natural radioactivity in Brazilian groundwater. J. Environ. Radioact. 2006, 85, 71–83. [Google Scholar] [CrossRef]
  23. Salonen, L. 238U series radionuclides as a source of increased radioactivity in groundwater originating from Finnish bedrock. In Future Groundwater Resources at Risk; Soveri, J., Suokko, T., Eds.; International Association of Hydrological Sciences Publications: Oxfordshire, UK, 1994; pp. 71–84. [Google Scholar]
  24. M. Isam Salih, M.; BL Pettersson, H.; Lund, E. Uranium and thorium series radionuclides in drinking water from drilled bedrock wells: Correlation to geology and bedrock radioactivity and dose estimation. Radiat. Prot. Dosim. 2002, 102, 249–258. [Google Scholar] [CrossRef] [PubMed]
  25. El-Mageed, A.I.A.; El-Kamel, A.E.-H.; Abbady, A.E.-B.; Harb, S.; Saleh, I.I. Natural radioactivity of ground and hot spring water in some areas in Yemen. Desalination 2013, 321, 28–31. [Google Scholar] [CrossRef]
  26. Said, R. The Geology of Egypt; CRC Press: Boca Raton, FL, USA, 2017; p. 734. [Google Scholar]
  27. Ahmed, A.A.; Fogg, G.E. The impact of groundwater and agricultural expansion on the archaeological sites at Luxor, Egypt. J. Afr. Earth Sci. 2014, 95, 93–401. [Google Scholar] [CrossRef]
  28. Razik, T.A.; Razvaliaev, A.V. On the Tectonic Origin of the Nile Valley between Idfu and Qena. Egypt. J. Geol. 1972, 16, 235–244. [Google Scholar]
  29. El Hosary, M.F.M. Hydrogeological and Hydrochemical Studies on Luxor Area, Southern Egypt. Master’s Thesis, Ain Shams University, Cairo, Egypt, 1994; p. 121. [Google Scholar]
  30. Said, R. The Geology of Egypt; Taylor & Francis: Oxfordshire, UK, 1990; p. 734. [Google Scholar]
  31. Said, R. The Geology of Egypt; Elsevier Publishing Company: New York, NY, USA, 1962; p. 377.
  32. Egyptian Ministry of Water Resources and Irrigation (MWRI). MWRI, Copyright © 2020–2024 Designed by Mic-MWRI. Available online: https://www.mwri.gov.eg/ (accessed on 1 December 2024).
  33. Research Institute for Groundwater (RIGW). Ministry of public works and water resources, Egypt. In Detailed Hydrogeological Maps of Luxor and Esna Areas (1:100.000); RIGW: Cairo, Egypt, 1997. [Google Scholar]
  34. Knoll, G.F. Radiation Detection and Measurement, 4th ed.; John Wiley & Sons: Hoboken, NJ, USA, 2010; p. 857. [Google Scholar]
  35. Ali, K.; Abu-Taleb, A.; Abbady, A.E.-B.; Harb, S. Radiological risks in Nasser lake water and their health and environmental implications. Sci. Rep. 2025, 15, 14545. [Google Scholar] [CrossRef]
  36. Harb, S. On the Human Radiation Exposure as Derived from the Analysis of Natural and Man-Made Radionuclides in Soil. Ph.D. Thesis, Institute for Radiation Protection and Radioecology, ZSR. Hannover University, Hannover, Germany, 2004. [Google Scholar]
  37. Ali, K.; Abbady, A.E.-B.; Abu-Taleb, A.; Harb, S. Assessment of radioactive substance transfer and its ecological and health impacts on the Nasser Lake ecosystem. Sci. Rep. 2025, 15, 26115. [Google Scholar] [CrossRef] [PubMed]
  38. Abbady, A.G.E.; Yousef, A.M.M.; Ali, K. Natural Radioactivity and Health Risks in Southeastern Desert, Egypt: A Forensic Evaluation of Wadi Um-Sleimat, Jebel El-Erediya, and Wadi Um-Had. Environ. Forensics 2025, 1–15. [Google Scholar] [CrossRef]
  39. Harb, S.; El-Kamel, A.H.; El-Mageed, A.I.A.; Abbady, A.; Rashed, W. Radioactivity Levels and Soil-to-Plant Transfer Factor of Natural Radionuclides from Protectorate Area in Aswan, Egypt. World J. Nucl. Sci. Technol. 2014, 4, 7–15. [Google Scholar] [CrossRef]
  40. El-Arabi, A.E.-G.; Khalifa, N.; El-Din, K.S. Natural radionuclides and dose estimation in natural water resources from Elba protective area, Egypt. Radiat. Prot. Dosim. 2006, 121, 284–292. [Google Scholar] [CrossRef]
  41. El-Gamal, H.; Sefelnasr, A.; Salaheldin, G. Determination of Natural Radionuclides for Water Resources on the West Bank of the Nile River, Assiut Governorate, Egypt. Water 2019, 11, 311. [Google Scholar] [CrossRef]
  42. Currie, L.A.; Currie. Limits for qualitative detection and quantitative determination. Application to radiochemistry. Anal. Chem. 1968, 40, 586–593. [Google Scholar] [CrossRef]
  43. ISO 5667-3:2024; Water Quality—Sampling. Part 3: Preservation and Handling of Water Samples. International Organization for Standardization (ISO): Geneva, Switzerland, 2024.
  44. ISO/IEC 17025; Requirements for the Competence of Testing and Calibration Laboratories. International Organization for Standardization (ISO): Geneva, Switzerland, 2017.
  45. Ahmed, M.; Chen, Y.; Khalil, M. Isotopic composition of groundwater resources in arid environments. J. Hydrol. 2022, 609, 127773. [Google Scholar] [CrossRef]
  46. Dabous, A.A.; Osmond, J.K. Uranium isotopic study of artesian and pluvial contributions to the Nubian Aquifer, Western Desert, Egypt. J. Hydrol. 2001, 243, 242–253. [Google Scholar] [CrossRef]
  47. El-Aassy, I.E.; El-Feky, M.G.; Issa, F.A.; Ibrahim, N.M.; Desouky, O.A.; Khattab, M.R. Uranium and 234U/238U isotopic ratios in some groundwater wells at Southwestern Sinai, Egypt. J. Radioanal. Nucl. Chem. 2015, 303, 357–362. [Google Scholar] [CrossRef]
  48. Sherif, M.I.; Lin, J.; Poghosyan, A.; Abouelmagd, A.; Sultan, M.I.; Sturchio, N.C. Geological and hydrogeochemical controls on radium isotopes in groundwater of the Sinai Peninsula, Egypt. Sci. Total Environ. 2018, 613–614, 877–885. [Google Scholar] [CrossRef] [PubMed]
  49. Rice, E.W.; Baird, R.B.; Eaton, A.D. Standard Methods for the Examination of Water and Wastewater, 23rd ed.; American Public Health Association; American Water Works Association; Water Environment Federation: Washington, DC, USA, 2017. [Google Scholar]
  50. Kiro, Y.; Weinstein, Y.; Starinsky, A.; Yechieli, Y. Application of radon and radium isotopes to groundwater flow dynamics: An example from the Dead Sea. Chem. Geol. 2015, 411, 155–171. [Google Scholar] [CrossRef]
  51. International Atomic Energy Agency (IAEA). Specification of Radionuclide Content in Commodities Requiring Regulation for Purposes of Radiation Protection; IAEA: Vienna, Austria, 2002.
  52. United Nations Scientific Committee on the Effects of Atomic Radiation (UNSCEAR). Sources and Effects of Ionizing Radiation; UN Publications: New York, NY, USA, 2000. [Google Scholar]
  53. Nicolov, V.P.; Georgescu, P.L.; Iticescu, C.; Moraru, D.I.; Pintilie, A.G. The assessment of the annual effective dose due to ingestion of radionuclides from drinking water consumption: Calculation methods. J. Radioanal. Nucl. Chem. 2020, 327, 49–58. [Google Scholar] [CrossRef]
  54. United Nations Scientific Committee on the Effects of Atomic Radiation (UNSCEAR). Report to the General Assembly: Volume 1 Sources of Ionizing Radiation; UN Publications: New York, NY, USA, 2000. [Google Scholar]
  55. United Nations Scientific Committee on the Effects of Atomic Radiation-UNSCEAR. Report to the General Assembly, with Scientifc Annexes Annex B: Exposures of the Public and Workers from Various Sources of Radiation; UN Publications: New York, NY, USA, 2008. [Google Scholar]
  56. Eckerman, K.; Harrison, J.; Menzel, H.-G.; Clement, C.H. ICRP Publication 119: Compendium of Dose Coefficients Based on ICRP Publication 60; International Commission on Radiological Protection (ICRP): Ottawa, ON, Canada, 2012. [Google Scholar]
  57. International Atomic Energy Agency (IAEA). Safety Standards for Protecting People and the Environment, Radiation Protection and Safety of Radiation Sources: International Basic Safety Standards; IAEA: Vienna, Austria, 2014.
Figure 1. (a) Distribution of the groundwater sampling sites in the eastern floodplain of Luxor Governorate, Upper Egypt. (b) Location of the study area within Egypt.
Water 17 02730 g001
Figure 2. Simplified geological cross-section illustrating the stratigraphic sequence and hydrogeological setting of the eastern floodplain of Luxor Governorate, Upper Egypt (Modified after [27]).
Water 17 02730 g002
Figure 3. Box plot illustration of 226Ra, 232Th, and 40K activity concentrations in groundwater wells.
Water 17 02730 g003
Figure 4. Box plots showing the distribution of Physicochemical properties in groundwater samples from the eastern floodplain of Luxor Governorate, Upper Egypt (n = 85): (a) pH, and (b) total dissolved solids (TDS, mg/L). Red dots indicate individual measured values for each sample, providing a detailed view of data dispersion within the interquartile range and beyond.
Water 17 02730 g004
Figure 5. Box plots illustrating hydrochemical properties in groundwater samples from the eastern floodplain of Luxor Governorate, Upper Egypt (n = 85): (a) total hardness (mg/L), and (b) alkalinity (ALK, mg/L as CaCO3). Red dots indicate individual measured values for each sample, providing a detailed view of data dispersion within and beyond the interquartile range.
Water 17 02730 g005
Figure 6. Box plots of major cations and anions in groundwater samples from the eastern floodplain of Luxor Governorate, Upper Egypt (n = 85): (a) Na+, (b) K+, (c) Cl, (d) NO3, (e) NO2, (f) SO42−, and (g) PO43− (all in mg/L). Red dots indicate individual measured values for each sample, providing a detailed view of data dispersion within and beyond the interquartile range.
Water 17 02730 g006
Figure 7. Box plots of trace elements in groundwater samples from the eastern floodplain of Luxor Governorate, Upper Egypt (n = 85): (a) Fe2+ (mg/L) and (b) Al3+ (mg/L). Red dots indicate individual measured values for each sample, providing a detailed view of data dispersion within and beyond the interquartile range.
Water 17 02730 g007
Figure 8. Scatter plots showing the variation of (a) 226Ra (Bq/L), (b) EC (µS/cm), (c) Cl (mg/L), (d) SO42− (mg/L), and (e) Al3+ (mg/L) with well depth (m) in 85 groundwater wells. Linear regression lines are shown, with adjusted R2 values indicating the strength of the relationship.
Water 17 02730 g008
Figure 9. Spatial distribution of 226Ra activity concentrations (Bq/L) in groundwater samples from the eastern floodplain of Luxor Governorate, Upper Egypt (n = 85), generated using Inverse Distance Weighting (IDW) interpolation in ArcGIS version 10.8. Sampling locations are indicated by black circles. The color scale ranges from green (low concentrations) to bright red (high concentrations), with values exceeding 1 Bq/L observed in central and eastern zones.
Water 17 02730 g009
Figure 10. Spatial distribution of 232Th activity concentrations (Bq/L) in groundwater samples from the eastern floodplain of Luxor Governorate, Upper Egypt (n = 85), derived through IDW interpolation. Sampling sites are marked as black circles. The color scale transitions from green (low) to bright red (high), showing relatively homogeneous distribution with marginally elevated levels in clay-rich areas.
Water 17 02730 g010
Figure 11. Spatial distribution of 40K activity concentrations (Bq/L) in groundwater samples from the eastern floodplain of Luxor Governorate, Upper Egypt (n = 85), mapped using IDW interpolation. Black circles denote sampling locations. The color scale extends from green (low) to bright red (high), reflecting consistent distribution patterns linked to potassium-rich geological formations.
Water 17 02730 g011
Figure 12. Pearson correlation matrix (r values) for radionuclide and hydrochemical parameters in groundwater samples from the eastern floodplain of Luxor Governorate, Upper Egypt (n = 85). Correlation coefficients are displayed within each cell. Color intensity and the associated gradient bar reflect the strength and direction of the relationship, classified into five defined intervals. PO43− and other ion labels are correctly formatted.
Water 17 02730 g012
Figure 13. Scree plot of eigenvalues for principal components derived from the correlation matrix of radionuclide and hydrochemical parameters in groundwater samples from the eastern floodplain of Luxor Governorate, Upper Egypt (n = 85). The dashed line at y = 1 indicates the threshold for component retention according to Kaiser’s criterion. X-axis labeled “Component Number” for clarity, and tick marks are aligned across all axes to ensure visual consistency.
Water 17 02730 g013
Figure 14. Variation in annual effective dose across adults, children, and infants, highlighting elevated exposure levels in vulnerable zones within Luxor Governorate.
Water 17 02730 g014
Figure 15. Distribution of excess lifetime cancer risk (mortality and morbidity) across groundwater samples from the eastern floodplain of Luxor Governorate, Upper Egypt (n = 85). The box plot shows the interquartile range (IQR), median, and 1.5 × IQR whiskers. Red dots indicate outlier risk values exceeding 1.5 × IQR above the upper quartile, associated with high 226Ra concentrations in confined aquifer zones.
Water 17 02730 g015
Table 1. Descriptive statistics of radionuclide activity concentrations, physicochemical parameters, hydrochemical properties, major cations, and trace elements in groundwater samples from the eastern floodplain of Luxor Governorate, Upper Egypt (n = 85). Values include minimum, maximum, mean, standard deviation, and coefficient of variation (CV).
ParameterMeanStd. DevMinMaxCV (%)
Radioactive elements (Bq/L)
226Ra0.740.30.25242.05
232Th0.240.10.110.642.08
40K13461927.09
Physicochemical properties
pH7.590.27.18.43.2
EC (µS/cm)1871.31676.1318790089.6
TDS (mg/L)1234.71106.3209521489.6
Hydrochemical properties (mg/L)
Total Hardness460.9317.2159.71790.968.8
Alkalinity363.4148.199.5965.240.8
Major cations (mg/L)
Na+261.2181.92.9679.669.7
K+13.26.34.135.147.6
Cl225.1306.716.61541.3136.2
NO36.94.60.112.466.1
NO20.10.30.012.3300
SO42−184.5140.510.745376.2
PO43−0.90.30.21.533.2
Trace elements (mg/L)
Fe2+0.030.0200.178.3
Al3+62.431.74156.950.7
Table 2. Pearson correlation coefficients (r) between selected radionuclides, hydrochemical parameters, and well depth in groundwater samples from the eastern floodplain of Luxor Governorate, Upper Egypt (n = 85). Correlations highlight key geochemical and hydrological controls, including the strong positive association between 226Ra and well depth, and between salinity indicators (TDS, EC, Cl, SO42−).
RelationshipCorrelation Coefficient (r)Parameter Type
226Ra ↔ Depth0.94 ***Radionuclide ↔ Well Depth
226Ra ↔ PO43−0.33 *Radionuclide ↔ Anion
232Th ↔ PO43−0.37 *Radionuclide ↔ Anion
40K ↔ PO43−0.23 *Radionuclide ↔ Anion
EC ↔ TDS1.00 ***Major ion ↔ TDS
Cl ↔ TDS0.97 ***Anion ↔ TDS
SO42− ↔ EC0.85 ***Anion ↔ Conductivity
Na+ ↔ SO42−0.75 ***Cation ↔ Anion
Cl ↔ Na+0.71 ***Anion ↔ Cation
NO3 ↔ SO42−0.45 **Nitrate ↔ Sulfate
Al3+ ↔ EC/TDS−0.53Trace metal ↔ Salinity indicator
Notes: * → Low correlation (0.3 ≤ |r| < 0.5), ** → Moderate correlation (0.5 ≤ |r| < 0.7), *** → Strong correlation (|r| ≥ 0.7).
Table 3. Summary of annual effective dose estimates and cancer risk values for different age groups based on 226Ra concentrations in groundwater.
CategoryMinMaxMeanStd. DevAcceptable Dose Limit [20,56]
Annual Effective Dose (µSv/y)
Adults (>17 years)48.18292.65131.2446.61100
Children (2–7 years)68.15444.35190.0570.33200
Infants (<2 years)42.12280.86118.3744.41260
Table 4. Summary of cancer risk values by gender based on 226Ra concentrations in groundwater.
CategoryMinMaxMeanStd. DevAcceptable Dose Limit [20,56]
Cancer Risk (Mortality) (×10−4)
Male0.796.262.370.99<1 × 10⁻⁴
Female0.836.562.481.04
Cancer Risk (Morbidity) (×10−4)
Male1.159.083.441.45<1 × 10⁻⁴
Female1.219.513.601.52
Table 5. Comparison of measured radionuclide concentrations and radiological parameters with international guidelines and regional studies in Egypt.
This StudyWHO [20]IAEA [57]Regional Studies
Avg.AreaRef.
226Ra (Bq/L)0.74 ± 0.3≤1 (alpha)≤10.54Qena [8]
1.50Safaga-Quseir [9]
0.59 Naser Lake[35]
0.20Assiut[41]
232Th (Bq/L)0.24 ± 0.10≤0.1 (beta)≤10.36Qena[8]
0.50Safaga-Quseir[9]
0.36Naser Lake[35]
0.08Assiut[41]
40K (Bq/L)13 ± 3.5410 105.10Qena[8]
8.60Naser Lake[35]
6.80Assiut[41]
AFD (µSv/y)Adults131.24 ± 46.61<100<1000
Children190.05 ± 70.33<200
Infants118.37 ± 44.41<260
CR (Mortality, ×10−4)2.37–2.48<1 × 10⁻⁴
CR (Morbidity, ×10−4)3.44–3.60<1 × 10⁻⁴
Disclaimer/Publisher’s Note: The statements, opinions and data contained in all publications are solely those of the individual author(s) and contributor(s) and not of MDPI and/or the editor(s). MDPI and/or the editor(s) disclaim responsibility for any injury to people or property resulting from any ideas, methods, instructions or products referred to in the content.