Article

Spatiotemporal Variations of Inorganic Carbon Species Along the Langtang–Narayani River System, Central Himalaya

by
Maya P. Bhatt
1,* and
Ganesh B. Malla
2
1
Department of Biology and Chemistry, Texas A&M International University, 5201 University Boulevard, Laredo, TX 78041, USA
2
Department of Mathematics, Computer, Geology and Physics, University of Cincinnati-Clermont, 4200 College Clermont Drive, Batavia, OH 45103, USA
*
Author to whom correspondence should be addressed.
Water 2025, 17(18), 2727; https://doi.org/10.3390/w17182727
Submission received: 27 July 2025 / Revised: 10 September 2025 / Accepted: 10 September 2025 / Published: 15 September 2025
(This article belongs to the Section Water and Climate Change)

Abstract

The production and transport of dissolved inorganic carbon (DIC) is central to weathering reactions and the global carbon cycle. We investigated the spatiotemporal variability and export of inorganic carbon species along the rapidly weathering Langtang–Narayani river system in the central Nepal Himalaya. Over the course of one year, surface water samples were collected from sixteen stations spanning a wide range of elevations. DIC concentrations generally declined with increasing elevation, except in mid-mountain sites influenced by hot springs. Bicarbonate (HCO3) was identified as the dominant inorganic carbon species, contributing approximately 85% to the total DIC and with a similar dominant export rate of bicarbonate to total DIC export rate, followed by carbon dioxide (CO2) and carbonate (CO32−). The river water exhibited a strong altitudinal gradient in carbonate chemistry, with CO2 supersaturation in the lowlands and undersaturation at higher elevations. Metamorphic activities in the lower mid-mountain sites significantly influenced CO2 concentrations and inorganic carbon dynamics. The partial pressure of CO2 (pCO2) varied widely (56 to 33,869 μatm), reflecting distinct geochemical and seasonal controls. The estimated DIC export rates were 93.66, 37.81, and 12.59 tons km−2 yr−1 from the Narayani River in the lowlands, the Trisuli River in the mid-mountains, and the Langtang River in the high Himalaya region, respectively. These findings highlight the critical role of elevation, seasonality, and geological processes in regulating carbon dynamics in Himalayan river systems, providing new insights into their contribution to regional carbon fluxes. A comprehensive array of significant univariate and multivariate predictive models is presented here, offering versatile applications, including the interpretation of full and partial derivatives explaining inorganic carbon dynamics within the Himalayan basin.

1. Introduction

Chemical weathering is a fundamental process in Earth’s geochemical cycles, acting as a natural regulator of atmospheric carbon dioxide (CO2) levels and shaping the carbon cycle over geological timescales [1]. Changes in Earth’s climate are linked to the levels of atmospheric carbon dioxide (CO2), which are ultimately regulated by terrestrial silicate weathering, which controls the carbon removal from the ocean–atmosphere system [2]. The rate of chemical weathering is influenced by the concentration of CO2 in the atmosphere, with feedback mechanisms linking weathering rates to the global carbon budget [3,4,5,6,7,8]. Weathering of silicate minerals is especially significant, as it acts as a long-term sink for atmospheric CO2 [1,8,9,10,11]. Global CO2 consumption by chemical weathering is 237 Mt C per year, with a high proportion (63%) from silicate weathering [7]. Silicate weathering generates bicarbonate (HCO3), which accounts for approximately half of the total atmospheric and soil CO2 consumed during mineral dissolution [12,13].
Dissolved inorganic carbon (DIC) species exhibit pH-dependent distributions: carbonic acid dominates below pH 6, bicarbonate is most predominant between pH 6.4 and 10.3, and carbonate becoming significant only at high pH values above 10.3 [14]. Partial pressure of CO2 (pCO2) in aquatic systems is a key variable in chemical weathering processes, as it directly influences the concentration of DIC and governs the rate of weathering [13]. Soil CO2 levels are typically 100 times higher than atmospheric levels, with groundwater and river systems also showing elevated concentrations due to interactions with terrestrial carbon pools [15]. The largest global carbon pool resides in the oceans (~38,000 Gt C), while terrestrial soils contain approximately 1500 Gt C [16]. Anthropogenic activities, including deforestation and fossil fuel combustion, release an estimated 7.3 Gt C/year into the atmosphere, impacting carbon dynamics in aquatic systems [17], The net cumulative emissions of CO2 from 1850 to 2019 were 2400 ± 240 Gt CO2 and of these 58% occurred between 1850 and 1989 and 42% from 1990 to 2019 [18].
The Himalayan region has garnered significant attention due to its unique geotectonic setting and its role in global carbon cycling. Studies have linked enhanced silicate weathering in the Himalayas to tectonic uplift and global cooling during the Cenozoic era [19,20]. However, recent studies suggest that only a small fraction of CO2 consumption in the Himalayas contributes to global cooling [21,22]. Recently, Bhatt et al. (2018) [23] hypothesized that pyrite oxidation compensates for the idealized CO2 consumption by silicate weathering along the Langtang–Narayani river system in the central Himalaya and later confirmed this based on sulfur isotope data, indicating that weathering exerts minimal impact on pCO2 over timescales of >5–10 kyr and less than 10 Myr [24]. Rivers originating in the Himalayas transport substantial organic and inorganic carbon to the oceans, playing a vital role in the global carbon budget [6,25]. In the Langtang–Narayani river system, hydrothermal activity and erosion-driven processes have been shown to influence carbon fluxes, with silicate weathering accounting for 10% of annual silicate alkalinity flux [26].
Surface waters are normally supersaturated with carbon dioxide with respect to atmospheric concentration [13,27,28,29,30,31,32,33]. In about 95% of 6708 stream and river sampling locations, a median pCO2 value greater than atmospheric values were reported, and in a similar way pCO2 observation of 20,623 sites from 7939 lakes and reservoirs also observed supersaturation [29]. Regnier et al. (2013) [30] compiled pCO2 values for about 12,000 sampling locations and found that 96% of inland waters were supersaturated and 82% showed double the concentration of the atmosphere. Lauerwald et al. (2015) [31] documented the first global maps of partial pressure of carbon dioxide (pCO2) in rivers of stream orders three and higher and estimated an average pCO2 of 2400 μatm at the global scale. Global analysis of pCO2 for rivers and streams with a catchment area of less than 500 km2 reveals high maximum pCO2 values, showing three times higher values in headwater streams than the global average [34]. Xiao et al. (2020) [33] found a mean annual average pCO2 value of 778 μatm at the eutrophic lake Taihu in China, with the highest value reported being 1000 μatm at the river mouth. Bhatt and McDowell (2007) [13] observed 1568 μatm in tropical streams and an average pCO2 value of up to 12,938 μatm in lower source points within the Rio Icacos basin, one of the critical zone observatories (CZO) sites of the US in Puerto Rico.
The normally high pCO2 values from the Langtang–Narayani river system is comparable with global observations indicating the supersaturation of surface waters worldwide, except for exceptionally high values from mid-mountain sites (LNS-5-LNS7) due to metamorphic activities in the region [27,29,31]. More than 15 times higher pCO2 than the atmospheric value was reported in the River Dee in northern Scotland by Dawson et al. in 1995 [35]. The Amazon, the largest river in the world, is supersaturated with carbon dioxide due to high respiration relative to primary production [36]. Higher carbon dioxide in surface waters is due to inputs of organic and inorganic carbon from terrestrial sources [27]. Tovas et al. (2023) [32] documented the 779,186 pCO2 estimates from 35,855 sites across 48 US states and found that flowing freshwater was mostly supersaturated and rising pCO2 affects a wide range of ecosystems and organisms. Decomposition of organic carbon acts as a primary driver of CO2 emission from the lake to the atmosphere and reduction in CO2 emission is due to eutrophication in aquatic ecosystems, which increases primary production and hence the eutrophic lake acts as sink for CO2 [37].
Decarbonation hot springs within the mountainous regions play a vital role in the Earth’s carbon budget [38]. Wang et al. (2024) [39] documented metamorphic decarbonation as a major source of carbon flux in the southern Tibetan region, responsible for 82% of total dissolved carbon in spring water and estimated a carbon flux of 2.7 to 4.5 × 10¹² mol yr−1 for the entire Himalayan Orogenic belt. France-Lanord and Derry (1997) [40] documented that the dominant effect of Neogene Himalayan erosion increased the amount of organic carbon in the sedimentary reservoir, which has had a significantly larger effect on the carbon cycle than the weathering of aluminosilicate by a factor of two to three. Later, Eveans et al. (2008) [41] reported a four-fold higher rate of CO2 degassing in geothermal systems than from the chemical weathering uptake of CO2 in the Narayani basin of the central Nepal Himalaya. The substantial production of CO2 from metamorphic decarbonation reactions in the mid-mountain region of Nepal is attributed to the Himalayan collision [41,42]. Earlier studies have documented higher CO2 production and emissions due to human activities and climate change or warming [30,33,37,43]. Mineral weathering and biological activity appear to control the dissolved inorganic carbon (DIC) flux in river basins [44].
While studies have documented bicarbonate concentration variations in Himalayan river systems [23,45,46,47,48], the controlling factors of all inorganic carbon species and their fluxes remain poorly understood. This study aims to evaluate the spatial and temporal variations and fluxes of inorganic carbon species along the Langtang–Narayani river system in the central Nepal Himalaya. Additionally, it seeks to elucidate the mechanisms regulating inorganic carbon dynamics within this high-altitude Himalayan drainage network through the application of empirical modeling.

2. Study Area

2.1. Site Description

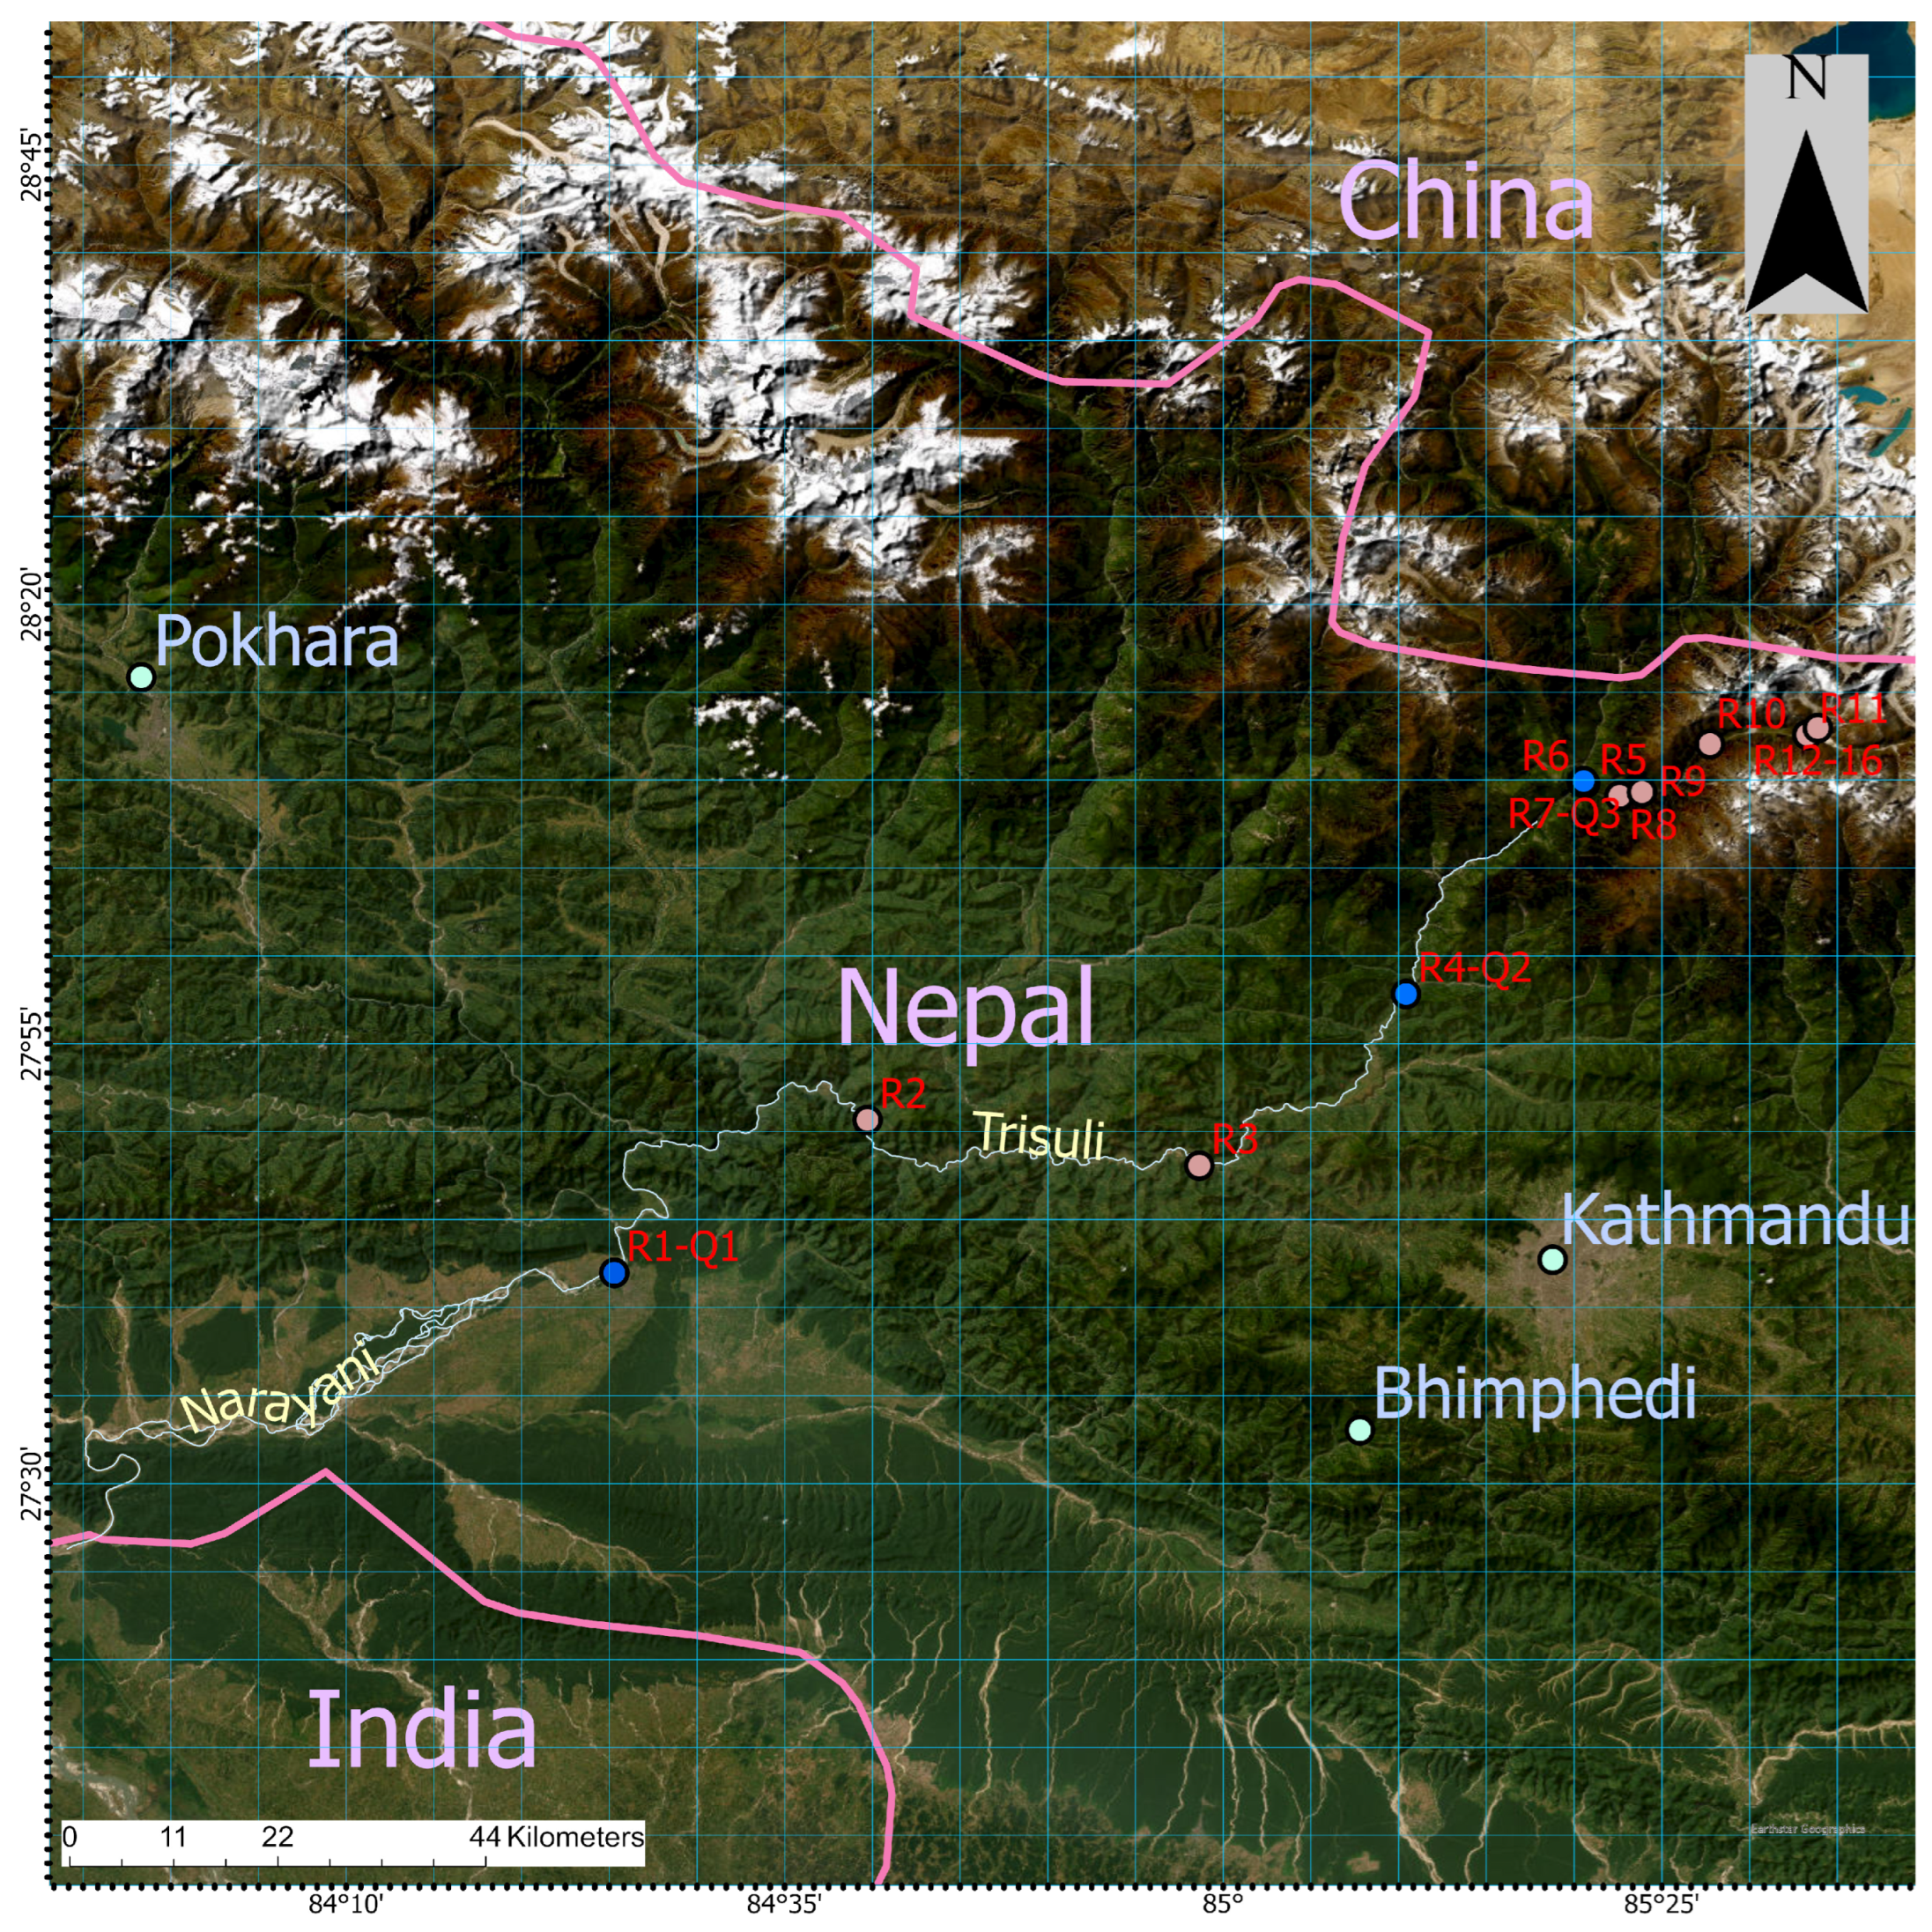
The Langtang–Narayani river system originates in the high Himalaya at the Langtang Lirung glacier (28°13′01.9″ N, 85°33′42.0″ E), located on the southern front of the Great Himalaya [23]. It stretches approximately 150 km downstream to the Narayani River at Narayanghat (27°41′58.1″ N, 84°25′17.6″ E) in Chitwan District, situated in the low-elevation floodplain of the Tarai region in central Nepal (Figure 1) [23]. The highest point of the watershed is Langtang Lirung at 7234 m above sea level (asl) within the Langtang Valley, while the lowest point is at 269 m asl at Narayanghat [23]. The drainage area spans 333 km2 for the Langtang glacier headwaters, 4640 km2 for the Trisuli Basin in the mid-mountain region (Nuwakot), and 31,795 km2 for the entire Narayani Basin [23].
The Langtang–Narayani river system is one of Nepal’s major river systems, significant for hydropower generation, irrigation, water supply, and aesthetic value. It is also a major tributary of the Ganga River, one of the world’s largest river systems, which delivers substantial dissolved and suspended loads to the Bay of Bengal [23,45,48].
The wide altitudinal gradient along the Langtang–Narayani drainage network results in significant climatic variation, including differences in temperature, precipitation, and humidity. These factors directly influence soil types and vegetation along the basin. Soil thickness increases with decreasing elevation, while vegetation shifts from dense subtropical forests in the low-elevation Siwalik region to coniferous forests in the mid-mountain and high-mountain zones. The high-elevation Himalayan region is largely barren, except for sparse shrubs. Human activity has a relatively minor impact on water quality in the high-elevation Himalayan region, with seasonal settlements primarily supported by subsistence farming and the grazing of yaks and sheep [23,49]. In contrast, human population density and agricultural activities increase substantially from the mid-mountain to the low-elevation Siwalik-Tarai region, partially impacting water quality in these areas.

2.2. Geologic Setting

The Himalayan basin in Nepal is characterized by four major geologic thrust systems: the Tethyan Sedimentary Series (TSS), High Himalayan Crystalline (HCC), Lesser Himalaya (LH), and Siwaliks [21]. High-grade metamorphic rocks, along with minor igneous rocks such as migmatites, schists, gneisses, phyllites, and granites, dominate the Langtang watershed [50]. X-ray fluorescence analysis of rock samples from the Langtang Lirung glacier debris area revealed that the bedrock consists primarily of biotite, quartz, and plagioclase, with smaller amounts of muscovite, alkali feldspar, ilmenite, and sillimanite [51]. The Lesser Himalayan region contains variably metamorphosed Precambrian sediments, including quartzo-pelitic schists, quartzites, and dolomitic carbonates [52]. The Siwalik region, formed from mid-Pliocene fluvial sediments, comprises recently uplifted deposits in the low-elevation Tarai region. Dominant soil types vary according to the altitudinal gradient. The high-elevation Langtang Valley features cryothents, cryumbrepts, and lithic soils, while central mid-mountain regions contain ustifluvents, eutrochepts, dystrochrepts, and haplumbrepts. Low-elevation Siwalik-Tarai areas are characterized by ustorthents, psamments, ustifluvents, fluvaquents, and haplaquepts [23,53]. The presence of sulfur-bearing minerals in the Himalayan basin has been documented in several studies [22,23,47,48,49,52,54,55,56,57]. Further geological details for this region are available in Bhatt et al., 2018 [23].

3. Materials and Methods

3.1. Sample Collection

Glacier meltwater samples were collected from the Langtang Lirung glacier outlet and Khimjung glacier in the high Himalayas to Narayanghat along the Langtang–Narayani River system, covering an elevation range of 169 m to 3989 m. Sampling was conducted monthly for sites from low-elevation to mid-mountain regions (R1–R7) and bimonthly for sites from mid-mountain to high Himalayas (R8–R16) during fall 2010 through winter 2011 [23]. Each water sample was filtered in the field using polycarbonate microfiber filters (0.45 µm pore size) for major ions and dissolved silica. Samples were collected in 100 mL acid-washed polyethylene bottles, refrigerated in Kathmandu, and transported frozen to the Institute of Biogeochemistry and Marine Chemistry at the University of Hamburg, Germany, for analysis. Alkalinity samples were collected in 200 mL polyethylene bottles, and 200 µL of mercuric chloride was added immediately to prevent microbial activity. Dissolved silica samples were collected in 50 mL polyethylene bottles and refrigerated until analysis.

3.2. Analytical Methods

Basic water parameters, including temperature, pH, and electrical conductivity (EC), were measured in the field using a thermometer, Hanna pH meter, and Hanna EC meter (Hanna Instruments, Woonsocket, RI, USA), respectively. Alkalinity was measured using the standard acid titration method [58] with a detection limit of 1 µeq/L. Dissolved silica (SiO2) was analyzed using a DR 3800 spectrophotometer with the molybdenum blue method (8185). Major cations (Na+, K+, Mg2+, Ca2+, and NH4+) and anions (F, Cl, NO2, NO3, and SO42−) were analyzed at the Institute of Biogeochemistry and Marine Chemistry, Hamburg University using ion chromatography. Cations were analyzed with Metrohm Compact IC Pro Cation chromatography (C4 separation column, 150 mm) and conductivity detection, while anions were analyzed with a Metrohm Compact IC Pro Anion chromatography system using a Metrosep A SUPP 5–250 analytical column and a Metrohm MSM self-regenerating suppressor (Metrohm AG, Herisau, Switzerland) [23]. Analytical errors were less than 2% for Cl, NO3, SO42−, Na+, K+, Mg2+, Ca2+, and SiO2; less than 4% for NH4+; and less than 5% for PO4–P (Bhatt et al., 2018) [23]. Water temperature, pH, alkalinity, chloride, sulfate, nitrate, phosphate, ammonium, potassium, magnesium, calcium, and silicon concentrations were used to run the PHREEQC model to estimate all inorganic carbon species [23,59].

3.3. Hydrologic Measurements

Discharge measurements were conducted by the Department of Hydrology and Meteorology [60], Government of Nepal at three locations along the Langtang–Narayani river system: at Narayanghat (Q1), a low-elevation Tarai plain, average annual discharge of 1457 m3/s; at Betrawati (Q2), a mid-mountain region, average annual discharge of 189 m3/s; and at Langtang (Q3), a high mountain region in Langtang River at Syabrubenshi, average annual discharge of 8.86 m3/s. The high discharge at Narayangh at (Q1) is attributed to contributions from major tributaries, including the Budhi Gandaki, Kali Gandaki, Marsyangdi, and Seti rivers [21,23]. Transient groundwater storage in fractured basement rock also significantly influences the discharge cycle at the base of the Himalayan river system [61]. Inorganic carbon fluxes were calculated using the average annual discharge and average concentrations of inorganic carbon species for the same year.

4. Results and Discussion

Detailed site descriptions including drainage basins, vegetation cover, geographic coordinates, elevation, water temperature, and pH along the Langtang–Narayani river system with sample locations (LNS-1 to LNS-16) are presented in Table 1. The Langtang River flows through diverse landscapes and eventually merges into Narayani River. The system is characterized by steep gradients, varied vegetation cover, and significant elevation changes (169 m to 3889 m), making it a valuable site for investigating ecological and biogeochemical dynamics. Samples from lower elevations (LNS-1 to LNS-7) were collected monthly, while those from higher elevations (LNS-8 to LNS-16) were collected once every two months due to difficulty accessing sampling sites. The sites range from 169 m at Narayanghat to 3989 m at the Lirung outlet, highlighting diverse vegetation types from tropical forests in the lowlands to sub-alpine shrubs in the high mountains. Water temperature decreases and pH generally increases with elevation, reflecting the transition from warm, tropical regions to colder, high-altitude environments (Table 1). High pH values were observed from Kyangjin at Langtang to Khimjung meltwater.
The average concentrations of inorganic carbon species along the Langtang–Narayani river system in central Nepal, measured from fall 2010 to fall of 2011, are presented in Table 2. The data clearly shows the decrease in inorganic carbon species with an increase in elevation. The partial pressure of carbon dioxide (pCO2) for seven low-elevation monitoring stations (LNS-1 to LNS-7) is several-fold higher than atmospheric values, whereas the other seven high-elevation monitoring stations (LNS-8 to LNS-16) exhibit lower pCO2 than atmospheric values. Up to nearly 27-fold higher pCO2 than the atmospheric value was measured at site LNS-6. Exceptionally very high pCO2 levels at certain mid-elevation sites (e.g., LNS-5 to LNS-7) suggest localized environmental factors, primarily relating to metamorphic activities and the presence of hot springs in the region. These findings provide insight into the spatial variability of carbon species in this Himalayan river system. Waters from low-elevation sites are supersaturated with carbon dioxide, whereas the waters of high-elevation sites are undersaturated. Our observed pCO2 values are comparable with global and regional freshwater pCO2 values except from mid-mountain section due to metamorphic activities [27,28,29,30,31,32,33].
Carbon concentrations were higher at lower-elevation sites, such as LNS-1, compared to higher-elevation sites like LNS-15 (Table 2). Notably, pCO2 values decrease with increasing elevation, transitioning from tropical to alpine environments. This pattern highlights the influence of altitude, temperature, and vegetation cover on the inorganic carbon dynamics of the river system.

4.1. Spatial Variation of Inorganic Carbon Species

4.1.1. Variation of Average DIC Along Langtang–Narayani

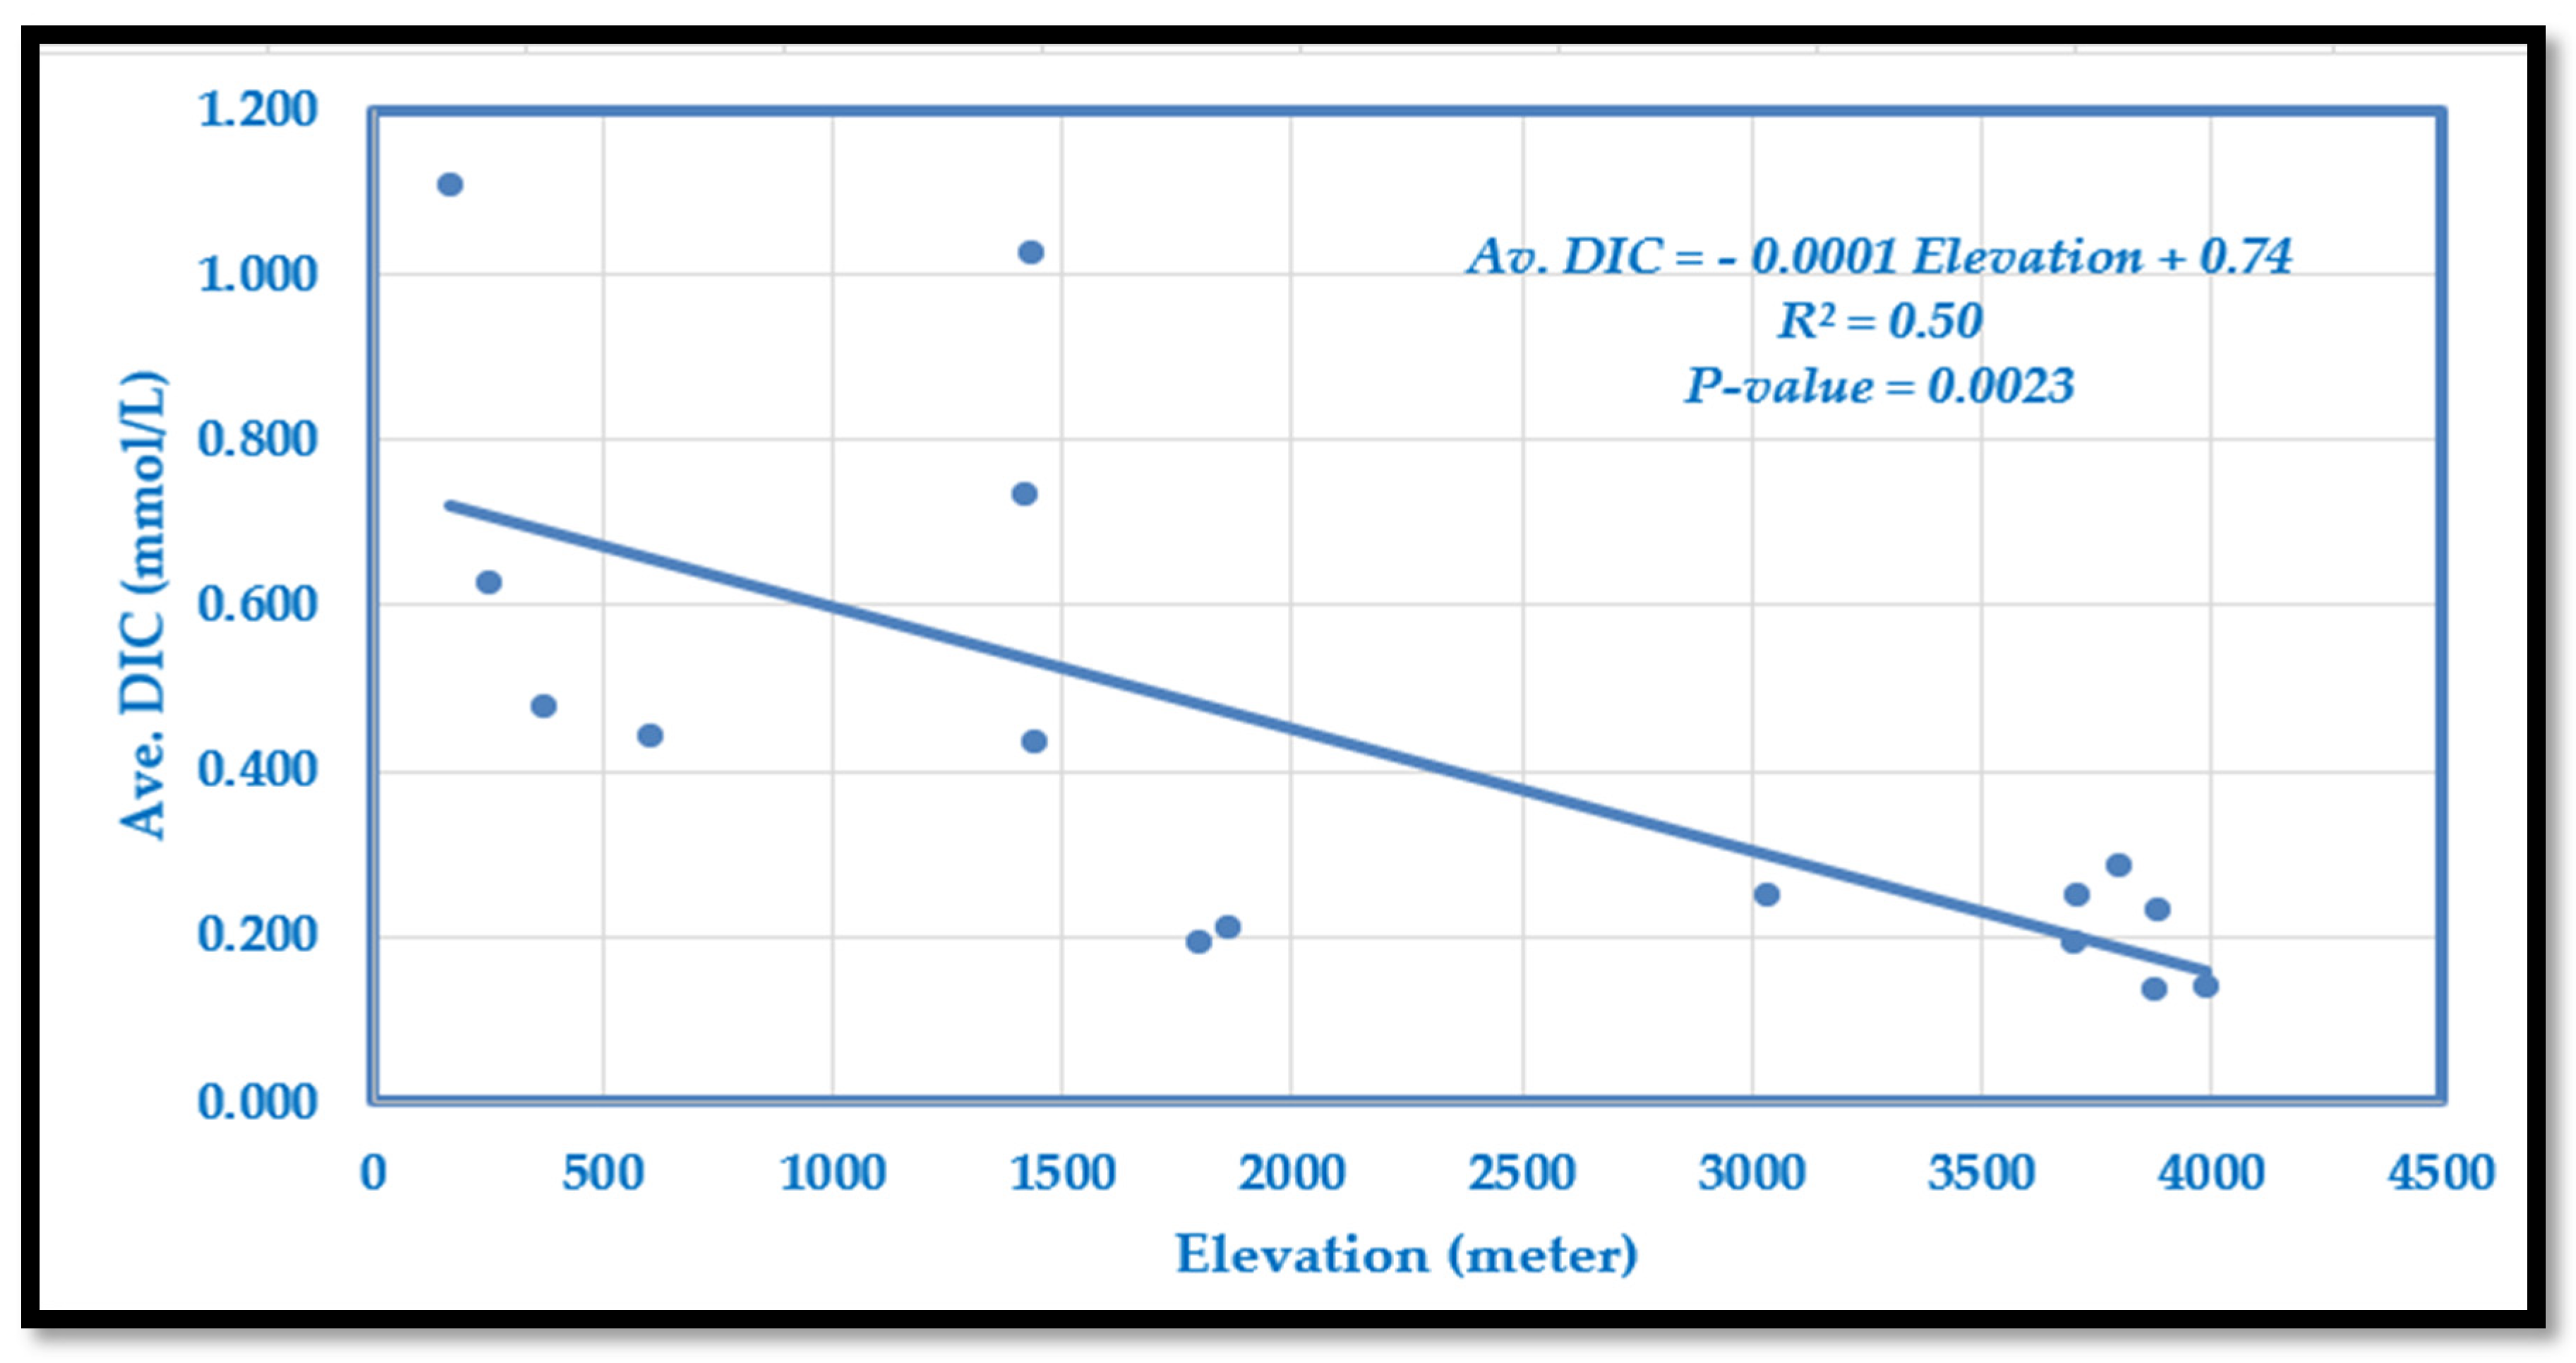
Dissolved inorganic carbon (DIC) ranges from 0.133 mmol/L at high elevations to 1.108 mmol/L in lowland Tarai (Table 2). DIC generally decreases with elevation, with some mid-mountain anomalies due to metamorphic activity (Figure 2). The relationship is described by the following model:
Average DIC = − 0.0001 × Elevation + 0.74
The slope indicates a decrease of 0.1 mmol/L per 1000 m rise in elevation. The model explains 50% of the variation (R2 = 0.50, p = 0.0023), showing a moderate but significant negative correlation between DIC and elevation.
Table 3 summarizes linear regression models predicting average dissolved inorganic carbon (DIC) using variables such as elevation, water temperature (WT), alkalinity, CO2, HCO3, pCO2, and CO32−. Model fits (R2) range from 0.50 for elevation to 1.00 for HCO3, with the multivariate Model #7 providing a perfect fit (R2 = 1.00).
Model #7 shows that DIC decreases with rising temperature (−0.001 mmol/L per °C) and higher pH (−0.009 mmol/L per unit). In contrast, DIC increases with CO2 (+0.367 mmol/L per mmol/L), HCO3 (+1.048 mmol/L per mmol/L), and pCO2 (small positive effect). These results highlight bicarbonate and CO2 as the strongest predictors of DIC, while temperature and pH act as negative influences.

4.1.2. Variation of Average Alkalinity Along Langtang–Narayani

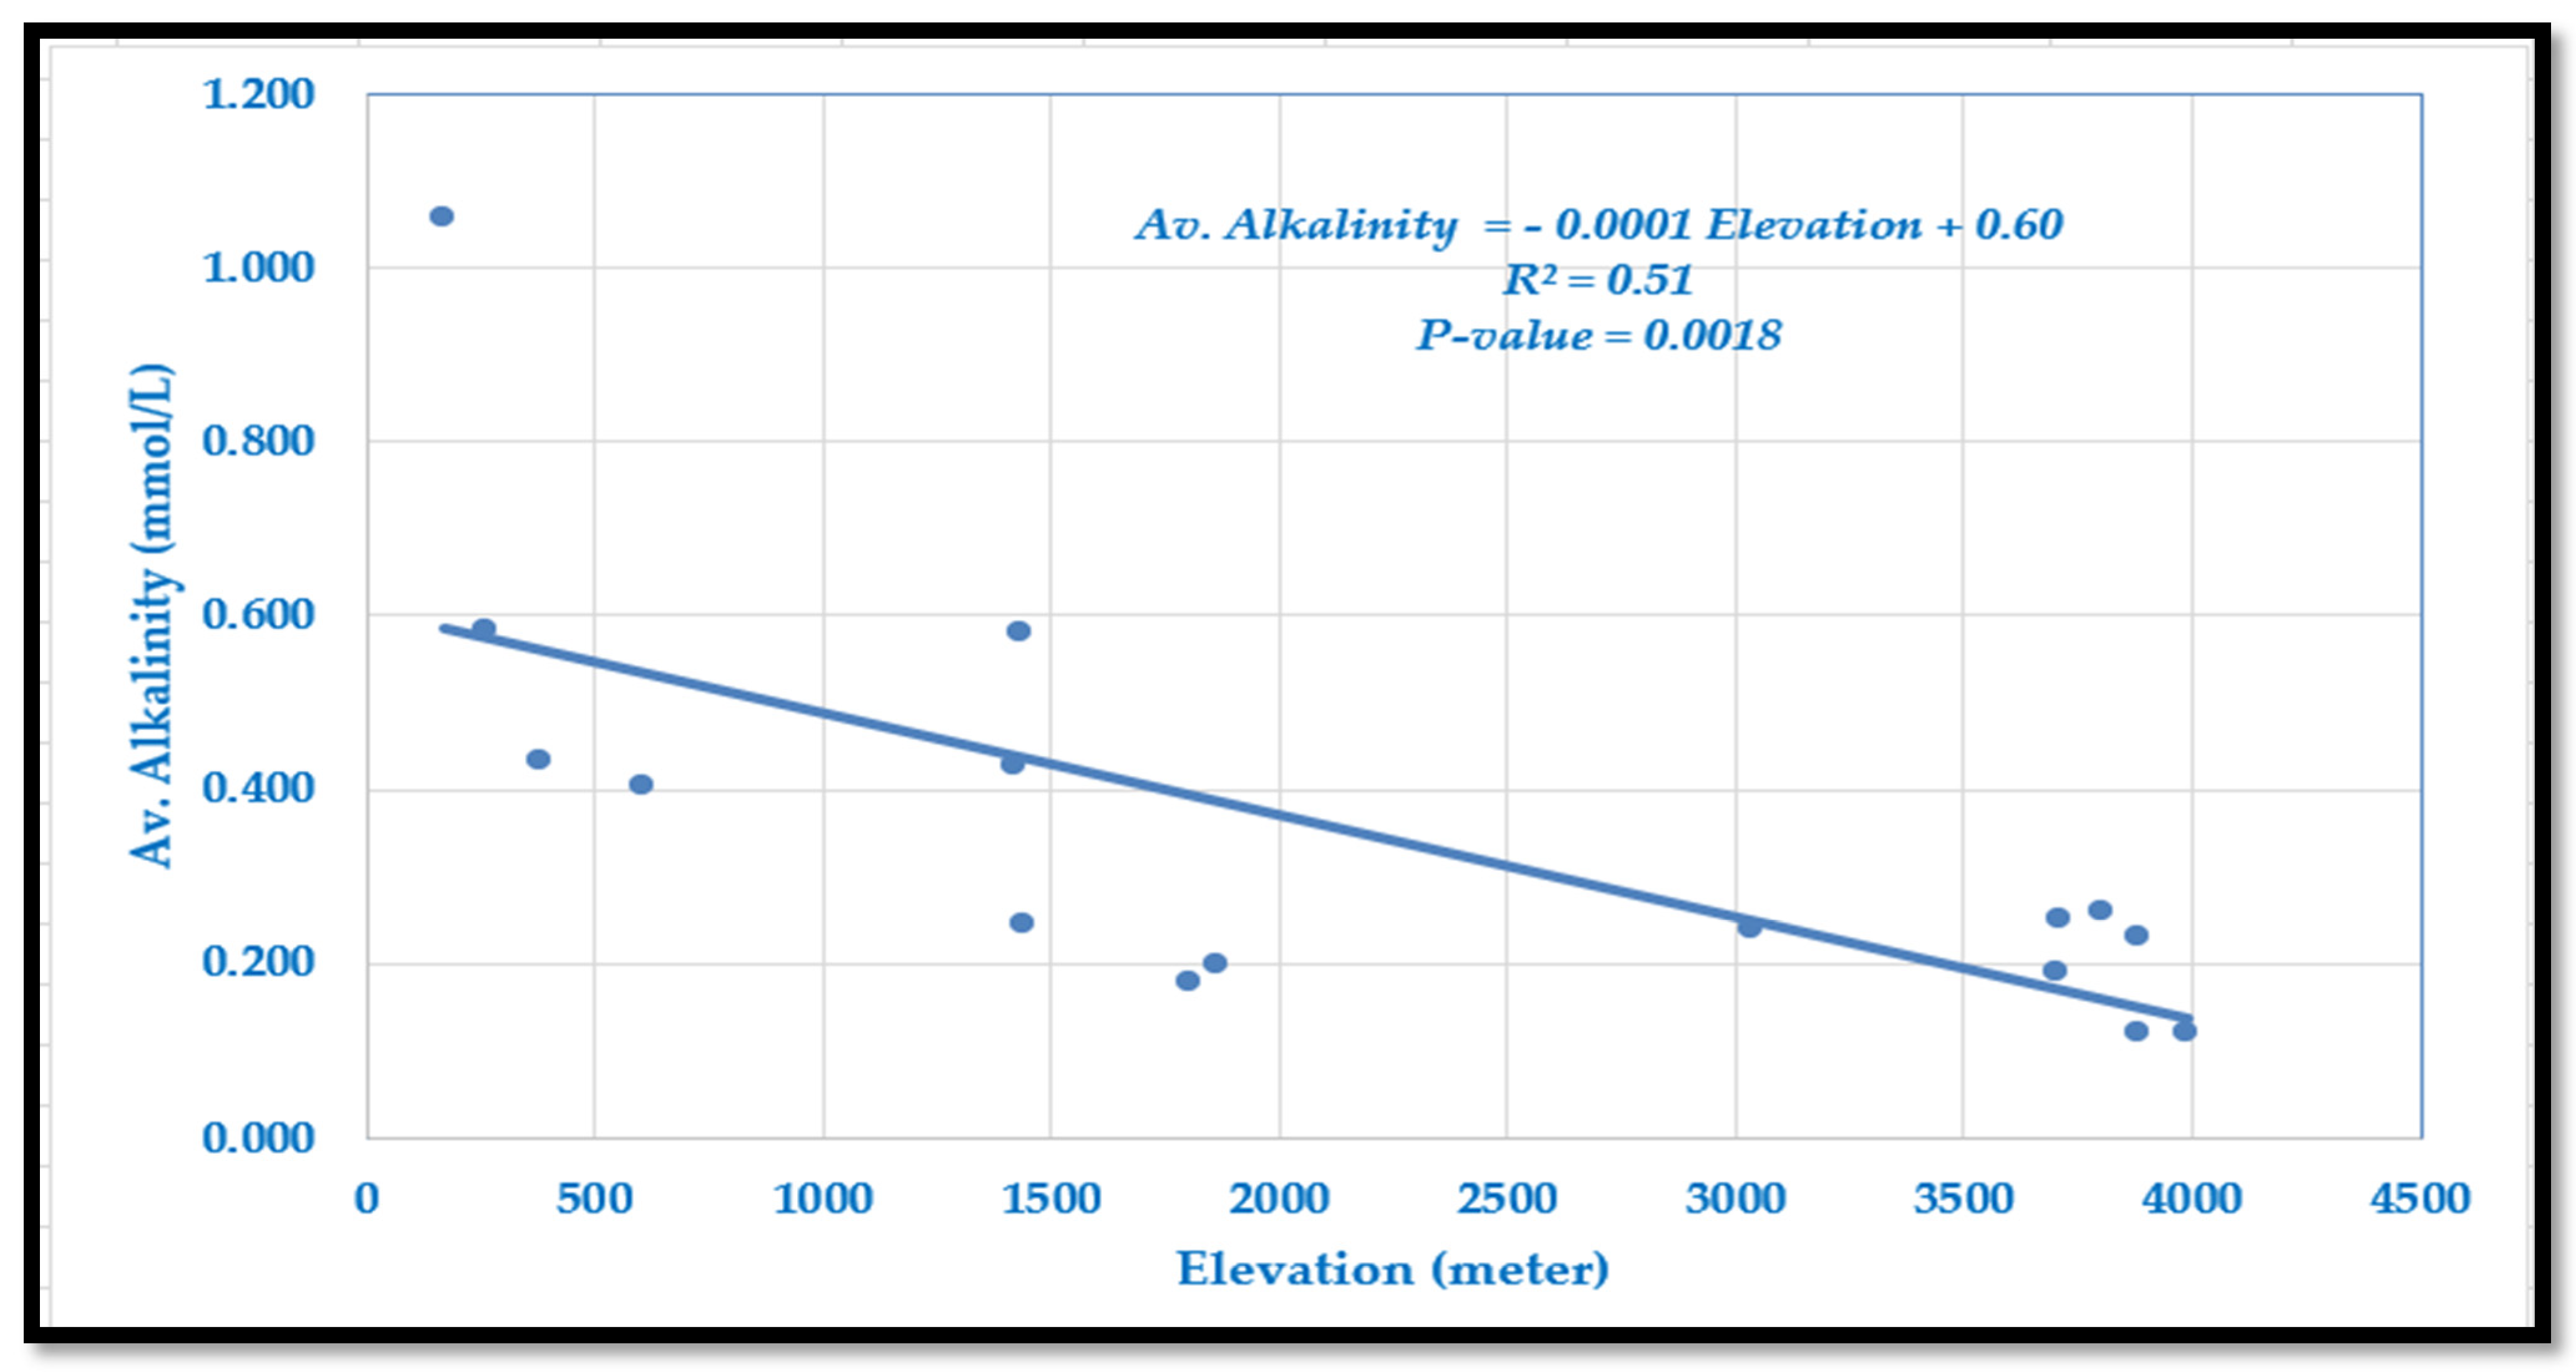
Alkalinity in the Langtang–Narayani river system ranges from 0.120 mmol/L at high elevations to 1.059 mmol/L in lowland Tarai (Figure 3). Alkalinity generally decreases with elevation, with some site-specific deviations. The relationship is described by the following model:
Average Alkalinity = −0.0001 × Elevation + 0.60
The slope indicates a decline of 0.1 mmol/L per 1000 m increase in elevation. The model explains 51% of the variation (R2 = 0.51, p = 0.0018), showing a moderate and statistically significant negative correlation. This pattern likely reflects reduced chemical weathering, lower bicarbonate concentrations, and limited ion dissolution at higher altitudes.

4.1.3. Variation of Average CO2 Along Langtang–Narayani

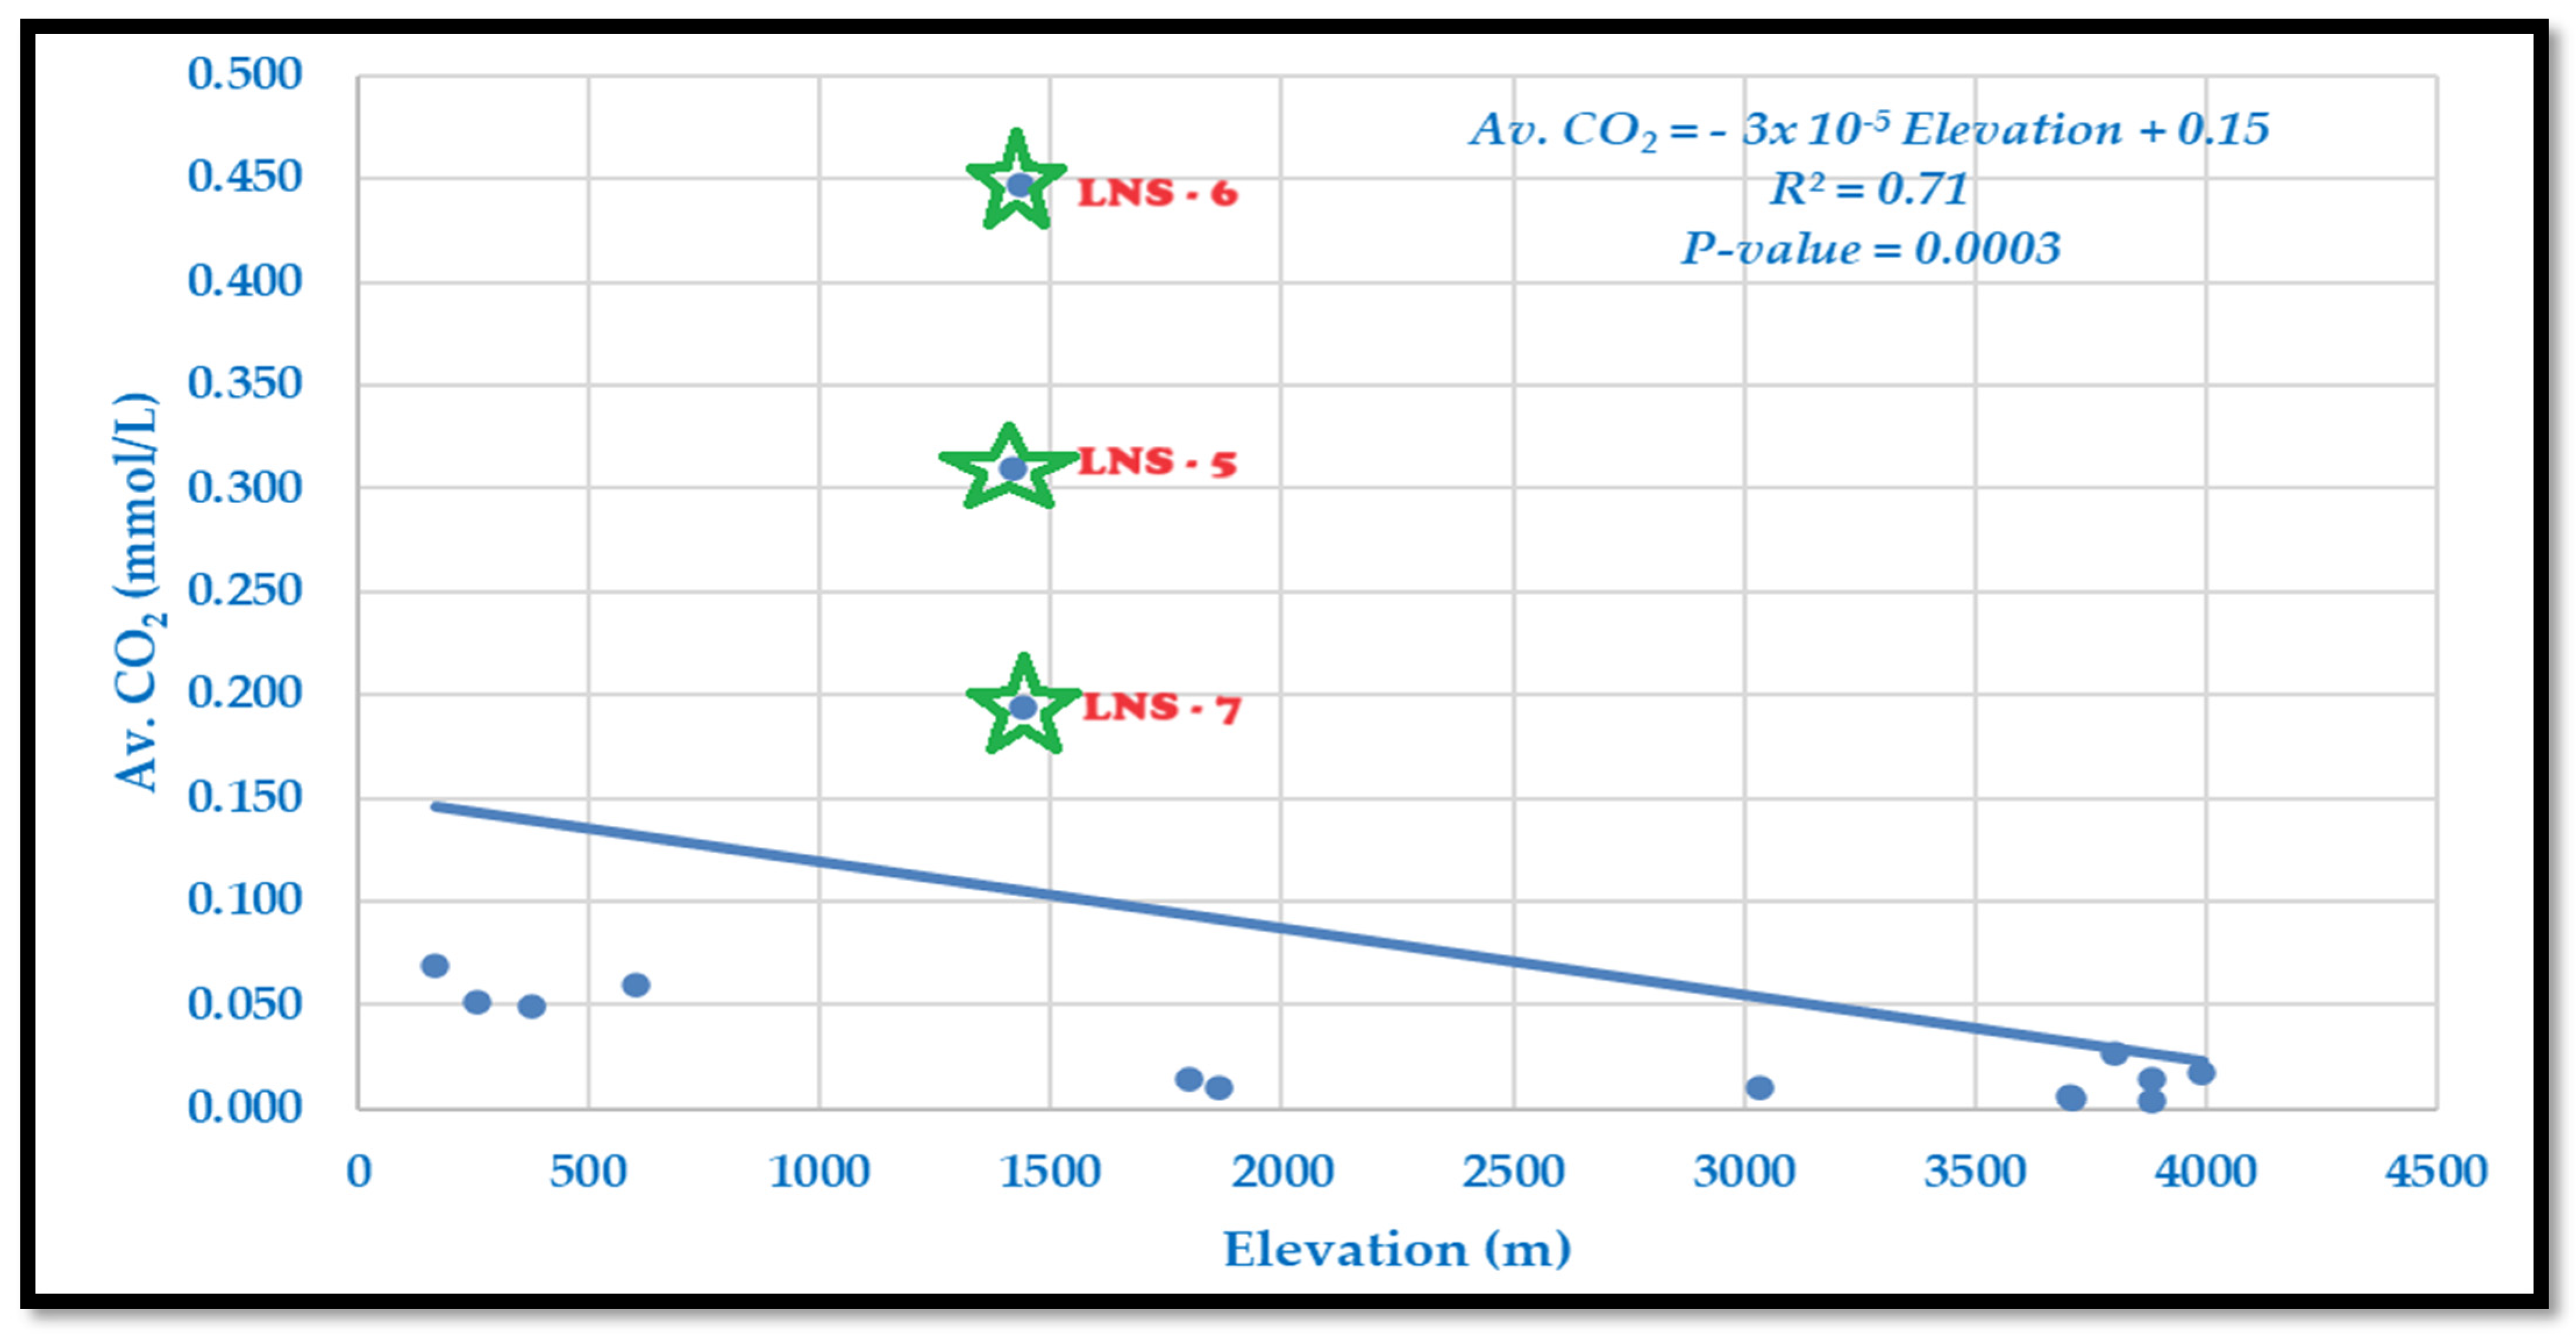
Dissolved CO2 ranges from 0.004 mmol/L at high elevations to 0.448 mmol/L at mid-elevations, with mid- and lowland sites often showing supersaturation relative to air (Table 2, Figure 4). Carbon dioxide decreases with increasing elevation, except for a few mid-mountain sites due to metamorphic activities, e.g., LNS-5 to LNS-7 (Figure 4). Mantle degassing at hotspots, subduction zone volcanoes, metamorphosis of carbonate rocks into silicate rocks, and oxidative weathering are thought to be the major sources of CO2 [62]. We found supersaturated waters with CO2 in mid-mountain and low-elevation sites but undersaturated waters in high-elevation Himalayan sites. Rivers are mostly supersaturated with CO2 relative to ambient air and considered as a net source of CO2 to the atmosphere [3,63,64]. The relationship is described by the following model:
Average CO2 = −3 × 10⁻⁵ × Elevation + 0.15
The slope indicates a decline of 0.03 mmol/L per 1000 m rise in elevation. The model explains 71% of the variation (R2 = 0.71, p = 0.0003), showing a strong and significant negative correlation. Higher CO2 in lowlands likely reflects slower flow, greater biological activity, and soil respiration, while lower CO2 levels at high elevations align with cooler temperatures, faster runoff, and reduced organic input.
Table 4 shows a collection of regression models that predict the average carbon dioxide (CO2) concentration based on various independent variables, such as elevation, water temperature (WT), pH, alkalinity (Alk), dissolved inorganic carbon (DIC), bicarbonate (HCO3), partial pressure of CO2 (pCO2), and carbonate (CO32−). Each model provides a predictive equation alongside the R2 value, indicating the proportion of variance explained. The R2 values range from 51% (CO32−) to 99% (a multivariate model incorporating elevation, CO32−, and pCO2). This table highlights the effectiveness of single-variable models and the significant improvement in prediction accuracy when multiple variables are combined, as seen in Model #7.

4.1.4. Variation of Average HCO3 Along the Langtang–Narayani River System

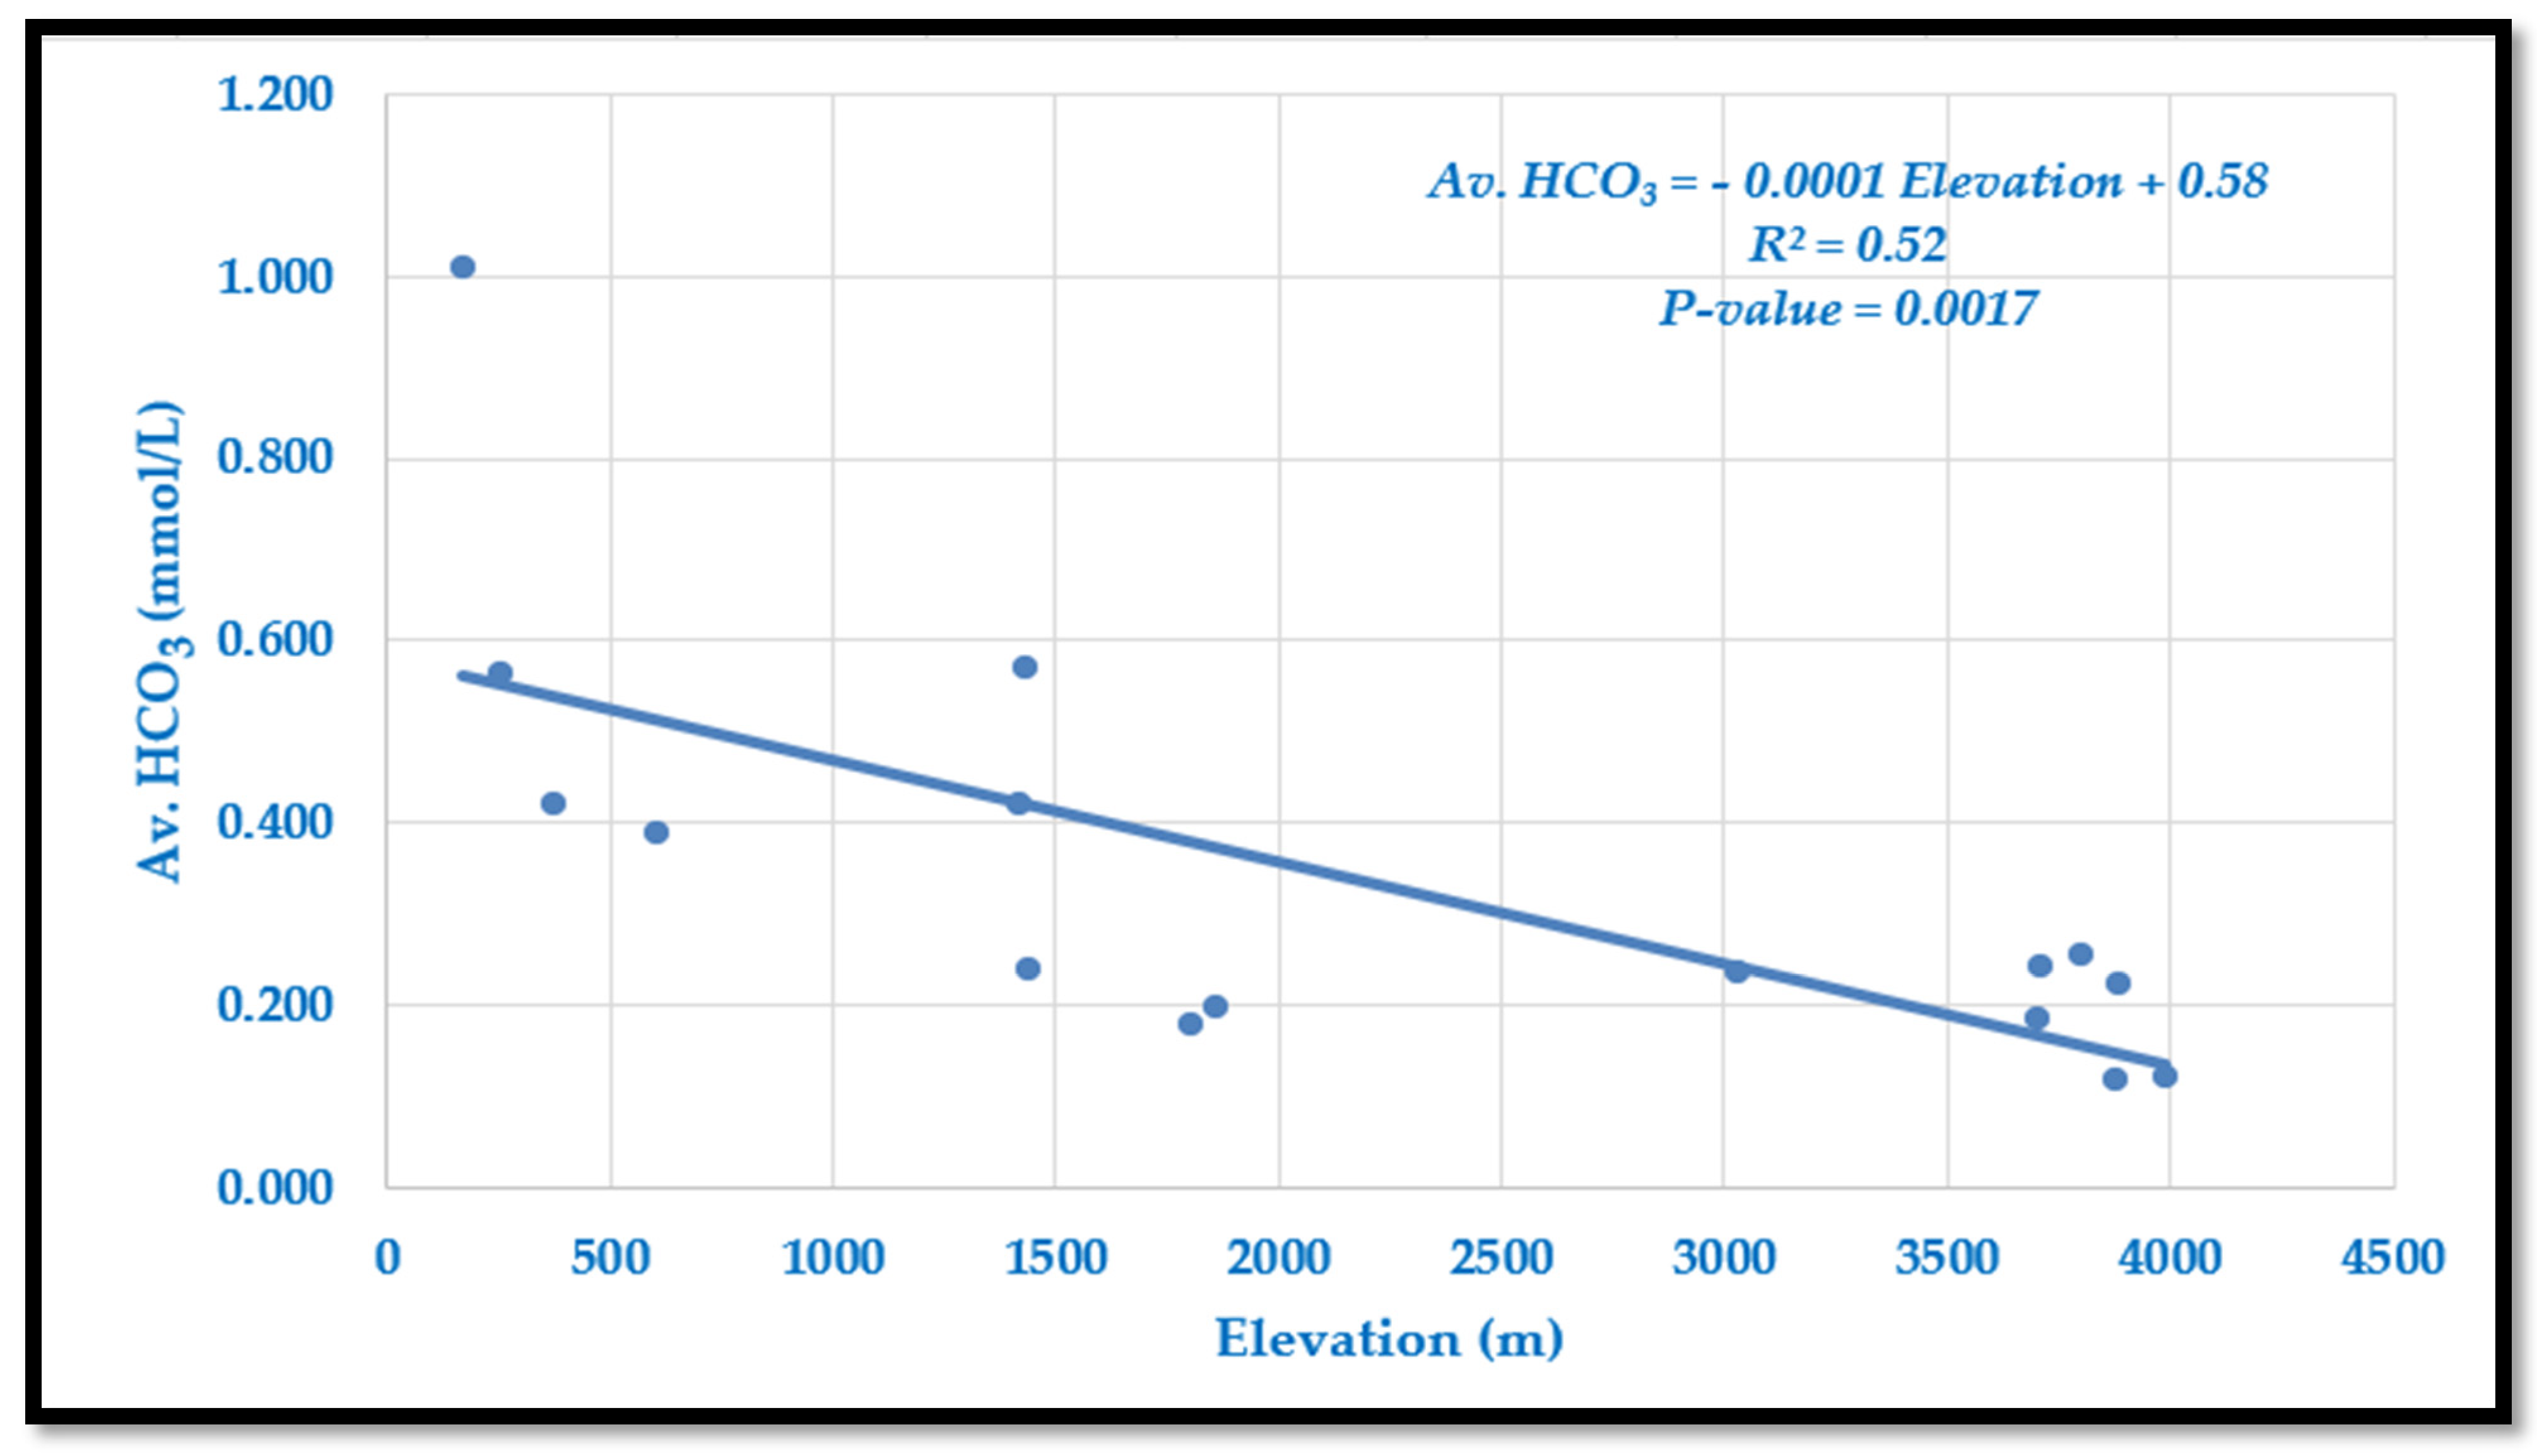
Bicarbonate (HCO3) ranges from 0.118 mmol/L at high elevations to 1.008 mmol/L in lowland Tarai (Table 2, Figure 5). Concentrations generally decrease with elevation, though mid-mountain sites (LNS-5 and LNS-6) show higher values due to enhanced weathering from metamorphic activity. The relationship is described by the following model:
Average HCO3 = −0.0001 × Elevation + 0.58
The slope indicates a decrease of 0.1 mmol/L per 1000 m increase in elevation. The model explains 52% of the variation (R2 = 0.52, p = 0.0017), showing a moderate and significant negative correlation. This pattern reflects reduced weathering and CO2 input at high altitudes, while higher concentrations in lowlands are linked to high extent of chemical weathering due to favorable condition, soil CO2 input, abundant availability of partially weathered materials transported from high elevation, and longer water–rock interaction times.
Table 5 displays regression models for predicting average bicarbonate (HCO3) concentrations using various independent variables such as elevation, alkalinity (Alk), dissolved inorganic carbon (DIC), carbon dioxide (CO2), partial pressure of CO2 (pCO2), and carbonate (CO32−). Each model provides a predictive equation along with its R2 value, which indicates the percentage of variance explained. The R2 values range from 52% (elevation) to 100% (models involving Alk or the combination of pH, Alk, and CO32−). The table highlights the strong predictive power of Alk, and the enhanced accuracy achieved through multivariate models, as seen in Model #7.

4.1.5. Variation of Average Carbonate (CO32−) Along Langtang–Narayani

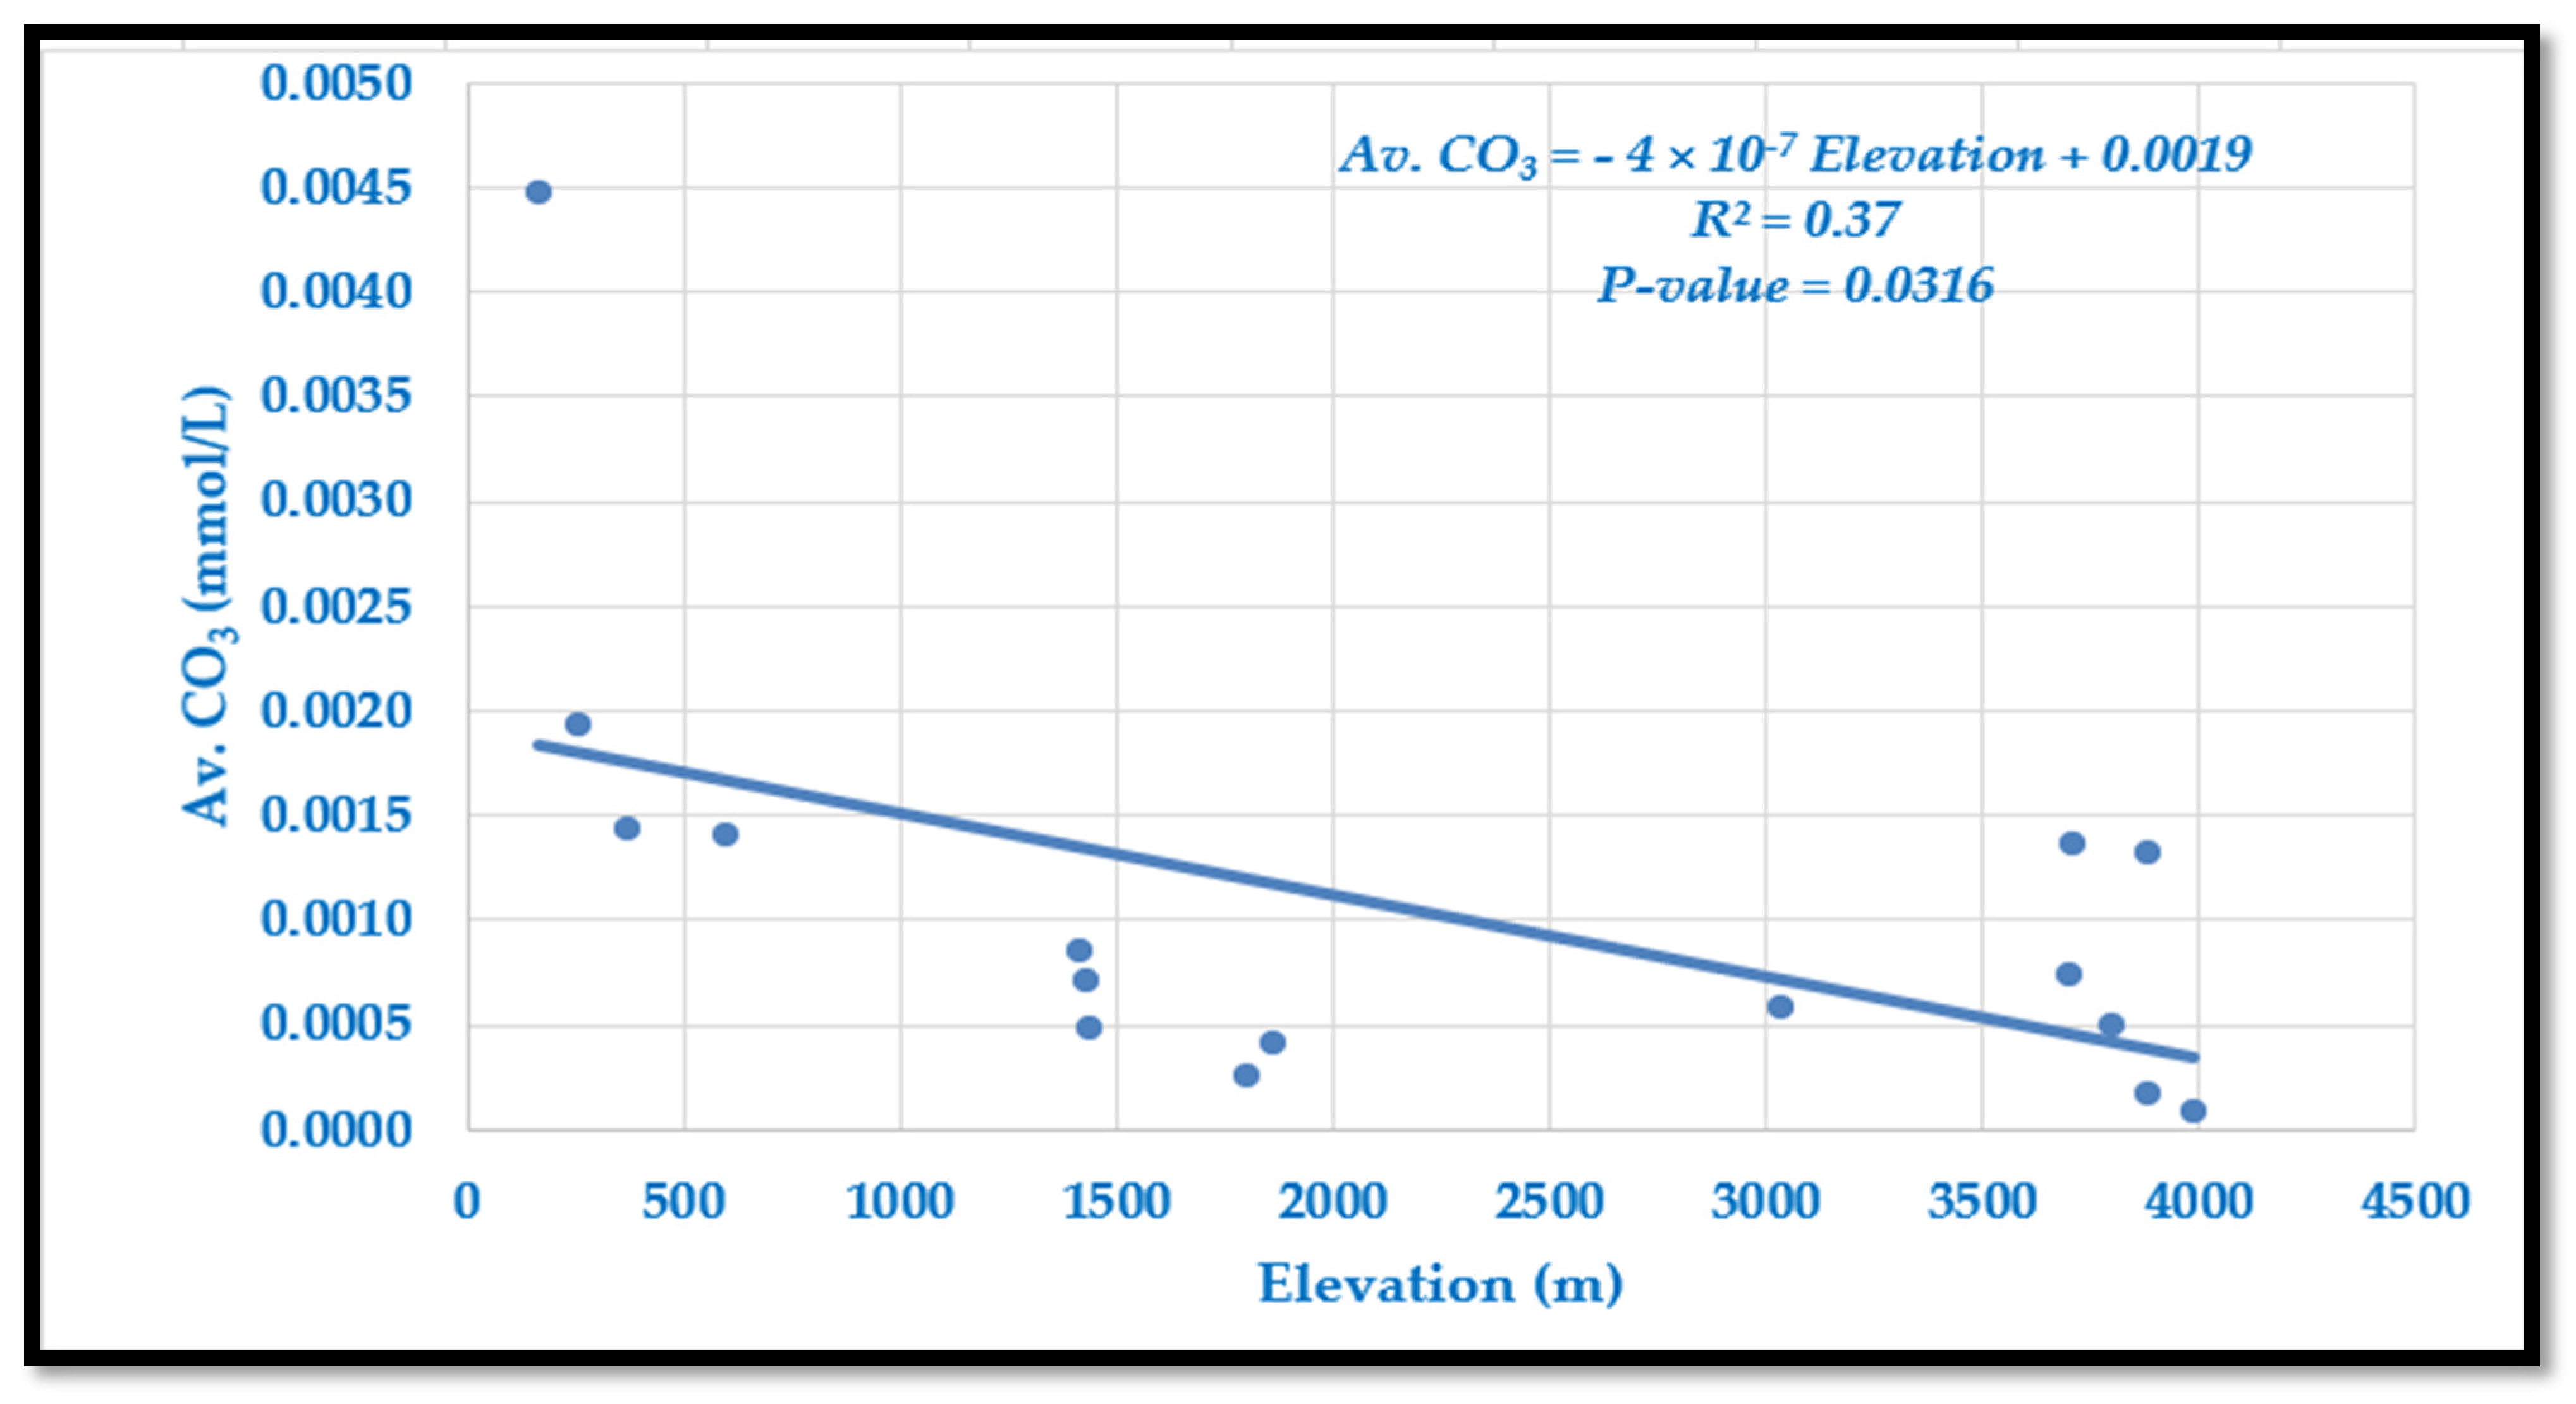
Carbonate (CO3) concentrations vary from 0.083 μmol/L at high elevations to 4.474 μmol/L in lowland Tarai (Table 2, Figure 6). Overall, CO32− decreases with elevation, though occasional site-specific deviations occur. The relationship is captured by the following model:
Average CO32− = −4.466 × 10⁻⁷ × Elevation + 0.002
The slope reflects only a minimal decline in carbonate with altitude, and the model explains 37% of the variation (R2 = 0.37, p = 0.0316), indicating a weak but statistically significant correlation. Compared with bicarbonate, carbonate forms a much smaller fraction of the buffering system, which explains its limited variability. Slightly higher concentrations in lowlands likely result from slower flows and greater rock–water interaction, while colder, fast-flowing highland streams restrict carbonate dissolution and shift the equilibrium toward bicarbonate.
Table 6 highlights the regression models for predicting average carbonate (CO32−) concentrations based on variables such as elevation, alkalinity (Alk), dissolved inorganic carbon (DIC), carbon dioxide (CO2), bicarbonate (HCO3), partial pressure of CO2 (pCO2), and pH. The table presents predictive equations and corresponding R2 values, which range from 37% (elevation) to 98% (a multivariate model using pH and HCO3). Alk, DIC, and HCO3 individually demonstrate strong predictive power with R2 values above 90%, while combining pH and HCO3 in Model #7 yields the highest accuracy. The table highlights the relative contributions of each variable to the prediction of CO32− concentrations.

4.1.6. Variation of the Partial Pressure of Carbon Dioxide (pCO2) Along Langtang–Narayani

Partial pressure of carbon dioxide (pCO2) shows a wide variation along the Langtang–Narayani river system in central Himalaya which ranges from 11,349 μatm at mid-elevation in Syabrubenshi to 56 μatm at high elevation in Khimjung glacier meltwater (Table 2). The observed pCO2 values from mid-mountain sites in our studied area appeared much higher than the reported pCO2 from lakes, streams, and rivers of local and global data sets, although these reported pCO2 values are also several-fold higher than the atmospheric value (supersaturated) [13,27,28,29,30,31,32,33,34,35,36,37]. The observed pCO2 in river water from a metamorphic site in the Himalaya basin is 4.7-fold higher than global streams and rivers [31], 14.6-fold higher than the Taihu lake in China [33], 7-fold higher than the pCO2 from Rio Icacos mainstem, 1.7-fold higher than the upper source points, and comparable with the lower source points in the flood-plain area within the tropical rainforest along the Rio Icacos basin, Luquillo Critical Zone Observatory in Puerto Rico [13]. Metamorphic decarbonation appeared as a dominant source of carbon flux in the southern Tibetan region [39]. Eveans et al. (2008) [41] found a 4-fold higher rate of CO2 degassing in geothermal systems than from the weathering uptake from the central Nepal Himalaya. Such wide variations of pCO2 in surface waters reflect the importance of metamorphic activities in carbon dynamics.
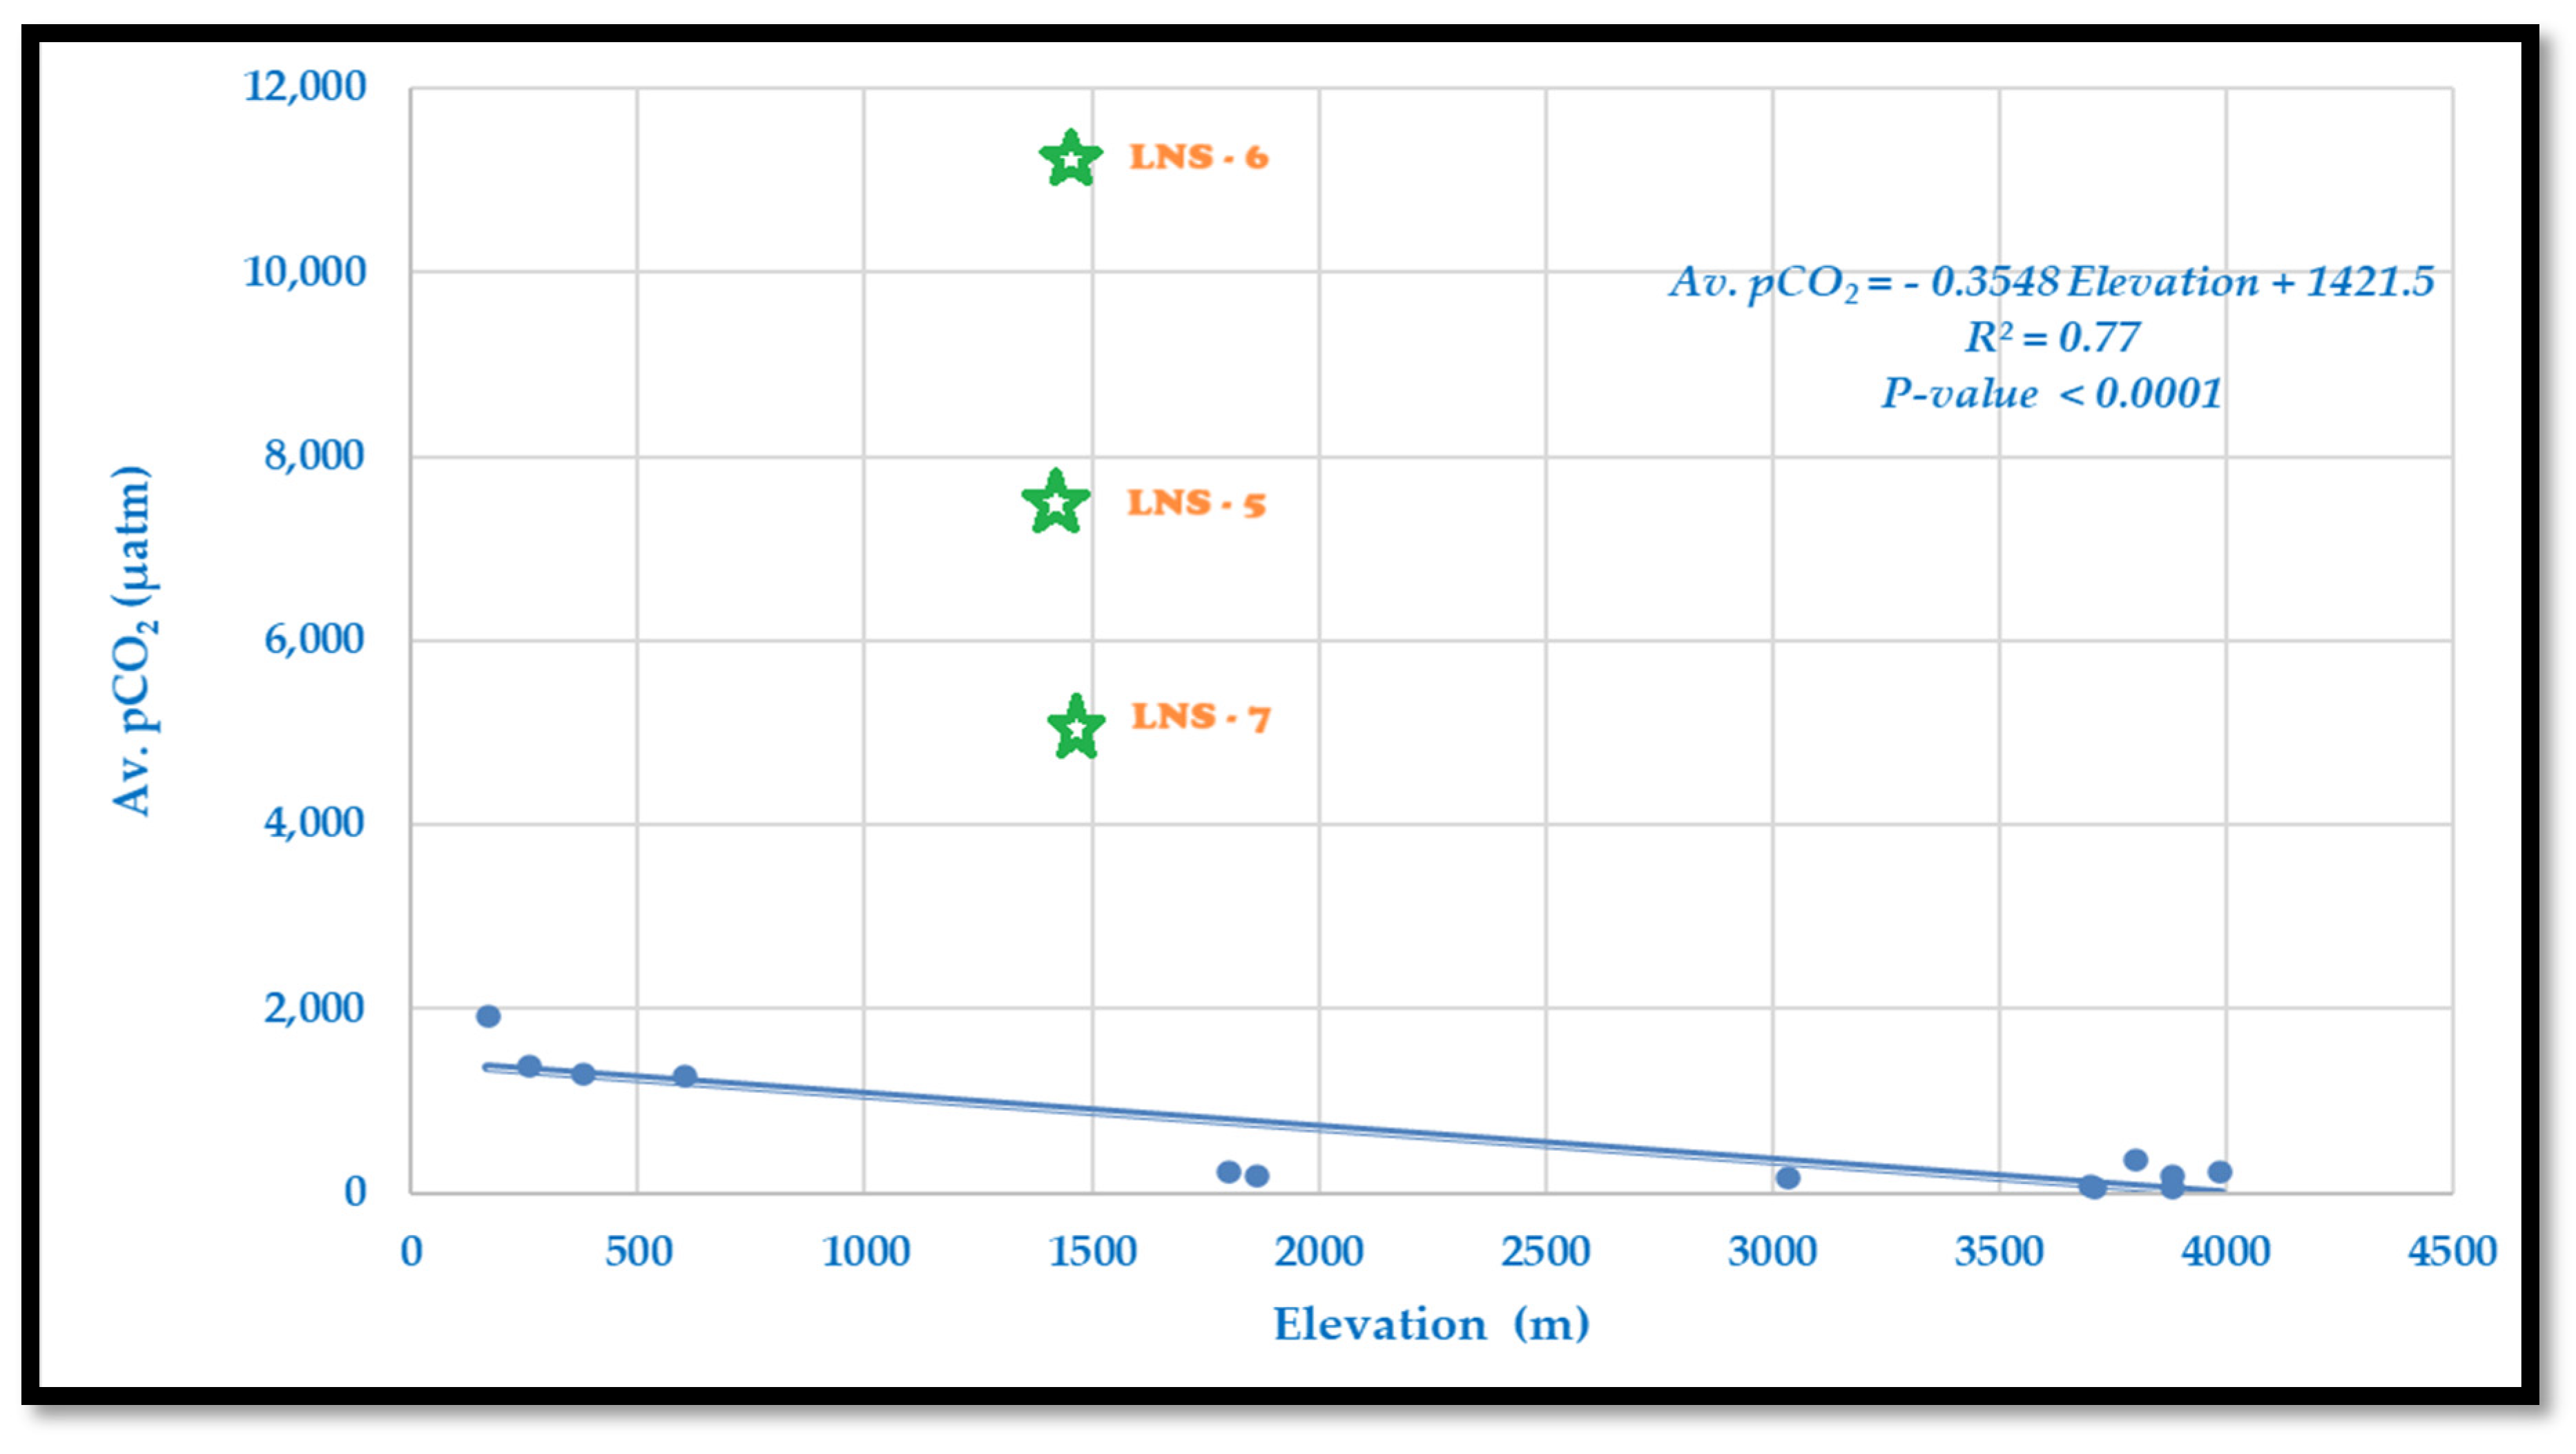
The pCO2 decreases with increasing elevation, except for a few mid-mountain sites due to metamorphic activities, e.g., LNS-5 to LNS-7, which are considered as an outlier (Figure 7). We found the descriptive model of the given linear equation as follows:
Average pCO2 = −0.3548 Elevation + 1421.5
Equation (6) describes the relationship between the average partial pressure of carbon dioxide (pCO2) in river water (in micro atmospheres, µatm) and elevation (in meters). Below is a detailed analysis of this relationship. The slope of −0.3548 indicates that for every 1 m increase in elevation, the average pCO2 decreases by approximately 0.3548 µatm. This suggests a significant reduction in dissolved pCO2 concentrations at higher elevations, likely driven by environmental factors such as water turbulence, temperature changes, and gas exchange rates. The intercept of 1421.5 µatm represents the predicted average pCO2 at sea level (elevation = 0 m). This relatively high value reflects the abundance of pCO2 in lowland waters, where biological and chemical processes contribute to its accumulation. The R2 value of 0.77 indicates that 77% of the variability in average pCO2 is explained by elevation. This strong correlation suggests that elevation is a dominant factor influencing pCO2 levels in the studied river system.
The decline in pCO2 with elevation can be attributed to turbulent water flow at higher elevations, which increases surface area and speeds up CO2 degassing into the atmosphere, and colder water temperatures at higher altitudes, which reduces microbial respiration, resulting in less CO2 production. Liu et al. (2022) [65] highlights the importance of hydrology to transfer terrestrial carbon to the atmosphere through global drainage networks, and the authors also described soil respiration rate as the best predictor for riverine pCO2 linking between soil carbon dynamics and watershed carbon loss through CO2 evasion from the water surface. Organic matter decomposition, a key source of CO2, is often lower at higher elevations due to limited vegetation and slower biological activity. Elevated pCO2 levels at low altitudes are likely influenced by greater plant and microbial respiration in lowland regions, contributing to higher CO2 production. The terrestrial respiration and aquatic respiration both contribute equally to pCO2 efflux, based on the research from Swedish watersheds [28]. Lowland rivers may receive groundwater enriched in CO2, further increasing pCO2 levels. The strong R2 value highlights elevation as a critical factor in controlling riverine pCO2 variability. The analysis yielded a p-value of <0.0001, providing strong evidence against the null hypothesis (H0) of no relationship between pCO2. This result supports the inclusion of elevation as a predictor in the model. This is consistent with the expectation that elevation influences water turbulence, temperature, and interactions with atmospheric CO2.
Table 7 provides regression models predicting average partial pressure of carbon dioxide (pCO2) using various independent variables, including elevation, water temperature (WT), alkalinity (Alk), dissolved inorganic carbon (DIC), bicarbonate (HCO3), carbon dioxide (CO2), and carbonate (CO32−). The models present predictive equations along with R2 values, which indicate the proportion of variance explained by each model. The R2 values range from 64% (CO32−) to 99% (a multivariate model with WT, CO2, and CO32−). Among individual predictors, CO2 exhibits the strongest predictive power with R2 = 97%. The multivariate model (Model #7) achieves the highest accuracy, highlighting the combined influence of WT, CO2, and CO32− in estimating pCO2.

4.2. Descriptive Correlation Analysis of Measured Parameters

Table 8 presents the results of a Pearson’s correlation analysis examining the relationships between elevation and key carbonate chemistry variables (Alk, DIC, CO2, HCO3, CO32−, and pCO2) along the Langtang–Narayani river system.

4.2.1. Influence of Elevation on Other Parameters

Negative correlations were observed for the water temperature, alkalinity, DIC, HCO3, CO32−, CO2, and pCO2, such as with water temperature (r = −0.971, p < 0.01); higher elevations correspond to significantly cooler water temperatures, consistent with typical climatic patterns. With alkalinity (r = −0.735, p < 0.01), DIC (r = −0.751, p < 0.01), HCO3 (r = −0.737, p < 0.01), and CO32− (r = −0.610, p < 0.05), these parameters decrease at higher altitudes, reflecting the influence of temperature and pressure on carbonate equilibria and mineral dissolution rates. With CO2 (r = −0.843, p < 0.01) and pCO2 (r = −0.876, p < 0.01), the reduction in dissolved CO2 with elevation may be tied to changes in gas solubility and atmospheric pressure.

4.2.2. Carbonate Chemistry Interactions

Highly interrelated parameters include alkalinity and HCO3 (r = 1.000, p < 0.01), and these variables are essentially identical under the studied conditions. DIC and HCO3 (r = 0.999, p < 0.01) showing strong coupling highlights the dominance of bicarbonate buffering in the carbonate system. CO2 and pCO2 coupling (r = 0.983, p < 0.01) indicates tight regulation between dissolved CO2 and its partial pressure. CO32− shows strong positive correlations with alkalinity (r = 0.964, p < 0.01) and DIC (r = 0.954, p < 0.01), reflecting its dependence on the overall carbonate equilibrium. The CO32− shows moderate correlation with CO2 (r = 0.713, p < 0.01), suggesting interplay between dissolved CO2 and carbonate ion concentrations.
The strong negative correlations of elevation with temperature, alkalinity, and carbonate chemistry parameters emphasize the role of altitude in regulating geochemical processes. Temperature strongly influences carbonate system dynamics, promoting higher dissolved carbon and alkalinity at lower elevations. Tight coupling among alkalinity, DIC, and HCO3 highlights the buffering role of bicarbonates, while the pH–carbonate relationship reinforces the balance between acidity and dissolved carbon species. These relationships reflect the interconnected influence of physical and chemical factors on water composition. Future research could explore the specific drivers of variability (e.g., biological activity or mineral weathering) in different altitudinal and thermal contexts.

4.3. Seasonal Variations of Inorganic Carbon Species Along Langtang–Narayani

Seasonal variation of inorganic carbon species measured along the Langtang–Narayani river system in central Nepal Himalaya from fall 2010 to fall 2011 are presented in Table 9. The data includes alkalinity, dissolved inorganic carbon (DIC), carbon dioxide (CO2), bicarbonate (HCO3), carbonate (CO32−), and partial pressure of CO2 (pCO2) across 16 sampling locations during pre-monsoon, monsoon, and post-monsoon periods. Measurements are reported as means with standard deviations. Table 9 reveals the substantial seasonal and spatial variability of carbon species including pCO2 across seasons, reflecting the significant role of climatic, hydrological, and geochemical processes in the river system.

4.3.1. The Temporal Variation of the DIC

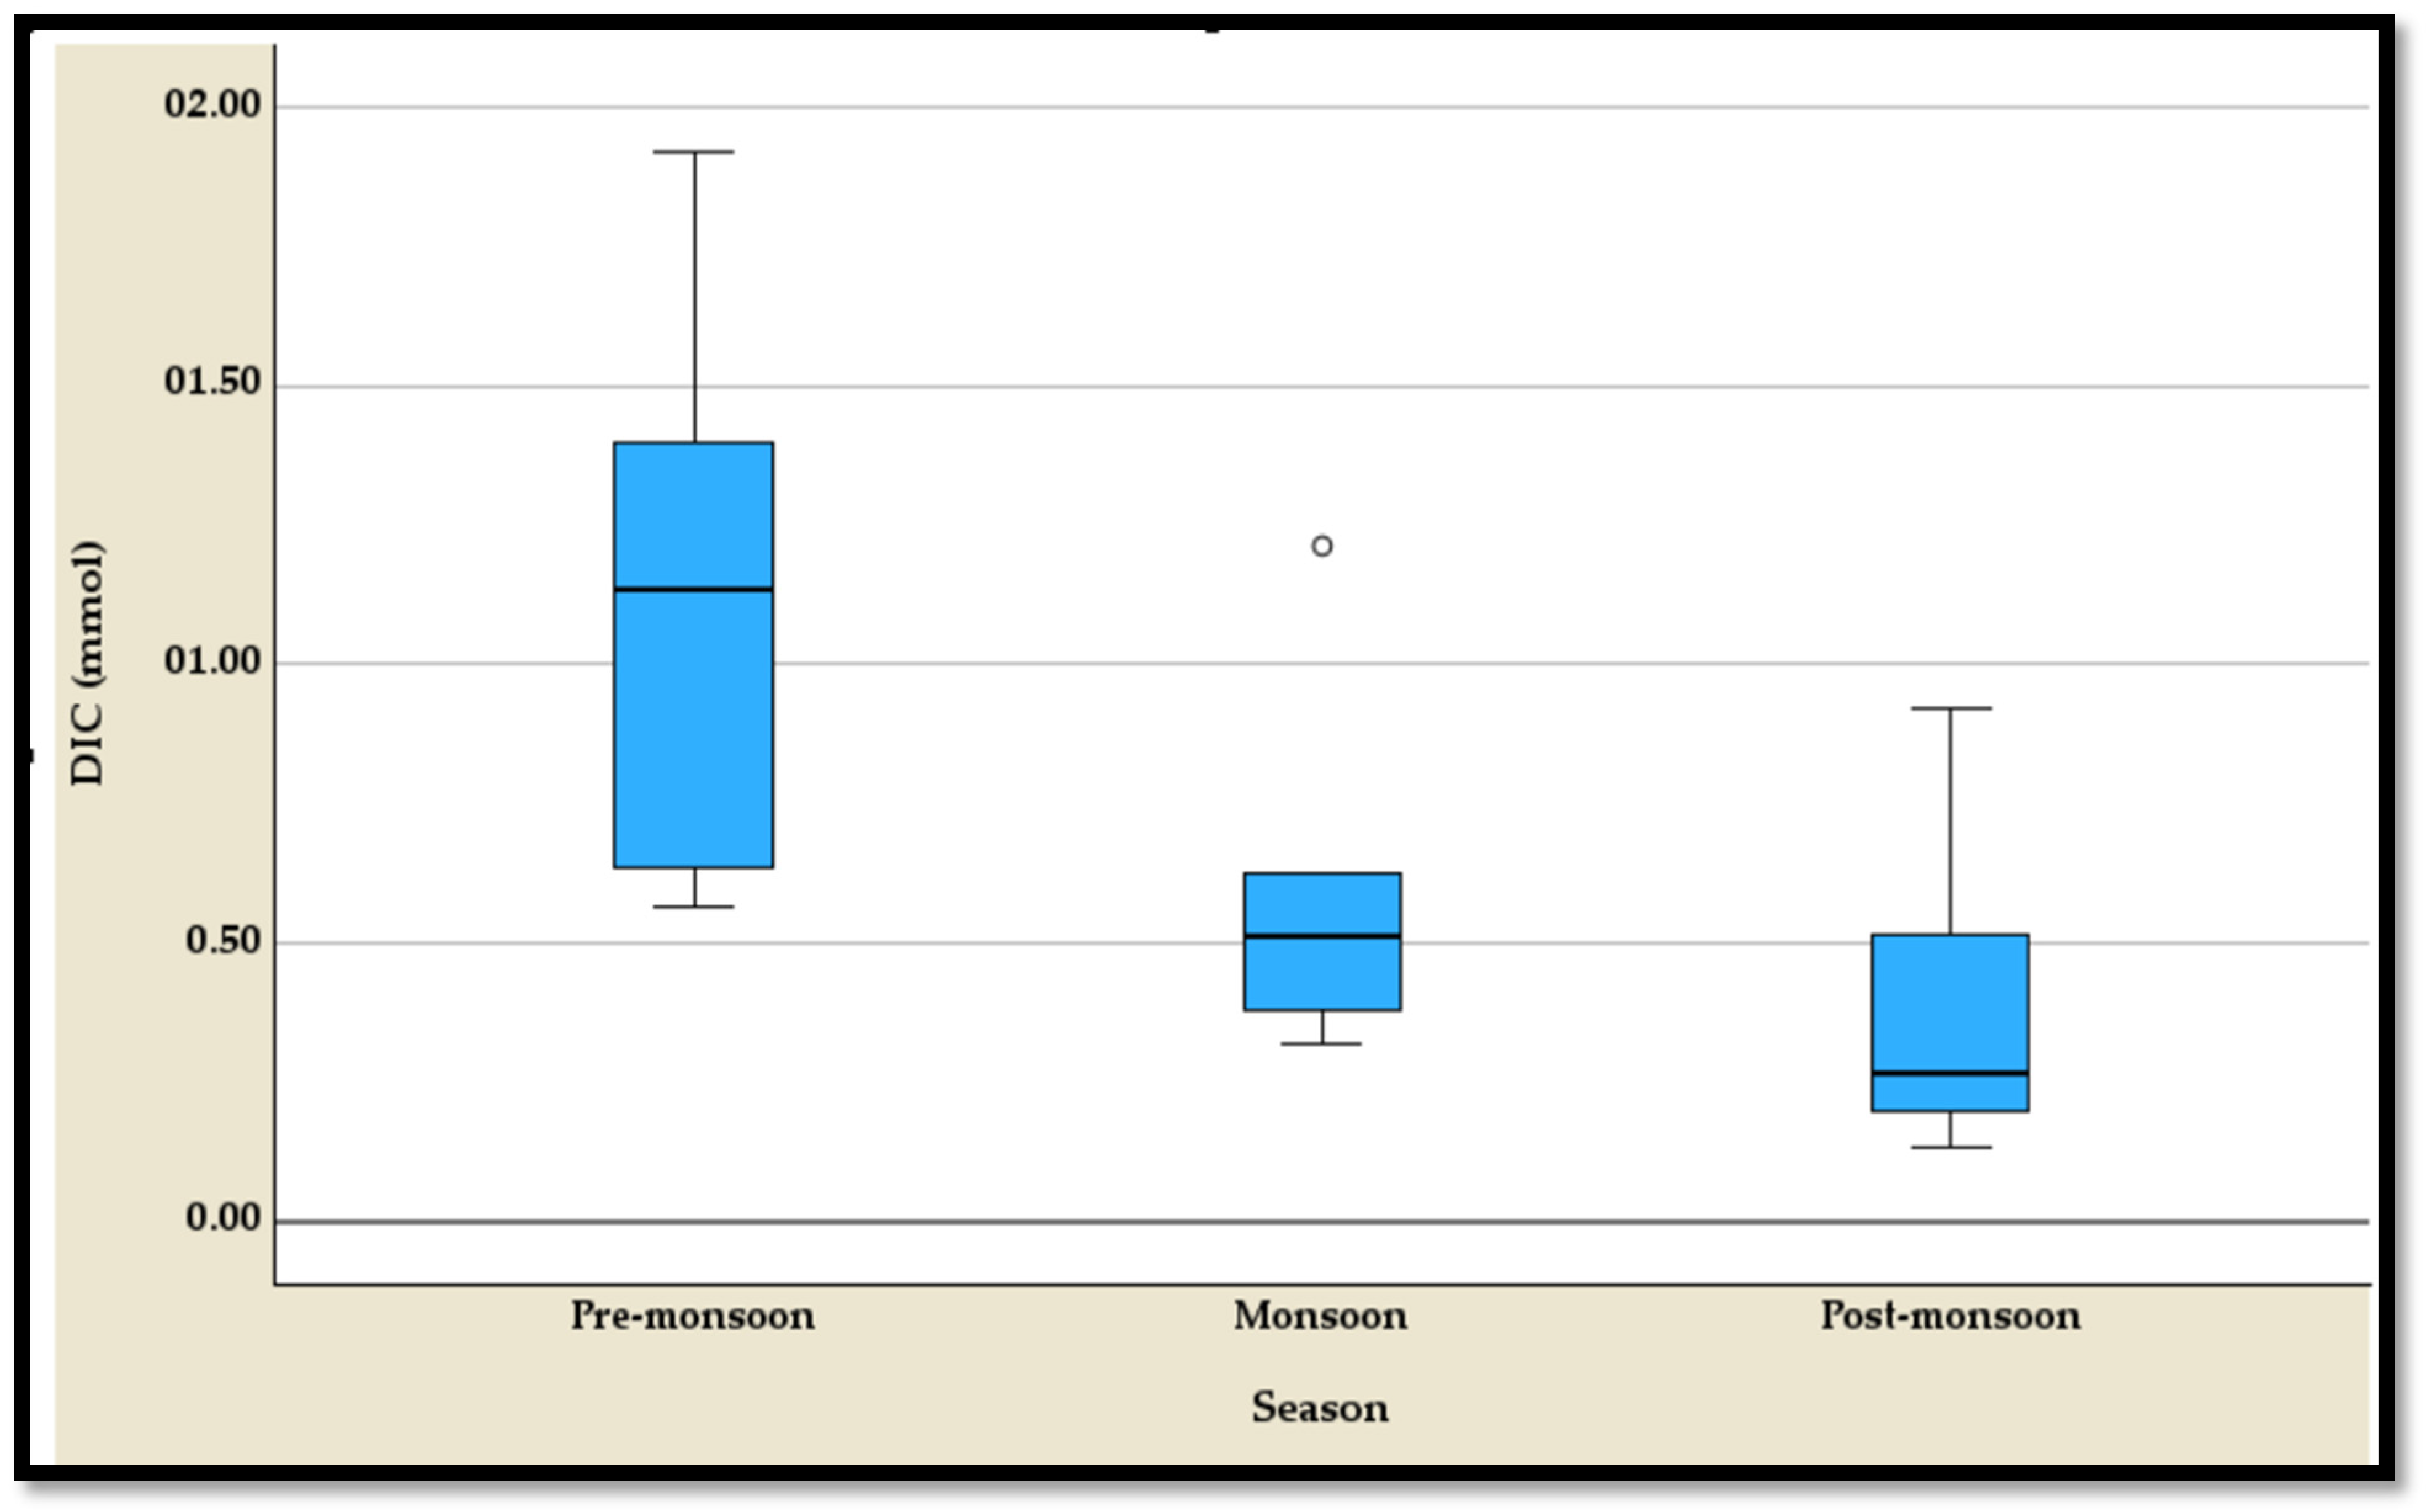
The temporal variation of the dissolved inorganic carbon (DIC) exhibits distinct seasonal patterns, as highlighted by the five-number summary and boxplot (Table S1; Figure 8). During the pre-monsoon season, DIC values are the highest, ranging from a minimum of 0.564 mmol to a maximum of 1.917 mmol, with a median of 1.135 mmol (Table S1). This season shows a wide spread of values, indicating elevated carbon concentrations. In contrast, the monsoon season experiences a significant drop in DIC levels, with a narrower range from 0.317 mmol to 1.212 mmol and a median of 0.511 mmol (Table S1). However, an outlier is observed in this season, reflecting occasional deviations from typical concentrations. The post-monsoon season records the lowest DIC levels overall, ranging from 0.133 mmol to 0.921 mmol and a median of 0.267 mmol, suggesting a significant depletion in dissolved carbon post rainfall (Table S1). The progression from pre-monsoon to post-monsoon illustrates a clear decline in DIC, likely driven by seasonal hydrological and ecological dynamics.

4.3.2. The Temporal Variation of the HCO3

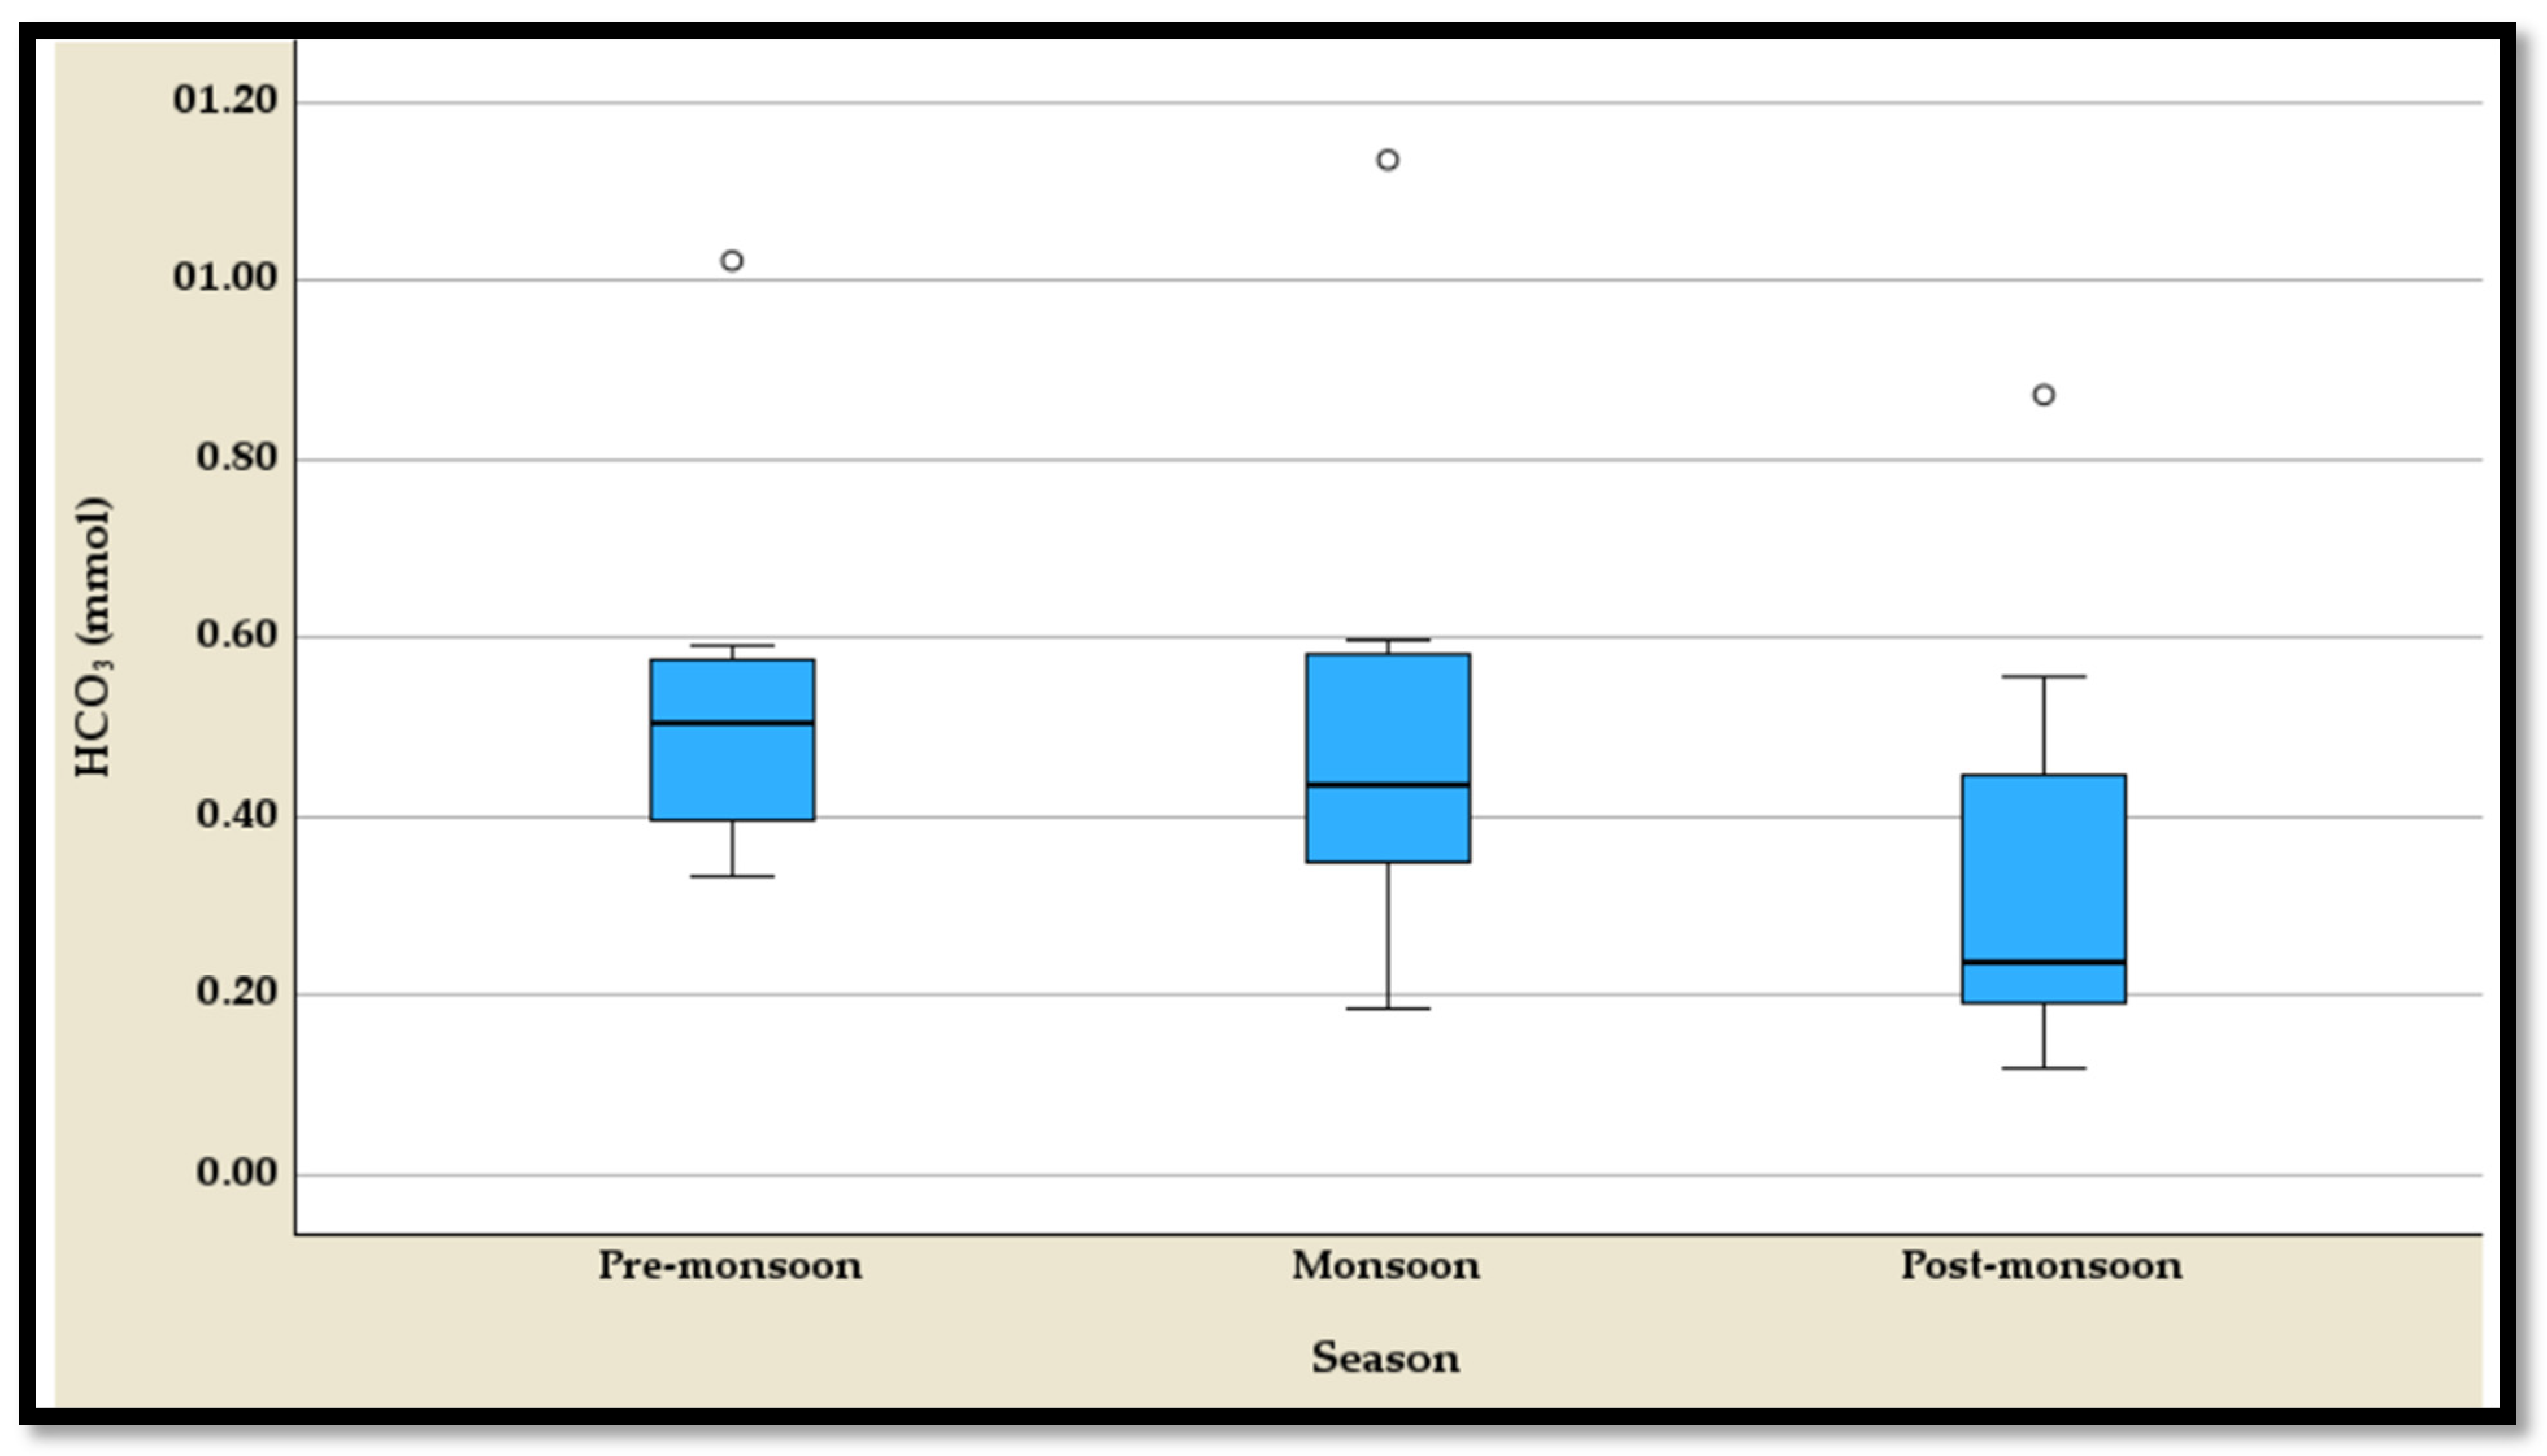
The temporal variation of bicarbonate (HCO3) concentrations reveals distinct seasonal differences, as shown by the five-number summary and corresponding boxplots, each displaying an outlier (Table S2, Figure 9). During the pre-monsoon season, HCO3 levels are the highest, ranging from 0.334 mmol to 1.022 mmol, with a median of 0.506 mmol (Table S2). This season exhibits relatively higher concentrations, reflecting increased bicarbonate availability. The monsoon season shows a slight reduction in HCO3 levels, with a range from 0.186 mmol to 1.135 mmol and a median of 0.434 mmol, though the interquartile range (Q1 to Q3) is comparable to the pre-monsoon period (Table S2). The post-monsoon season has the lowest HCO3 concentrations, spanning from 0.118 mmol to 0.872 mmol, with a median of 0.238 mmol, indicating significant bicarbonate depletion after the monsoon (Table S2). Each season features an outlier, suggesting occasional anomalous variations in HCO3 levels that deviate from the typical seasonal patterns. This trend reflects the interplay of hydrological and biogeochemical processes influencing bicarbonate dynamics throughout the year.

4.3.3. The Temporal Variation of the CO32−

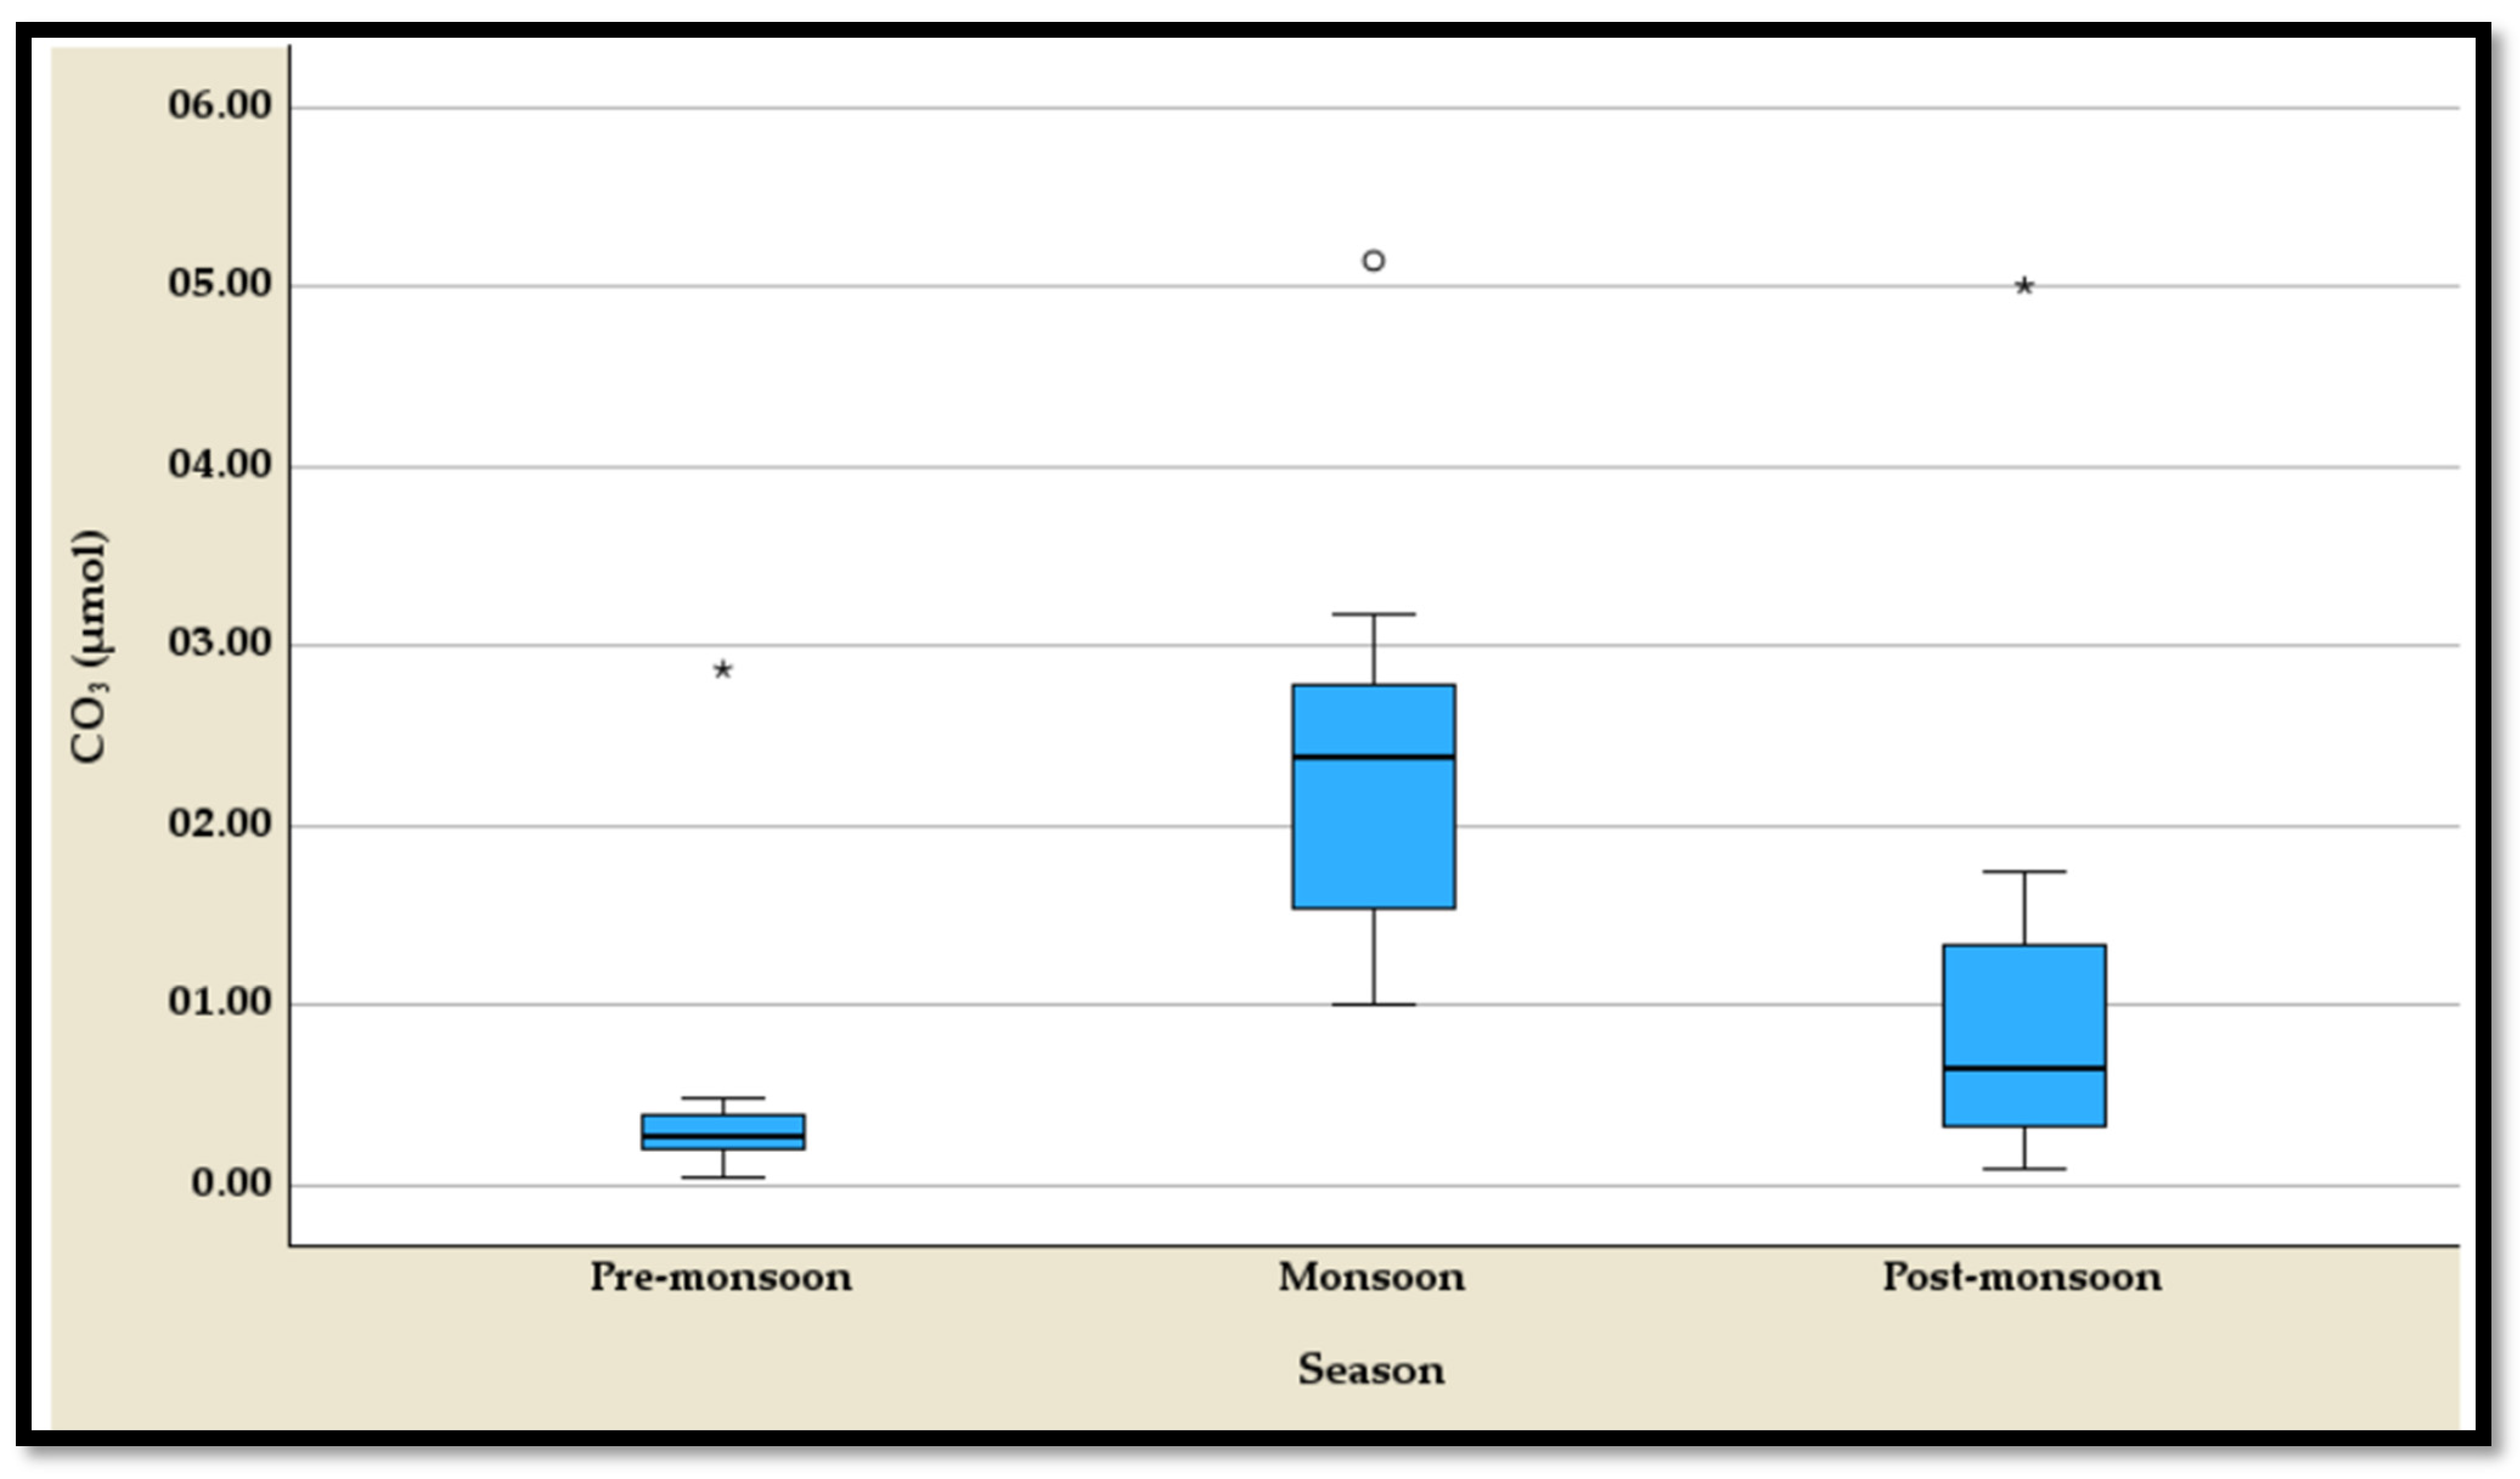
The temporal variation of carbonate (CO32−) concentrations demonstrates notable seasonal differences, as revealed by the five-number summary and boxplots, with each season exhibiting an outlier (Table S3, Figure 10). During the pre-monsoon season, CO32− levels are relatively low, ranging from 0.040 µmol to 0.491 µmol, with a median of 0.252 µmol (Table S3). This season reflects the lowest overall carbonate concentrations, suggesting limited carbonate availability. In stark contrast, the monsoon season exhibits a significant increase, with values ranging from 1.011 µmol to 3.170 µmol and a median of 2.159 µmol (Table S3). This marked elevation highlights the impact of monsoonal processes on carbonate levels. The post-monsoon season shows intermediate carbonate concentrations, with a range from 0.083 µmol to 1.747 µmol and a median of 0.577 µmol, indicating a reduction compared to the monsoon season but higher levels than pre-monsoon (Table S3). The presence of outliers in all three seasons suggests episodic deviations in carbonate concentrations, likely influenced by localized or transient environmental factors. These seasonal patterns reflect dynamic carbonate chemistry shaped by precipitation, runoff, and ecological interactions.

4.3.4. The Temporal Variation of the CO2

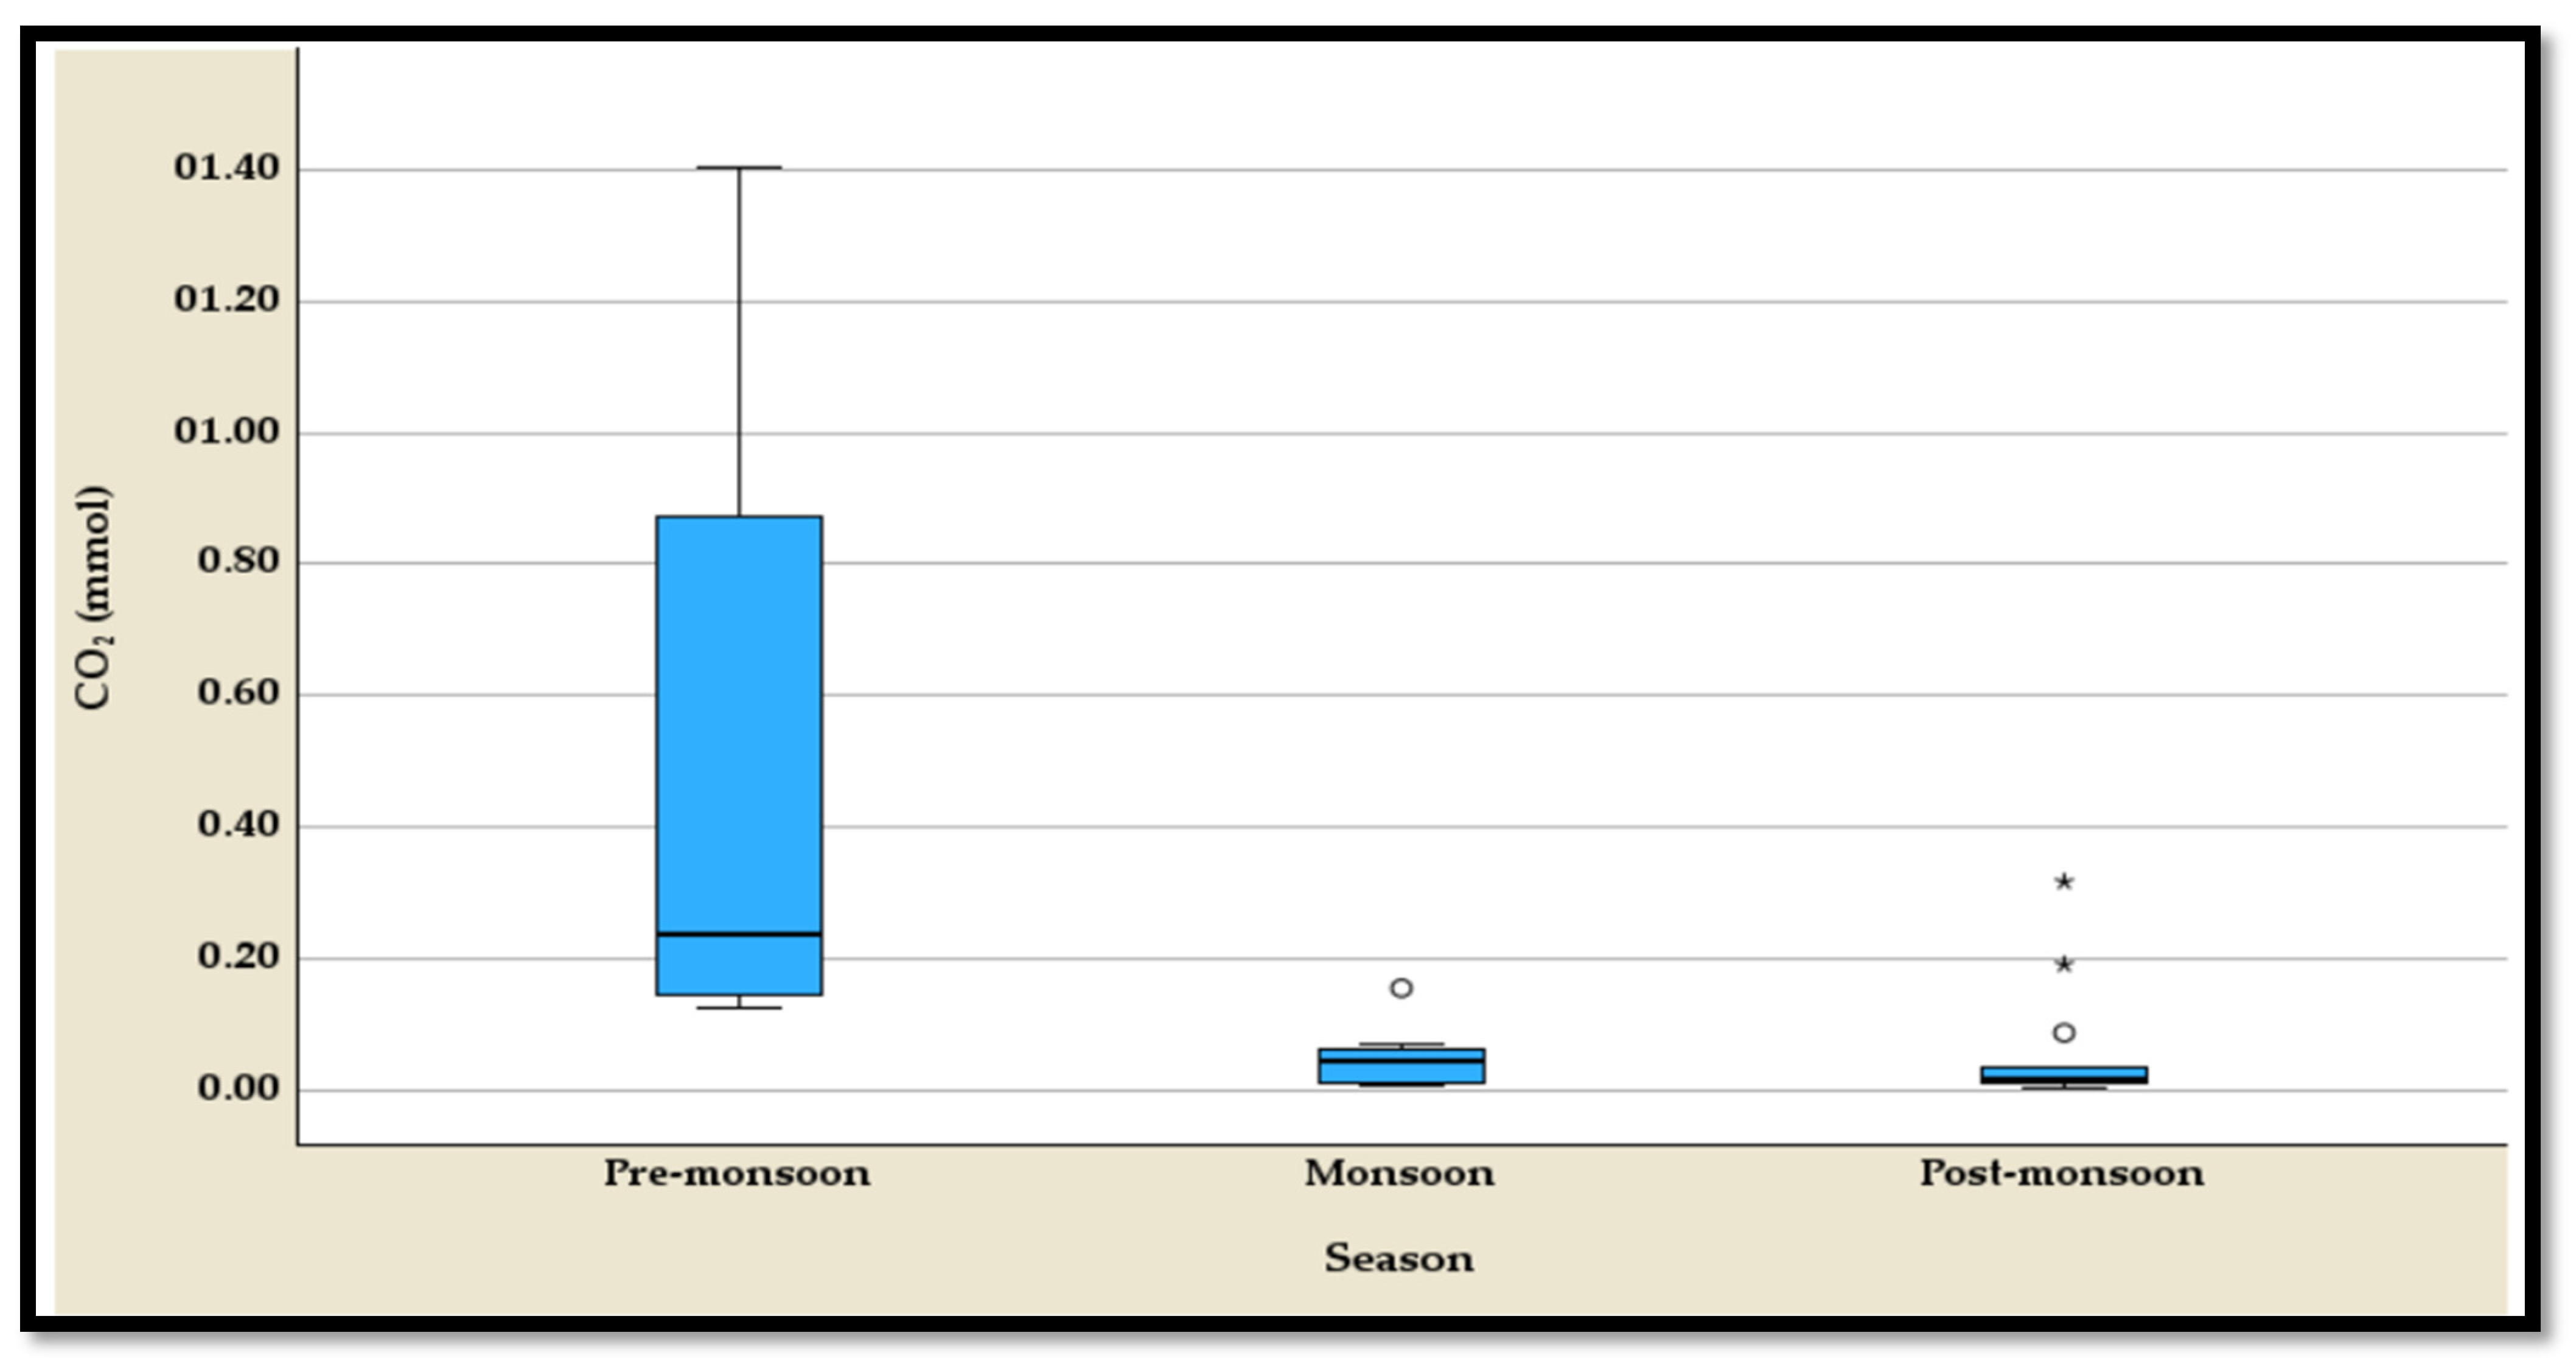
The temporal variation of carbon dioxide (CO2) concentrations highlights pronounced seasonal differences, as evidenced by the five-number summary and boxplots (Table S4, Figure 11). During the pre-monsoon season, CO2 levels are the highest, ranging from 0.125 mmol to 1.405 mmol, with a median of 0.236 mmol (Table S4). This season shows a wide interquartile range, reflecting elevated and variable CO2 concentrations without any outliers. In the monsoon season, CO2 levels drop significantly, with a range from 0.006 mmol to 0.155 mmol and a median of 0.046 mmol (Table S4). This sharp decline suggests enhanced CO2 dissolution or reduced production during monsoonal rainfall, although outliers are observed, indicating occasional deviations. The post-monsoon season records the lowest median CO2 concentration (0.019 mmol) and a range from 0.004 mmol to 0.317 mmol (Table S4). Despite the overall decrease, outliers are present, reflecting episodic CO2 increases possibly due to localized post-monsoonal processes. These seasonal patterns underscore the dynamic interplay of hydrological, atmospheric, and biological factors governing CO2 levels.

4.3.5. The Temporal Variation of the pCO2

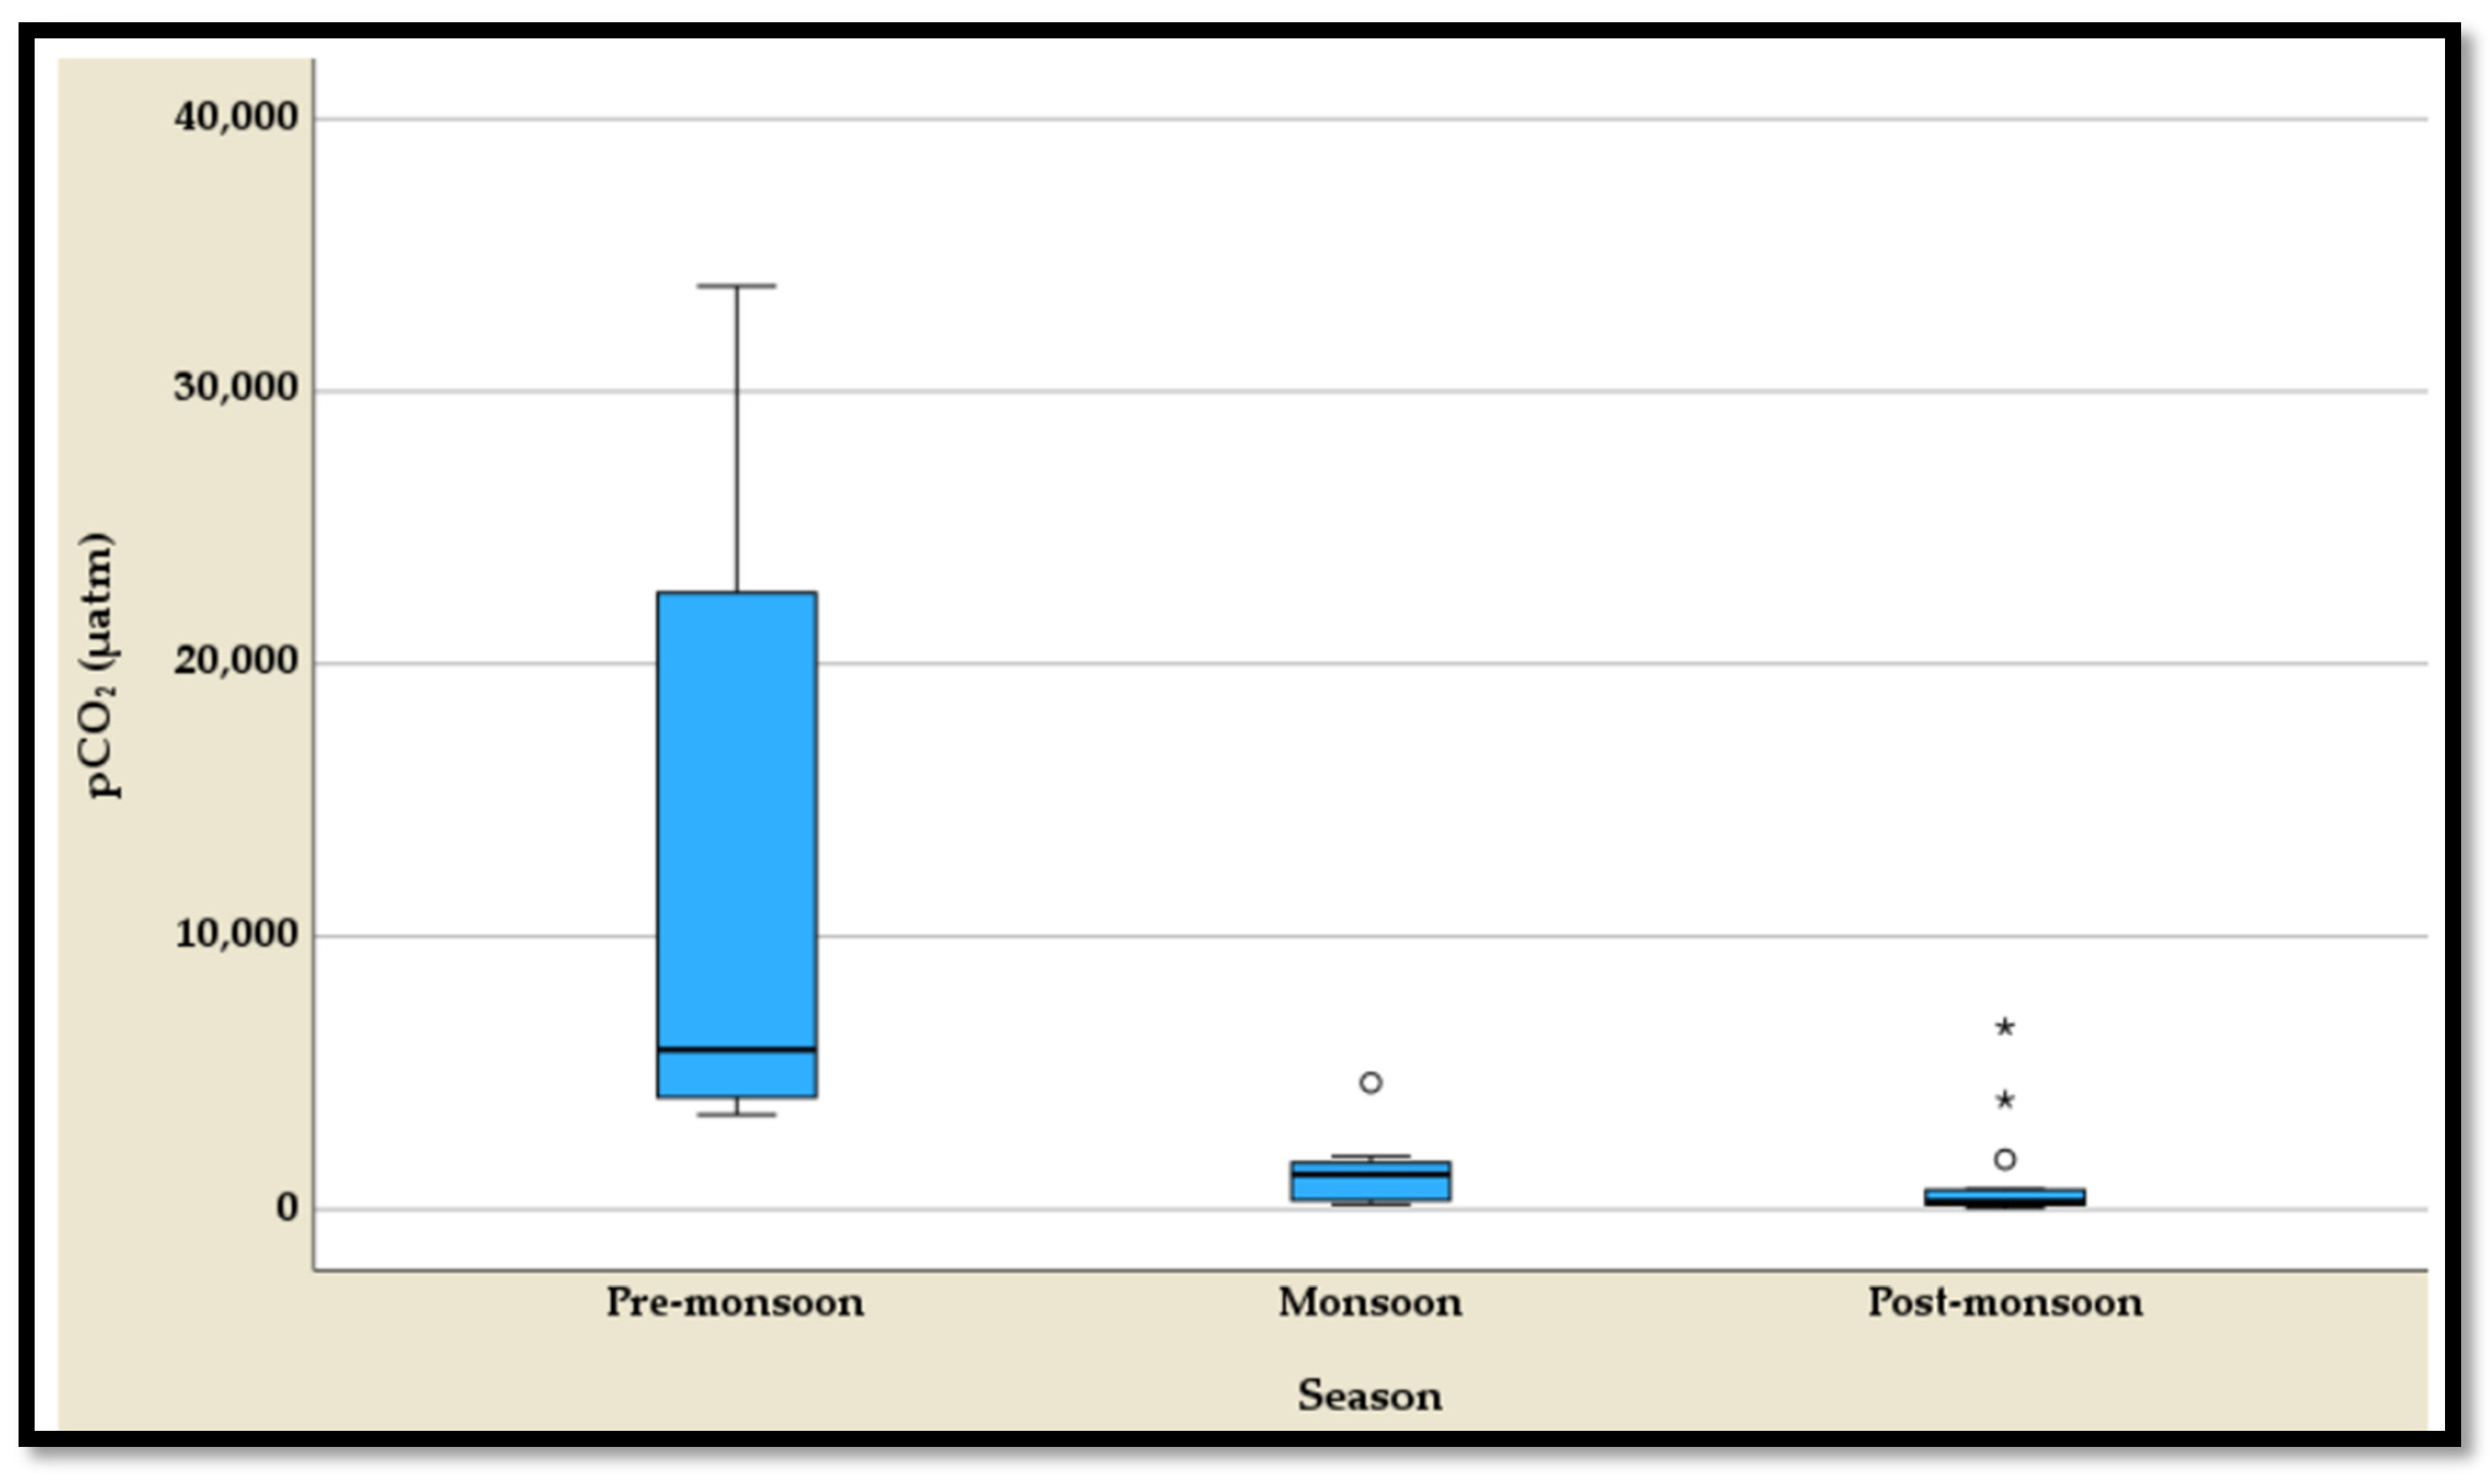
The temporal variation of partial pressure of carbon dioxide (pCO2) shows distinct seasonal patterns, as highlighted by the five-number summary and boxplots, with outliers observed in the monsoon and post-monsoon seasons but not in the pre-monsoon season (Table S5, Figure 12). During the pre-monsoon season, pCO2 levels are substantially higher, ranging from 3465 µatm to 33,869 µatm, with a median of 5836 µatm (Table S5). This season exhibits the highest variability and concentrations, likely driven by elevated biological or atmospheric CO2 contributions. In contrast, the monsoon season experiences a dramatic reduction in pCO2 levels, ranging from 185 µatm to 4637 µatm, with a median of 1283 µatm (Table S5). Outliers in this season suggest occasional localized surges in pCO2 despite the overall decline. The post-monsoon season records the lowest pCO2 levels, ranging from 56 atm to 6673 µatm, with a median of 305 µatm (Table S5). While the levels are more stable compared to the monsoon season, outliers highlight sporadic increases. These seasonal trends reflect the influence of monsoonal precipitation, runoff, and associated biogeochemical processes on pCO2 dynamics.
Water levels increase drastically along the Himalaya river system during monsoon months (June–September) due to extreme rainfall, rapid glacier melting, and a much higher groundwater recharge rate [61]. The highest discharge occurs during the summer months (June to September), followed by post-monsoon months (October to January) and the lowest during the pre-monsoon months (February to May) [23]. More than 80% of solute load transport from Himalayan river system to the global ocean occurs during monsoon, reflecting seasonal control on chemicals and suspended sediment transport. The proportion of pCO2 released was 78.6% during pre-monsoon, 17.3% during monsoon, and 4.1% during post-monsoon along the Himalayan drainage network (Figure 12; Table S5). This variation is attributed to difference in microbial activities, residence time of water, and variation in dissolution rate due to abundant hydrolysis conditions with the availability of fresh reactive mineral surfaces during monsoon months. Variation in discharge, microbial activities, and terrestrial and aquatic respiration are all factors that influence carbon dynamics, including pCO2, in different landscapes [28,65]. The dissolution rate is less during pre-monsoon, so less bicarbonate is produced and more pCO2 is available in water, while during monsoon enhanced weathering produces tremendous amounts of bicarbonate as more pCO2 is consumed during fast weathering of carbonate and aluminosilicate dissolution, hence pCO2 appeared low. A similar relationship between pCO2 and SiO2 was observed within the Rio Icacos watershed in the tropical rainforest in Puerto Rico [13].

4.4. Export of Inorganic Carbon Species from Different Transects of Langtang–Narayani

Annual export of inorganic carbon species at three transects of the Langtang–Narayani river system in central Nepal Himalaya during 2010–2011 is presented in Table 10. The transects range from low altitude (Narayani at 169 m) to high altitude (Langtang at 3710 m). Reported values include dissolved inorganic carbon (DIC), bicarbonate (HCO3), carbon dioxide (CO2), and carbonate (CO32−), expressed in tons km−2 yr−1. The estimated DIC export rates were at 93.66, 37.81, and 12.59-tons km−2 yr−1 from the Narayani River in the lowlands, the Trisuli River in the middle mountains, and the Langtang River in the high Himalayas, respectively. These fluxes are calculated based on the average concentrations of inorganic carbon species and average annual discharge of the same year from all three monitoring stations to present the exact transport rate. Earlier, Bhatt et al. (2018) [23] documented annual river runoff and export of all water constituents for each station with the number of years of available average discharge data, including percentage of runoff and export by season. The Himalayan river system, including the Ganga river system, is a critical region, having significantly large inputs of carbon into the Bay of Bengal [30]. Freshwater atmosphere flux of CO2 primarily from rivers and streams contributes about 560 Mt C per year [64,66]. Rivers are considered as a biogeochemical reactor from which substantial net fluxes of CO2 move to the atmosphere [29,67]. The data reveal a significant decrease in inorganic carbon exports with increasing altitude, with Narayani exhibiting the highest export and Langtang the lowest.
The dissolved inorganic carbon (DIC) export rate is much higher than the cationic denudation after sea-salt correction (75.48 tons km−2 yr−1), silica denudation (12.72 tons km−2 yr−1), and dissolved organic carbon (DOC) export rate (2.62 tons km−2 yr−1) at the low-elevation site at Narayanghat in the Narayani river system, a major tributary of the Ganga river system, where the weathering advance rate is reported as 201.12 mm kyr−1, several-fold higher than the world average denudation rate (Bhatt et al., 2018) [23]. The contribution of bicarbonate, carbon dioxide, and carbonate export rate to total DIC export rate is 97.9%, 1.46%, and 0.52%, respectively, at the high-elevation Langtang Himalaya region while the contribution of bicarbonate, carbon dioxide, and carbonate export rate to total DIC export rate is 94.9%, 4.68%, and 0.42%, respectively, at the low-elevation Narayani River at Narayanghat. These findings indicate substantial transport of dissolved inorganic carbon transport from the Himalayan river system to the global ocean.

5. Conclusions

This study investigates the intricate relationships between elevation and inorganic carbon species such as dissolved inorganic carbon (DIC), bicarbonate (HCO3), carbonate (CO32−), carbon dioxide (CO2), and partial pressure of carbon dioxide (pCO2) dynamics along the Langtang–Narayani river system in central Nepal Himalaya, providing valuable insights into the geochemical and hydrological processes shaping the riverine environment. Bicarbonate, carbonate, and DIC declined significantly with altitude, indicating a reduced chemical weathering rate due to colder temperatures, less runoff, lower biological activity, and diminished CO2 availability. We have also observed a significant reduction in CO2 and pCO2, primarily because of enhanced CO2 degassing in more turbulent waters and reduced microbial respiration in the colder, less biologically active environment in higher elevation of the Himalayas. The strong correlations between temperature, alkalinity, bicarbonate, and DIC emphasize the role of thermal conditions in controlling carbonate system dynamics. We observed pCO2 values of up to 33,869 μatm during pre-monsoon period in the mid-elevation site, suggesting waters are supersaturated with carbon dioxide in this region due to metamorphic activities or the presence of hot springs in the region. High-elevation sites are undersaturated with pCO2. The variation in dynamics of inorganic carbon species along the Langtang–Narayani river system in the central Himalaya is primarily due to variation in climatic, biological, and hydrological factors.
Supplementary Materials

The following supporting information can be downloaded at: https://www.mdpi.com/article/10.3390/w17182727/s1, Table S1. 5-Number summary of DIC across three seasons. Table S2. 5-Number summary of HCO3 across three seasons. Table S3. 5-Number summary of CO3 across three seasons. Table S4. 5-Number summary of CO2 across three seasons. Table S5. 5-Number summary of pCO2 across three seasons.

Author Contributions

M.P.B.; project design—methodology, sampling and coordination, funding acquisition, writing original draft, and reviewing and editing; G.B.M.; data analysis—statistical tests, model run, writing, and reviewing and editing. Both authors have read and agreed to publish the manuscript. All authors have read and agreed to the published version of the manuscript.

Funding

This research was supported by the Cluster of Excellence ‘CliSAP’ (EXC177) at Klima Campus, University of Hamburg, funded by the German Science Foundation (DFG).

Data Availability Statement

The original contributions presented in this study are included in the article. Supplement Tables S1–S5 are also included as an Supplementary Materials. Further inquiries can be directed to the corresponding author.

Acknowledgments

The authors extend their gratitude to Tom Jäppinen for his assistance in the laboratory and to Ronny Lauerwald for his help with running PhreeqC. Special thanks to Kedar Rijal and Anil Shrestha for their support and cooperation during the preparation of fieldwork in Nepal. The authors also wish to acknowledge Quinga Tamang, Mingma Tamang, Deepak Bhatt, Gyanendra Pant, Gyan Shrestha, Bibek Karki, Sushil Karki, Suraj Poudyal, and other members of the field campaign for their invaluable assistance and collaboration during sampling. The authors extended special thanks to Aaron Parez at the Center for Earth and Environmental Studies of Texas A & M International University for his contribution to producing the map (Figure 1). The authors thank William McDowell for his comments on improving the earlier version of the manuscript. The authors would like to acknowledge the Department of Hydrology and Meteorology (DHM), Government of Nepal for providing the hydrology data. The authors would like to thank members of the editorial office for handling the manuscript, editors for their suggestions and three anonymous reviewers for their insightful and constructive comments that helped to improve the manuscript.

Conflicts of Interest

The authors declare no conflicts of interest.

References

  1. Berner, R.A.; Lasaga, A.C.; Garrells, R.M. The carbonate-silicate geochemical cycles and its effect on atmospheric carbon dioxide over the past 100 million years. Am. J. Sci. 1983, 283, 641–683. [Google Scholar] [CrossRef]
  2. Isson, T.T.; Planavsky, N.J.; Coogan, L.A.; Stewart, E.M.; Ague, J.J.; Bolton, E.W.; Zhang, S.; McKenzie, N.R.; Kump, L.R. Evolution of the global carbon cycle and climate regulation on earth. Glob. Biogeochem. Cycles 2020, 34, e2018GB006061. [Google Scholar] [CrossRef]
  3. Garrels, R.M.; Mackenzie, F.T. Evolution of Sedimentary Rocks; W.W. Norton and Company, Inc.: New York, NY, USA, 1971; p. 397. [Google Scholar]
  4. Walker, J.G.C.; Hays, P.B.; Kasting, J.F. A negative feedback mechanism for the long-term stabilization of Earth’s surface temperature. J. Geophys. Res. 1981, 86, 9776–9782. [Google Scholar] [CrossRef]
  5. Brady, P.V.; Carroll, S.A. Direct effects of CO2 and temperature on silicate weathering: Possible implications for climate control. Geochim. Cosmochim. Acta 1994, 58, 1853–1856. [Google Scholar]
  6. Gaillardet, J.; Dupre, B.; Louvat, P.; Allegre, C.J. Global silicate weathering and CO2 consumption rates deduced from the chemistry of large rivers. Chem. Geol. 1999, 159, 3–30. [Google Scholar] [CrossRef]
  7. Hartmann, J.; Jensen, N.; Dürr, H.H.; Kempe, S.; Köhler, P. Global CO2 consumption by chemical weathering: What is the contribution of high active weathering region? Glob. Planet. Change 2009, 69, 185–194. [Google Scholar] [CrossRef]
  8. Goudie, A.S.; Viles, H.A. Weathering and the global carbon cycle: Geomorphological perspectives. Earth Sci. Rev. 2012, 113, 59–71. [Google Scholar] [CrossRef]
  9. Holland, H.D. The Chemical Evolution of the Atmosphere and Oceans; Princeton University Press: Princeton, NJ, USA, 1984; p. 582. [Google Scholar]
  10. Kempe, S. Carbon in the rock cycle. In The Global Carbon Cycle; Bolin, B., Degens, E.T., Kempe, S., Ketner, P., Eds.; Scientific Committee on Problems of the Environment (SCOPE) of the International Council of the Scientific Union (ICSU); John Wiley and Sons: Hoboken, NJ, USA, 1979; pp. 343–377. [Google Scholar]
  11. Upendra, B.; Ciba, M.; Rahul, S.; Sreenivasulu, G.; Reddy, S.K.K.; Arun, V.; Krishan, K.A. Dissolved load, chemical weathering, and CO2 uptake dynamics of small tropical mountainous rivers of Southern Granulite Terrain, Karamana and Vamanpuram, Western Ghats, India. Sci. Rep. 2025, 15, 11684. [Google Scholar] [CrossRef]
  12. Meybeck, M. Global chemical weathering from surficial rocks estimated from river-dissolved loads. Am. J. Sci. 1987, 287, 401–428. [Google Scholar] [CrossRef]
  13. Bhatt, M.P.; McDowell, W.H. Controls on major solutes within the drainage network of a rapidly weathering tropical watershed. Water Resour. Res. 2007, 43, W11402. [Google Scholar] [CrossRef]
  14. Drever, J.I. The Geochemistry of Natural Waters, 2nd ed.; Prentice Hall: Englewood Cliffs, NJ, USA, 1988; p. 473. [Google Scholar]
  15. Kempe, S.; Kazmierczak, J.; Digens, E.T. The soda ocean concept and its bearing on biotic evolution. In Origin, Evolution and Modern Aspects of Biomineralization in Plants and Animals; Crick, R.E., Ed.; Springer: Boston, MA, USA, 1989; pp. 29–43. [Google Scholar]
  16. Graves, J.; Reavey, D. Global Environmental Change. Plants, Animals and Communities; Longman: Harlow, UK, 1996; p. 226. [Google Scholar]
  17. Intergovernmental Panel on Climate Change (IPCC). Climate Change: The IPCC Scientific Assessment, World Meteorological Organization/United Nations Environment Program; Houghton, J.T., Jenkins, G.J., Ephraums, J.J., Eds.; Cambridge University Press: Cambridge, UK, 1990; p. 365. [Google Scholar]
  18. Intergovernmental Panel on Climate Change (IPCC). Climate Change 2022: Mitigation of Climate Change, Working Group III Contribution to the Sixth Assessment Report of the IPCC; Shukla, P.R., Skea, J., Slade, R., Al Khourdajie, A., van Diemen, R., McCollum, D., Pathak, M., Some, S., Vyas, P., Fradera, R., et al., Eds.; Cambridge University Press: Cambridge, UK; New York, NY, USA, 2022; p. 52. [Google Scholar]
  19. Raymo, M.E.; Ruddiman, W.F. Tectonic forcing of late Cenozoic climate. Nature 1992, 359, 117–122. [Google Scholar] [CrossRef]
  20. Edmond, J.M.; Huh, Y. Chemical weathering yields from basement and organic terrains in hot and cold climates. In Tectonic Uplift and Climate Change; Ruddiman, W.F., Ed.; Plenum Press: New York, NY, USA, 1997; pp. 329–351. [Google Scholar]
  21. France-Lanord, C.; Evans, M.; Hurtrez, J.E.; Riotte, J. Annual dissolved fluxes from central Nepal rivers: Budget of chemical erosion in the Himalayas. Comptes Rendus Geosci. 2003, 335, 1131–1140. [Google Scholar] [CrossRef]
  22. Wolff-Boenisch, W.; Gabet, E.; Burbank, D.W.; Langner, H.; Putkonen, J. Spatial variations in chemical weathering and CO2 consumption in Nepalese High Himalayan catchments during monsoon season. Geochim. Cosmochim. Acta 2009, 73, 3148–3170. [Google Scholar]
  23. Bhatt, M.P.; Hartmann, J.; Acevedo, M.F. Seasonal variations of biogeochemical matter export along Langtang-Narayani River System in Central Nepal Himalaya. Geochim. Cosmochim. Acta 2018, 238, 208–234. [Google Scholar] [CrossRef]
  24. Kemeny, P.C.; Lopez, G.I.; Dalleska, N.; Torres, M.; Burke, A.; Bhatt, M.P.; West, J.; Hartmann, J.; Adkins, J.F. Sulfate sulfur isotopes and major ion chemistry reveal that pyrite oxidation counteracts CO2 drawdown from silicate weathering in the Langtang- Trisuli-Narayani River system, Nepal Himalaya. Geochim. Cosmochim. Acta 2021, 294, 43–69. [Google Scholar] [CrossRef]
  25. Meybeck, M. Carbon, nitrogen, and phosphorus transport by world rivers. Am. J. Sci. 1982, 282, 401–450. [Google Scholar] [CrossRef]
  26. Evans, M.J.; Derry, L.A.; France-Lanord, C. Geothermal fluxes of alkalinity in the Narayani river system of central Nepal. Geochem. Geophys. Geosyst. 2004, 5, Q08011. [Google Scholar] [CrossRef]
  27. Cole, J.J.; Caraco, N.F. Carbon in catchments: Connecting terrestrial carbon loses with aquatic metabolism. Mar. Freshw. Res. 2001, 52, 101–110. [Google Scholar] [CrossRef]
  28. Humborg, C.; Mörth, C.M.; Sundbom, M.; Borg, H.; Blenckner, T.; Giesler, R.; Ittekkot, V. CO2 supersaturation along the aquatic conduit in Swedish Watersheds as constrained by terrestrial respiration, aquatic respiration and weathering. Glob. Change Biol. 2010, 16, 1966–1978. [Google Scholar]
  29. Raymond, P.; Hartmann, J.; Lauerwald, R.; Sobek, S.; McDonald, C.; Hoover, M.; Butman, D.; Striegl, R.; Mayorga, E.; Humborg, C.; et al. Global Carbon Dioxide emissions from inland waters. Nature 2013, 503, 355–359. [Google Scholar] [CrossRef]
  30. Regnier, P.; Friedlingstein, P.; Ciais, P.; Mackenzie, F.T.; Gruber, N.; Janssens, I.A.; Laruelle, G.G.; Lauerwald, R.; Luyssaert, S.; Andersson, A.J.; et al. Anthropogenic perturbation of the caron fluxes from land to ocean. Nat. Geosci. 2013, 6, 597–607. [Google Scholar] [CrossRef]
  31. Laerwald, R.; Laruelle, G.G.; Hartmann, J.; Ciais, P.; Regnier, P.A.G. Spatial pattern in CO2 evasion from the global river network. Glob. Biogeochem. Cycles 2015, 29, 534–554. [Google Scholar] [CrossRef]
  32. Tovas, T.R.; Hasler, C.T.; Suski, C.D.; Midway, S.R. A 30-year dataset of CO2 in flowing freshwaters in the United States. Sci. Data 2023, 10, 20. [Google Scholar] [CrossRef]
  33. Xiao, Q.; Xu, X.; Qi, T.; Qin, B.; Lee, X.; Hu, Z.; Wang, W.; Xiao, W.; Zhang, M. Eutrophic Lake Taihu as a significant CO2 source during 2000–2015. Water Res. 2020, 170, 115331. [Google Scholar] [CrossRef]
  34. Marx, A.; Dusek, J.; Jankovec, J.; Sanda, M.; Vogel, T.; van Geldern, R.; Hartmann, J.; Barth, J.A.C. A review of CO2 and associated carbon dynamics in headwater streams: A global perspective. Rev. Geophys. 2017, 55, 560–585. [Google Scholar] [CrossRef]
  35. Dawson, J.J.C.; Hope, D.; Cresser, M.S.; Billett, M.F. Downstream changes in free carbon dioxide in upland catchments from northern Scotland. J. Environ. Qual. 1995, 24, 699–706. [Google Scholar] [CrossRef]
  36. Richey, J.E.; Melak, J.M.; Aufdenkampe, A.K.; Ballester, V.M.; Hess, L.L. Outgassing from Amazonian rivers and wetlands as a large tropical source of atmospheric CO2. Nature 2002, 416, 617–620. [Google Scholar] [CrossRef]
  37. Xiao, Q.; Xu, X.; Qi, T.; Luo, J.; Lee, X.; Duan, H. Lakes shifted from a carbon dioxide source to sink over past two decades in China. Sci. Bull. 2024, 69, 1857–1861. [Google Scholar] [CrossRef] [PubMed]
  38. Gaillardet, J.; Galy, A. Himalaya carbon sink or source? Science 2008, 320, 1727–1728. [Google Scholar] [CrossRef] [PubMed]
  39. Wang, Y.; Quan, S.; Tang, X.; Hosono, T.; Hao, Y.; Tian, J.; Pang, Z. Organic and inorganic carbon sinks reduce long-term deep carbon emissions in the continental collision margin of the southern Tibetan plateau: Implications for Cenozoic cooling. J. Geophys. Res. Solid Earth 2024, 129, e2024JB028802. [Google Scholar] [CrossRef]
  40. France-Lanord, C.; Derry, L.A. Organic carbon urial forcing of the carbon cycle from Himalayan erosion. Nature 1997, 390, 65–67. [Google Scholar] [CrossRef]
  41. Evans, J.M.; Derry, L.A.; France-Lanord, C. Degassing of metamorphic carbon dioxide from the Nepal Himalaya. Geochem. Geophys. Geosyst. 2008, 9, Q04021. [Google Scholar] [CrossRef]
  42. Gorman, P.J.; Kerrick, D.M.; Connolly, J.A.D. Modeling open system metamorphic decarbonation of subducting slabs. Geochem. Geophys. Geosyst. 2006, 7, Q04007. [Google Scholar] [CrossRef]
  43. Su, H.; Chen, J.; Li, Y.; Rao, Q.; Luo, C.; Deng, X.; Shen, H.; Li, R.; Chen, J.; Sun, Y.; et al. Carp stocking and climate change are potentially more important factors than nutrient enrichments driving water quality deterioration in subtropical freshwater lakes in China. Limnol. Oceanogr. 2023, 68, S131–S143. [Google Scholar] [CrossRef]
  44. Giani, M.; Orgine, N.; Tamse, S.; Cozzi, S. Elevated River Inputs of the Total Alkalinity and Dissolved Inorganic Carbon in the Northern Adriatic Sea. Water 2023, 15, 894. [Google Scholar] [CrossRef]
  45. Sarin, M.M.; Krishnaswami, S.; Dilli, K.; Somayajulu, B.L.K.; Moore, W.S. Major ion chemistry of the Ganga-Brahamputra river system: Weathering processes and fluxes to the Bay of Bengal. Geochim. Cosmochim. Acta 1989, 53, 997–1009. [Google Scholar] [CrossRef]
  46. Krishnaswami, S.; Singh, S.K. Chemical weathering in the river basins of the Himalaya, India. Curr. Sci. 2005, 89, 841–849. [Google Scholar]
  47. Bhatt, M.P.; Masuzawa, T.; Yamamoto, M.; Gardner, K.H. Spatial variations in chemical compositions along Langtang-Narayani river system in central Nepal. Environ. Geol. 2009, 57, 557–569. [Google Scholar] [CrossRef]
  48. Bickle, M.J.; Chapman, H.J.; Tipper, E.; Galy, A.; Dela La Rocha, C.L.; Ahmad, T. Chemical weathering outputs from the flood plain of the Ganga. Geochim. Cosmochim. Acta 2018, 225, 146–175. [Google Scholar] [CrossRef]
  49. Bhatt, M.P.; Masuzawa, T.; Yamamoto, M.; Sakai, A.; Fujita, K. Seasonal changes in dissolved chemical composition and flux of melt water draining from Lirung glacier in the Nepal Himalayas. In Proceedings of a Workshop on Debris-Coved Glaciers Held at Seattle; IAHS Publication: Washington, DC, USA, 2000; pp. 277–288. [Google Scholar]
  50. Inger, S.; Harris, B.W. Tectonothermal evolution of the High Himalayan Crystalline Sequence, Langtang Valley, Northern Nepal. J. Metam. Geol. 1992, 10, 439–452. [Google Scholar] [CrossRef]
  51. Bhatt, M.P.; Masuzawa, T.; Yamamoto, M.; McDowell, W.H. Chemical weathering in central Himalaya: Dissolved silica dynamics in glacier meltwater. In Proceedings of the International Conference on Hydrology and Climate Change in Mountainous Area (ICHCC), Kathmandu, Nepal, 15–17 November 2008; pp. 162–179. [Google Scholar]
  52. Galy, A.; France-Lanord, C. Weathering processes in the Ganga-Bhahmaputra basin and the riverine alkalinity budget. Chem. Geol. 1999, 159, 31–60. [Google Scholar] [CrossRef]
  53. Survey Department (SD). Land System Map, Central Development Region, Nepal; Topographical Survey Branch, Survey Department, Ministry of Land Reform, HMG: Kathmandu, Nepal, 1984. [Google Scholar]
  54. Bhatt, M.P.; Bhatt, S.; Gaye, B. Controls on chemistry of Gosaikunda Lake in High Himalaya within Langtang National park in central Nepal. Int. J. Geosci. 2014, 5, 1100–1115. [Google Scholar] [CrossRef]
  55. Hasnain, S.I.; Thayyen, R.J. Controls on the major ion chemistry of Dokriani Glacier meltwaters, Ganga Basin, Garhwal Himalaya, India. J. Glaciol. 1999, 45, 87–92. [Google Scholar] [CrossRef]
  56. Bhatt, M.P.; Masuzawa, T.; Yamamoto, M.; Takeuchi, N. Chemical characteristics of pond waters within the debris area of Lirung Glacier in Nepal Himalaya. J. Limnol. 2007, 66, 71–80. [Google Scholar] [CrossRef]
  57. Bhatt, M.P.; Takeuchi, N.; Acevedo, M.F. Chemistry of Supraglacial Ponds in the Debris Covered Area of Lirung Glacier in Central Nepal Himalayas. Aquat. Geochem. 2016, 22, 35–64. [Google Scholar] [CrossRef]
  58. American Public Health Association (APHA). Standard Method for the Examination of Water and Wastewater, 19th ed.; Eaton, A.D., Clesceri, L.S., Greenberg, A.E., Eds.; American Public Health Association: Washington, DC, USA, 1995. [Google Scholar]
  59. Parkhurst, D.I.; Appelo, C.A.I. User’s guide to PHREEQC: A computer program for speciation, reaction path, 1D transport and inverse geochemical calculations. US Geol. Surv. Water Resour. Investig. Rep. 1999, 99, 4259. [Google Scholar]
  60. Department of Hydrology and Meteorology (DHM). Hydro-Meteorological Data of Nepal, DHM; Government of Nepal: Kathmandu, Nepal, 2019. [Google Scholar]
  61. Andermann, C.; Longuevergne, L.; Bonnet, S.; Crave, A.; Davy, P.; Gloaguen, R. Impact of transient groundwater storage on the discharge of Himalayan Rivers. Nat. Geosci. 2012, 5, 127–132. [Google Scholar] [CrossRef]
  62. Hartmann, J. Plate tectonics, carbon and climate. Science 2019, 363, 126–127. [Google Scholar] [CrossRef]
  63. Kempe, S. Long Term Records CO2 Pressure Fluctuations in Freshwater; SCOPE/UNEP Sonderband 52, Mitteilungen aus dem Geologisch-Paläontologischen Institut, University of Hamburg: Hamburg, Germany, 1982; pp. 91–332. [Google Scholar]
  64. Lauerwald, R.; Hartmann, J.; Moosdorf, N.; Kempe, S.; Raymond, P.A. What controls the spatial patterns of the riverine carbonate system? A case study from North America. Chem. Geol. 2013, 337–338, 114–127. [Google Scholar] [CrossRef]
  65. Liu, S.; Kohn, C.; Amatulli, G.; Aho, K.; Butman, D.E.; Allen, G.H.; Lin, P.; Pan, M.; Yamazaki, D.; Brinkerhoff, C.; et al. The importance of hydrology in routing terrestrial carbon to the atmosphere vis global streams and rivers. Proc. Natl. Acad. Sci. USA 2022, 119, e2106322119. [Google Scholar] [CrossRef] [PubMed]
  66. Aufdenkempe, A.K.; Mayorga, E.; Raymond, P.A.; Melack, J.M.; Doney, S.C.; Alin, S.R.; Aalto, R.E.; Yoo, K. Riverine coupling of biogeochemical cycles between land, oceans and atmosphere. Front. Ecol. Environ. 2011, 9, 53–60. [Google Scholar] [CrossRef]
  67. Butman, D.; Raymond, P.A. Significant efflux of carbon dioxide from streams and rivers in United States. Nat. Geosci. 2011, 4, 839–842. [Google Scholar] [CrossRef]
Figure 1. Sampling map of Langtang–Narayani river system in central Nepal, showing sample locations (closed circle). R1–R16 indicates sample IDs (LNS-1–LNS16). Q1, Q2, and Q3 are discharge points at low elevation in Tarai region at Narayanghat, Siwalik region in Trisuli river at Betrawati, and high elevation in high mountain region at Syabrubenshi, respectively.
Water 17 02727 g001
Figure 2. Variation of average DIC with elevation.
Water 17 02727 g002
Figure 3. Variation of average alkalinity with elevation.
Water 17 02727 g003
Figure 4. Average variation of CO2 with elevation.
Water 17 02727 g004
Figure 5. Variation of average HCO3 with elevation.
Water 17 02727 g005
Figure 6. Variation of average CO3 with elevation.
Water 17 02727 g006
Figure 7. Variation of average pCO2 with elevation.
Water 17 02727 g007
Figure 8. Boxplots of DIC across three seasons. NB: O = Outlier.
Water 17 02727 g008
Figure 9. Boxplots of HCO3 across three seasons. NB: O = Outlier.
Water 17 02727 g009
Figure 10. Boxplots of CO32− across three seasons. NB: O = Outlier, * = Extreme Outlier.
Water 17 02727 g010
Figure 11. Boxplots of CO2 across three seasons. NB: O = Outlier, * = Extreme Outlier.
Water 17 02727 g011
Figure 12. Boxplots of pCO2 across three seasons. NB: O = Outlier, * = Extreme Outlier.
Water 17 02727 g012
Table 1. Description of Langtang–Narayani river system with water temperature and pH.
SampleSiteDrainage BasinVegetation CoverLatitudeLongitudeElevation (m)WT (°C)pH
LNS-1NarayanghatSiwaliksSub-tropical27°41′58.1″84°25′17.6″16922.53 ± 2.717.80 ± 0.44
LNS-2FislingMahabharatSub-tropical27°50′39.3″84°39′43.1″25820.62 ± 3.587.64 ± 0.47
LNS-3BairainiMahabharatSub-tropical27°48′03.9″84°58′38.6″37719.99 ± 3.417.63 ± 0.56
LNS-4BetrawatiMid-mountainSub-tropical27°57′49.4″84°10′24.9″60419.78 ± 6.587.52 ± 0.88
LNS-5SyabrubenshiUpper-mountainSparse28°09′52.3″85°20′26.2″141917.14 ± 5.987.06 ± 0.80
LNS-6SyabrubenshiUpper-mountainSparse28°09′56.9″85°20′33.1″143416.74 ± 6.417.07 ± 0.76
LNS-7SyabrubenshiUpper-mountainSparse28°09′47.9″85°20′38.4″144116.14 ± 7.127.16 ± 0.93
LNS-8LandslideLesser HimalayaDense28°09′05.9″85°22′34.7″18028.55 ± 2.627.61 ± 0.16
LNS-9BambooLesser HimalayaDense28°09′18.9″85°23′52.0″18649.3 ± 4.387.75 ± 0.07
LNS-10GhodatabelaHigh HimalayaDense28°12′02.7″85°27′44.5″30346.6 ± 4.537.86 ± 0.01
LNS-11Langtang RiverHigh HimalayaSparse28°12′34.6″85°33′17.6″37103.1 ± 2.978.26 ± 0.16
LNS-12LajaHigh HimalayaShrub28°12′35.6″85°33′22.5″37033.45 ± 3.188.07 ± 0.27
LNS-13Khimjung KholaHigh HimalayaShrub28°12′58.1″85°33′53.9″38843.95 ± 4.748.31 ± 0.13
LNS-14Lirung KholaHigh HimalayaShrub28°12′55.6″85°33′49.9″38824.8 ± 4.427.58 ± 0.39
LNS-15Lirung OutletHigh HimalayaNo vegetation28°13′01.9″85°33′42.0″39891.75 ± 0.217.39 ± 0.08
LNS-16ThumdiHigh HimalayaShrub28°12′19.8″85°34′04.1″38004.5 ± 5.377.68 ± 0.49
Notes: Water temperature (WT) and pH were measured monthly for samples LNS-1 to LNS-7, and only in the fall for samples LNS-8 to LNS-16 during 2010–2011 (n = 99). Sample site details, including WT and pH, are from Bhatt et al. (2018) [23] (Table 1) for clarity.
Table 2. Average concentration of inorganic carbon species along the Langtang–Narayani river system in central Nepal Himalaya during fall 2010 to fall 2011. n = 99.
SampleAlkalinityDICCO2HCO3CO32−pCO2
Name(mmol L−1)(mmol L−1)(mmol L−1)(mmol L−1)(μmol L−1)(µatm)
LNS-11.06 ± 0.251.11 ± 0.320.07 ± 0.111.01 ± 0.254.47 ± 2.551925.45 ± 3108.15
LNS-20.58 ± 0.070.63 ± 0.100.05 ± 0.060.56 ± 0.071.92 ± 1.551372.78 ± 1779.81
LNS-30.43 ± 0.070.48 ± 0.100.05 ± 0.070.42 ± 0.071.43 ± 1.071295.55 ± 1850.51
LNS-40.40 ± 0.180.44 ± 0.310.06 ± 0.130.39 ± 0.191.40 ± 1.531263.88 ± 2380.32
LNS-50.44 ± 0.170.73 ± 0.720.31 ± 0.660.42 ± 0.160.85 ± 1.257693.40 ± 16,709.36
LNS-60.58 ± 0.111.03 ± 0.720.448 ± 0.7020.57 ± 0.110.70 ± 0.6611,349.30 ± 18,593.32
LNS-70.24 ± 0.110.44 ± 0.310.194 ± 0.2980.24 ± 0.110.47 ± 0.684828.31 ± 7472.26
LNS-80.18 ± 0.020.19 ± 0.080.014 ± 0.0100.18 ± 0.060.25 ± 0.02240.76 ± 148.75
LNS-90.20 ± 0.030.21 ± 0.030.010 ± 0.0040.20 ± 0.030.41 ± 0.05180.05 ± 45.02
LNS-100.24 ± 0.030.25 ± 0.030.010 ± 0.0020.24 ± 0.030.58 ± 0.01161.78 ± 13.10
LNS-110.25 ± 0.040.25 ± 0.050.005 ± 0.0030.24 ± 0.051.37 ± 0.3366.36 ± 32.34
LNS-120.19 ± 0.010.19 ± 0.020.006 ± 0.0040.19 ± 0.020.73 ± 0.4283.60 ± 52.39
LNS-130.23 ± 0.130.25 ± 0.130.004 ± 0.0030.22 ± 0.131.31 ± 0.2656.26 ± 41.69
LNS-140.12 ± 0.030.13 ± 0.040.014 ± 0.0140.12 ± 0.030.16 ± 0.11198.07 ± 181.53
LNS-150.12 ± 0.030.14 ± 0.040.017 ± 0.0070.12 ± 0.030.08 ± 0.01237.38 ± 95.04
LNS-160.26 ± 0.060.29 ± 0.090.027 ± 0.0300.26 ± 0.060.50 ± 0.44370.13 ± 377.96
Table 3. The predictive models for estimating average DIC.
Model #Independent Variable(s)Predictive ModelR2 Value
1.Elevation D I C ^ = −0.0001 Elevation + 0.740.50
2.Alk D I C ^ = 0.002 + 1.054 Alk1.00
3.CO2 D I C ^ = 0.088 + 10.008 CO20.73
4.HCO3 D I C ^ = −0.005 + 1.111 HCO31.00
5.pCO2 D I C ^ = 0.127 + 0.0004 pCO20.87
6.CO32− D I C ^ = 0.097 + 221.946 CO32−0.91
7.WT, pH, CO2, HCO3, pCO2 D I C ^ = 0.069 − 0.001 WT − 0.009 pH + 0.367 CO2 + 1.048 HCO3 + 2.1 10−5 pCO21.00
Note: NB: WT indicates water temperature and Alk indicates alkalinity.
Table 4. Predictive models for estimating average CO2.
Model #Independent Variable(s)Predictive ModelR2 Value
1Elevation C O 2   ^ = −3 × 10⁻⁵ Elevation + 0.160.71
2Alk C O 2   ^ = 0.001 + 0.075 Alk0.70
3DIC C O 2   ^ = 0.001 + 0.0731 DIC0.73
4HCO3 C O 2   ^ = 0.001 + 0.079 HCO30.70
5pCO2 C O 2   ^ = 0.006 + 3.53 × 10⁻⁵ pCO20.97
6CO32− C O 2   ^ = 0.010 + 14.156 CO32−0.51
7Elevation, CO32−, pCO2 C O 2   ^ = −0.002 + 2.403 × 10⁻⁶ Elevation − 4.618 CO32− + 4.714 × 10⁻⁵ pCO20.99
Table 5. Predictive models for estimating average HCO3.
Model #Independent Variable(s)Predictive ModelR2 Value
1Elevation H C O 3   ^ = 0.58 − 0.0001 Elevation0.52
2Alk H C O 3   ^ = 0.006 + 0.948 Alk1.00
3DIC H C O 3   ^ = 0.005 + 0.899 DIC1.00
4CO2 H C O 3   ^ = 0.089 + 8.790 CO20.70
5pCO2 H C O 3   ^ = 0.122 + 0.0003 pCO20.81
6CO32− H C O 3   ^ = 0.090 + 201.181 CO32−0.93
7pH, Alk, CO32− H C O 3   ^ = −0.049 + 0.007 pH + 0.992 Alk − 9.911 CO32−1.00
Table 6. The predictive models for estimating average CO32−.
Model #Independent Variable(s)Predictive ModelR2 Value
1Elevation C O 3   ^ = 0.002 − 4.466 × 10⁻⁷ Elevation0.37
2Alk C O 3   ^ = −0.0003 + 0.004 Alk0.93
3DIC C O 3   ^ = −0.0003 + 0.004 DIC0.91
4CO2 C O 3   ^ = 0.0002 + 0.036 CO20.51
5HCO3 C O 3   ^ = −0.0003 + 0.005 HCO30.93
6pCO2 C O 3   ^ = 0.0003 + 1.44 × 10⁻⁶ pCO20.63
7pH, HCO3 C O 3   ^ = −0.008 + 0.001 pH + 0.005 HCO30.98
Table 7. The predictive models for estimating average pCO2.
Model #Independent Variable(s)Predictive ModelR2 Value
1Elevation p C O 2   ^ = 1421.5 − 0.3548 Elevation 0.77
2Alk p C O 2   ^ = −166.957 + 2253.499 Alk0.81
3DIC p C O 2   ^ = −183.444 + 2174.835 DIC0.84
4HCO3 p C O 2   ^ = −181.543 + 2378.682 HCO30.81
5CO2 p C O 2   ^ = −136.192 + 27,366.474 CO20.97
6CO32− p C O 2   ^ = 74.916 + 440,686.284 CO32−0.64
7WT, CO2, CO32− p C O 2   ^ = −191.308 + 19.580 WT + 17,733.103 CO2 + 97,870.190 CO32−0.99
Table 8. Pearson’s correlation analysis of elevation and measured chemical parameters along Langtang–Narayani river system.
ElevationAlkDICCO2HCO3CO32−
Elevation1
Alk−0.735 **1
DIC−0.751 **0.999 **1
CO2−0.843 **0.834 **0.855 **1
HCO3−0.737 **1.000 **0.999 **0.835 **1
CO32−−0.610 *0.964 **0.954 **0.713 **0.962 **1
pCO2−0.876 **0.898 **0.915 **0.983 **0.899 **0.797 **
Notes: NB: ** correlation is significant at the 1% level (2-tailed), * correlation is significant at the 5% level (2-tailed).
Table 9. Seasonal variation of inorganic carbon species along Langtang–Narayani river system in central Nepal Himalaya during fall 2010 to fall 2011. n = 99.
SampleAlkalinityDICCO2HCO3CO32−pCO2
Name(mmol L−1)(mmol L−1)(mmol L−1)(mmol L−1)(µmol L−1)(µatm)
Pre-monsoon
LNS-11.07 ± 0.161.22 ± 0.360.163 ± 0.1991.02 ± 0.172.87 ± 3.214671.4 ± 5490.6
LNS-20.57 ± 0.090.70 ± 0.160.126 ± 0.0840.56 ± 0.090.49 ± 0.403521.1 ± 2342.3
LNS-30.44 ± 0.100.56 ± 0.040.125 ± 0.0840.43 ± 0.100.29 ± 0.253464.9 ± 2408.1
LNS-40.51 ± 0.271.92 ± 2.481.405 ± 2.5420.51 ± 0.270.27 ± 0.3333,868.8 ± 60,162.9
LNS-50.36 ± 0.231.14 ± 1.230.771 ± 1.0760.36 ± 0.220.04 ± 0.0419,306.7 ± 27,164.5
LNS-60.60 ± 0.131.57 ± 0.900.974 ± 0.9380.59 ± 0.130.24 ± 0.3425,907.9 ± 26,017.5
LNS-70.34 ± 0.140.57 ± 0.310.236 ± 0.3230.33 ± 0.140.17 ± 0.125835.8 ± 8138.9
Monsoon
LNS-11.19 ± 0.331.21 ± 0.370.046 ± 0.0411.13 ± 0.335.14 ± 3.241283.0 ± 1132.8
LNS-20.62 ± 0.060.63 ± 0.070.016 ± 0.0070.60 ± 0.063.17 ± 1.71450.0 ± 689.8
LNS-30.42 ± 0.080.41 ± 0.080.008 ± 0.0030.40 ± 0.082.40 ± 0.83225.3 ± 95.1
LNS-40.33 ± 0.160.32 ± 0.170.006 ± 0.0060.31 ± 0.172.38 ± 2.01184.6 ± 165.2
LNS-50.45 ± 0.200.51 ± 0.120.069 ± 0.1140.43 ± 0.191.94 ± 1.751944.0 ± 3239.0
LNS-60.58 ± 0.140.63 ± 0.160.052 ± 0.0490.57 ± 0.141.21 ± 0.801467.0 ± 1594.1
LNS-70.19 ± 0.070.34 ± 0.240.155 ± 0.2960.19 ± 0.071.01 ± 1.034636.5 ± 8867.9
Post-monsoon
LNS-10.92 ± 0.190.92 ± 0.210.020 ± 0.0090.87 ± 0.195.01 ± 0.91508.5 ± 231.3
LNS-20.55 ± 0.040.57 ± 0.070.031 ± 0.0330.53 ± 0.041.75 ± 0.88684.3 ± 689.9
LNS-30.44 ± 0.060.47 ± 0.110.034 ± 0.0450.43 ± 0.061.31 ± 0.74738.8 ± 945.1
LNS-40.36 ± 0.050.38 ± 0.060.020 ± 0.0220.35 ± 0.051.55 ± 1.17420.7 ± 462.6
LNS-50.47 ± 0.070.55 ± 0.160.087 ± 0.1110.46 ± 0.070.56 ± 0.321829.4 ± 2364.8
LNS-60.56 ± 0.100.88 ± 0.650.317 ± 0.5690.55 ± 0.100.74 ± 0.586673.0 ± 12,090.8
LNS-70.20 ± 0.030.39 ± 0.390.191 ± 0.3580.20 ± 0.030.24 ± 0.174012.7 ± 7586.7
LNS-80.18 ± 0.060.19 ± 0.070.014 ± 0.0100.18 ± 0.060.25 ± 0.02240.8 ± 148.7
LNS-90.20 ± 0.030.21 ± 0.030.010 ± 0.0040.20 ± 0.030.41 ± 0.05180.1 ± 45.0
LNS-100.24 ± 0.030.25 ± 0.030.010 ± 0.0020.24 ± 0.030.58 ± 0.01161.8 ± 13.1
LNS-110.25 ± 0.040.25 ± 0.050.005 ± 0.0030.24 ± 0.051.36 ± 0.3366.4 ± 32.3
LNS-120.19 ± 0.010.19 ± 0.020.006 ± 0.0040.18 ± 0.020.73 ± 0.4283.6 ± 52.4
LNS-130.23 ± 0.130.23 ± 0.130.004 ± 0.0030.22 ± 0.121.31 ± 0.2656.3 ± 41.7
LNS-140.12 ± 0.030.13 ± 0.040.014 ± 0.0140.12 ± 0.030.16 ± 0.11198.1 ± 181.5
LNS-150.12 ± 0.030.14 ± 0.040.017 ± 0.0070.12 ± 0.030.08 ± 0.01237.4 ± 95.0
LNS-160.26 ± 0.060.28 ± 0.090.027 ± 0.0300.26 ± 0.060.50 ± 0.44370.1 ± 378.0
Table 10. Annual export of inorganic carbon species at different transects of Langtang–Narayani River system in central Nepal Himalaya during 2010–2011. n = 99.
Inorganic CarbonNarayani RiverTrishuli RiverLangtang River
Species (tons km−2 yr−1)(169 m)(604 m)(3710 m)
DIC93.6637.8112.59
HCO388.8934.3512.34
CO24.393.350.18
CO32−0.390.110.07
Disclaimer/Publisher’s Note: The statements, opinions and data contained in all publications are solely those of the individual author(s) and contributor(s) and not of MDPI and/or the editor(s). MDPI and/or the editor(s) disclaim responsibility for any injury to people or property resulting from any ideas, methods, instructions or products referred to in the content.