Article

Hybrid ITSP-LSTM Approach for Stochastic Citrus Water Allocation Addressing Trade-Offs Between Hydrological-Economic Factors and Spatial Heterogeneity

1
Hubei Key Laboratory of Hydropower Engineering Construction and Management, China Three Gorges University, Yichang 443002, China
2
College of Hydraulic & Environmental Engineering, China Three Gorges University, Yichang 443002, China
3
Key Laboratory for City Cluster Environmental Safety and Green Development of the Ministry of Education, Institute of Environmental and Ecological Engineering, Guangdong University of Technology, Guangzhou 510006, China
4
Guangdong Provincial Key Laboratory of Water Quality Improvement and Ecological Restoration for Watersheds, Institute of Environmental and Ecological Engineering, Guangdong University of Technology, Guangzhou 510006, China
*
Author to whom correspondence should be addressed.
Water 2025, 17(18), 2665; https://doi.org/10.3390/w17182665
Submission received: 17 June 2025 / Revised: 14 August 2025 / Accepted: 1 September 2025 / Published: 9 September 2025
(This article belongs to the Section Water, Agriculture and Aquaculture)

Abstract

This study addresses the critical challenge of optimizing water resource allocation in fragmented citrus cultivation zones, particularly in Anfusi Town, a key citrus production area in China’s middle-lower Yangtze River region. To overcome the limitations of traditional deterministic models and spatially heterogeneous water supply–demand dynamics, an innovative framework integrating interval two-stage stochastic programming (ITSP) with long short-term memory (LSTM) neural networks is proposed. The LSTM component forecasts irrigation demand and supply under climate variability, while ITSP optimizes dynamic allocation strategies by quantifying uncertainties through interval analysis and balancing economic returns with hydrological risks. Key results demonstrate an 8.67% increase in system-wide benefits compared to baseline practices in the current year scenario. For the planning year (2025), the model identifies optimal water distribution thresholds: an upper limit of 3.85 × 10⁶ m3 for high-availability zone A and lower limits of 1.62 × 10⁶ m3 for moderate-to-low-availability zones B and C. These allocations minimize water scarcity penalties while maximizing net benefits, prioritizing local over external water sources to reduce costs. The study innovates by integrating stochastic-economic analysis with spatial prioritization of high-marginal-benefit zones and uncertainty robustness via interval analysis and two-stage decision making. By bridging a research gap in citrus irrigation optimization, this approach advances sustainable water management in complex agricultural systems, offering a scalable solution for regions facing fragmented landscapes and climate-driven water scarcity.

1. Introduction

Water resources are a critical factor in agricultural production; statistical analyses indicate that agricultural irrigation accounts for approximately 70% of global water use, and 90% of the water consumed is used for agricultural production [1,2]. Currently, under the influence of natural geographical conditions and climate change, agricultural development in China is also facing significant challenges related to water scarcity [3]. Traditional agricultural irrigation methods are inefficient and wasteful, resulting in agricultural water use that often exceeds actual demand by a considerable degree [4,5]. Therefore, effectively improving the utilization of agricultural water resources not only alleviates the strain on water resources and meets the needs of agricultural development but also further conserves water, protects the ecological environment, and adapts to climate change.
Optimizing the allocation of water resources plays a crucial role in water conservancy efforts. However, there are differences in socio-economic levels, water resource conditions, and other factors between regions. Moreover, the water resource challenges faced by a region vary depending on its stage of social and economic development. Therefore, when conducting water resource optimization, selecting an appropriate research scope is especially important. Currently, research typically divides study areas into irrigation zones, river basins, and administrative regions to better understand and address issues in water resource management. Research on optimizing agricultural irrigation water resources mainly focuses on the allocation of water resources for different crops, at various growth stages, and across multiple water sources. Common mathematical models include linear programming, dynamic programming, fuzzy decision making, and statistical models [6,7,8].
With the increasing prominence of water resource conflicts, agricultural water resource optimization models are evolving toward multi-objective and multi-level approaches, which not only consider economic benefits but also emphasize the coordinated development of the ecological environment. For example, Tang et al. [9] established a new multi-objective optimization model of water resources based on structural water shortage risks and fairness. The model was applied to optimize the allocation of water resources in Wusu City in China and provided a feasible solution to address the optimal allocation of water resources. Liu et al. [10] established a multi-objective optimization model for soil-water resource allocation in winter wheat, summer maize, peanut, and cotton cropping systems. The study employed the non-dominated sorting genetic algorithm-II (NSGA-II) to simultaneously maximize economic benefits and enhance water use efficiency, with total water consumption serving as the critical constraint. Li et al. [11] developed a multi-scale multi-objective programming model to optimize the concurrent allocation of irrigation water and cropland resources, aiming to reconcile the conflicting demands between agricultural profitability and the sustainable development of irrigation zones. The model can help plan irrigation water and cropland resources in a sustainable way.
The rapid development of computer technology has driven the adoption of novel intelligent algorithms in agricultural irrigation water optimization research [12]. For instance, Wang and Huang [13] introduced a methodology known as multi-stage Taguchi-factorial two-stage stochastic programming (MTTSP). This approach was validated in the context of water resource management issues and demonstrated the capability to produce various decision alternatives across different scenarios. Tarebari et al. [14] developed a multi-objective water resource allocation model for Lake Urmia, aiming to address socio-economic and environmental objectives while meeting production, domestic, and ecological demands.
In the formulation of models for the optimization of water resources, conventional techniques such as linear programming (LP), nonlinear programming (NP), and dynamic programming (DP) are frequently employed [15,16,17]. However, regional water resource systems typically involve multiple water sources, water users, and supply lines, making the optimization process complex and prone to various uncertainties [18]. As a result, a substantial amount of research on the theory and practice of uncertain systems analysis has been conducted, including interval mathematical programming (IMP), fuzzy mathematical programming (FMP), and stochastic mathematical programming (SMP) [19,20]. These studies have provided more pragmatic recommendations and strategies for water resource management. Specifically, the IMP approach can effectively address the uncertainties present in water resource systems by constructing interval models to describe the range of uncertainty, allowing for a more comprehensive evaluation of the feasibility and robustness of different scenarios [21,22,23]. Although the IMP framework exhibits robustness in managing uncertainties, its practical efficacy is constrained by inherent limitations, particularly its susceptibility to outliers, which can induce significant biases in interval estimation. Consequently, hybrid approaches often integrate interval programming with complementary uncertain optimization methodologies to enhance solution reliability [24,25]. Among these, two-stage stochastic programming (TSP) has emerged as a widely recognized paradigm for addressing decision making under stochastic uncertainty, owing to its capacity to systematically model sequential decisions and probabilistic scenario decomposition [26,27]. Interval two-stage stochastic programming (ITSP) synergizes IMP’s interval robustness with TSP’s sequential decision making, particularly in water resource optimization under hydrological uncertainty, leveraging distribution-free interval parameters to reduce data dependency while addressing stochastic scenarios without distributional assumptions [22,28].
Building on these methodological advancements, recent advances in deep learning, particularly long short-term memory (LSTM) networks and related recurrent neural architectures have further enhanced predictive capabilities for agricultural water management [29]. Deep learning models excel in capturing complex temporal dependencies in hydrometeorological data, enabling agricultural water use forecasting [30], crop evapotranspiration [31], and accurately predicting water quality in agricultural watersheds [32]. For instance, LSTMs have been integrated with high-resolution remote sensing data to predict soil moisture and irrigation optimization [33]. Despite their proven efficacy in forecasting hydrological variables for crops, applications in perennial tree crops like citrus, where irrigation scheduling must account for multi-stage phenological cycles and fragmented topography, remain nascent [34]. This gap highlights the need for adaptive frameworks that combine AI-driven predictions with robust optimization methods to address the unique challenges of perennial crops in heterogeneous landscapes.
Despite the predominant focus of agricultural irrigation water allocation research on staple crops like rice, wheat, and maize [35,36], citrus crops (a critical economic crop in southern China) have received limited attention in optimization frameworks. Unlike short-cycle annual crops, citrus exhibits long-term growth cycles (10 to 20 years) and stage-specific water requirements (e.g., blooming, fruit maturation), necessitating allocation strategies that balance immediate yield stability with long-term orchard health. Furthermore, staple crops are cultivated in contiguous flat lands, whereas citrus is predominantly grown in fragmented mountainous regions, requiring zonal partitioning to account for spatially variable water supply and demand. Zhijiang City, located in southeastern Hubei Province, exemplifies this challenge, with citrus occupying 24,687 hm2 as a key economic crop. Although its subtropical monsoon climate offers abundant rainfall, uneven spatiotemporal precipitation distribution frequently causes water shortages during critical citrus growth stages, directly threatening yield and fruit quality [37].
To address these challenges, this study first stratifies citrus planting areas based on hydrological demand–supply characteristics. Subsequently, long short-term memory (LSTM) networks are employed to forecast irrigation water demand and supply dynamics. Finally, an interval two-stage stochastic programming (ITSP) model is developed to optimize irrigation allocation strategies under variable inflow scenarios, leveraging distribution-free interval analysis to enhance decision robustness in stochastic environments. This integrated approach bridges the research gap in citrus irrigation optimization while advancing sustainable water management practices and mitigating ecological risks in fragmented mountainous regions.

2. Materials and Methods

2.1. Study Area

Anfusi Town (111°51′–111°64′ E, 30°43′–30°58′ N), a major citrus-producing region in the middle and lower Yangtze River basin under Zhijiang City, Hubei Province, China, is characterized by a subtropical monsoon climate with pronounced seasonal contrasts and abundant rainfall (Figure 1). Spanning 25 administrative villages, the region experiences annual temperatures of 13.0–17.6 °C, with pronounced precipitation (997–1406 mm) concentrated between April and September, followed by dry winter conditions (October–March) that frequently induce droughts. Despite this, precipitation distribution remains highly uneven, with 60% of citrus water demand met by rainfall during its growth phase. However, climate change has intensified precipitation variability, exacerbating risks of water stress. Insufficient rainfall or prolonged dry spells during critical growth stages cause wilting and fruit drop, while excessive rainfall events lead to waterlogging, damaging root systems and impairing fruit quality [34,38]. These challenges highlight the urgent need for robust water resource management to enhance agricultural resilience, mitigate drought/flood risks, and ensure sustainable citrus production.

2.2. Research Framework

This study proposes a framework integrating LSTM neural networks and to optimize citrus irrigation in Anfusi Town. Based on available water supply conditions, the study area was divided into three citrus-growing zones. LSTM forecasts water supply and demand using historical data on precipitation and crop growth patterns. ITSP formulates robust allocation strategies under uncertain inflows via distribution-free interval analysis, balancing economic returns and water constraints. This dual-model approach generates adaptive irrigation plans tailored to seasonal precipitation fluctuations, mitigating drought/flood risks and ensuring sustainable citrus production under climate variability (Figure 2).
In fragmented citrus zones with heterogeneous microclimates, the non-linear interactions between climate variables (e.g., temperature, precipitation) and crop water requirements cannot be effectively captured by static or linear regression approaches. The LSTM model, as implemented in this study, explicitly addresses these challenges by learning sequential dependencies in the data, such as prolonged droughts or abrupt rainfall shifts. This dynamic capability is essential for optimizing water allocation in Anfusi Town, where localized mismatches between supply (derived from reservoir and weir data) and demand necessitate real-time adjustments. By integrating LSTM, the framework not only handles temporal complexity but also provides robust predictions for different scenarios in the planning year.

2.3. Available Water Supply Calculation

Based on the irrigation quotas for various crops, planting areas, and the annual water supply data from the reservoirs and weirs in Anfusi Town, the calculation of the annual water supply for citrus cultivation is as follows:
W i = h i   × p   × G × B i / ( j = 1 J M i j A i j     )    
where W i is the available irrigation water supply for citrus from the reservoir (or weir) in village i, 106 m3; h i is the total water supply from the reservoir (or weir) in village i, 106 m3; p is the percentage of agricultural water use out of the total water use; G is the irrigation quota for citrus, m3/hm2; B i is the citrus planting area in village i in hectares, hm2; M i j is the irrigation quota for crop j in village i, m3/hm2; A i j is the planting area of crop j in village i, hm2; i represents different villages, i = 1,2 , , I ; j represents different types of crops, j = 1,2 , , J .
The available water supply for citrus planting in 2023 as shown in Table S1 (see in the Supplementary Information).

2.4. Citrus Irrigation Water Requirement Calculation

The crop net irrigation requirement (IR) is a direct measure of the crop’s irrigation water demand and is equal to the difference between the citrus water requirement and the effective precipitation, representing the amount of water required to meet leakage losses, evapotranspiration, and other water needs.
I R = E T c P e
where IR is the crop net irrigation requirement, mm; ETc is the daily water requirement of citrus, mm; Pe is the effective precipitation during the crop growth period, mm.
The specific calculation formula for the daily water requirement of citrus ETc is shown in the following Formula (2b).
E T c = E T 0 × K c
where ETc is the daily water requirement of citrus, mm; K c is the crop coefficient for citrus.
ET0 is calculated using the Penman–Monteith model for daily potential evapotranspiration (ET0), as shown in the following Formula (2c).
E T 0 = 0.048 R n G + γ 900 T + 273 U 2 ( e s e α ) + γ ( 1 + 0.34 U 2 )
where is the slope of the saturated water vapor pressure versus temperature curve, kPa·°C−1; R n is the net radiation at the canopy surface, MJ·m−2·d−1; G is the soil heat flux, MJ·m−2·d−1; γ is the humidity constant, kPa·°C−1; T   is the daily average temperature, °C; U 2 is the wind speed at 2 m above the ground, m·s−1; e s is the saturated water vapor pressure, kPa; e α is the actual water vapor pressure, kPa.
According to the standard of citrus irrigation water quota in the study area, and with reference to the temperature indices and growth stages of citrus fruits in southern citrus planting zones [39], the citrus crop coefficients Kc for different regions of the study area have been proposed, as shown in Table 1 below.
The effective precipitation for each growth stage of citrus is calculated using the method recommended by the United States Department of Agriculture (USDA). This method employs the soil moisture balance approach, taking evapotranspiration, precipitation, and irrigation into account. It is one of the most widely recognized and commonly used methods among various effective precipitation calculation methods [40,41]. The method has been validated through years of practical experience, demonstrating high reliability and accuracy.
P e = P × ( 4.17 0.2 P ) / 4.17       P i 8.3   m m 4.17 + 0.1 P                                                     P i > 8.3   m m
where Pe represents the daily effective precipitation, and P represents the daily precipitation.

2.5. Water Supply and Demand Prediction Based on the Long Short-Term Memory Method

Long short-term memory (LSTM) is a variant of the Recurrent Neural Network (RNN), first proposed by Hochreiter and Schmidhuber in 1997 [42]. Compared to traditional RNNs, LSTM has stronger memory capabilities and is better at handling long-term dependencies. In an LSTM neural network, there are three key gating units to achieve the update of information and dynamic memory. Specifically, the function of   f ( t ) is to control the forgetting or retention of certain information from the previous time step C ( t 1 ) ; i ( t ) is used to determine which important information in C ( t ) should be retained, thus updating the information from C ( t 1 ) ; and O ( t ) is used to decide which relevant information from C ( t ) should be output to h ( t ) . The LSTM neural network achieves the update and dynamic memory of information in C ( t ) and h ( t ) through these gating units, and the mathematical formulas are shown below.
f ( t ) = σ ( ( i = 1 p   x i t W i k x f + j = p + 1 p + q   h j t 1 W j k h f ) + b k f ) , k = 1,2 , ... , q
  i ( t ) = σ ( ( i = 1 p   x i t W i k . n i + j = p + 1 p + q   h j t 1 W j k h i ) + b k i ) , k = 1,2 , ... , q
o ( t ) = σ ( ( i = 1 p   x i t W i k x o + j = p + 1 p + q   h j 1 W j k h o ) + b k o ) , k = 1,2 , ... , q
c ( t ) = t a n h ( ( i = 1 p   x i t W i k x c + j = p + 1 p + q   h j t 1 W j k h c ) + b k c ) , k = 1,2 , ... , q
where f ( t ) , O ( t ) , i ( t ) , C ( t ) represent the forget gate, input gate, output gate, and the output of the candidate cell state, respectively. x i t denotes the input at the current time step, and h i t 1 represents the hidden state at the previous time step. W and b are the weight matrix and bias vector corresponding to each gating unit, which are the parameters the network needs to learn. p and q represent the input dimension and the number of hidden layer nodes, respectively. σ ( ) represents the sigmoid nonlinear activation function, and t a n h ( ) represents the hyperbolic tangent activation function. The updated cell state C ( t ) and unit output h ( t ) are:
C ( t ) = f ( t ) C ( t 1 ) + i ( t ) c ( t )
h ( t ) = o ( t ) t a n h ( C ( t ) )
⊙ represents the element-wise vector multiplication. The final network output y ( t ) can be expressed as:
y ( t ) = g ( k = 1 q   W k y ( o ( t ) t a n h ( f ( t ) C ( t 1 ) + i ( t ) c ( t ) ) ) + b y
This study utilizes meteorological data from the Zhijiang City Meteorological Station spanning 1971 to 2023, including daily precipitation, relative humidity, maximum and minimum temperatures, wind speed, sunlight, and evaporation, to calculate the net irrigation water requirement for citrus cultivation in Anfusi Town over the past 52 years using Formulas (2a)–(2d) (see Table S2 in the Supplementary Information). To predict the net irrigation water requirement for 2025, an LSTM neural network model with a monthly time step was trained in MATLAB R2023b. The model employs a 5-layer deep learning architecture, and through multiple trials, key parameters were optimized: 200 hidden units, a learning rate drop period of 800, a learning rate drop factor of 0.1, and 1000 training iterations. Historical surface water supply data for citrus irrigation over the past 15 years were divided into 12 years for training and 3 years for validation, with the average metrics from six experiments used as final indicators. The predicted results provide the available water supply for citrus irrigation reservoirs and weirs in Anfusi Town for both high- and low-flow scenarios in 2025, as detailed in Table S3 (see the Supplementary Information).

2.6. Establishment of Interval Two-Stage Stochastic Programming Model

This paper determines the optimal allocation of irrigation water resources for the citrus planting zones in Anfusi Town, considering spatially varying water supply capacities. The first stage determines pre-allocation targets based on historical crop water requirements, serving as primary decision variables. As citrus crops are usually grown in mountainous and dispersed areas, leading to large variations in irrigation management, different water supply capacities in different regions may lead to insufficient water supply, prompting the second phase of adaptation measures: reducing the amount of water rationed (yield penalties) or obtaining water externally (incurring costs), both of which are quantified by penalty coefficients. The model minimizes total costs (water usage and scarcity penalties) by dynamically balancing allocation adjustments across stages, integrating water availability constraints into a unified objective function. This framework enhances decision robustness under climatic variability, ensuring resilient water resource management in agricultural systems. The model’s objective function is as follows:
M a x   f = i = 1 I j = 1 3 B i j W i j E i = 1 I j = 1 J C i j S i j
where f represents the net profit of the system, CNY; Bij represents the system benefit when water source i allocates water to citrus planting area j, CNY/m3; Wij represents the pre-allocation water target for water source i to citrus planting area j, m3; Cij represents the penalty coefficient for water shortage when water source i fails to meet the pre-allocation target for citrus planting area j, CNY/m3, where C > B; Sij represents the shortage of water when water source i fails to meet the pre-allocation water target for citrus planting area j, m3; i indicates different water sources, where i = 1 , 2 , , I ; j indicates different citrus planting sub-areas, where j = 1,2 , 3 .
Since the inflow volume significantly affects the water shortage, the water shortage under different inflow levels is treated using a discrete function. It is assumed that the probability of different inflow levels is Ph, 0 < Ph < 1 (h = 1, 2, 3). h = 1 represents the lowest inflow level, with the maximum water shortage; h = 2 represents a medium inflow level; h = 3 represents the highest inflow level, with the minimum water shortage; Additionally, h = 1 3 P h = 1 . Thus, the objective function of the ITSP model can be expressed as:
M a x   f = i = 1 I j = 1 J B i j W i j i = 1 I j = 1 J C i j h = 1 3 P h S i j h
where Sijh indicates the water shortage when the water supply level is h, and water source i supplies water to citrus planting area j, but fails to meet the pre-set water distribution target, m3.
To address the uncertainty of the model’s pre-set water distribution target, yield, and penalty coefficients, interval parameters are introduced to construct the model. This approach allows for more accurate consideration of the possible value ranges and enables calculations and analysis based on specific situations. The “+” represents the upper limit of the parameter, and the “−” represents the lower limit of the parameter. The objective function of the ITSP model can be expressed as:
M a x   f ± = i = 1 I j = 1 J B i j ± W i j ± i = 1 I j = 1 J C i j h = 1 3 P h S i j h ±
where f ± represents the net system profit, CNY; B i j ± represents the system profit when water source i supplies water to citrus planting area j, CNY/m3; W i j ± represents the pre-set water distribution target from water source i to citrus planting area j, m3; Cij represents the penalty coefficient for the water shortage when water source i fails to meet the pre-set water distribution target for citrus planting area j, CNY/m3, where (C > B); Ph represents the probability of different water supply levels, with 0 < Ph < 1, where h = 1, 2, 3. h = 1 represents the lowest water supply level, with the highest water shortage; h = 2 represents a moderate water supply level; h = 3 represents the highest water supply level, with the lowest water shortage. S i j h ± represents the water shortage when water source i fails to meet the pre-set water distribution target for citrus planting area j at water supply level h, m3; i represents different water sources, where i = 1,2 , , I ; j represents different citrus planting areas, where j = 1, 2, 3.
Constraints:
(1)
Available water supply constraint for water sources:
j = 1 J W i j ± S i j h ± Q i h m a x   ±   ,     j , h      
where Q i h m a x ± represents the maximum available water supply from water source i, m3;
(2)
Crop water requirement constraint:
W j m i n i = 1 I W i j ± W j m a x ,   i , j
where W j m i n represents the minimum water requirement for the normal growth of citrus in the j planting area, m3; W j m a x represents the maximum water requirement for the normal growth of citrus in the j planting area.
(3)
Non-negativity constraint:
W i j ± 0 ,   i , j

2.7. Solution of the Interval Two-Stage Stochastic Programming Model

Due to the constraints of linear programming, when the pre-distributed water amount Wij± is expressed as an interval value, the model’s solution cannot be calculated. In this study, a decision variable z i j is introduced, where W i j ± = W i j + W i j z i j , with z i j [0,1], and W i j = W i j + W i j . When z i j = 1, Wij± reaches its upper bound, meaning the pre-distributed water target is at its maximum value, but the risk is also at its highest. When z i j = 0, Wij± reaches its lower bound, meaning the pre-distributed water target is at its minimum value, resulting in the lowest total benefit for the water resource system and the least risk. At this point, the model can be transformed into:
Objective function:
M a x   f ± = i = 1 I j = 1 J B i j ± W i j + W i j z i j i = 1 I j = 1 J h = 1 h P i h C i j ± S i j h ±
Constraints:
i = 1 I ( W i j + W i j z i j S i j h ± ) Q i h m a x   ±   ,   i , h
W j m i n ± i = 1 n W i j + W i j z i j W j m a x ± ,   i , j
( W i j + W i j z i j ) S i j h ± 0 ,   i , j , h
0 z i j 1
The model is transformed into two deterministic sub-models through an interactive algorithm, which represent the upper and lower bounds, respectively. Since the objective is to maximize the system’s benefits, the upper bound sub-model is solved first:
Objective function:
M a x   f + = i = 1 I j = 1 J B i j + ( W i j + W i j z i j ) i = 1 I j = 1 J h = 1 h P i h C i j S i j h
Constraints:
i = 1 I ( W i j + W i j z i j S i j h ) Q i h m a x   +   ,   i , h
W j m i n i = 1 I ( W i j + W i j z i j ) W j m a x + ,   i , j
W i j + W i j z i j S i j h 0 ,   i , j , h
0 z i j 1
where z i j and S i j   are decision variables, with   z i j o p t and S i j o p t   defined as the solutions to the model. By applying the equation W i j ± = W i j + W i j z i j , the expected available water volume W i j ± for each citrus planting area can be calculated. Substituting z i j o p t into the model’s lower bound:
Objective function:
M a x   f = i = 1 I j = 1 J B i j   ( W i j + W i j z i j o p t ) i = 1 I j = 1 J h = 1 h P i h C i j + S i j h +
Constraints:
i = 1 I ( W i j + W i j z i j o p t S i j h + ) Q i h m a x     ,   i , h
W j m i n + i = 1 n ( W i j + W i j z i j o p t ) W j m a x ,   i , j
( W i j + W i j z i j o p t ) S i j k 0 ,   i , j , h
S i j h + S i j h o p t 0 ,   i , j , h
where S i j +   is a decision variable. By solving the lower bound sub-model, the solution to the lower bound sub-model is obtained, which results in S i j o p t + , f o p t . The optimal solution to the model is:
f o p t ± = [ f o p t , f o p t + ]
S i j h o p t ± = [ S i j h o p t , S i j h o p t + ]
The optimal water allocation objective W i j o p t :
W i j o p t = W i j + W i j z i j o p t ,   i , j
The optimal water allocation amount M i j h o p t ± :
M i j h o p t ± = W i j o p t S i j h o p t ± ,   i , j , k

2.8. Profit Coefficient

In water resource allocation systems, economic benefits are realized when available water satisfies predetermined allocation targets. Conversely, water scarcity penalties are incurred when supply falls short of these targets. A critical relationship exists between the unit water usage benefit and the water shortage penalty coefficient. In this study, the benefit-to-penalty ratio is empirically established at 1:1.3, reflecting the trade-off between optimal resource utilization and deficit mitigation costs. This ratio ensures proportional weighting of surplus benefits against scarcity penalties, thereby enhancing the model’s capacity to balance system efficiency and resilience under stochastic water availability. The benefit coefficient is calculated using Formula (10):
S = (P × L)/Q
where S represents the system’s benefit coefficient, CNY/m3; P is the purchase price, CNY/kg; L is the yield per unit area, kg/hm2; and Q is the irrigation water usage per unit area, m3/hm2.

3. Results

3.1. Water Resource Zoning Strategies and Supply–Demand Balance for Citrus Irrigation

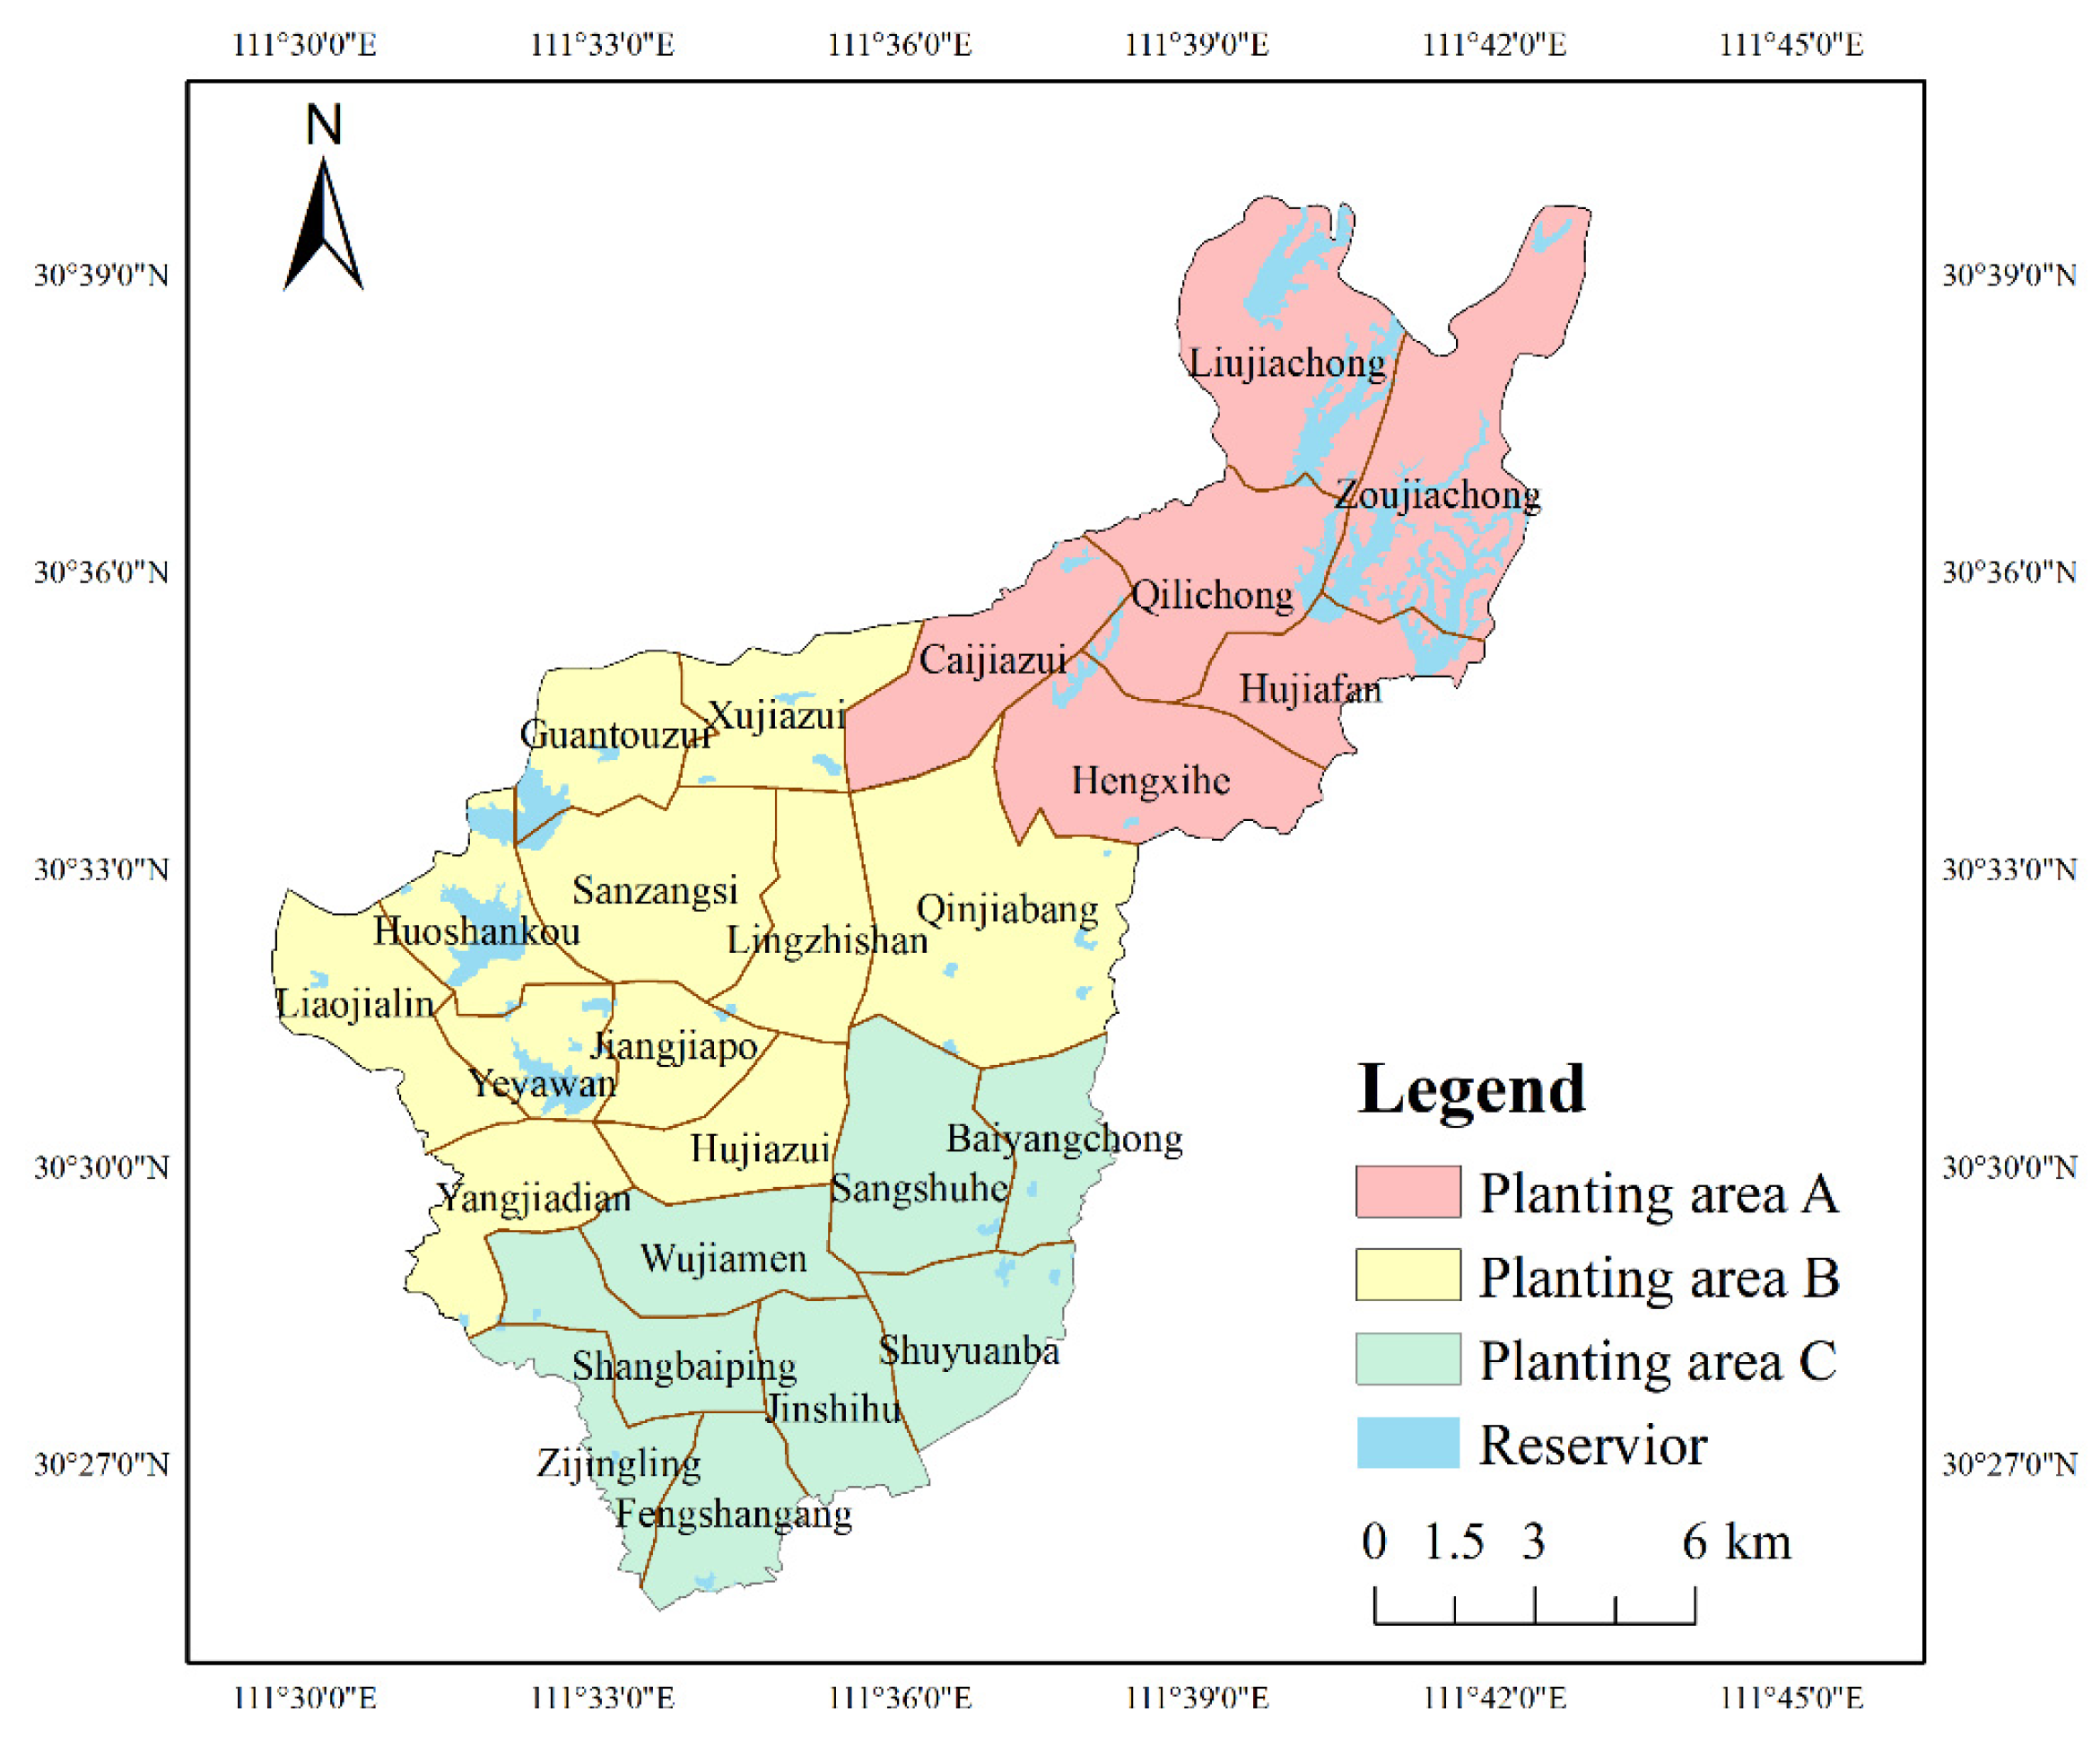
Anfusi Town’s citrus cultivation is spatially uneven, with the largest planting zone concentrated in the southwestern region, followed by smaller zones in the northeastern and southeastern parts, corresponding to peak water demand in the southwest and lower demands in the northeast and southeast. Furthermore, water resources are spatially mismatched with demand, as major reservoirs, including the medium-sized Huoshankou and Banmenxi reservoirs in the southwest and Hujiafan, Longtouqiao, and Liujiacong reservoirs in the northeast, which provide irrigation and domestic water to local villages. While the southeastern region suffers from limited water infrastructure, necessitating external water sourcing to meet citrus irrigation needs. To optimize allocation, the town is categorized into three zones (Figure 3) based on water availability. Specifically, citrus planting zone A (northeast) encompasses six villages (Caijiazui, Hengxihe, Hujiafan, Liujiachong, Qilichong, Zoujiachong) with the highest water supply (10.42 × 10⁶ m3) and moderate planting area (2077.67 hm2), yielding the highest unit-area water supply (5.02 × 10³ m3/hm2); citrus planting zone B (southwest) covers nine villages (Guantou, Huoshankou, Jiangjiapo, etc.) with the largest citrus zone (3520.67 hm2) but moderate water availability (6.38 × 10⁶ m3), resulting in 1.81 × 10³ m3/hm2 per unit area; citrus planting zone C (southeast) includes ten villages with the smallest water supply (2.15 × 10⁶ m3) and planting area of 2265.33 hm2, giving the lowest unit-area availability (949 m3/hm2). Water supply zones (a, b, c) are mapped to reservoir clusters (Table 2), highlighting the need for inter-zonal redistribution to balance supply–demand disparities, enabling targeted optimization under constrained resources.
Based on Equations (2a)–(2d), the 2023 irrigation water demand, effective precipitation, and evapotranspiration for citrus cultivation in Anfusi Town were calculated as 337.52 mm, 361.21 mm, and 678.73 mm, respectively. This corresponds to an irrigation water requirement of approximately 3375.00 m3/hm2 per unit planting area. Using the citrus planting area data, the irrigation water demands for the three spatially differentiated zones (A, B, and C) were further quantified (Table 2). Citrus irrigation water supply in Anfusi Town is derived from a combination of precipitation and surface water resources. A water supply–demand balance analysis was conducted using field-measured water utilization data and verified water supply statistics, revealing regional irrigation deficits for 2023. As shown in Table 2, citrus planting zone A achieved full irrigation water satisfaction due to its abundant supply (10.42 × 10⁶ m3), while citrus planting zones B and C faced significant deficits of 5.50 × 10⁶ m3 and 5.49 × 10⁶ m3, respectively. These deficits highlight the critical mismatch between water availability and agricultural demand in the spatially heterogeneous landscape of Anfusi Town.

3.2. Prediction of Water Supply and Demand for Citrus Irrigation in Planning Year

The LSTM model was employed to capture complex temporal dependencies in historical meteorological data, enabling accurate forecasting of irrigation water demands for citrus cultivation. The model demonstrated robust predictive capability for irrigation water demand forecasting, with performance metrics revealing strong alignment between predicted and observed values (Figure S1 and Table S5, see the Supplementary Information). On the training set, the model achieved an R2 of 0.7819, RMSE of 41.6133 mm, MAE of 33.0536 mm, and MBE of 1.4511 mm, indicating high accuracy in capturing temporal patterns. While the test set performance slightly declined (R2 = 0.5645, RMSE = 58.8234 mm, MAE = 77.2678 mm, MBE = 0.5525 mm), this discrepancy may reflect inherent variability in unobserved hydrological conditions or minor overfitting to training data.
To mitigate prediction variability, the LSTM model’s outputs were ensemble-averaged across six experimental runs to derive final metrics. The predicted 2025 net irrigation water demand for citrus cultivation in Anfusi Town is 330.53 mm, corresponding to 3300.00 m3/hm2 per unit area. Using historical planting area data, the irrigation water demands for citrus planting zones A, B, and C were calculated as 6.86 × 10⁶ m3, 11.62 × 10⁶ m3, and 7.47 × 10⁶ m3, respectively. Concurrently, the LSTM model forecasted 2025 water availability from reservoirs and weirs for citrus irrigation (Table 3). Reservoirs remain the dominant water source, contributing [11.01, 11.80] × 106 m3, [7.18, 7.81] × 106 m3, and [2.31, 2.71] × 106 m3 to water supply zones a, b, and c, respectively. While weirs provide limited water volumes, their geographic proximity to citrus areas enhances accessibility, particularly during dry seasons [43].
To account for supply uncertainty, three probabilistic scenarios were defined: low (0.2 probability), medium (0.6), and high (0.2) water availability (Table 4). The medium scenario aligns with the base values in Table 3, while high and low scenarios scale supply by ±20% (e.g., [13.21, 14.16] × 106 m3 for zone a at high supply vs. [8.81, 9.44] × 106 m3 at low). Comparing 2025 predictions with 2023 data (Table 2), medium- and high-level supplies increased relative to prior years, but deficits persisted in citrus planting zones B and C. Specifically, citrus planting zone A achieved full irrigation satisfaction across all scenarios due to reservoir surpluses, whereas citrus planting zones B and C faced deficits of [2.25, 5.87] × 106 m3 and [4.23, 5.62] × 106 m3, respectively, underscoring unresolved water shortages without inter-zonal redistribution. These findings highlight the critical need for adaptive water management strategies to reconcile spatial and probabilistic supply–demand imbalances in Anfusi Town’s citrus sector.

3.3. Target Value of Citrus Water Distribution in Advance

The LSTM model was applied to forecast the 2025 irrigation requirement (IR) for citrus cultivation in Anfusi Town, yielding a net irrigation water demand of 330.53 mm. To account for inter-annual climatic variability, hydrological years were classified based on precipitation guarantee rates: 25% (wet year), 50% (normal year), and 75% (dry year). Historical data from Zhijiang City indicated that the average dry-year IR was 312.22 mm (equivalent to 3122.25 m3/hm2 per unit area), while the wet-year IR reached 370.69 mm (3706.95 m3/hm2). Consequently, the 2025 citrus irrigation water demand for Anfusi Town was defined as an interval [3122.25, 3706.95] m3/hm2, reflecting spatially averaged climatic conditions across hydrological scenarios.
To optimize water resource allocation while minimizing external supply costs, a 2:1 ratio of local to external water sources was calibrated based on regional economic data, including significantly lower transportation costs (CNY 0.15/m3 for local vs. CNY 0.35/m3 for external sources), infrastructure limitations, and policy priorities favoring self-sufficiency in water-stressed zones. To optimize water resource allocation while minimizing external supply costs, this ratio was adopted to prioritize cost-effective utilization of local reservoirs and weirs over expensive inter-basin transfers. A cost-benefit analysis evaluated multiple scenarios (e.g., 3:1, 1.5:1, and 1:1.5 ratios) and revealed critical trade-offs between cost efficiency, drought resilience, and operational flexibility. For instance, a 3:1 ratio reduced costs for high-value citrus zones but risked over-extraction during dry seasons, whereas a 1.5:1 ratio improved profitability without exceeding local supply capacities. These findings underscored the 2:1 ratio as a balanced compromise for the study region, effectively harmonizing economic feasibility with sustainable water management under regional constraints. This allocation strategy was integrated into the ITSP-LSTM framework to derive pre-allocated water targets for citrus planting zones A, B, and C in 2025 (Table 5). The resulting targets balance regional water availability with projected demand under varying hydrological conditions, ensuring both economic feasibility and agricultural resilience.

3.4. System Net Benefit and Penalty Rates per Unit Transferred Water

As a major citrus production center in Hubei Province, Anfusi Town exhibited a citrus acquisition price range of 0.7–0.9 CNY/kg in 2023, according to field survey data. Citrus cultivation is characterized by distinct growing and ripening seasons, with supply fluctuations directly impacting market prices. Furthermore, yield variability is influenced by climatic factors such as temperature and precipitation, which contribute to inter-annual price volatility. Based on historical trends and these agroclimatic dependencies, it is projected that citrus acquisition prices in Anfusi Town will remain within a stable range with minimal deviations over the long term. A conservative economic forecast estimates the 2025 citrus market price to range between 0.8 and 1.0 CNY/kg.
By integrating the projected unit-area yield and market price with Equation (10), the revenue and water shortage penalty coefficients for each citrus planting zone under different water source scenarios were quantified (Table 6). This analysis accounts for the economic trade-offs between irrigation efficiency and supply reliability, providing a critical basis for optimizing water allocation strategies in the region.

3.5. Optimal Water Allocation Schemes for Citrus Irrigation

The optimal water distribution plan for each citrus planting zone is presented in Table 7. By analyzing the decision variables z i j and target water allocation W i j in the citrus irrigation optimization model, the system aims to maximize revenue under probabilistic water supply scenarios. The relationship between water distribution volume and system revenue is directly proportional that higher allocations yield greater profits.
For citrus planting zone A, the pre-set water distribution target for water supply zone a is [3.24, 3.85] × 106 m3. Model analysis reveals that maximum revenue occurs when z 11 = 1 , corresponding to the upper limit of 3.85 × 10⁶ m3. At high water availability levels (Table 4), water supply zone a provides [13.21, 14.16] × 106 m3, far exceeding the pre-set upper bound. To mitigate water shortage penalties, the optimal allocation is fixed at the upper limit. For z 21 = 0 , water supply zone b’s optimal allocation is set to the lower limit of 1.62 × 10⁶ m3, aligning with its pre-set range [1.62, 1.92] × 106 m3. This strategy avoids severe penalties from excessive shortages while maximizing revenue. Similarly, for z 31 = 0 , water supply zone c’s allocation is fixed at the lower limit of 1.62 × 10⁶ m3. The allocation principles for other zones follow analogous logic and are detailed in (Figure 4).
For citrus planting zone B, the pre-set target for water supply zone a is [2.75, 3.26] × 106 m3. Maximum revenue is achieved when z 21 = 1 , setting the allocation to the upper limit of 3.26 × 10⁶ m3. At high availability levels, water supply zone b offers [8.62, 9.37] × 106 m3, exceeding the pre-set upper bound. To minimize penalty risks, the optimal allocation is fixed at the upper limit. When z 22 = 0.466 , water supply zone b’s allocation is optimized to 5.98 × 10⁶ m3, consistent with its pre-set range [5.50, 6.52] × 106 m3. This balances supply constraints and penalty avoidance. For z 32 = 0 , water supply zone c’s allocation is set to the lower limit of 2.75 × 10⁶ m3.
For citrus planting zone C, the pre-set target for water supply zone a is [1.77, 2.10] × 106 m3. Maximum revenue occurs at z 13 = 1 , fixing the allocation to the upper limit of 2.10 × 10⁶ m3. High availability levels in water supply zone c provide [2.77, 3.25] × 106 m3, significantly exceeding the pre-set upper bound. To mitigate penalties, the optimal allocation is set at the upper limit. When z 23 = 0 , water supply zone b’s allocation is 1.77 × 10⁶ m3, matching its pre-set range [1.77, 2.10] × 106 m3. For z 33 = 0 , water supply zone c’s allocation is fixed at the lower limit of 3.54 × 10⁶ m3.
These strategies consistently prioritize upper-limit allocations when supply exceeds preset targets, ensuring revenue maximization without penalties, while adhering to lower limits in constrained zones to mitigate shortage risks. Historical supply-capacity comparisons (Table 4) and allocation trends across years (Figure 4) validate this approach, demonstrating that the model effectively reconciles water availability, economic penalties, and profitability. By systematically aligning allocations with supply dynamics and penalty constraints, the framework provides a robust basis for sustainable citrus irrigation management in Anfusi Town.

4. Discussions

4.1. Stochastic Citrus Water Allocation Integrating Hydrological and Economic Factors

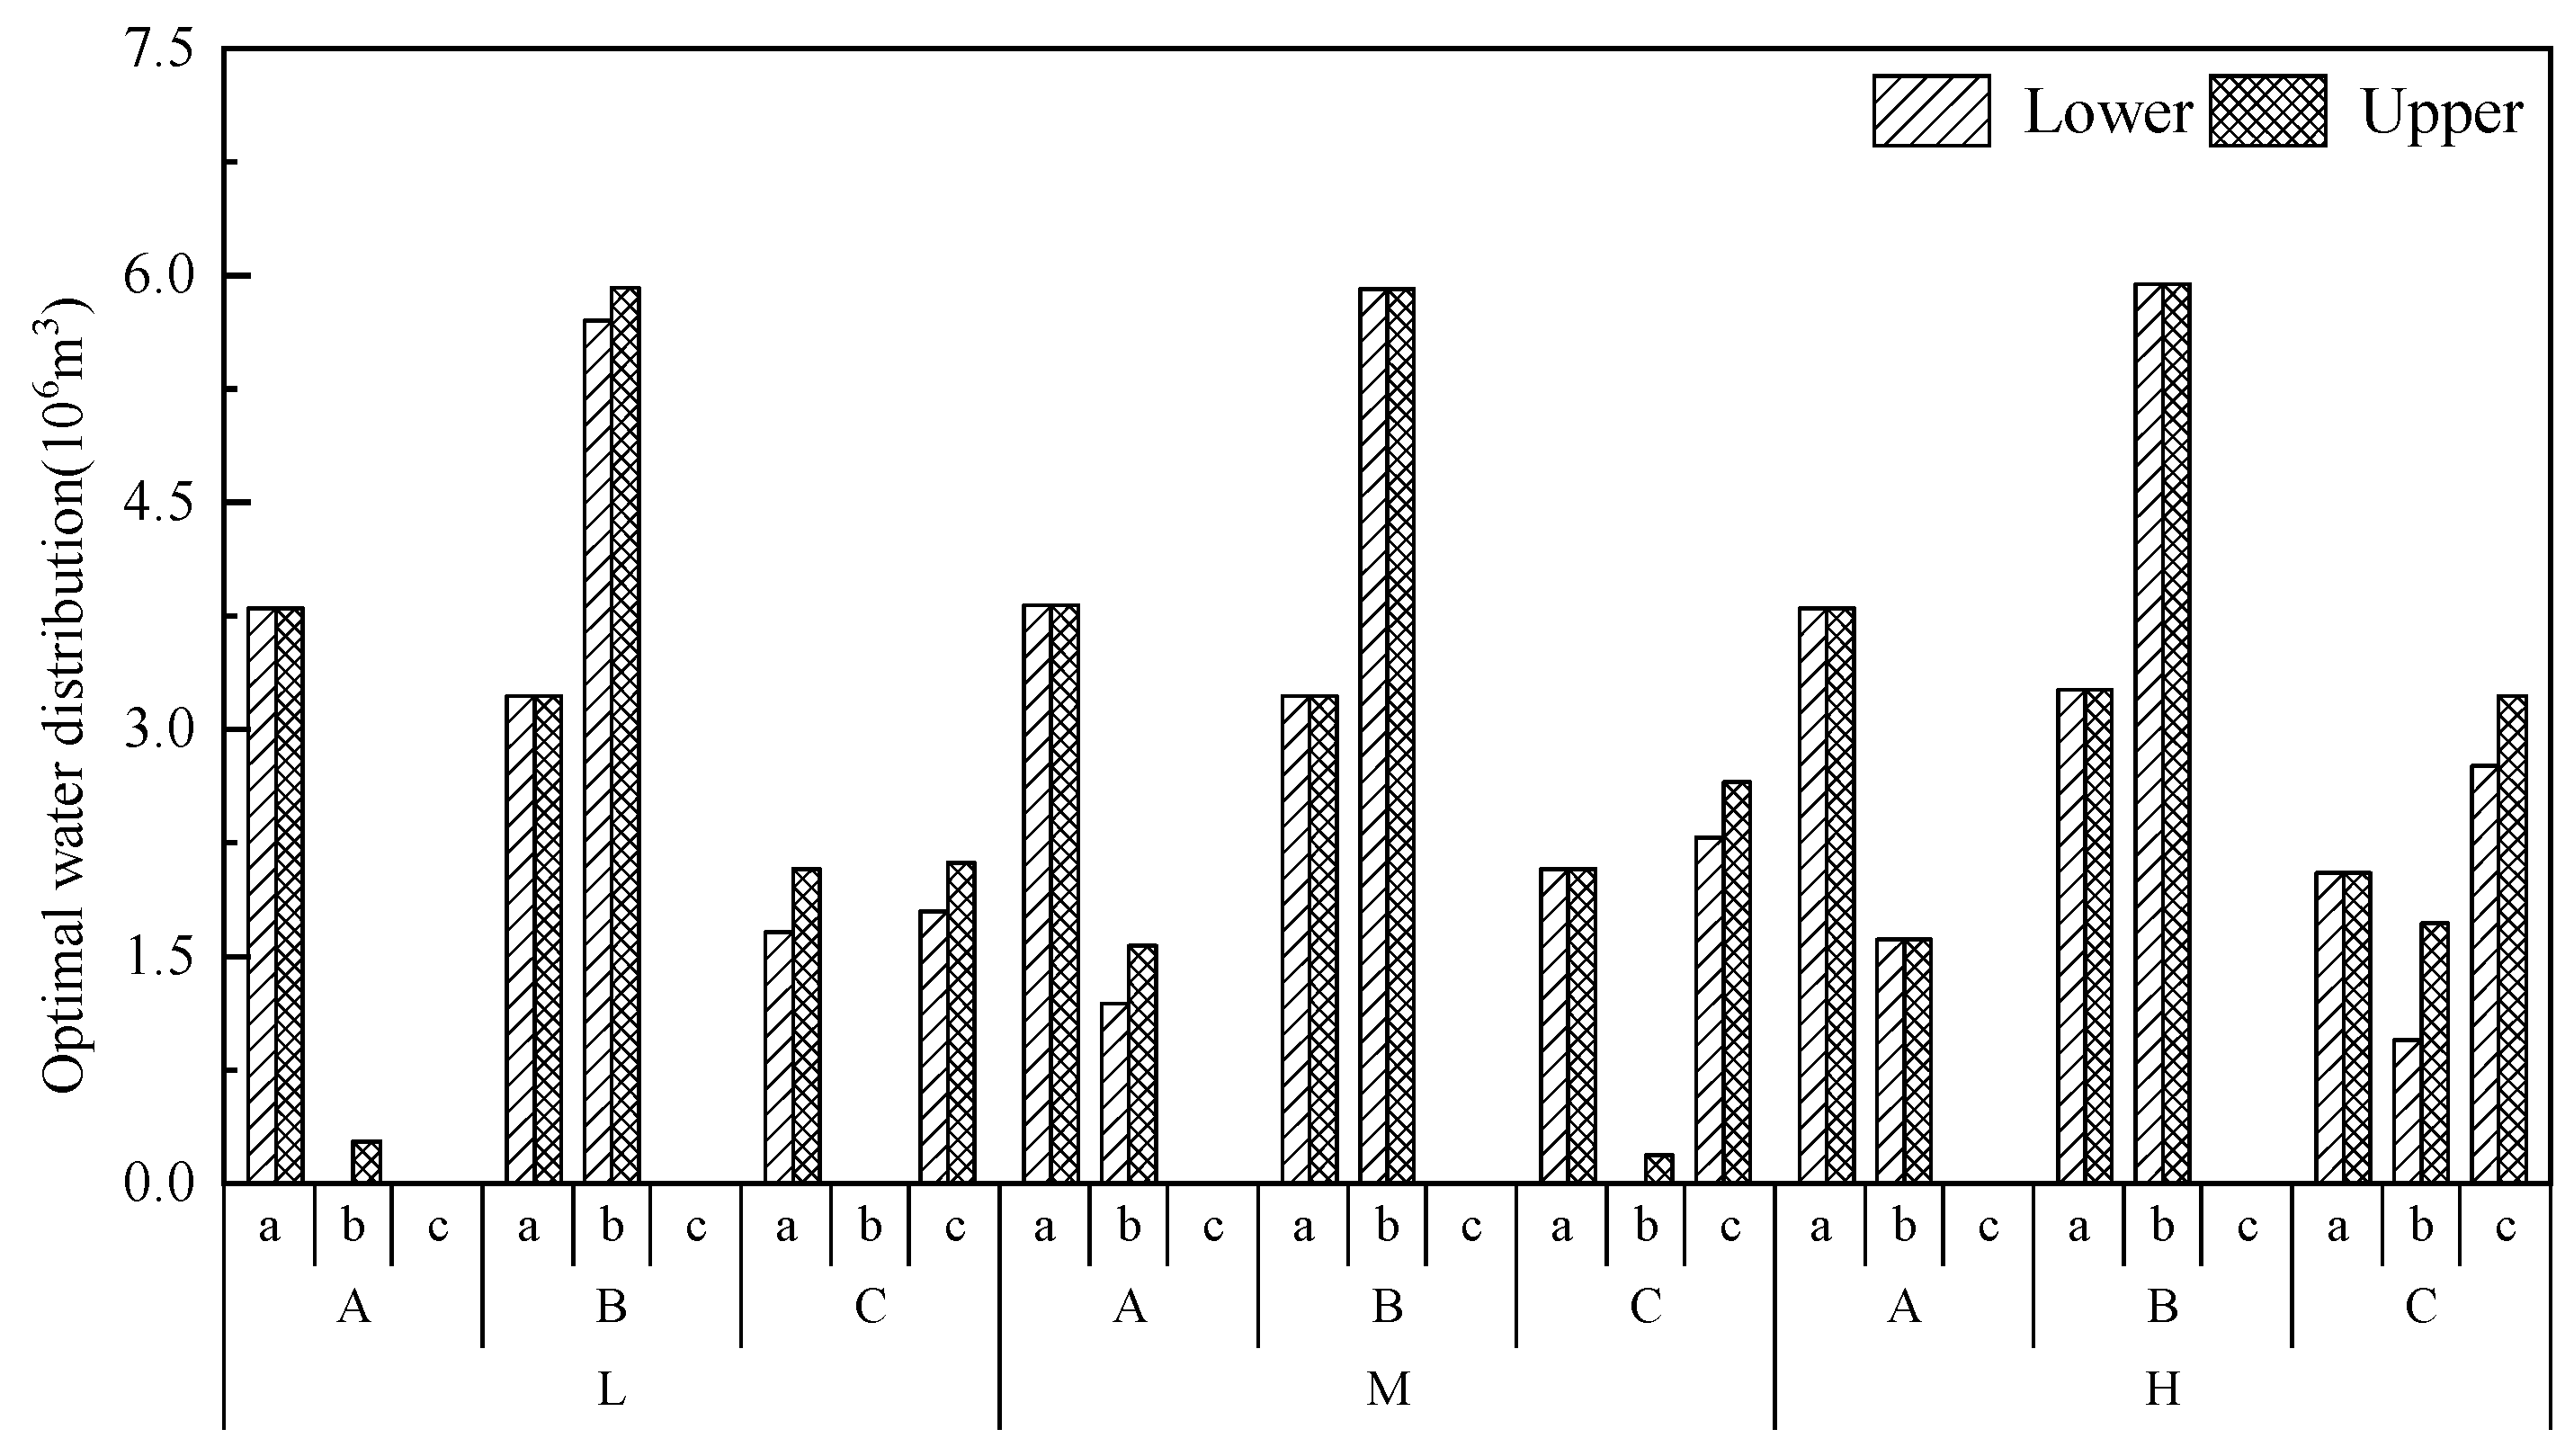
The proposed water allocation strategy for Anfusi Town’s citrus planting zones introduces a stochastic optimization framework that integrates probabilistic water inflow scenarios (low, medium, high) with economic prioritization. Unlike traditional deterministic models (e.g., linear programming or fixed ratio rationing), which often fail to account for hydrological uncertainty [23], our model dynamically adjusts allocations based on inflow levels. For instance, under low inflow conditions, water supply zone B exhibits deficits of [1.35, 1.62] × 106 m3 for citrus planting zone A, whereas the model reduces these gaps to [0, 0.41] × 106 m3 under medium inflow and eliminates them entirely under high inflow (Figure 5). This flexibility aligns with stochastic dual dynamic programming (SDDP) methods used in energy-water nexus studies [44,45] but extends their application to agricultural systems with crop-specific demand patterns.
A key innovation lies in the marginal benefit-driven prioritization of water supply zone C for citrus planting zone C. By allocating zero water from water supply zone C to citrus planting zone A across all inflow levels, the model ensures that high-value citrus production in citrus planting zone C is prioritized, even at the expense of localized deficits in citrus planting zone A. This mirrors economic optimization frameworks proposed by [46], who emphasize cost/benefit analysis in water distribution. However, our study uniquely integrates marginal benefit calculations with spatially explicit crop productivity data, enabling a more nuanced trade-off analysis than traditional economic models.

4.2. Spatial Heterogeneity and Trade-Offs in Citrus Water Allocation

The village-level allocation plan (Table S4) reveals significant spatial variability in water distribution, reflecting differences in citrus planting scales and local irrigation needs. For example, Hujiatan Village (largest citrus zone) receives 0.74 × 10⁶ m3 from water supply zone a, while Caijiazui Village (smallest zone) receives 0.59 × 10⁶ m3. This spatially explicit approach aligns with the principles of precision agriculture, yet it functions at the meso-level (ranging from watershed to village scales), thereby connecting macroeconomic optimization strategies with the practical feasibility of micro-level implementation.
However, the model’s prioritization of high marginal-benefit zones (e.g., citrus planting zone C) introduces trade-offs between economic efficiency and equity in water distribution. Under stochastic inflow conditions, the allocation strategy dynamically balances supply constraints, demand priorities, and penalty risks. For citrus planting zone A, water supply zone a consistently meets optimal targets, while water supply zone b remains deficit-prone under low and medium inflows. For example, during low inflow, villages in citrus planting zone A face water deficits proportional to their planting scales: Hujiatan Village (largest zone) incurs the largest deficit ([0.26, 0.31] × 106 m3), whereas Caijiazui Village (smallest zone) receives the minimal allocation (i.e., 0.59 × 10⁶ m3). Although deficits reduce under medium inflow, they persist, with Hujiatan receiving [0.23, 0.31] × 106 m3 from water supply zone b. Only under high inflow does water supply zone b fully satisfy citrus planting zone A’s needs. Notably, water supply zone c allocates zero water to citrus planting zone A across all inflow scenarios, as it prioritizes citrus planting zone C’s higher marginal returns. This design ensures that citrus planting zone A avoids severe shortage penalties by fulfilling essential irrigation needs, albeit at the cost of unmet optimal targets under low and medium flow conditions. The framework thus highlights the inherent tension between maximizing economic gains and addressing spatial inequities in water resource management under uncertainty.

5. Conclusions

This study addresses the critical challenge of optimizing water resource allocation in citrus-growing regions characterized by fragmented terrain and complex management systems, particularly in Anfusi Town, a major citrus production zone in the middle and lower reaches of the Yangtze River, China. By integrating interval two-stage stochastic programming (ITSP) with a long short-term memory (LSTM) neural network, the proposed methodology advances water resource optimization by simultaneously accounting for spatial heterogeneity and stochastic water supply–demand dynamics. The results demonstrate significant improvements over conventional approaches: in the current year scenario, the model achieves an 8.67% increase in system-wide benefits compared to baseline practices, achieved through prioritizing high-marginal-benefit citrus plantations and dynamically adjusting allocations across supply zones. For the planning year, the model identifies optimal water distribution thresholds (i.e., an upper limit of 3.85 × 10⁶ m3 for citrus planting zone A and lower limits of 1.62 × 10⁶ m3 for citrus planting zones B and C), which minimizes water scarcity penalties while maximizing net benefits. This study bridges a critical gap in existing research by addressing the unique spatial and stochastic complexities of citrus irrigation systems. Compared to deterministic models, the ITSP-LSTM approach offers a robust framework for balancing economic efficiency and operational reliability in regions facing fragmented landscapes and climate-driven water scarcity.
Crucially, the framework’s modular design allows it to be adapted to diverse agricultural contexts. For example, adjustments to crop-specific water demand intervals and phenological constraints can accommodate staple crops like rice or wheat, while modifications to infrastructure capacities (e.g., reservoir sizes, pipeline networks) and institutional rules (e.g., water rights, allocation policies) ensure applicability across varying governance structures. These features enhance its practical utility for regions with distinct climatic, hydrological, and policy environments.

Supplementary Materials

The following supporting information can be downloaded at: https://www.mdpi.com/article/10.3390/w17182665/s1, Table S1: Available water supply for citrus planting in Anfusi Town; Table S2: Data sheet for net irrigation water requirements for citrus (2005–2023); Table S3: Water supply for citrus planting in Anfusi Town for the planning year; Table S4: Water distribution program for citrus cultivation in Anfusi Town for planning year; Table S5: Performance metrics of the LSTM model; Figure S1: The performance of the LSTM model. (a) Prediction was performed using the irrigation requirement data from the first 45 years as the training set of the LSTM model. The blue line depicts the predicted values from the LSTM model, while the red line shows the original observed values. (b) Prediction was performed using the remaining 7 years of irrigation requirement data as a test set for the LSTM model. The blue line depicts the predicted values from the LSTM model, while the red line shows the original observed values.

Author Contributions

W.X.: writing—original draft, funding acquisition, project administration; R.H.: writing—original draft, data curation, methodology, investigation; Y.Z.: resources, investigation, data curation; Y.Y.: methodology, investigation; Y.C.: writing—review and editing, supervision; S.Z.: funding acquisition, Project administration. All authors have read and agreed to the published version of the manuscript.

Funding

This work was supported by the Youth Fund from the National Natural Science Foundation of China (52000120); the Key Scientific Research Projects of Water Conservancy in Hubei Province (HBSLKY201919 and HBSLKY202124); and the 111 project of Hubei Province.

Data Availability Statement

The data used in this study can be requested by the corresponding authors.

Acknowledgments

The authors are grateful to Yichang Municipal Bureau of Statistics and Zhijiang Municipal People’s Government for their provision of useful data.

Conflicts of Interest

The authors declare that they have no known competing financial interests or personal relationships that could have appeared to influence the work reported in this paper.

References

  1. Mehta, P.; Siebert, S.; Kummu, M.; Deng, Q.; Ali, T.; Marston, L.; Xie, W.; Davis, K.F. Half of Twenty-First Century Global Irrigation Expansion Has Been in Water-Stressed Regions. Nat. Water 2024, 2, 254–261. [Google Scholar] [CrossRef]
  2. Cao, X.; Wu, M.; Guo, X.; Zheng, Y.; Gong, Y.; Wu, N.; Wang, W. Assessing Water Scarcity in Agricultural Production System Based on the Generalized Water Resources and Water Footprint Framework. Sci. Total Environ. 2017, 609, 587–597. [Google Scholar] [CrossRef]
  3. Sun, S.; Zhou, T.; Wu, P.; Wang, Y.; Zhao, X.; Yin, Y. Impacts of Future Climate and Agricultural Land-use Changes on Regional Agricultural Water Use in a Large Irrigation District of Northwest China. Land Degrad. Dev. 2019, 30, 1158–1171. [Google Scholar] [CrossRef]
  4. Saccon, P. Water for Agriculture, Irrigation Management. Appl. Soil Ecol. 2018, 123, 793–796. [Google Scholar] [CrossRef]
  5. Shi, X.; Zhu, W. Spatio-Temporal Patterns and Drivers of Irrigation Water Requirement in Mainland China. Agric. Water Manag. 2025, 308, 109283. [Google Scholar] [CrossRef]
  6. Zhu, H.; Huang, G.H.; Guo, P.; Qin, X.S. A Fuzzy Robust Nonlinear Programming Model for Stream Water Quality Management. Water Resour. Manag. 2009, 23, 2913–2940. [Google Scholar] [CrossRef]
  7. Ren, C.F.; Guo, P.; Li, M.; Gu, J.J. Optimization of Industrial Structure Considering the Uncertainty of Water Resources. Water Resour. Manag. 2013, 27, 3885–3898. [Google Scholar] [CrossRef]
  8. Li, M.; Guo, P.; Ren, C. Water Resources Management Models Based on Two-Level Linear Fractional Programming Method under Uncertainty. J. Water Resour. Plan. Manag. 2015, 141, 05015001. [Google Scholar] [CrossRef]
  9. Tang, X.; He, Y.; Qi, P.; Chang, Z.; Jiang, M.; Dai, Z. A New Multi-Objective Optimization Model of Water Resources Considering Fairness and Water Shortage Risk. Water 2021, 13, 2648. [Google Scholar] [CrossRef]
  10. Liu, B.; Liu, R.; Yan, Z.; Ren, S.; Zhao, X.; Liu, G. Optimal Allocation of Soil and Water Resources in Agriculture under the Total Regional Evapotranspiration Indicator: A Case Study in Guangping, China. Ecol. Indic. 2024, 160, 111855. [Google Scholar] [CrossRef]
  11. Li, M.; Sun, H.; Liu, D.; Singh, V.P.; Fu, Q. Multi-Scale Modeling for Irrigation Water and Cropland Resources Allocation Considering Uncertainties in Water Supply and Demand. Agric. Water Manag. 2021, 246, 106687. [Google Scholar] [CrossRef]
  12. Jain, S.; Ramesh, D.; Trivedi, M.C.; Edla, D.R. Evaluation of Metaheuristic Optimization Algorithms for Optimal Allocation of Surface Water and Groundwater Resources for Crop Production. Agric. Water Manag. 2023, 279, 108181. [Google Scholar] [CrossRef]
  13. Wang, S.; Huang, G.H. A Multi-Level Taguchi-Factorial Two-Stage Stochastic Programming Approach for Characterization of Parameter Uncertainties and Their Interactions: An Application to Water Resources Management. Eur. J. Oper. Res. 2015, 240, 572–581. [Google Scholar] [CrossRef]
  14. Tarebari, H.; Javid, A.H.; Mirbagheri, S.A.; Fahmi, H. Optimal Water Allocation by Equilibrating between Agricultural and Environmental Sectors in River Basins. Appl. Ecol. Environ. Res. 2018, 16, 7467–7483. [Google Scholar] [CrossRef]
  15. Aljanabi, A.A.; Mays, L.W.; Fox, P. Optimization Model for Agricultural Reclaimed Water Allocation Using Mixed-Integer Nonlinear Programming. Water 2018, 10, 1291. [Google Scholar] [CrossRef]
  16. Garajová, E.; Hladík, M.; Rada, M. Interval Linear Programming under Transformations: Optimal Solutions and Optimal Value Range. Cent. Eur. J. Oper. Res. 2019, 27, 601–614. [Google Scholar] [CrossRef]
  17. Suo, M.; Xia, F.; Fan, Y. A Fuzzy-Interval Dynamic Optimization Model for Regional Water Resources Allocation under Uncertainty. Sustainability 2022, 14, 1096. [Google Scholar] [CrossRef]
  18. Parsinejad, M.; Yazdi, A.B.; Araghinejad, S.; Nejadhashemi, A.P.; Tabrizi, M.S. Optimal Water Allocation in Irrigation Networks Based on Real Time Climatic Data. Agric. Water Manag. 2013, 117, 1–8. [Google Scholar] [CrossRef]
  19. Lu, W.T.; Dai, C.; Fu, Z.H.; Liang, Z.Y.; Guo, H.C. An Interval-Fuzzy Possibilistic Programming Model to Optimize China Energy Management System with CO2 Emission Constraint. Energy 2018, 142, 1023–1039. [Google Scholar] [CrossRef]
  20. Zhu, Y.; Yan, X.; Chen, C.; Li, Y.; Huang, G.; Li, Y. Analysis of Industry-Air Quality Control in Ecologically Fragile Coal-Dependent Cities by an Uncertain Gaussian Diffusion-Hurwicz Criterion Model. Energy Policy 2019, 132, 1191–1205. [Google Scholar] [CrossRef]
  21. Lv, Y. Planning Regional Water Resources System Using an Interval Fuzzy Bi-Level Programming Method. J. Environ. Inform. 2010, 16, 43–56. [Google Scholar] [CrossRef]
  22. Nematian, J. An Extended Two-Stage Stochastic Programming Approach for Water Resources Management under Uncertainty. J. Environ. Inform. 2015, 27, 72–84. [Google Scholar] [CrossRef]
  23. Zhang, C.; Li, X.; Guo, P.; Huo, Z. An Improved Interval-Based Fuzzy Credibility-Constrained Programming Approach for Supporting Optimal Irrigation Water Management under Uncertainty. Agric. Water Manag. 2020, 238, 106185. [Google Scholar] [CrossRef]
  24. Bekri, E.; Disse, M.; Yannopoulos, P. Optimizing Water Allocation under Uncertain System Conditions for Water and Agriculture Future Scenarios in Alfeios River Basin (Greece)—Part B: Fuzzy-Boundary Intervals Combined with Multi-Stage Stochastic Programming Model. Water 2015, 7, 6427–6466. [Google Scholar] [CrossRef]
  25. Zhang, C.; Guo, P.; Huo, Z. Irrigation Water Resources Management under Uncertainty: An Interval Nonlinear Double-Sided Fuzzy Chance-Constrained Programming Approach. Agric. Water Manag. 2021, 245, 106658. [Google Scholar] [CrossRef]
  26. Guo, P.; Huang, G.H.; Zhu, H.; Wang, X.L. A Two-Stage Programming Approach for Water Resources Management under Randomness and Fuzziness. Environ. Model. Softw. 2010, 25, 1573–1581. [Google Scholar] [CrossRef]
  27. Xie, Y.L.; Huang, G.H.; Li, W.; Li, J.B.; Li, Y.F. An Inexact Two-Stage Stochastic Programming Model for Water Resources Management in Nansihu Lake Basin, China. J. Environ. Manag. 2013, 127, 188–205. [Google Scholar] [CrossRef] [PubMed]
  28. Huang, G.H.; Loucks, D.P. An Inexact Two-Stage Stochastic Programming Model for Water Resources Management under Uncertainty. Civ. Eng. Environ. Syst. 2000, 17, 95–118. [Google Scholar] [CrossRef]
  29. Nifa, K.; Boudhar, A.; Ouatiki, H.; Elyoussfi, H.; Bargam, B.; Chehbouni, A. Deep Learning Approach with LSTM for Daily Streamflow Prediction in a Semi-Arid Area: A Case Study of Oum Er-Rbia River Basin, Morocco. Water 2023, 15, 262. [Google Scholar] [CrossRef]
  30. Wu, M.; Liu, P.; Liu, L.; Zou, K.; Luo, X.; Wang, J.; Xia, Q.; Wang, H. Improving a Hydrological Model by Coupling It with an LSTM Water Use Forecasting Model. J. Hydrol. 2024, 636, 131215. [Google Scholar] [CrossRef]
  31. Hashemi, S.; Samadianfard, S.; Nazemi, A.H. Sequence-to-Sequence and Meta LSTM Techniques Enhanced by Remote Sensing for Advanced Evapotranspiration Estimation. Earth Sci. Inform. 2025, 18, 386. [Google Scholar] [CrossRef]
  32. Luo, Y.; Meng, X.; Zhai, Y.; Zhang, D.; Ma, K. Prediction of Water Quality in Agricultural Watersheds Based on VMD-GA-LSTM Model. Mathematics 2025, 13, 1951. [Google Scholar] [CrossRef]
  33. Koohikeradeh, E.; Jose Gumiere, S.; Bonakdari, H. NDMI-Derived Field-Scale Soil Moisture Prediction Using ERA5 and LSTM for Precision Agriculture. Sustainability 2025, 17, 2399. [Google Scholar] [CrossRef]
  34. Berríos, P.; Temnani, A.; Zapata, S.; Forcén-Muñoz, M.; Franco, J.A.; Pérez-Pastor, A. Sensitivity to Water Deficit of the Second Stage of Fruit Growth in Late Mandarin Trees. Irrig. Sci. 2023, 41, 35–47. [Google Scholar] [CrossRef]
  35. Yu, A.; Cai, E.; Yang, M.; Li, Z. An Analysis of Water Use Efficiency of Staple Grain Productions in China: Based on the Crop Water Footprints at Provincial Level. Sustainability 2022, 14, 6682. [Google Scholar] [CrossRef]
  36. Liu, X.; Ma, S.; Fang, Y.; Wang, S.; Guo, P. A Novel Approach to Identify Crop Irrigation Priority. Agric. Water Manag. 2023, 275, 108008. [Google Scholar] [CrossRef]
  37. Navarro, J.M.; Botía, P.; Pérez-Pérez, J.G. Influence of Deficit Irrigation Timing on the Fruit Quality of Grapefruit (Citrus Paradisi Mac.). Food Chem. 2015, 175, 329–336. [Google Scholar] [CrossRef]
  38. Fung, K.F.; Chew, K.S.; Huang, Y.F.; Ahmed, A.N.; Teo, F.Y.; Ng, J.L.; Elshafie, A. Evaluation of Spatial Interpolation Methods and Spatiotemporal Modeling of Rainfall Distribution in Peninsular Malaysia. Ain Shams Eng. J. 2022, 13, 101571. [Google Scholar] [CrossRef]
  39. Zhu, S.; Zhang, Z.; Duan, C.; Lin, Z.; Hao, K.; Li, H.; Zhong, Y. Multispectral Inversion of Citrus Multi-Slope Evapotranspiration by UAV Based on Modified RSEB Model. Water 2024, 16, 1520. [Google Scholar] [CrossRef]
  40. Fontanier, C.H.; Aitkenhead-Peterson, J.A.; Wherley, B.G.; White, R.H.; Thomas, J.C. Effective Rainfall Estimates for St. Augustinegrass Lawns under Varying Irrigation Programs. Agron. J. 2021, 113, 3720–3729. [Google Scholar] [CrossRef]
  41. Muratoglu, A.; Bilgen, G.K.; Angin, I.; Kodal, S. Performance Analyses of Effective Rainfall Estimation Methods for Accurate Quantification of Agricultural Water Footprint. Water Res. 2023, 238, 120011. [Google Scholar] [CrossRef]
  42. Laib, O.; Khadir, M.T.; Mihaylova, L. Toward Efficient Energy Systems Based on Natural Gas Consumption Prediction with LSTM Recurrent Neural Networks. Energy 2019, 177, 530–542. [Google Scholar] [CrossRef]
  43. Wisser, D.; Frolking, S.; Douglas, E.M.; Fekete, B.M.; Schumann, A.H.; Vörösmarty, C.J. The Significance of Local Water Resources Captured in Small Reservoirs for Crop Production—A Global-Scale Analysis. J. Hydrol. 2010, 384, 264–275. [Google Scholar] [CrossRef]
  44. Manassaldi, J.I.; Mussati, M.C.; Incer-Valverde, J.; Morosuk, T.; Mussati, S.F. Renewable Energy-Water Nexus: Optimal Design of an Integrated System Including a Single Flash Geothermal Plant, Kalina Cycle, and Seawater Desalination Units. Renew. Energy 2024, 236, 121395. [Google Scholar] [CrossRef]
  45. Zhen, J.L.; Wu, C.B.; Liu, X.R.; Huang, G.H.; Liu, Z.P. Energy-Water Nexus Planning of Regional Electric Power System within an Inexact Optimization Model in Tangshan City, China. J. Clean. Prod. 2020, 266, 121997. [Google Scholar] [CrossRef]
  46. Cao, M.; Liu, W.; Xu, B.; Wang, L.; Zhang, Y.; Zhang, Y. Multi-Scenario Optimization Model for Operation of Inter-Basin Water Transfer-Supply Systems Considering Cost–Benefit Relationships. J. Water Clim. Change 2023, 14, 2872–2884. [Google Scholar] [CrossRef]
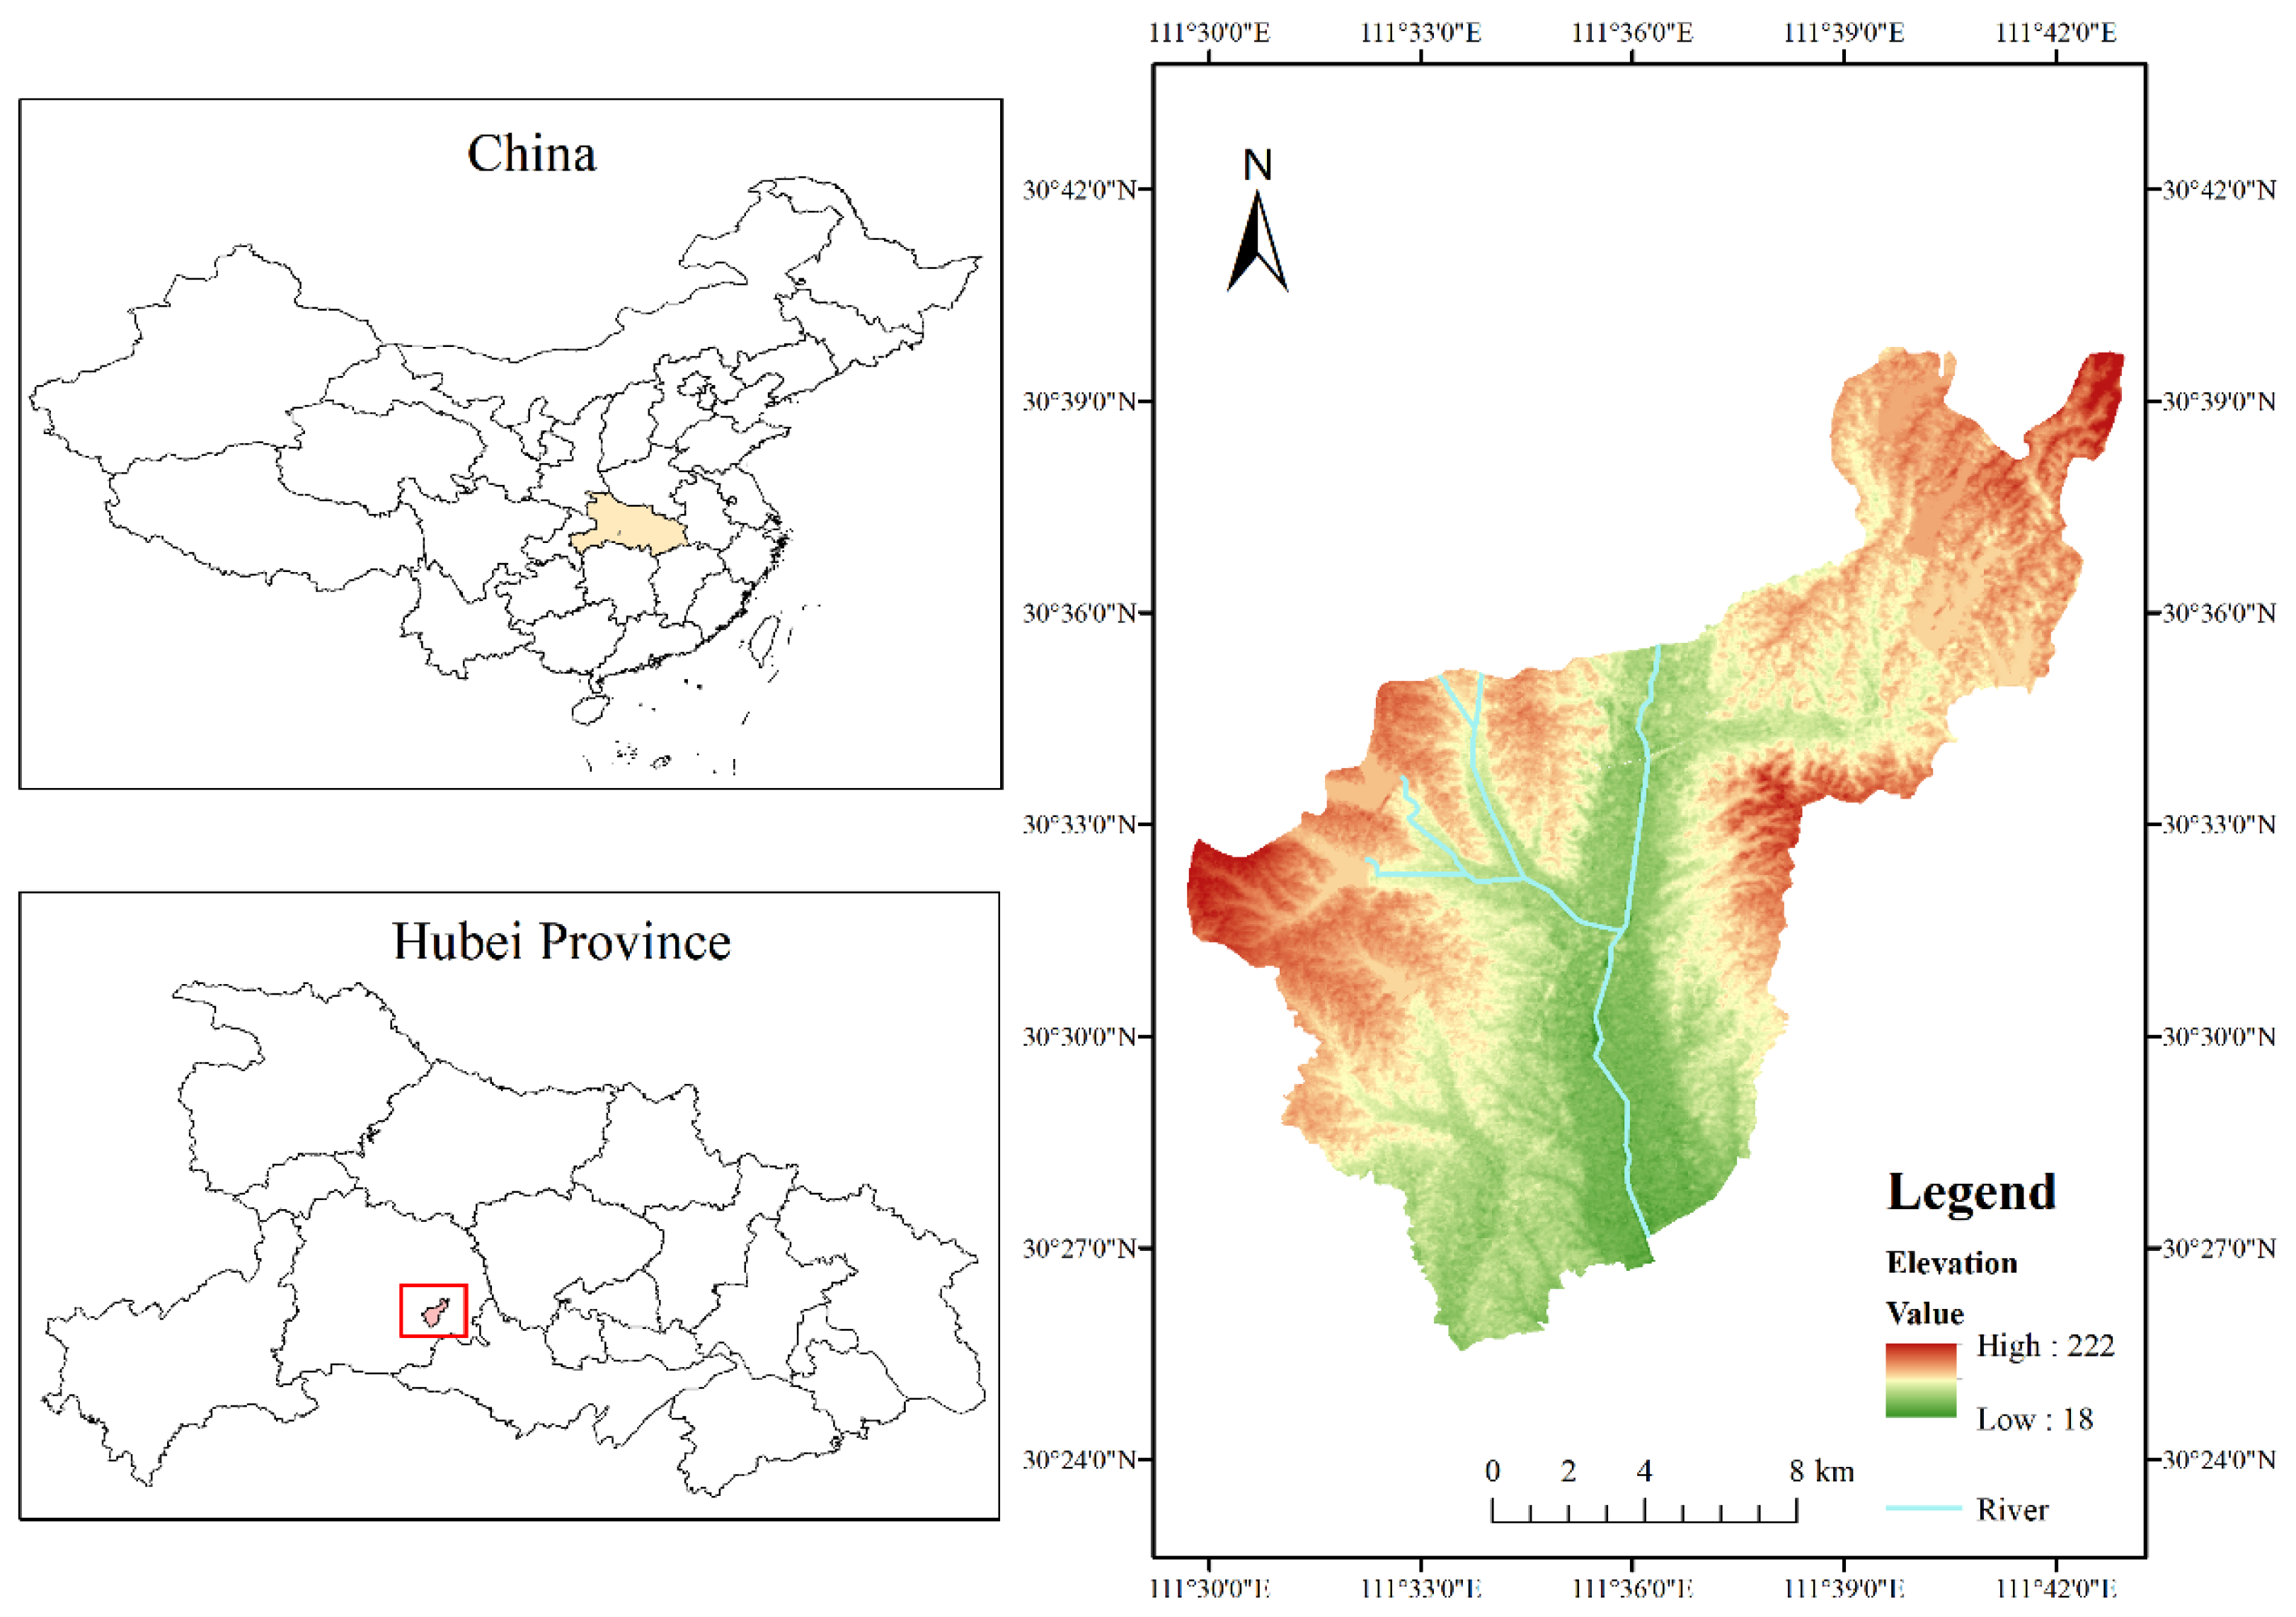
Figure 1. The location of the study area.
Water 17 02665 g001
Figure 2. The framework of the ITSP-LSTM hybrid modeling.
Water 17 02665 g002
Figure 3. Citrus planting zones zoning in the study area.
Water 17 02665 g003
Figure 4. Target water allocation for different citrus planting zones. A, B, and C denote citrus planting zones; a, b, and c denote water supply areas.
Water 17 02665 g004
Figure 5. Optimal water rationing under different water inflow levels. A, B, and C denote citrus planting zones; a, b, and c denote water supply areas; L, M, and H denote water inflow scenarios (low, medium, high).
Water 17 02665 g005
Table 1. Crop coefficients Kc for citrus growth stages in Anfusi Town.
Developmental PhaseTime IntervalLower Limit Temperature
t1 (°C)
Preference-Temperature
t0 (°C)
Ceiling Temperature
t2 (°C)
Crop Coefficient
Kc
Germination stage15 February–15 April8.114.026.00.48
Blooming stage16 April–15 May11.820.030.00.65
Physiological fruit drop stage16 May–20 June13.021.030.00.76
Development stage21 June–5 October13.022.034.00.95
Maturation stage6 October–20 November13.021.027.00.70
Flower bud differentiation stage21 November–15 February−5.012.523.00.39
Table 2. Water supply and demand for citrus irrigation in different planting zones.
Citrus Planting ZonesWater Supply ZonesCultivated Area
(hm2)
Water Supply (106 m3) Citrus Planting Water Demand
(106 m3)
Water Shortage
(106 m3)
Reservoirs Water
Supply (106 m3)
Weirs Water
Supply (106 m3)
Total
(106 m3)
Aa2077.6710.130.2910.427.010
Bb3520.675.940.446.3811.885.50
Cc2265.331.400.752.157.655.49
Table 3. Annual water supply for citrus cultivation in Anfusi Town.
Water Supply ZonesReservoirs Water Supply (106 m3)Weirs Water Supply
(106 m3)
Total
(106 m3)
Upper LimitLower LimitUpper LimitLower Limit
a11.4310.670.370.33[11.01, 11.80]
b7.036.510.780.67[7.18, 7.81]
c1.901.570.810.74[2.31, 2.71]
Table 4. Available water supply for citrus cultivation under different water inflow levels.
Water Inflow LevelProbabilityWater Supply for Zone a (106 m3)Water Supply for Zone b (106 m3)Water Supply for Zone c (106 m3)
Low(L)0.2[8.81, 9.44][5.75, 6.24][1.85, 2.17]
Medium(M)0.6[11.01, 11.80][7.18, 7.80][2.31, 2.71]
High(H)0.2[13.21, 14.16][8.62, 9.37][2.77, 3.25]
Table 5. Citrus planting zone and unit area irrigation water consumption in Anfusi Town.
Citrus Planting ZonesPlanting Area
(hm2)
Irrigation Module
(m3/hm2)
Pre-Water Distribution Target (106 m3)
Water Supply for Zone AWater Supply for Zone BWater Supply for Zone C
A2077.67[3122.25, 3706.95][3.24, 3.85][1.62, 1.93][1.62, 1.93]
B3520.67[2.75, 3.26][5.50, 6.53][2.75, 3.26]
C2265.33[1.77, 2.10][1.77, 2.10][3.54, 4.20]
Table 6. Economic coefficient of different citrus planting zones.
Economic CoefficientABC
(CNY/m3)CoefficientPenalty CoefficientCoefficientPenalty CoefficientCoefficientPenalty Coefficient
A[9.68, 10.19][12.58, 13.25][8.71, 9.17][13.33, 11.92][8.23, 8.66][10.70, 11.26]
B[8.94, 9.41][11.62, 12.24][9.93, 10.46][12.91, 13.60][8.44, 8.96][10.98, 11.56]
C[8.58, 9.03][11.15, 11.74][8.10, 8.53][10.53, 11.09][9.53, 10.04][12.39, 13.05]
Table 7. Water distribution plan for each citrus planting zone in Anfusi in 2025 (106 m3).
Water Inflow LevelCitrus Planting ZonesWater Supply ZonesOptimal Water Distribution Target (106 m3)Water Deficit
(106 m3)
Optimal Water Allocation
(106 m3)
zij,opt
LAa3.8503.851
b3.2603.261
c2.10[0, 0.41][1.69, 2.10]1
Ba3.2603.261
b5.98[0, 0.23][5.75, 5.98]0.466
c2.752.7500
Ca2.10[0, 0.41][1.69, 2.10]0
b1.771.7600
c3.54[1.37, 1.69][1.85, 2.17]0
MAa3.8503.851
b1.62[0, 0.41][1.21, 1.62]0
c1.621.6200
Ba3.2603.261
b5.9805.980.466
c2.752.7500
Ca2.1002.101
b1.77[1.56, 1.77][0, 0.21]0
c3.54[0.83, 1.23][2.31, 2.71]0
HAa3.8503.851
b1.6201.620
c1.621.6200
Ba3.2603.261
b5.9805.980.466
c2.752.7500
Ca2.1002.101
b1.77[0, 0.75][1.02, 1.77]0
c3.54[0.29, 0.77][2.77, 3.25]0
Disclaimer/Publisher’s Note: The statements, opinions and data contained in all publications are solely those of the individual author(s) and contributor(s) and not of MDPI and/or the editor(s). MDPI and/or the editor(s) disclaim responsibility for any injury to people or property resulting from any ideas, methods, instructions or products referred to in the content.