1. Introduction
Since ancient times, human communities have searched for water. This essential resource has been in decline for a number of reasons, notably the negative impacts of climate change, the increase in human consumption of water and food due to the population explosion, and the overexploitation of water resources [
1]. Water insecurity leads to food and energy insecurity. In 2015, the United Nations projected that half of the world’s population would be living in water-stressed regions by 2050 [
2], while the World Economic Forum’s 2015 report considered water stress to be a global risk threatening international security [
3], requiring real and urgent action to ensure integrated management of this scarce resource. Water’s scarcity makes it an economic good with distinctive characteristics. Accordingly, the OECD classified water as an “economic good” on the grounds that scarce economic resources have to be brought together to make water available in the form, quality, location, and timing required by users [
4], similarly the fourth principle of the World Economic Forum’s 2015 report reinforces the notion of water’s scarcity and economic nature by declaring that water has “economic value in all its competing uses and should be recognized as an economic good” [
5]. The economic nature of water has also been examined by authors such as Zisopoulou et al. [
6], who demonstrated that water qualifies as an economic good in the sense defined by Robbins [
7]. This is primarily due to its unique characteristics, notably its essential role in sustaining human life and its non-producible nature [
8,
9]. In Morocco, the inventory of water resources was estimated in 2023 at 22 billion m
3 (18 billion m
3 of surface water and 4 billion m
3 of groundwater), equivalent to 606 m
3 per capita per year [
6]. However, water resources are unevenly distributed throughout the country. The Sebou, OumErbia, and Moulouya water basins account for over 60% of Morocco’s surface water resources, where most of the water is lost to the sea and is therefore unsuitable for agricultural use due to the limited arable land in these areas.
Water resource management in Morocco is governed by Law 36-15 on Water, and its implementation is carried out by the Hydraulic Basin Agencies (HBAs), which cover the entire national territory. These agencies participate in the execution of public policies in the water sector through substantial investments, guided by several strategies and programs, including the National Water Plan (NWP), the National Program for Water Saving in Irrigation (NPWSI), and the National Program for Drinking Water Supply and Irrigation (NPDWSI). These initiatives aim to ensure the integrated management of water resources and the rationalization of their use.
Despite all efforts to protect Morocco’s water resources, their inventory has been severely depleted in recent years as a result of several factors, including successive years of drought, rapid population growth, and the overexploitation of water resources by various economic sectors, particularly agriculture. The quantity available per inhabitant has fallen from 2500 cubic meters per year in 1960 to less than 650 cubic meters in 2023, and is expected to drop to about 500 cubic meters by 2030, placing Morocco among the countries experiencing “water scarcity” after previously being classified as in a situation of “water stress.” Losses through evapotranspiration, estimated at 118 billion m
3 [
6], and the decline in dam storage capacity due to the silting of reservoirs, resulting in a loss of almost 75 million m
3 per year [
7], are also factors exacerbating the water resources situation in Morocco. Meanwhile, Gumus et al. [
8] analyzed potential scenarios for assessing the impact of drought on Morocco’s water resources, with the most pessimistic scenario estimating that drought in the northern region of Morocco will reach around 80% on average after 2075. This situation could have severe socio-economic consequences, increasing desertification [
9], poverty, hunger, and social crises [
10], in the face of growing water demand from various economic sectors [
11,
12].
The importance of water resources for the Moroccan economy is particularly evident in the dependence of economic sectors on water, especially the agricultural sector, which accounted for around 12% of Morocco’s GDP in 2024 and is a key contributor to the country’s foreign trade. The EU market alone absorbs an average of 67% of Moroccan agricultural exports [
13]. Statistically, Morocco’s foreign trade data show that the EU is Morocco’s leading partner, accounting for 86.5% of trade, making the EU both Morocco’s main supplier and its main customer [
14]. Trade with the EU was expected to reach 62 billion USD in 2023. Spain, France, Italy, and Germany are the EU countries that trade most extensively with Morocco. The first agreements between Morocco and the EU were signed in the 2000s, starting with an association agreement that allowed the abolition of customs duties on industrial products. In 2010, an agricultural agreement was signed between the two partners and came into force in 2012, with the aim of increasing bilateral trade in agricultural, agri-food, and fishery products. By 2023, Moroccan agricultural and agri-food exports had reached 8.2 billion USD, ranking third after automobile exports and exports of phosphate and its derivatives [
14]. The majority of these agricultural exports were destined for the EU, making Morocco the EU’s leading supplier of vegetables and its third-largest extra-EU supplier of citrus fruits [
15]. At the regional level, Morocco is the top exporter of agricultural products from the southern Mediterranean to the EU. For example, exports of fresh tomatoes to the EU increased from 660 million USD in 2021 to 942 million USD in 2023, a rise of 42% in two years, representing 82% of Morocco’s total exports of fresh tomatoes to the EU [
14].
Boosting exports of agricultural produce is the result of an agricultural policy launched in 2008 under the name of the Green Morocco Plan. This policy aimed to encourage farmers to focus on export crops while subsidizing their production, mobilizing 11.30 billion USD in cumulative investment over a 10-year period after the strategy was launched [
13]. Statistically, fresh tomato exports increased from 303 million USD in 2009 to 1.14 billion USD in 2023, while citrus exports grew from 311.9 million USD in 2009 to 456.5 million USD in 2023 [
14]. Like other crops subsidized under the Green Morocco Plan, these crops are water-intensive and deplete Morocco’s water resources. Many studies [
12,
16] have analyzed the impact of agricultural policies in Morocco on the stock of these resources. In this regard, Molle [
16] found a major discrepancy between Morocco’s agricultural policy (Green Morocco Plan 2008–2020) and its water policies, noting that subsidized agriculture has overexploited groundwater. Saidi et al. [
17] showed that the crops prioritized by the GMP (citrus, olives, and fruits) are characterized by high water consumption, indicating that the policy’s underlying choices were not sufficiently well studied. In the same context, Boudhar et al. [
18], using an input–output model, studied the relationships between economic sectors and the use of water resources (direct use), as well as the intersectoral relationships involving water (indirect use). They found that 86% of direct water use is consumed by the agricultural sector, illustrating the sector’s dominant role in water consumption.
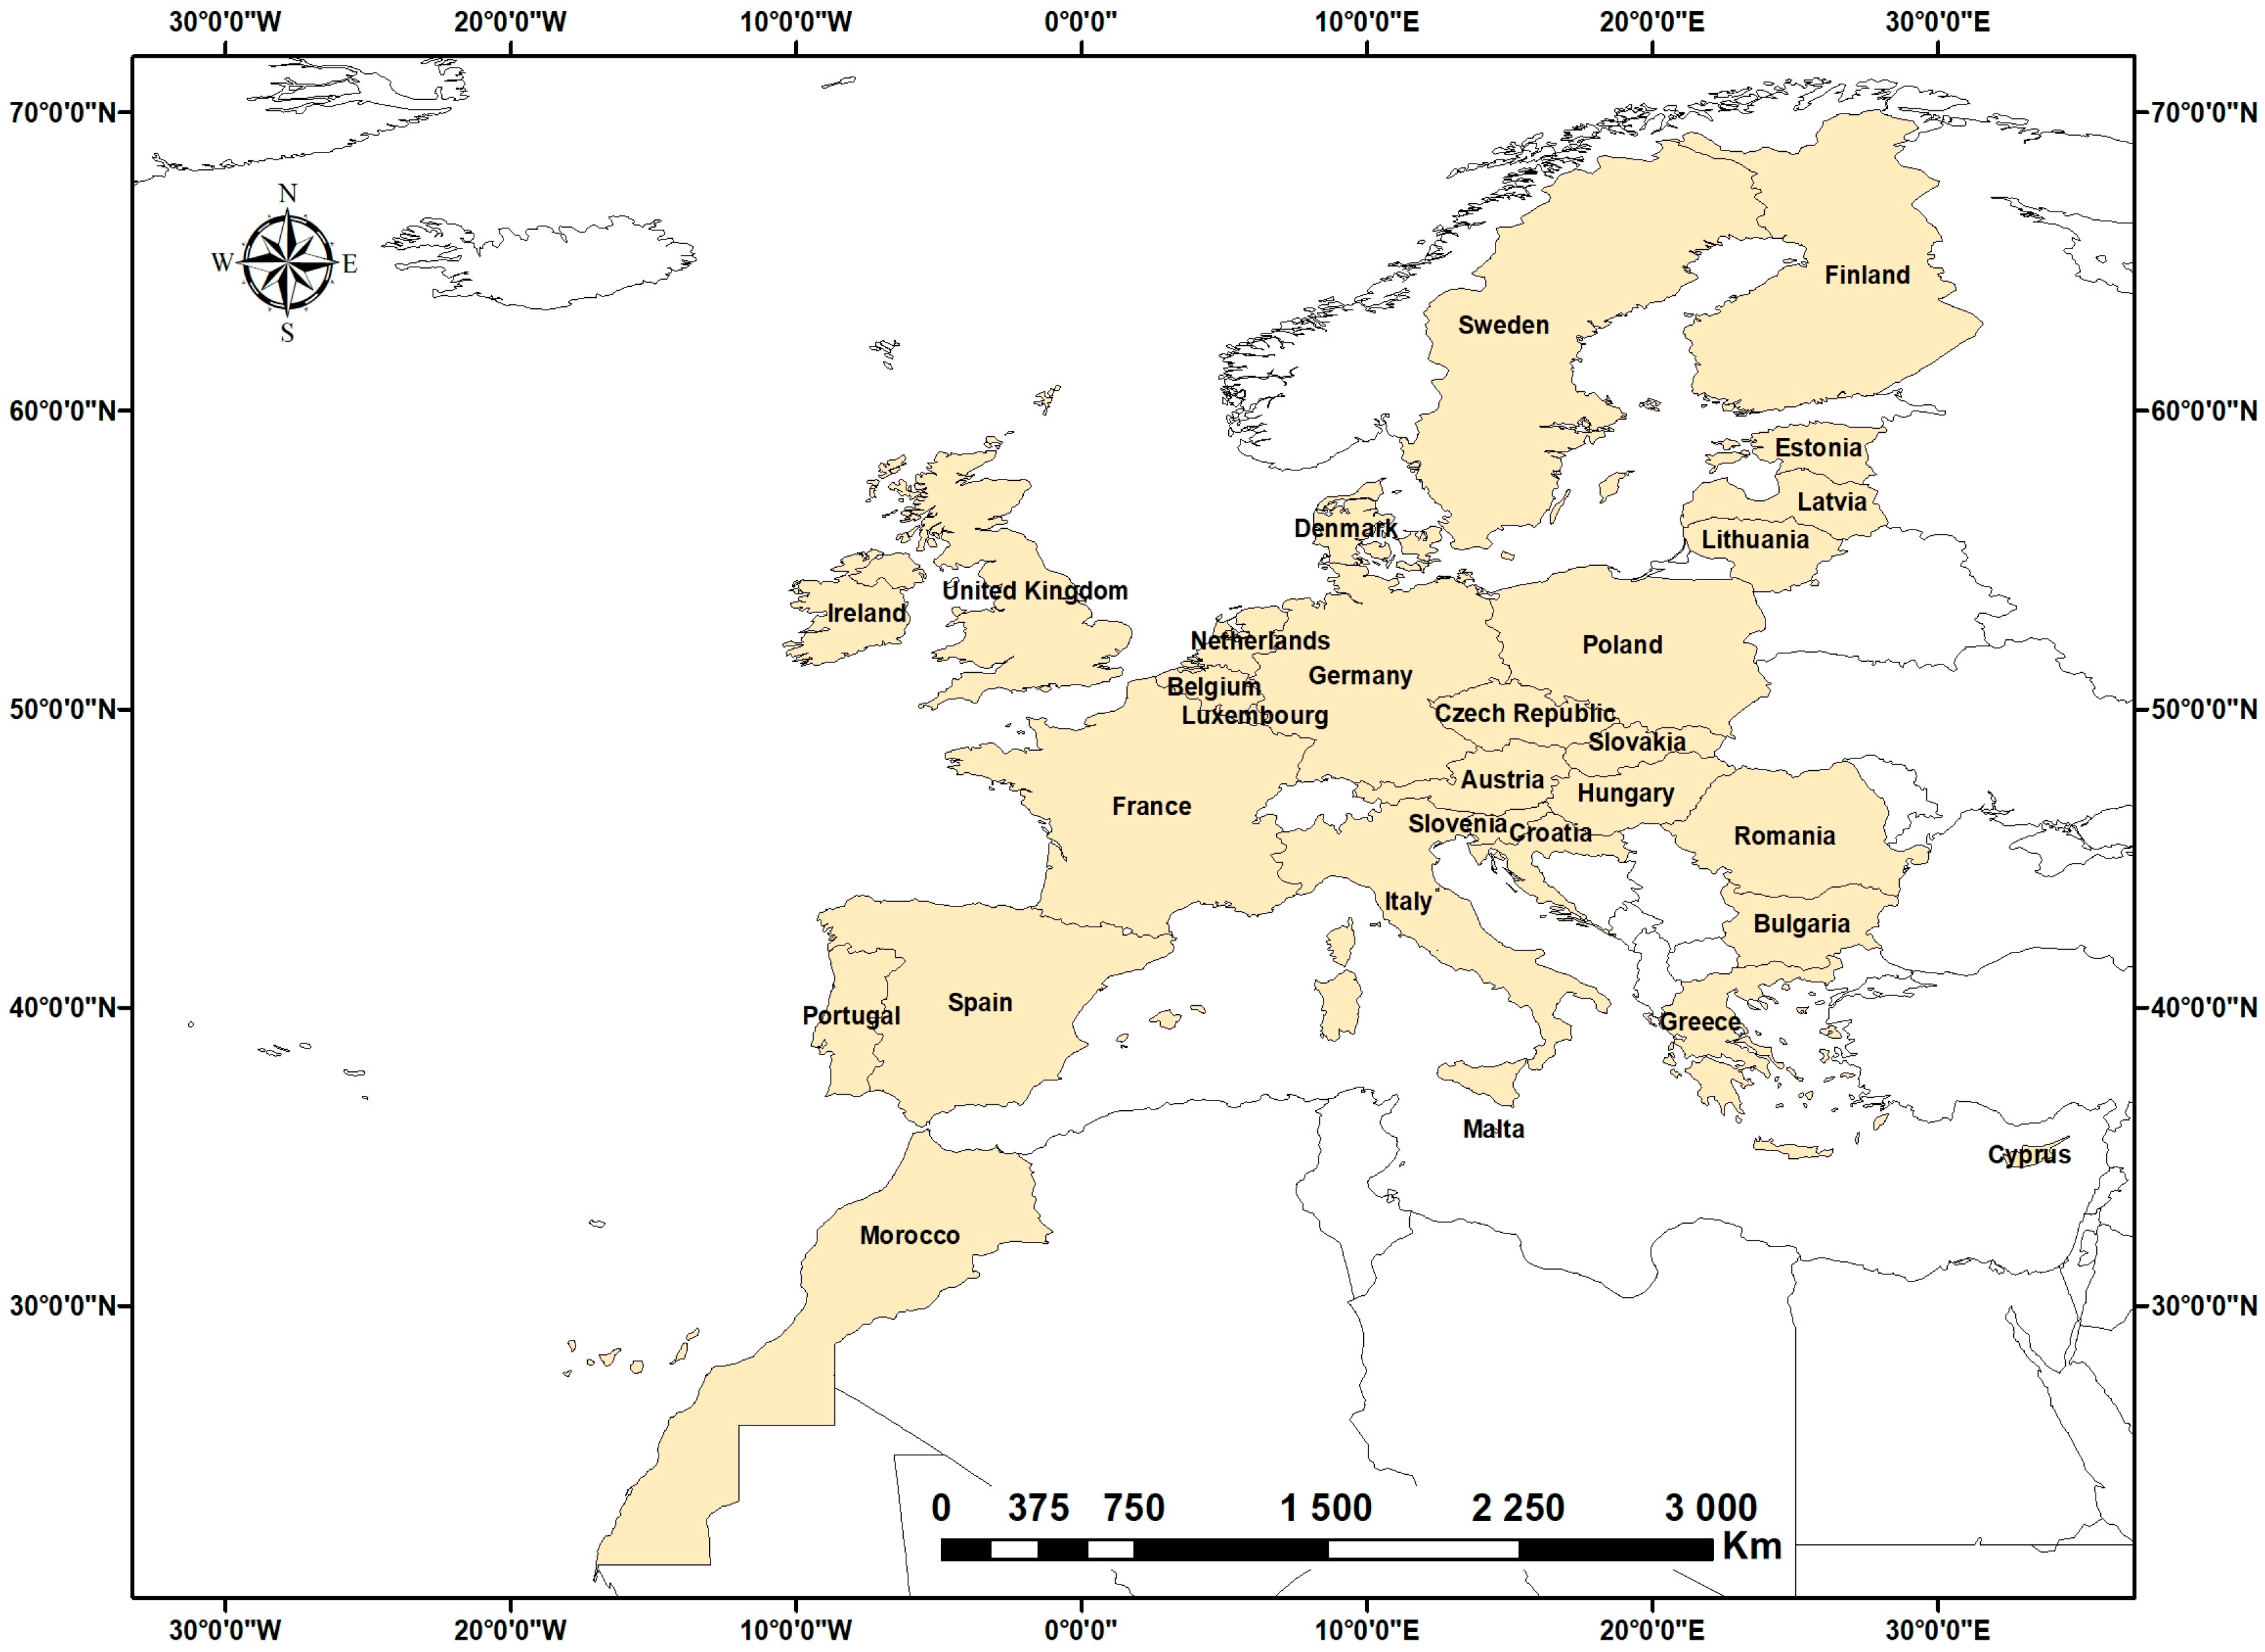
The present work analyzes the flow of virtual water trade between Morocco and EU countries for 32 agricultural products over the period of 2000–2020, with the purpose of assessing the impact of agricultural trade with the EU on Morocco’s water resources, while also evaluating the economic productivity of water use.
Section 2 provides a literature review on the economic foundations of virtual water trade and the various studies conducted in the Morocco–EU context.
Section 3 presents the methods and data used in the empirical analysis.
Section 4 reports the results of the empirical analysis and concludes with a general discussion and recommendations.
2. Literature Review
The impact of water scarcity on the global economy is one of the most pressing topics in international agricultural trade today. At a time when the World Bank and the International Monetary Fund are encouraging countries to further liberalize their foreign trade to promote economic development and growth, it is essential to take into account the issue of water scarcity, as these resources are critical not only for the development of the agricultural sector but also for industrialization and the service sector.
Conceptually, virtual water trade has its economic roots in international trade theories. In The Wealth of Nations (1776), Smith introduced the idea of free trade through the specialization of each country in the production where it holds an absolute advantage, focusing on producing the lowest-cost goods and improving productivity and production methods. A few decades later, Ricardo (1817) developed the theory of comparative advantage to address the limitations of the absolute advantage theory. According to Ricardo, each country should specialize in producing the goods for which it has the greatest comparative advantage or, conversely, the least comparative disadvantage. The Heckscher–Ohlin–Samuelson (HOS) model subsequently added a new dimension to classical and neoclassical analyses of international trade: the concept of the “relative abundance of a factor of production,” which acts as a source of comparative advantage and determines trade patterns according to the factor endowments of the trading countries.
From the same perspective, J.A. Allan, a British geographer, coined the concept of virtual water trade in the 1990s as an alternative means for countries to prevent conflicts over water resources, particularly in the Middle East, and to access global water availability indirectly and at low cost [
19]. This concept can be defined as the total volume of water consumed during a production process to produce a good that will be exported to another region, where it will ultimately be consumed.
Merrett [
20] analyzed the concept of virtual water trade within an economic framework as a creative extension of economic theories. Similarly, Lant [
21] concluded that there is a close link between virtual water trade and Ricardo’s theory of comparative advantage. In fact, the relative abundance of water, together with a comparison of full costs between different trading partners, can generate a regional comparative advantage in the water sector [
22,
23].
The literature on virtual water trade has been widely developed. However, the USA, China, and the Netherlands remain the most productive countries in terms of publications and research on the subject [
24]. This research is highly diversified, analyzing virtual water flows at global, national, and regional scales, including flows between cities, provinces, and river basins [
25].
In Europe, several studies have examined virtual water trade. Serrano et al. [
26] investigated virtual water trade for EU countries, finding that European countries imported 585 km
3 of water in their trade with the rest of the world. At the intra-regional scale, Antonellia et al. [
27] assessed the trade in virtual water embedded in agricultural products between EU countries during the period of 1993–2011. They found that the European Union is a net importer of virtual water, with 46% of imports and 75% of exports occurring within the region. To measure the role of virtual water in the food security of EU countries, Alexoaei et al. [
28] showed that the agricultural products they analyzed depended on virtual water trade, with percentages varying from one product to another. Fu et al. [
29] applied a multi-regional input–output model to assess virtual water flows between 43 countries, including EU members. They found that economic and trade relations significantly influence virtual water flows, with countries such as the UK, China, and the USA showing a high dependence on virtual water flows with the EU. At the river basin level, Vanham [
30] established the water balance for agricultural products in EU river basins. Other researchers have explored the relationship between virtual water trade and other dimensions, such as CO
2 emissions within the EU [
31] and electricity use [
32] at the European level.
In the Moroccan context, research on virtual water trade remains limited. The first study in this field was conducted by Hoekstra and Chapagain [
33], who analyzed the virtual water trade between Morocco and the Netherlands. Their calculations showed that Morocco depends on the Netherlands’ resources for 14% of its virtual water needs, while the Netherlands depends on Morocco for 95% of its own. The authors concluded that trade between the two countries allows Morocco to save a substantial volume of water, estimated at 780 million m
3 per year.
Schyns and Hoekstra [
34] also quantified Morocco’s water footprint over the period of 1996–2005 to propose scenarios for efficient water resource management. They found that the total water footprint production was 38.8 Gm
3 per year, dominated by the agricultural sector, which alone consumes the largest share of water.
Other studies have been carried out on a continental or regional scale including Morocco. For example, Hriwa et al. [
35] analyzed virtual water trade flows in Africa and found that Morocco overexploits its water resources but remains a net importer of virtual water, ranking among the top ten net virtual water importing countries, with 190.32 Bm
3.
Boudhar et al. [
36] constructed a virtual water trade balance for Morocco by examining virtual water trade flows over the period of 2000–2017 for 40 agricultural products. The authors noted that Morocco was a net importer of virtual water during the study period, with a net virtual water balance of 595.74 Gm
3, virtual water exports of 95.03 Gm
3, and total imports of 690.77 Gm
3.
Regarding intra-regional flows, Haddad et al. [
37] used an inter-regional input–output model to evaluate virtual water exchanges between various regions of Morocco, analyzing the relationship between these exchanges and the creation of added value at the regional level. They found that the total volume of water incorporated into trade between regions exceeded foreign exports and revealed that certain regions exerted pressure on their water resources despite low participation in added value.
However, no study in the literature has examined Morocco’s virtual water trade flows with its commercial and economic partners, particularly major partners such as the European Union, making this work an important contribution to the still underdeveloped literature on virtual water trade in Morocco.
4. Results
4.1. Analysis of Virtual Water Exports Through Morocco’s Trade with EU Countries
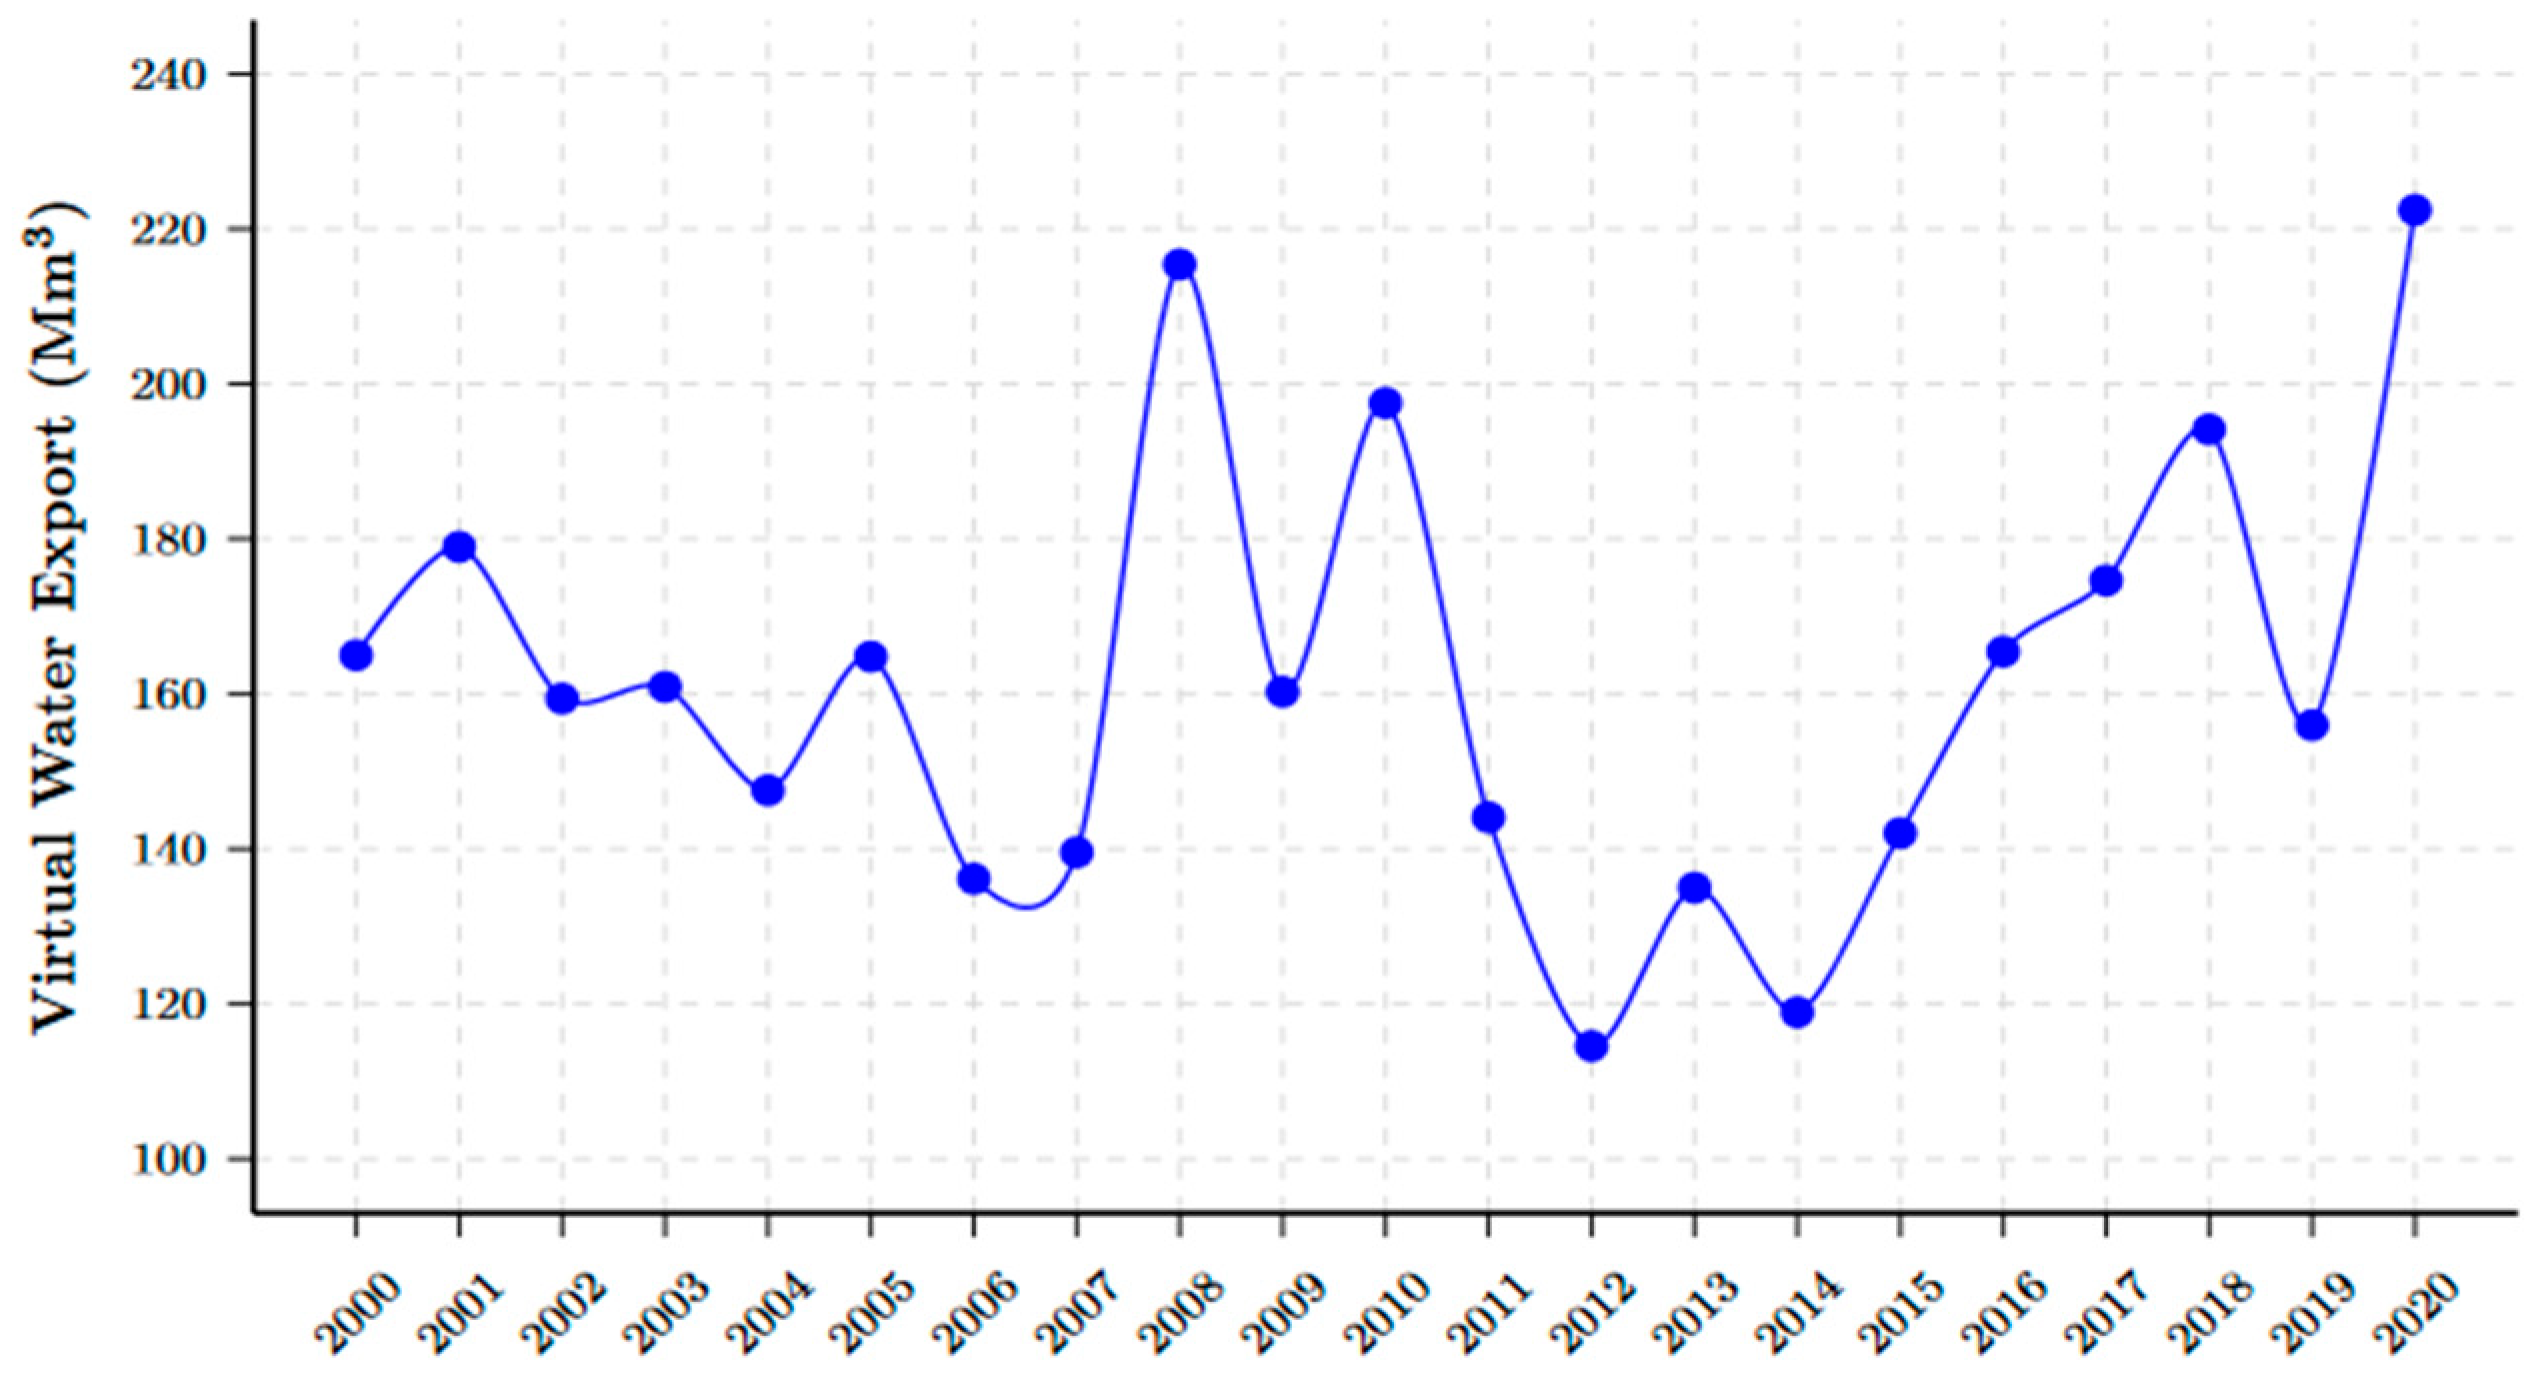
The results of this study show that the total volume of Virtual Water Exported (VWE) by the agricultural products studied for European Union countries over the period of 2000–2020 is estimated at 3393.791 Mm
3, with an average of 161.581 Mm
3 per year. Our calculations indicate that the lowest quantity of Virtual Water Exported was 114.572 Mm
3 in 2012, while the highest quantity was 222.481 Mm
3 in 2020.
Figure 3 shows an increase in virtual water exports that varies each year, mainly due to large exports of fruits and vegetables with a high water footprint.
In terms of categories, fruits and vegetables are the main exporters of virtual water, with volumes of 2903.028 Mm3 and 467.928 Mm3 for fruits and vegetables, respectively, representing a total of 99.327% of Virtual Water Exported during the study period (85.539% for fruits and 13.788% for vegetables). However, pulses and cereals accounted for only 0.673% of the Virtual Water Exported, with 19.647 Mm3 for pulses and 3.166 Mm3 for cereals.
Table 2 shows that the most important exporters of virtual water are citrus fruits, with a total volume of 2499.043 Mm
3. Mandarins and clementines represent a volume of 1258.973 Mm
3, oranges 1201.46 Mm
3, lemons 29.418 Mm
3, and pomelos 9.19 Mm
3. Grapes follow, exporting a volume of 148 Mm
3 of virtual water. The arboriculture sector has recorded an increase in virtual water exports following the development of avocado cultivation in recent decades. The volume of virtual water embodied in avocados exported to European Union countries increased from 0.511 Mm
3 in 2012 to 29.670 Mm
3 in 2020, an impressive increase of 57.06% over 9 years. Plums, on the other hand, are the fruits exporting the smallest amount of virtual water to European Union countries, with total exports not exceeding 0.187 Mm
3 during the period of 2000–2020 (
Figure 4a).
As shown in
Figure 4b vegetable exports of fresh tomatoes to European Union countries rose sharply from 2006 to 2020. The total volume of Virtual Water Exported through fresh tomatoes from 2000 to 2020 reached 350.99 Mm
3, representing 75% of virtual water exports by vegetables. Potatoes follow with 76.55 Mm
3 of Virtual Water Exported, then asparagus with 10.744 Mm
3 and onions with 10.407 Mm
3, while carrots are the vegetables with the smallest amount of Virtual Water Exported (0.259 Mm
3).
It should be noted that during the study period, virtual water exports were boosted by the export of fresh tomatoes, which are considered a high-value crop under the Green Morocco Plan (GMP) strategy, whereas potato exports declined over time.
The third category of virtual water exporting crops in this study is pulses, with a volume of 19.467 Mm
3.
Figure 4c shows that the Virtual Water Exported by pulses was mainly represented by fresh peas 9.697 Mm
3, dry beans 4.611 Mm
3, and broad beans 3.335 Mm
3. Trade in virtual water through pulses to European Union countries fluctuated between 2000 and 2013, then declined between 2014 and 2020 due to weak European market demand for Moroccan pulses and the orientation of Moroccan agricultural policy towards export crops. However, the significant virtual water volume associated with peas, particularly in 2013, can be attributed to a peak in export volumes during that year. Notably, Belgium alone accounted for approximately 62% (7506 tons) of Moroccan pea exports in 2013, resulting in a temporary surge in virtual water exports linked to peas.
Regarding cereals, our calculations show that only 4 of the 28 European Union countries (Belgium, France, Italy, and Spain) imported Moroccan cereals. Representing 3.166 Mm
3, the volume of Virtual Water Exported by cereals accounts for only 0.109% of the total Virtual Water Exported during the study period (61.146% wheat, 38.181% maize, and no virtual water export for barley and oats). As shown in
Figure 4d the relatively high share of wheat within cereal-related virtual water exports is largely due to a peak observed in 2017, when favorable climatic conditions, particularly the 327 mm of rainfall recorded that year, resulted in a strong cereal harvest. This led to an increase in national wheat production and export capacity, ultimately causing a temporary surge in the volume of virtual water embodied in wheat exports.
Analysis of Moroccan Virtual Water Exports Across the EU28 Countries
The main EU28 countries importing Moroccan virtual water are generally Morocco’s first customers.
Table 3 illustrates that France, the Netherlands, UK, Spain, and Sweden accounted for 85.636% of virtual water exports (France 1138.785 Mm
3, Netherlands 874.323 Mm
3, UK 430.872 Mm
3, Spain 281.606 Mm
3, Sweden 180.233 Mm
3). As shown in
Figure 5, Croatia and Romania are the least significant importers of Moroccan virtual water, with volumes of 0.015 Mm
3 and 0.021 Mm
3, respectively, while virtual water exports to Bulgaria and Luxembourg are practically nil.
The large volume of virtual water exports is primarily derived from fruits and vegetables. For instance, France, the leading importer of Moroccan virtual water, received an estimated total volume of 1138.785 Mm3 over the period of 2000–2020. This total comprises 774.284 Mm3 from fruits, 354.631 Mm3 from vegetables, 8.062 Mm3 from pulses, and 1.807 Mm3 from cereals, representing 33.560% of the Virtual Water Exported to all EU28 countries.
4.2. Analysis of Virtual Water Imports Through Morocco’s Trade with EU Countries
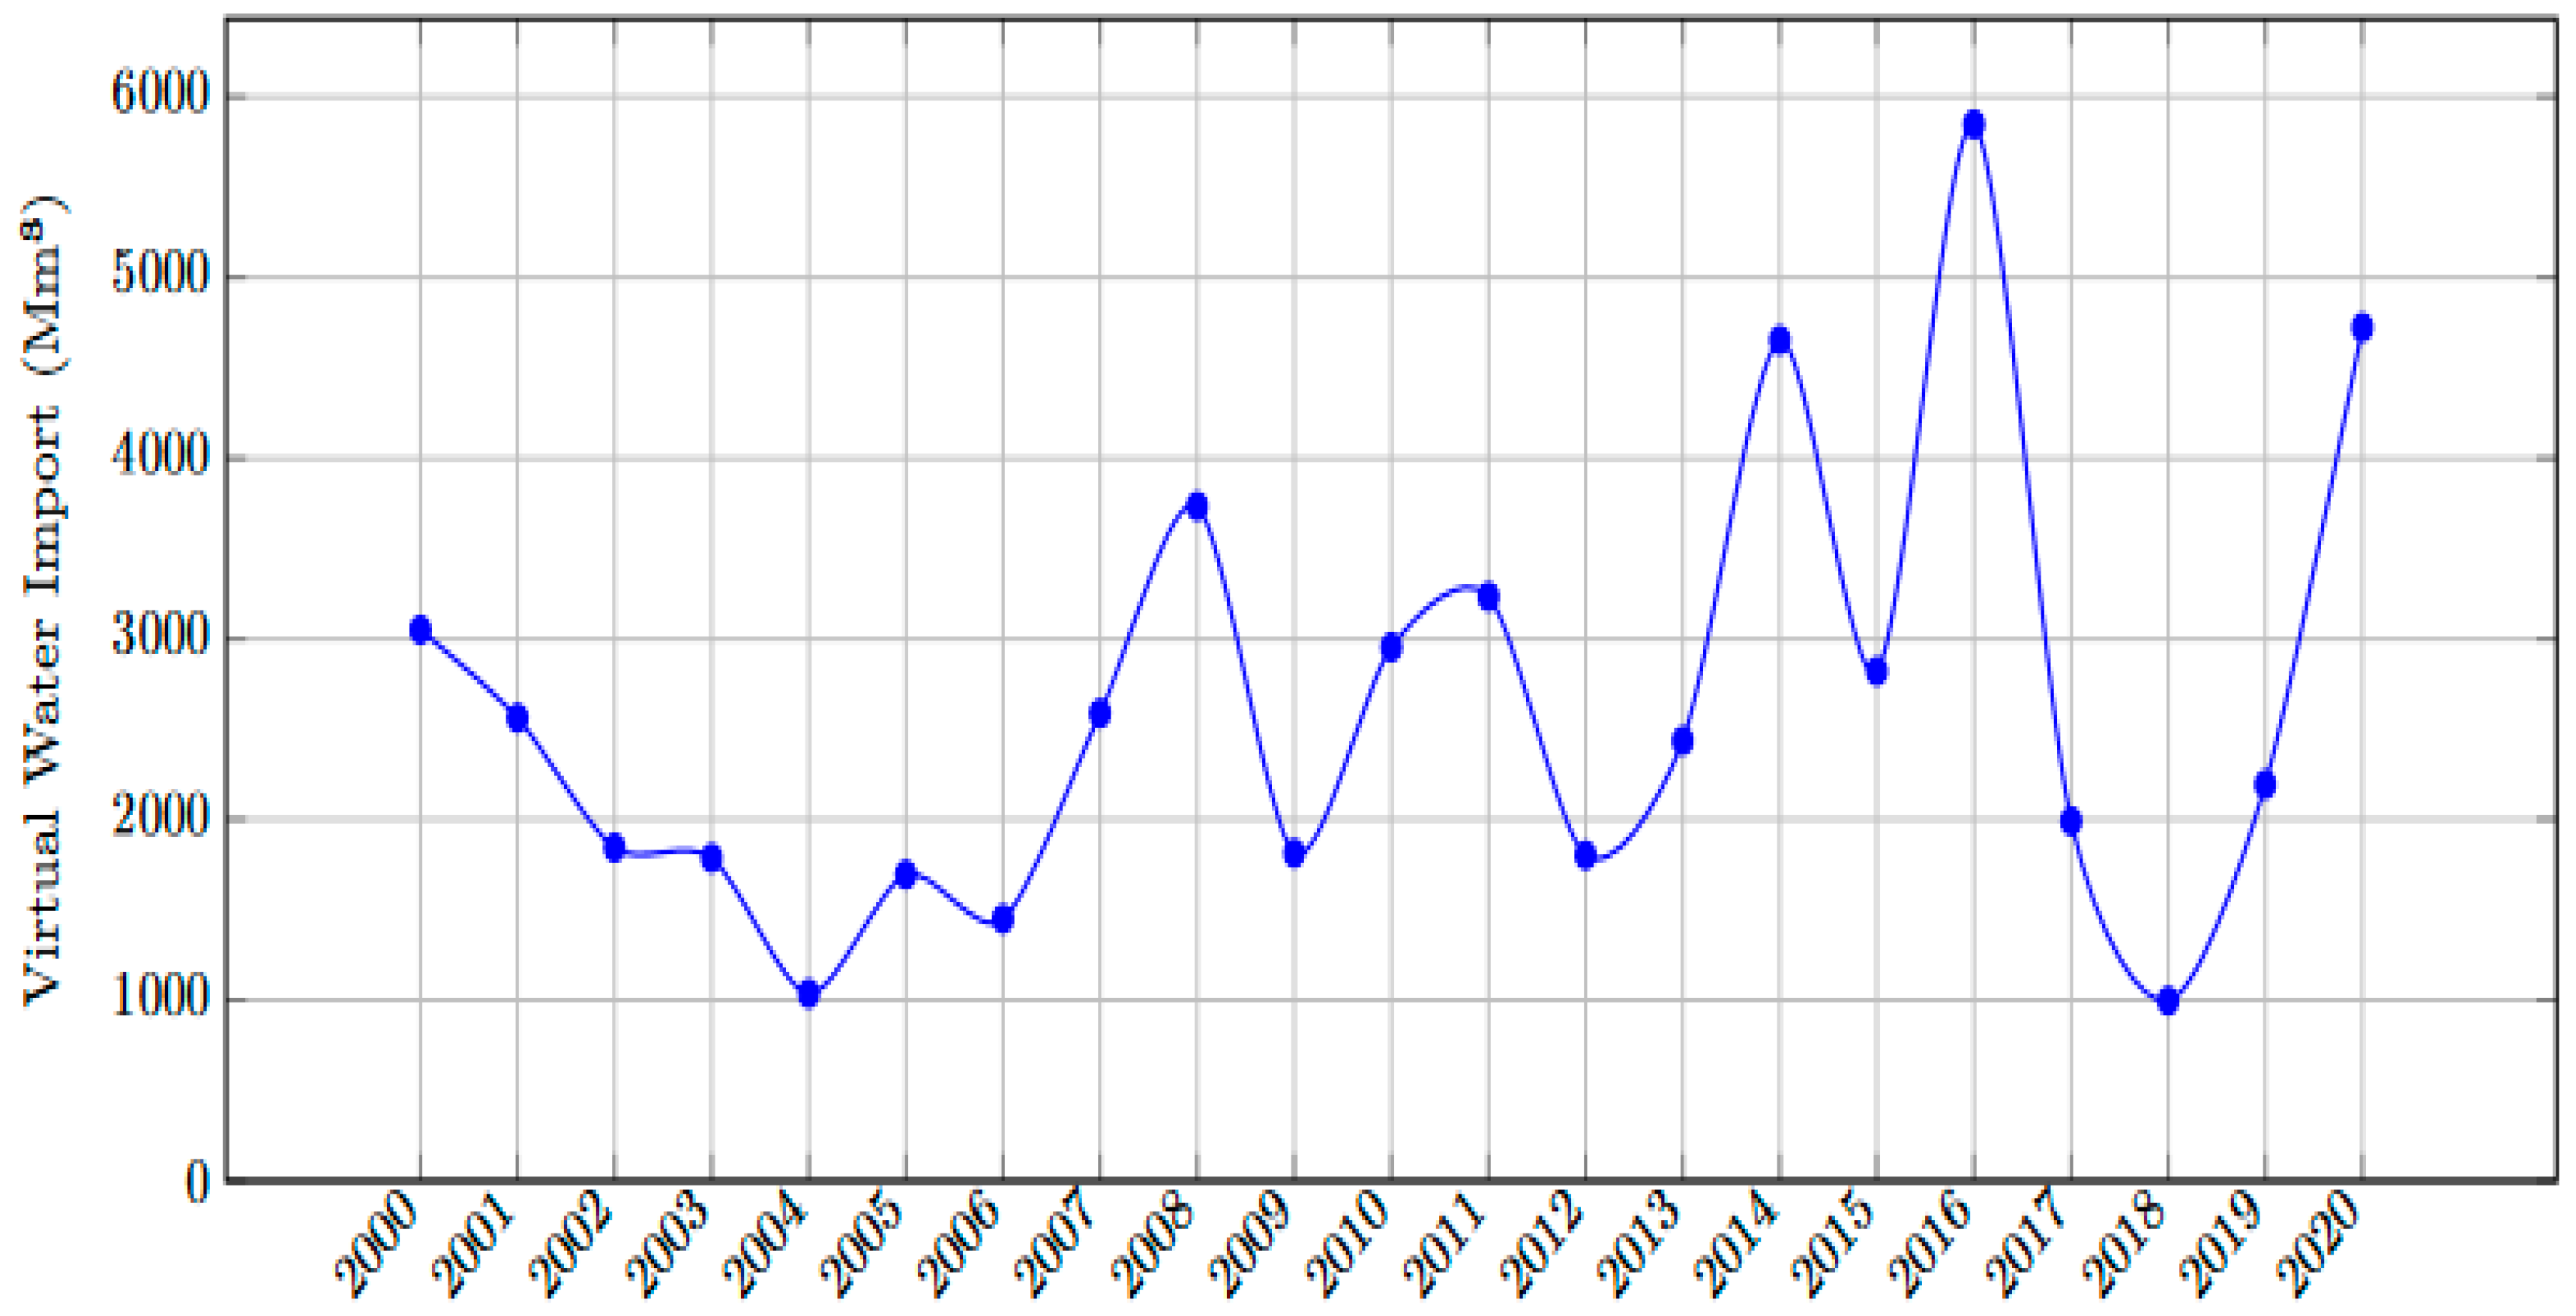
The cumulative volume of Virtual Water Imported from European Union countries for the studied crops over the period of 2000–2020 amounted to 55,232.963 Mm
3.
Figure 6 shows that the largest annual import volume was recorded in 2016, reaching 5848.356 Mm
3, while the smallest occurred in 2018, with 996.814 Mm
3. The average annual virtual water import over the period was approximately 2630.052 Mm
3. The quantity of imported virtual water decreased from 2000 to 2006, then gradually increased to peak in 2016 before declining sharply in 2018 and rising again through 2020. This decline can be attributed to agricultural factors, as Morocco experienced a series of favorable rainy seasons leading to strong agricultural production, as well as to political factors, notably diplomatic tensions impacting agricultural trade under the free trade agreement with the European Union.
As shown in
Table 4, more than 99.697% of the Virtual Water Imported by various European Union countries comes from cereals, with a total volume of 55,065.975 Mm
3, followed by vegetables 83.207 Mm
3, fruits 79.393 Mm
3, and pulses 4.386 Mm
3. Wheat and barley are the main agricultural products importing virtual water into Morocco, with virtual water volumes of 52,346.877 Mm
3 and 2413.738 Mm
3, respectively.
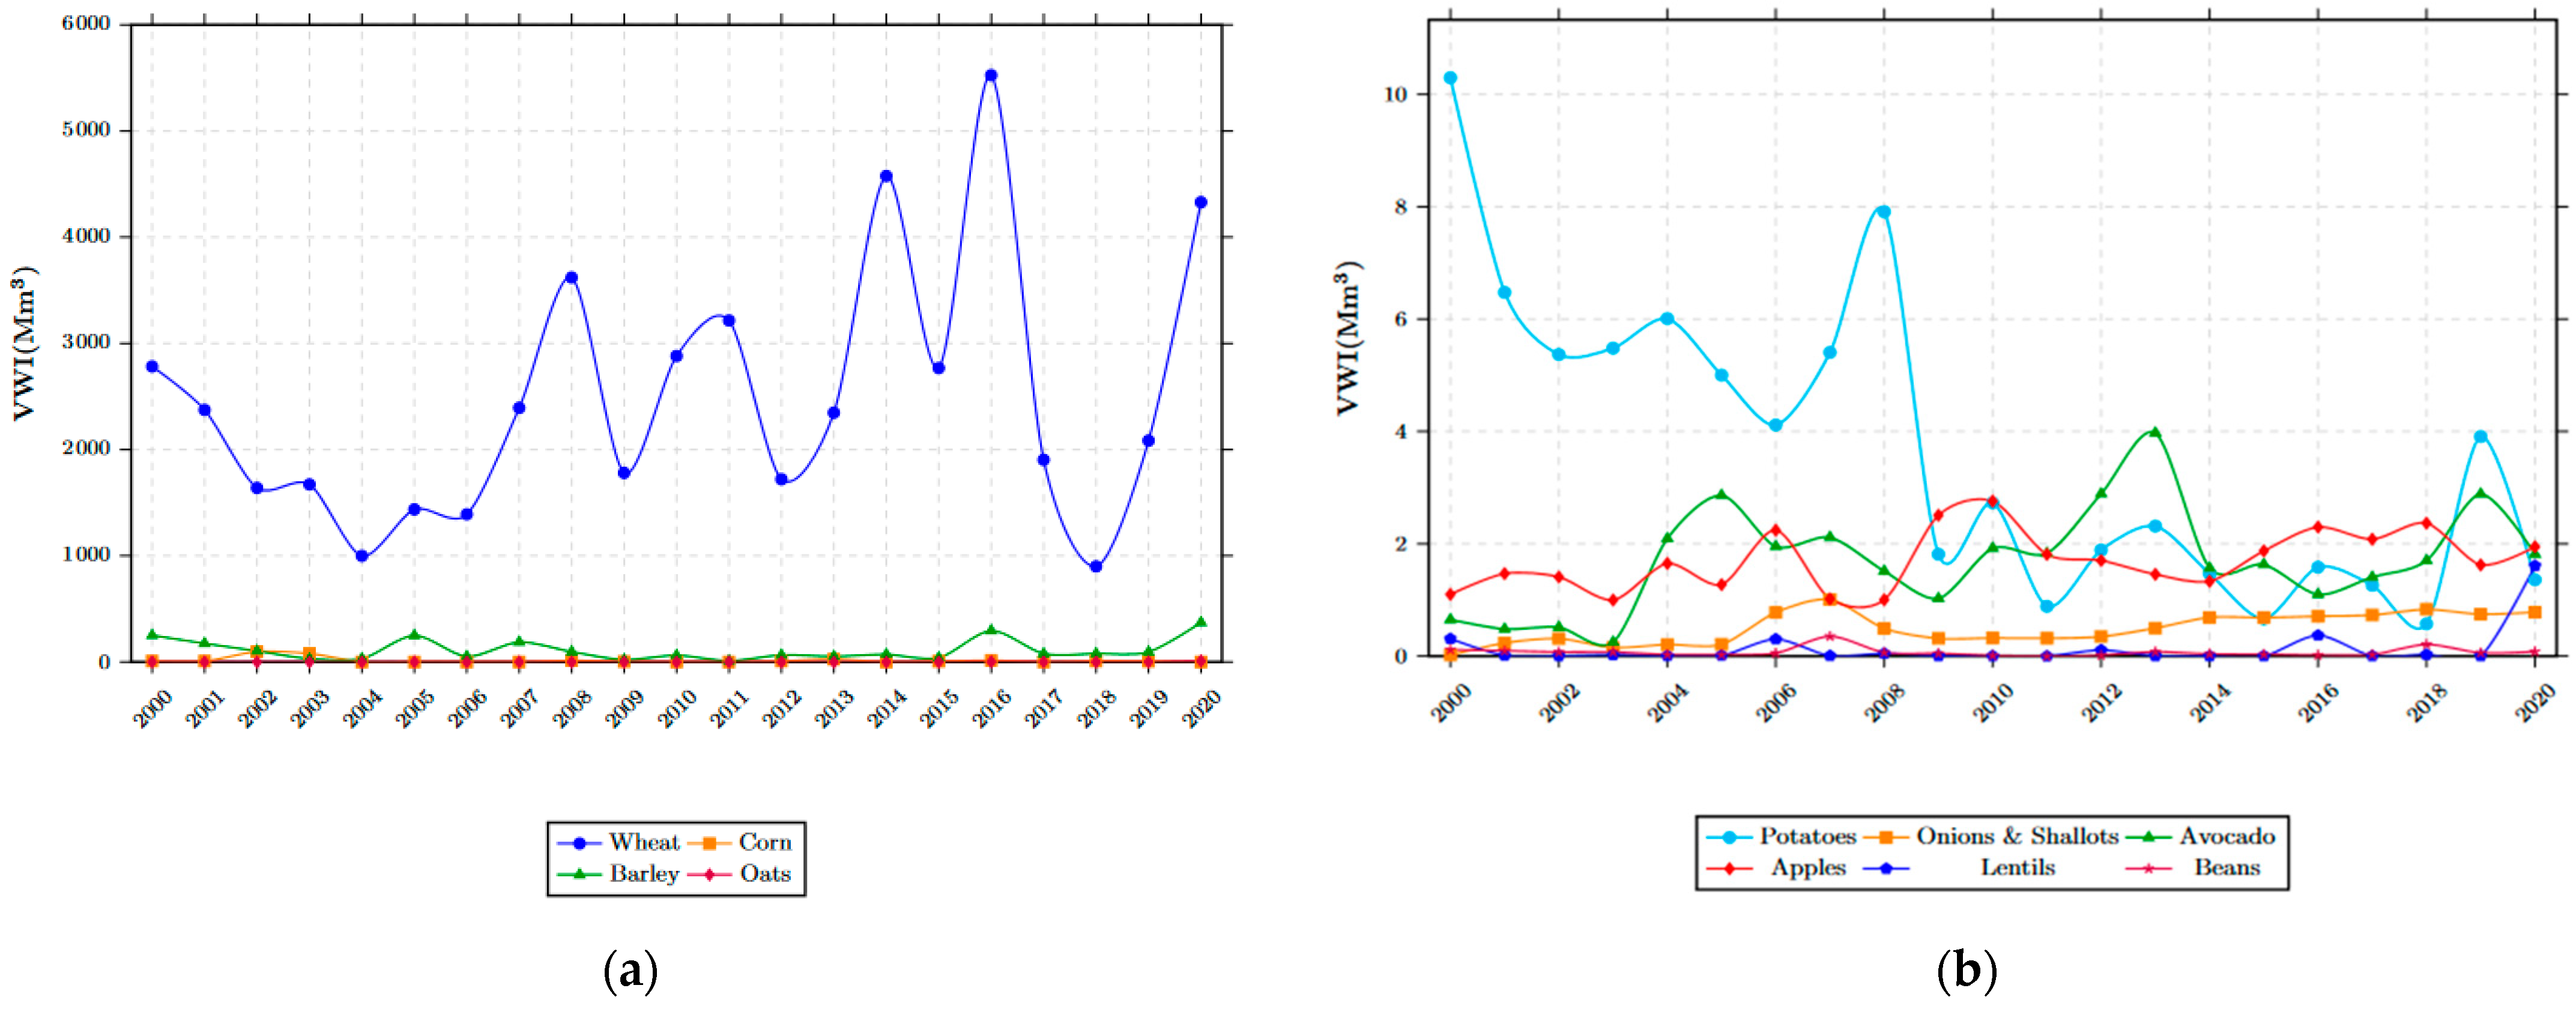
As shown in
Figure 7a, wheat is the cereal crop that dominates all imported virtual water volumes, accounting for 94.781%. On average, Morocco imported an estimated 2492.708 Mm
3 of virtual water embodied in wheat. The largest quantity of virtual water imports was 5525.742 Mm
3 in 2016, and the smallest quantity was 900.093 Mm
3 in 2018.
The decrease in wheat imports in 2018 is explained by Morocco’s shift to other wheat-exporting countries, notably Ukraine and Russia, following the impact on the free trade agreement caused by the political conflict between the two economic partners (Morocco–EU), as well as by Morocco’s high cereal production during this period, which reached 73.3 million quintals of wheat. The second most important cereal importing virtual water is barley, with an average annual volume of 114.939 Mm3. Morocco’s high level of cereal imports is justified by the insufficiency of domestic production to meet the demand of the Moroccan market, particularly for wheat, a staple food in the Moroccan diet.
Potatoes and onions are the main vegetables imported by Morocco from the EU28 countries, with calculated volumes of 80.206 Mm3 and 2.199 Mm3 for potatoes and onions, respectively. Of the 75.560 Mm3 of Virtual Water Imported by fruits into Morocco, 36.182 Mm3 (47.885%) is accounted for by avocados, followed by apples, which account for 35.942 Mm3 (0.475%) of the Virtual Water Imported by fruit. Pulses are the crops containing the least virtual water imports, mainly represented by dried lentils (2.862 Mm3) and dried beans (1.509 Mm3).
Analysis of Virtual Water Imports from EU28 Counties
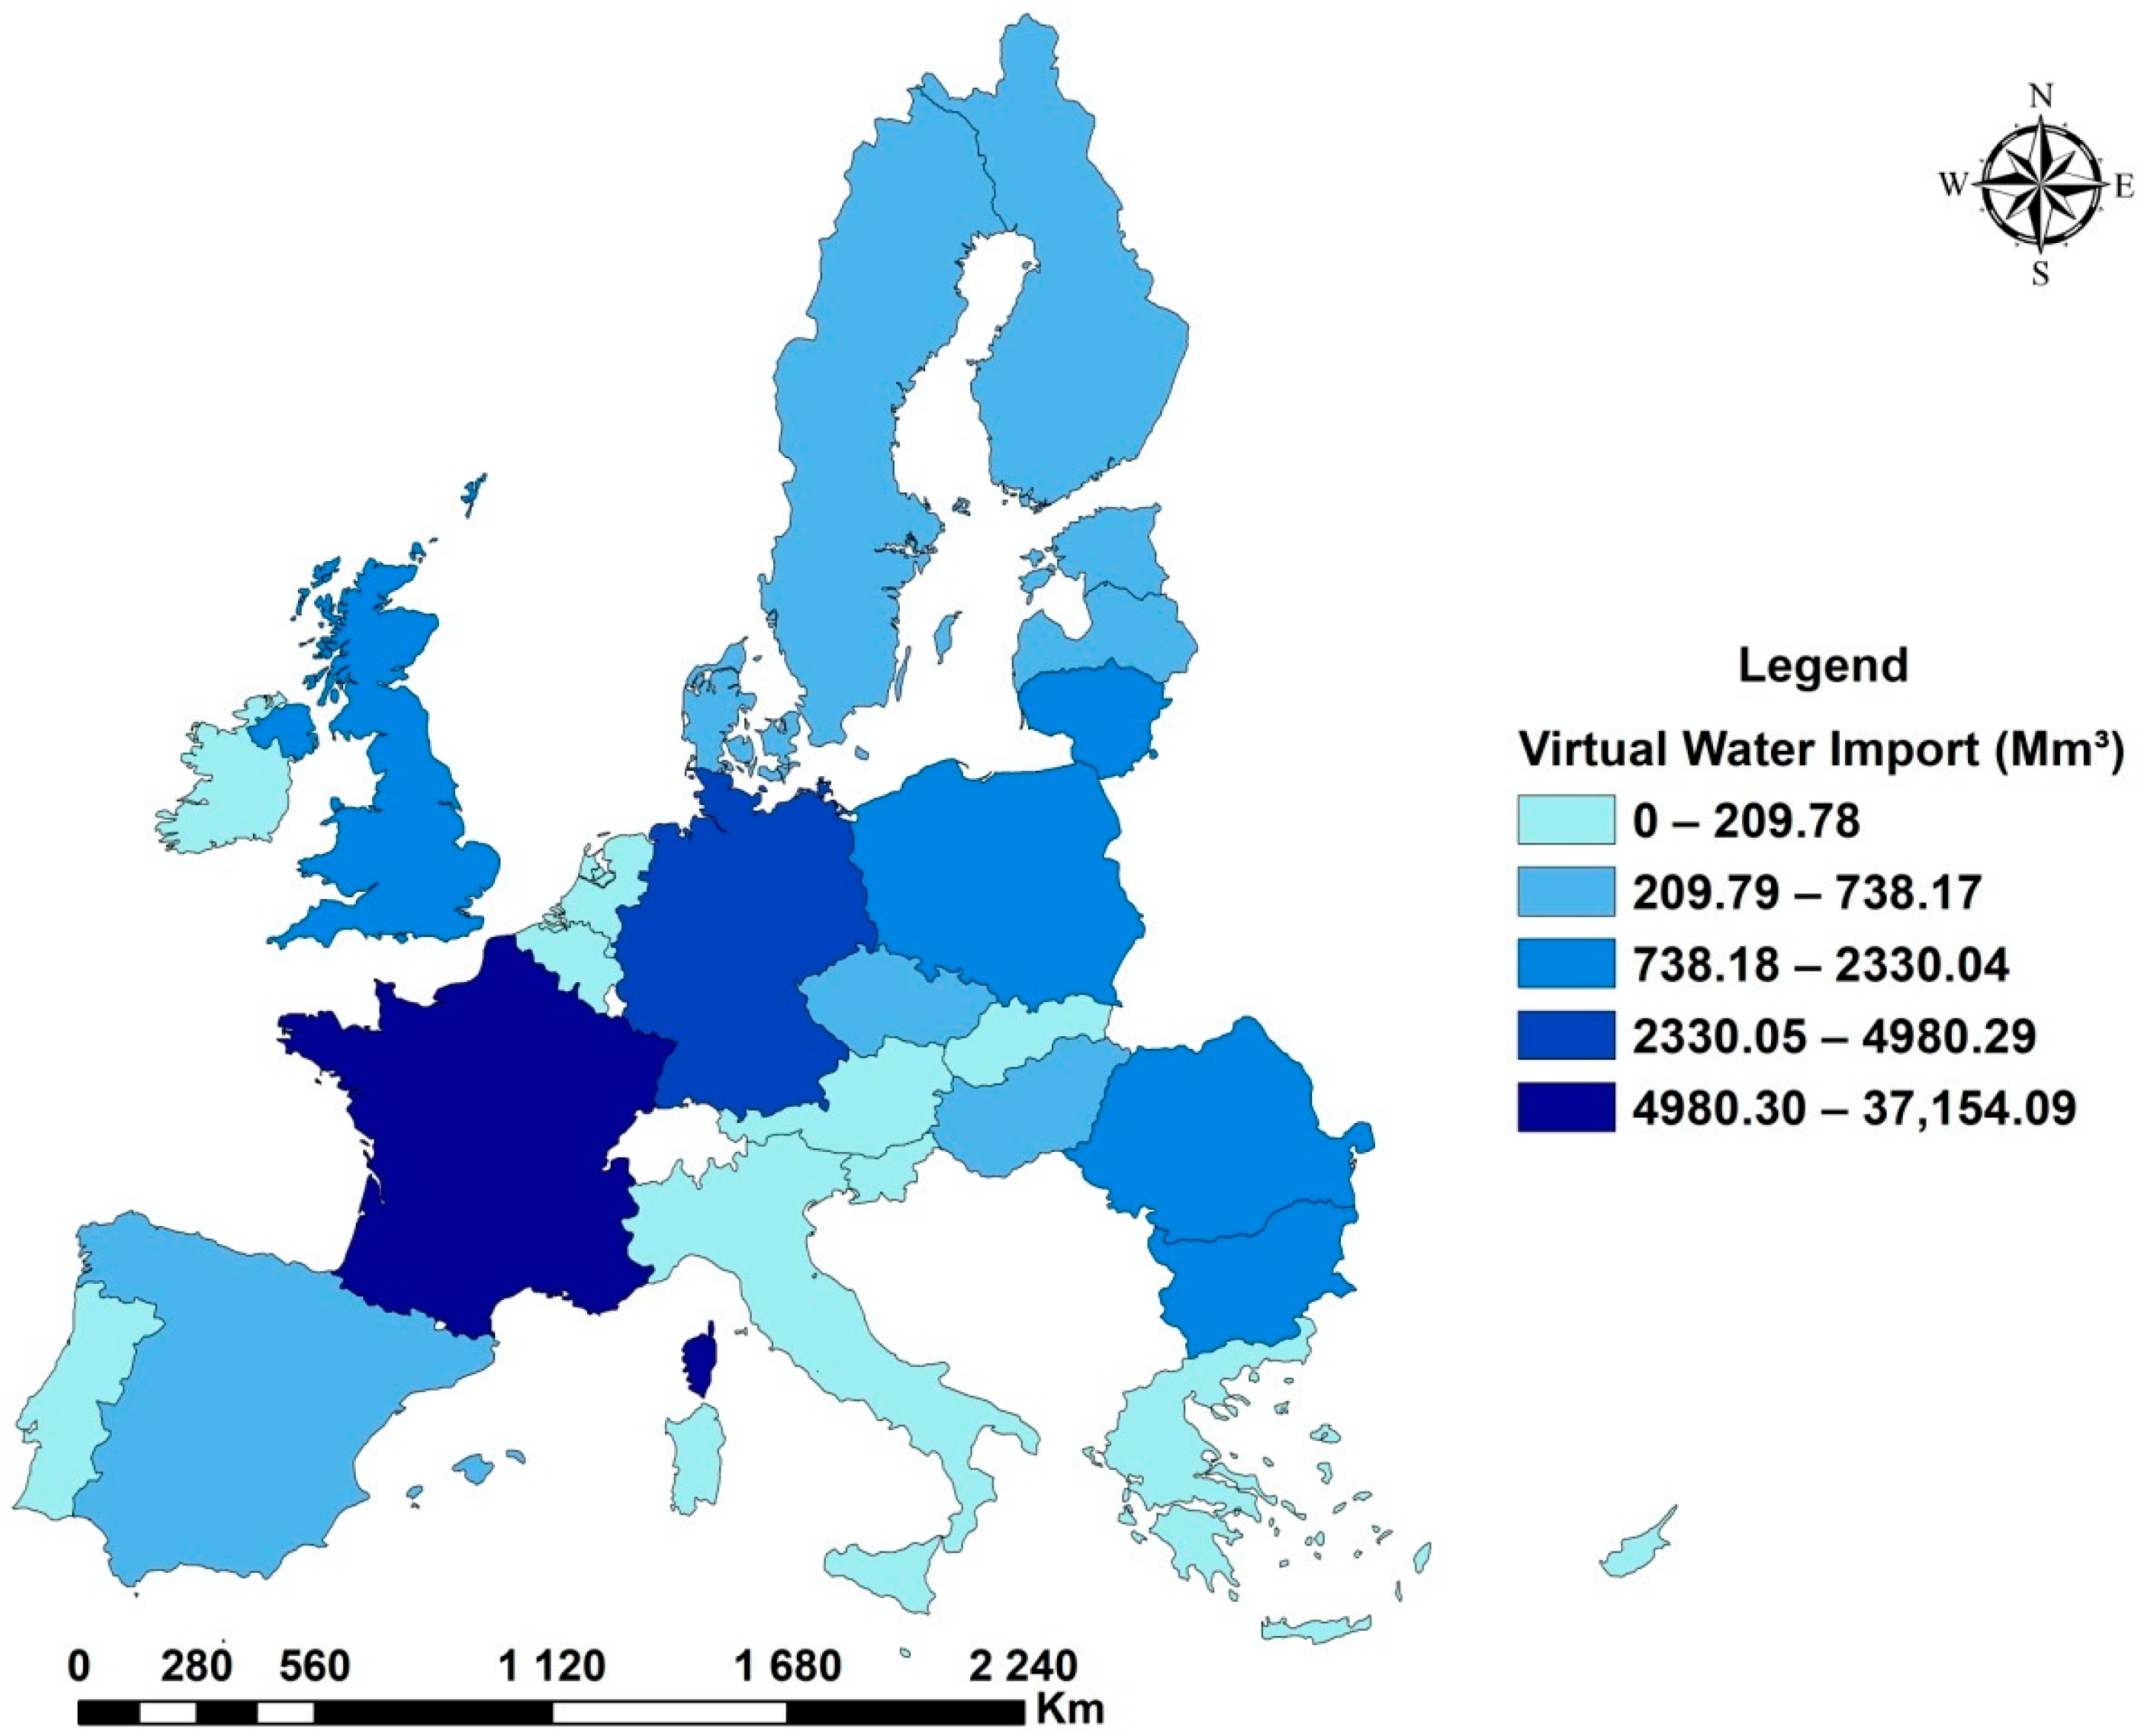
Most virtual water imports originate from European cereal-producing countries. Statistically, 37,154.090 million m
3 of Virtual Water Imported comes from Morocco’s leading trading partner, France, which accounts for 67.267%.
Table 5 shows that the second and third largest EU28 countries exporting virtual water to Morocco are Germany (4980.296 Mm
3, 9.016%) and Poland (2330.039 Mm
3, 4.218%). Around 10% of virtual water imports come from three Eastern European countries: Romania, Bulgaria, and Lithuania, with volumes of 2113.087 Mm
3, 2055.783 Mm
3, and 1569.317 Mm
3, respectively.
Figure 8 shows that during the study period, Luxembourg and Portugal exported only 0.019 Mm
3 and 0.959 Mm
3 to Morocco, making them the countries from which Morocco imported the least virtual water, while Malta and Slovenia imported no virtual water at all.
4.3. Global Net Virtual Water
In relation to the countries of the European Union, Morocco was a net importer of virtual water over the period of 2000–2020, with a volume of 51,839.171 Mm
3.
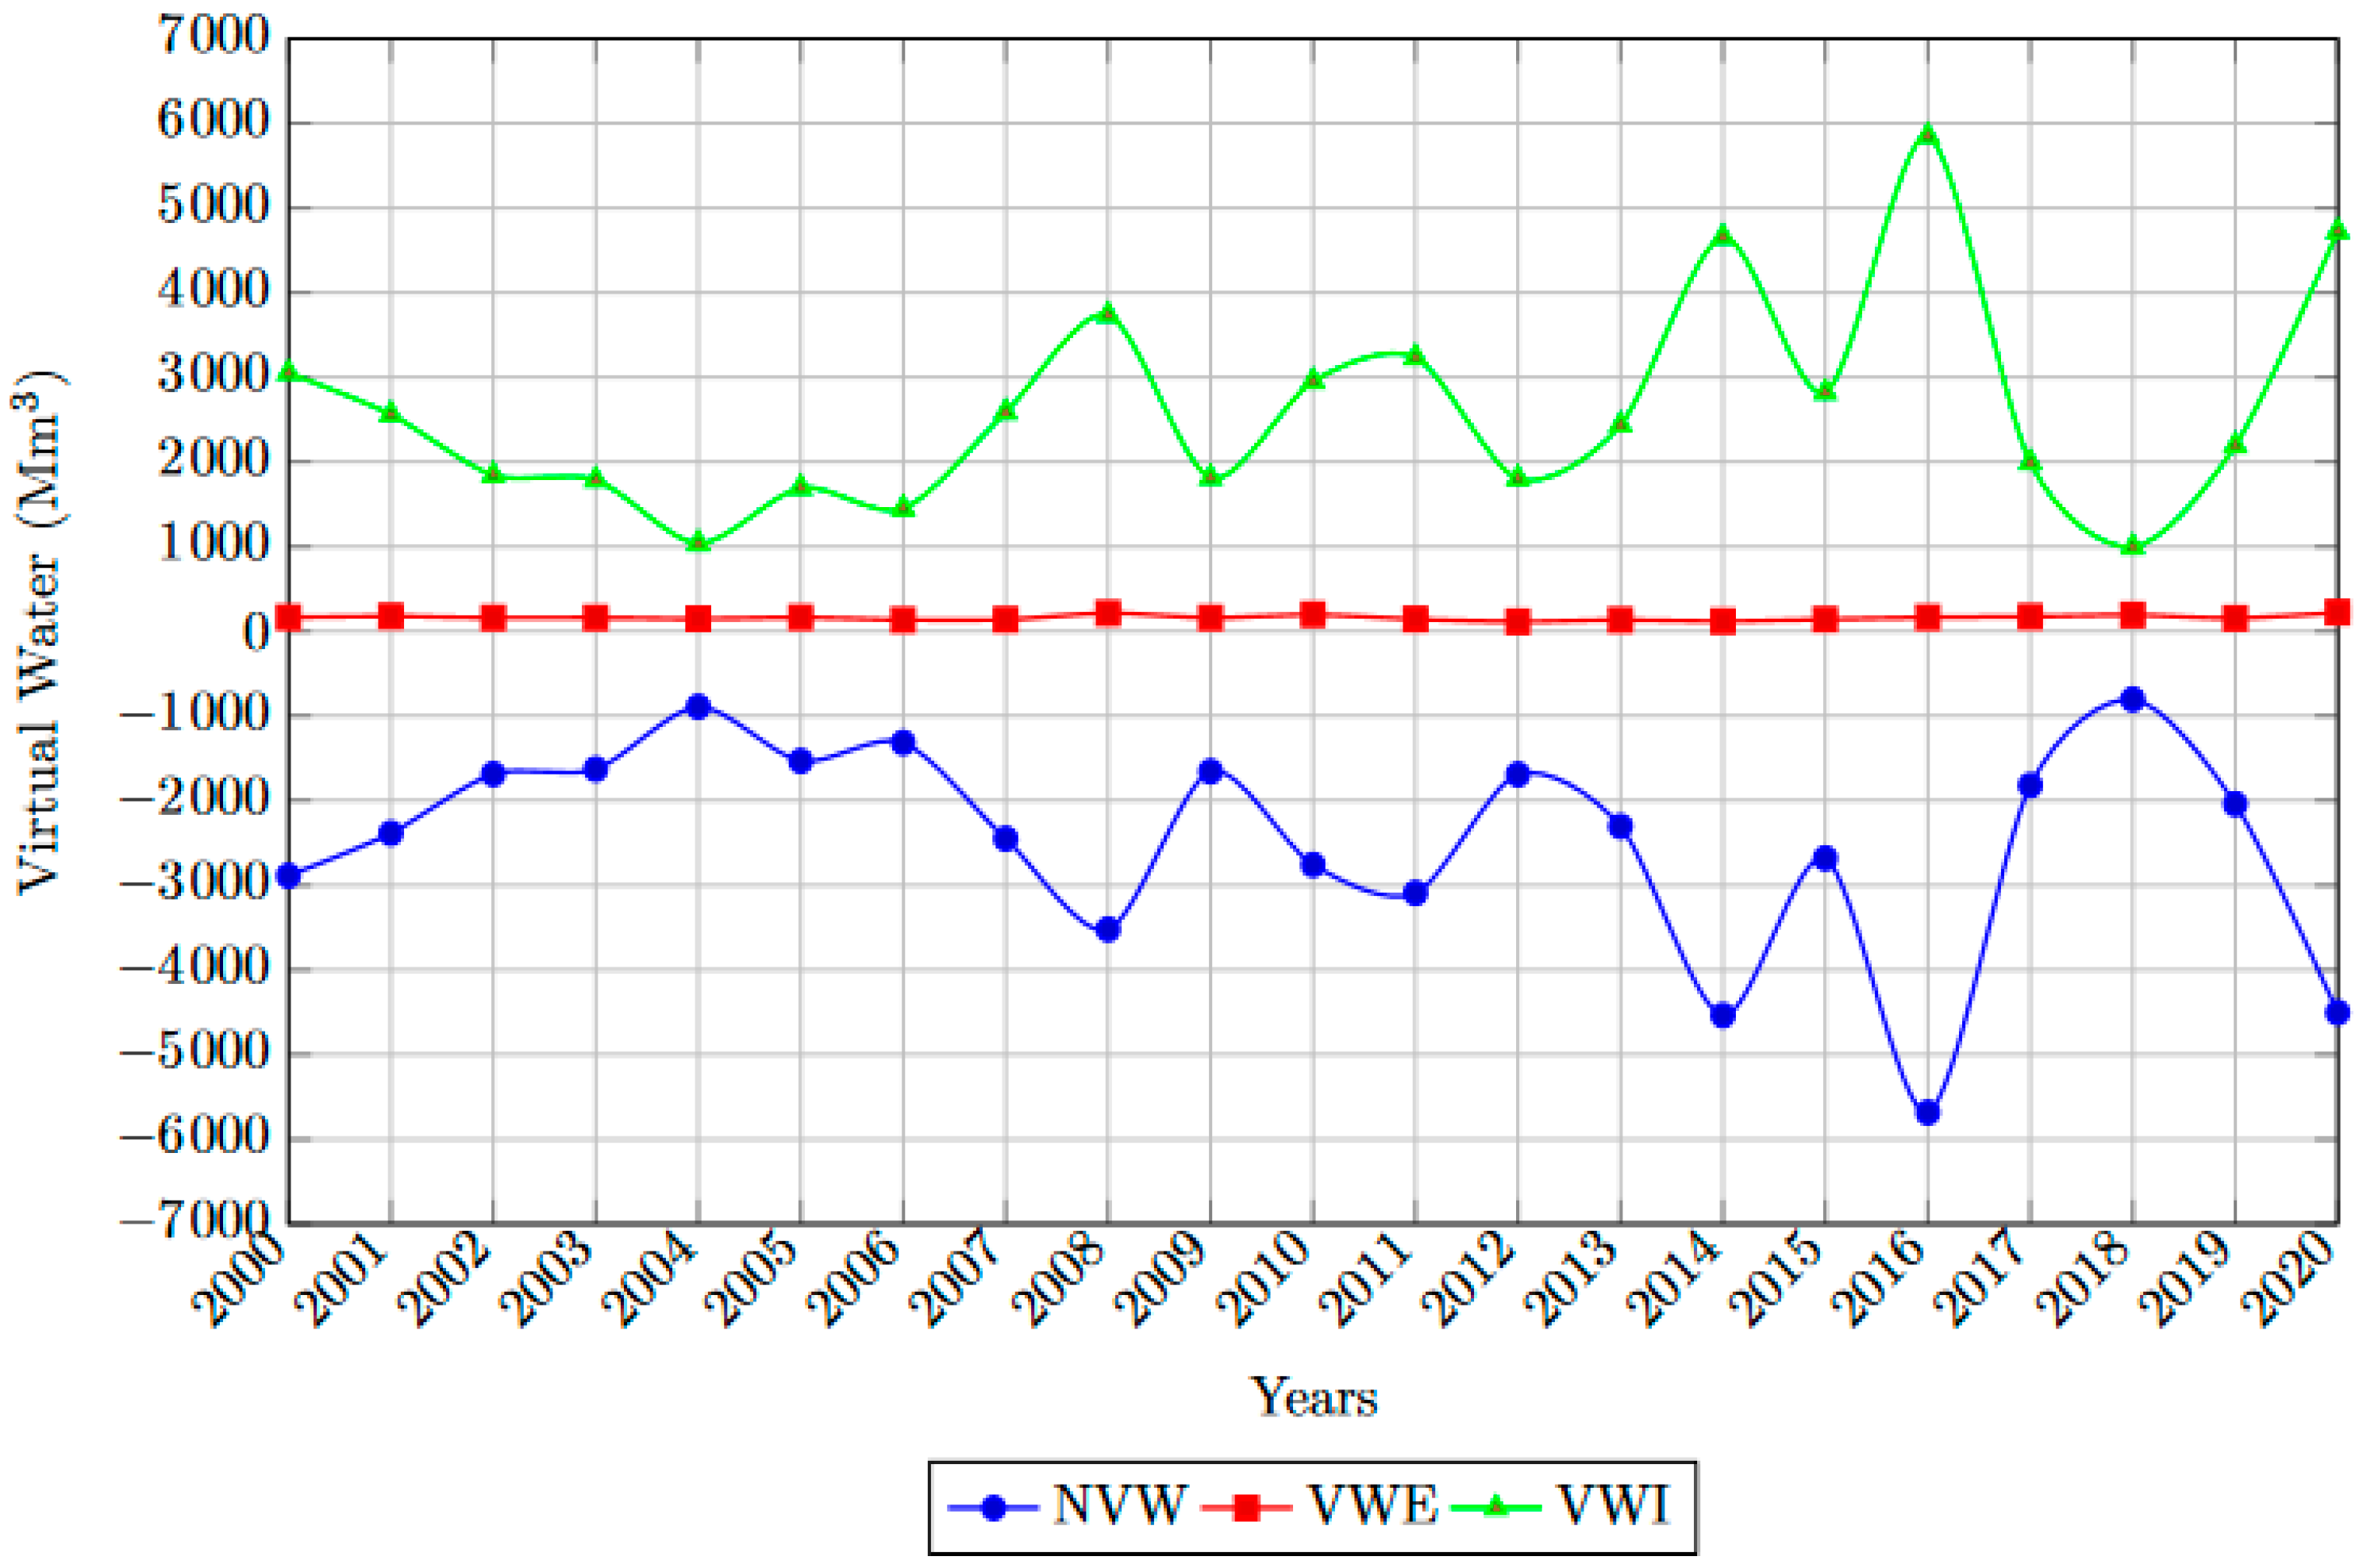
Figure 9 shows that the water-intensive cereal imports accounted for the bulk of the net virtual water. Fluctuations in the water balance over time showed that the virtual water balance was always positive, with an average of 2468.470 Mm
3/year. The largest net virtual water volume was recorded in 2016 with 5682.882 Mm
3, and the smallest net virtual water volume was 802.672 Mm
3, recorded in 2018.
4.3.1. Analysis of Net Virtual Water by Crop Category
The results for net virtual water by crop category show that Morocco is a net virtual water exporter for vegetables and fruits, as well as for the pulses studied in this work, while it is a net virtual water importer for all types of cereals. The net virtual water export was 15.29 Mm
3 for pulses, 384.74 Mm
3 for vegetables, mainly fresh tomatoes, with an estimated net virtual water export of 350.98 Mm
3, and 2823.63 Mm
3 for fruit, of which mandarins account for 1258.84 Mm
3. For cereals, the net virtual water import was 55,062.80 Mm
3, with wheat accounting for 52,344.94 Mm
3 as shown in
Figure 10a. These findings show that Morocco’s agricultural policy, in particular the Green Morocco Plan, tends to export the most water-intensive crops, essentially fruits and vegetables such as fresh tomatoes, citrus fruit, avocado, artichokes, asparagus, and strawberries, which explains the virtual water surplus in the water balance of these crops. Even though cereals are a major source of virtual water imports from the European Union, the growing export of water-intensive crops means that Morocco’s water shortage situation is set to worsen, especially in a climate marked by significant rises in temperature, falling rainfall, and groundwater depletion.
4.3.2. Analysis of Net Virtual Water by EU28 Countries
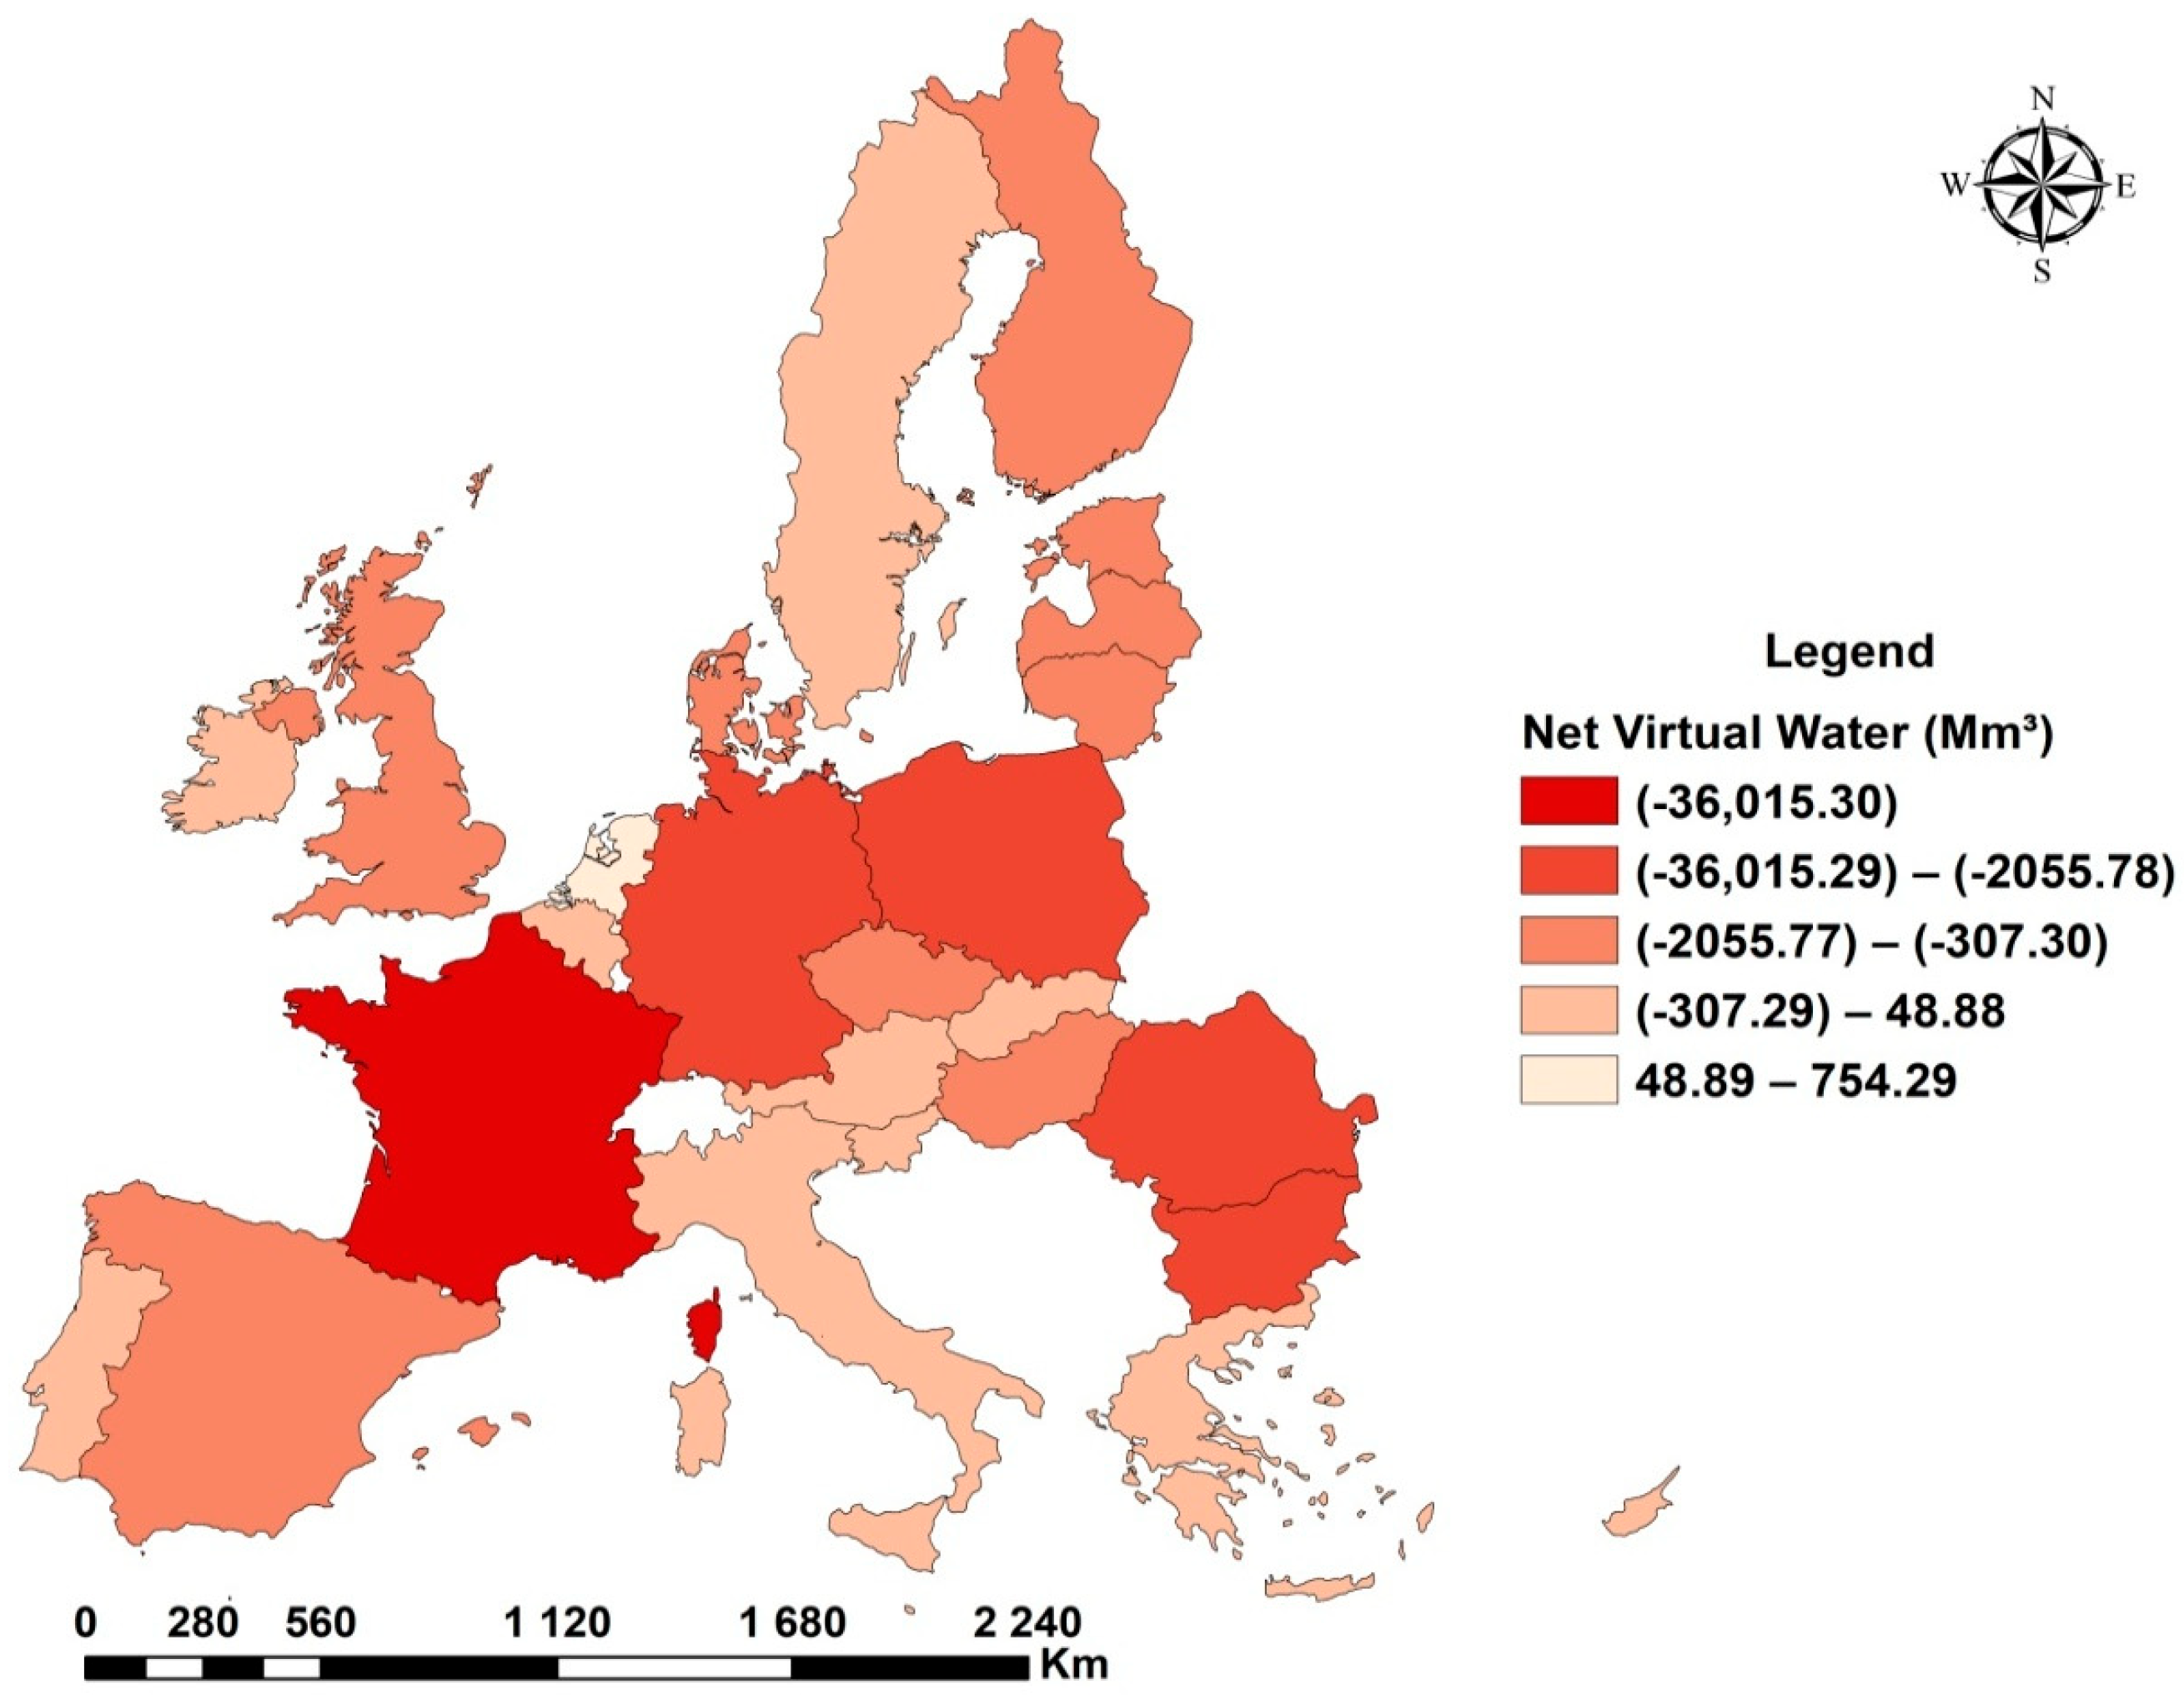
According to this study, the virtual water trade in agricultural products shows that Morocco is a net importer of virtual water for the majority of EU28 countries. As shown in
Figure 11, the water balance over the study period was 36,015.305 Mm
3 with France, 4875.027 Mm
3 with Germany, 2311.069 Mm
3 with Poland, 2113.066 Mm
3 with Romania, and 2055.783 Mm
3 with Bulgaria. Nevertheless,
Table 6 shows that Morocco was a net exporter of virtual water with five countries: the Netherlands, Belgium, Portugal, Malta, and Slovenia, with net virtual water exports of 754.295 Mm
3, 48.886 Mm
3, 18.645 Mm
3, 0.154 Mm
3, and 0.095 Mm
3, respectively.
4.4. Results of the Water Economic Productivity
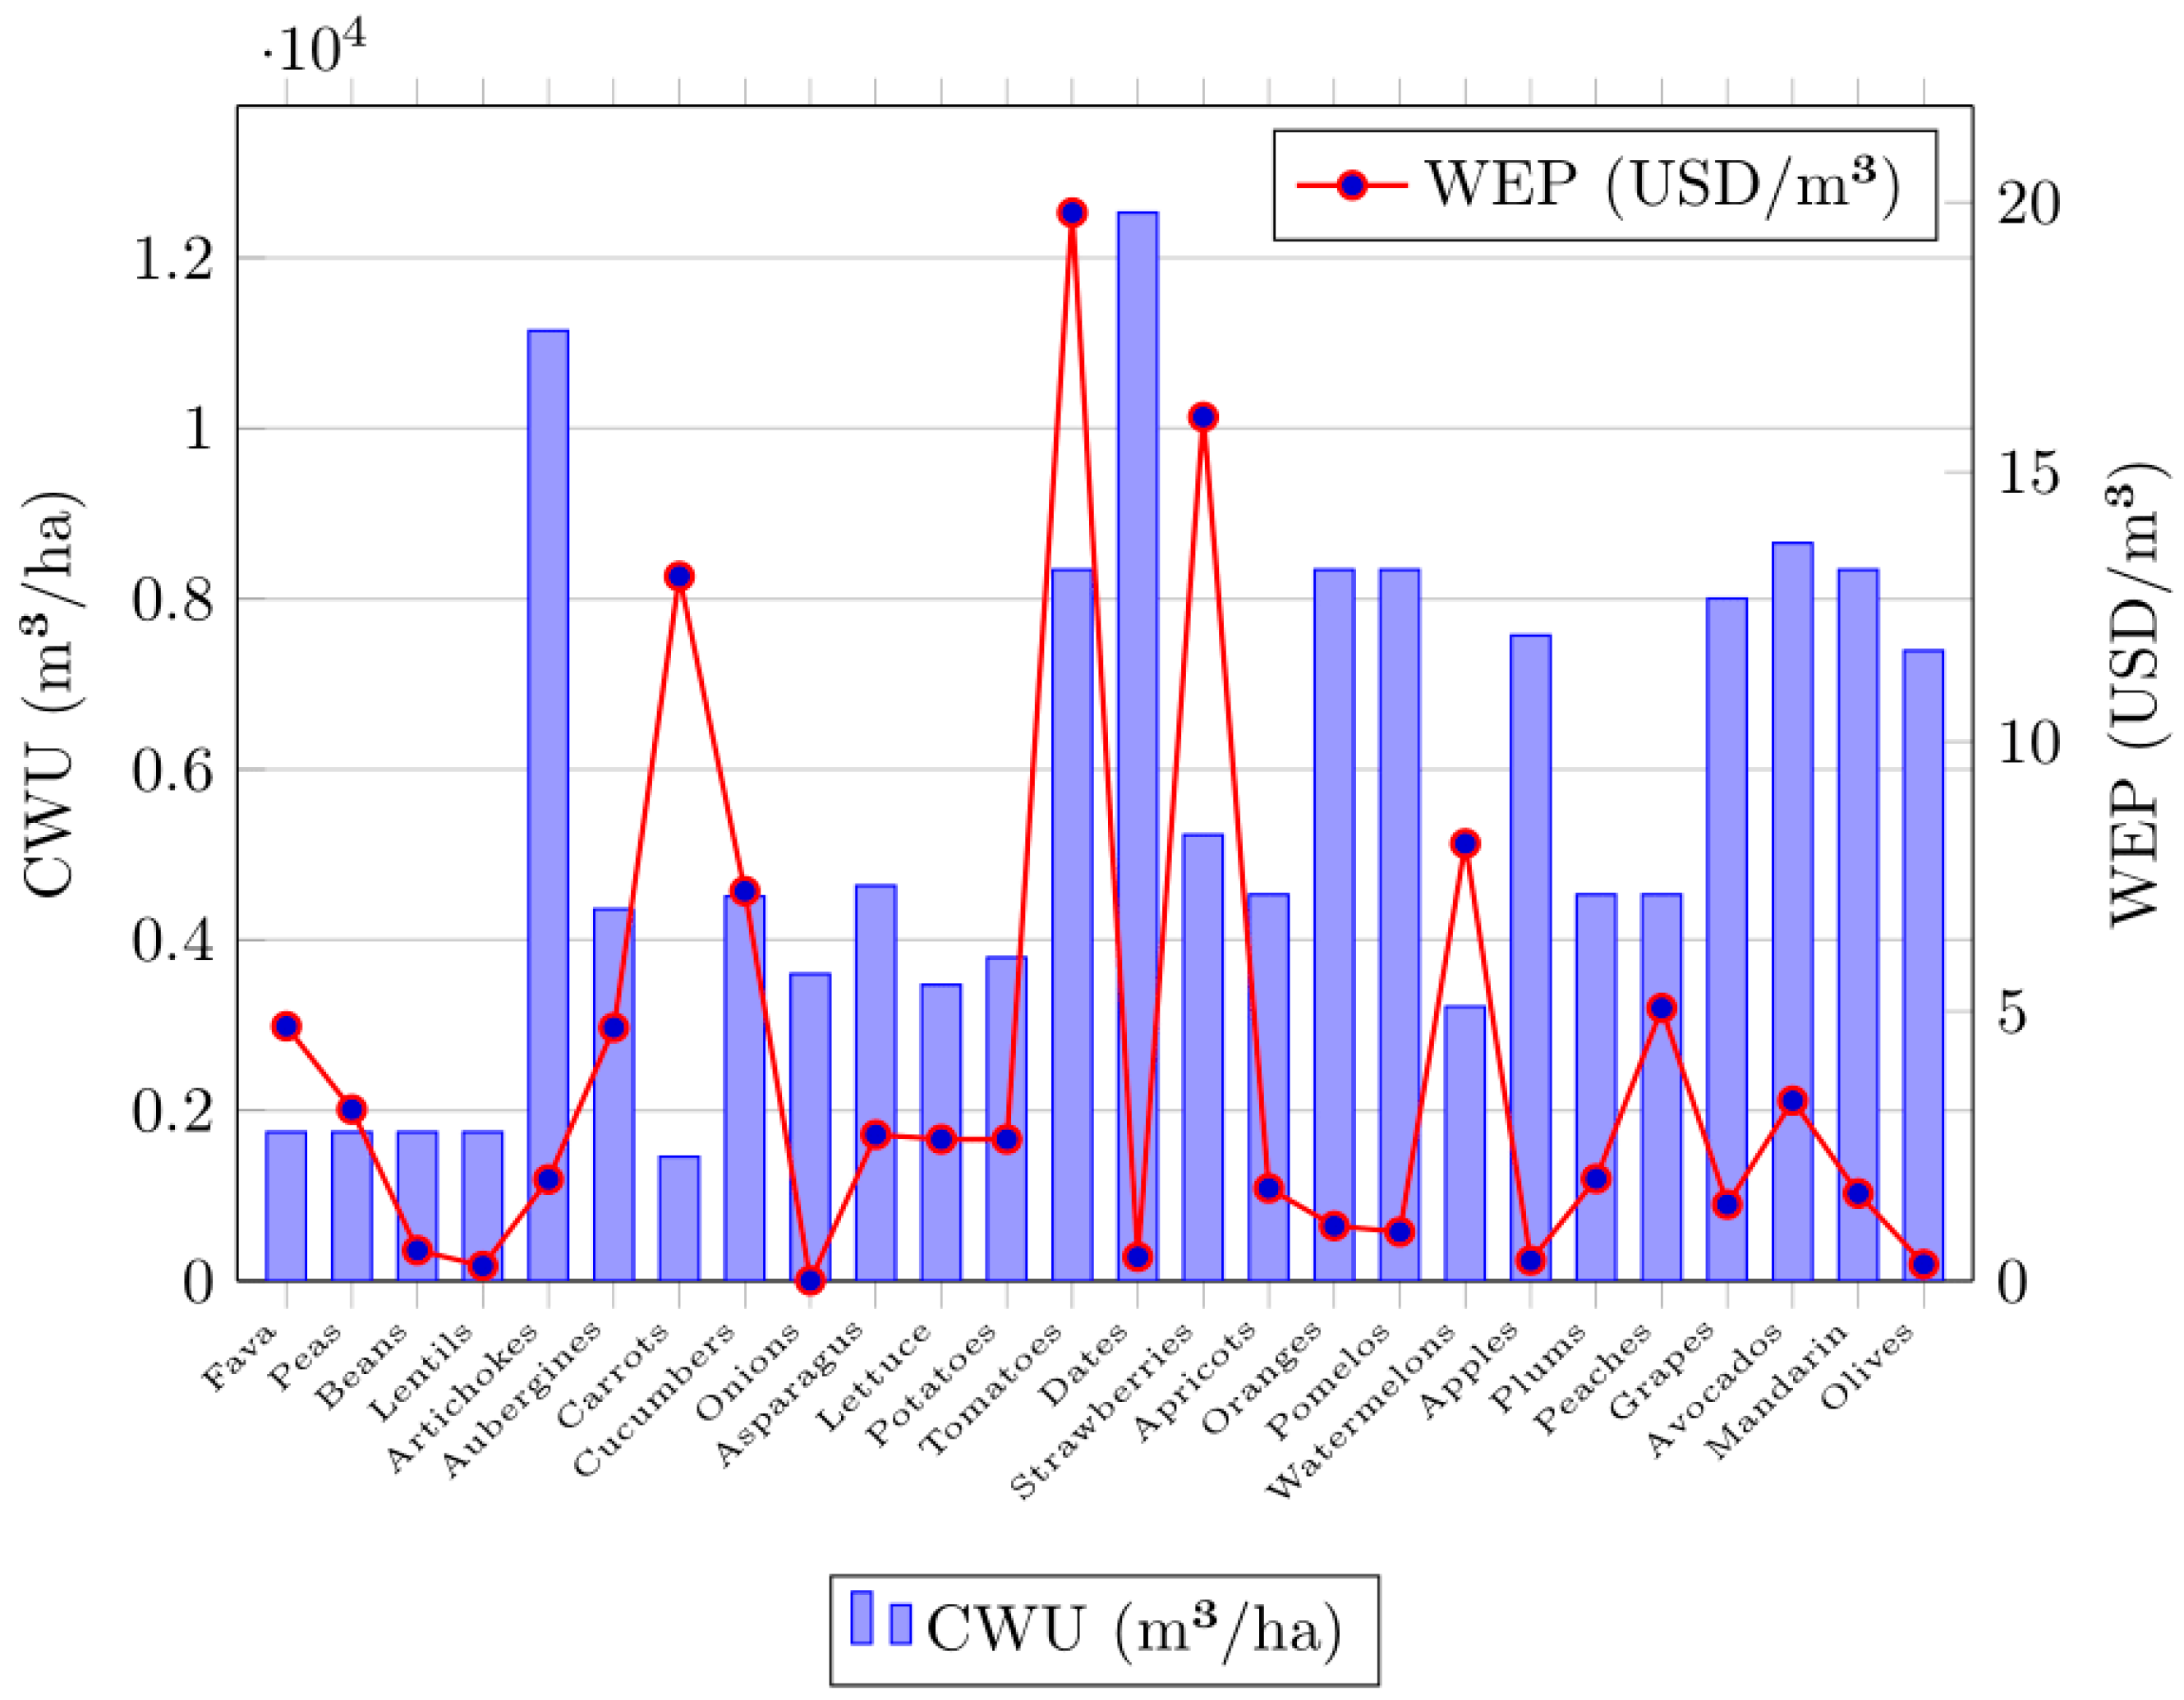
Our analysis of the economic productivity of water for the agricultural products studied in this paper showed a variation in virtual water profitability ranging from 0.005 USD/m3 to 19.80 USD/m3. Among the 32 agricultural products, four recorded a high income per cubic meter of Virtual Water Exported. Tomatoes returned 19.80 USD/m3 exported, strawberries 16.02 USD/m3, carrots 13.06 USD/m3, and watermelons 8.11 USD/m3, while cereals were the crops with the lowest financial return.
Figure 12 shows that artichokes, wheat, citrus fruits, dates, and olives are crops that consume a lot of water but do not generate profits proportional to the volume of water exported through these agricultural products. Mandarins, which are among the leading virtual water-exporting fruits to EU countries, generate a low economic productivity of 1.62 USD/m
3. However, the increase in avocado production shows that this crop does not generate a remarkable benefit when compared with the water requirement for its cultivation. Caro et al. [
52] classified Morocco in 2016 as the seventh-largest avocado-exporting country in the world with a cost of 0.54 m
3/USD. Most Moroccan avocado is exported to Spain, France, and Germany, European Union countries where the total renewable water resources range between 24 and 26 billion m
3. These countries benefit from significant green water availability, largely influenced by annual precipitation levels of 705 mm in Spain, 1238 mm in France, and 1003 mm in Germany. Green water, defined as the portion of rainfall stored in the soil and directly available for plant growth, is therefore more abundant in these regions compared to Morocco, which had an estimated renewable water availability of only 22 billion m
3 and an annual precipitation of just 224 mm in 2024. Green water use represents about 68% of the aggregate water footprint in the EU27 [
26]. France and Germany, among the seven member states, including France, Italy, Germany, Spain, Romania, Poland, and Great Britain, account for 72% of the green water footprint within the EU27 [
26]. This contrast highlights a major inconsistency between Morocco’s water policy, which promotes sustainable resource management under growing water stress, and its agricultural policy, which encourages the export of water-intensive crops.
For each agricultural product, the results of the economic productivity of water revealed a variation in the profit generated by the export of virtual water to the European Union, with an overuse of water resources in Morocco yielding a generally limited return in terms of dollar value per unit of exported water, with the exception of tomatoes, strawberries, carrots, and watermelons, which generate a high economic return.
5. Discussion
Our analysis of virtual water trade between Morocco and its trade partners over the period of 2000–2020 has shown that the results are different from those found in previous studies, due to a number of reasons, such as those relating to technical aspects, i.e., the types of agricultural crops included, the study period, the origin of the data, and the method used, and also reasons of a political economic nature, such as the impact of the choice of agricultural policy on the agricultural production of countries, bilateral and multilateral free trade agreements concluded, market dynamics, trade flows, and also the availability of water, which influences the type of crop adapted. In previous limited studies on virtual water trade in Morocco, Hoekstra and Chapagain [
33] took into account livestock products and a wide range of agricultural products in their calculation of the virtual water of Morocco and the Netherlands in the period of 1997–2001. They found that Morocco exported 1.6 billion m
3/year and imported 6.3 billion m
3/year. Schyns and Hoekstra [
34] also considered livestock products in the calculation of the water footprint and industrial commodities, showing that Morocco imported during the period of 1996–2005 a volume of 12.643 Mm
3/year and exported a volume of 1.333 Mm
3/year, with an economic return of 0.87 USD/m
3 on average. In their analysis of virtual water in the African context, Hriwa et al. [
35] found that Morocco had an NVWI of 190.32 Bm
3 during the period of 2000–2020. Boudhar et al. [
36] evaluated virtual water trade for 40 agricultural products over the period of 2000–2017, showing that Morocco exported 95.03 Gm
3 and imported 595.74 Gm
3. Unlike previous studies, which studied Morocco’s virtual water trade with the rest of the world, the present work focuses on virtual water trade with an economic aggregate and a major trading partner of Morocco that has signed a free trade agreement for agricultural products. This study also considers only the most traded products between the two trading partners in a period of time that was characterized by the launch of a major agricultural policy, the “Green Morocco Plan,” in order to transform Moroccan agriculture into an exporting and revenue-generating sector.
The present study found that Morocco is a net importer of virtual water in relation to the majority of European Union countries, with an estimated net virtual water of 51,839.171 Mm3,thereby enabling the conservation of substantial volumes of water, notably through the importation of cereals, but has a net export balance with Malta, Portugal, Slovenia, and the Netherlands. Given its geographical location, Morocco exports more water-consuming crops to European Union countries, particularly major partners such as France, the Netherlands, the UK, and Sweden, primarily through fruits and vegetables. These countries are generally considered humid and possess extensive hydrological networks, France is served by major rivers such as the Seine, Loire, and Rhône, providing a renewable water resource of approximately 210 billion m3 per year, the Netherlands relies heavily on the Rhine and Meuse rivers along with an extensive canal system, with around 90 billion m3 of renewable water resources, the UK benefits from river systems like the Thames and Severn, with about 120 billion m3 of available water annually, and Sweden, rich in lakes and rivers such as the Göta älv and Dalälven, has renewable water resources estimated at 160 billion m3 per year.In contrast, Morocco’s main rivers, including the Oum Er-Rbia, Sebou, Moulouya, Tensift, and Draa, collectively contribute to a renewable water availability of only about 18 billion m3 annually, highlighting the stark disparity in water endowment between Morocco and its main agricultural trade partners.
Despite exporting significant volumes of virtual water embedded in fruits and vegetables to these countries, the economic productivity of this water remains insufficient when considering the real value of water in a water-scarce country like Morocco. Hriwa et al. [
35] found that water stress in Morocco exceeds 60–70%, indicating a structural pressure on water resources, particularly on blue water used for irrigation. The large volumes of virtual water export contribute to substantial pressure on Morocco’s limited water resources, with relatively limited economic returns compared to the water scarcity challenges faced nationally.
6. Conclusions and Policy Implication
This paper used the concept of virtual water to analyze Morocco’s international trade flows with European Union countries for 32 agricultural products over the period of 2000–2020, with the aim of understanding the policy direction of Moroccan agriculture and identifying new approaches to alleviate pressure on water resources and ensure their sustainability. Our findings are as follows:
Over the period of 2000–2020, Morocco was a net importer of virtual water, with a total volume of 51,839.171 Mm3. Imports of virtual water from European Union countries were estimated at 55,232.963 Mm3. Cereals represented the largest share of imported virtual water (55,065.975 Mm3, 99.69%), predominantly wheat, which is a staple food in the Moroccan diet. France, Germany, and Poland were the leading EU exporters of virtual water to Morocco. The growing reliance on wheat imports could place Morocco in a position of food dependence on other countries, particularly France and Germany. In contrast, Morocco exported a total of 3393.791 Mm3 of virtual water to European Union countries over the same period. The volume of virtual water exports exhibited a variable upward trend throughout the study period. Morocco’s virtual water exports to the EU28 were dominated by fruits (2903.028 Mm3, 85.53%) and vegetables (467.948 Mm3, 13.78%), respectively. France, the Netherlands, and the United Kingdom were the principal importers of Moroccan virtual water.
Morocco’s net virtual water exchange with the European Union revealed a surplus for vegetables (384.74 Mm3), pulses (15.29 Mm3), and fruits (2823.63 Mm3), indicating a net export position for these categories. Conversely, cereals exhibited a substantial net import of virtual water amounting to 55,062.80 Mm3, predominantly driven by wheat imports (52,344.94 Mm3), which accounted for 95% of the category’s total net imports.
Morocco was a net importer of virtual water from 23 out of the 28 EU member states, with the largest net import volumes recorded from France (36,015.305 Mm3) and Germany (4875.027 Mm3). In contrast, Morocco maintained a net export position with five countries, namely the Netherlands (754.295 Mm3), Belgium (48.886 Mm3), Portugal (18.645 Mm3), Malta (0.154 Mm3), and Slovenia (0.095 Mm3).
Virtual water export analysis shows that Morocco exports more virtual water through fruits and vegetables to the European Union countries, particularly water-intensive agricultural products such as citrus fruits, avocados, grapes, watermelons, artichokes, and fresh tomatoes, while importing only a small volume of the virtual water embedded in these agricultural products. Furthermore, the economic return on water has shown that many agricultural products exported to the European Union are not generating significant profit relative to the volume of virtual water consumed in their production. In contrast, this study also revealed that Morocco imports a substantial amount of virtual water in the form of cereals, which allows the country to save a considerable volume of water that would otherwise be required to produce these staple food products domestically. This pattern illustrates a more efficient use of national water resources, in line with comparative advantage, by relying on imports for highly water-demanding crops that are essential to the Moroccan diet. However, despite being a net importer of virtual water and holding a comparative advantage in cereal trade, Morocco continues to export large volumes of fruits and vegetables that are highly water-intensive, which raises concerns in light of the country’s alarming water scarcity situation. The persistence of prolonged droughts and the worsening water stress indicate that maintaining such an export strategy is no longer sustainable under current and projected hydrological conditions.
Based on the above findings, this study, through the analysis of virtual water trade flows, underscores the importance of preserving Morocco’s water resources. It recommends that policymakers revise current agricultural policies by explicitly integrating virtual water trade as a strategic tool to alleviate pressure on already scarce water resources. This entails considering both the water footprint of agricultural commodities and the country’s water availability prior to launching new agricultural programs. Particular attention should be given to maintaining a balanced level of virtual water imports to mitigate the risk of water and food dependency on European Union countries, while avoiding the overexploitation of domestic water resources through the continued cultivation and export of water-intensive crops. In this context, agricultural planning should be grounded in the specific pedoclimatic and hydrological conditions of each region, thereby ensuring that crop selection aligns with regional suitability and resource availability. Additionally, greater support should be directed toward biotechnology and agronomic research to develop crop varieties that are more resilient to both biotic (e.g., pests, diseases) and abiotic (e.g., water scarcity, salinity) stresses.
These efforts should be complemented by broader structural measures, including improving water use efficiency in domestic agriculture, promoting the cultivation of less water-intensive crops, and investing in wastewater reuse and desalination technologies. Furthermore, diversifying cereal import sources beyond traditional partners such as France and Germany could reduce Morocco’s dependence on a limited set of suppliers, thereby enhancing national food security and resilience to external shocks.
