Article

Interannual Variations in Water Budget and Vegetation Coverage Dynamics in Desert Ecosystems of Heihe River Basin

1
School of Natural Resources, Faculty of Geographical Science, Beijing Normal University, Beijing 100875, China
2
State Key Laboratory of Earth Surface Processes and Hazards Risk Governance, Faculty of Geographical Science, Beijing Normal University, Beijing 100875, China
*
Author to whom correspondence should be addressed.
Water 2025, 17(18), 2660; https://doi.org/10.3390/w17182660
Submission received: 10 August 2025 / Revised: 5 September 2025 / Accepted: 6 September 2025 / Published: 9 September 2025
(This article belongs to the Section Ecohydrology)

Abstract

Climate change intensifies the challenges surrounding water cycling and vegetation dynamics in arid desert ecosystems, calling for detailed observations to decode adaptive plant strategies and support restoration efforts. This study analyzes interannual variations in water budgets and vegetation coverage in two distinct desert systems—K. foliatum (midstream) and R. songarica (downstream)—within the Heihe River Basin from 2016 to 2021. We uncover a pronounced ecohydrological contrast: the K. foliatum ecosystem displays substantial soil moisture variability alongside high precipitation and evapotranspiration rates, leading to a soil water deficit. In contrast, the R. songarica ecosystem maintains minimal moisture fluctuation under extreme aridity, yet records a slight water surplus. Notably, vegetation coverage in K. foliatum closely correlates with soil water storage, precipitation, and evapotranspiration, whereas R. songarica exhibits no significant hydrological coupling, implying a pulsed response to episodic rainfall. Groundwater recharge emerges as a key compensatory mechanism against rainfall shortages in midstream regions. These findings underscore the need for region-specific management—prioritizing groundwater conservation downstream and intelligent irrigation regulation midstream—offering a science-backed pathway for restoring and managing water resources in arid inland basins under climate change.

1. Introduction

Desert ecosystems constitute a vital yet vulnerable component of ecological security in arid regions worldwide. Characterized by extreme environmental conditions and delicate ecological balances, these ecosystems exhibit heightened sensitivity to climate change impacts. Key climatic drivers—including rising temperatures, precipitation scarcity, increased drought frequency, and irregular rainfall patterns—collectively contribute to vegetation fragmentation in desert landscapes, ultimately leading to biodiversity loss and ecosystem destabilization [1]. The arid region of northwest China, located in the mid-latitudes of Eurasia, is one of the most climate-sensitive areas globally, with the Heihe River Basin (HRB) serving as a critical case study [2]. Situated in China’s inland arid–semiarid transition zone, the HRB exemplifies the complex challenges facing desert–oasis ecotones where ecological fragility intersects with intensive human water use demands [3,4]. The middle and lower HRB supports characteristic desert shrub communities dominated by Reaumuria songarica (Pall.) Maxim., Tamarix ramosissima Ledeb., Artemisia desertorum Spreng., and Kalidium foliatum (Pall.) Moq. These keystone species form the structural foundation of the basin’s desert–oasis transition zone, where soil–vegetation–water interactions critically regulate regional ecological security and sustainable water management. Notably, the halophytic species Kalidium foliatum (K. foliatum) and Reaumuria soongorica (R. songarica) serve as keystone ecosystem engineers, creating distinctive vegetation mosaics through complex spatial patterning. Their patch distributions exhibit tight coupling with local hydrological processes, ultimately governing critical ecosystem services including windbreak capacity, sand stabilization, and carbon sequestration potential [5,6]. Understanding water partitioning mechanisms among these desert plants and their responses to coupled climatic–hydrological forcing represents a crucial scientific frontier for targeted ecological restoration in arid lands.
In desert ecosystems, water availability constitutes the primary constraint on plant survival and physiological performance. The ecosystem water budget reflects integrated vegetation–soil–climate interactions and broader ecohydrological processes at landscape scales [7,8]. Evapotranspiration (ET) typically dominates the water balance, representing either the largest (in groundwater-dependent systems) or second-largest (in precipitation-driven systems) flux component [9]. Desert vegetation exhibits particular sensitivity to precipitation variability due to evolutionary adaptations to water-limited conditions [10,11]. Precipitation patterns directly control soil moisture dynamics and the central water reservoir linking surface and subsurface hydrological processes in deserts [12,13]. Groundwater plays an outsized role in these ecosystems, frequently accounting for >60% of total plant water uptake and serving as the principal source for both transpiration and soil evaporation fluxes [9]. Research by Jiao et al. [14] employing combined water balance and groundwater fluctuation methods demonstrated how excessive vegetation water use has driven progressive groundwater decline, threatening the persistence of Haloxylon ammodendron forests. These dynamics are further complicated by anthropogenic influences, as agricultural water extraction, surface diversions, and irrigation practices substantially alter natural surface water–groundwater exchange processes [15]. Desert vegetation exhibits sophisticated water use strategies, dynamically exploiting different soil water sources (surface, intermediate, and deep layers) across growth stages [16], with >60% of incident precipitation typically returned to the atmosphere via ET in arid regions [17]. Fractional Vegetation Cover (FVC) quantifies the status of surface vegetation and is frequently used in research on vegetation change, ecology, soil and water conservation, and climate for assessing vegetation conditions and land degradation [18,19]. Compared with other vegetation indices—such as the Normalized Difference Vegetation Index (NDVI), the Ratio Vegetation Index (RVI), and the Enhanced Vegetation Index (EVI)—FVC not only improves analytical accuracy but also effectively reduces uncertainties caused by the spectral characteristics of non-vegetated areas [18,19].
Despite advances in understanding seasonal ecohydrological processes, significant knowledge gaps persist regarding sustained water–vegetation interactions in arid ecosystems, particularly due to the scarcity of continuous, coupled soil–plant–atmosphere observations needed to elucidate climate-driven water redistribution mechanisms. This limitation has constrained our ability to quantify both the spatiotemporal heterogeneity of water budgets across desert ecosystems and the complex feedback between hydrological partitioning and vegetation response—these are critical questions that the middle-lower Heihe River Basin (HRB) is uniquely positioned to address as it exhibits pronounced desertification, groundwater depletion, and vegetation degradation under combined climatic and anthropogenic pressures [20,21].
To address these critical knowledge gaps, our study implements a comprehensive field-based research framework that combines multi-year in situ observations with cutting-edge analytical approaches. From 2016 to 2021, intensive field measurements were conducted at two ecologically representative sites: the K. foliatum-dominated midstream desert and the R. songarica-dominated downstream desert in the Heihe River Basin. Our methodology integrates (1) high-frequency hydrological monitoring using eddy covariance systems for evapotranspiration quantification and multi-depth soil moisture profiling (0–100 cm), (2) vegetation dynamics assessment through fractional vegetation cover (FVC) analysis validated by ground surveys, and (3) water budget modeling adapted for arid ecosystems. This integrated approach enables us to achieve two primary research objectives: first, to quantify interannual variations in ecosystem water budgets and their impacts on vegetation patterns across contrasting desert environments; second, to elucidate the mechanistic responses of key desert shrubs to fluctuating water availability, including their adaptations to groundwater depletion and precipitation variability. Our findings provide novel insights into the ecohydrological functioning of arid ecosystems while identifying critical thresholds in plant–water relations. These results have important practical implications for developing science-based ecological restoration strategies and sustainable water management practices in climate-sensitive drylands facing increasing anthropogenic pressures.

2. Materials and Methods

2.1. Study Location

The Heihe River Basin (HRB) is the second-largest inland river basin, covering approximately 130,000 km2 and spanning from 97°24′ to 101°58′ E and from 37°41′ to 42°42′ N [22]. This expansive basin exhibits a remarkable ecological gradient, transitioning from alpine meadows in its upper reaches to arid desert ecosystems in its middle and lower sections. The HRB’s ecological fragility is particularly pronounced in its desert regions, where sparse vegetation cover and severe desertification prevail due to extreme aridity and anthropogenic pressures [8]. The basin demonstrates pronounced spatial heterogeneity in climatic conditions, soil properties, and vegetation distribution driven by topographic variation. [23]. As shown in Figure 1, deserts are widely distributed in the mid-lower reaches of the HRB, accounting for more than 72% of the total basin area [24]. The first study site features K. foliatum, a salt-tolerant halophyte that forms distinctive vegetation communities in the midstream’s saline–alkali regions. This species plays a crucial ecological role in stabilizing soils and improving saline land productivity through its unique salt-dilution physiology [25,26]. The second study site is dominated by R. songarica, a C3 photosynthetic pathway shrub that represents a keystone species in the hyper-arid downstream deserts. This drought-adapted plant thrives in the basin’s most extreme environments, including piedmont slopes, ancient river terraces, and Gobi desert plains [27]. For a detailed investigation, we established two intensive monitoring stations: (1) the Huazhaizi Station (100.3201° E, 38.7659° N) in the midstream K. foliatum desert and (2) the Huangmo Station (100.9872° E, 42.1135° N) in the downstream R. songarica desert. These sites were selected to represent the basin’s contrasting desert ecosystems, with their distinct vegetation patterns clearly visible in the landscape photographs (Figure 1b–e). Through systematic field quadrat surveys, we characterized the structural differences between these ecosystems, including variations in plant density, canopy architecture, and spatial distribution patterns that reflect their adaptation to different aridity regimes along the basin’s longitudinal gradient (Table 1).

2.2. Description of Datasets

This study integrates high-quality observational datasets from Huazhaizi Station (2016–2019, 2021) and Desert Station (2016, 2018–2021) in the Heihe River Basin, including meteorological and eddy covariance data from the National Tibetan Plateau Data Center (TPDC) [28,29]. For hydrological monitoring, we utilized a TES25MM tipping-bucket rain gauge (Texas Electronics, Dallas, TX, USA) to measure precipitation. The eddy covariance system, consisting of a CSAT3 sonic anemometer (Campbell Scientific, Logan, UT, USA) and LI-7500 open-path CO2/H2O analyzer (LI-COR Biosciences, Lincoln, NE, USA), provided continuous measurements of turbulent fluxes. The raw flux data underwent rigorous post-processing, including coordinate rotation (double rotation method), spectral correction, and WPL correction for density fluctuations. Latent heat flux (LE, W·m−2) was converted to evapotranspiration (ET, mm·d−1) using the latent heat with appropriate unit conversions. Soil moisture dynamics were monitored using ML3 ThetaProbe soil moisture sensors (Delta-T Devices, Cambridge, UK) installed at seven depths (2, 4, 10, 20, 40, 60, and 100 cm) to capture the vertical moisture profile. These probes, with an accuracy of ±0.03 m3·m−3, were calibrated for local soil conditions. Soil water storage (Q) was calculated by integrating volumetric water content across all measured layers using the trapezoidal method, as detailed in Section 2.4 and reference [29]. Air temperature and humidity were measured using a ventilated thermometer and hygrometer (HMP45AC, Vaisala, Vantaa, Finland). Vegetation monitoring incorporated both ground-based and remote sensing approaches. Monthly fractional vegetation cover (FVC) data were extracted from the China Regional 250 m Vegetation Coverage Dataset (2000–2023) [30], which was rigorously validated against synchronous high-resolution (1–5 m) ground measurements using digital photography and visual estimation methods [31]. The complete datasets are publicly available through the TPDC (http://data.tpdc.ac.cn accessed on 11 October 2023). All datasets underwent rigorous quality control procedures to ensure their reliability for investigating hydrological dynamics and ecosystem responses in desert environments.

2.3. Water Balance of the Ecosystem

The ecosystem water balance equation [32] can be defined as follows:
P + G W + I + Δ R = E T + D + Δ Q
where P is precipitation (mm), G is groundwater recharge (mm), I is irrigation (mm), R is the difference between lateral inflow and outflow in the ecosystem (mm), ET is evapotranspiration (mm), D is deep percolation (mm), and ΔQ is the change in soil water storage (mm). In this study, the water budget equation was simplified for desert ecosystems based on their distinct characteristics (e.g., no runoff input or output and soil moisture observed at a depth of 0–100 cm, with D ignored in calculations), resulting in P + GW (I) = ET + ΔQ. Precipitation and other potential water sources (e.g., groundwater recharge in downstream deserts or oasis farmland irrigation in midstream K. foliatum deserts) constitute the primary water inputs of desert ecosystems. Evapotranspiration represents their main water expenditure, while changes in soil water storage reflect the comprehensive result of water budget dynamics.
In the water balance analysis, we utilized a multi-year daily observational dataset while implementing strict screening criteria for years with significant data gaps (e.g., Huazhaizi Station in 2020 and the downstream desert station in 2017). Years with an excessive amount of missing data were systematically excluded from quantitative assessments. For instance, Huazhaizi Station’s 2020 data were omitted due to high missing rates, and, similarly, the 2017 dataset from the downstream desert station was not used for water balance calculations. This selective exclusion ensured reliability—only years meeting data completeness thresholds were included in the analysis, meaning that missing data did not bias our conclusions.

2.4. Estimation of Soil Water Storage and Its Variations

Consistent with established dryland hydrology methods [32], soil water storage (Q, mm) was calculated by multiplying the measured soil volumetric water content of each layer by its representative depth. The specific formula is as follows:
Q = i = 1 n ( θ u i + θ l i ) d i 2
where θ u i and θ l i (m3 m−3) are the soil volumetric water contents at the upper and lower boundaries of the i-th sublayer, respectively (depths: 2 cm, 4 cm, 10 cm, 20 cm, 40 cm, 60 cm, 100 cm); di is the thickness of the soil layer; and n is the number of observed soil layers. The change in soil water content over a specific period is generally the difference between the soil water storage at the end and start times of the period.

2.5. Calculation of Soil Water Balance and Residence Time

Referring to a previous study [32] and based on the assumption that all precipitation-derived water returns to the atmosphere via evapotranspiration, the average residence time (or turnover time) of water in the soil column could be estimated using the following formula:
τ = Q P + G W
where Q (mm) is the average water storage in the soil column over a given period, P (mm·d−1) is the average precipitation during the same period, and GW (mm) represents other water sources (e.g., potential groundwater or artificial irrigation recharge). It was estimated as the residual term of the ecosystem water budget balance (GW = PET − ΔQ). τ provided a means to measure the timescale of the soil–hydrological cycle in the study area.

2.6. Calculation of ET0

The Penman–Monteith formula, as recommended by the Food and Agriculture Organization (FAO), is suggested for estimating potential evapotranspiration (ET0), which can be defined as
E T 0 = 0.408 Δ ( R n G ) + γ 900 T + 273 u 2 ( e s e a ) Δ + γ ( 1 + 0.34 u 2 )
where ET0 is the potential evapotranspiration; Rn is the net radiation (MJ·m−2·d−1); G is the soil heat flux (MJ·m−2·d−1); γ is the psychrometric constant (kPa·°C−1); T is the average air temperature at 2 m above the ground (°C); u2 is the average wind speed at 2 m above the ground (m·s−1); es and ea are the saturation water vapor pressure and the actual water vapor pressure, respectively (kPa·°C−1); and Δ is the slope of the vapor pressure curve (kPa·°C−1).

3. Results

3.1. Variation Characteristics of Soil Water Storage and Precipitation in Desert Ecosystems

As shown in Figure 2, both desert ecosystems exhibit lower water content in shallow soil layers due to intense surface evaporation compared to deeper layers. In the midstream K. foliatum desert, soil moisture is primarily concentrated at a depth of 10–50 cm, displaying clear seasonal and interannual variations. In contrast, the downstream R. songarica desert shows a relatively uniform soil moisture profile with minimal seasonal or interannual fluctuations. On an interannual scale, while vertical soil moisture patterns are somewhat similar between the two deserts, they exhibit distinct interannual dynamics. Using a variance threshold of 2 [33], none of the soil layers (0–100 cm) in the R. songarica desert showed significant interannual variation (all variances < 2). In contrast, the K. foliatum desert showed certain interannual fluctuations, with interannual variances greater than 2 observed in the shallow soil moisture of 0–2 cm, the 2–4 cm layer, and the 20–40 cm layer. The soil moisture content of each layer in the K. foliatum desert (Figure 2a) fluctuated between 2.75% and 21.4%. The soil moisture increased gradually from 0–20 cm, with an increase of approximately 15%, peaking significantly within the 10–20 cm range and then decreasing in the deeper layers below 20 cm. The R. songarica desert (Figure 2c) had lower soil moisture content, with the moisture content of each layer fluctuating between 1.71% and 7.08% during the study period. Figure 2b,d show the dynamic changes in soil volumetric water content at a 0–100 cm depth for the two desert ecosystems. In the K. foliatum desert (Figure 2b), soil moisture in the surface layer (0–60 cm) exhibits strong seasonal fluctuations, whereas the deeper layer (60–100 cm) remains relatively stable, with moisture content increasing with depth (as indicated by the color gradient). In contrast, the R. songarica desert (Figure 2d) shows large variations and low moisture content in the shallow layer (0–20 cm), while the deeper soil (40–100 cm) maintains higher and more stable water content.
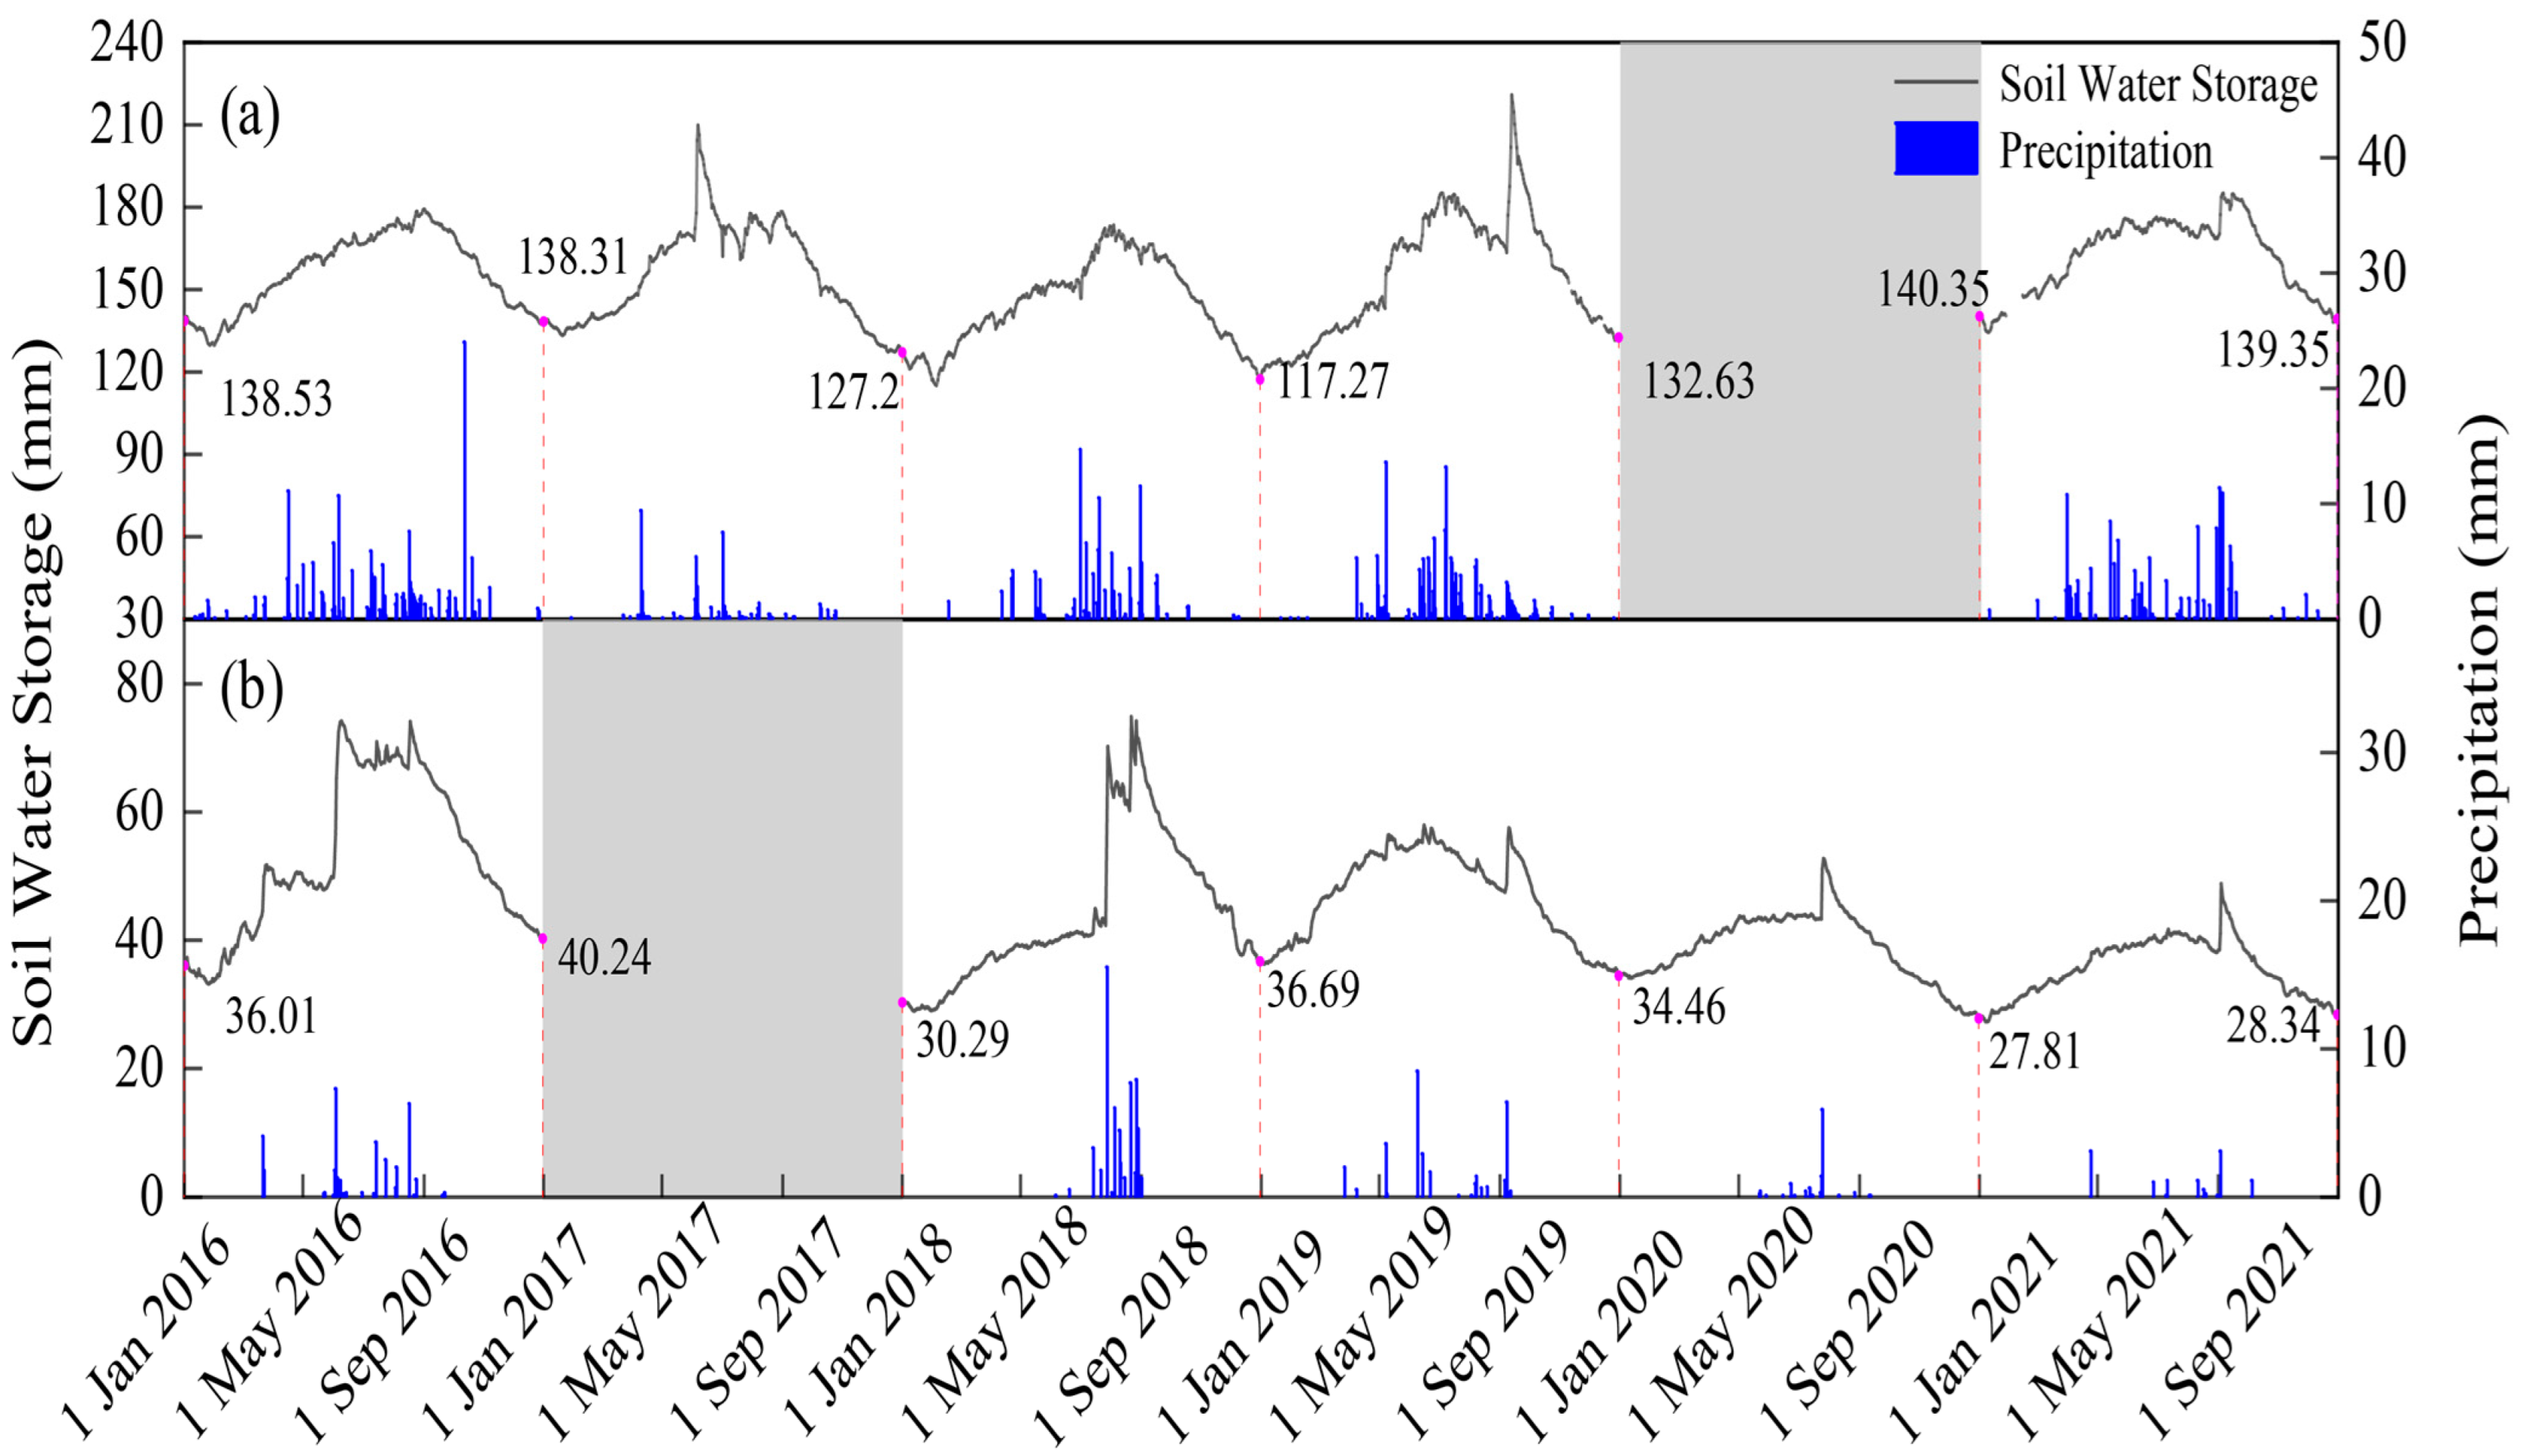
Precipitation, as the primary water source, drives diverse biological processes across spatiotemporal scales in desert ecosystems [34]. These rainfall pulses are critical for triggering physiological and ecological responses in plants, such as water, nutrient, and carbon cycling, and play a crucial driving role in the evolution of desert ecosystem structure and function [35]. Figure 3 illustrates that both deserts exhibited similar annual trends in 0–100 cm daily average soil water storage (Q) and precipitation, characterized by an initial increase followed by a decrease. Peak annual Q values reached 218.14 mm in the K. foliatum desert and 74.78 mm in the R. songarica desert, while year-start and year-end values stabilized at 133.38 ± 8.5 mm and 33.41 ± 4.69 mm, respectively. From January to March, Q rose gradually despite limited precipitation. The period from April to September saw concentrated rainfall and significant Q increases, followed by sharp declines from October onward as precipitation diminished. In the K. foliatum desert, October–December precipitation accounted for only 2.8–9.4% of April–September totals. The R. songarica desert received negligible precipitation during these months, with just 1.1 mm recorded in November 2021.
Desert soil moisture dynamics are closely tied to precipitation events. Moisture peaks typically follow concentrated rainfall, while inter-rainfall periods see declines due to plant uptake and evaporation [36]. For instance, intense precipitation from 3–7 June 2017 (K. foliatum) and 1–8 June 2016 (R. songarica) triggered rapid Q increases from 169.21 mm to 209.87 mm and 49.74 mm to 74.15 mm, respectively. Seasonal shifts in precipitation timing and volume can delay soil water recharge, a critical regulator of dryland vegetation dynamics [37]. Summer combines high precipitation with elevated ET, resulting in pronounced moisture turnover. By September, reduced plant transpiration and evaporative demand, coupled with lagged precipitation effects, often yield peak or near-peak growing-season Q [38].

3.2. Variation Characteristics of Evapotranspiration and Potential Evapotranspiration in Desert Ecosystems

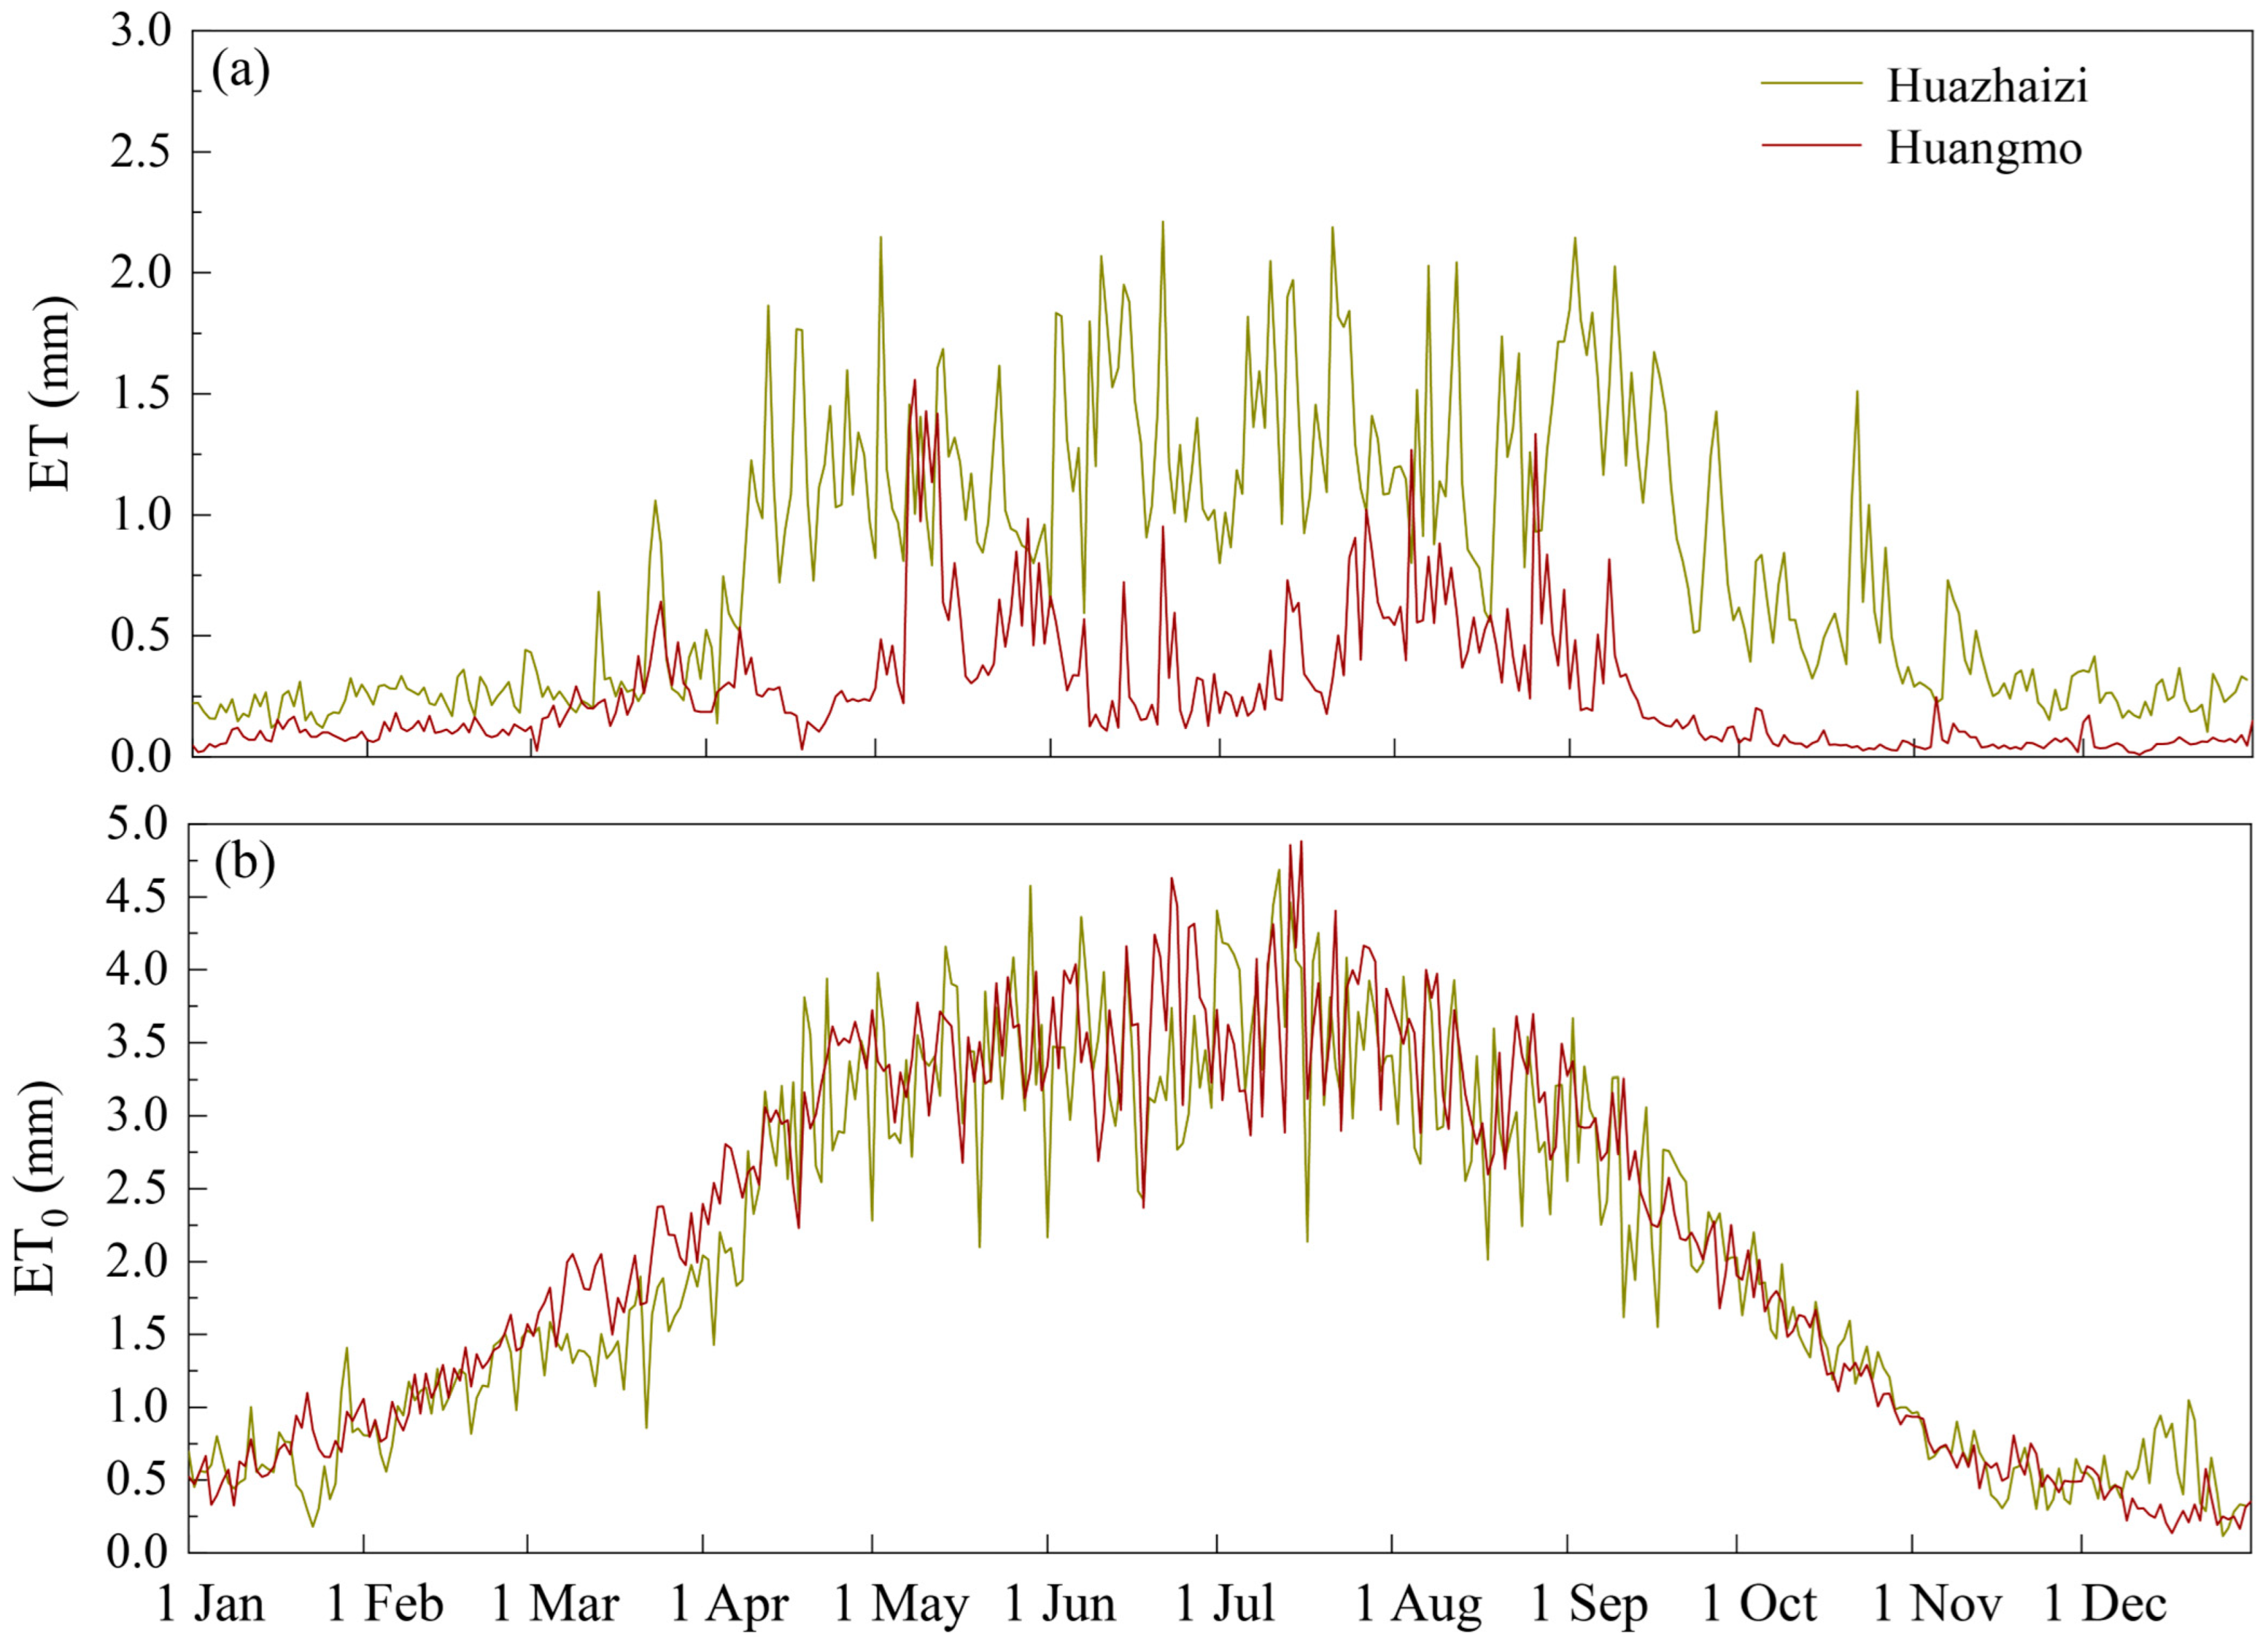
As shown in Figure 4a, ET in desert ecosystems exhibits distinct seasonal patterns. During the growing season (April–October), ET shows high variability with pronounced fluctuations, while remaining relatively stable with minimal variation in the non-growing season (January–March and November–December). Significant differences exist in daily ET dynamics between the K. foliatum and R. songarica deserts, with ET-driven water consumption being substantially higher in the K. foliatum desert. Specifically, the K. foliatum desert recorded its peak ET value (2.21 mm) on 21 June and its lowest (0.12 mm) on 24 January during the study period. In contrast, the R. songarica desert reached its maximum ET (1.56 mm) on 8 May and its minimum (0.02 mm) on 2 January.
As shown in Figure 4b, ET0 in desert ecosystems exhibits distinct seasonal patterns, which are similar to ET but differ in fluctuation amplitude. During the growing season, ET0 shows high variability with pronounced fluctuations, while remaining relatively stable with minimal variation in the non-growing season. Significant differences exist in daily ET0 dynamics between the K. foliatum and R. songarica deserts. Specifically, the K. foliatum desert recorded its peak ET0 value (4.69 mm) on 12 July and its lowest (0.11 mm) on 26 December. In contrast, the R. songarica desert reached its maximum ET0 (4.88 mm) on July 16 and its minimum (0.14 mm) on 17 December.

3.3. Monthly Variations in Water Budget Components in Desert Ecosystems

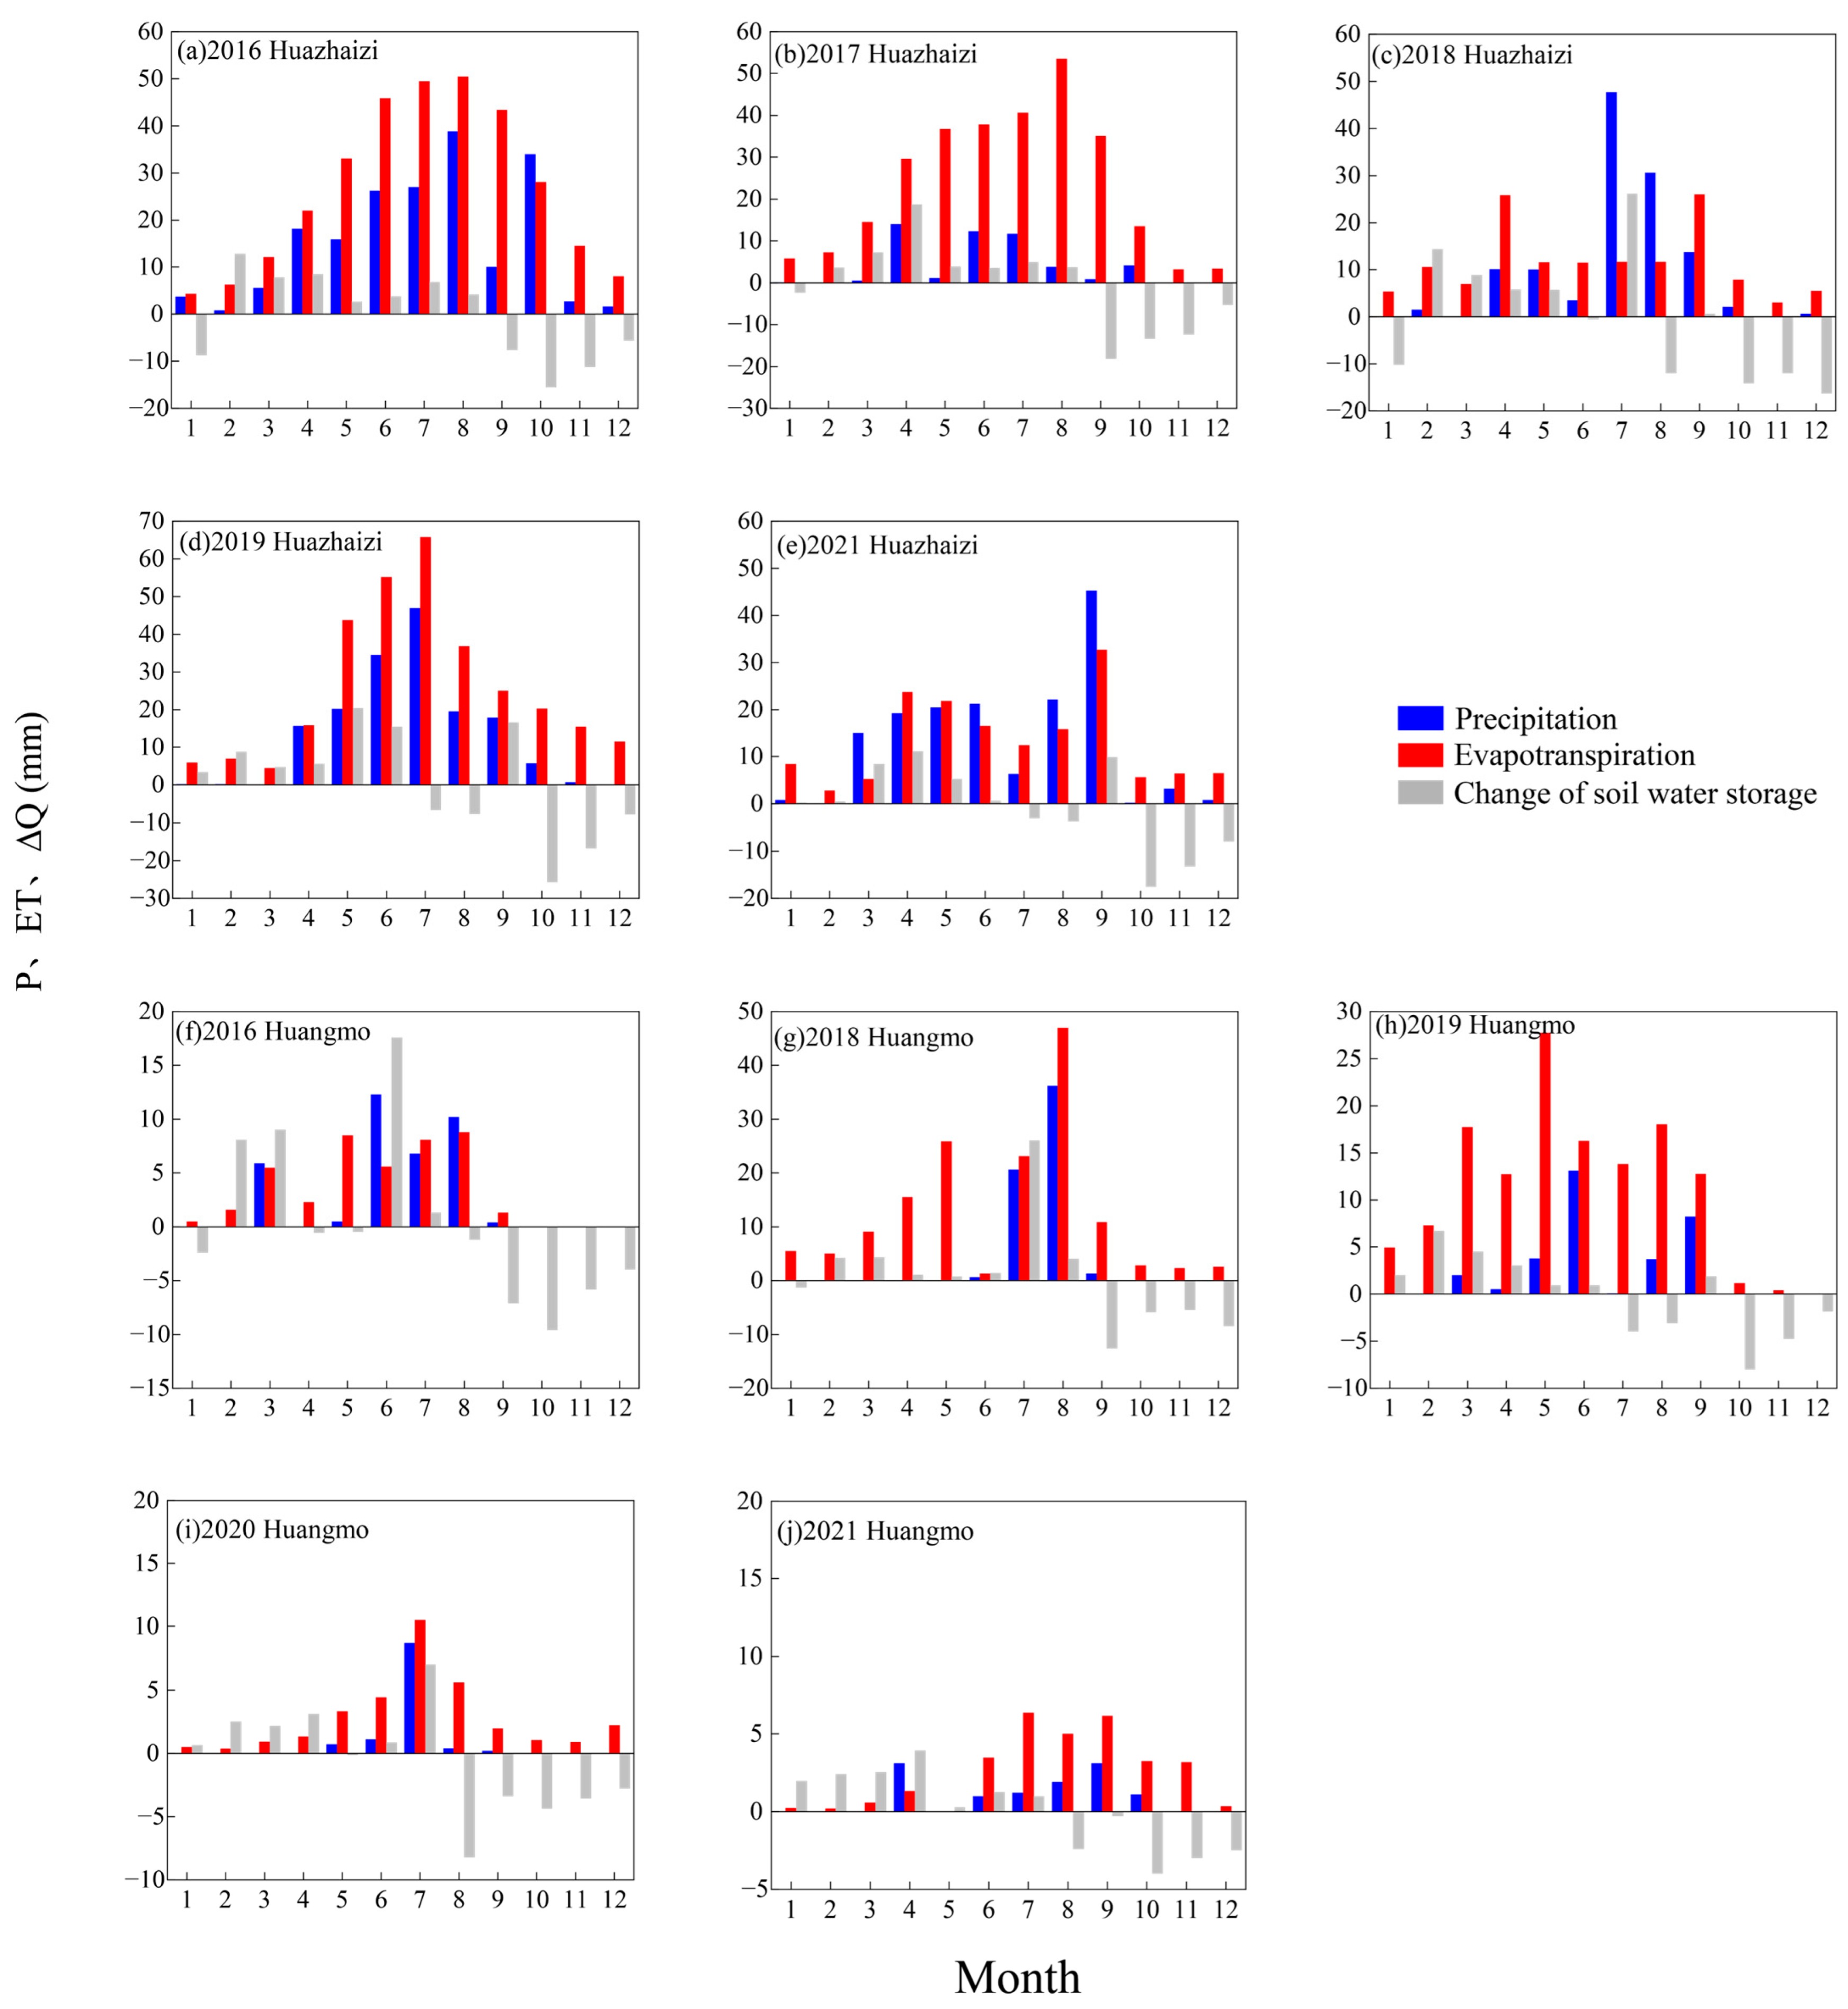
Figure 5 presents the monthly variations in water budget components for the two desert ecosystems. Both systems exhibit an overall water deficit, though with distinct hydrological characteristics. In the K. foliatum desert, the annual averages for precipitation, ET, and changes in soil water storage (ΔQ) were 133.7 mm, 240.05 mm, and −1.67 mm, respectively (Table 2). ET intensified from May to September, peaking at 65.79 mm in July 2019, coinciding with the year’s highest monthly precipitation (46.9 mm). During this period, soil water storage replenished ET-driven losses, but ΔQ turned negative starting in September as moisture reserves depleted. Conversely, the R. songarica desert showed markedly smaller interannual fluctuations in precipitation, ET, and ΔQ (Figure 5f–j), with annual averages of 29.7 mm, 77.74 mm, and 0.47 mm, respectively (Table 2). Between 2016 and 2021, precipitation and ET ratios (K. foliatum/R. songarica) ranged from 2.04 to 13.54 and 0.91 to 7.55, highlighting significantly higher water fluxes in the Kalidium foliatum desert. The R. songarica desert sustained prolonged soil water deficits (August–December), attributable to low precipitation and high ET rates that rapidly exhausted moisture. In contrast, the Kalidium foliatum desert’s greater precipitation and ET capacity shortened its deficit period, better meeting ecosystem water demands.
The residence time of soil water in the K. foliatum desert ranges from 75 to 163 days, with an average of 105 days. This indicates that the soil water in this ecosystem has strong seasonal variations, accumulating during the rainy season and gradually depleting during the dry season. In the R. songarica desert, the residence time of soil water ranges from 38 to 154 days, with an average of 102 days. Compared with the K. foliatum desert, the R. songarica desert has a shorter soil water residence time, reflecting more agile changes in soil water and a closer coupling with environmental conditions. In general, the two different types of desert ecosystems exhibit distinct differences in soil water residence time, which reflects their different adaptation mechanisms in coping with arid environments.

3.4. Response Characteristics of Vegetation Coverage to Water Budget Variations in K. foliatum and R. songarica Deserts of the Middle and Lower Heihe River Basin

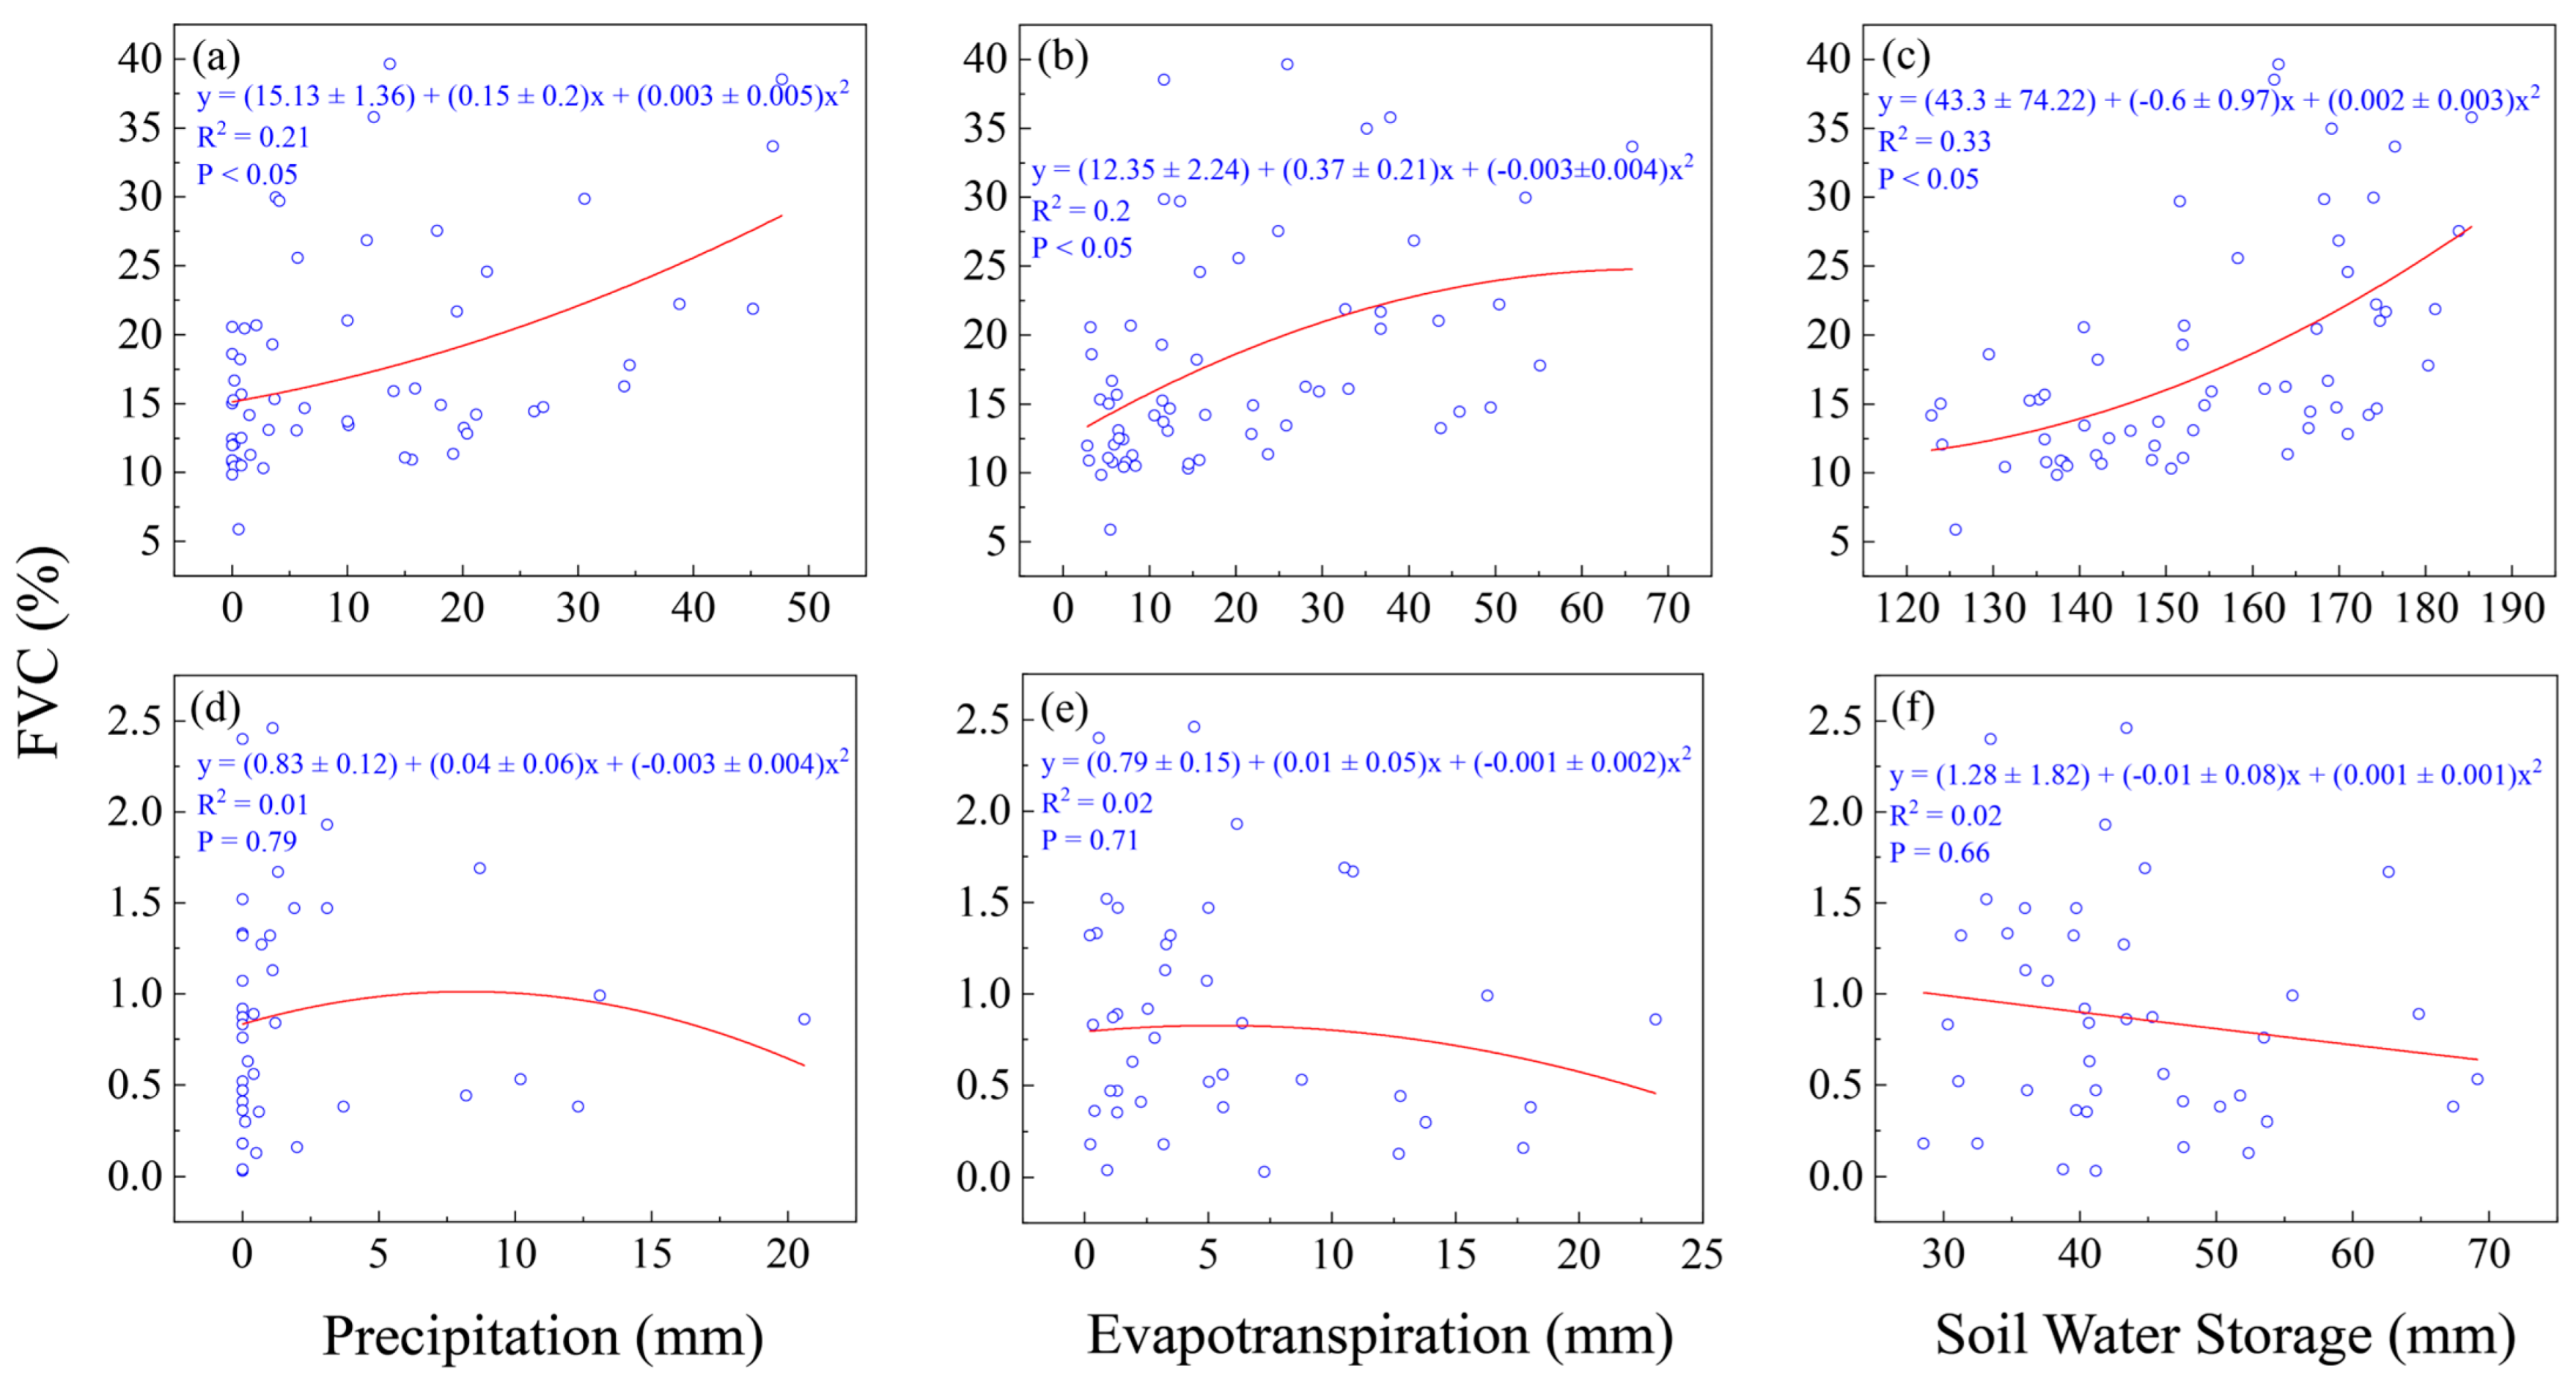
Figure 6 reveals differences in the response mechanisms between monthly-scale vegetation coverage and water budget components. Based on observational data from the two desert ecosystems during 2016–2021, this study found that in the relatively water-rich K. foliatum desert area, monthly vegetation coverage exhibited a significant non-linear response to concurrent hydrothermal factors. Specifically, soil water storage (R2 = 0.33, p < 0.01), precipitation (R2 = 0.21, p < 0.05), and evapotranspiration (R2 = 0.20, p < 0.05) explained 33%, 21%, and 20% of the variation in vegetation coverage, respectively, indicating that soil water storage plays a dominant regulatory role in vegetation growth. In contrast, in the extremely arid R. songarica desert area, no significant correlation was observed between any hydrological factors and vegetation coverage (p > 0.05), suggesting that the vegetation pattern in this region may be more controlled by the stochastic influence of sporadic precipitation events. This contrast highlights that in water-constrained desert ecosystems, traditional monthly-scale hydrological process models are insufficient to fully explain vegetation dynamics. There is an urgent need to develop multi-scale coupling models that integrate millimeter-scale precipitation events, evapotranspiration stress, and soil water transport to deepen the understanding of eco-hydrological response mechanisms in extreme arid regions.

4. Discussion

4.1. Soil Water Cycle and Water Budget Characteristics of Desert Ecosystems

Soil moisture serves as a vital nexus in terrestrial water cycles, linking precipitation, surface water, groundwater, and vegetation water use [39]. Our multi-year (2016–2021) water balance analysis reveals pronounced ecohydrological divergence between the two desert ecosystems, driven primarily by steep precipitation gradients and contrasting anthropogenic influences. Consistent with findings across arid regions [40], precipitation exhibited a strong positive correlation with both soil water storage (Q) and soil water content (SWC), though this relationship was strongly mediated by local soil characteristics and external water inputs. The hyper-arid downstream R. songarica desert (annual precipitation: 11.4–36.1 mm) demonstrated minimal soil water replenishment and persistently low-profile moisture, except during infrequent rain events (Figure 2). In contrast, the midstream K. foliatum desert (48.4–184.4 mm yr−1) sustained higher moisture levels, particularly within the 10–50 cm layer, with pronounced interannual variability in shallow soils, a pattern also reported by Ren et al. [41] in similar arid settings and partly attributable to finer soil texture and higher organic matter facilitating moisture retention.
Groundwater played a critical role in moderating water limitation, especially in the lower reaches, where groundwater depth variations significantly influenced plant transpiration and soil moisture persistence [42]. Estimated soil water residence times ranged from 52 to 163 days (mean: 105 days) in the K. foliatum desert and 38 to 154 days (mean: 102 days) in the R. songarica desert. These estimates, derived from multi-year water storage and flux data, reflect integrated soil water cycling dynamics and align with known plant water-use strategies. Previous studies indicate that shrubs in the middle reaches shift between soil moisture and groundwater sources depending on seasonal availability [43], while riparian plants in the lower reaches rely predominantly on groundwater and deep soil water [44], a pattern consistent with the longer residence times and lower ET observed in our R. songarica site.
Both ecosystems experienced persistent water deficits (ET > P), with deficits averaging 106.35 mm yr−1 (K. foliatum) and 48.04 mm yr−1 (R. songarica). The midstream site received substantial external water inputs (mean: 104.72 mm yr−1), with high interannual variability (2.37–222.39 mm), reflecting contributions from adjacent farmland irrigation and oasis water vapor diffusion, key anthropogenic factors not fully quantified but evident in the residual flux term. Conversely, the downstream site showed smaller but non-negligible external inputs (mean: 48.13 mm yr−1), primarily from groundwater capillary rise, highlighting its reliance on non-precipitation water sources in an otherwise precipitation-limited environment. This refined water balance approach—incorporating high-resolution (10-min) soil moisture monitoring and residual flux analysis—allowed for the indirect capture of unmeasured processes (e.g., capillary rise, deep drainage) and yielded monthly and annual closure errors below 5%, enhancing confidence in flux estimates. Nevertheless, uncertainties remain due to single-site representation per ecosystem and unmeasured lateral or capillary fluxes. Future studies should integrate direct measurements (e.g., lysimeters, isotopic tracers) and expanded spatial monitoring to better resolve these processes and improve generalizability across desert landscapes.

4.2. Divergent Vegetation–Water Coupling Mechanisms and Their Drivers

This study reveals fundamentally divergent vegetation–water coupling mechanisms between the two desert ecosystems, driven by species-specific physiological adaptations and contrasting hydrological constraints (Figure 6 and Figure 7). These patterns are clearly reflected in the community structures derived from transect surveys in Table 1. The R. songarica desert in the hyper-arid lower reaches exhibits a “low-density-large-size” strategy (0.1 ± 0.0 patches m−2; mean patch area: 0.2 ± 0.1 m2; height: 23.1 ± 5.5 cm; volume: 20042.66 cm3), which aligns with its significantly deeper and more stable soil moisture profile (Figure 2d). This suggests adaptations to extreme drought through deep rooting systems and water storage capacities, with sparse distribution minimizing water competition. Conversely, the mid-reach K. foliatum desert displays a “high-density-small-size” pattern (1.0 ± 0.5 patches m−2; mean patch area: 0.07 ± 0.01 m2; height: 13.4 ± 1.4 cm; volume: 3624.85 cm3), corresponding to its high sensitivity to shallow soil moisture dynamics (Figure 2b). This indicates rapid life-cycle completion and efficient resource use under seasonal drought, where clustered growth may enhance wind and sand resistance. These adaptive strategies, further evidenced by isotope tracing techniques [45], are consistent with the distinct hydrological regimes observed in this study.
These structural differences underpin distinct ecohydrological response mechanisms. The strong monthly-scale correlations between vegetation coverage and soil water storage (R2 = 0.33, p < 0.01), precipitation (R2 = 0.21, p < 0.05), and ET (R2 = 0.20, p < 0.05) in the K. foliatum desert affirm its dependence on recent hydrological inputs. This is mechanistically explained by its shallow root system that rapidly captures pulse water events, consistent with its high patch density strategy [46]. In contrast, the absence of significant monthly hydrological correlations in the R. songarica desert, despite its larger plant size, reflects its reliance on deeper, more stable water sources beyond the scope of monthly monitoring. Our soil moisture data (Figure 2d) show minimal variation in deeper layers (40–100 cm), supporting the hypothesis that this species depends on deep groundwater access rather than superficial rainfall inputs. This apparent paradox is resolved when considering the pulsed nature of ecohydrological processes in hyper-arid environments [47], where vegetation responds to infrequent, high-intensity rainfall events at sub-weekly timescales that are obscured by monthly aggregation. Atmospheric controls further differentiate species strategies [48]. Vapor pressure deficit (VPD) emerged as the dominant constraint on vegetation coverage in both ecosystems (explaining 45% of variability, p < 0.01), while net radiation (R2 = 0.02) and wind speed (R2 = 0.04) showed minimal influence. This underscores atmospheric drought as the primary growth limiter in hyper-arid zones, suggesting that both species employ conservative water-use strategies under high VPD but through different mechanisms: K. foliatum relies on shallow soil moisture and frequent irrigation subsidies, while R. songarica depends on deep groundwater access and physiological traits such as lower osmotic potential or enhanced hydraulic safety [45], as evidenced by its stable vegetation coverage despite extremely low precipitation.
These findings significantly advance our understanding of vegetation–hydrology interactions by quantifying how co-occurring desert species diverge in their water use under the same regional climate, thereby moving beyond earlier broad-scale approaches. Crucially, our research demonstrates that groundwater and human-derived water inputs—not just precipitation—are vital in sustaining vegetation beyond its expected arid limits, while also revealing that monthly-scale monitoring is insufficient for capturing the rapid, pulsed ecohydrological responses characteristic of hyper-arid environments. The absence of high-frequency data remains a constraint, particularly in resolving transient physiological responses in species such as R. songarica. Future efforts should therefore integrate daily-scale remote sensing such as automated canopy photography, minute-resolution precipitation sensors, and in situ physiological measurements—including sap flow and water potential—to fully unravel these underlying mechanisms. Such integrated approaches are essential for building critical theoretical frameworks to guide effective desert vegetation restoration and management amidst changing climatic conditions.

5. Conclusions

This study systematically analyzed the interannual ecohydrological dynamics in two contrasting desert ecosystems within the Heihe River Basin from 2016 to 2021, revealing fundamentally divergent water–vegetation coupling mechanisms driven by precipitation gradients and species-specific adaptations. The midstream K. foliatum desert, characterized by higher precipitation (133.7 mm yr−1) and evapotranspiration (240.05 mm yr−1), exhibited strong nonlinear relationships between vegetation coverage and soil water storage (R2 = 0.33), indicating its dependence on recent hydrological inputs and anthropogenic irrigation subsidies. In contrast, the hyper-arid downstream R. songarica desert (29.7 mm yr−1 precipitation) sustained minimal vegetation cover (2%) through pulsed responses to infrequent rainfall events, a key mechanism obscured by conventional monthly monitoring but critical for understanding arid ecosystem resilience. Groundwater emerged as a vital buffer against precipitation deficits, particularly in the downstream region, where deeper root systems and physiological adaptations enable water conservation. These findings not only quantify species-specific water-use strategies under shared climatic conditions but also highlight the limitations of monthly-scale approaches in capturing rapid ecohydrological pulses. This study provides a scientific basis for differentiated water management: optimizing irrigation practices in midstream oasis–desert ecotones while implementing groundwater conservation measures downstream to support drought-tolerant species. These insights advance desert ecohydrology by integrating high-resolution field observations with vegetation response analysis, offering both theoretical and practical frameworks for sustaining fragile dryland ecosystems under changing climate conditions.

Author Contributions

J.L.: Investigation, Data curation, Software, Visualization, Writing—original draft preparation. W.C.: Investigation, Reviewing and editing. Y.Y.: Reviewing and editing. S.L.: Reviewing and editing. P.W.: Conceptualization, Methodology, Supervision, Funding acquisition, Reviewing and editing. All authors have read and agreed to the published version of the manuscript.

Funding

This study was financially supported by the Joint Fund Project of the National Natural Science Foundation of China (U21A2001).

Data Availability Statement

Data will be made available upon request.

Conflicts of Interest

The authors declare no conflicts of interest.

References

  1. Li, C.Y.; He, M.Z.; Tang, L. Advances on Phosphorus Cycle and Their Driving Mechanisms in Desert Ecosystems: A Review. Acta Ecol. Sin. 2022, 42, 5115–5124. [Google Scholar] [CrossRef]
  2. Chen, Y.; Li, Z.; Fan, Y.; Wang, H.; Deng, H. Progress and prospects of climate change impacts on hydrology in the arid region of northwest China. Environ. Res. 2015, 139, 11–19. [Google Scholar] [CrossRef] [PubMed]
  3. Liao, J.; Yang, X.; Ye, Q.; Wan, K.; Sheng, J.; Zhang, S.; Song, X. Assessing Spatial–Temporal Characteristics of Land Desertification from 1990 to 2020 in the Heihe River Basin Using Landsat Series Imagery. Sustainability 2024, 16, 6556. [Google Scholar] [CrossRef]
  4. Zhang, Z.; Huisingh, D. Combating desertification in China: Monitoring, control, management and revegetation. J. Clean. Prod. 2018, 182, 765–775. [Google Scholar] [CrossRef]
  5. Meng, J.J.; Wang, X.D.; Zhou, Z. Integrated Landscape Pattern Optimization in Arid Region: A Case Study of Middle Reaches of Heihe River. Acta Sci. Nat. Univ. Pekin. 2017, 53, 451–461. [Google Scholar]
  6. Chen, Y.; Chen, Y.; Zhu, C.; Li, W. The Concept and Mode of Ecosystem Sustainable Management in Arid Desert Areas of Northwest China. Acta Ecol. Sin. 2019, 39, 7410–7417. [Google Scholar] [CrossRef]
  7. Silvertown, J.; Araya, Y.; Gowing, D. Hydrological niches in terrestrial plant communities: A review. J. Ecol. 2015, 103, 93–108. [Google Scholar] [CrossRef]
  8. Wang, X.; Fan, H.; Chen, X.; Xie, Y.; Wang, H. Holistic evolution of ecosystem in Heihe River Basin from the perspective of eigen microstates. Ecol. Indic. 2024, 159, 111689. [Google Scholar] [CrossRef]
  9. Zhao, W.; Liu, B.; Chang, X.; Yang, Q.; Yang, Y.; Liu, Z.; Cleverly, J.; Eamus, D. Evapotranspiration Partitioning, Stomatal Conductance, and Components of the Water Balance: A Special Case of a Desert Ecosystem in China. J. Hydrol. 2016, 538, 374–386. [Google Scholar] [CrossRef]
  10. Xiao, Y.; Bao, F.; Xu, X.; Yu, K.; Wu, B.; Gao, Y.; Zhang, J. The Influence of Precipitation Timing and Amount on Soil Microbial Community in a Temperate Desert Ecosystem. Front. Microbiol. 2023, 14, 1249036. [Google Scholar] [CrossRef]
  11. Maestre, F.T.; Eldridge, D.J.; Soliveres, S.; Kéfi, S.; Delgado-Baquerizo, M.; Bowker, M.A.; García-Palacios, P.; Gaitán, J.; Gallardo, A.; Lázaro, R.; et al. Structure and Functioning of Dryland Ecosystems in a Changing World. Annu. Rev. Ecol. Evol. Syst. 2016, 47, 215–237. [Google Scholar] [CrossRef] [PubMed]
  12. Celentano, D.; Rousseau, G.X.; Engel, V.L.; Zelayán, M.; Oliveira, E.C.; Araujo, A.C.M.; Moura, E.G.d. Degradation of Riparian Forest Affects Soil Properties and Ecosystem Services Provision in Eastern Amazon of Brazil. Land Degrad. Dev. 2017, 28, 482–493. [Google Scholar] [CrossRef]
  13. Wang, J.; Liu, W.; Peng, J.; Niu, J.; Yang, L. Distribution of Desert Riparian Forest Soil Water and Shallow Groundwater in Upstream Basin of Tarim River. Southwest China J. Agric. Sci. 2017, 30, 2071–2077. [Google Scholar]
  14. Ping, J.; Shunjun, H. Estimation of Evapotranspiration in the Desert–Oasis Transition Zone Using the Water Balance Method and Groundwater Level Fluctuation Method—Taking the Haloxylon ammodendron Forest at the Edge of the Gurbantunggut Desert as an Example. Water 2023, 15, 1210. [Google Scholar]
  15. Tian, Y.; Zheng, Y.; Wu, B.; Wu, X.; Liu, J.; Zheng, C. Modeling surface water-groundwater interaction in arid and semi-arid regions with intensive agriculture. Environ. Model. Softw. 2015, 63, 170–184. [Google Scholar] [CrossRef]
  16. Shuai, H.; Fadong, L. Water Sources for Typical Desert Vegetation in the Ebinur Lake Basin. J. Geogr. Sci. 2022, 32, 1103–1118. [Google Scholar] [CrossRef]
  17. Shuai, Y.; Tian, Y.; Shao, C.; Huang, J.; Gu, L.; Zhang, Q.; Zhao, R. Potential Variation of Evapotranspiration Induced by Typical Vegetation Changes in Northwest China. Land 2022, 11, 808. [Google Scholar] [CrossRef]
  18. Liu, C.; Zhang, X.; Wang, T.; Chen, G.; Zhu, K.; Wang, Q.; Wang, J. Detection of vegetation coverage changes in the Yellow River Basin from 2003 to 2020. Ecol. Indic. 2022, 138, 108818. [Google Scholar] [CrossRef]
  19. Zhang, M.; Wang, J.; Li, S. Tempo-spatial changes and main anthropogenic influence factors of vegetation fractional coverage in a large-scale opencast coal mine area from 1992 to 2015. J. Clean. Prod. 2019, 232, 940–952. [Google Scholar] [CrossRef]
  20. Li, F.; Zhao, W.Z. Changes in Normalized Difference Vegetation Index of Deserts and Dunes with Precipitation in the Middle Heihe River Basin. Chin. J. Plant Ecol. 2016, 40, 1245–1256. [Google Scholar]
  21. Lu, Y.; Quan, J.; Zhan, Y.; Teng, Y.; Zhen, W.; He, Z. Characteristics of Vegetation Diversity and Effects of Water in the Desert-Oasis Region in the Middle Reaches of Heihe River Basin. J. Northwest For. Univ. 2021, 36, 22–30. [Google Scholar]
  22. Wang, T.; Wang, X.; Zhang, Q.; Zhang, S.; Tan, J.; Zhang, Y.; Ren, Z.; Yang, Y.; Che, T. Effects of extreme temperature events on carbon fluxes in different ecosystems in the Heihe River Basin, China. Agric. For. Meteorol. 2025, 362, 110380. [Google Scholar] [CrossRef]
  23. Li, X.; Lu, L.; Cheng, G.; Xiao, H. Quantifying Landscape Structure of the Heihe River Basin, North-West China Using FRAGSTATS. J. Arid. Environ. 2001, 48, 521–535. [Google Scholar] [CrossRef]
  24. Li, W.; Li, X.; Huang, Y.; Wang, P.; Zhang, C. Spatial Patch Structure and Adaptive Strategy for Desert Shrub of Reaumuria soongorica in Arid Ecosystem of the Heihe River Basin. J. Geogr. Sci. 2019, 29, 1507–1525. [Google Scholar] [CrossRef]
  25. Liang, X.H. Species Identification and Phylogeography of Six Species in Kalidium. Master’s Thesis, Lanzhou University, Lanzhou, China, 2018. [Google Scholar]
  26. Jiang, H.; Tian, C.Y. Drought Tolerance During Seed Germination and Young Seedling Period of Kalidium foliatum Under Different Temperatures. Pratacult. Sci. 2023, 40, 674–679. [Google Scholar]
  27. Casati, P.; Campi, M.; Morrow, D.J.; Fernandes, J.; Walbot, V. Transcriptomic, Proteomic and Metabolomic Analysis of Maize Responses to UV-B: Comparison of Greenhouse and Field Growth Conditions. Plant Signal. Behav. 2011, 6, 1146–1153. [Google Scholar] [CrossRef]
  28. Liu, S.; Li, X.; Xu, Z.; Che, T.; Xiao, Q.; Ma, M.; Liu, Q.; Rui, J.; Guo, J.; Wang, L.; et al. The Heihe Integrated Observatory Network: A Basin-Scale Land Surface Processes Observatory in China. Vadose Zone J. 2018, 17, 1–21. [Google Scholar] [CrossRef]
  29. Liu, S.; Xu, Z.; Che, T.; Li, X.; Xu, T.; Ren, Z.; Zhang, Y.; Tan, J.; Song, L.; Zhou, J.; et al. A Dataset of Energy, Water Vapor, and Carbon Exchange Observations in Oasis–Desert Areas from 2012 to 2021 in a Typical Endorheic Basin. Earth Syst. Sci. Data 2023, 15, 4959–4981. [Google Scholar] [CrossRef]
  30. Gao, J.; Shi, Y.; Zhang, H.; Chen, X.; Zhang, W.; Shen, W.; Xiao, T.; Zhang, Y. China Regional 250 m Fractional Vegetation Cover Data Set (2000–2023); National Tibetan Plateau/Third Pole Environment Data Center: Beijing, China, 2022. [Google Scholar]
  31. Li, W. Eco-hydrological characteristics and ecological adaptation of Reaumuria soongorica along middle and lower reaches of Heihe River Basin. Ph.D. Dissertation, Beijing Normal University, Bejing, China, 2016. [Google Scholar]
  32. Yamanaka, T.; Kaihotsu, I.; Oyunbaatar, D.; Ganbold, T. Summertime Soil Hydrological Cycle and Surface Energy Balance on the Mongolian Steppe. J. Arid. Environ. 2007, 69, 65–79. [Google Scholar] [CrossRef]
  33. Wang, Z.Q.; Liu, B.Y.; Zhang, Y. Effects of Different Vegetation Types on Soil Moisture in Deep Loess Soil Profiles. Acta Geogr. Sin. 2008, 63, 703–713. [Google Scholar]
  34. Ehleringer, J.R.; Schwinning, S.; Gebauer, R. Water use in arid land ecosystems. In Physiological Plant Ecology; Springer: Berlin/Heidelberg, Germany, 2000. [Google Scholar]
  35. Niu, F.; Chen, J.; Xiong, P.; Wang, Z.; Zhang, H.; Xu, B. Responses of soil respiration to rainfall pulses in a natural grassland community on the semi-arid Loess Plateau of China. Catena 2019, 178, 199–208. [Google Scholar] [CrossRef]
  36. Liu, B.; Zhao, W.; Chang, X.; Li, S. Response of Soil Moisture to Rainfall Pulse in Desert Region of the Heihe River Basin. J. Desert Res. 2011, 31, 716–722. [Google Scholar]
  37. McKellar, T.T.; Crimmins, M.A. Seasonal precipitation variability controls shallow soil water drought events across the southwestern United States. Agric. For. Meteorol. 2025, 363, 110403. [Google Scholar] [CrossRef]
  38. He, X.; Tian, L.; Wang, H.; Jin, Y.; Li, Y. Temporal-Spatial Variation of Soil Moisture Content of Different Hippophae rhamnoides Communities in an Alpine Desert. Bull. Soil Water Conserv. 2023, 43, 23–33. [Google Scholar]
  39. Bai, X.; Zhang, L.; He, C.; Zhu, Y. Estimating Regional Soil Moisture Distribution Based on NDVI and Land Surface Temperature Time Series Data in the Upstream of the Heihe River Watershed, Northwest China. Remote Sens. 2020, 12, 2414. [Google Scholar] [CrossRef]
  40. Chen, J.; Chen, Y.; Wang, K.; Wang, G.; Wu, J.; Zhang, Y. Differences in soil water storage, consumption, and use efficiency of typical vegetation types and their responses to precipitation in the Loess Plateau, China. Sci. Total Environ. 2023, 869, 161710. [Google Scholar] [CrossRef] [PubMed]
  41. Ren, Y.; Bai, J.; Wang, Y.; Liu, X.; Xu, S.; Liu, H.; Zhu, Z.; Gao, T.; Pang, W.; Han, H.; et al. Soil Moisture in Typical Underlying Surfaces of the Heihe River Basin. Pratacultural Sci. 2022, 39, 2475–2491. [Google Scholar]
  42. Sun, H.; Wang, P.; Chen, Q.; Zhang, D.; Xing, Y. Coupling the water use of Populus euphratica and Tamarix ramosissima and evapotranspiration partitioning in a desert riparian forest ecosystem. Agric. For. Meteorol. 2022, 323, 109064. [Google Scholar] [CrossRef]
  43. Zhao, L.; Xie, C.; Liu, X.; Wang, N.; Yu, Z.; Dong, X.; Wang, L. Water sources of major plant species along a strong climatic gradient in the inland Heihe River Basin. Plant Soil 2020, 455, 439–466. [Google Scholar] [CrossRef]
  44. Wang, P.; Yu, J.; Min, L.; Xu, Y.; Zhu, B.; Zhang, Y.; Du, C. Shallow Groundwater Regime and Its Driving Forces in the Ejina Oasis. Quat. Sci. 2014, 34, 982–993. [Google Scholar]
  45. Zhang, C.; Li, X.; Wu, H.; Wang, P.; Wang, Y.; Wu, X.; Li, W.; Huang, Y. Differences in water-use strategies along an aridity gradient between two coexisting desert shrubs (Reaumuria soongorica and Nitraria sphaerocarpa): Isotopic approaches with physiological evidence. Plant Soil 2017, 419, 169–187. [Google Scholar] [CrossRef]
  46. Zhang, C.; Li, X.; Wang, Y.; Wu, H.; Wang, P.; Li, W.; Bai, Y.; Li, E.; Wang, S. Responses of two desert shrubs to simulated rainfall pulses in an arid environment, northwestern China. Plant Soil 2019, 435, 239–255. [Google Scholar] [CrossRef]
  47. Wang, Y.; Li, X.; Zhang, C.; Wu, X.; Du, E.; Wu, H.; Yang, X.; Wang, P.; Bai, Y.; Wu, Y.; et al. Responses of soil respiration to rainfall addition in a desert ecosystem: Linking physiological activities and rainfall pattern. Sci. Total Environ. 2019, 650, 3007–3016. [Google Scholar] [CrossRef] [PubMed]
  48. Yuan, W.; Zheng, Y.; Piao, S.; Ciais, P.; Lombardozzi, D.; Wang, Y.; Ryu, Y.; Chen, G.; Dong, W.; Hu, Z.; et al. Increased atmospheric vapor pressure deficit reduces global vegetation growth. Sci. Adv. 2019, 5, eaax1396. [Google Scholar] [CrossRef] [PubMed]
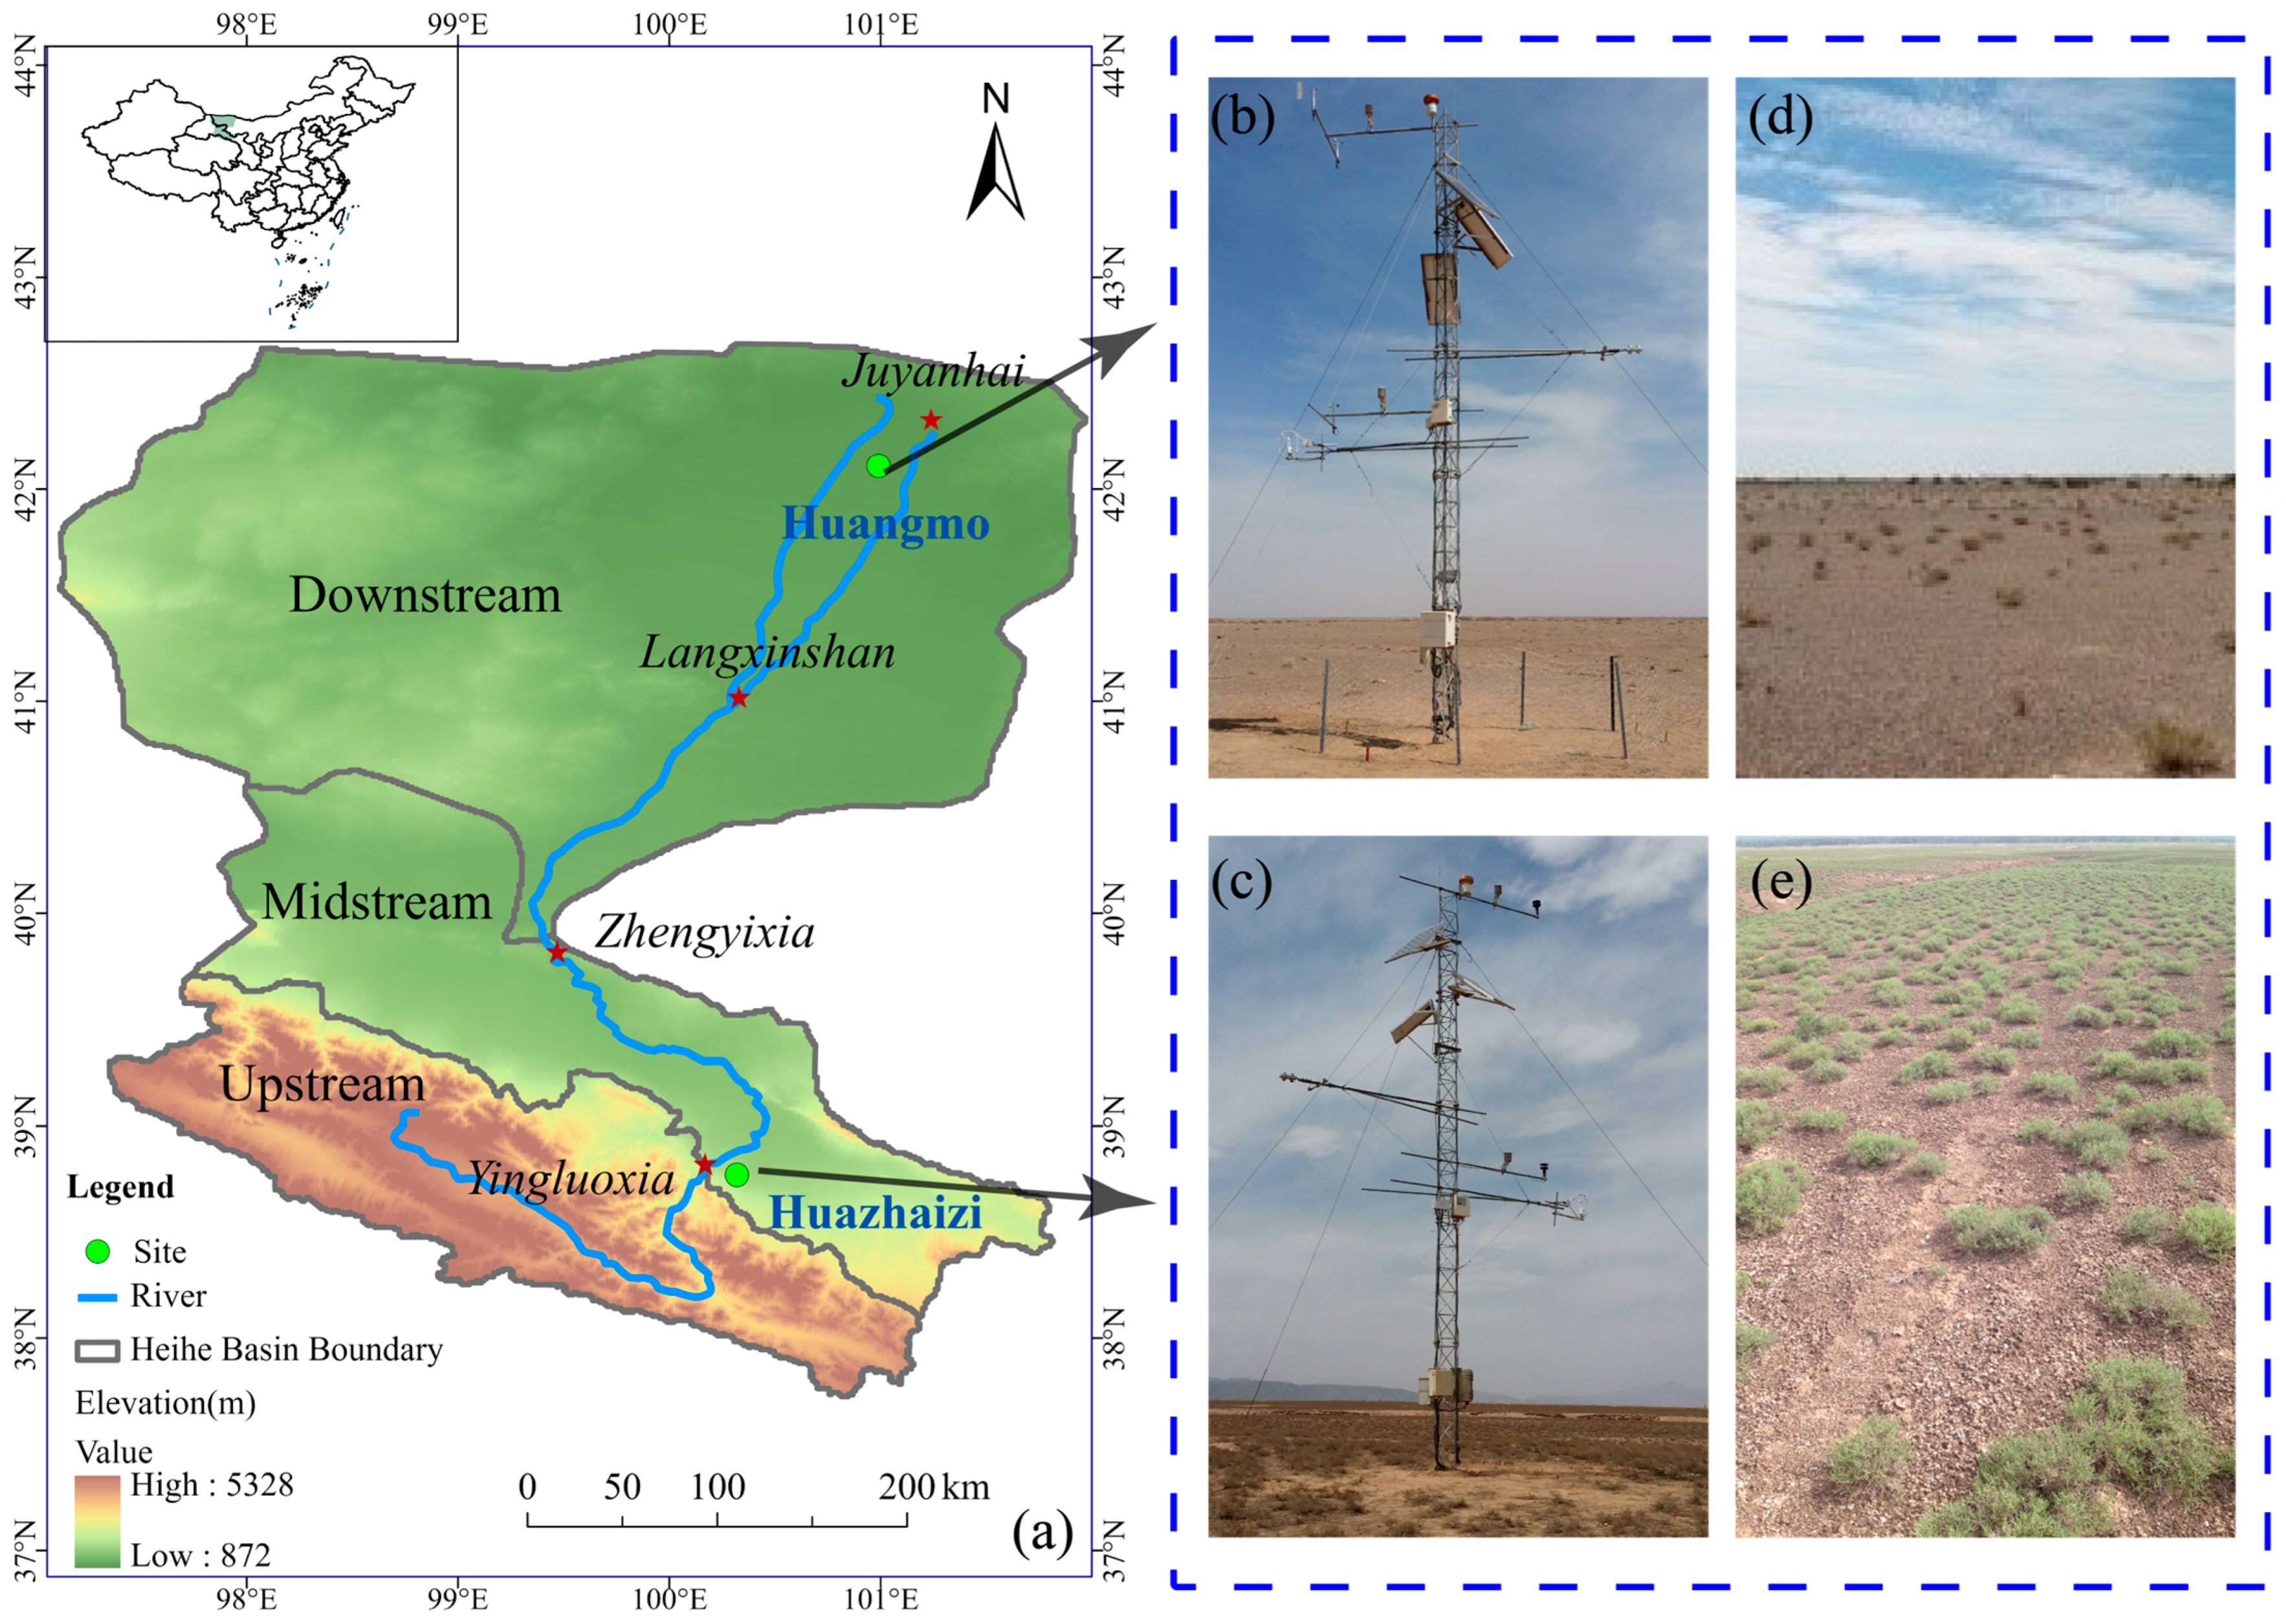
Figure 1. (a) Geographic location of the Heihe River Basin (denoted by the solid line). (b,c) Observation tower and instruments at the two selected study sites (indicated by circles in panel (a)). (d,e) Landscape photographs of the underlying surfaces at the respective study sites. The star symbols denote the geographical division between upstream and downstream regions. The entire study area is enclosed by a dotted line. Arrows in panel a indicate the locations of the two desert field sites where instruments were deployed and corresponding landscape photographs were taken.
Water 17 02660 g001
Figure 2. Soil moisture characteristics of the Huazhaizi (K. foliatum) and Huangmo (R. songarica) desert sites: (a) Annual mean soil water profile with error bars indicating interannual variation at the Huazhaizi site; (b) Spatial distribution of the average daily soil volumetric water content (m3·m−3) at 100 cm depth for the Huazhaizi site from 2016 to 2021; (c) Annual mean soil water profile with error bars indicating interannual variation at the Huangmo site; (d) Spatial distribution of the average daily soil volumetric water content (m3·m−3) at 100 cm depth for the Huangmo site from 2016 to 2021.
Water 17 02660 g002
Figure 3. Daily soil water storage (0–100 cm depth) and interannual variation of precipitation (2016–2021) for (a) Huazhaizi K. foliatum desert and (b) Huangmo R. songarica desert. The vertical dotted lines indicate annual boundaries between years. Grey shaded rectangles denote periods with missing data.
Water 17 02660 g003
Figure 4. (a) Day-to-day variations of multi-year evapotranspiration (ET) measured by eddy covariance systems and (b) reference evapotranspiration (ET0) estimated by Penman–Monteith formula for the Huazhaizi (K. foliatum desert) and Huangmo (R. songarica desert) sites.
Water 17 02660 g004
Figure 5. Monthly variations in precipitation (P), evapotranspiration (ET), and water storage changes (ΔQ) in the two deserts. (ae) Huazhaizi desert with K. foliatum vegetation. (fj) Huangmo desert with R. songarica vegetation.
Water 17 02660 g005
Figure 6. Correlation relationships between monthly Fractional Vegetation Cover (FVC) and hydrological variables: (a,d) precipitation, (b,e) evapotranspiration, and (c,f) soil water storage. (ac) Huazhaizi K. foliatum desert. (df) Huangmo R. songarica desert. Circles represent monthly FVC values, and lines represent nonlinear multivariate fitted relationships between monthly FVC and hydrological variables.
Water 17 02660 g006
Figure 7. Correlation relationships between monthly Fractional Vegetation Cover (FVC) and (a) monthly saturation vapor pressure deficit (VPD), (b) monthly net radiation (Rn), and (c) average monthly wind speed (WS). Circles represent monthly FVC values, and lines represent nonlinear multivariate fitted relationships between monthly FVC and VPD, Rn and WS variables, respictively.
Water 17 02660 g007
Table 1. Comparative vegetation characteristics from field survey between K. foliatum (middle reaches) and R. songarica (lower reaches) deserts in the Heihe River Basin.
ParameterUnitKalidium foliatumReaumuria soongorica
Community traits aPatch numbersIndividuals637 ± 29148 ± 11
Patch densityPatches m−21.0 ± 0.50.1 ± 0.0
Patch area percentage%7.3 ± 3.91.6 ± 1.0
Mean patch aream20.07 ± 0.010.2 ± 0.1
Individual traits aPlant heightcm13.4 ± 1.423.1 ± 5.5
Shrub volumecm33624.8520,042.66
Note: a Individual traits refer to morphological measurements of single plants, while community traits describe collective properties at the stand level.
Table 2. Annual Scale Water Budget, Water Deficit, Groundwater Recharge, and Soil Water Residence Time Values for Huazhaizi K. foliatum desert and Huangmo R. songarica desert.
SiteYearPrecipitation P (mm)Evapotranspiration ET (mm)Change in Soil Water Storage (0–100 cm) ΔQ (mm)Residual Term of Water Budget (mm)Soil Water Storage (0–40 cm) Q (mm)Soil Water Residence Time τ (day)
Huazhaizi2016184.4317.45−0.73132.3365.1475
201748.4281.01−10.22222.3964.7252
2018119.8137.33−9.937.657.06163
2019161.3306.6813.55158.9366.0475
2021154.4157.77−12.3767.78158
Mean133.7240.05−1.67104.7264.15105
Huangmo201636.142.044.239.7018.02144
201858.7150.836.498.5316.3138
201931.4132.79−2.1499.215.3443
202011.132.95−6.615.2511.07154
202111.430.110.4917.9610.69133
Mean29.777.740.4748.1314.29102
Disclaimer/Publisher’s Note: The statements, opinions and data contained in all publications are solely those of the individual author(s) and contributor(s) and not of MDPI and/or the editor(s). MDPI and/or the editor(s) disclaim responsibility for any injury to people or property resulting from any ideas, methods, instructions or products referred to in the content.