Article

Effluent Dissolved Carbon Discharge from Two Municipal Wastewater Treatment Plants to the Mississippi River

1
School of Renewable Natural Resources, Louisiana State University, Baton Rouge, LA 70803, USA
2
Coastal Studies Institute, Louisiana State University, Baton Rouge, LA 70803, USA
*
Author to whom correspondence should be addressed.
Water 2025, 17(17), 2589; https://doi.org/10.3390/w17172589
Submission received: 11 July 2025 / Revised: 29 August 2025 / Accepted: 30 August 2025 / Published: 1 September 2025

Abstract

Nutrient and carbon transport from the Mississippi River to the Gulf of Mexico have been investigated intensively. However, little is known about the direct human contribution of carbon from wastewater treatment plants (WWTPs) to this large river, a source that can be termed as Cultural Carbon. This study analyzed dissolved carbon in effluents from two municipal WWTPs on the bank of the Mississippi River in Baton Rouge, South Louisiana, USA. One of the WWTPs (WWTP North) is a conventional wastewater treatment facility with a treatment capacity of 40 million gallons per day (MGD), while the other (WWTP South) is a recently upgraded facility with a treatment capacity of 200 MGD. From September 2022 to November 2024, river water and effluent samples were collected monthly to analyze dissolved organic carbon (DOC) and dissolved inorganic carbon (DIC) concentrations and their mass transport. The study found significantly higher monthly average DIC (56.80 ± 16.51 mg/L) and DOC (29.52 ± 8.68 mg/L) concentrations in the effluent of WWTP North than in the effluent of WWTP South (DIC: 42.64 ± 10.50 mg/L and DOC: 12.93 ± 3.68 mg/L). Effluents from both WWTPs had substantially greater DOC and DIC levels than the Mississippi River water (DIC: 28.92 ± 4.91 mg/L and DOC: 5.47 ± 2.35 mg/L). WWTP North discharged, on average, 3.80 MT of DIC and 1.95 MT of DOC per day, whereas WWTP South discharged 6.27 MT of DIC and 1.92 MT of DOC per day, resulting in a total annual load of 3808 MT of DIC and 1459 MT of DOC entering the Mississippi River. Considering the large number of WWTPs within the Mississippi River Basin, these findings highlight a significant contribution of effluents to riverine carbon, suggesting that basin-wide carbon budgets and regional climate assessments must take them into account. The findings from this study can be useful for federal and state policymakers, as well as researchers and engineers involved in carbon science, climate change, and water quality assessment of the Mississippi River Basin and beyond.

1. Introduction

Municipal wastewaters contain substantial amounts of nitrogen and phosphorus because of their high contents in human waste, food residues, and detergents [1,2,3]. These nutrients are not completely removed during primary treatment, requiring additional nutrient removal operations in modern wastewater treatment plants (WWTPs). Therefore, nutrient removal processes are required and the level of the nutrients in effluents of wastewater treatment plants are regularly monitored in developed countries [4,5]. However, monitoring of dissolved carbon (DC) in WWTP effluents is not required by regulatory agencies, likely because carbon is generally not considered a concern for water quality. Because of this, our knowledge of the level and discharge of dissolved carbon from WWTP effluents to streams and rivers at a watershed and/or a river basin scale is limited. High concentrations of this cultural carbon, particularly labile dissolved carbon from WWTP effluents, can stimulate microbial respiration while decreasing dissolved oxygen levels, potentially leading to hypoxia, and harming aquatic organisms like fish, macroinvertebrates, and other benthic organisms [6,7,8,9]. On the other hand, rivers have been found to transport a large quantity of dissolved carbon from inland watersheds to the coastal waters. For instance, Li et al. (2017) estimated that global rivers export a total of 240 Tg dissolved organic carbon (DOC) and 410 Tg dissolved inorganic carbon (DIC) annually to the oceans [10]; Xu et al. (2024) estimated a total of 6.3 Tg DOC and 19.3 Tg DIC each year from the Mississippi River Basin into the Gulf of Mexico [11]. However, little is known about how much contribution WWTP effluents make to the riverine carbon exports regionally and globally. Such information can be crucial for developing management plans and strategies to reduce riverine carbon export.
As urbanization and population growth continue, the number of wastewater treatment plants has grown drastically, and so do the quantities of treated effluent discharged into freshwater systems. Jones et al. (2021) reported that the global annual WWTP effluent has increased to 147.4 billion m3, causing approximately 1.2 million km of rivers around the world to be affected [12]. The higher the population density in a certain location, the greater the supply of local rivers from WWTPs [13]. In many watersheds, WWTP effluents can contribute substantially to rivers’ baseflow. As of 2022, China has developed 4695 urban wastewater treatment plants capable of treating up to 73.8 billion cubic meters of sewage per year [14]. These facilities account for approximately 44% of the total water used in the country in the national artificial ecological systems [15]. In the continental United States, about 75% of the country’s population (i.e., 238 million people) rely on the 16,000 publicly operated wastewater treatment plants (EPA 2022 CWNS Report) for essential wastewater collection, treatment, and disposal services. The remaining houses normally manage their wastewater with septic systems (Center for Sustainable Systems; CISA) [16]. These 16,000 WWTPs are discharging tremendous amounts of effluent into their nearby waterbodies daily. While effluents from WWTPs are an important source of the baseflow of rivers, they may contribute a large amount of highly concentrated dissolved carbon to the receiving streams and rivers. Effluents are often enriched in labile DOC and DIC, which can be rapidly metabolized by microbial communities, leading to increased oxygen demand, pH changes, and higher partial pressures of CO2 (pCO2), eventually enhancing CO2 outgassing from rivers to the atmosphere [8,17,18,19]. Since most of the organic matter of domestic sewage can be degraded after advanced treatments, WWTP effluents often show low pH value, high DIC and DOC concentrations, and high pCO2 affecting ecological integrity of downstream receiving waters [9,20,21]. Despite the large chemical loadings from WWTP effluents, their impact on both local and basin-wide carbon budgets is normally neglected. This is particularly true for large-scale watersheds with abundant WWTPs like the Mississippi River Basin.
This study aimed to address this information gap by quantifying DIC and DOC in WWTP effluents and determining their difference with the receiving river water. Over a period of 27 months, we conducted in-situ measurements and collected monthly effluent samples from two WWTPs in Baton Rouge, South Louisiana, that discharge effluents into the Mississippi River. The study concentrated on three primary research questions: (1) How do the DIC and DOC concentrations in WWTP effluents compare with those in the Mississippi River water? (2) How do the effluent carbon concentrations of one upgraded WWTP compare with those of a conventional WWTP in the same area? (3) What is the significance of considering wastewater treatment plants in basin-wide carbon accounting to better understand the impact of their effluents on carbon levels in discharging waterbodies? Our goal in answering these questions is to provide an in-depth understanding of how WWTPs affect the carbon dynamics of inland receiving water bodies.

2. Materials and Methods

2.1. Study Site

This study was carried out at two municipal wastewater treatment plants in East Baton Rouge Parish, South Louisiana, USA (Figure 1). These WWTPs, the North Wastewater Treatment Plant (WWTP North) (30°29′02.6″ N, 91°10′09.6″ W) and the South Wastewater Treatment Plant (WWTP South) (30°20′23.4″ N, 91°11′20.3″ W), serve as the principal wastewater treatment system for much of the City of Baton Rouge with a population of 227,470 (based on the 2020 United States census). Both WWTP North and WWTP South use multi-stage treatment methods that begin with basic screening and grit removal, followed by primary clarification. In comparison, WWTP North is a conventional facility with a daily treatment capacity of 40 million gallons per day (MGD) and a daily average treated effluent of 20 MGD. WWTP North uses a traditional activated sludge process with secondary clarifying and sodium hypochlorite disinfection, as well as odor control measures like a bio-trickling filter tower, chemical scrubbers, and carbon adsorption filters. To keep phosphate and nitrogen levels low in the effluent, the facility uses treatment techniques such as nutrient removal systems. On the other hand, WWTP South, located off Gardere Lane, is the larger of the two facilities and capable of processing up to 200 MGD of wastewater with around 42 MGD daily average processed effluent. This plant has undergone extensive upgrades in recent years with a spend of more than USD 250 million, transforming the 50-year-old plant into an advanced facility. The updated process includes trickling filters and solids contact process that can be used in series during both dry weather and in parallel during wet weather to handle peak flows. Additional enhancements include biological nutrient removal (BNR), membrane bioreactor (MBR) filtration for fine solid separation, and chlorination followed by dichlorination. WWTP South also has a centralized Supervisory Control and Data Acquisition (SCDA) system, which provides real-time monitoring and operational management control. It is part of a USD 1.3 billion Sanitary Sewer Overflow (SSO) Program, which includes extensive pipeline rehabilitation, pump station expansion, and the installation of system-wide backup generators [22]. These operational improvements have increased treatment efficiency, effluent quality, and resilience, making WWTP South a modern facility compared to the traditional WWTP North. The treated effluents from both WWTPs are released into the Mississippi River, totaling around 40 million gallons of effluent each day.
The study region has a humid subtropical climate with long hot summers and short mild winters. Long-term annual temperature in the area was reported to be 20 °C, with monthly averages ranging from 11 °C in the coldest month (January) to 28 °C in the warmest month (July). The annual average air temperature during the study period recorded at Ben Hur weather station, which is about 5 km southeast of the study lake, was 20 °C, fluctuating from 11 °C in January to 28 °C in July. Throughout the 12-month study period, most of the monthly average temperatures were lower than the long-term monthly averages. Long-term annual precipitation in the area was reported to be about 1477 mm, ranging from 159 mm in July to 81 mm in October.

2.2. Field Measurements and Sampling

Between September 2022 and November 2024, in-situ measurements and sampling were conducted monthly at the two wastewater treatment plants, as well as in the Mississippi River at Baton Rouge, LA, USA (Figure 1). Each month, samples from the final effluents, before discharging into the Mississippi, were collected in an HDPE sample bottle from the treatment plants north and south. The effluent samples and measurement collection were conducted between 10:00 and 1:30 Central Standard Time (CST). The same procedure was performed for river water sampling. Monthly effluent and river water samples were filtered in-situ into a precleaned 40 mL glass vial with a 0.2 µm filter and pierceable top, then kept on ice during the sample transport to the laboratory. Additionally, in-situ measurements were conducted during each trip with a YSI 556 multi-probe meter (YSI Inc., Yellow, Springs, OH, USA) for recording dissolved oxygen (DO), water temperature, and conductivity. Fluorescence detection of chlorophyll a (Chl a), phycocyanin (Phyco), colored dissolved organic matter (cDOM), and ammonium (NH4) in the river waters were performed on-site using Aqua Fluor Handheld Fluorometers (Turner Designs, San Jose, CA, USA). Chl a was measured with the AquaFluor® handheld fluorometer (Turner Designs), which measures fluorescence with an excitation wavelength of ~460 nm and an emission wavelength of ~685 nm.

2.3. Chemical Analysis for DIC and DOC

After each field trip, effluent samples and river water samples were refrigerated until they were sent to the LSU Wetland Biogeochemistry Analytical Services Laboratory at Louisiana State University, Baton Rouge, Louisiana, for DIC and DOC analysis. The samples were analyzed by a Total Organic Carbon Analyzer (TOC-L CHS/CSN Shimadzu, Kyoto, Japan) using the 680° C combustion catalytic oxidation process and nondispersive infrared sensor (NDIR) detection. The instrument measures the inorganic carbon fraction by acidifying the sample and converting all carbonate species (CO2(aq), HCO3, CO32−) into CO2 gas. The gas is then quantified using a nondispersive infrared (NDIR) detector. To determine the DOC, the sample is burned at 680 °C with a platinum catalyst present, oxidizing organic carbon to CO2, which is then measured by an NDIR detector. The DOC concentration is computed as the difference between total and inorganic carbon. TOC was calculated using the TC (Total Carbon) and IC (Inorganic Carbon) concentrations after calibrating the instrument with TC and IC standards.

2.4. Estimation of Effluent DIC and DOC Mass Loading

Monthly effluent volumes were gathered from the two wastewater treatment plants. The effluent volume and monthly DOC and DIC concentrations were used to calculate the mass loading of dissolved carbon (DC = DIC + DOC). The loadings were calculated as a product of monthly effluent volume and monthly DIC and DOC concentrations. The 24 monthly loadings from September 2022 to August 2024 were summed up for annual loadings. The data from September to November 2024 were not included in the average monthly and annual loading estimation in order to avoid possible seasonal effects. However, all data from these months were included in regression analysis as described below.

2.5. Statistical Analysis

Means and standard deviations were computed for DIC and DOC concentrations and other physiochemical parameters. A Pearson’s correlation matrix was utilized to look for statistically significant correlations (p < 0.05) across the dataset, particularly between dissolved carbon and ambient water parameters. Furthermore, linear regression analysis was used to confirm parameter relationships. All statistical analyses employed a significance level of 0.05 and were carried out using the R 4.3.1 software.

3. Results

3.1. Physicochemical Parameters

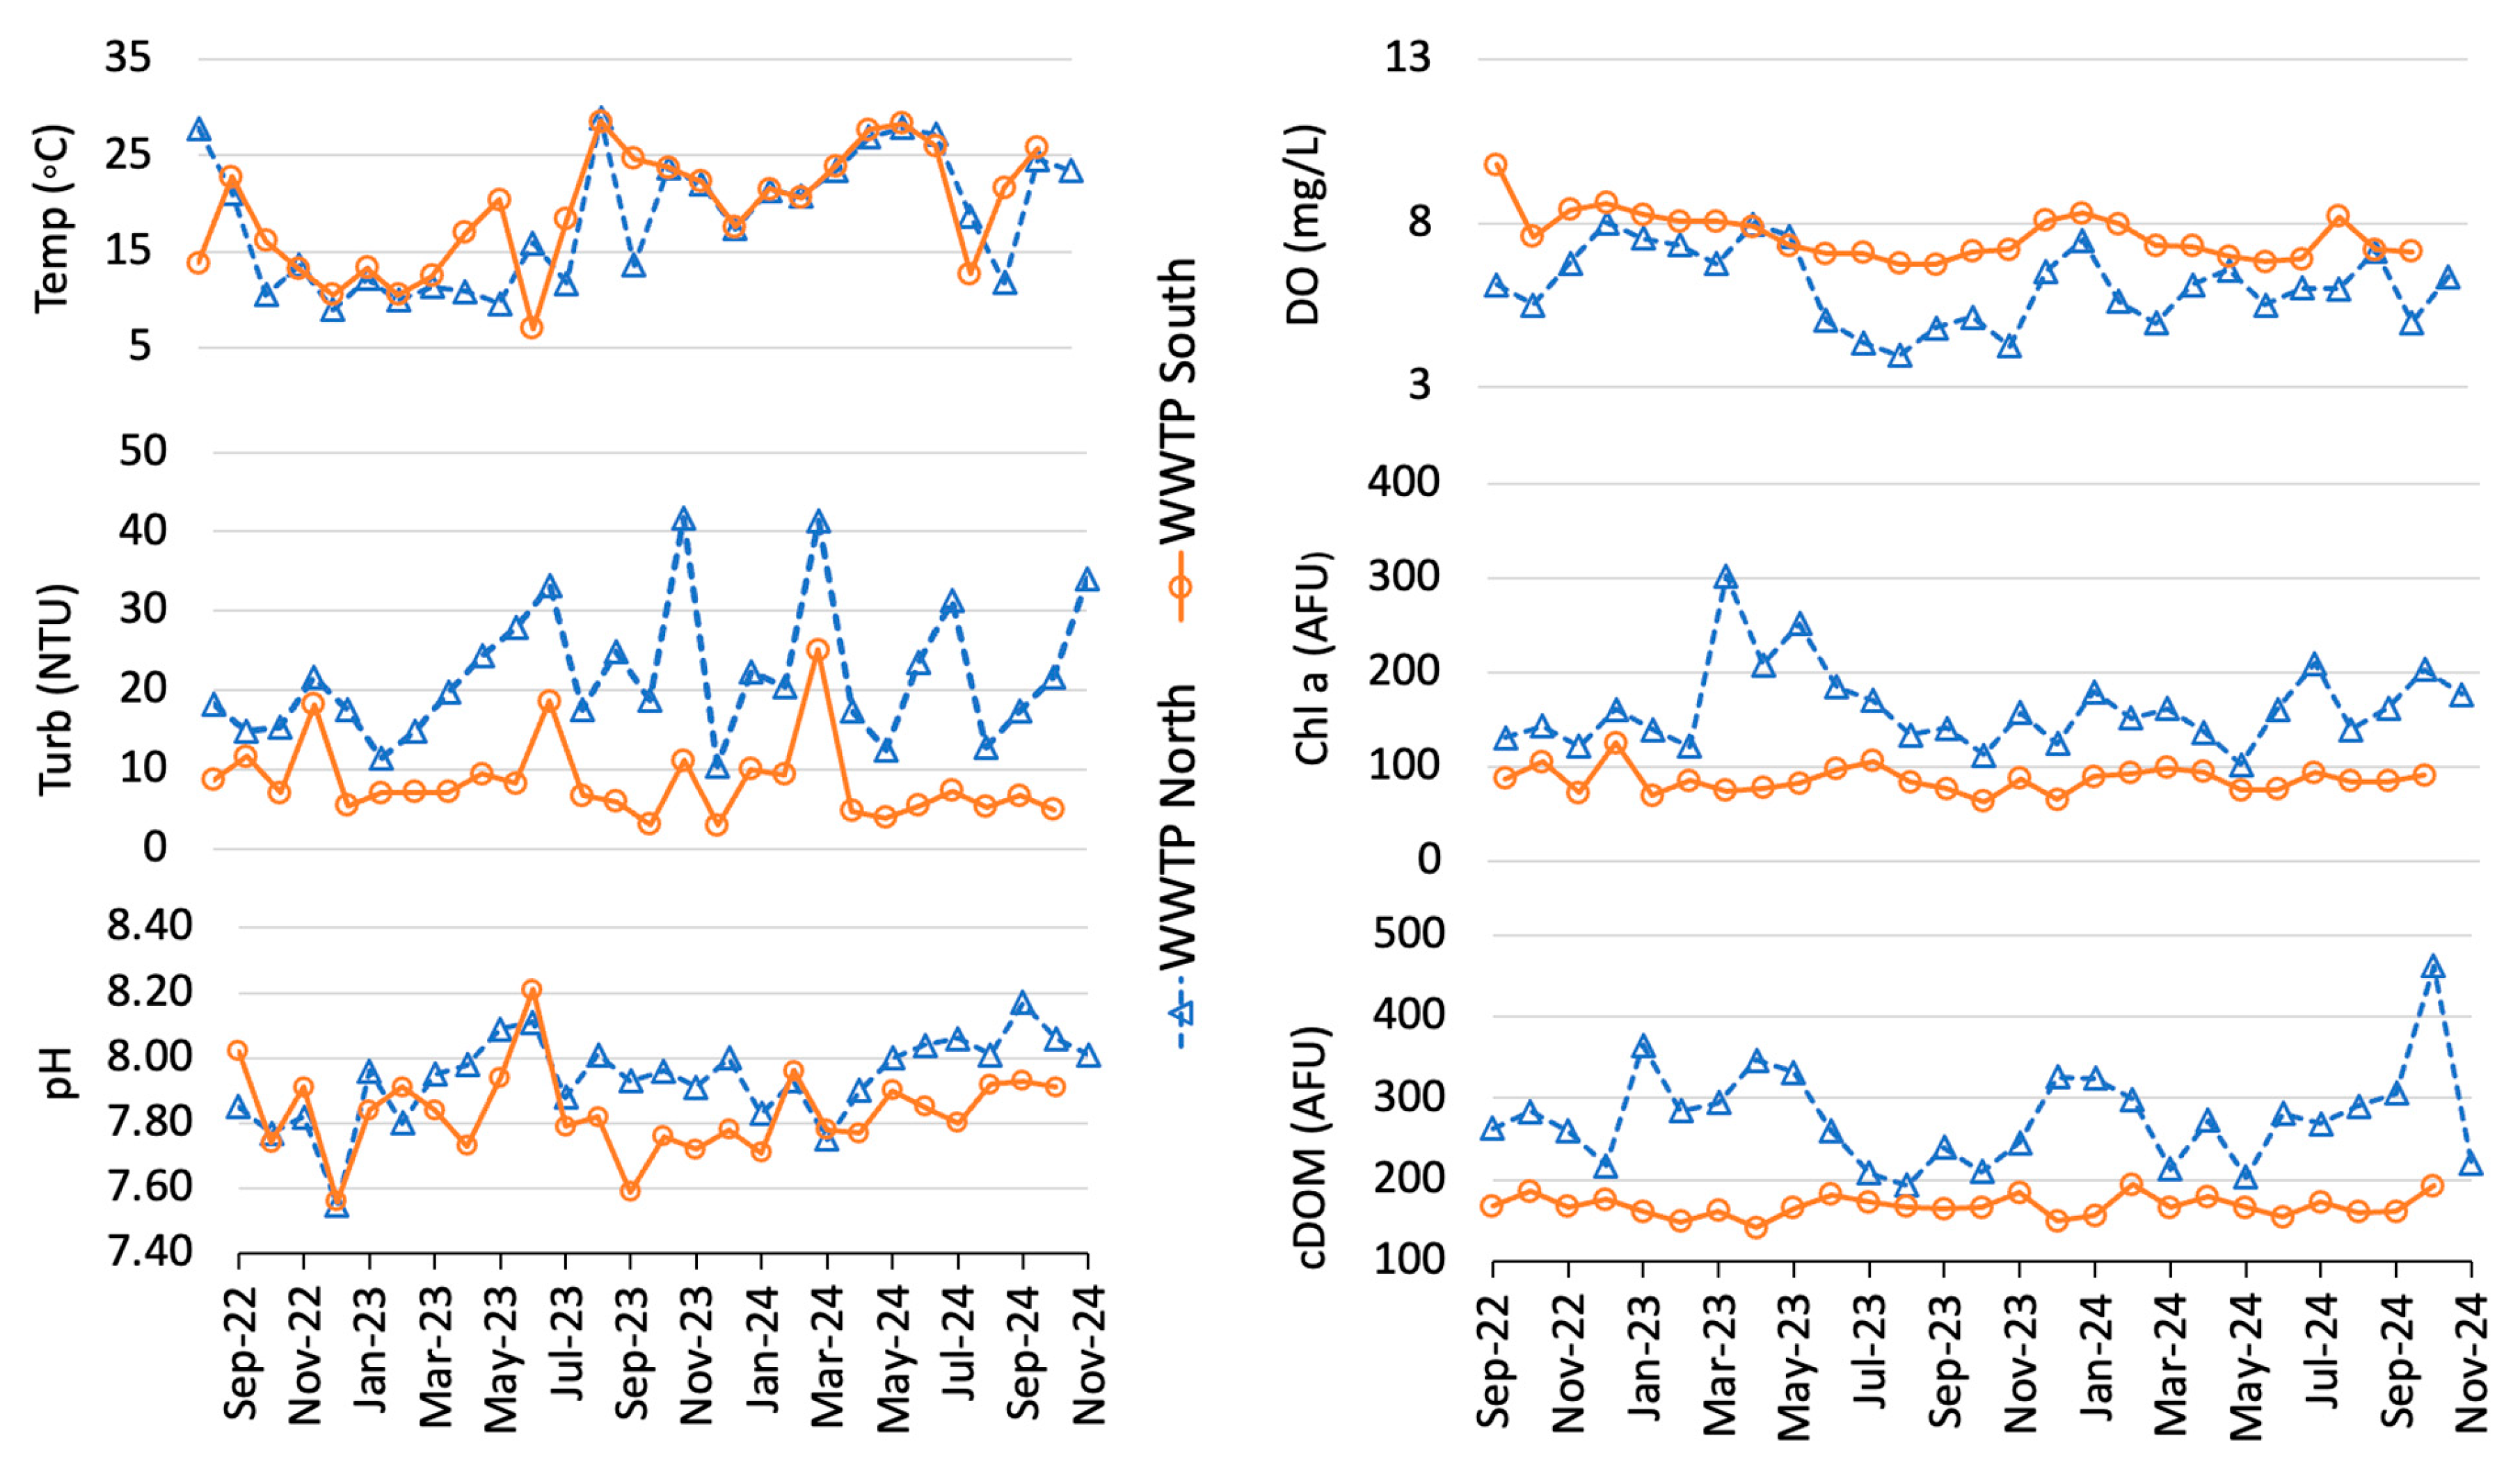
Physicochemical parameters varied largely in effluents of the two treatment plants over the 27-month study period (Figure 2). Water temperature ranged from 9.00 to 28.90 °C, with a mean of 18.34 ± 6.72 °C in the WWTP North while the temperature ranged from 7.00 to 28.50 °C, with a mean of 19.25 ± 6.15 °C in the WWTP South. Turbidity of the effluents was found higher in the WWTP North (ranged from 10.46–41.70 NTU with an average 21.71 ± 8.425 NTU) than the WWTP South (ranged from 2.96–25.10 NTU with an average 8.48 ± 5.11 NTU). The high turbidity indicates a large number of suspended particles in effluent. pH value of the effluents in the WWTP North averaged 7.94 ± 0.13 varying from 7.55 to 8.17 while in the WWTP South averaged 7. 83 ± 0.13 varying from 7.56 to 8.21 (Figure 2).
On the other hand, DO concentration in WWTP North was found to be lower, 3.96–8.02 mg/L, with an average value of 6.09 ± 1.17 mg/L, than that in WWTP South, which ranged from 6.73–9.78 mg/L with an average 7.61 ± 0.72 mg/L (Figure 2). This low DO indicates a high concentration of oxygen-consuming contaminants in effluent. During the study period, WWTP North had consistently greater concentrations of Chlorophyll-a (Chl a) and colored dissolved organic matter (cDOM) than WWTP South. At WWTP North, Chl a concentration ranged from 102.10 to 302.10 AFU, with an average of 162.06 ± 43.80 AFU. WWTP South, on the other hand, showed average Chl a concentration of 85.66 ± 13.73 AFU, ranging from 62.53 to 124.50 AFU. High concentrations of Chl a suggest a high presence of algal biomass enriched with nutrients (like carbon, nitrogen, and phosphorus), and a eutrophication indicator. Similarly, the WWTP North had considerably higher cDOM concentrations, ranging from 193.60 to 461.30 AFU, with a mean of 276.62 ± 59.33 AFU. In contrast, the WWTP South showed lower cDOM levels, with an average of 167.95 ± 13.07 AFU and a range of 141.40 to 194.40 AFU. High levels of cDOM in wastewater may indicate the existence of organic contaminants that were not eliminated during treatment.
The Pearson correlation analysis identified notable correlations between water quality metrics at both WWTPs (Table 1). At WWTP North, cDOM and NH4 had a strong correlation (r = 0.99), indicating a common source, most likely organic-rich effluent. DIC had moderate positive associations with cDOM (r = 0.67), NH4 (r = 0.63), and pH (r = 0.46). DOC had moderate associations with cDOM (r = 0.38) and pH (r = 0.51), suggesting the importance of effluent chemistry in determining carbon speciation. In WWTP South, Chl a was strongly connected with turbidity (r = 0.72, p < 0.05), most likely due to algal biomass. The relation of DOC with turbidity (r = 0.48) and cDOM’s close correlation with NH4 (r = 0.64) indicate that effluent-derived organic matter and nutrients are linked to higher particulate and organic content in effluent. DIC in the South plant had weak or negative correlations, particularly with Chl a (r = −0.31), indicating that photosynthesis may have taken up carbon.

3.2. Dissolved Carbon Concentrations

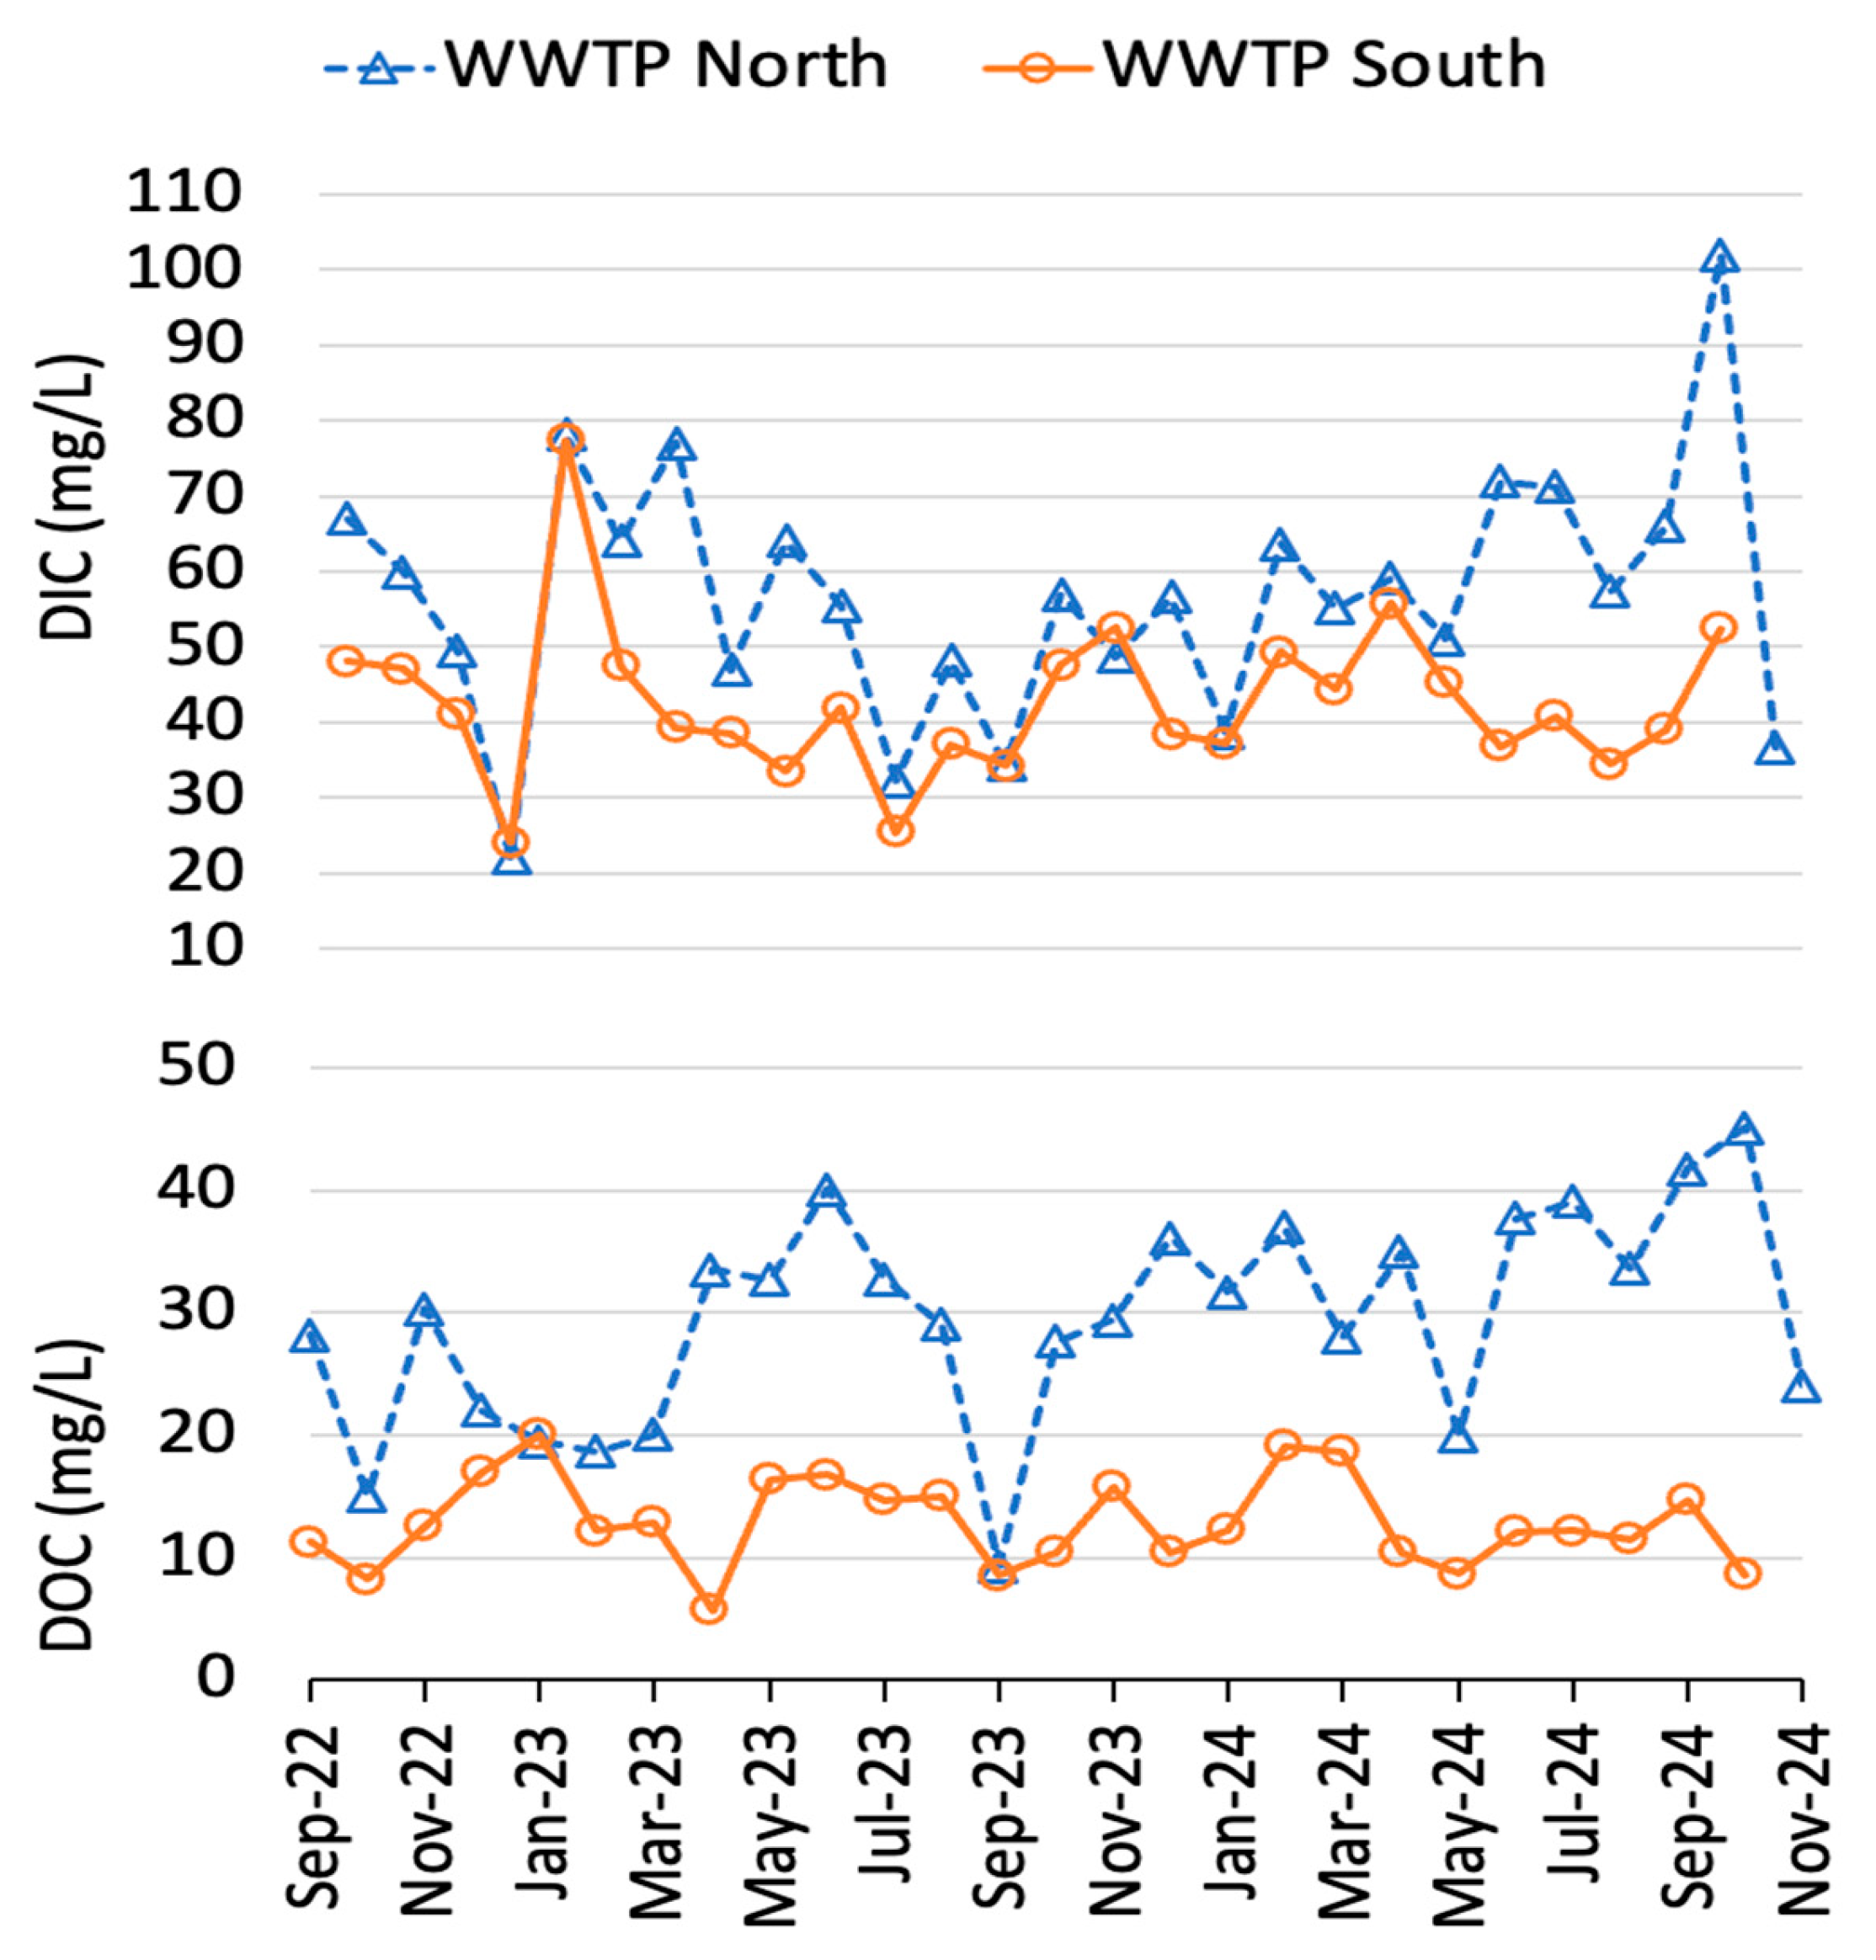
Dissolved inorganic carbon and dissolved organic carbon concentrations in effluents varied largely between the two treatment plants. In this 27-month study period, we have found both DIC and DOC significantly higher in WWTP North than in WWTP South. Independent t-tests confirmed significant differences in DIC (p = 0.0003) and DOC (p < 0.0001) between the two plants. The non-parametric Mann–Whitney U tests, which also showed significant differences for both DIC (p < 0.001) and DOC (p < 0.0001), further confirmed these findings and showed consistent patterns in addition to normality assumptions. The range of DIC of effluent found in WWTP North is 22.00–102.00 mg/L with an average of 56.80 ± 16.51 mg/L while the DIC ranged from 24.00–77.37 mg/L with an average of 42.64 ± 10.50 mg/L in WWTP South (Figure 2, Table 2). In WWTP North, the DOC varied from 9.27 to 45.10 mg/L with an average of 29.52± 8.68 mg/L, whereas in WWTP South, it only varied from 5.74 to 20.00 mg/L with an average of 12.93 ± 3.68 mg/L (Figure 3, Table 2).
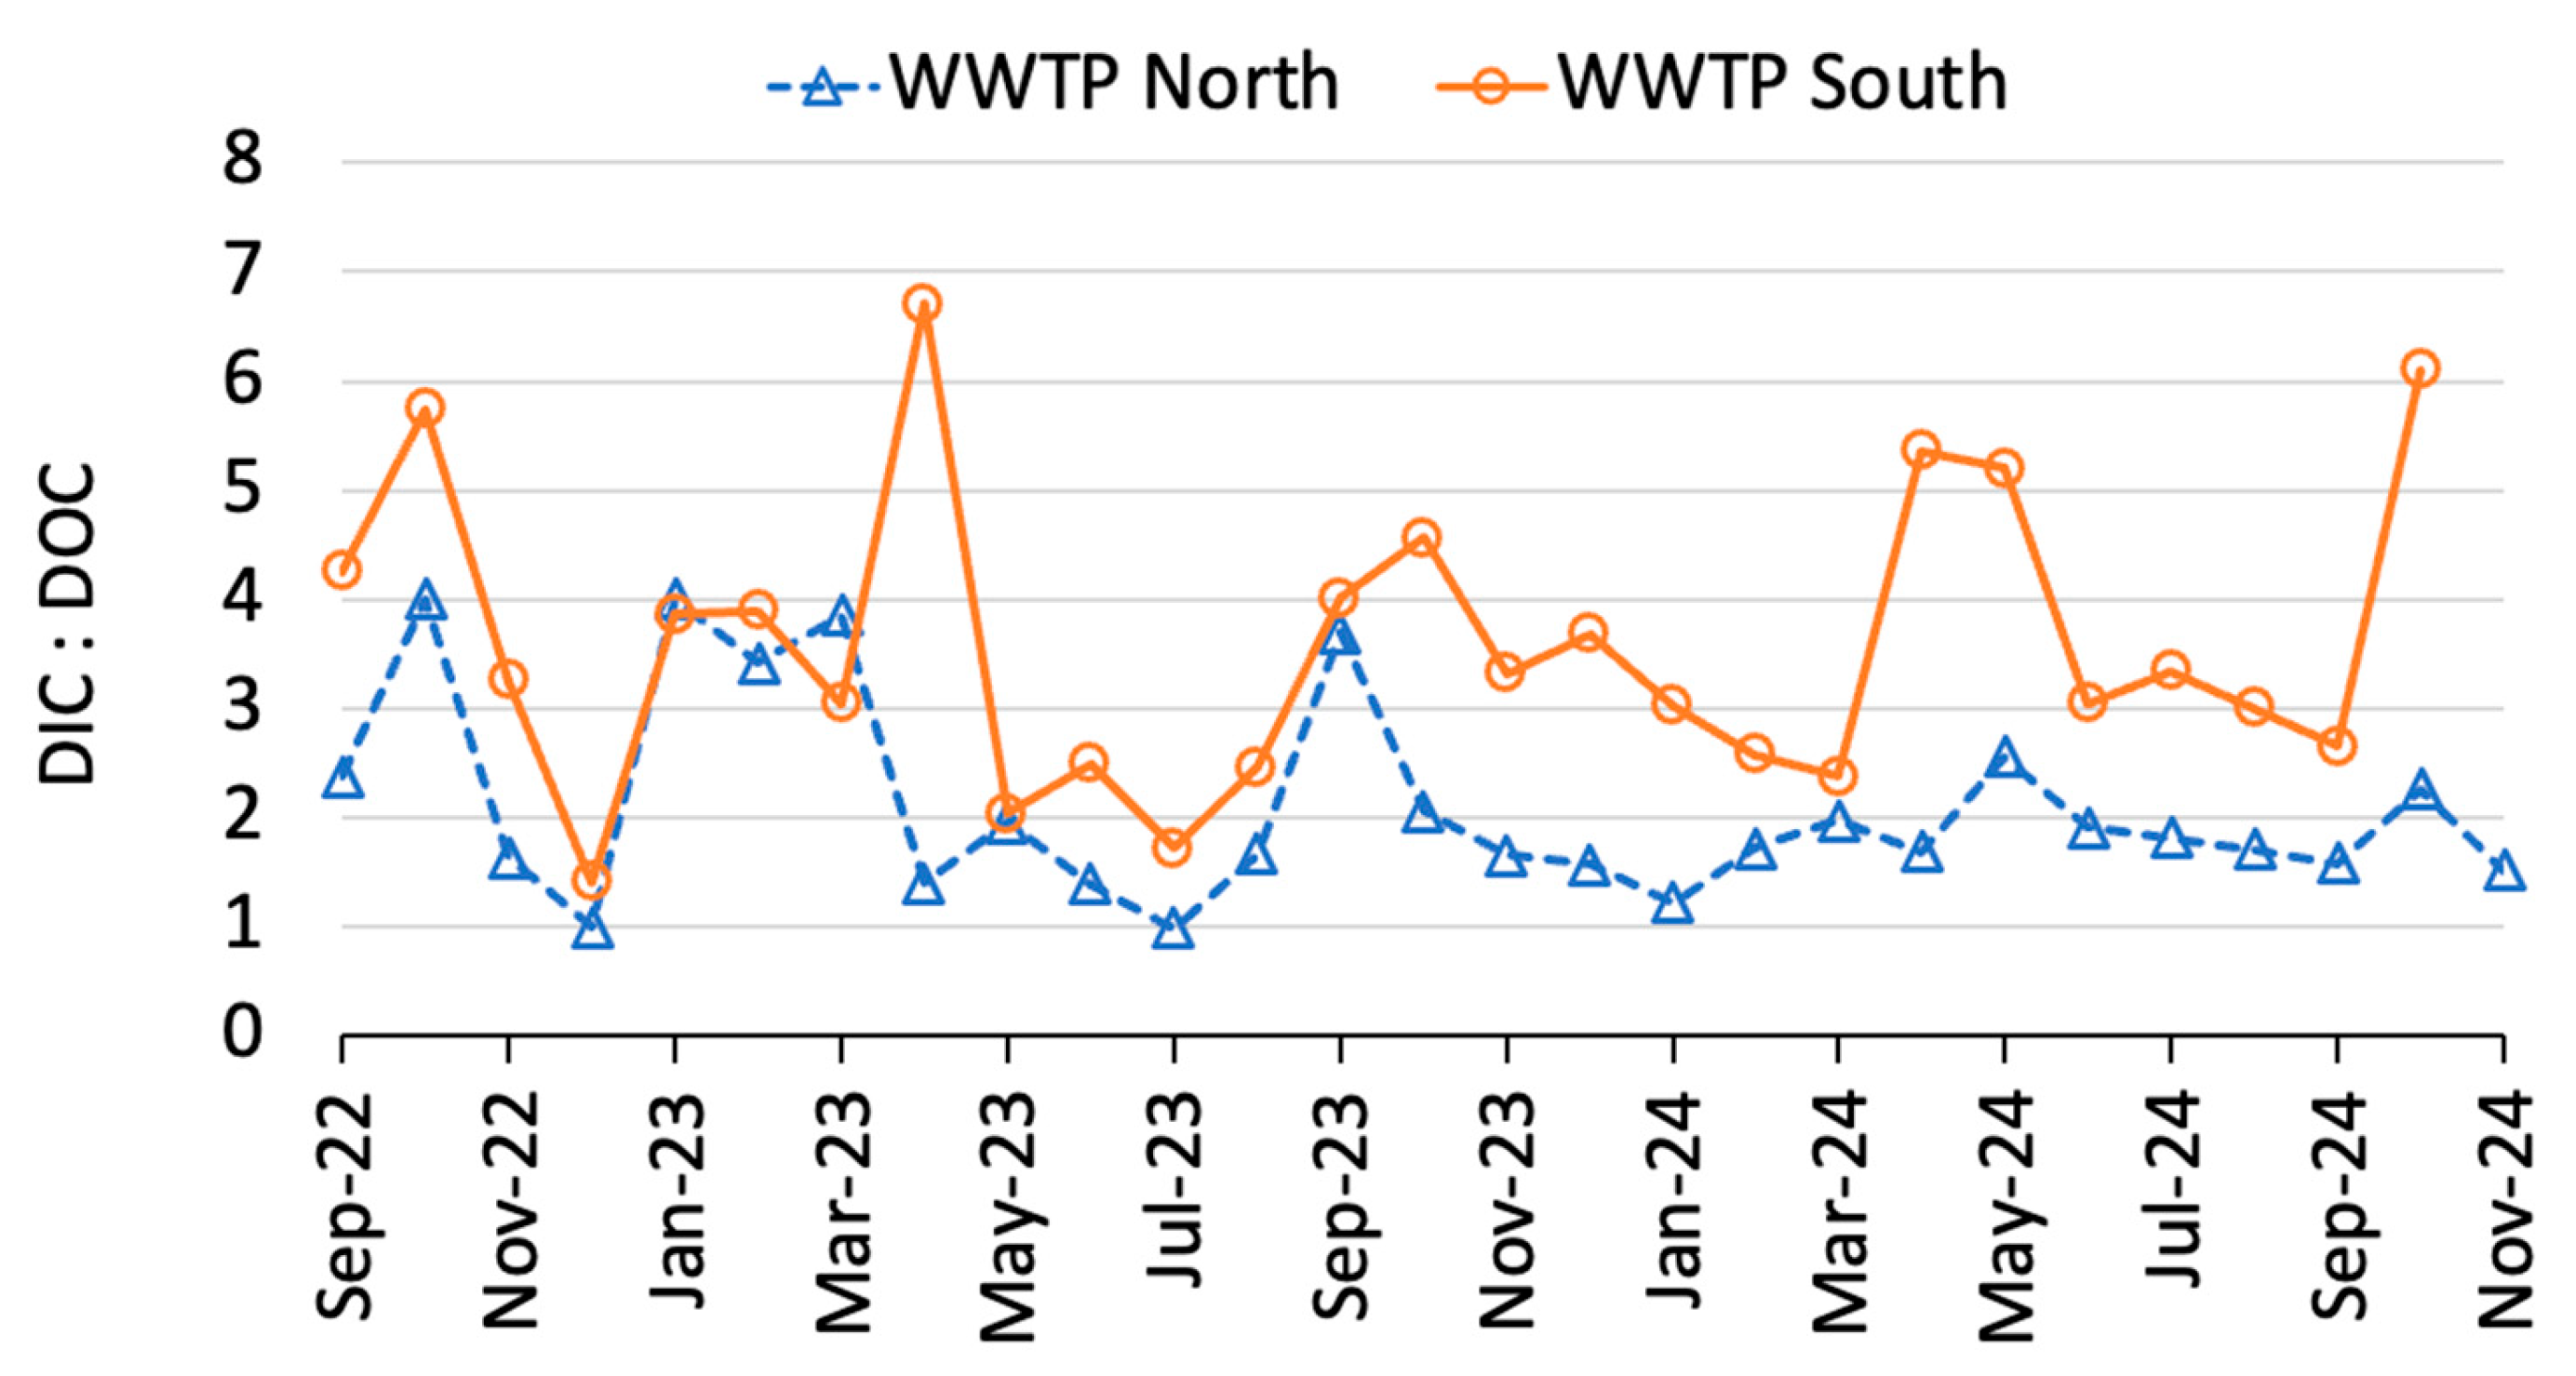
The ratio of DIC and DOC in effluents of the two WWTPs varied from 1 to nearly 7, but the temporal variation was largely similar between the two WWTPs (Figure 4). However, the average DIC:DOC was found higher in WWTP South (3.29) than in WWTP North (1.92). The contrasting DIC:DOC ratios at WWTP North and WWTP South highlight the importance of treatment facility design and technological improvement in carbon removal efficiency.

3.3. Annual Dissolved Carbon Loads from WWTP Effluents

Over the study period, the monthly DIC and DOC loads in effluent fluctuated a lot (Figure 5). The daily effluent flow averaged 6.74 × 10⁴ m3 for WWTP North and 14.85 × 10⁴ m3 for WWTP South (Table 2). WWTP North discharged an average of 3.80 metric tons (MT) of DIC and 1.95 MT of DOC each day, and WWTP South released 6.27 MT of DIC and 1.92 MT of DOC. Together, these two wastewater treatment plants released around 10.07 MT of DIC and 3.87 MT of DOC into the Mississippi River each day. Annually, WWTP North discharged 1387.61 MT DIC and 707.78 MT DOC, whereas WWTP South discharged 2420.40 MT DIC and 750.88 MT DOC.

3.4. Relations of Effluent Dissolved Carbon with Water Physiological Variables

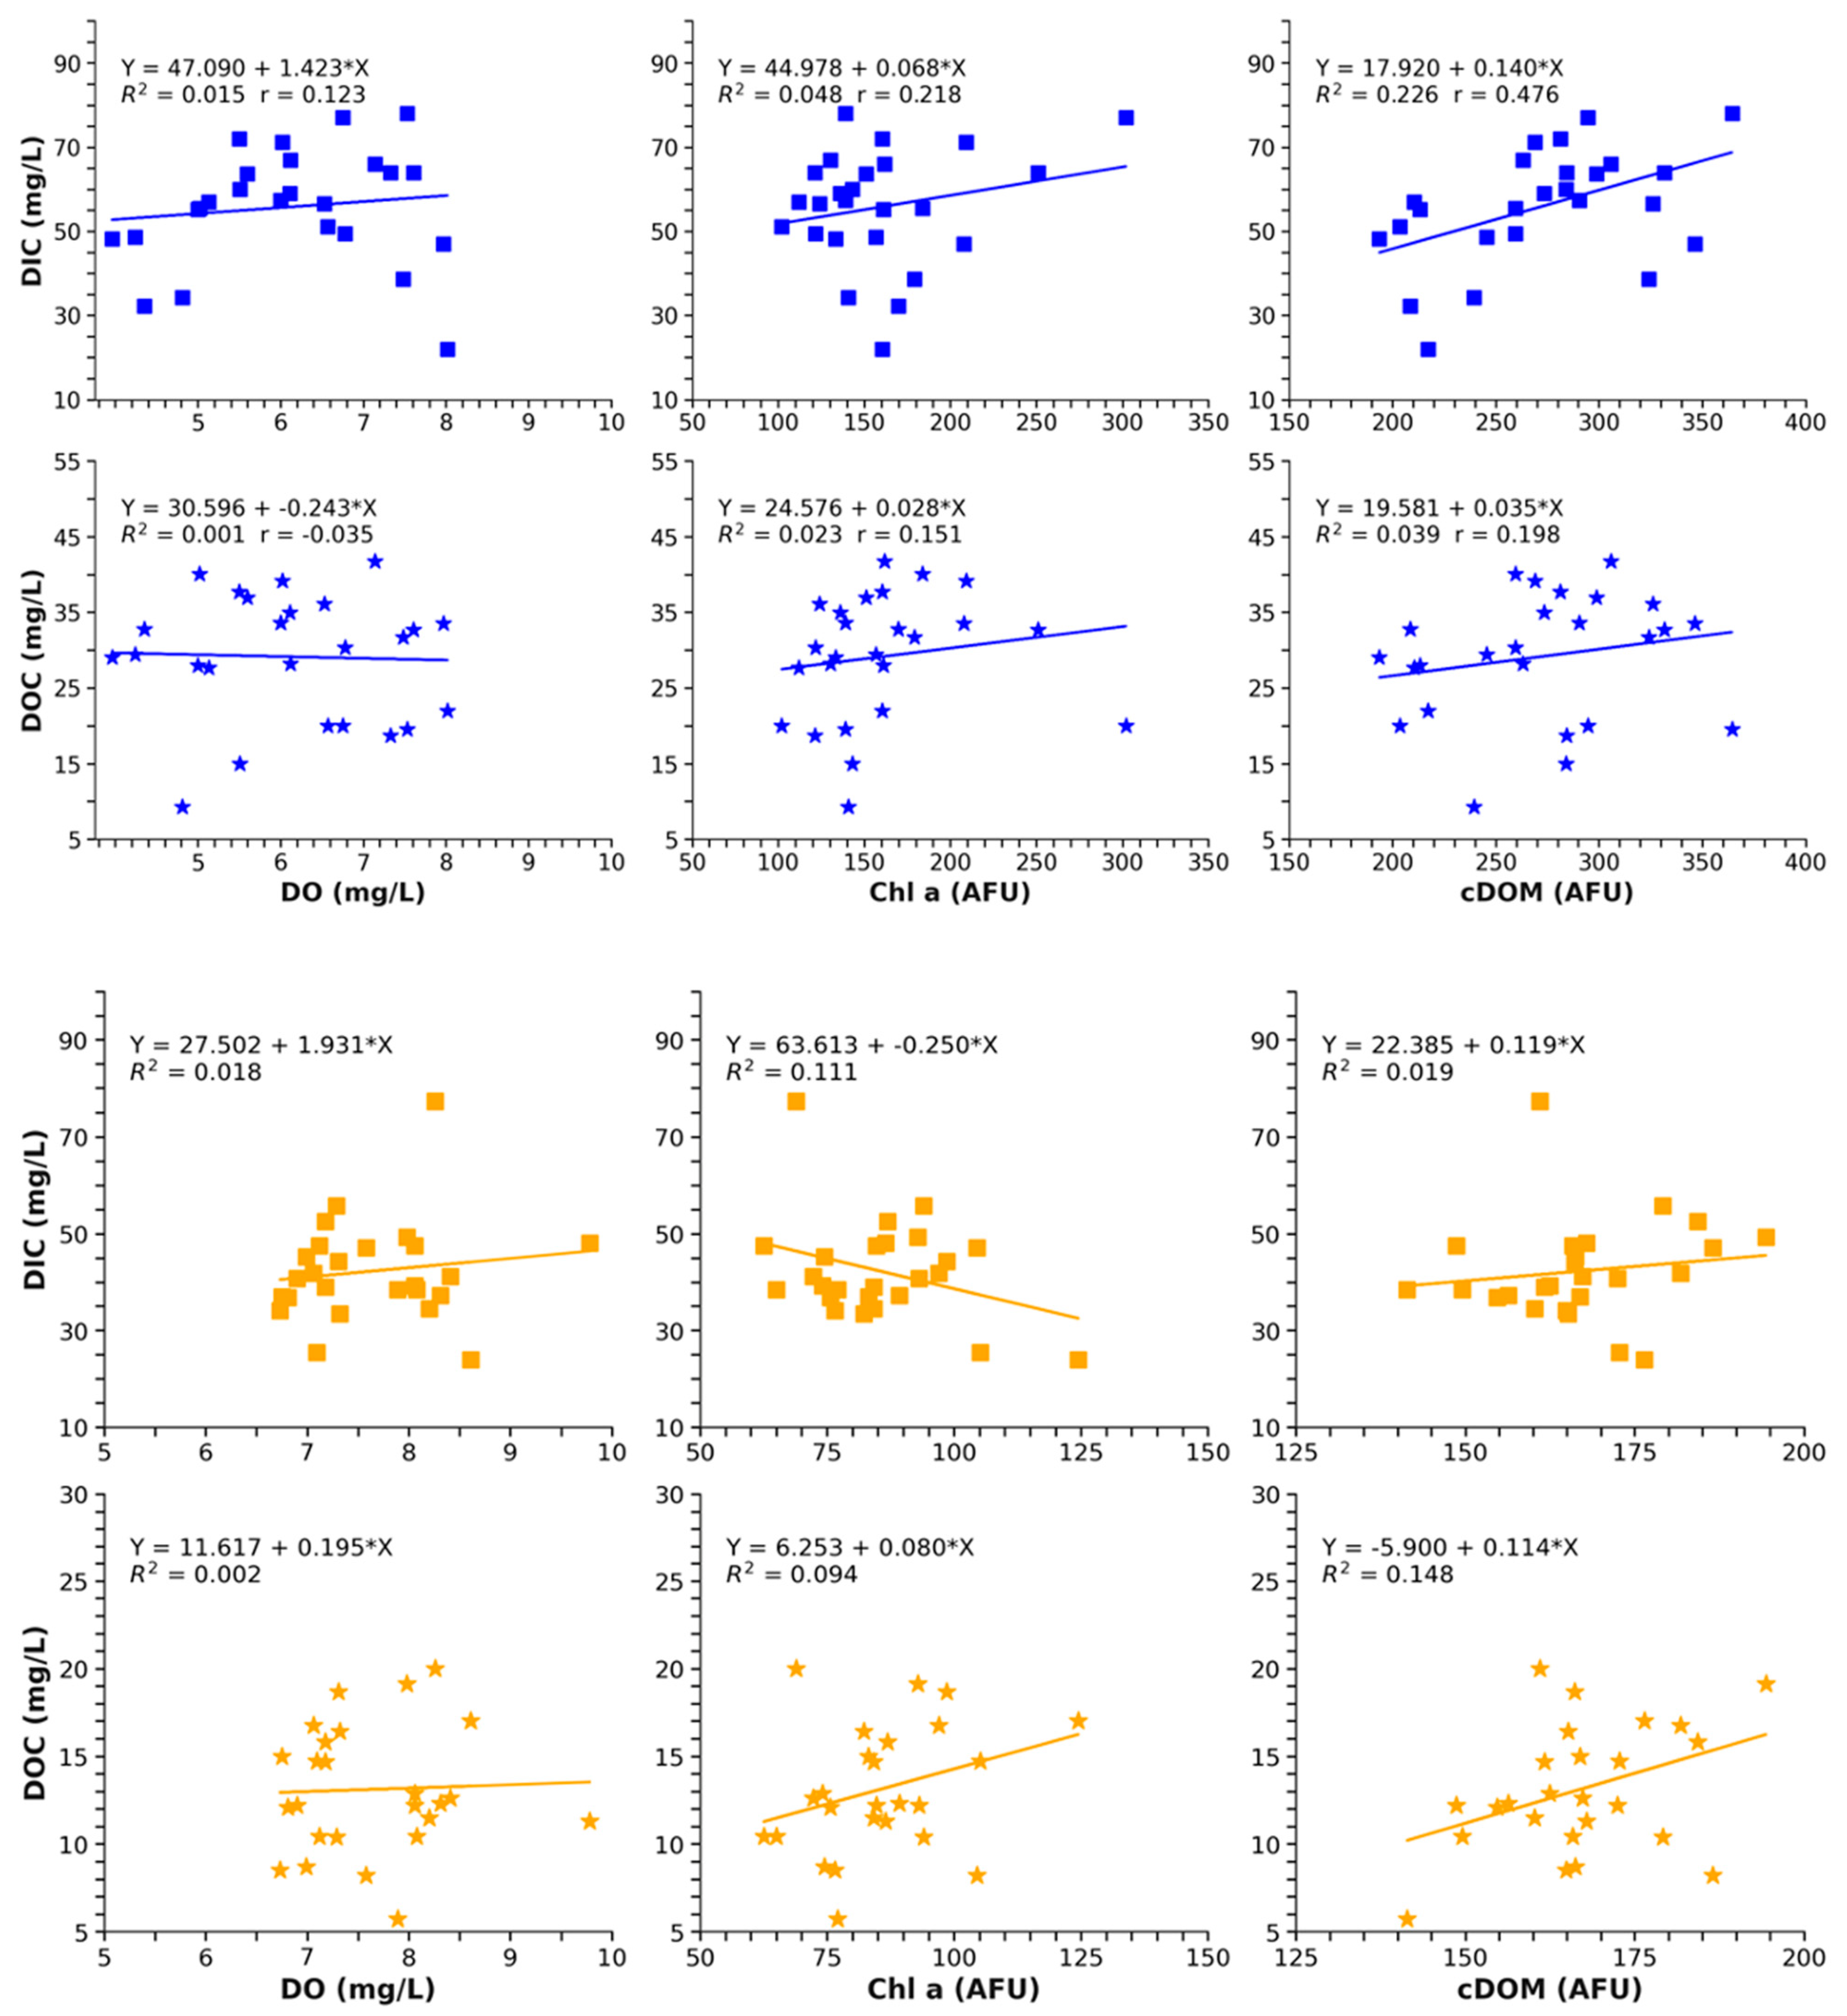
Effluents from both wastewater treatment plants showed a positive relationship between DIC and DO, resulting in increased DO levels with higher DIC concentrations (Figure 6). This relationship was stronger and more varied at WWTP South. Similarly, DOC levels showed a minor positive association with DO at both plants, but the variation was larger at WWTP South. A positive correlation was observed between DOC and Chl a in both treatment plants; however, the correlation became more apparent in WWTP South. Interestingly, WWTP South showed a negative correlation between DIC and Chl a, while WWTP North showed a positive correlation between DIC and Chl a. In addition, both treatment plants showed a positive association between DIC and cDOM, with higher cDOM values correlating to greater DIC concentrations, and a similar tendency was shown between DOC and cDOM. Overall, effluents from WWTP South had clear relationships with increased variation in DIC and DOC concentrations.

4. Discussion

4.1. High Legacy Carbon from WWTP Effluents

The results of this study demonstrate that WWTPs act as a significant source of both dissolved inorganic and dissolved organic carbon to the Mississippi River. The significantly higher dissolved carbon found in the effluents from the two municipal WWTPs than in the river water confirms the critical role of legacy carbon input to riverine systems. When compared with DIC concentrations, DOC concentrations are much higher in WWTP effluents than in river waters, resulting in a significantly lower DIC:DOC ratio (Table 3). Our results align with the finding from a study by Aitkenhead-Peterson et al. (2009), which showed that WWTP effluents in south Central Texas had much higher DOC (72.5 mg/L) than that in rural river water, i.e., almost 10-fold higher [23]. Similar findings have been reported in studies from other geographical regions, such as considerably greater dissolved carbon downstream of WWTPs in southwest Germany [24] and higher DIC-DOC in urban-impacted rivers in eastern China [25]. A recent study by Cao et al. (2025) on WWTPs in many other countries found that globally, effluent DIC concentration ranged from 16.68 to 69.80 mg C L−1, with a median of 43.80 mg C L−1, and the DOC ranged from 3.55 to 17.08 mg C L−1, with a median of 7.50 mg C L−1 [26]. Our findings on both DIC and DOC concentrations in the two WWTP effluents (Table 3) are higher than the global average, especially the DOC concentration. This may be due to a difference in diet among people in different countries. Collectively, these findings highlight that municipal WWTPs are consistent and substantial sources of legacy dissolved carbon, continuously enriching receiving river systems like the Mississippi with higher DIC and DOC concentrations than what is naturally found in the river.
Importantly, the difference in carbon contents between WWTP effluent and river water is more than just a chemical finding; it has wider ecological ramifications. Elevated DOC concentrations can promote microbial respiration and oxygen consumption downstream, while high DIC loading can increase riverine CO2 outgassing, particularly in warmer temperatures [17,24], high winds [27,28], and high river velocities [29]. The localized pulses of pCO2 found at the confluences show that urban tributaries and downstream rivers receiving WWTP effluents act as “anthropogenic C pumps” [8] capable of triggering substantial CO2 pulses along relatively short stretches of the impacted reach. According to Keen et al., 2014, both the buildup of labile carbon compounds due to microbial transformation activities within treatment systems and the ineffectiveness of traditional wastewater treatment in totally eliminating organic and inorganic carbon species are reflected in these patterns [30]. This highlights the necessity of encountering WWTPs as persistent point sources of reactive carbon in addition to nutrient sources, as these factors have a substantial impact on microbial dynamics and local and downstream biogeochemistry in aquatic systems.
Our study found a much higher DOC level in the effluent of the outdated WWTP North (29.53 mg/L) than in the effluent of the updated WWTP South (12.93 mg/L). The finding indicates that the current treatment technologies can largely remove dissolved organic matter. The change of DIC:DOC ratio from 1.92 in WWTP North to 3.29 in WWTP South and 5.89 in the river water suggests that the ratio could be used in WWTP effluent monitoring for carbon control. Higher concentrations of dissolved inorganic carbon and dissolved organic carbon in effluent water from a wastewater treatment plant suggests that the plant has inefficiencies in removing organic and inorganic carbon during treatment, which can have an impact on the quality of the receiving water bodies. The upgraded WWTP South, which is equipped with modern treatment facilities, has considerably higher DIC:DOC ratios (Figure 4), indicating better DOC removal and increased mineralization of organic carbon into its inorganic form. Also, WWTP South has a stronger relationship with increased variation in DIC and DOC concentrations, implying that its effluent properties are more variable, perhaps due to changes in treatment procedures or effluent quality. These findings highlight that modern technologies not only enhance overall water quality but also help shift the carbon composition of effluents toward more stable, less reactive forms, reducing the biogeochemical impact on downstream ecosystems.

4.2. Temporal Variation of Effluent Carbon

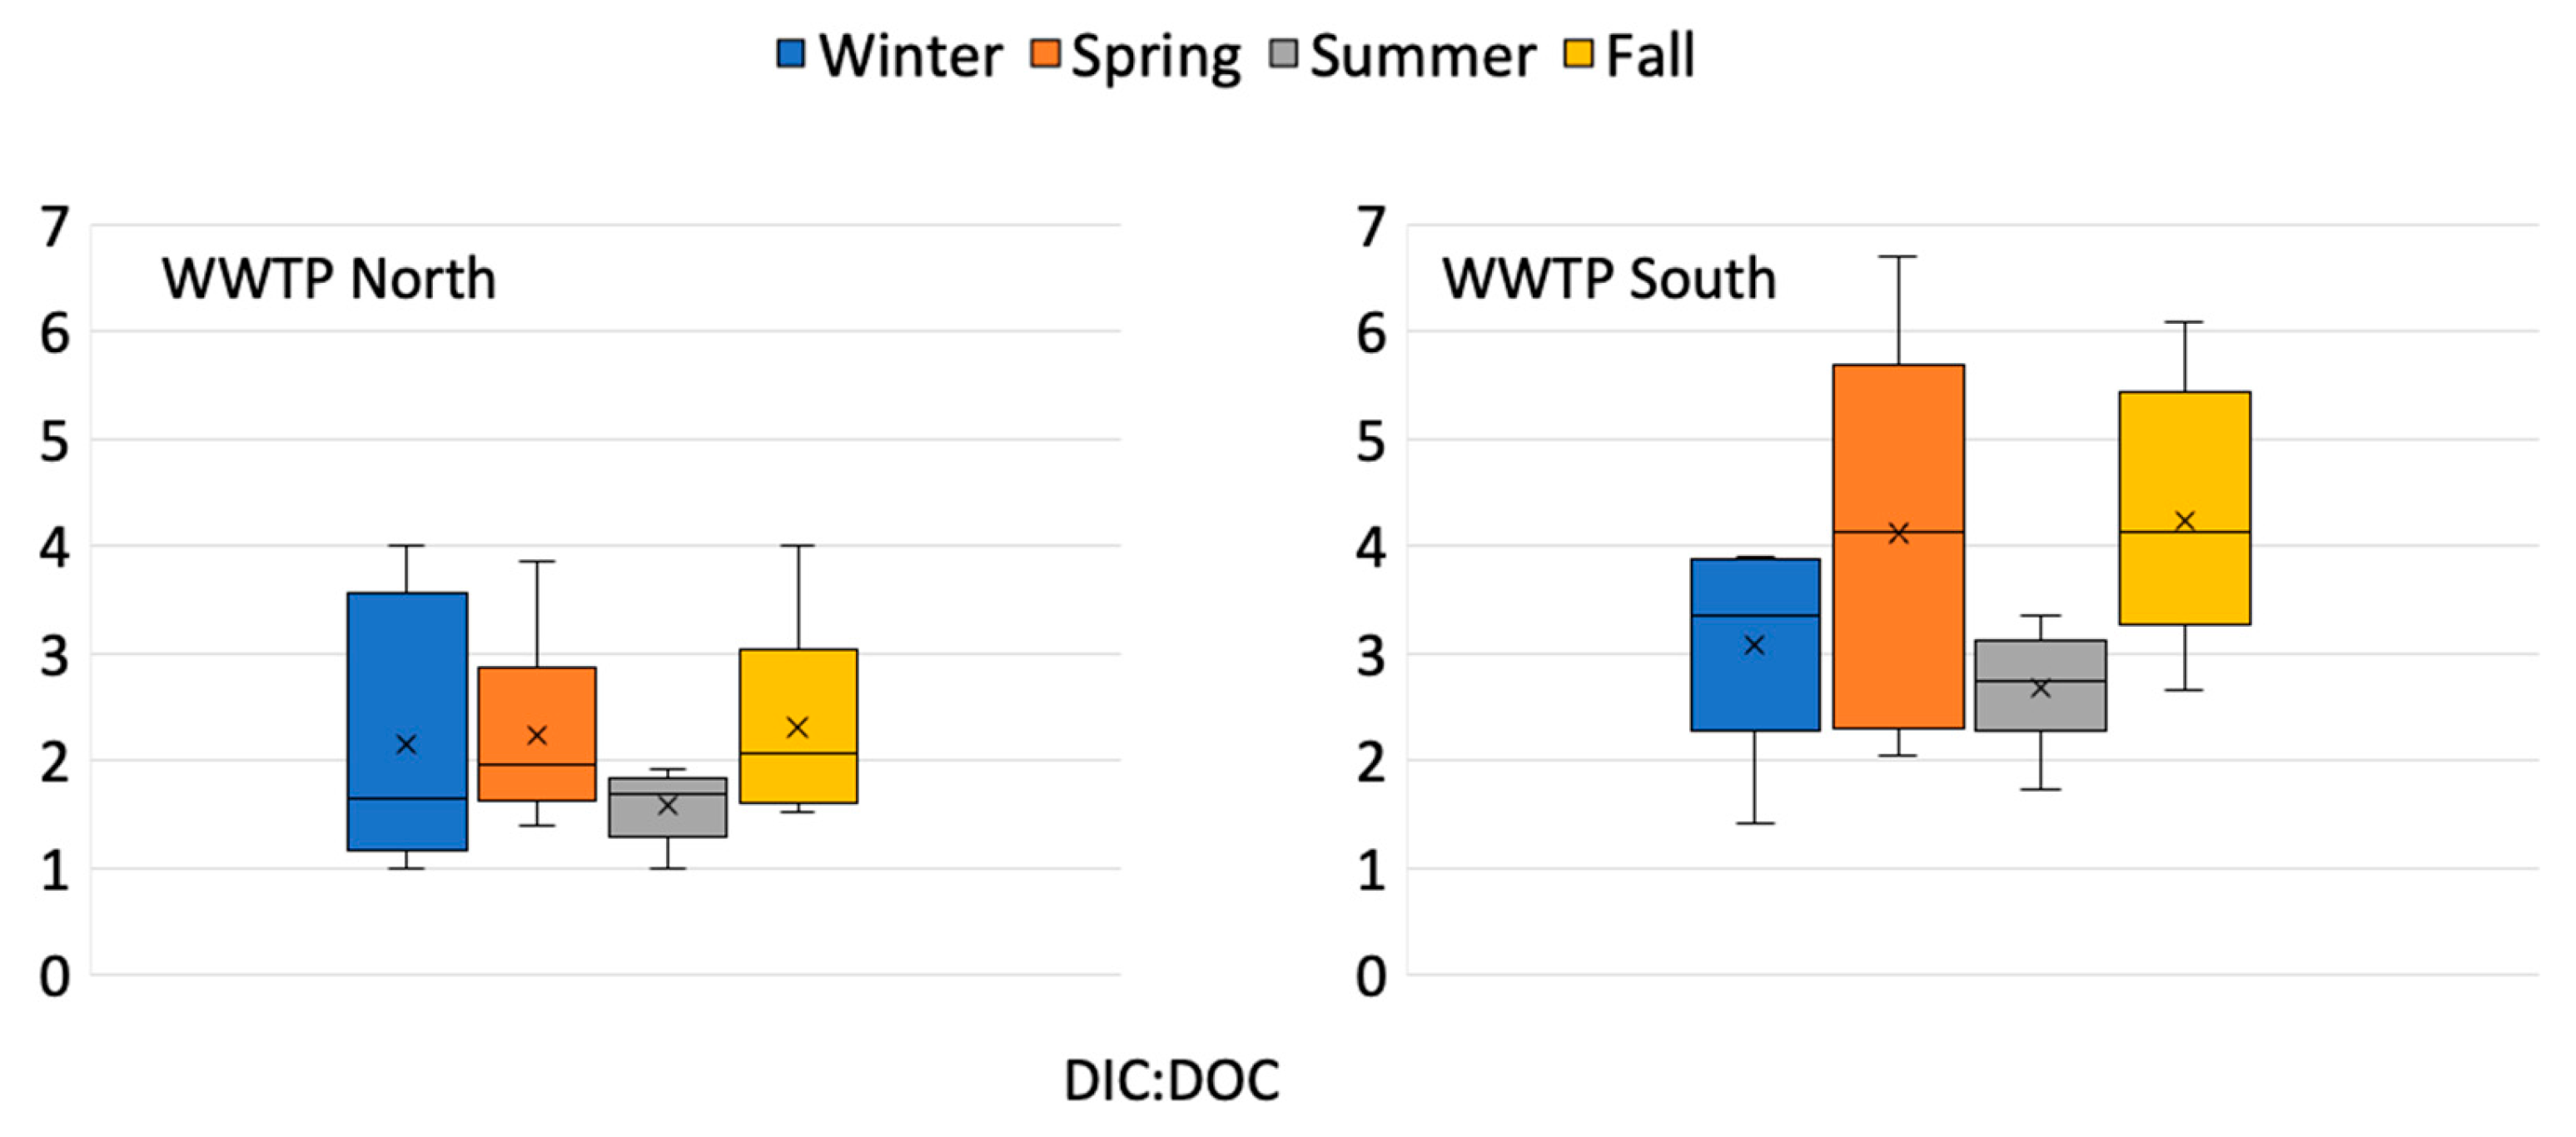
This 27-month study shows a temporal fluctuation in both DIC and DOC concentrations of WWTP effluents, resulting in a variation of DIC:DOC ratio (Figure 7). The distinct seasonality—higher in fall and spring, and lower in summer—is observed in both wastewater treatment plants. Not only is the ratio low in the summer months, but the fluctuation is also small in the summer. While these findings are interesting, we are not certain about the reason behind them. One of the reasons may be due to a proportionally lower DIC input during the dry summer months, as both treatment plants receive partial input from stormwater in the city. Louisiana experienced severe drought conditions during the summer of 2023 and 2024 [31,32]. This may also be the reason for the small variation in the DIC:DOC ratio in the summer months. In the other months DIC:DOC ratio shows a large variation, likely driven by rainfall events. Other reasons for the different DIC:DOC ratio might be dietary or due to changes in wastewater flow (for example, from heating-related water use in winter or rainfall-induced dilution in spring). Human diets shift with the seasons, with higher intakes of calories including fats, proteins, and carbohydrates in colder months [33,34] and higher intakes of plant-based meals and pharmaceuticals and personal care products (PPCP) in warmer months [35], resulting in variations in the biochemical composition of sewage. Previous research has shown that the removal efficiency of pharmaceuticals and personal care items rises during the summer, particularly in biological wastewater treatment procedures in Beijing, China [36]. Other investigations have found that nutritional and pharmaceutically active substances are removed more efficiently in the summer than in the winter [37,38]. As a result, enhanced nutrient removal efficiency during the summer months may contribute to the observed DIC and DOC fractions. Further studies are needed to discern the seasonal fluctuation in effluent DIC and DOC.
This seasonal variability in the DIC:DOC ratio may have effects on downstream ecological consequences. Particularly when DIC:DOC ratios are low, organic carbon in effluent gives heterotrophic microbial communities a labile energy source that promotes microbial respiration and depletes oxygen in receiving waters. This process can lead to hypoxic conditions, especially in stratified or low-flow situations [7]. A similar trend has also been found in other studies where WWTP effluents containing labile fractions of DOC promote microbial respiration, oxygen depletion, and enhanced CO2 outgassing along the river continuum [19].
The DOC and DIC loads from WWTP effluents are frequently co-discharged with high nutrient concentrations (e.g., nitrogen and phosphorus) [39], creating ideal conditions for eutrophication. These nutrient-carbon combinations encourage algal blooms, which can worsen water quality by reducing light penetration, changing pH, and depleting oxygen during bloom [40]. Nutrient and carbon loadings in the northern Gulf of Mexico, a coastal ecosystem primarily dominated by inflow from the Mississippi River, can alter the water quality through primary production changes, pH changes [41], and oxygen depletion, ultimately leading to the formation of seasonal hypoxic zones, also known as “dead zones” [42]. Several studies reported that hypoxia in this region is affected by the accumulation of settled organic carbon in sediments [43], and the primary production of organic matter [44,45]. One notable outcome of such processes is the formation of hypoxic or “dead zones” in downstream and coastal areas [46]. Effluent carbon load along the Mississippi River eventually adds to the Gulf of Mexico’s carbon cycling, which has consequences for coastal eutrophication and hypoxia [47,48]. Hypoxia has been observed in the northern Gulf of Mexico for decades, fueled primarily by nutrient and carbon exports from the Mississippi River Basin, including WWTP sources [44,48]. A certain impact of WWTP-derived nutrients and carbon in downstream biogeochemistry has been found as indicated by a seasonal algal bloom in May 2015 that led to a rapid spike in chl a and concomitant drops in pCO2 and nutrient concentrations, indicating greater planktonic carbon intake in the eutrophic reach [8]. This indicates that algal photosynthesis briefly dominated CO2 production from microbial respiration and organic matter breakdown. Several recent investigations have reported considerable declines in pCO2 in dammed rivers as a result of eutrophication on algal CO2 uptake [49,50]. Urban DOC input (such as WWTPs) contributes to this dynamic shift in the carbon cycle by influencing CO2 emissions and carbon quality [51].
pCO2 levels are affected by seasonal variations in the composition of dissolved inorganic carbon (DIC) and dissolved organic carbon (DOC), which are strongly related to the carbon balance in urban rivers impacted by wastewater treatment plant (WWTP) discharges. Our findings show that DIC:DOC ratios are regularly higher in the fall and spring (Figure 7), implying a huge supply of inorganic carbon throughout these seasons. Seasonal enrichment can increase CO2 supersaturation and atmospheric CO2 fluxes, especially when DIC dominates the effluent carbon pool. Previous investigations have found higher pCO2 levels downstream of WWTP discharges [18,52,53]. For example, in highly urbanized rivers in East Asia, dissolved CO2 emissions were closely related to WWTP discharges that increased DIC concentrations and water column acidity [53,54]. Similar trends have been documented in other eutrophic river systems [25,52], illustrating how effluent carbon, combined with nutrient enrichment, can shift the carbon balance downstream and influence riverine CO2 dynamics. Therefore, the variability of effluent carbon and seasonal ratios influences not only microbial respiration and eutrophication potential but also riverine carbon export to the atmosphere.

4.3. Implications of WWTP Effluent Carbon at a River Basin Scale

This study presents vital field measurements on dissolved inorganic carbon and dissolved organic carbon concentrations in municipal WWTP effluents entering the Mississippi River system. The findings can be useful for assessing carbon budgets at a large river basin scale. For instance, extending the daily carbon loads found in our study—roughly 10.07 metric tons of DIC and 3.87 metric tons of DOC from just two WWTPs—to thousands of similar facilities located throughout the Mississippi River Basin would result in an immense cumulative contribution to the dissolved carbon in the Mississippi River. Based on a recent analysis by Xu et al. (under review) [55], there are 8470 municipal WWTPs in the Mississippi River Basin, discharging a total of 21.98 billion m3 in 2022 into the river and its tributaries. Assuming that the DIC and DOC concentrations found in our study are applicable, these WWTPs would have contributed 1.03 million metric tons of DIC (or 1.03 Tg) and 0.47 million metric tons of DOC (or 0.47 Tg). These quantities of legacy carbon are gigantic, making up about 9.5% of the total annual riverine DOC (4.9 Tg) and 6.5% of the total annual riverine DIC fluxes (15.9 Tg) reported by Xu et al. (2024) [11]. Further studies are needed to quantify the actual contribution of WWTPs and their spatial distribution in the tributary basins.
This is consistent with modeling studies that demonstrate how riverine systems can change from net carbon sinks due to point sources like WWTPs [56,57]. The changes in dissolved carbon due to urbanization affect the geochemical process of C and CO2 areal fluxes, which will make it more difficult to accurately estimate CO2 from rivers around the world [51]. The exclusion of WWTPs from basin-wide carbon accounting will result in a significant underestimate of anthropogenic carbon loads [56,58]. As urban populations expand and climate pressures rise, incorporating WWTP-derived carbon into water resource management and carbon mitigation frameworks becomes not only important but also necessary for accurate assessments and long-term solutions. The current study primarily analyzed dissolved carbon contribution from WWTPs. However, other significant wastewater characterization measurements, such as COD, BOD5, TSS, TKN, TP, and TDS, were not studied. Future research can include these characteristics to better understand the whole biogeochemical process and how DOC and DIC interact with them. Incorporating these measures will also provide a more comprehensive assessment of wastewater effects on receiving waters, thereby supporting long-term sustainability objectives for water quality management, ecosystem health, and resource restoration.

5. Conclusions

Our study shows significantly higher DIC and DOC levels in the effluents from two wastewater treatment plants in south Louisiana, USA. Average DIC in the WWTP effluents was about four times that of the riverine average, while average DOC in the effluents was double that of river water. Considering the large number of wastewater treatment plants within the Mississippi River Basin, the findings imply that effluent-derived dissolved carbon is a significant source of carbon to the riverine system. These carbon inputs can also have significant downstream implications, such as increasing microbial activity, promoting algal blooms, and possibly accelerating hypoxia in the Gulf of Mexico’s coastal zone. In the Mississippi River basin, the combined impact of thousands of WWTPs can have a profound impact on carbon fluxes and water quality. Any failure to account for WWTP effluent-derived carbon from major watersheds can greatly underestimate global carbon accounting. Furthermore, the study found that both DIC and DOC loadings from the updated south WWTP were significantly lower than those from the conventional north WWTP, indicating the importance of treatment technologies in reducing cultural carbon to riverine systems. Collectively, these findings highlight the need of integrating WWTPs into river basin carbon budgets to ensure precise accounting of anthropogenic carbon emissions and develop efficient mitigation strategies. The study’s findings are the first step toward quantifying the previously overlooked carbon source. Future studies should extend monitoring to many WWTPs throughout the Mississippi River Basin in order to create a basin-wide comprehensive carbon budget which also takes seasonal and interannual variations into account.

Author Contributions

A.D.: Data curation, Formal analysis, Investigation, Methodology, Writing—original draft, Writing—review and editing. Y.X.: Conceptualization, Data curation, Funding acquisition, Methodology, Project administration, Supervision, Writing—original draft, Writing—review and editing. All authors have read and agreed to the published version of the manuscript.

Funding

This research was partially supported by a Provost’s Fund of Louisiana State University, a U.S. Geological Survey grant (AWD 004846), and a US Department of Agriculture Hatch Fund project (LAB94708).

Data Availability Statement

Data will be made available on request.

Acknowledgments

The authors are sincerely thankful to Clay Van Veckhoven, Wastewater Treatment Plant Manager at WWTP North, and Michael Lowe, Wastewater Treatment Laboratory Supervisor at WWTP South, for their generous support and assistance in collecting wastewater samples and effluent data. We also thank Lee Potter for his outstanding assistance with the field work. The authors are also grateful to the editor and four anonymous reviewers for their constructive suggestions, which have helped improve the quality of this article.

Conflicts of Interest

The authors declare no conflict of interest.

References

  1. Carey, R.O.; Migliaccio, K.W. Contribution of wastewater treatment plant effluents to nutrient dynamics in aquatic systems: A review. Environ. Manag. 2009, 44, 205–217. [Google Scholar] [CrossRef] [PubMed]
  2. Bouwman, A.F.; Van Drecht, G.; Knoop, J.M.; Beusen, A.H.W.; Meinardi, C.R. Exploring changes in river nitrogen export to the world’s oceans. Glob. Biogeochem. Cycles 2005, 19. [Google Scholar] [CrossRef]
  3. Beusen, A.H.; Bouwman, A.F.; Van Beek, L.P.; Mogollón, J.M.; Middelburg, J.J. Global riverine N and P transport to ocean increased during the 20th century despite increased retention along the aquatic continuum. Biogeosciences 2016, 13, 2441–2451. [Google Scholar] [CrossRef]
  4. Rectenwald, L.L.; Drenner, R.W. Nutrient removal from wastewater effluent using an ecological water treatment system. Environ. Sci. Technol. 2000, 34, 522–526. [Google Scholar] [CrossRef]
  5. Hendriks, A.T.; Langeveld, J.G. Rethinking wastewater treatment plant effluent standards: Nutrient reduction or nutrient control? Environ. Sci. Technol. 2017, 51, 4735–4737. [Google Scholar] [CrossRef]
  6. Eissa, A.E.; Zaki, M.M. The impact of global climatic changes on the aquatic environment. Procedia Environ. Sci. 2011, 4, 251–259. [Google Scholar] [CrossRef]
  7. Battin, T.J.; Lauerwald, R.; Bernhardt, E.S.; Bertuzzo, E.; Gener, L.G.; Hall, R.O., Jr.; Hotchkiss, E.R.; Maavara, T.; Pavelsky, T.M.; Ran, L.; et al. River ecosystem metabolism and carbon biogeochemistry in a changing world. Nature 2023, 613, 449–459. [Google Scholar] [CrossRef]
  8. Yoon, T.K.; Jin, H.; Begum, M.S.; Kang, N.; Park, J.-H. CO2 Outgassing from an Urbanized River System Fueled by Wastewater Treatment Plant Effluents. Environ. Sci. Technol. 2017, 51, 10459–10467. [Google Scholar] [CrossRef]
  9. Worrall, F.; Howden, N.; Burt, T.; Bartlett, R. The importance of sewage effluent discharge in the export of dissolved organic carbon from U.K. rivers. Hydrol. Process. 2019, 33, 1851–1864. [Google Scholar] [CrossRef]
  10. Li, M.; Peng, C.; Wang, M.; Xue, W.; Zhang, K.; Wang, K.; Shi, G.; Zhu, Q. The carbon flux of global rivers: A re-evaluation of amount and spatial patterns. Ecol. Indic. 2017, 80, 40–51. [Google Scholar] [CrossRef]
  11. Xu, Y.J.; Xu, Z.; Potter, L. Connectivity of floodplain influences riverine carbon outgassing and dissolved carbon transport. Sci. Total Environ. 2024, 924, 171604. [Google Scholar] [CrossRef]
  12. Jones, E.R.; Van Vliet, M.T.; Qadir, M.; Bierkens, M.F. Country-level and gridded estimates of wastewater production, collection, treatment and reuse. Earth Syst. Sci. Data 2021, 13, 237–254. [Google Scholar] [CrossRef]
  13. Macedo, H.; Lehner, B.; Nicell, J.; Grill, G.; Li, J.; Limtong, A.; Shakya, R. Distribution and characteristics of wastewater treatment plants within the global river network. Earth Syst. Sci. Data 2022, 14, 559–577. [Google Scholar] [CrossRef]
  14. Available online: https://www.mohurd.gov.cn/gongkai/fdzdgknr/sjfb/index.html (accessed on 1 June 2025).
  15. Available online: http://www.mwr.gov.cn/sj/tjgb/szygb/202306/t20230630_1672556.html (accessed on 1 June 2025).
  16. U.S. Environmental Protection Agency (EPA). Clean Watersheds Needs Survey (CWNS) 2022 Report. 2022. Available online: https://www.epa.gov/cwns (accessed on 29 August 2025).
  17. Reiman, J.H.; Xu, Y.J. Diel Variability of pCO2 and CO2 Outgassing from the Lower Mississippi River: Implications for Riverine CO2 Outgassing Estimation. Water 2019, 11, 43. [Google Scholar] [CrossRef]
  18. Wang, J.; Wang, X.; Liu, T.; Yuan, X.; Chen, H.; He, Y.; Wu, S.; Yuan, Z.; Li, H.; Que, Z.; et al. pCO2 and CO2 evasion from two small suburban rivers: Implications of the watershed urbanization process. Sci. Total Environ. 2021, 788, 147787. [Google Scholar] [CrossRef] [PubMed]
  19. Barnes, R.T.; Raymond, P.A. The contribution of agricultural and urban activities to inorganic carbon fluxes within temperate watersheds. Chem. Geol. 2009, 266, 318–327. [Google Scholar] [CrossRef]
  20. Cai, W.; Jiao, N. Wastewater alkalinity addition as a novel approach for ocean negative carbon emissions. Innovation 2022, 3, 100272. [Google Scholar] [CrossRef]
  21. Cao, X.; Xu, Y.J.; Long, G.; Wu, P.; Liu, Z. Dissolved carbon in effluent of wastewater treatment plants and its potential impacts in the receiving karst river. Environ. Res. 2024, 251, 118570. [Google Scholar] [CrossRef]
  22. City of Baton Rouge. (n.d.). Available online: https://city.brla.gov/press/arounddet.asp?gid=2590 (accessed on 5 August 2025).
  23. Aitkenhead-Peterson, J.A.; Steele, M.K.; Nahar, N.; Santhy, K. Dissolved organic carbon and nitrogen in urban and rural watersheds of south-central Texas: Land use and land management influences. Biogeochemistry 2009, 96, 119–129. [Google Scholar] [CrossRef]
  24. Alshboul, Z.; Encinas-Fernández, J.; Hofmann, H.; Lorke, A. Export of Dissolved Methane and Carbon Dioxide with Effluents from Municipal Wastewater Treatment Plants. Environ. Sci. Technol. 2016, 50, 5555–5563. [Google Scholar] [CrossRef]
  25. Li, Z.; Sun, Z.; Zhang, L.; Zhan, N.; Lou, C.; Lian, J. Investigation of water quality and aquatic ecological succession of a newly constructed river replenished by reclaimed water in Beijing. Heliyon 2023, 9, e17045. [Google Scholar] [CrossRef]
  26. Cao, X.; Chen, S.; Liu, Y.; Long, G.; Xu, Y.J. Domestic wastewater is an overlooked source and quantity in global river dissolved carbon. Nat. Commun. 2025, 16, 7522. [Google Scholar] [CrossRef] [PubMed]
  27. Raymond, P.; Hartmann, J.; Lauerwald, R.; Sobek, S.; McDonald, C.; Hoover, M.; Butman, D.; Striegl, R.; Mayorga, E.; Humborg, C.; et al. Global carbon dioxide emissions from inland waters. Nature 2013, 503, 355–359. [Google Scholar] [CrossRef] [PubMed]
  28. Wanninkhof, R.; Asher, W.E.; Ho, D.T.; Sweeney, C.; McGillis, W.R. Advances in Quantifying Air-Sea Gas Exchange and Environmental Forcing. Annu. Rev. Mar. Sci. 2009, 1, 213–244. [Google Scholar] [CrossRef] [PubMed]
  29. Dristi, A.; Xu, Y.J. Large Uncertainties in CO2 Water–Air Outgassing Estimation with Gas Exchange Coefficient KT for a Large Lowland River. Water 2023, 15, 14. [Google Scholar] [CrossRef]
  30. Keen, O.S.; McKay, G.; Mezyk, S.P.; Linden, K.G.; Rosario-Ortiz, F.L. Identifying the factors that influence the reactivity of effluent organic matter with hydroxyl radicals. Water Res. 2014, 50, 408–419. [Google Scholar] [CrossRef] [PubMed]
  31. Miller, P.W.; Hiatt, M. Hydrometeorological Drivers of the 2023 Louisiana Water Crisis. Geophys. Res. Lett. 2024, 5, e2024GL108545. [Google Scholar] [CrossRef]
  32. Dristi, A.; Ran, L.; Li, S.; Xu, Y.J. Carbon dioxide emission and dissolved carbon transport of a large lowland river entering the Gulf of Mexico under hydrological drought. Estuar. Coast. Shelf Sci. 2025, 324, 109465. [Google Scholar] [CrossRef]
  33. Aparicio-Ugarriza, R.; Rumi, C.; Luzardo-Socorro, R.; Mielgo-Ayuso, J.; Palacios, G.; Bibiloni, M.D.M.; González-Gross, M. Seasonal variation and diet quality among Spanish people aged over 55 years. J. Physiol. Biochem. 2018, 74, 179–188. [Google Scholar] [CrossRef]
  34. Kucukerdonmez, O.; Rakicioglu, N. The effect of seasonal variations on food consumption, dietary habits, anthropometric measurements and serum vitamin levels of university students. Prog. Nutr. 2018, 20, 165–175. [Google Scholar]
  35. Loraine, G.A.; Pettigrove, M.E. Seasonal variations in concentrations of pharmaceuticals and personal care products in drinking water and reclaimed wastewater in southern California. Environ. Sci. Technol. 2006, 40, 687–695. [Google Scholar] [CrossRef]
  36. Sui, Q.; Huang, J.; Deng, S.; Chen, W.; Yu, G. Seasonal variation in the occurrence and removal of pharmaceuticals and personal care products in different biological wastewater treatment processes. Environ. Sci. Technol. 2011, 45, 3341–3348. [Google Scholar] [CrossRef]
  37. Bayo, J.; López-Castellanos, J.; Puerta, J. Operational and environmental conditions for efficient biological nutrient removal in an urban wastewater treatment plant. CLEAN–Soil Air Water 2016, 44, 1123–1130. [Google Scholar] [CrossRef]
  38. Sari, S.; Ozdemir, G.; Yangin-Gomec, C.; Zengin, G.E.; Topuz, E.; Aydin, E.; Pehlivanoglu-Mantas, E.; Tas, D.O. Seasonal variation of diclofenac concentration and its relation with wastewater characteristics at two municipal wastewater treatment plants in Turkey. J. Hazard. Mater. 2014, 272, 155–164. [Google Scholar] [CrossRef]
  39. Devlin, M.; Brodie, J. Nutrients and eutrophication. In Marine Pollution–Monitoring, Management and Mitigation; Springer Nature Switzerland: Cham, Switzerland, 2023; pp. 75–100. [Google Scholar]
  40. Song, C.; Ballantyne, F., IV; Smith, V.H. Enhanced dissolved organic carbon production in aquatic ecosystems in response to elevated atmospheric CO2. Biogeochemistry 2014, 118, 49–60. [Google Scholar] [CrossRef]
  41. Merlivat, L.; Boutin, J.; Antoine, D.; Beaumont, L.; Golbol, M.; Vellucci, V. Increase of dissolved inorganic carbon and decrease in pH in near-surface waters in the Mediterranean Sea during the past two decades. Biogeosciences 2018, 15, 5653–5662. [Google Scholar] [CrossRef]
  42. Justić, D.; Rabalais, N.N.; Turner, R.E. Coupling between climate variability and coastal eutrophication: Evidence and outlook for the northern Gulf of Mexico. J. Sea Res. 2005, 54, 25–35. [Google Scholar] [CrossRef]
  43. Turner, R.E.; Rabalais, N.N.; Justic, D. Gulf of Mexico hypoxia: Alternate states and a legacy. Environ. Sci. Technol. 2008, 42, 2323–2327. [Google Scholar] [CrossRef] [PubMed]
  44. Rabalais, N.N.; Turner, R.E.; Wiseman, W.J., Jr. Gulf of Mexico hypoxia, aka “The dead zone”. Annu. Rev. Ecol. Syst. 2002, 33, 235–263. [Google Scholar] [CrossRef]
  45. Fry, B.; Justić, D.; Riekenberg, P.; Swenson, E.M.; Turner, R.E.; Wang, L.; Pride, L.; Rabalais, N.N.; Kurtz, J.C.; Lehrter, J.C.; et al. Carbon dynamics on the Louisiana continental shelf and cross-shelf feeding of hypoxia. Estuaries Coasts 2015, 38, 703–721. [Google Scholar] [CrossRef]
  46. Trefry, J.H.; Metz, S.; Nelsen, T.A.; Trocine, R.P.; Eadie, B.J. Transport of particulate organic carbon by the Mississippi River and its fate in the Gulf of Mexico. Estuaries 1994, 17, 839–849. [Google Scholar] [CrossRef]
  47. Bauer, J.E.; Cai, W.J.; Raymond, P.A.; Bianchi, T.S.; Hopkinson, C.S.; Regnier, P.A. The changing carbon cycle of the coastal ocean. Nature 2013, 504, 61–70. [Google Scholar] [CrossRef]
  48. Cai, W.-J. Estuarine and coastal ocean carbon paradox: CO2 sinks or sites of terrestrial carbon incineration? Annu. Rev. Mar. Sci. 2011, 3, 123–145. [Google Scholar] [CrossRef] [PubMed]
  49. Crawford, J.T.; Loken, L.C.; Stanley, E.H.; Stets, E.G.; Dornblaser, M.M.; Striegl, R.G. Basin scale controls on CO2 and CH4 emissions from the Upper Mississippi River. Geophys. Res. Lett. 2016, 43, 1973–1979. [Google Scholar] [CrossRef]
  50. Zeng, F.-W.; Masiello, C.A.; Hockaday, W.C. Controls on the origin and cycling of riverine dissolved inorganic carbon in the Brazos River, Texas. Biogeochemistry 2011, 104, 275–291. [Google Scholar] [CrossRef]
  51. Li, S.; Luo, J.; Wu, D.; Jun Xu, Y. Carbon and nutrients as indictors of daily fluctuations of pCO2 and CO2 flux in a river draining a rapidly urbanizing area. Ecol. Indic. 2020, 109, 105821. [Google Scholar] [CrossRef]
  52. Reiman, J.; Xu, Y.J. Dissolved carbon export and CO2 outgassing from the lower Mississippi River–Implications of future river carbon fluxes. J. Hydrol. 2019, 578, 124093. [Google Scholar] [CrossRef]
  53. Yang, X.; Xue, L.; Li, Y.; Han, P.; Liu, X.; Zhang, L.; Cai, W.J. Treated wastewater changes the export of dissolved inorganic carbon and its isotopic composition and leads to acidification in coastal oceans. Environ. Sci. Technol. 2018, 52, 5590–5599. [Google Scholar] [CrossRef]
  54. Liu, X.; Yang, X.; Li, Y.; Zang, H.; Zhang, L. Variations in dissolved inorganic carbon species in effluents from large-scale municipal wastewater treatment plants (Qingdao, China) and their potential impacts on coastal acidification. Environ. Sci. Pollut. Res. 2019, 26, 15019–15027. [Google Scholar] [CrossRef]
  55. Xu, Y.J.; Cao, X.; Zhou, W. (under review) Effluent contribution of municipal wastewater treatment plants to the Mississippi River across its tributary basins. Water Res. Under Rev. 2025, under review. [Google Scholar]
  56. Drake, T.; Raymond, P.; Spencer, R. Terrestrial carbon inputs to inland waters: A current synthesis of estimates and uncertainty. Limnol. Oceanogr. Lett. 2018, 3, 132–142. [Google Scholar] [CrossRef]
  57. Gu, C.; Waldron, S.; Bass, A. Anthropogenic land use and urbanization alter the dynamics and increase the export of dissolved carbon in an urbanized river systems. Sci. Total Environ. 2022, 846, 157436. [Google Scholar] [CrossRef]
  58. Raymond, P.; Bauer, J. Use of 14C and 13C natural abundances for evaluating riverine, estuarine, and coastal DOC and POC sources and cycling: A review and synthesis. Org. Geochem. 2001, 32, 469–485. [Google Scholar] [CrossRef]
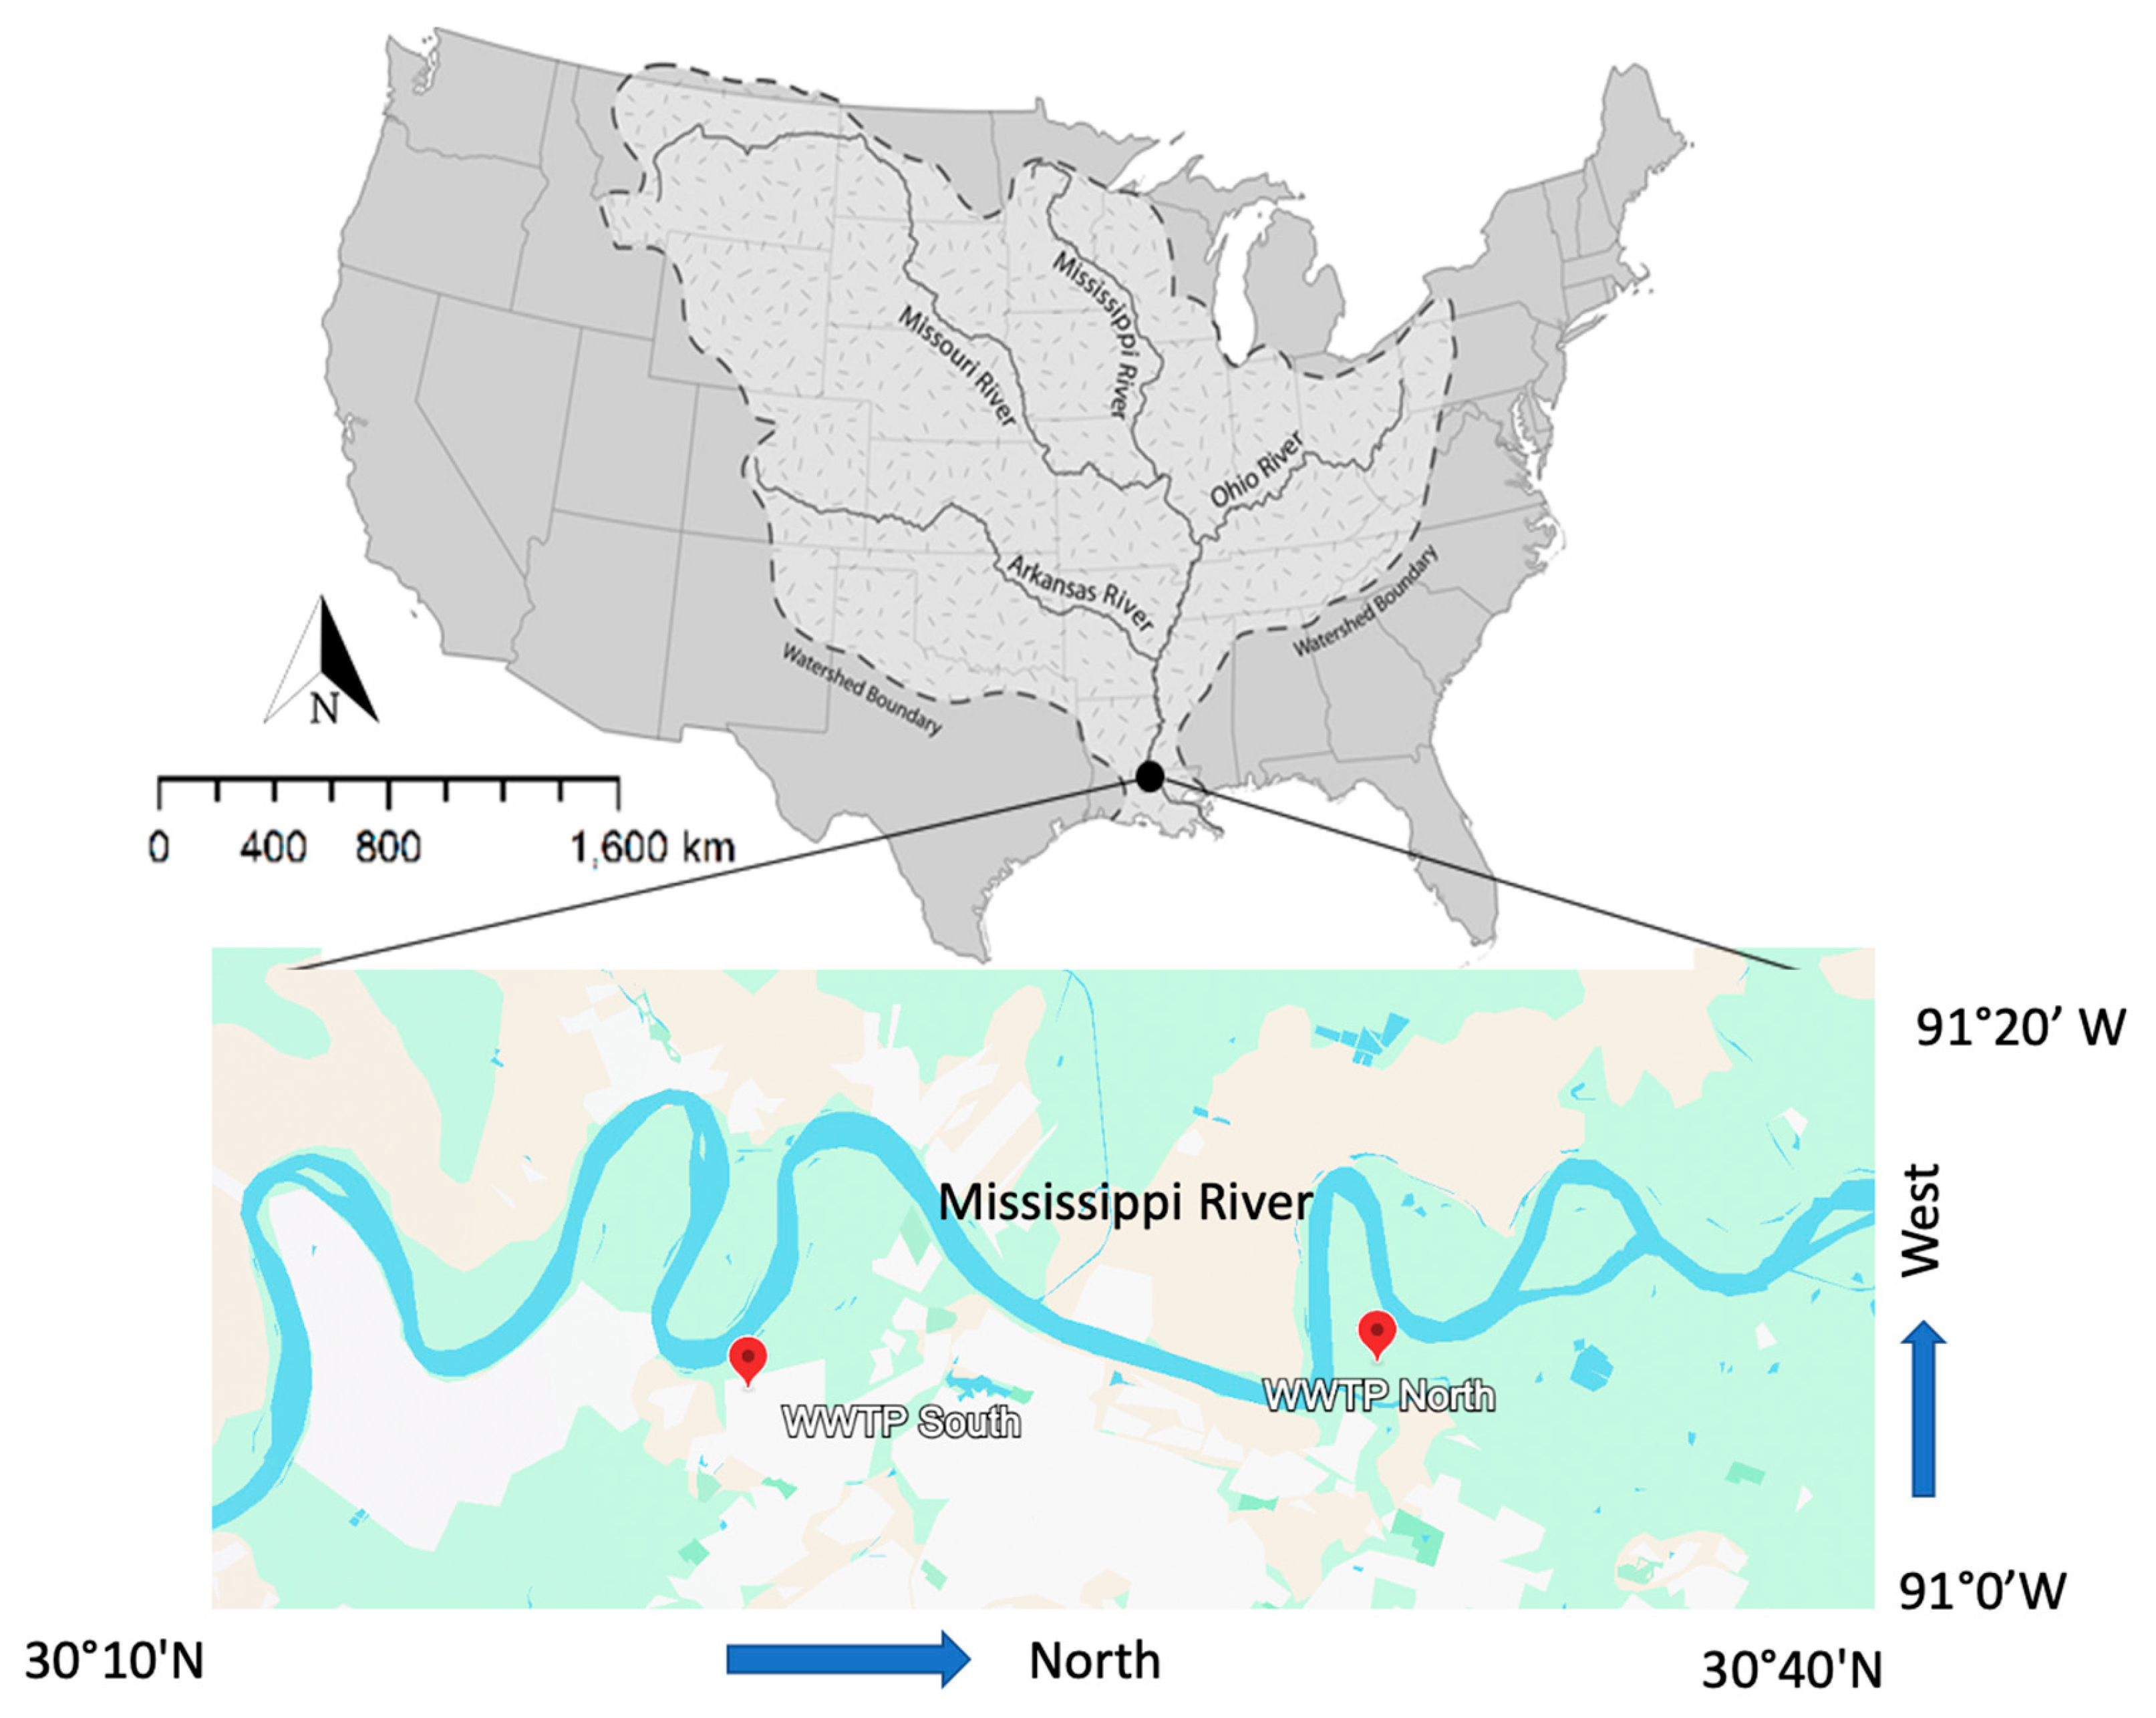
Figure 1. Geographical locations of two study wastewater treatment plants: WWTP North (30°29′02.6″ N, 91°10′09.6″ W) and WWTP South (30°20′23.4″ N, 91°11′20.3″ W) on the floodplain of the Mississippi River at Baton Rouge, LA, USA.
Water 17 02589 g001
Figure 2. Trends of physiochemical parameters in the final effluents of two wastewater treatment plants (North and South) in Baton Rouge, LA, USA, including water temperature (Temp), turbidity (Turb), pH, dissolved oxygen concentration (DO), Chlorophyll-a (Chl a), and Colored Dissolved Organic Matter (cDOM).
Water 17 02589 g002
Figure 3. Monthly concentrations of dissolved inorganic carbon (DIC) and dissolved organic carbon (DOC) in mg/L of two treatment plants in Baton Rouge, LA, USA (WWTP North and WWTP South) from September 2022–November 2024.
Water 17 02589 g003
Figure 4. Ratios of dissolved inorganic carbon (DIC) and dissolved organic carbon (DOC) of two treatment plants in Baton Rouge, LA, USA (WWTP North and WWTP South).
Water 17 02589 g004
Figure 5. Monthly dissolved inorganic and dissolved organic carbon loads in metric tons, calculated from monthly effluent volume and DOC/DIC concentrations from two wastewater treatment plants in Baton Rouge, LA, USA (WWTP North and WWTP South) during September 2022 and November 2024.
Water 17 02589 g005
Figure 6. Relations of DIC and DOC with DO, turbidity, Chl a, and cDOM of effluents from two wastewater treatment plants in Baton Rouge, LA, USA. The blue color represents WWTP North, and the orange color represents WWTP South.
Water 17 02589 g006
Figure 7. Means and variations in DIC:DOC ratios in effluent waters from WWTP North and WWTP South in Baton Rouge, LA, USA.
Water 17 02589 g007
Table 1. Pearson correlation coefficients for the variables from two wastewater treatment plants in Baton Rouge, LA, USA (WWTP North and WWTP South), including Chlorophyll-a (Chl a), colored dissolved organic matter (cDOM), ammonium (NH4), turbidity (Turb), water temperature (Temp), dissolved oxygen (DO), pH, dissolved inorganic carbon (DIC), and dissolved organic carbon (DOC). The Asterix sign (*) indicates a statistical significance at p < 0.05.
WWTPNorth
Chl acDOMNH4TurbTempDOpHDICDOC
Chl a1
cDOM0.361
NH40.360.99 *1
Turb0.25−0.28−0.271
Temp−0.24−0.09−0.110.231
DO0.200.350.33−0.43 *−0.371
pH0.250.310.29−0.04−0.01−0.151
DIC0.260.67 *0.63 *−0.25−0.06−0.020.46 *1
DOC0.200.38 *0.370.140−0.100.51 *0.361
WWTPSouth
Chl acDOMNH4TurbTempDOpHDICDOC
Chl a1
cDOM0.53 *1
NH40.220.64 *1
Turb0.72 *0.220.131
Temp−0.160.290.26−0.311
DO0.05−0.18−0.160.07−0.59 *1
pH−0.140.14−0.06−0.25−0.080.091
DIC−0.310.20−0.01−0.310.120.110.211
DOC0.280.250.110.48 *−0.300.070.220.141
Table 2. Concentrations of dissolved inorganic carbon (DIC) and dissolved organic carbon (DOC) in mg/L and mass load of dissolved carbon (DC) in metric ton (MT) from two wastewater treatment plants in Baton Rouge, LA, USA: WWTP North and WWTP South.
Average DIC (mg/L)Average DOC (mg/L)Average Effluent (m3/day)DIC Load (MT/day)DOC Load (MT/day)Total DC (MT/day)
WWTP North56.80 ± 16.5129.52 ± 8.686.74 × 104 3.801.955.75
WWTP South42.64 ± 10.5012.93 ± 3.6814.85 × 104 6.271.928.19
Total10.073.8713.94
Table 3. Comparison of monthly average dissolved inorganic carbon (DIC) and dissolved organic carbon (DOC) concentrations, and DIC:DOC ratio in effluents of two wastewater treatment plants (WWTP North and WWTP South) and Lower Mississippi River (LMR) water at Baton Rouge, LA, USA. The monthly data covered the period from September 2022 to November 2024 *.
SitesAverage DIC
mg/L
Average DOC
mg/L
DIC:DOC
WWTP North56.80 ± 16.51 a29.52 ± 8.64 a1.92 a
WWTP South42.64 ± 10.50 b12.93 ± 3.68 b3.29 b
LMR28.92 ± 4.91 c5.47 ± 2.35 c 5.89 c
Note: * Values behind ± denote standard deviations; means followed by the same letter within a column are not significantly different at the 0.01 level.
Disclaimer/Publisher’s Note: The statements, opinions and data contained in all publications are solely those of the individual author(s) and contributor(s) and not of MDPI and/or the editor(s). MDPI and/or the editor(s) disclaim responsibility for any injury to people or property resulting from any ideas, methods, instructions or products referred to in the content.