Article

Methane Emissions from Wetlands on the Tibetan Plateau over the Past 40 Years

School of Civil Engineering, University of Science and Technology Liaoning, Anshan 114051, China
*
Author to whom correspondence should be addressed.
Water 2025, 17(16), 2491; https://doi.org/10.3390/w17162491
Submission received: 21 July 2025 / Revised: 13 August 2025 / Accepted: 14 August 2025 / Published: 21 August 2025
(This article belongs to the Section Water and Climate Change)

Abstract

Methane (CH4) emissions from the wetlands of the Tibetan Plateau (TP) remain poorly quantified, particularly regarding their historical dynamics, spatial heterogeneity, and response to climate change. This study provides the high-resolution, observation-driven reconstruction of TP wetland CH4 emissions over the past four decades, integrating a machine learning model with 108 flux measurements from 67 sites. This unique combination of field-based data and fine-scale mapping enables unprecedented accuracy in quantifying both emission intensity and long-term trends. We show that current TP wetlands emit 5.87 ± 1.43 g CH4 m−2 yr−1, totaling 97.3 Gg CH4 yr−1, equivalent to 7.8% of East Asia’s annual wetland emissions. Despite a climate-driven increase in per-unit-area CH4 fluxes, a 19.8% (8432.9 km2) loss of wetland area since the 1980s has reduced total emissions by 15%, counteracting the enhancement from warming and moisture increases. Our comparative analysis demonstrates that existing land surface models (LSMs) substantially underestimate TP wetland CH4 emissions, largely due to the inadequate representation of TP wetlands and their dynamics. Projections under future climate scenarios indicate a potential 8.5–21.2% increase in emissions by 2100, underscoring the importance of integrating high-quality, region-specific observational datasets into Earth system models. By bridging the gap between field observations and large-scale modeling, this work advances understanding of alpine wetland–climate feedback, and provides a robust foundation for improving regional carbon budget assessments in one of the most climate-sensitive regions on Earth.

1. Introduction

Wetlands are a critical component of the global methane (CH4) cycle, acting as significant sources of potent greenhouse gas. According to the Intergovernmental Panel on Climate Change (IPCC) Sixth Assessment Report, CH4 ranks as the second-largest contributor to global warming after carbon dioxide (CO2). Current and projected increases in atmospheric CH4 concentrations are largely attributed to emissions from wetlands, which play a pivotal role in driving climate feedback processes [1,2,3]. Notably, climate change has induced substantial shifts in wetland extent and function globally, with studies forecasting that expansion of northern wetlands and temperature-driven increases in tropical wetland CH4 emissions will dominate global CH4 emission trends by the end of the 21st century [4].
However, wetlands exhibit pronounced spatial heterogeneity in both their distribution and CH4 emission intensity, leading to highly variable regional contributions to global greenhouse gas budgets. This heterogeneity stems from differences in local hydrology, vegetation, soil characteristics, and climatic conditions, which collectively influence CH4 production, oxidation, and release processes [5]. Therefore, understanding wetland CH4 emissions at regional scales, particularly under future climate change scenarios, is essential for accurately predicting global CH4 dynamics and informing targeted mitigation strategies.
The Tibetan Plateau (TP) represents a unique and critical region within the global carbon cycle. As the “Third Pole,” it hosts extensive wetland ecosystems that store more than 20% of the world’s soil organic carbon within its wetlands, making it a significant natural source of atmospheric CH4 [6,7,8]. The region’s wetlands are highly sensitive to climatic variations due to their high altitude, cold climate, and distinct hydrological conditions. Consequently, changes in wetland CH4 emissions from the TP have important feedback effects on regional and even global climate systems [9,10].
Despite the recognized importance of the TP wetlands, current estimates of their CH4 emissions are highly uncertain, particularly over long temporal scales. Considerable discrepancies exist between observational studies and model-based simulations. For example, point-scale field measurements report thaw-season CH4 emission intensities around 15.9 g CH4 m−2 yr−1, whereas land surface models (LSMs) such as those used by Li et al. (2019) simulate much lower values (~2.56 g CH4 m−2 yr−1) [11,12]. These disparities highlight challenges in model parameterization and representation of complex wetland processes under the unique environmental conditions of the plateau. Reducing such uncertainties is critical for the development of effective wetland ecosystem management and carbon mitigation policies [13,14,15].
Two main factors drive these uncertainties. First, while LSMs effectively simulate wetland CH4 fluxes at global scales by modeling production and transport processes, they often struggle to capture the regional sensitivity of emissions to climatic drivers such as temperature and precipitation, especially in regions with sparse observational data and complex terrain like the TP [16,17,18,19,20,21,22]. The coarse spatial resolution of global models further limits their applicability for regional assessments. Second, inadequate and inconsistent wetland distribution data exacerbate estimation errors. The TP’s diverse terrain and vegetation types result in strong spatial variability of wetland characteristics and CH4 emissions [23,24]. However, variations in wetland definitions, classification methods, and mapping efforts have led to inconsistent spatial representations, complicating emission calculations and comparisons across studies [25,26].
To address these challenges, this study compiles a comprehensive dataset of 96 published CH4 flux measurement sites on the TP (Figure 1), and applies an observation-driven machine learning approach to estimate the spatial and temporal patterns of wetland CH4 emissions. Importantly, we manually delineated high-resolution (30 m) wetland distribution maps across five historical periods within the past 35 years to reduce uncertainties associated with wetland extent and dynamics. By comparing our results with outputs from existing LSMs, we further evaluated their performance, and highlight the need for model refinement based on empirical observations. This integrative approach aims to enhance understanding of the spatial heterogeneity and controlling factors of CH4 emissions on the plateau, providing a scientific foundation for improving regional carbon cycle modeling and supporting wetland conservation and climate mitigation efforts.
In this study, we compiled 96 published data points of CH4 emissions from TP wetlands to better characterize their spatial distribution patterns. Our objectives were to (1) estimate the current spatial distribution and historical temporal dynamics of CH4 emissions based on long-term, high-resolution maps of TP wetlands; (2) determine the relative importance of hydrological and environmental variables controlling wetland CH4 emissions on the plateau; and (3) simulate the impacts of future global change on CH4 emission intensity, evaluate the performance of existing terrestrial ecosystem models in capturing TP wetland CH4 emissions, and provide scientific guidance for improving the carbon emission modeling of TP wetlands in future research.

2. Materials and Methods

2.1. Study Area

The study area is located on the Tibetan Plateau in China (26–39.8° N, 74.6–104.7° E) (Figure 1), covering ~2.6 million km2 and encompassing Tibet, Qinghai, as well as parts of Yunnan and Sichuan provinces. The TP serves as a critical ecological barrier in Asia and harbors China’s largest distribution of marsh wetlands, accounting for over 50% of the country’s total marsh wetland area. It preserves numerous irreplaceable and pristine wetland ecosystems.

2.2. Inventory Data

Here, we define wetlands as marshes and swamps dominated by herbaceous plants and trees, subject to permanent or seasonal inundation. We obtained the literature from the Web of Science using the keywords “Tibetan Plateau”, “Tibet”, “Qinghai “, “Wetland”, “Water body”, “Marsh”, “Greenhouse gas”, and “Methane (CH4)”. Finally, we compiled a database of CH4 flux measurements for the TP during the thawing period (May to October, 184 days) [27] by gathering information from 96 published studies. The database encompasses 108 CH4 emission estimates from 67 monitoring sites (Figure 1), with an average CH4 emission flux of 6.21 ± 6.22 g CH4 m−2 yr−1. The CH4 flux data were screened based on the following criteria: (a) results obtained using both flux station data and in situ sampling data, (b) multiple measurements at the same site averaged for the thawing period within the same year, and (c) wetland types associated with all sites must align with our definition of wetlands.

2.3. Multisource Remote Sensing Dataset

The limited clarity on the global distribution of wetlands and other inland water bodies remains a major source of uncertainty in estimating CH4 emissions from aquatic systems [28]. On the TP, this challenge is exacerbated by the region’s harsh terrain and extreme environmental conditions, which hinder accurate wetland identification. To address this, we adopted the wetland distribution datasets developed by Niu et al. (2012) and Lang et al. (2021) [26,29], derived from multiple sources of remote sensing data. These datasets integrate Landsat multispectral imagery at 30 m resolution, MODIS time-series data, and high-resolution Google Earth images. Using visual interpretation at 30 m resolution, we manually delineated wetland boundaries for five historical periods (1980s, 1990s, 2000s, 2010s, and 2015s), achieving a mapping accuracy of up to 82.9%. In total, over 8000 wetlands were mapped, primarily concentrated in the central and northern parts of inland basins (19,219.2 km2) and the central and western portions of peripheral basins (15,934.8 km2). Over the past four decades, the TP has experienced an overall wetland area loss of ~20%, driven by the combined impacts of climate change and human activities [29].
To upscale in situ CH4 flux measurements to the plateau scale, we incorporated a comprehensive set of potential controlling variables. These included thermal conditions (annual mean temperature), hydrological factors (annual precipitation, wetland area), external carbon sources (soil organic carbon [SOC], gross primary production [GPP]), and additional environmental parameters such as elevation, exchangeable cations (EC), water pH, permafrost active layer thickness (ALT), and the biogeography of fungal and bacterial biomass carbon in topsoil (FBC) [30]. These factors were selected to account for the fundamental role of anaerobic microbes in producing CH4 through the decomposition of organic carbon, a process strongly modulated by external environmental conditions.
For model prediction, climate datasets including temperature, precipitation, and GPP were obtained from the CRU TS 3.20 monthly dataset at a spatial resolution of 0.5° × 0.5° [31]. SOC, EC, and pH data were extracted from the SoilGrids dataset at 250 m resolution [32]. ALT data were obtained from the TP frozen ground change dataset (1961–2020) [33], and elevation data were derived from the Shuttle Radar Topography Mission (SRTM) Digital Elevation Model (DEM).

2.4. Land Surface Models

We used the wetland CH4 emissions from 9 LSMs (Table 1) run under a common protocol with a spin-up period of 30 years (1901–1930) to compare with our observation-based estimates of TP wetlands CH4 emissions. These models considered a series of processes in CH4 production, oxidation, transport, and environmental factors in estimating CH4 emissions [24,34,35], and simulated monthly CH4 emissions from global wetlands since 2000 under the forcing of the climate field reconstructed by CRU-JRA [36]. Additionally, these models all employed the same WAD2M wetland distribution data [37] to constrain wetland distribution. The WAD2M wetland dataset, based on microwave remote sensing, extended existing static wetland datasets and provided monthly-scale data on global wetland area fractions from 2000 to 2017. Importantly, this dataset excluded all water types (including lakes, rivers, and rice paddies) other than wetlands, maintaining a high level of consistency with our definition of wetland distribution on the TP and reducing uncertainty in wetland CH4 emissions between models and observations due to differences in wetland definitions.

3. Method

3.1. Upscaling of In Situ to Plateau via Machine Learning

In order to effectively estimate TP wetlands CH4 emissions, we initially employed machine learning methods to scale down in situ monitoring data on CH4 emission intensity to the entire plateau scale. Subsequently, we estimated five periods of CH4 emission intensity distribution maps for plateau wetlands over the past 35 years at 10-year intervals. Utilizing manually interpreted 30 m historical wetland distribution maps, we calculated the spatial distribution and changes in CH4 emissions from plateau wetlands, along with their dominant factors.
Specifically, we employed the Random Forest algorithm (RF) to estimate TP wetland CH4 emissions during five historical periods based on observed data at in situ measurement samples. RF is a machine learning method based on ensemble decision trees, widely used for its high precision. It creates a set of decision trees (in this study, N = 1000) from randomly selected subsets of input data and predicts the final result based on the majority vote of all these trees. Seven variables, including temperature, moisture, and environmental factors, were used to estimate wetland CH4 emissions. By ranking the importance of variables, we quantified the contribution of each variable to CH4 emissions. The ranking of variable importance was determined by calculating the change in model accuracy when each variable was randomly permuted in the RF model. This approach allows us to better understand the non-linear relationships between predictive variables and their impact on changes in wetland CH4 emissions.

3.2. Data Preprocessing and Model Validation

To enhance the accuracy and robustness of CH4 emission estimates from plateau wetlands, all input variables were first normalized to eliminate the influence of differing units across datasets. Subsequently, all variables were resampled to a uniform spatial resolution of 0.1° using bilinear interpolation, while maintaining consistent temporal scales. To eliminate the potential for multicollinearity among variables that could lead to model estimation errors, we selected only variables with low variance inflation factors (VIF < 10) for prediction. During model development, 10-fold cross-validation was applied, dividing the sample data into ten subsets to evaluate the model’s generalization capability across different data splits. It was important to note that training and validation sets remained strictly independent in each fold to ensure the robustness of the validation results.

3.3. Model Data Comparison

Additionally, we compared the plateau wetland CH4 emissions simulated by 9 LSMs. By calculating the partial correlation between CH4 emissions flux and temperature and precipitation, we quantified the sensitivity of wetland CH4 emissions to climate among different models, simulating the differences in their respective responses to climate change, and analyzing model uncertainties.
To quantify the effect of climate change on the control of observed and modeled wetland CH4 emissions, we assessed the sensitivity of CH4 emission fluxes from TP wetlands to climate change using annual mean temperature and annual precipitation data from the CRU dataset [47]. Given the interactive nature of the various driving factors influencing CH4 emissions, we employed partial derivatives derived from multivariate linear regression to simulate how CH4 emission fluxes respond to temperature and precipitation, thereby isolating the intrinsic effects of individual driving factors (with wetland CH4 emissions serving as the independent variable). Specifically, we first standardized the distribution of CH4 emission fluxes simulated by land surface models (LSMs) in 2015. We then established a least squares regression model for CH4 emission fluxes at each wetland site, paired with corresponding temperature and precipitation data. Finally, by calculating the partial derivatives of CH4 emission fluxes for temperature and precipitation separately, we determined the changes in wetland CH4 emission fluxes corresponding to each 1 °C increase in temperature or 1 mm increase in precipitation. Using the same approach, we also calculated the sensitivity at the sample scale for comparison.

4. Results and Discussion

4.1. Developing a Data-Driven Approach to Estimate Plateau-Scale CH4 Emission

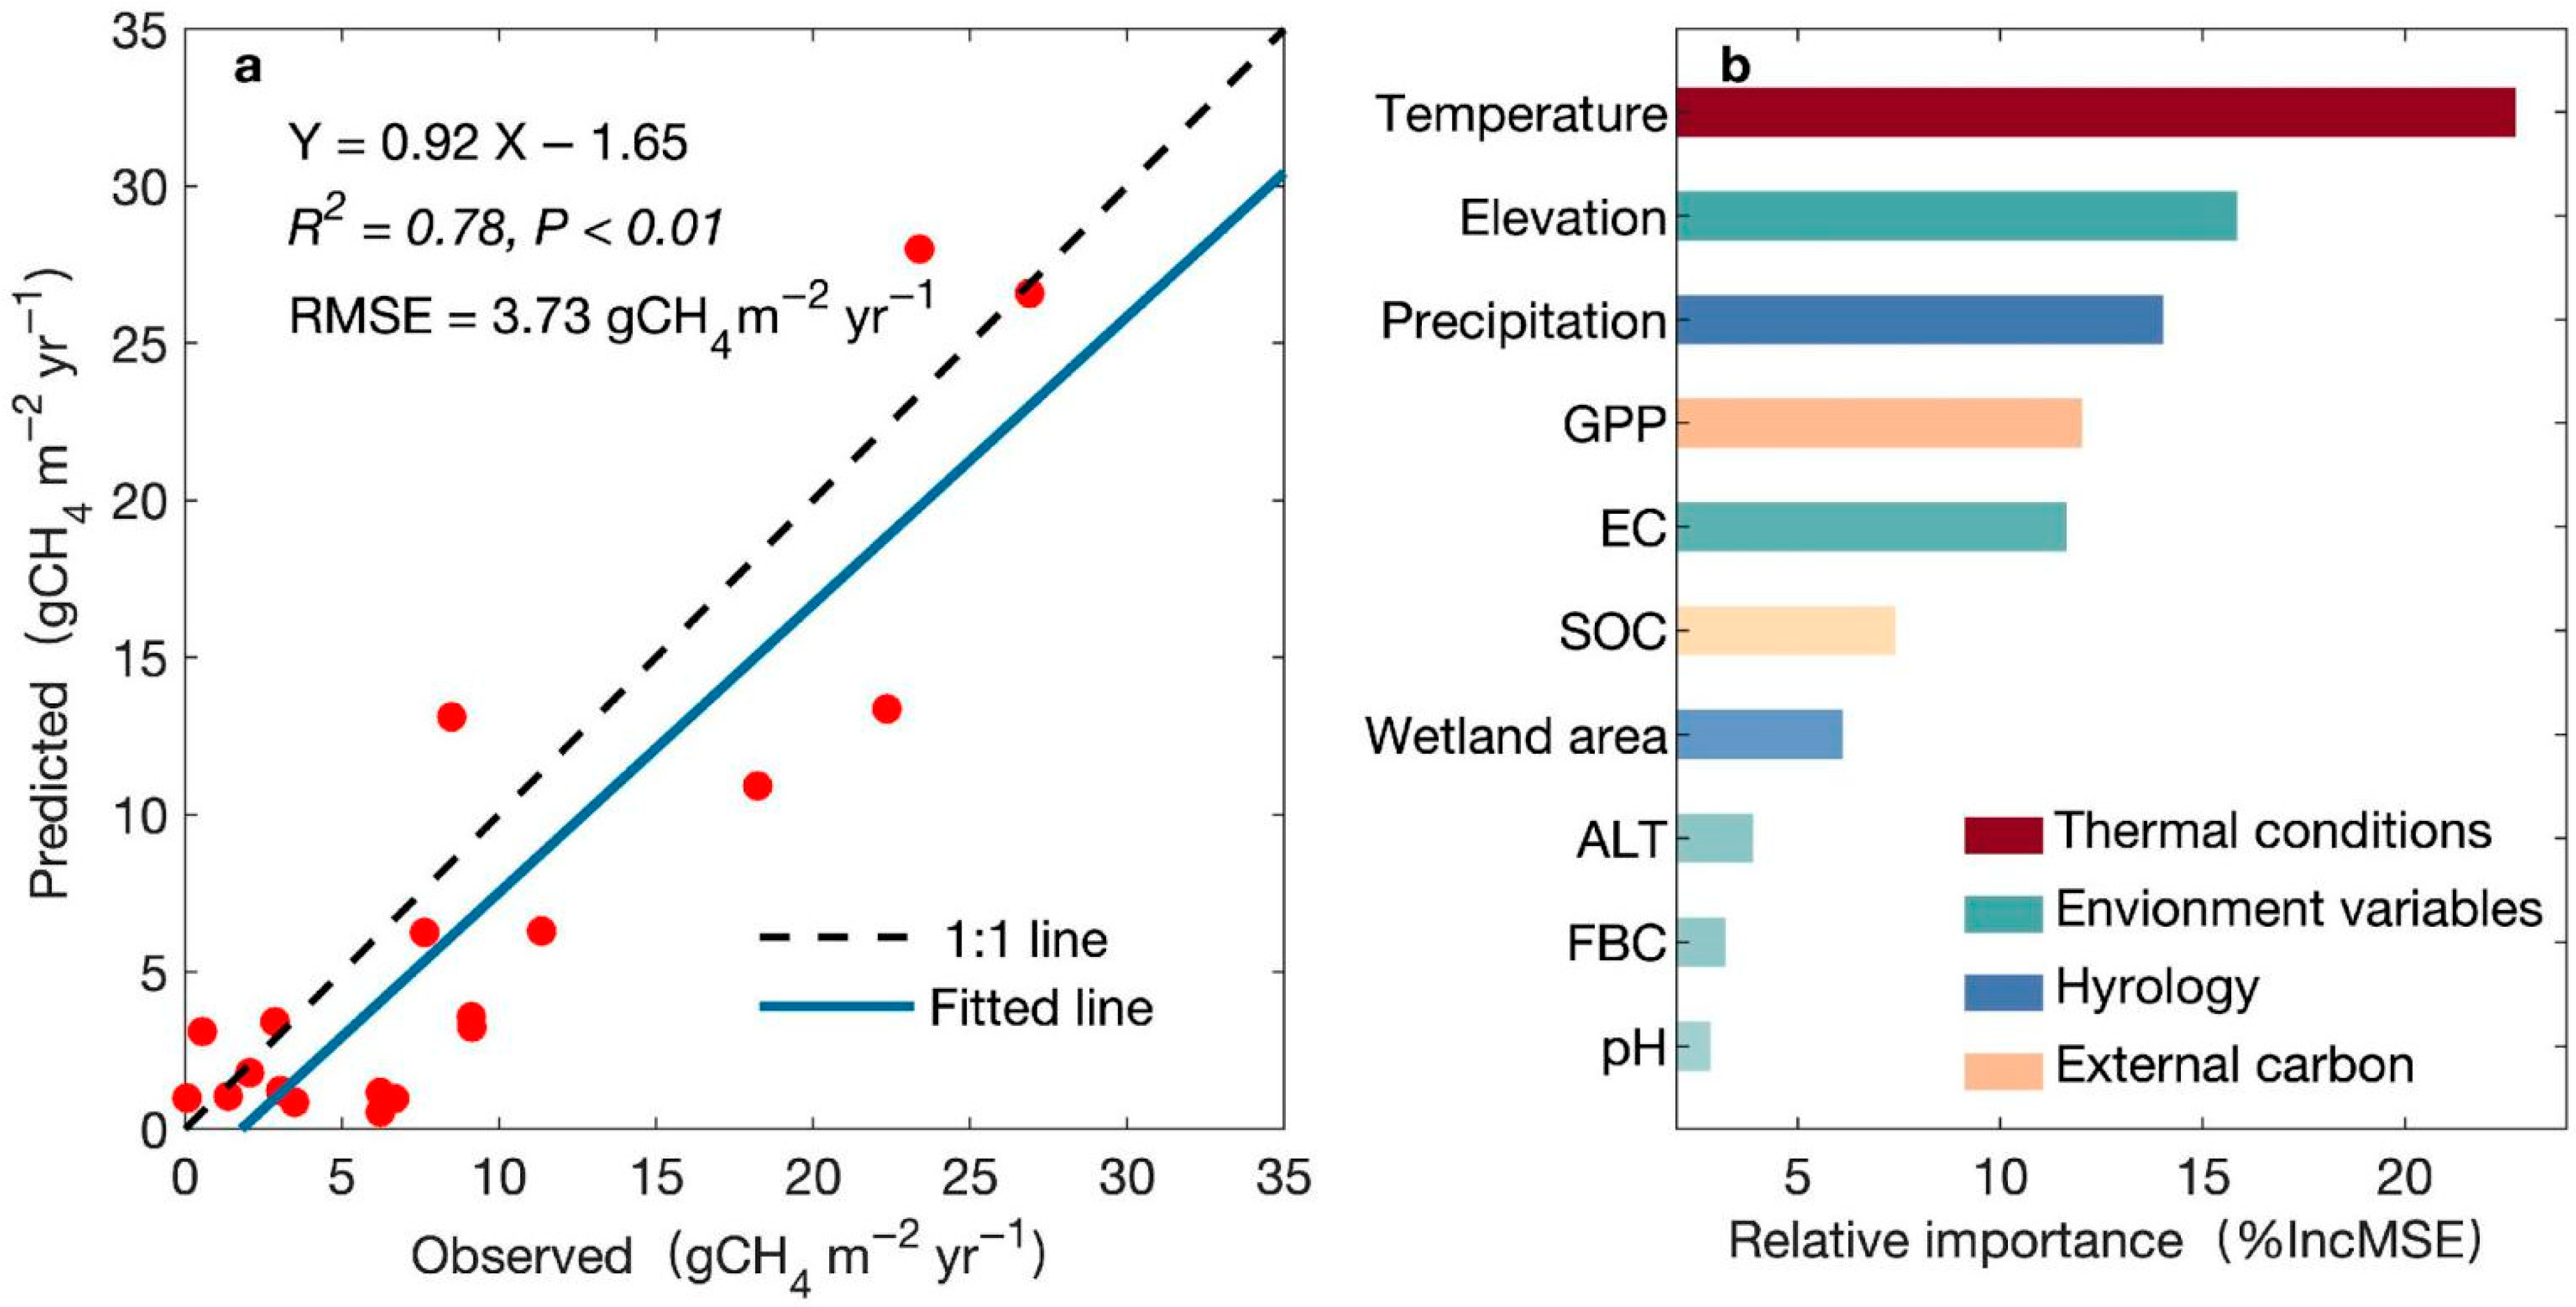
We assessed the spatial distribution and temporal variation of CH4 emissions from TP wetlands by compiling a comprehensive database of CH4 flux measurements and upscaling 108 observations from 67 sampling sites to the plateau scale using RF model. To minimize uncertainty caused by seasonal variability, our analysis focused on average wetland CH4 emissions during the thawing period, when fluxes are most representative of annual dynamics. Model validation using 20% of the in situ dataset (N = 24) demonstrated robust performance, explaining 78% of the variance in wetland CH4 fluxes (Figure 2a) with a root mean square error (RMSE) of 2.35 g CH4 m−2 yr−1.
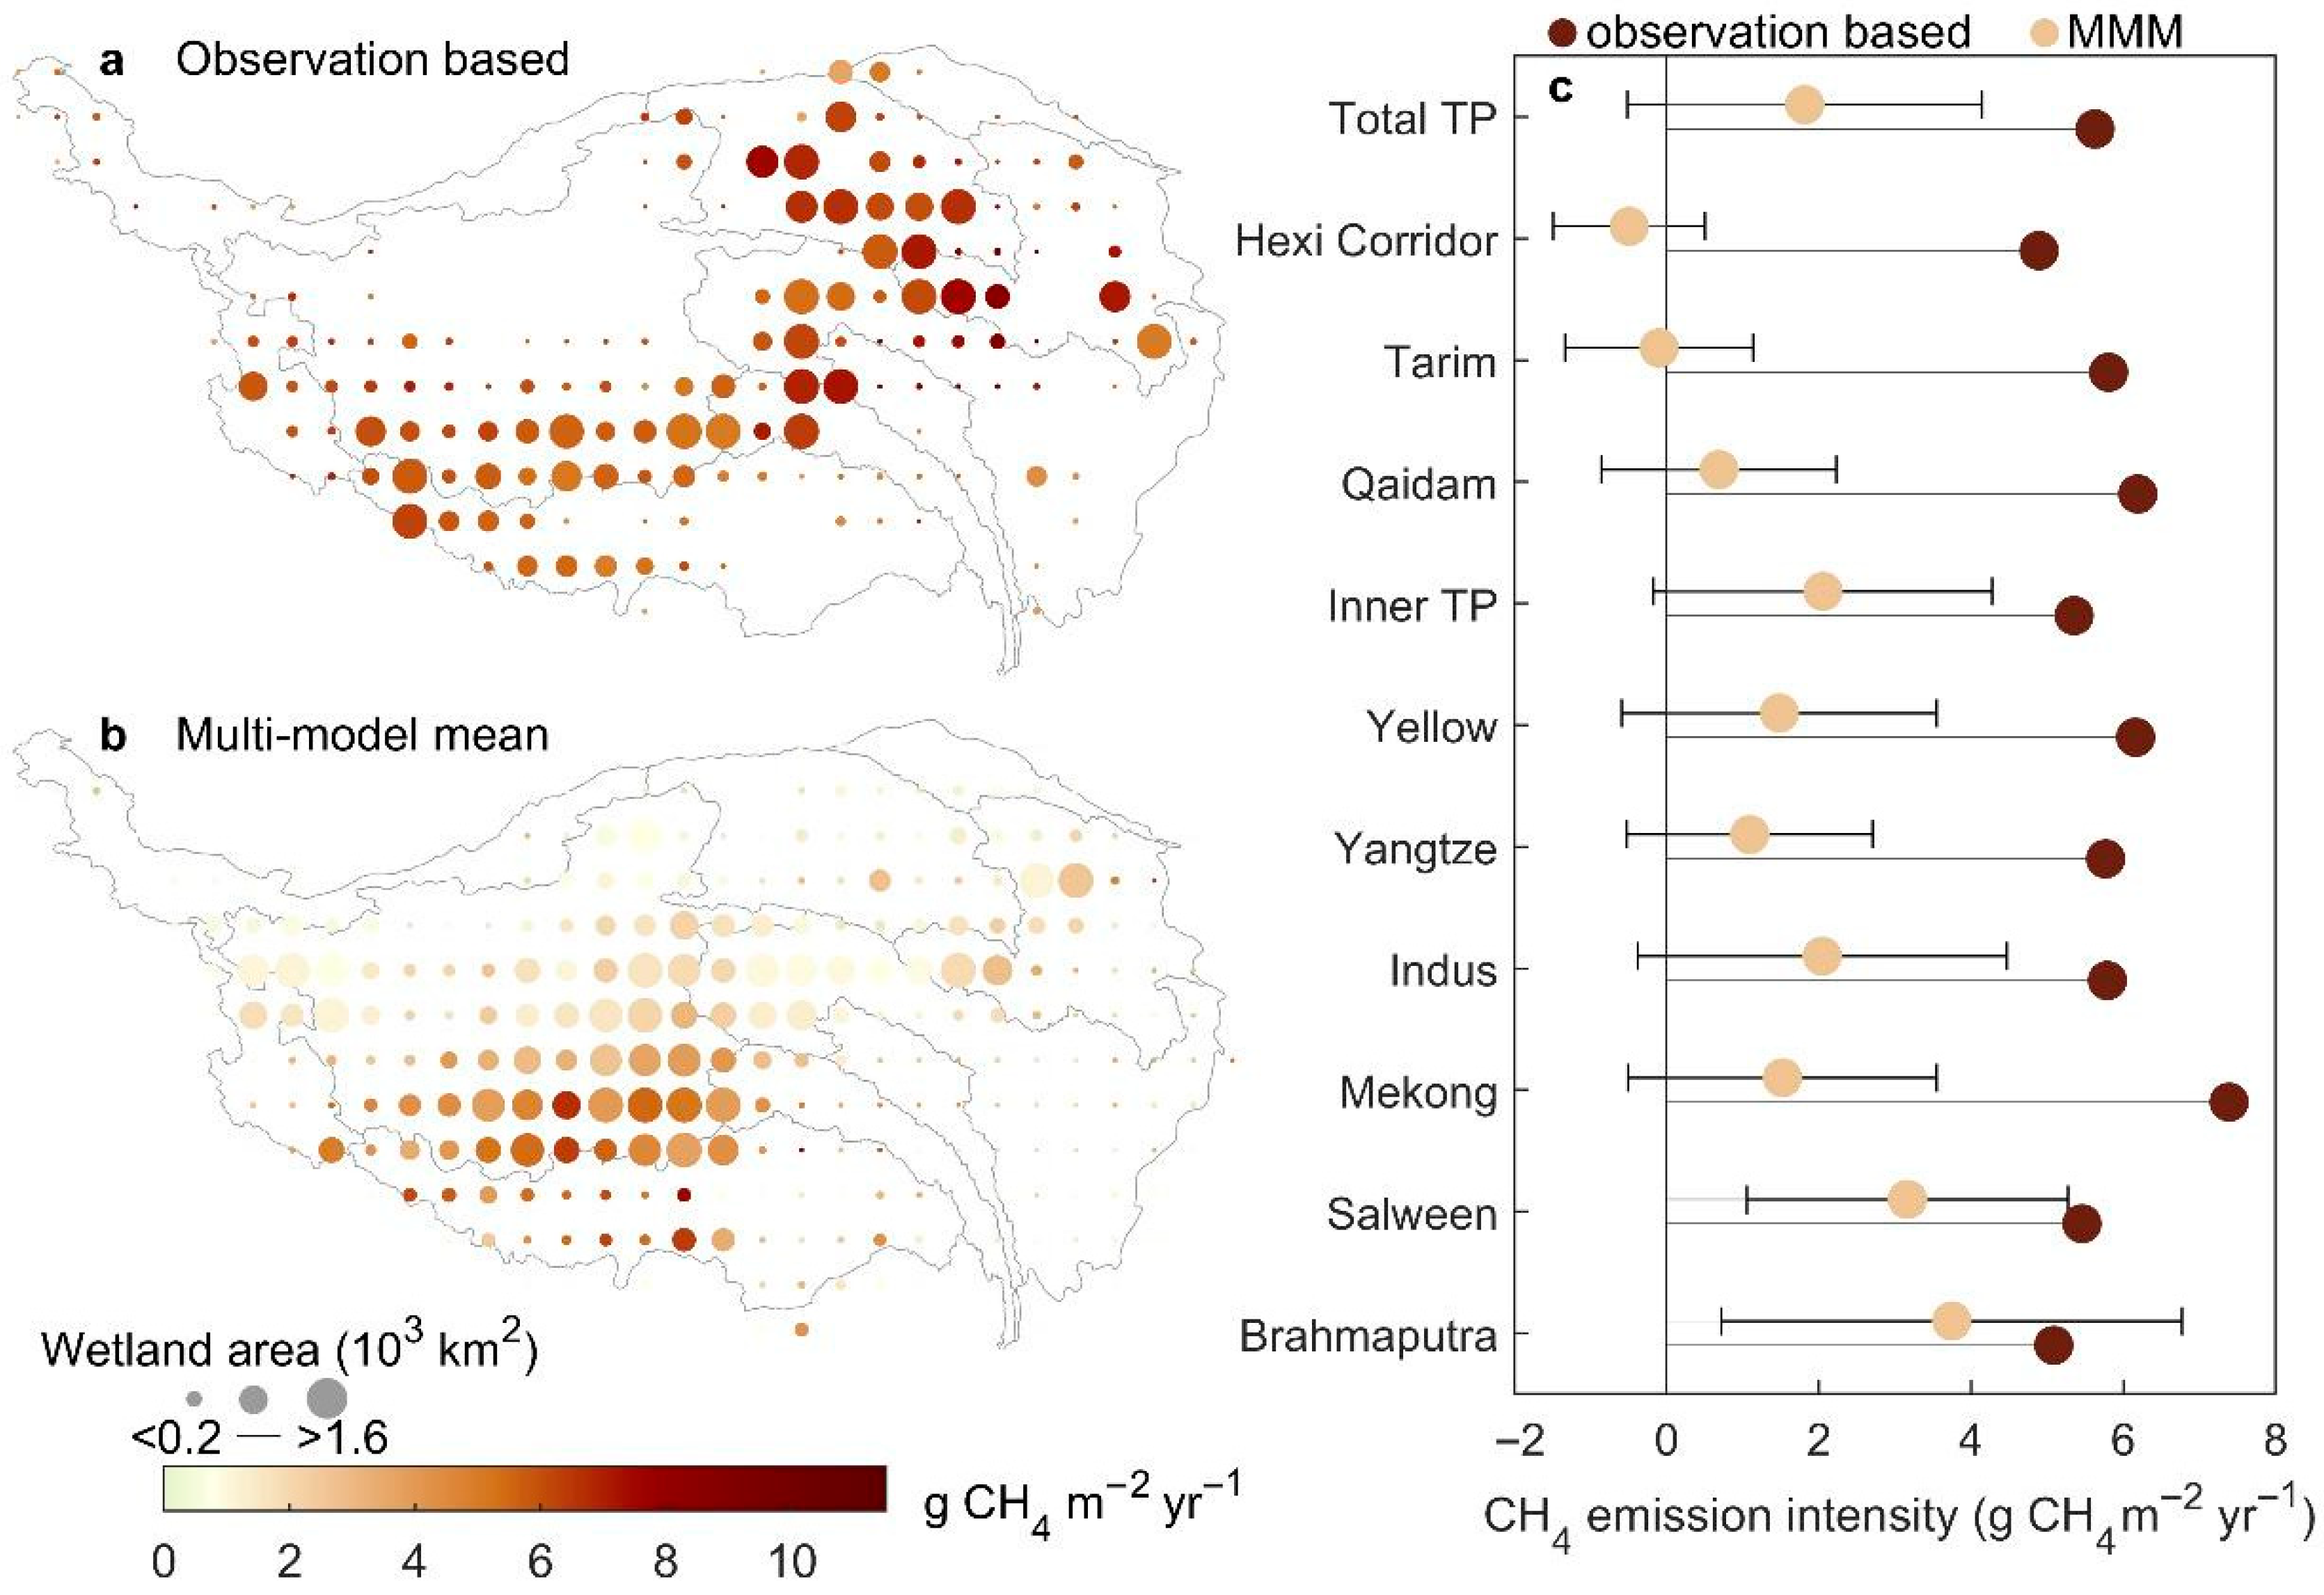
The spatial distribution of current emissions reveals that TP wetlands act as substantial CH4 sources during the thawing period, with an average emission intensity of 5.87 ± 1.43 g CH4 m−2 yr−1 (Figure 3a). This intensity is nearly 56 times greater than the estimated CH4 uptake capacity of the region’s grasslands and forests (−0.006 and −0.06 g CH4 m−2 yr−1, respectively) [48]. High-emission zones are concentrated in the northeastern plateau, particularly in the Three Rivers Source region (6.44 g CH4 m−2 yr−1), encompassing the Yellow, Yangtze, and Mekong river basins, as well as the Qaidam Basin (6.21 g CH4 m−2 yr−1). Notably, the Mekong River basin exhibits the highest emission intensity (7.36 g CH4 m−2 yr−1). In contrast, wetlands in the western plateau—including the Inner TP, Brahmaputra, Salween, and Indus river basins—show relatively lower intensities, averaging 5.37 g CH4 m−2 yr−1.
These elevated emissions can be attributed to the plateau’s distinctive hydrological regime, substantial organic matter accumulation, and the synergistic influence of warm, humid summer conditions that enhance methanogenesis and CH4 release [49,50]. On a per-unit-area basis, TP wetlands emit approximately 30–50% more CH4 than mid- to high-latitude wetlands in North America and Europe [51], though they emit 15–25% less than tropical wetlands in the Amazon Basin and Southeast Asia [52]. This comparison underscores the plateau’s unique role in the global CH4 budget; although alpine cold-region wetlands do not match the extreme fluxes of tropical systems, their emission intensity ranks among the highest globally, contributing substantially to both regional and global greenhouse gas dynamics.
To better understand the drivers of these emissions, we used the RF model to disentangle the effects of temperature, hydrology, and other environmental factors. Temperature and elevation together explained ~45% of the variation in wetland CH4 emissions (Figure 2b), with influence of elevation primarily reflecting temperature gradients along the altitudinal range. In contrast, annual precipitation accounted for only 16.4% of the variance. This suggests that the cold, high-altitude environment renders plateau aquatic ecosystems susceptible to temperature fluctuations, which largely govern CH4 emissions. Meanwhile, the generally ample water availability across the plateau means that precipitation changes exert only a marginal influence.

4.2. Spatio-Temporal Pattern of Wetland CH4 Emissions During 1979–2015

Next, we estimated the spatial distribution of CH4 emissions from TP wetlands at a spatial resolution of 0.1°. By compiling decadal changes in CH4 emissions over the past 35 years, we found that in the most recent period (2015), total emissions from TP wetlands reached 97.3 Gg CH4 yr−1 (1 Gg = 109 g) (Figure 4), accounting for 7.8% of wetland CH4 emissions across East Asia [53]. Historically, emissions exhibited a gradual increase during the earlier decades, peaking at 190.6 Gg CH4 yr−1 in the 2010s. However, this was followed by a marked decline, with emissions in 2015 decreasing by 15.6% compared with 114.4 Gg CH4 yr−1 in the 1980s.
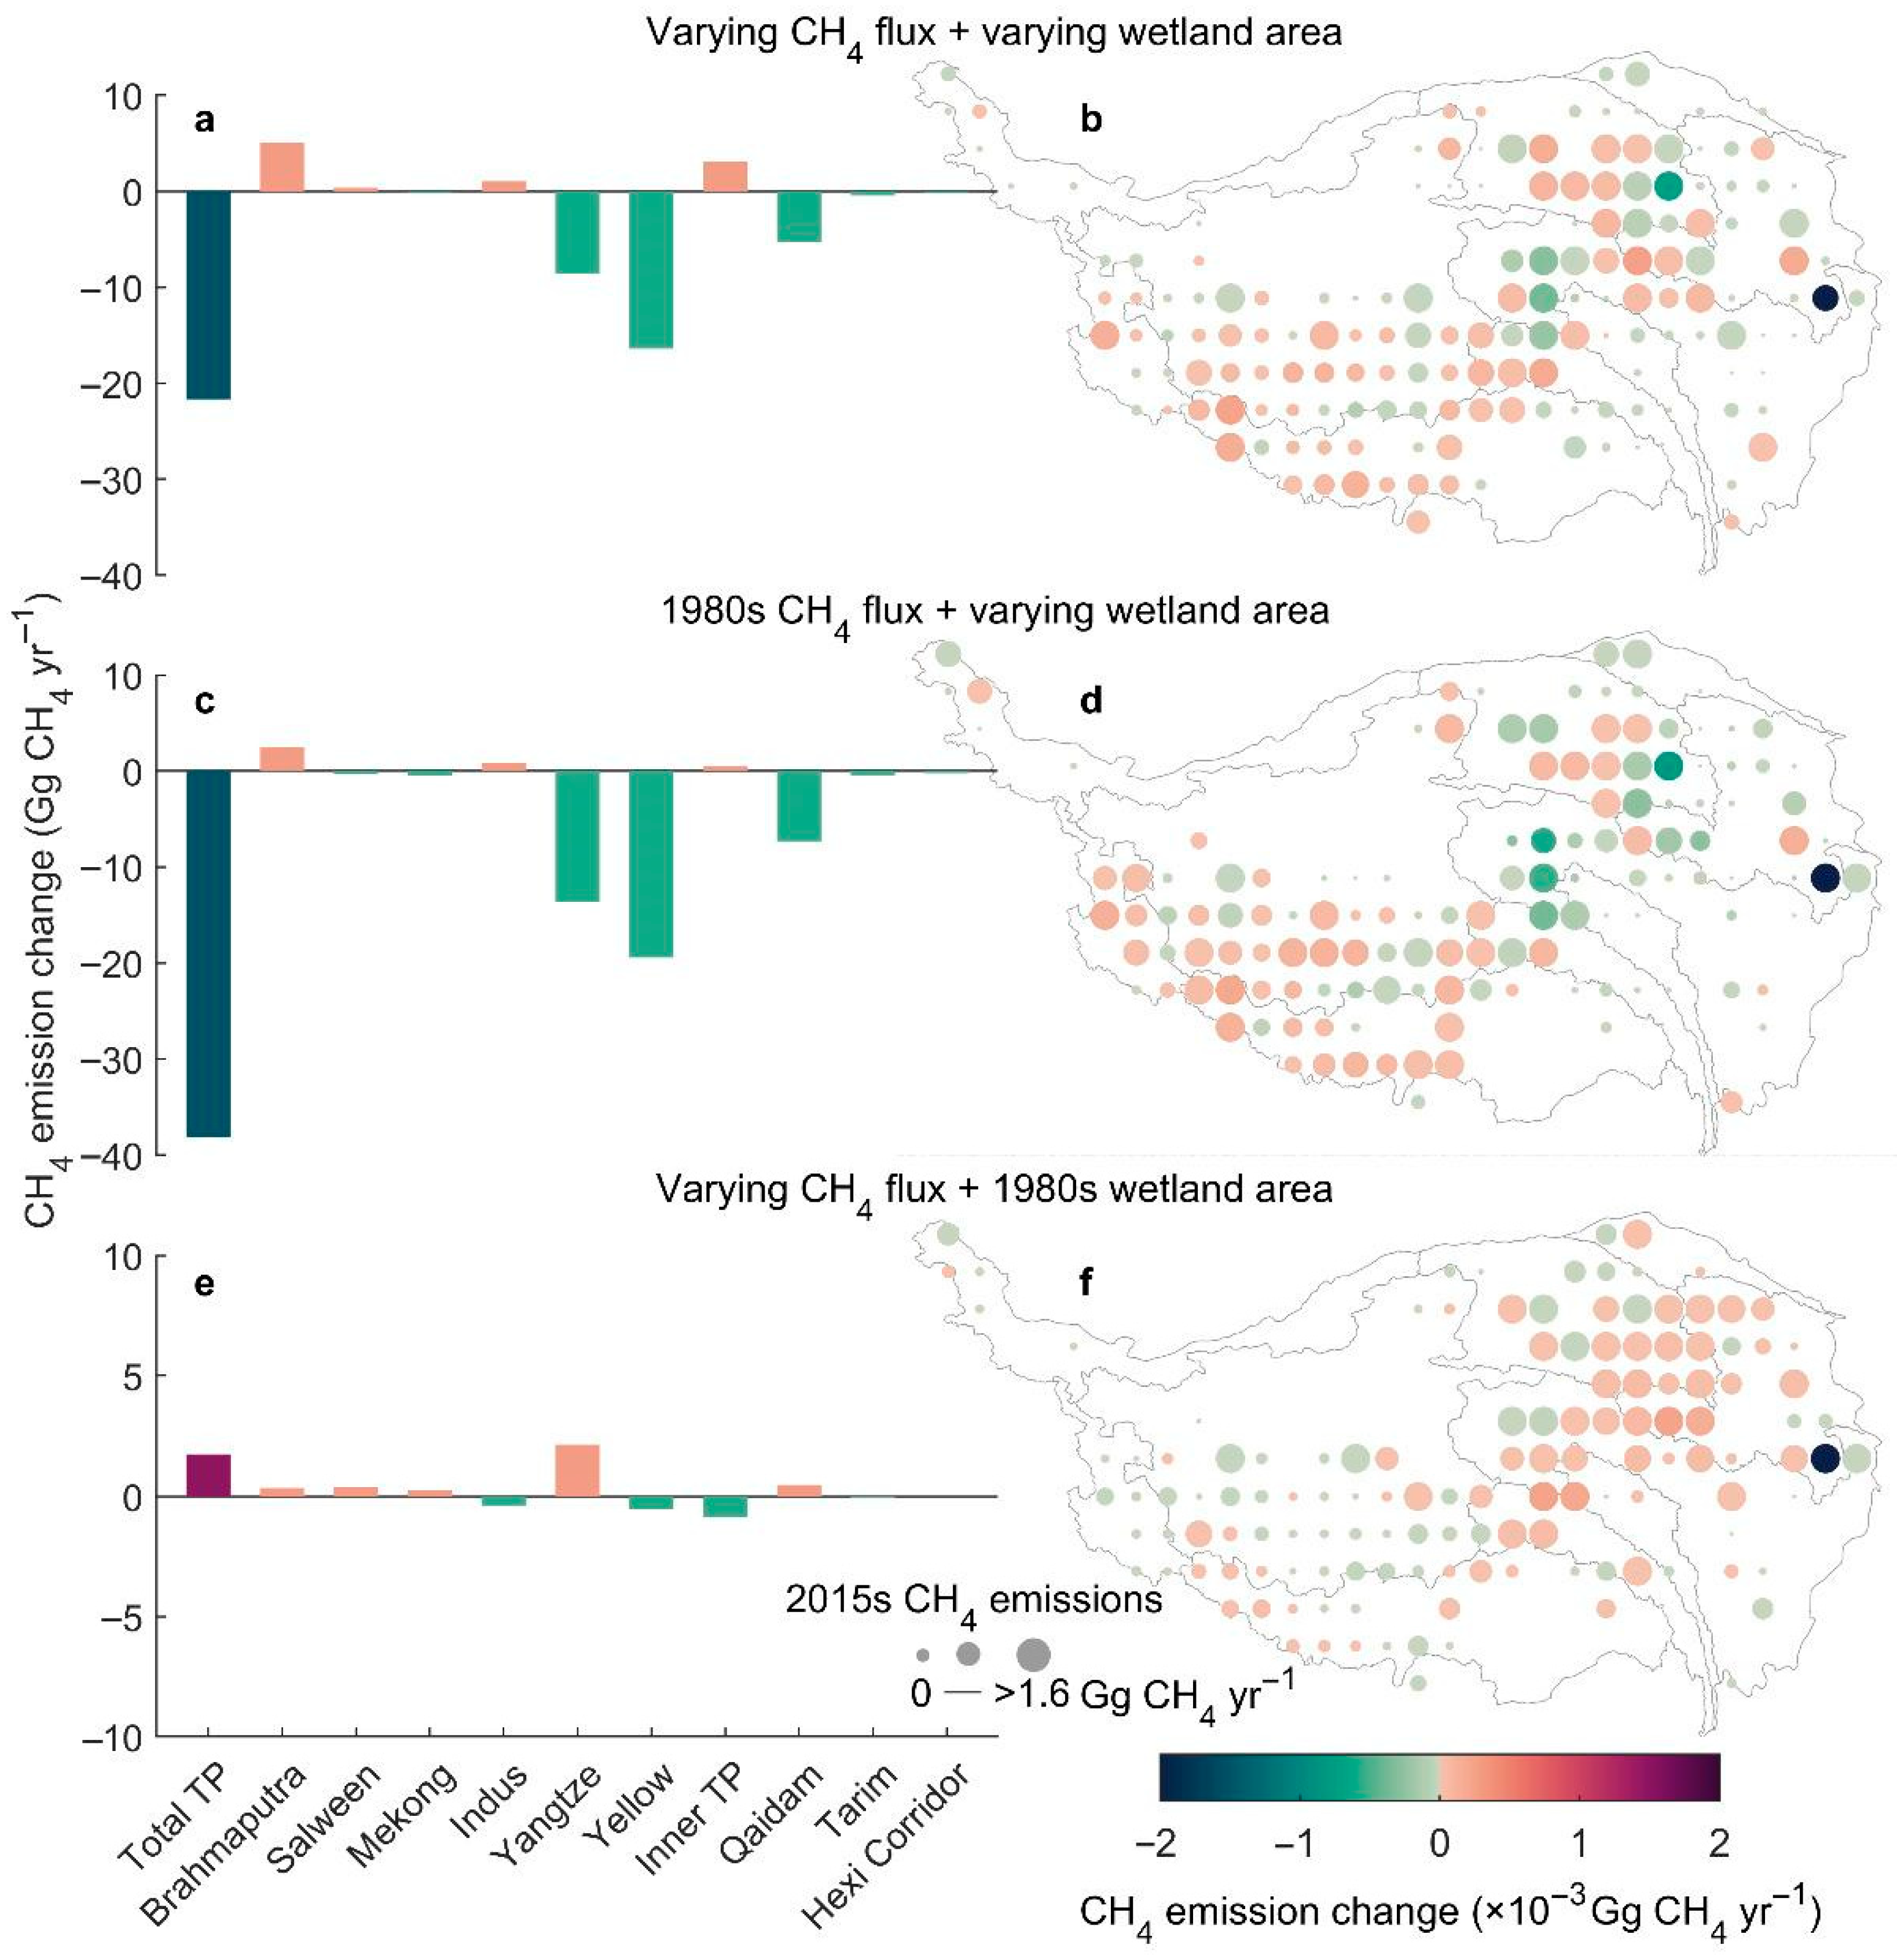
Although wetland CH4 emissions in different regions have trends over 35 years, the CH4 emissions in the severely degraded wetland areas in the central and northern parts of TP decreased most significantly due to human activities. This phenomenon is basically consistent with the phenomenon obtained by Zhang et al. (2023) through LSM that led to the decline in global wetland CH4 emission intensity from 2020 to 2021 [54]. Notably, 86% of the total CH4 emission reduction originated from the Three Rivers Source Region (−1.13 Gg CH4 yr−1), while the Qaidam Basin accounted for 28% of the loss (−0.42 Gg CH4 yr−1) (Figure 5a,b). In contrast, western wetlands, where the wetland area expanded, exhibited a general increase in CH4 emissions. However, the total emission gain from these regions was equivalent to only 14% of the combined losses from the Three Rivers Source Region and Qaidam Basin.
At the global scale, previous studies have generally shown that CH4 emissions from wetlands in both arid and humid regions are highly sensitive to warmer and wetter climates [17]. Nevertheless, our results indicate that, despite recent decades of warming and increased humidity on the TP, CH4 emissions from plateau wetlands have not increased as much as expected. To further investigate this apparent discrepancy, we performed a sensitivity analysis by separately constraining either CH4 emission intensity or wetland area to their 1980s levels, thereby isolating their respective contributions to total emission changes over the past 35 years.
The results show that, if the wetland area had remained constant at the 1980s levels (Figure 5c), changes in emission intensity alone would have led to a modest 1.51% increase in total CH4 emissions (1.73 Gg CH4 yr−1) over the study period. Conversely, if CH4 emission intensity had remained constant, wetland area loss would have reduced total CH4 emissions by 38.1 Gg CH4 yr−1 (Figure 5b). These findings demonstrate that the decline in wetland area has effectively offset the positive influence of climate change on CH4 emissions, highlighting the critical role of wetland extent in regulating greenhouse gas fluxes from alpine wetland ecosystems.

4.3. Evaluation of Modeled CH4 Emissions

To compare the results of this study with the effect of LSM simulation on CH4 emissions in TP wetlands, we synthesized results from nine LSM simulations, each forced with the WAD2M wetland distribution dataset for the plateau. Using the same wetland dataset for all models and observations was intended to minimize uncertainties arising from inconsistencies in wetland definitions (see Section 3.3).
The results reveal substantial variability in modeled CH4 emissions, with the difference between the highest and lowest model estimates reaching 7.82 g CH4 m−2 yr−1 (JSBACH: −1.69 g CH4 m−2 yr−1; LPX-Bern: 6.16 g CH4 m−2 yr−1) (Figure 3c). On average, the simulated CH4 emission intensity from LSMs was 1.81 ± 2.77 g CH4 m−2 yr−1 (Figure 3b), only about one-third of the value derived from in situ measurements. The underestimation is particularly pronounced in the northern TP, especially in the Three Rivers Source region, where modeled CH4 emissions (1.14 ± 1.60 g CH4 m−2 yr−1) account for just 22.5% of the observed emissions from 25 monitoring sites (5.09 ± 6.90 g CH4 m−2 yr−1). These discrepancies also coincide with large inter-model uncertainties, underscoring the challenge of accurately capturing CH4 dynamics in this region.
This mismatch suggests that although LSMs incorporate the fundamental processes driving wetland CH4 production and transport, they may not adequately represent the coupled environmental interactions unique to the TP. The plateau’s distinct topography, high-altitude climate, and hydrological regime introduce complex covariant relationships between environmental drivers, which are often poorly parameterized in global models [18,55]. This omission likely increases the uncertainty of CH4 emission simulations for plateau wetlands.
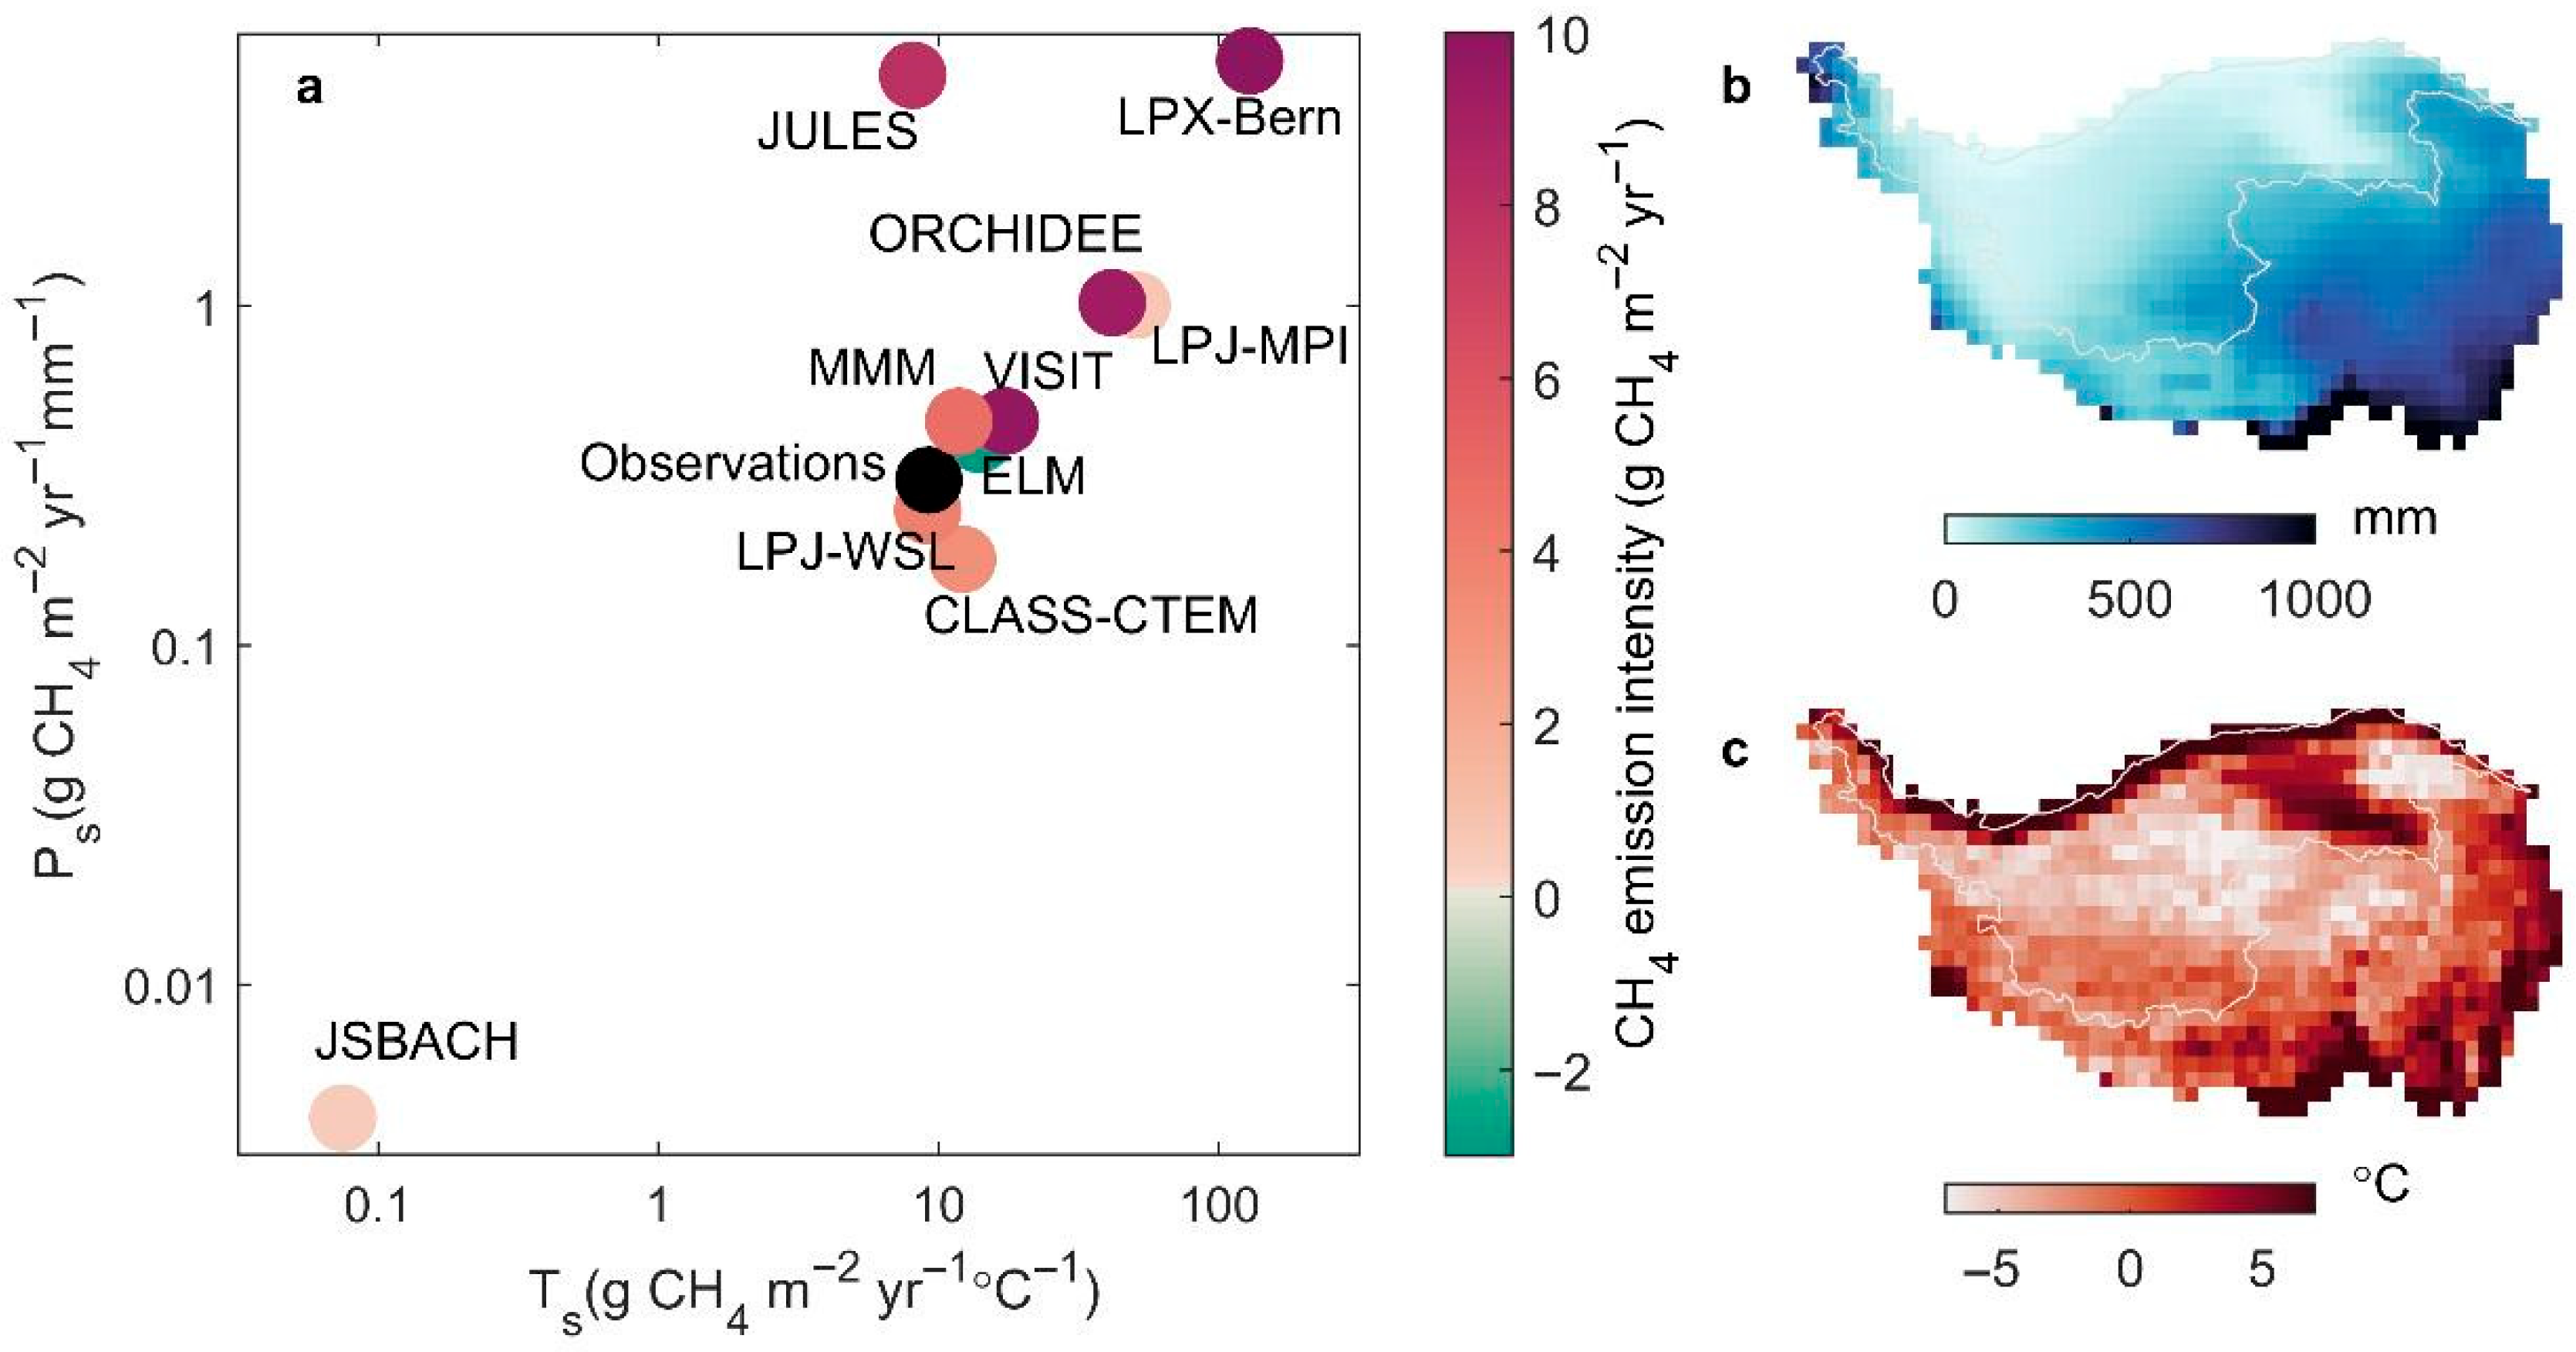
To further investigate, we compared the climatic sensitivities of modeled and observed CH4 emissions. Both datasets were analyzed using a consistent partial correlation approach to ensure comparability. Figure 6 illustrates the sensitivity of CH4 fluxes to temperature (Ts, x-axis) and precipitation (Ps, y-axis) in both observations and models. While all results confirm the positive influence of temperature and precipitation on CH4 emissions, most models greatly overestimate this sensitivity. Compared to observations (Ts = 9.22 g CH4 m−2 yr−1 °C−1; Ps = 0.31 g CH4 m−2 yr−1 mm−1), the model-averaged sensitivities were 3.4 times higher for temperature and 4.9 times higher for precipitation. Excessive sensitivity may lead to misrepresentation of emission responses, particularly in colder and drier northern regions, where temperature and precipitation exert weaker controls. Moreover, sensitivity differences among models can vary by nearly three orders of magnitude, representing a major source of inter-model uncertainty. These findings highlight the necessity of refining model parameters using site-level CH4 flux measurements from plateau wetlands.
When examining historical changes, LSMs simulated only a 4.69% change in plateau wetland CH4 emissions over the past 15 years, a trend broadly consistent with the wetland area changes represented in the WAD2M dataset. However, because WAD2M was optimized primarily for tropical and high-latitude wetlands [37], its representation of TP wetlands is limited, particularly regarding historical changes in extent. This shortcoming likely contributes to the underestimation of CH4 emissions in model simulations. Our results emphasize that accurate, high-resolution wetland distribution maps are a prerequisite for improving model performance in simulating CH4 emissions from TP wetlands.

4.4. Future Projections of CH4 Emissions from TP Wetlands

Our simulations of the CH4 source–sink dynamics in TP wetlands demonstrate that significant warming during the historical period has led to increased CH4 fluxes. However, due to a substantial reduction in wetland area, the total CH4 emissions from these wetlands have shown a marked decline. To assess future emission trends, we integrated projected climate data with an established RF model to estimate CH4 emission potentials under the assumption of a constant wetland area through the end of the 21st century (2100), considering three Shared Socioeconomic Pathway (SSP) scenarios.
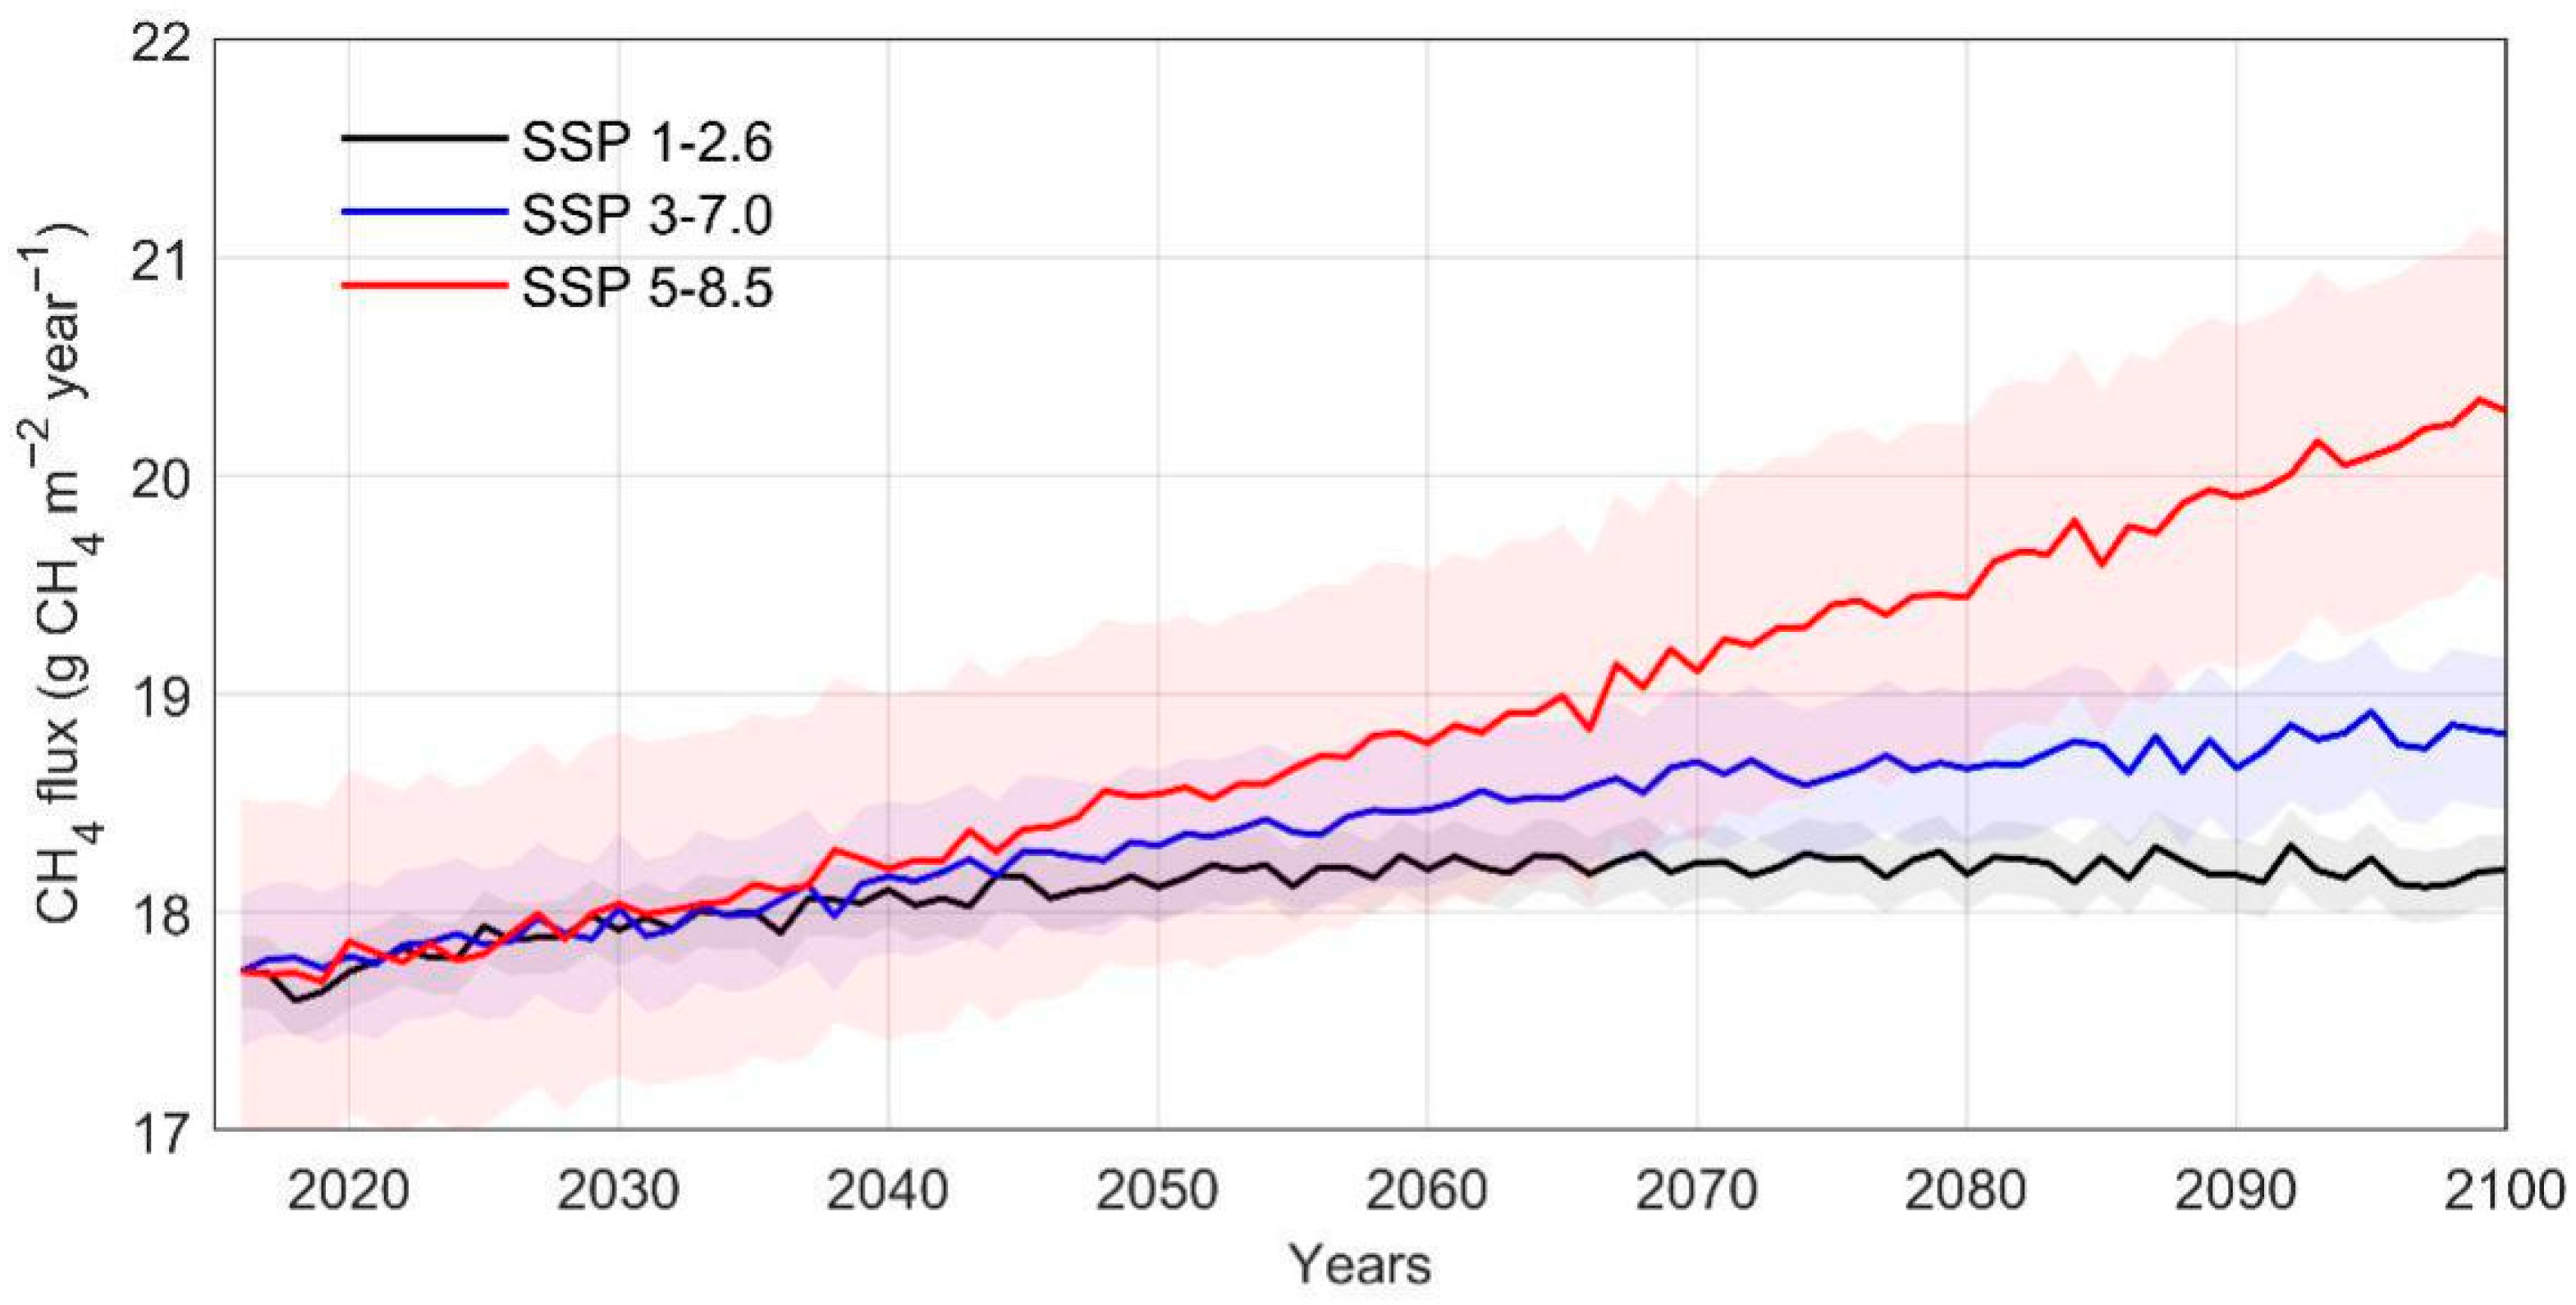
Compared to the current period, all three scenarios indicate a significant increase in annual CH4 fluxes across the Plateau (Figure 7). By the end of the century, the annual mean CH4 emission fluxes are projected to increase by 2.47–14.1%, reaching 18.1 g CH4 m−2 yr−1 under SSP1-2.6, 18.8 g CH4 m−2 yr−1 under SSP3-7.0, and 20.2 g CH4 m−2 yr−1 under SSP5-8.5. It is noteworthy that under the low- and medium-emission scenarios, CH4 fluxes are projected to stabilize around 18.1 and 18.8 g CH4 m−2 yr−1 by approximately 2060 and 2080, respectively.
We then further quantified the projected annual total CH4 emissions from TP wetlands across major river basins under future climate scenarios (Table 2). By the end of this century, CH4 emissions are expected to increase by 8.53% to 21.2% compared to 2016 levels. Notably, the Qaidam Basin exhibits the most pronounced growth in CH4 emissions, with an increase of 29.5% to 46.3%, accounting for nearly half of the total emission increment across the entire Plateau. In addition, significant increases in CH4 emissions were also observed in the Yangtze and Yellow River basins, corresponding to substantial projected expansions in wetland areas within these regions.
Under the scenario where the wetland area continues to decrease at the current rate, our simulation indicates that the total CH4 emissions are only 34.3% to 57.2% of the predicted level assuming that the wetland area remains unchanged.
These findings suggest that rising CH4 fluxes driven by future climate change may cause total CH4 emissions from TP wetlands to surpass current levels by the end of the century. The substantial increase in CH4 emissions could accelerate the feedback of wetlands to climate change, posing additional challenges for regional carbon management and climate mitigation efforts.

5. Conclusions

This study combined in situ observations, RF model, and manually delineated 30 m wetland maps to systematically simulate the spatiotemporal patterns of CH4 emissions from TP wetlands over historical periods. The results indicate that current emissions are approximately 97.3 Gg CH4 yr−1, with a 15% decline over the past 40 years. This decline reflects opposing drivers: historical warming and increased moisture have enhanced CH4 production potential per unit area, while wetland area shrinkage—due to drying, land use changes, and boundary retreat—has offset these gains at the landscape scale. Comparison with multiple land surface models (LSMs) reveals substantial underestimation of CH4 emissions on the plateau, particularly in the Three Rivers Source region, likely caused by insufficient representation of high-altitude, small-scale wetlands and their dynamics, as well as the limited regional parameterization of hydrological and biogeochemical processes. Additionally, amplified uncertainties in climate, topography, and vegetation inputs at high elevations contribute to model biases.
Projecting into the future under multiple Shared Socioeconomic Pathway (SSP) scenarios and assuming constant wetland area, CH4 emissions from TP wetland are expected to increase by 2.47% to 14.1% by the end of the 21st century. The Qaidam Basin is projected to exhibit the most significant growth, accounting for nearly half of the TP wetland total emission increase. These trends highlight the potential for intensified wetland–climate feedback, and underscore significant challenges for regional carbon management and climate mitigation strategies moving forward.
Given these findings, we recommend the following: (1) to address these issues, we recommend expanding long-term, multi-seasonal, and spatially extensive observation networks; (2) improving dynamic wetland mapping by integrating high-resolution maps with remote sensing time series; (3) refining land surface models with region-specific parameterizations supported by observational data; and (4) carefully balancing wetland restoration efforts to maintain ecosystem functions while mitigating potential increases in CH4 emissions, thereby supporting sustainable carbon neutrality goals.
In addition, this study still has certain limitations, including limited spatial coverage and potential biases in observation sites, as well as the need for a more comprehensive consideration of key processes such as permafrost degradation, hydrodynamics, vegetation succession, and CH4 emission pathways in future research.

Author Contributions

Conceptualization, G.L.; methodology, G.L.; validation, T.S., Z.J., Y.Z., M.Y. and M.S.; formal analysis, G.L.; writing–original draft preparation, T.S. and G.L.; Writing–review and editing, T.S., Z.J., Y.Z., M.Y., M.S. and G.L. All authors have read and agreed to the published version of the manuscript.

Funding

This study was supported by the Basic Scientific Research Project of Colleges and Universities in Liaoning Province (Grant No. LJ212510146031). This work was jointly supported by the Innovation and Entrepreneurship Training Program for College Students from Liaoning University of Science and Technology (Grant No. X202510146011X).

Data Availability Statement

The data that support the findings of this study are available from the corresponding author, G.L., upon reasonable request.

Conflicts of Interest

The authors declare no conflict of interest.

References

  1. Gedney, N.; Huntingford, C.; Comyn-Platt, E.; Wiltshire, A. Significant feedbacks of wetland methane release on climate change and the causes of their uncertainty. Environ. Res. Lett. 2019, 14, 084027. [Google Scholar] [CrossRef]
  2. Bridgham, S.D.; Cadillo-Quiroz, H.; Keller, J.K.; Zhuang, Q. Methane emissions from wetlands: Biogeochemical, microbial, and modeling perspectives from local to global scales. Glob. Change Biol. 2013, 19, 1325–1346. [Google Scholar] [CrossRef]
  3. Saunois, M.; Stavert, A.R.; Poulter, B.; Bousquet, P.; Canadell, J.G.; Jackson, R.B.; Raymond, P.A.; Dlugokencky, E.J.; Houweling, S.; Patra, P.K.; et al. The global methane budget 2000–2017. Earth Syst. Sci. Data 2020, 12, 1561–1623. [Google Scholar] [CrossRef]
  4. Zhang, Z.; Zimmermann, N.E.; Stenke, A.; Li, X.; Hodson, E.L.; Zhu, G.; Huang, C.; Poulter, B. Emerging role of wetland methane emissions in driving 21st century climate change. Proc. Natl. Acad. Sci. USA 2017, 114, 9647–9652. [Google Scholar] [CrossRef]
  5. Chang, K.-Y.; Riley, W.J.; Knox, S.H.; Jackson, R.B.; McNicol, G.; Poulter, B.; Aurela, M.; Baldocchi, D.; Bansal, S.; Bohrer, G.; et al. Substantial hysteresis in emergent temperature sensitivity of global wetland CH4 emissions. Nat. Commun. 2021, 12, 2266. [Google Scholar] [CrossRef]
  6. Hua, T.; Zhao, W.; Cherubini, F.; Hu, X.; Pereira, P. Sensitivity and future exposure of ecosystem services to climate change on the Tibetan Plateau of China. Landsc. Ecol. 2021, 36, 3451–3471. [Google Scholar] [CrossRef]
  7. Yao, T.; Bolch, T.; Chen, D.; Gao, J.; Immerzeel, W.; Piao, S.; Su, F.; Thompson, L.; Wada, Y.; Wang, L.; et al. The imbalance of the Asian water tower. Nat. Rev. Earth Environ. 2022, 3, 618–632. [Google Scholar] [CrossRef]
  8. Song, W.; Wang, H.; Wang, G.; Chen, L.; Jin, Z.; Zhuang, Q.; He, J. Methane emissions from an alpine wetland on the Tibetan Plateau: Neglected but vital contribution of the nongrowing season. J. Geophys. Res. Biogeosci. 2015, 120, 1475–1490. [Google Scholar] [CrossRef]
  9. Gedney, N.; Cox, P.; Huntingford, C. Climate feedback from wetland methane emissions. Geophys. Res. Lett. 2004, 31, 421–422. [Google Scholar] [CrossRef]
  10. Salimi, S.; Almuktar, S.A.; Scholz, M. Impact of climate change on wetland ecosystems: A critical review of experimental wetlands. J. Environ. Manag. 2021, 286, 112160. [Google Scholar] [CrossRef] [PubMed]
  11. Zhang, X.; Jiang, H. Spatial variations in methane emissions from natural wetlands in China. Int. J. Environ. Sci. Technol. 2014, 11, 77–86. [Google Scholar] [CrossRef]
  12. Li, T.; Li, H.; Zhang, Q.; Ma, Z.; Yu, L.; Lu, Y.; Niu, Z.; Sun, W.; Liu, J. Prediction of CH4 emissions from potential natural wetlands on the Tibetan Plateau during the 21st century. Sci. Total Environ. 2019, 657, 498–508. [Google Scholar] [CrossRef]
  13. Wei, D.; Ri, X.; Tarchen, T.; Dai, D.; Wang, Y.; Wang, Y. Revisiting the role of CH4 emissions from alpine wetlands on the Tibetan Plateau: Evidence from two in situ measurements at 4758 and 4320 m above sea level. J. Geophys. Res. Biogeosci. 2015, 120, 1741–1750. [Google Scholar] [CrossRef]
  14. Wei, D.; Wang, X. Uncertainty and dynamics of natural wetland CH4 release in China: Research status and priorities. Atmos. Environ. 2017, 154, 95–105. [Google Scholar] [CrossRef]
  15. Wang, J.; Zhu, Q.; Yang, Y.; Zhang, X.; Zhang, J.; Yuan, M.; Chen, H.; Peng, C. High uncertainties detected in the wetlands distribution of the Qinghai–Tibet Plateau based on multisource data. Landsc. Ecol. Eng. 2020, 16, 47–61. [Google Scholar] [CrossRef]
  16. Lorente, A.; Borsdorff, T.; Butz, A.; Hasekamp, O.; de Brugh, J.A.; Schneider, A.; Wu, L.; Hase, F.; Kivi, R.; Wunch, D.; et al. Methane retrieved from TROPOMI: Improvement of the data product and validation of the first 2 years of measurements. Atmos. Meas. Tech. 2021, 14, 665–684. [Google Scholar] [CrossRef]
  17. Peng, S.; Lin, X.; Thompson, R.L.; Xi, Y.; Liu, G.; Hauglustaine, D.; Lan, X.; Poulter, B.; Ramonet, M.; Saunois, M.; et al. Wetland emission and atmospheric sink changes explain methane growth in 2020. Nature 2022, 612, 477–482. [Google Scholar] [CrossRef]
  18. Arneth, A.; Harrison, S.P.; Zaehle, S.; Tsigaridis, K.; Menon, S.; Bartlein, P.J.; Feichter, J.; Korhola, A.; Kulmala, M.; O’DOnnell, D.; et al. Terrestrial biogeochemical feedbacks in the climate system. Nat. Geosci. 2010, 3, 525–532. [Google Scholar] [CrossRef]
  19. Zhang, Z.; E Zimmermann, N.; Calle, L.; Hurtt, G.; Chatterjee, A.; Poulter, B. Enhanced response of global wetland methane emissions to the 2015–2016 El Niño-Southern Oscillation event. Environ. Res. Lett. 2018, 13, 074009. [Google Scholar] [CrossRef]
  20. Zhu, Q.; Peng, C.; Ciais, P.; Jiang, H.; Liu, J.; Bousquet, P.; Li, S.; Chang, J.; Fang, X.; Zhou, X.; et al. Interannual variation in methane emissions from tropical wetlands triggered by repeated El Niño Southern Oscillation. Glob. Change Biol. 2017, 23, 4706–4716. [Google Scholar] [CrossRef]
  21. Shaw, J.T.; Allen, G.; Barker, P.; Pitt, J.R.; Pasternak, D.; Bauguitte, S.J.; Lee, J.; Bower, K.N.; Daly, M.C.; Lunt, M.F.; et al. Large methane emission fluxes observed from tropical wetlands in Zambia. Glob. Biogeochem. Cycles 2022, 36, e2021GB007261. [Google Scholar] [CrossRef]
  22. Parker, R.J.; Wilson, C.; Bloom, A.A.; Comyn-Platt, E.; Hayman, G.; McNorton, J.; Boesch, H.; Chipperfield, M.P. Exploring constraints on a wetland methane emission ensemble (WetCHARTs) using GOSAT observations. Biogeosciences 2020, 17, 5669–5691. [Google Scholar] [CrossRef]
  23. Bohn, T.J.; Melton, J.R.; Ito, A.; Kleinen, T.; Spahni, R.; Stocker, B.D.; Zhang, B.; Zhu, X.; Schroeder, R.; Glagolev, M.V.; et al. WETCHIMP-WSL: Intercomparison of wetland methane emissions models over West Siberia. Biogeosciences 2015, 12, 3321–3349. [Google Scholar] [CrossRef]
  24. Melton, J.R.; Wania, R.; Hodson, E.L.; Poulter, B.; Ringeval, B.; Spahni, R.; Bohn, T.; Avis, C.A.; Beerling, D.J.; Chen, G.; et al. Present state of global wetland extent and wetland methane modelling: Conclusions from a model inter-comparison project (WETCHIMP). Biogeosciences 2013, 10, 753–788. [Google Scholar] [CrossRef]
  25. Mao, D.; Wang, Z.; Du, B.; Li, L.; Tian, Y.; Jia, M.; Zeng, Y.; Song, K.; Jiang, M.; Wang, Y. National wetland mapping in China: A new product resulting from object-based and hierarchical classification of Landsat 8 OLI images. ISPRS J. Photogramm. Remote Sens. 2020, 164, 11–25. [Google Scholar] [CrossRef]
  26. Niu, Z.; Zhang, H.; Wang, X.; Yao, W.; Zhou, D.; Zhao, K.; Zhao, H.; Li, N.; Huang, H.; Li, C.; et al. Mapping wetland changes in China between 1978 and 2008. Chin. Sci. Bull. 2012, 57, 2813–2823. [Google Scholar] [CrossRef]
  27. Mu, C.; Mu, M.; Wu, X.; Jia, L.; Fan, C.; Peng, X.; Ping, C.L.; Wu, Q.; Xiao, C.; Liu, J. High carbon emissions from thermokarst lakes and their determinants in the Tibet Plateau. Glob. Change Biol. 2023, 29, 2732–2745. [Google Scholar] [CrossRef] [PubMed]
  28. Allen, G.H.; Pavelsky, T.M. Global extent of rivers and streams. Science 2018, 361, 585–588. [Google Scholar] [CrossRef]
  29. Lang, Q.; Niu, Z.; Hong, X.; Yang, X. Remote Sensing Monitoring and Change Analysis of Wetlands in the Tibetan Plateau. Geomat. Inf. Sci. Wuhan Univ. 2021, 46, 8. [Google Scholar]
  30. He, L.; Rodrigues, J.L.M.; Soudzilovskaia, N.A.; Barceló, M.; Olsson, P.A.; Song, C.; Tedersoo, L.; Yuan, F.; Yuan, F.; Lipson, D.A.; et al. Global biogeography of fungal and bacterial biomass carbon in topsoil. Soil Biol. Biochem. 2020, 151, 108024. [Google Scholar] [CrossRef]
  31. Abatzoglou, J.T.; Dobrowski, S.Z.; Parks, S.A.; Hegewisch, K.C. TerraClimate, a high-resolution global dataset of monthly climate and climatic water balance from 1958–2015. Sci. Data 2018, 5, 170191. [Google Scholar] [CrossRef] [PubMed]
  32. Poggio, L.; de Sousa, L.M.; Batjes, N.H.; Heuvelink, G.B.M.; Kempen, B.; Ribeiro, E.; Rossiter, D. SoilGrids 2.0: Producing soil information for the globe with quantified spatial uncertainty. Soil 2021, 7, 217–240. [Google Scholar] [CrossRef]
  33. Yan, D.; Zheng, X.; Feng, M.; Liang, S.; Hu, Z.; Kuang, X.; Feng, Y. Frozen Ground Change Data Set in the Tibetan Plateau (1961–2020); National Tibetan Plateau/Third Pole Environment Data Center: Beijing, China, 2023; pp. 17–240. [Google Scholar]
  34. Wania, R.; Melton, J.R.; Hodson, E.L.; Poulter, B.; Ringeval, B.; Spahni, R.; Bohn, T.; Avis, C.A.; Chen, G.; Eliseev, A.V.; et al. Present state of global wetland extent and wetland methane modelling: Methodology of a model inter-comparison project (WETCHIMP). Geosci. Model Dev. 2013, 6, 617–641. [Google Scholar] [CrossRef]
  35. Xu, X.F.; Tian, H.Q.; Zhang, C.; Liu, M.L.; Ren, W.; Chen, G.S.; Lu, C.Q.; Bruhwiler, L. Attribution of spatial and temporal variations in terrestrial methane flux over North America. Biogeosciences 2010, 7, 3637–3655. [Google Scholar] [CrossRef]
  36. Harris, I.; Osborn, T.J.; Jones, P.; Lister, D. Version 4 of the CRU TS monthly high-resolution gridded multivariate climate dataset. Sci. Data 2020, 7, 109. [Google Scholar] [CrossRef] [PubMed]
  37. Zhang, Z.; Fluet-Chouinard, E.; Jensen, K.; McDonald, K.; Hugelius, G.; Gumbricht, T.; Carroll, M.; Prigent, C.; Bartsch, A.; Poulter, B. Development of a global synthetic map of Wetland Area and Dynamics for Methane Modeling (WAD2M). Earth Syst. Sci. Data 2021, 13, 2001–2023. [Google Scholar] [CrossRef]
  38. Arora, V.K.; Melton, J.R.; Plummer, D. An assessment of natural methane fluxes simulated by the CLASS-CTEM model. Biogeosciences 2018, 15, 4683–4709. [Google Scholar] [CrossRef]
  39. Riley, W.J.; Subin, Z.M.; Lawrence, D.M.; Swenson, S.C.; Torn, M.S.; Meng, L.; Mahowald, N.M.; Hess, P. Barriers to predicting changes in global terrestrial methane fluxes: Analyses using CLM4Me, a methane biogeochemistry model integrated in CESM. Biogeosciences 2011, 8, 1925–1953. [Google Scholar] [CrossRef]
  40. Kleinen, T.; Mikolajewicz, U.; Brovkin, V. Terrestrial methane emissions from the Last Glacial Maximum to the preindustrial period. Clim. Past 2020, 16, 575–595. [Google Scholar] [CrossRef]
  41. Hayman, G.D.; O’COnnor, F.M.; Dalvi, M.; Clark, D.B.; Gedney, N.; Huntingford, C.; Prigent, C.; Buchwitz, M.; Schneising, O.; Burrows, J.P.; et al. Comparison of the HadGEM2 climate-chemistry model against in situ and SCIAMACHY atmospheric methane data. Atmos. Chem. Phys. 2014, 14, 13257–13280. [Google Scholar] [CrossRef]
  42. Kleinen, T.; Brovkin, V.; Schuldt, R.J. A dynamic model of wetland extent and peat accumulation: Results for the Holocene. Biogeosciences 2012, 9, 235–248. [Google Scholar] [CrossRef]
  43. Zhang, Z.; Zimmermann, N.E.; Kaplan, J.O.; Poulter, B. Modeling spatiotemporal dynamics of global wetlands: Comprehensive evaluation of a new sub-grid TOPMODEL parameterization and uncertainties. Biogeosciences 2016, 13, 1387–1408. [Google Scholar] [CrossRef]
  44. Spahni, R.; Wania, R.; Neef, L.; van Weele, M.; Pison, I.; Bousquet, P.; Frankenberg, C.; Foster, P.N.; Joos, F.; Prentice, I.C.; et al. Constraining global methane emissions and uptake by ecosystems. Biogeosciences 2011, 8, 1643–1665. [Google Scholar] [CrossRef]
  45. Ringeval, B.; Friedlingstein, P.; Koven, C.; Ciais, P.; de Noblet-Ducoudré, N.; Decharme, B.; Cadule, P. Climate-CH4 feedback from wetlands and its interaction with the climate-CO2 feedback. Biogeosciences 2011, 8, 2137–2157. [Google Scholar] [CrossRef]
  46. Ito, A.; Inatomi, M. Use of a process-based model for assessing the methane budgets of global terrestrial ecosystems and evaluation of uncertainty. Biogeosciences 2012, 9, 759–773. [Google Scholar] [CrossRef]
  47. Koffi, E.N.; Bergamaschi, P.; Alkama, R.; Cescatti, A. An observation-constrained assessment of the climate sensitivity and future trajectories of wetland methane emissions. Sci. Adv. 2020, 6, eaay4444. [Google Scholar] [CrossRef]
  48. Chen, H.; Ju, P.; Zhu, Q.; Xu, X.; Wu, N.; Gao, Y.; Feng, X.; Tian, J.; Niu, S.; Zhang, Y.; et al. Carbon and nitrogen cycling on the Qinghai–Tibetan Plateau. Nat. Rev. Earth Environ. 2022, 3, 701–716. [Google Scholar] [CrossRef]
  49. Bastviken, D.; Tranvik, L.J.; Downing, J.A.; Crill, P.M.; Enrich-Prast, A. Freshwater methane emissions offset the continental carbon sink. Science 2011, 331, 50. [Google Scholar] [CrossRef]
  50. Rosentreter, J.A.; Borges, A.V.; Deemer, B.R.; Holgerson, M.A.; Liu, S.; Song, C.; Melack, J.; Raymond, P.A.; Duarte, C.M.; Allen, G.H.; et al. Half of global methane emissions come from highly variable aquatic ecosystem sources. Nat. Geosci. 2021, 14, 225–230. [Google Scholar] [CrossRef]
  51. Zhang, Z.; Poulter, B.; Melton, J.R.; Riley, W.J.; Allen, G.H.; Beerling, D.J.; Bousquet, P.; Canadell, J.G.; Fluet-Chouinard, E.; Ciais, P.; et al. Ensemble estimates of global wetland methane emissions over 2000–2020. Biogeosciences 2025, 22, 305–321. [Google Scholar] [CrossRef]
  52. Murguia-Flores, F.; Jaramillo, V.J.; Gallego-Sala, A. Assessing methane emissions from tropical wetlands: Uncertainties from natural variability and drivers at the global scale. Glob. Biogeochem. Cycles 2023, 37, e2022GB007601. [Google Scholar] [CrossRef]
  53. Wang, X.; Gao, Y.; Jeong, S.; Ito, A.; Bastos, A.; Poulter, B.; Wang, Y.; Ciais, P.; Tian, H.; Yuan, W.; et al. The greenhouse gas budget of terrestrial ecosystems in East Asia since 2000. Glob. Biogeochem. Cycles 2024, 38, e2023GB007865. [Google Scholar] [CrossRef]
  54. Zhang, Z.; Poulter, B.; Feldman, A.F.; Ying, Q.; Ciais, P.; Peng, S.; Li, X. Recent intensification of wetland methane feedback. Nat. Clim. Change 2023, 13, 430–433. [Google Scholar] [CrossRef]
  55. Christensen, T.R.; Ekberg, A.; Ström, L.; Mastepanov, M.; Panikov, N.; Öquist, M.; Svensson, B.H.; Nykänen, H.; Martikainen, P.J.; Oskarsson, H. Factors controlling large scale variations in methane emissions from wetlands. Geophys. Res. Lett. 2003, 30, 1414–1419. [Google Scholar] [CrossRef]
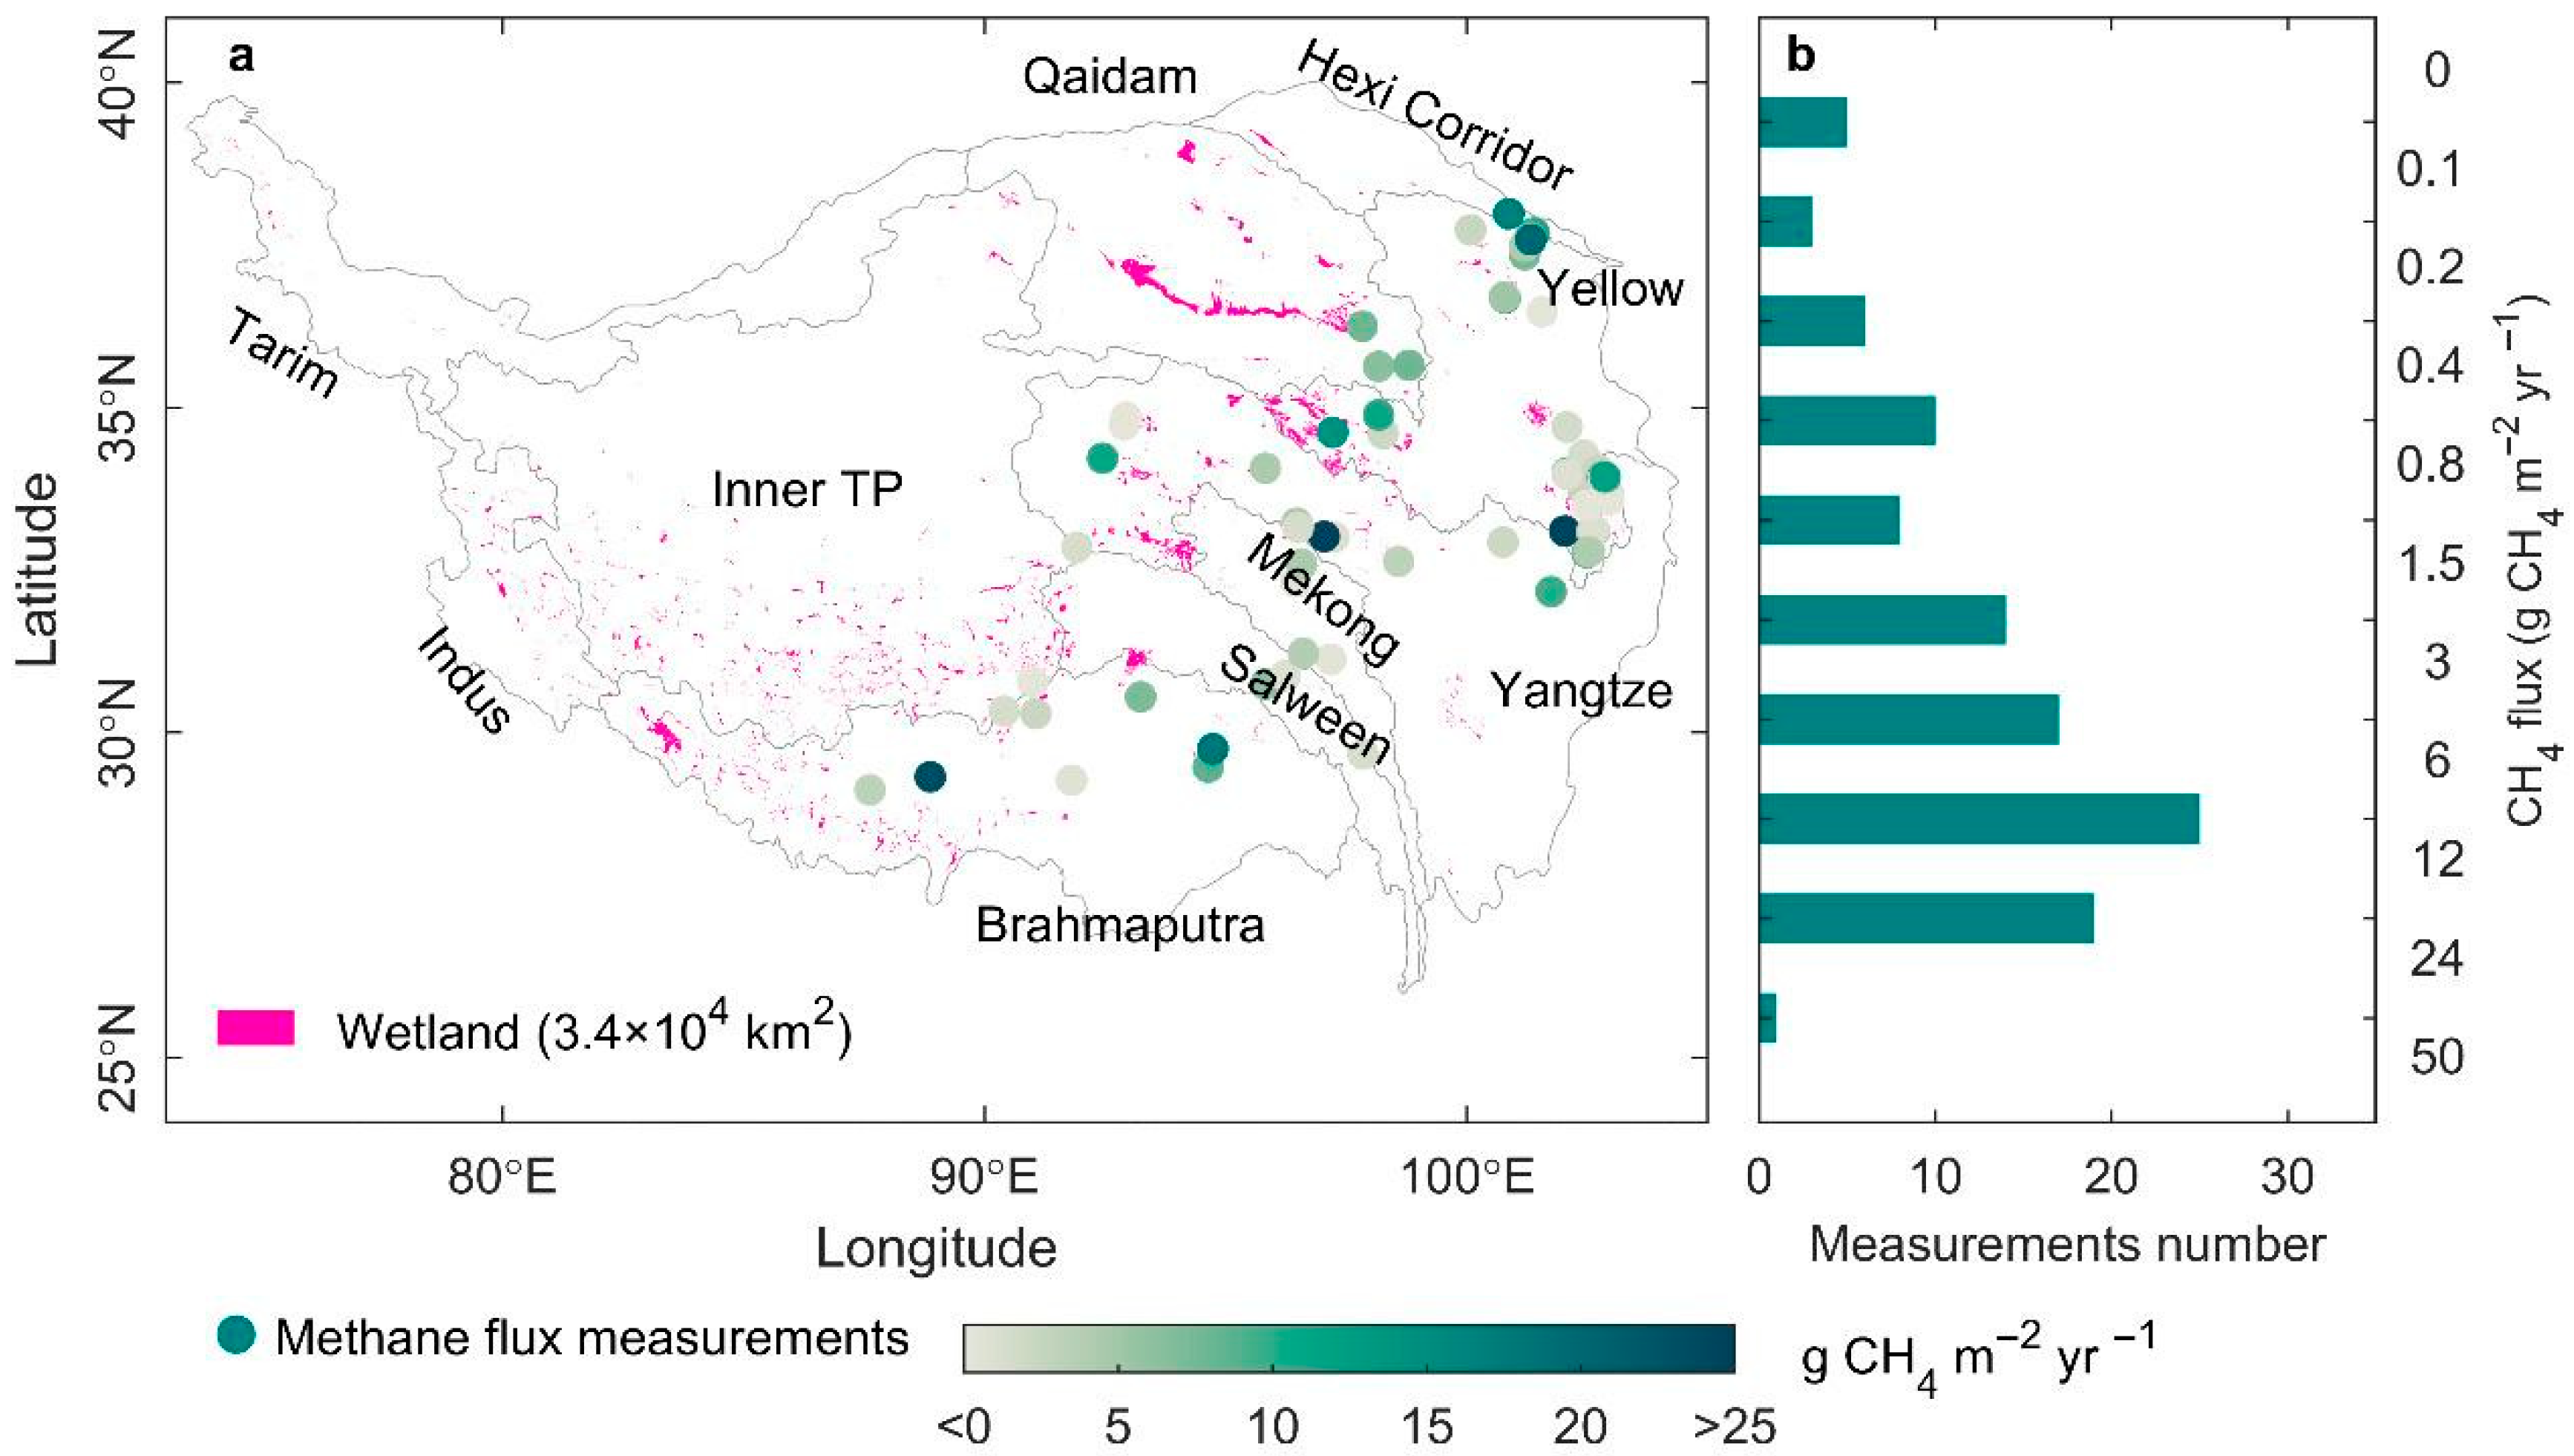
Figure 1. Distribution of wetland and CH4 flux measurement samples site over the TP. (a) The pink area represents the 2015 30 m wetland distribution mapping through manual interpretation. Green point indicates in situ flux measurement samples site for wetland CH4. (b) Histogram of the frequency distribution of flux values for in situ measurement samples.
Water 17 02491 g001
Figure 2. Validation of wetland CH4 emission model on the TP. (a) Relationship of the predicted CH4 emissions with the observed measurements in wetlands, along with the 1:1 line (black dashed line) and regression line (blue solid line). In this study, the wetland CH4 emission for 108 in situ measurements was estimated by connecting seven major driving factors (including temperature, moisture, environment) using an RF model (Section 3.1). R2 represents the coefficient of determination. (b) The importance ranking of the seven factors in contributing to the model results.
Water 17 02491 g002
Figure 3. Spatial distribution of wetland CH4 emission intensity on the TP. (a,b) The spatial distribution of wetland CH4 emission intensity on the TP in 2015, averaged through observation simulation and multiple land surface models, respectively. The size of each circle indicates the wetland area at a spatial resolution of 0.1° in 2015. (c) Statistics for different river basins.
Water 17 02491 g003
Figure 4. Wetland CH4 emissions in different historical periods on the TP. The two different bar charts represent the total CH4 emissions and average emission intensity of wetlands on the plateau during various periods. The radar chart illustrates the statistics of wetland area using two different wetland distribution datasets employed by observations and LSMs throughout the historical periods.
Water 17 02491 g004
Figure 5. Distribution of wetland CH4 emission changes on the TP in historical periods. By limiting the changes of CH4 emission flux and wetland area, we calculated (b) wetland CH4 emissions changes with variations in both CH4 flux and wetland area, (d) wetland CH4 emissions changes when CH4 emission flux is maintained at 1980s levels while the wetland area varies, and (f) wetland CH4 emissions changes when CH4 flux varies while maintaining the wetland area at the 1980s levels. (a), (c), and (e) represents the statistics of different river basins in these three scenarios, respectively.
Water 17 02491 g005
Figure 6. Spatial distribution of the sensitivity of wetland CH4 emission intensity to climate on the TP. The color of each point in (a) represents the CH4 emission intensity, with black dots indicating observational results corrected for seasonal wetland changes. (b) and (c) represents the average temperature and annual precipitation of 2015, respectively.
Water 17 02491 g006
Figure 7. Changes in CH4 emission fluxes from wetlands on the TP under three different emission scenarios in the future. The black, blue, and red curves represent the wetland CH4 emission fluxes under three emission scenarios: low (SSP 1-2.6), medium (SSP 3-7.0) and high (SSP 5-8.5), respectively.
Water 17 02491 g007
Table 1. Land surface models that computed TP wetland CH4 emissions used in this study.
ModelInstitutionReferences
CLASS-CTEMEnvironment And Climate Change CanadaArora et al. (2018) [38]
ELMLawrence Berkeley National LaboratoryRiley et al. (2011) [39]
JSBACHMpiKleinen et al. (2020) [40]
JULESUkmoHayman et al. (2014) [41]
LPJ-MPIMpiKleinen et al. (2012) [42]
LPJ-WSLNasa GsfcZhang et al. (2016) [43]
LPX-BernUniversity of BernSpahni et al. (2011) [44]
ORCHIDEELsceRingeval et al. (2011) [45]
VISITNiesIto and Inatomi (2012) [46]
Table 2. Total CH4 emissions of historical and future estimates that under the three emission scenarios based on seasonal variability correction for TP wetlands.
Basin1978s
(Gg CH4 year−1)
2016s
(Gg CH4 year−1)
2100s
(Gg CH4 year−1)
SSP1-2.6SSP3-7.0SSP5-8.5
Brahmaputra9.616.916.617.118.5
Salween2.743.143.073.173.42
Mekong4.642.932.862.963.19
Indus2.373.733.653.784.07
Yangtze42.328.928.329.231.5
Yellow75.337.236.337.640.5
Inner TP29.435.234.435.638.4
Qaidam17.013.713.413.814.9
Tarim12.54.64.484.635.00
Hexi Corridor1.940.840.820.850.91
Total TP179.6147.9143.8148.8160.5
Disclaimer/Publisher’s Note: The statements, opinions and data contained in all publications are solely those of the individual author(s) and contributor(s) and not of MDPI and/or the editor(s). MDPI and/or the editor(s) disclaim responsibility for any injury to people or property resulting from any ideas, methods, instructions or products referred to in the content.