Article

Groundwater Flow Impact in Complex Karst Regions Considering Tunnel Construction Conditions: A Case Study of the New Construction Project at XLS Tunnel

1
Key Laboratory of Groundwater Protection and Utilization—National Key Laboratory Cultivation and Development Site, School of Earth Sciences and Engineering, Hohai University, Nanjing 210098, China
2
Changjiang Survey Planning Design and Research Co., Ltd., Wuhan 430010, China
*
Author to whom correspondence should be addressed.
Water 2025, 17(16), 2383; https://doi.org/10.3390/w17162383
Submission received: 21 July 2025 / Revised: 9 August 2025 / Accepted: 10 August 2025 / Published: 12 August 2025
(This article belongs to the Section Hydrogeology)

Abstract

Tunneling in structurally complex, tectonically active regions such as southwest China poses significant environmental risks to groundwater, especially in heterogeneous karst fault systems where conventional prediction methods often fail. This study innovatively coupled MODFLOW’s STREAM package (for simulating karst conduit networks) and DRAIN package (for tunnel inflow prediction) within a 3D groundwater model to assess hydrogeological impacts in complex mountainous terrain. The simulations show that an uncased tunnel lining causes significant groundwater changes under natural conditions, with predicted inflows reaching 34,736 m3/d. Conventional cement grouting (permeability: 1 × 10⁻⁵ cm/s; thickness: 10 m) mitigates the effects considerably and reduces the inflows in the tunnel sections by 27–97%. Microfine cement grouting (5 × 10⁻⁶ cm/s; 10 m thickness) further improves performance by achieving a 49–98% reduction in inflows and limiting the reduction in spring discharge to ≤13.28%. These results establish a valid theoretical framework for predicting groundwater impacts in heterogeneous terrain and demonstrate that targeted seepage control—particularly grouting with microfine cement—effectively protects groundwater-dependent ecosystems during infrastructure development.

1. Introduction

Tunnel excavation, commonly employed in engineering sectors such as mining, transportation infrastructure, and water conservancy, inevitably perturbs the surrounding groundwater regime. This disturbance manifests as a decline in groundwater levels, diminished spring discharge, depletion of domestic and industrial water supply wells, and potentially severe hydrogeological consequences, including ground subsidence, ground fissuring, wetland degradation, and land desertification [1,2]. Hydrogeological impacts induced by tunnel excavation are often characterized by their latent nature, time-lag effects, and irreversible consequences. Consequently, predictive research on the influence of tunnel excavation on adjacent groundwater systems holds significant importance for safeguarding water resource security and ecological sustainability [3].
The inherent heterogeneity and anisotropy of groundwater aquifers significantly complicate subsurface flow dynamics, thereby amplifying the complexity of hydrogeological disturbances induced by tunnel construction. Within the tectonically active fault zone along the southeastern margin of the Tibetan Plateau in Southwest China, intensively developed fold structures associated with regional-scale fractures, coupled with well-developed karst conduits, collectively render the regional rock mass exceptionally anisotropic [4,5,6]. This configuration establishes a hydro-geologically vulnerable and responsive system, where tunnel excavation triggers more significant and unpredictable hydrogeological impacts.
Traditional approaches for predicting groundwater environmental impacts induced by tunnel construction primarily encompass the empirical formula method and the analytical formula method. The empirical formula method neglects geological complexity by simplifying aquifers as homogeneous and isotropic media, treating the hydraulic conductivity (K) as the sole governing parameter [7,8]. The analytical formula method—including the mirror method [9], the Shaft method [10] and other methods [11,12]—shares the inherent limitation of relying on simplified assumptions. Critically, these conventional methods fail to account for hydraulic anisotropy and scale effects (especially the REV—Representative Elementary Volume—dependence) in fractured rock masses. Consequently, they exhibit limited applicability in karst aquifers or discrete fracture networks and cannot respond to dynamic groundwater fluctuations. This leads to substantial deviations between predicted results and the technical reality.
Driven by innovations in computational technology and breakthroughs in numerical simulation techniques—such as the Finite Element Method (FEM) and Finite Difference Method (FDM) [13,14,15,16]—the prediction of groundwater environmental impacts has transitioned from traditional approaches to advanced numerical modeling [17,18,19,20,21]. This paradigm shift progressively resolves limitations imposed by oversimplifying assumptions in conventional methods, enabling robust simulations in complex geological settings [22,23,24]. For instance, Xia [25] developed a tunnel inflow simulation method based on nested local grid refinement (LGR) within the MODFLOW framework. Validated through a case study of a deeply buried railway tunnel in Yunnan, China, this approach achieved dynamic tracking of transient seepage fields during tunnel advancement through water-rich fault zones. Compared to static conventional models, it enhanced computational efficiency by 47% while reducing groundwater level prediction errors from ±12.3% to ±4.7%. Furthermore, Bai et al. [26] addressed the dual-continuum characteristics (conduit-fracture coupled transport) of karst aquifers. By enhancing the MODFLOW-Conduit Flow Process (CFP) module, they formulated a construction-disturbance coupled simulation method, establishing a joint solution algorithm for flow regime transformation and solute transport during excavation phases. Additionally, Vilhelmsen et al. [27] implemented multiscale coupled simulations using MODFLOW-LGR (Local Grid Refinement), employing hierarchical mesh refinement (minimum cell size: 0.5 m) to resolve near-tunnel seepage dynamics while maintaining regional aquifer representation (50 m grid scale). MODFLOW-CFP is widely used in karst aquifers [28,29]. However, its characterization of karst conduits requires complex parameters (diameter, tortuosity), and it often fails to adequately characterize large-scale or complex karst systems.
This study establishes a representative tunnel case in Southwest China to develop a three-dimensional numerical groundwater flow model using the MODFLOW framework. The model simulates tunnel-induced perturbations in groundwater flow regimes under structurally complex geological conditions, incorporating multiple tunnel advancement scenarios to assess hydrogeological impacts. The primary objective is to provide a robust theoretical framework and technical protocols for evaluating groundwater environmental impacts during tunnel excavation in geologically heterogeneous terrains.

2. Methods

To characterize groundwater environmental impacts induced by tunnel excavation under complex geological conditions in the study area, the aquifer system was conceptualized as a three-dimensional heterogeneous and anisotropic equivalent continuum medium. Simulations employed the mathematical model of steady-state groundwater flow, governed by the following governing equation:
x ( K x H x )   +   y ( K y H y )   +   z ( K z H z )   +   ε   =   0 ( x ,   y ,   z ) Ω H ( x ,   y ,   z )   =   H Γ ( x ,   y ,   z ) ( x ,   y ,   z ) Γ 1 K x H x   +   K y H y   +   K z H z   =   q 0 ( x ,   y ,   z )       ( x ,   y ,   z ) Γ 2
where H is the groundwater head (m); K x , K y and K z are anisotropic main permeability coefficients (m/d); ε is the source and sink term strength (1/d); Ω is the seepage area; Γ1 is the Dirichlet boundary (the constant head boundary); Γ2 is the Neumann boundary (the constant flow boundary); H   ( x , y , z ) is the initial head; H Γ ( x ,   y ,   z ) is the head of the Dirichlet boundary (m); and q 0 ( x ,   y ,   z ) is the flow rate of the Neumann boundary (m2/d).
This study utilized GMS 10.7 (Groundwater Modeling System) to establish the three-dimensional hydrogeological structural model and groundwater flow model. The DRAIN [30] package within MODFLOW was utilized to simulate tunnel inflow. This package is specifically designed to simulate the drainage effect induced by tunnel excavation. The DRAIN package functions by discharging water from the aquifer when the aquifer head exceeds the specified discharge height (also referred to as the drain head). The drainage rate is proportional to the difference between the aquifer head and the drain head. The proportionality constant is termed the conductivity of the channel. While the DRAIN package simulates a physical process conceptually similar to aquifer drainage, a key distinction is its unidirectional behavior: it allows water to discharge from the aquifer when the aquifer head is above the drain elevation but prevents inflow into the aquifer when the aquifer head falls below the drain elevation.
Q o u t = C h i , j , k H D , h i , j , k > H D Q o u t = 0 , h i , j , k H D
where Q o u t is the flow rate from the aquifer into the drainage ditch (m3/d), C is the drainage coefficient (m2/d), H D is the Drain elevation (m) and h i , j , k is the water head (m) in DRAIN.
This study targets a region with well-developed karst aquifer systems, where MODFLOW’s STREAM [31] package was employed to characterize groundwater flow in karst conduit systems. Beyond simulating river–aquifer flow exchanges, the STREAM package routes water through stream networks (including tributaries and diversions) via sequential reach computations. This is implemented as follows:
Q u p s t r e a m = Q d o w n s t r e a m ± Q l e a k a g e
where Q u p s t r e a m is the flow of the upstream reach (m3), Q d o w n s t r e a m is the flow of the downstream reach (m3), Q l e a k a g e is the adding or subtracting leakage to the aquifer in STREAM.
This routing process is repeated for the next downstream reach and so forth. Consequently, unlike the River Package, where channelized water exits the model domain, STREAM preserves flow continuity, enabling water to travel downstream and possibly reenter the aquifer at another point. Furthermore, its capacity to simulate ephemeral channel drying during specified stress periods aligns particularly well with the transient behavior of subsurface karst conduit systems.

3. Case Analysis

3.1. Site Description

The Dianzhong Water Diversion Project plays a crucial role in utilizing water from the Jinsha River, employing water pumping stations for extraction. Specifically designed as a first-level underground station, it is nestled in the mountains along the right bank of the Chongjiang River. The project draws water approximately 1.5 km upstream from Shigu, directing it through a 1.27 km detour channel, then via a 3.0 km tunnel and a 0.8 km culvert to an underground pump above Zhuyuan Village. From there, water ascends to the Xianglushan (XLS) Tunnel entrance, traversing pipelines ranging from 4563.58 m to 4337.40 m in length. The research area is situated at the junction of the Hengduan Mountains and Yunnan–Guizhou Plateau.
The project area forms the watershed divide between the Jinsha River (Yangtze headwaters) and the Lancang River (Mekong headwaters) systems. Mountain elevations range from 3200 to 3900 m ASL, with incision depths of ~1200 m, classifying it as a deeply dissected high-mountain landscape. Valley morphology is predominantly V-shaped, with poorly developed terraces and localized alluvial deposits only in broad, low-gradient river sections.
Stratigraphic succession of bedrock exposures (oldest to youngest): Gray to pale gray marls, bioclastic limestones, and pure limestones (S2b); Massive gray limestones, banded limestones interbedded with biohermal reefs (D1q); Basalts with tuff intercalations (Pβ); Gray sandstones, shales with limestone lenses and coal seams (P2h); Sandstones and siltstones interbedded with argillaceous shales (T1q); argillaceous limestones with siltstone and shale partings (T2b1).
The modeled tunnel section spans a total length of 31.478 km, primarily traversing the Heqing Xishan (HQX) karst system and the Qingshui–Jianchuan (QS-JC) karst system. The model incorporates the newly added Shaft 32#, Shaft 34#, Branch tunnel 6#, and realigns the main tunnel section. The area encompassed by the model, defined by the hydrogeological boundaries of the karst systems associated with the tunnel, is illustrated in Figure 1.
The research area covers an area of 91.6 km2. Within this region, groundwater is delineated into four distinct karst systems. Groundwater is primarily hosted within limestone formations and localized Quaternary deposits. The primary flow conduits are transmissive faults and karst conduits.
Recharge to the shallow aquifer originates predominantly from precipitation, while discharge occurs primarily through groundwater extraction, evaporation, and spring outflow. The deep aquifer receives recharge mainly via downward leakage from overlying aquifers and regional groundwater circulation. Its primary discharge mechanisms include extraction, spring discharge, and lateral outflow. Faults and karst windows within the region facilitate hydraulic connectivity between the upper and lower aquifers, resulting in a unified, mixed aquifer system.
Based on the tunnel construction plan and the surrounding geological and environmental conditions within the study area, groundwater environmental protection targets (GEPT) were listed in Table 1. The specific locations of these GEPTs are indicated in Figure 2.

3.2. Model and Parameter Settings

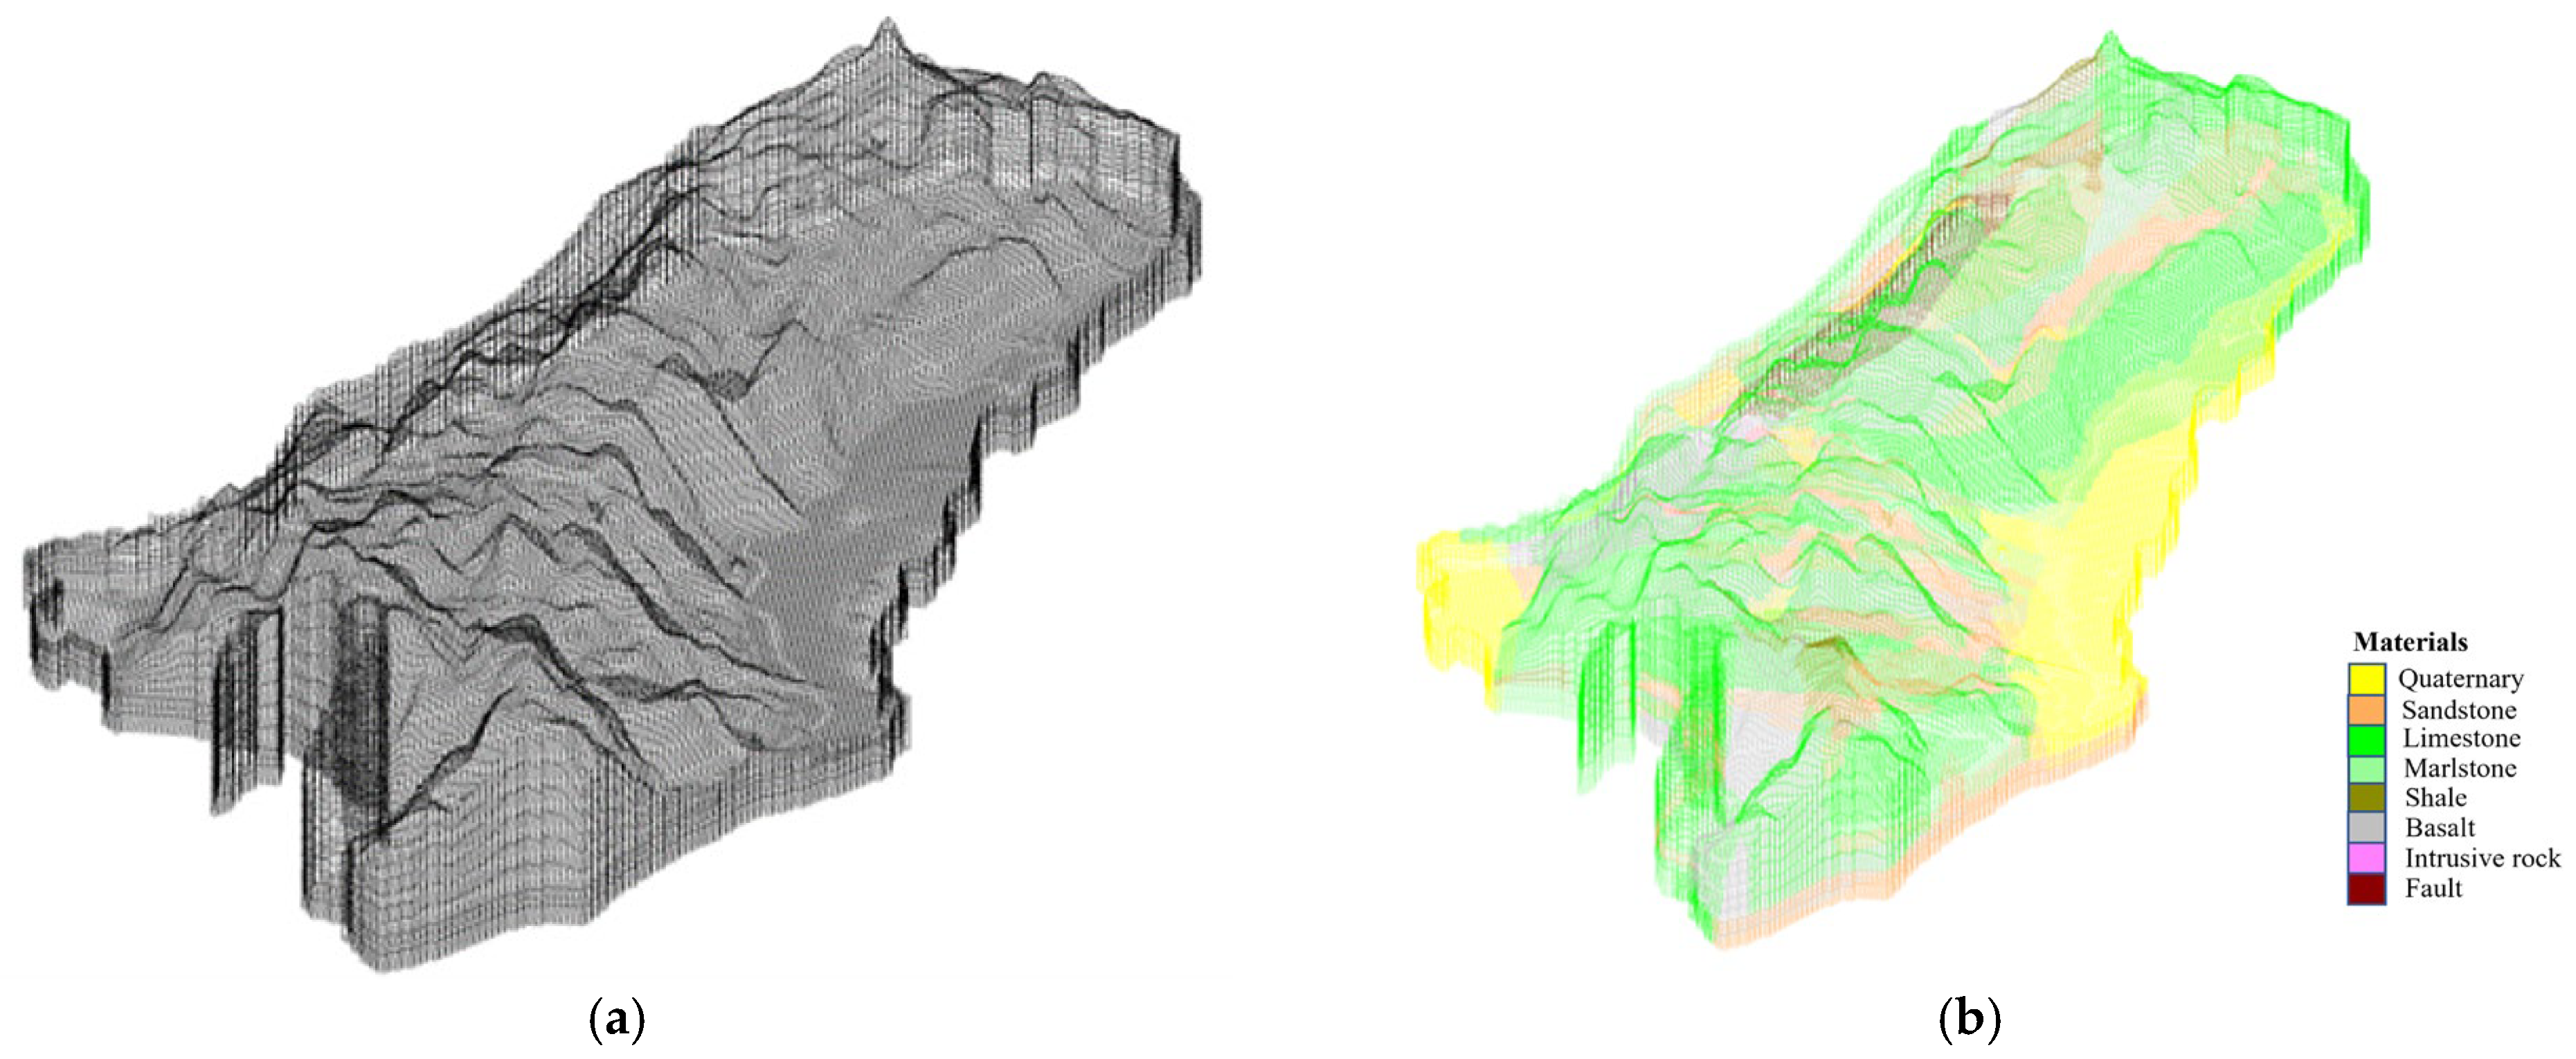
A 3D geological visualization model was constructed using borehole data. Lithological stratification was constrained by 112 boreholes. Corresponding hydrogeological parameters were assigned to distinct lithologic units based on their identified rock types. The meshing and lithology division of the study area is shown in Figure 3. The simulation domain was discretized using a structured grid with 200 × 200 cells horizontally and subdivided into 10 layers vertically. Layer 8 possesses a uniform thickness of 35 m, with an elevation range from 2000 m to 2035 m above sea level (ASL), configured to represent the tunnel horizon. The elevations of other layers were proportionally distributed based on their top boundary elevations to maintain vertical heterogeneity.
Consequently, the groundwater flow regime within the study area is conceptualized as a three-dimensional, heterogeneous, and anisotropic system. The primary rivers and major identified subterranean rivers within the study area were assigned as Dirichlet boundary (the constant head) boundaries. Hydraulic head values and streambed leakance parameters were prescribed for these boundaries. Major watershed divides and impervious faults were designated as no-flow boundaries. The remaining lateral boundaries were assigned as the Neumann boundary (the constant flow) boundaries, with flux magnitudes determined based on the discharge rates of springs. The upper model boundary receives recharge via precipitation infiltration. The basal boundary, constrained by borehole data to approximately 1800 m ASL, was set as an impervious basement boundary.
Permeability parameters for rock masses within the study area were primarily determined through field tests, including packer tests and injection tests. Based on results from field packer tests and slug tests, a comprehensive range of hydraulic conductivity values has been established. In subsequent phases, model calibration was performed to identify the optimal parameter set that minimizes the misfit between simulated and observed results. The following Table 2 shows the range of lithological generalization types and corresponding permeability coefficients in the model.
Statistical analysis of hydrological station data within the study area reveals that the mean annual precipitation ranges from 833.8 mm to 1020.2 mm, with a pronounced disparity between wet and dry seasons and a negligible intermediate season. Precipitation during the wet season (May to October) accounts for 807.3–946.2 mm, representing 90.8–97.8% of the annual total. In contrast, the dry season (November to April) receives only 26.5–44.9 mm, constituting 3.2–9.2% of yearly precipitation.
In the MODFLOW model, recharge is governed by the Recharge rate parameter, defined as the product of precipitation and the rainfall infiltration coefficient. This coefficient exhibits significant spatial heterogeneity across lithologies, necessitating zone-specific assignments based on geological characteristics. Furthermore, topography critically modulates infiltration: convergent terrains (e.g., valleys and depressions) enhance infiltration coefficients, whereas steep slopes markedly reduce them.
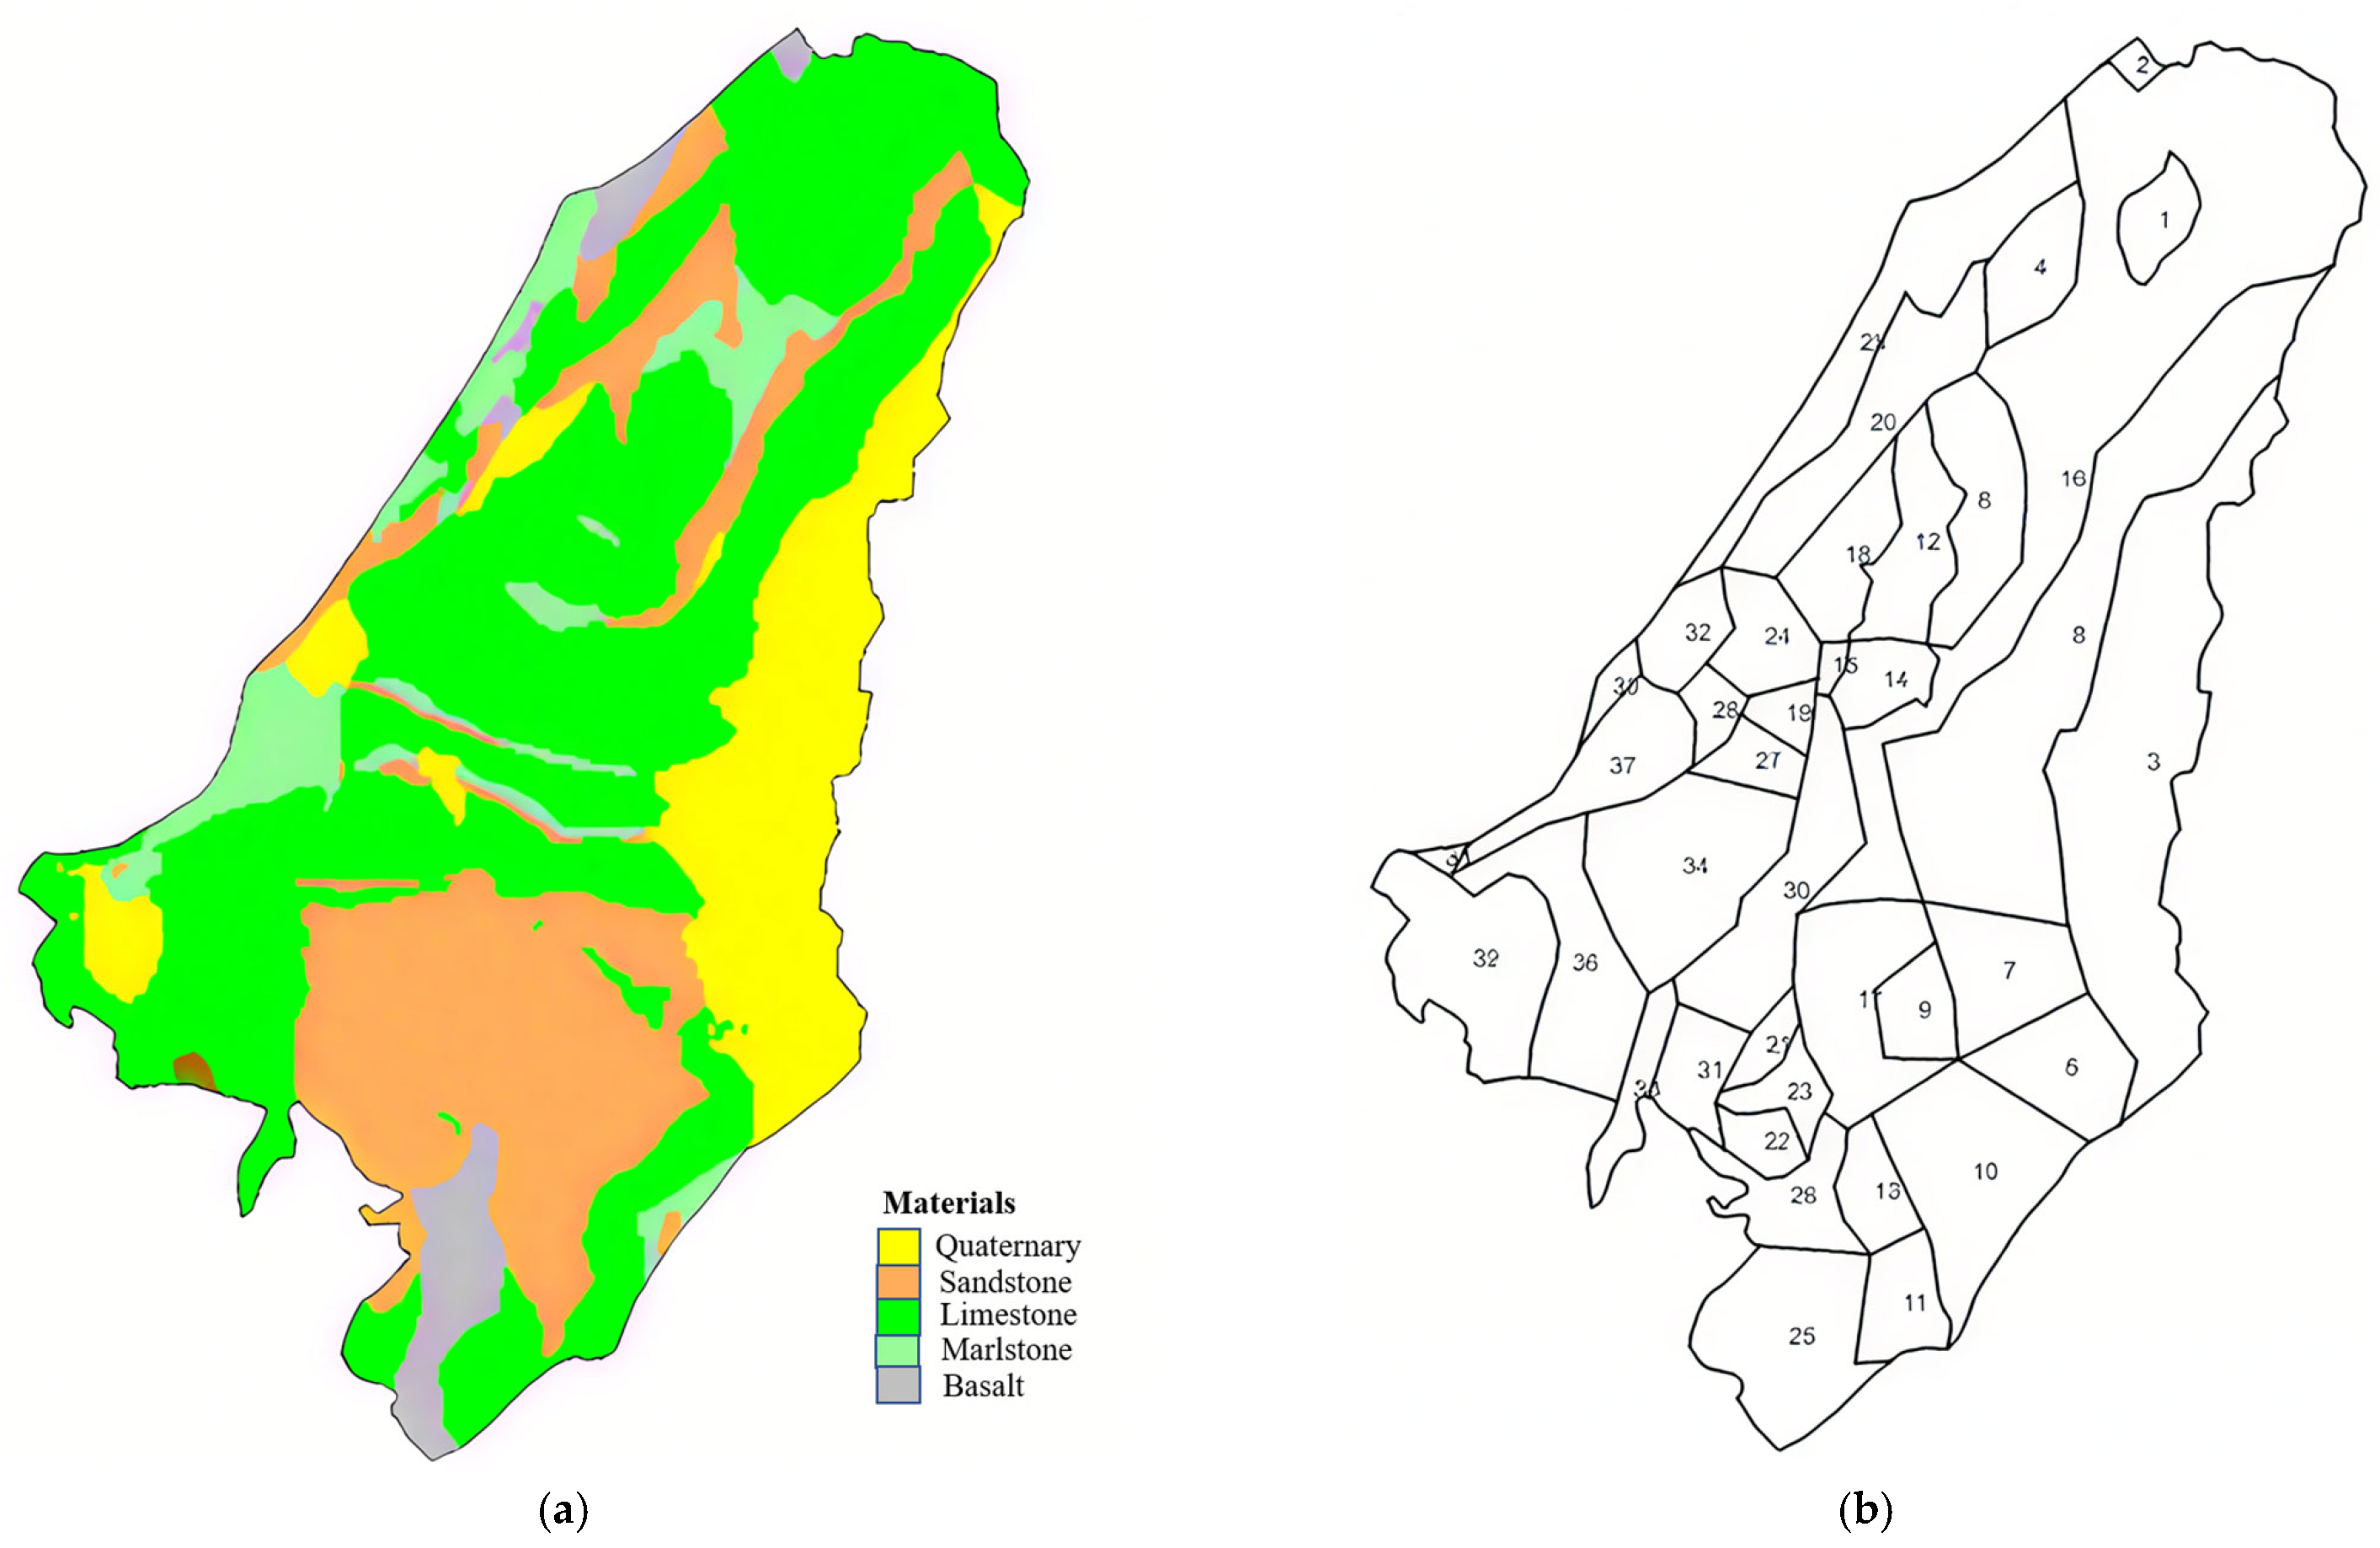
Therefore, this study delineated 39 distinct rainfall infiltration zones by integrating regional lithological distributions and topographic features (as shown in Figure 4b).

3.3. Model Calibration

Model calibration is a critical process that determines the fidelity of numerical simulations to real-world conditions and the reliability of predictive outcomes. In hydrogeological physical systems, spatiotemporal groundwater level fluctuations represent the most salient manifestation of model behavior. Consequently, hydrogeological model calibration is primarily evaluated through the goodness-of-fit between simulated and observed hydraulic heads. The model calibration process involved refining model configurations and parameter values to minimize discrepancies between computational results and field measurements, thereby ensuring the accuracy of predictive simulations.
Therefore, to ensure the constructed groundwater flow model accurately represents the hydrogeological regime of the study area and reliably predicts environmental impacts induced by tunnel construction, calibration was performed using observed water levels from monitoring boreholes within the model domain. Permeability coefficients (K) fields were optimized exclusively through PEST-based inverse modeling to minimize head residuals at eight observed boreholes. Through iterative refinement of parameter values within plausible ranges across designated model zones, simulated borehole water levels were brought into alignment with field measurements (as shown in Figure 5).
Calibration performance was quantified using the following statistical metrics: mean absolute residual (MAR), root mean square error (RMSE), residual sum of squares (RSS), target minimum (the minimum observed value), and target maximum (the maximum observed value). The specific calculation formulas for each indicator are shown below:
M A R = 1 n i = 1 n | e i |
R M S E = 1 n i = 1 n   e i 2
R S S = i = 1 n   e i 2
where e i   is the residual value and n is the number of samples.
The results of the indicators are shown in Table 3. The low MAR (3.06 m) and RMSE (4.01 m) values represent <0.2% of the total head range (500 m), while the negligible mass balance error (0.02%) confirms rigorous conservation of hydrological mass. These metrics collectively validate the model’s reliability.
Through iterative parameter adjustment, the model achieved satisfactory agreement between simulated and observed hydraulic heads, with close correspondence at most observing boreholes. The calibrated Permeability coefficients (K) adopted in the final model configuration are summarized in Table 4.

3.4. Simulation Results

To investigate the specific impact of tunnel construction on the groundwater regime within the study area, the water inflow rates into the main tunnels post-excavation were predicted through computational modeling. Three distinct conditions were defined in accordance with construction design specifications and seepage control requirements: Condition 1—natural conditions (unlined tunnel without grouting). Condition 2—conventional cement grouting (grouted zone permeability: 1 × 10⁻⁵ cm/s; thickness: 10 m). Condition 3—microfine cement grouting (grouted zone permeability: 5 × 10⁻⁶ cm/s; thickness: 10 m). Grouting was omitted in cases where the surrounding rock mass permeability was less than or comparable to that of the grouted zone. The prediction of groundwater level changes under the three working conditions of each construction tunnel is shown in Figure 6. The predicted water inflow rates derived from numerical simulations under these scenarios are shown in Table 5.
It can be seen from the groundwater level map after the construction of the tunnel under three different working conditions that the falling funnel formed by the tunnel excavation under natural working conditions is larger, and the influence radius is larger. The landing funnel formed by the Shaft is significantly smaller than that under natural grouting conditions under ordinary cement and finely ground cement grouting, and the influence radius is also smaller. It is indicated that the influence of Shaft excavation on the surrounding groundwater flow field can be effectively reduced by grouting treatment. According to the prediction results of the water inflow of tunnel excavation under different working conditions, the water inflow of the tunnel section is significantly reduced after grouting treatment, and the water inflow in the construction of the Shaft can be reduced by more than 90%, and the grouting treatment in the 6# Branch tunnel and the realigned main tunnel section can reduce the water inflow by 60% compared with the bare tunnel condition, and the water inflow is further reduced under the microfine grouting condition.
To further assess the impact of tunnel excavation on the surrounding groundwater regime, this study employed a 3D seepage flow model to predict and analyze the effects on spring discharge rates at environmentally sensitive spring sites under various construction scenarios.
The computational results are presented in Table 6. Analysis reveals that the most significant reduction in spring discharge occurs at the Heinishao Village Spring, located at the junction area of the main tunnel modified section and Branch Tunnel 6#. Implementation of grouting measures effectively mitigates this reduction magnitude. Conventional grouting prevented complete desiccation at two high-risk springs (Heinishao Spring and Aqing River supply), reducing discharge depletion from 100% to ≤28.56% across all sites. Microfine grouting further minimized ecological disruption, limiting maximum discharge loss to 12.38% (vs. 67.94% under natural conditions) and ensuring no spring exceeded 10% depletion except Heinishao (13.28%).

4. Discussion

The findings of this study demonstrate the significant efficacy of microfine cement grouting in mitigating tunnel-induced groundwater impacts within complex karst terrains, reducing inflows by 49–98% and limiting spring discharge depletion to ≤13.28%. However, the success and applicability of such grouting techniques are inherently contingent upon site-specific geological conditions, logistical feasibility, and economic considerations. Our model-based insights offer valuable perspectives for stakeholders but warrant contextualization against geological heterogeneity, temporal dynamics, and practical constraints.

4.1. Geological Controls on Grouting Efficacy

The performance of grouting—particularly microfine cement—varies markedly across lithologies and structural settings. In highly jointed/fractured limestone (e.g., Shaft 32#/34# sections), microfine cement achieved >95% inflow reduction. In fault zones (e.g., realigned tunnel segments), conventional and microfine grouting showed lower efficacy (27–88% reduction). Here, chemical grouts or sequential grouting protocols may be preferable but entail higher costs and environmental risks [32]. In low-permeability basalts/mudstones (e.g., Branch Tunnel 6#), grouting provided modest benefits (27–49% inflow reduction), as intrinsic permeability approached grouted zone values. Hydraulic fracturing remains a critical risk in such settings if injection pressures exceed rock tensile strength, potentially exacerbating connectivity [33]. Thus, grouting design must integrate geological characterization to optimize injectate selection.

4.2. Practical Implications and Cost–Benefit Trade-Offs

While microfine cement grouting outperformed conventional methods, its adoption entails logistical and economic challenges. Material costs are typically 2–3× higher than ordinary Portland cement, and injection requires specialized equipment and stringent quality control. However, the dramatic reduction in long-term tunnel inflow (e.g., 93.83% decrease in Realigned Tunnel high-K zones) translates to lower operational pumping costs and minimized ecological compensation expenses. For projects traversing water-sensitive ecosystems (e.g., the Dianzhong Water Diversion Project), this trade-off favors advanced grouting, potentially preventing spring desiccation and preserving local water security. Our MODFLOW-STREAM/DRAIN coupling provides a robust platform for such cost–benefit analyses, enabling designers to spatially optimize grouting zones (e.g., targeting karst conduits identified in Figure 1) while avoiding over-treatment in low-K strata.

4.3. Model Advancements and Limitations

The integration of the MODFLOW’s STREAM (karst conduits) and DRAIN (tunnel inflow) packages represents a pragmatic advance for simulating groundwater flow in complex karst regions. Our approach using the STREAM package provided sufficient accuracy for regional-scale impacts while avoiding the computational intensity of CFP simulations [34], particularly critical given our large model domain (91.6 km2) with >1.2 million cells. CFP requires explicit conduit geometry data (diameter, tortuosity) unavailable in this project, whereas STREAM could be parameterized using the computable addition or subtraction of leakage to the aquifer. Also, STREAM’s ability to simulate flow cessation in conduits during dry seasons aligned with observed seasonal drying of karst windows in the study area—a feature less efficiently implemented in CFP.
Nevertheless, uncertainties persist in highly heterogeneous fault zones, where equivalent continuum parameters may inadequately represent localized preferential flow. Future work should incorporate stochastic fracture generators or machine learning-based [35] K-field ensembles to quantify prediction bounds.

5. Conclusions

This study employed a MODFLOW hydrogeological model to predict the impacts of tunnel construction on groundwater systems in a mountainous region of Southwest China. The model incorporated detailed lithological characterization and parameter zonation to address complex geological conditions, explicitly accounting for rock mass anisotropy during the construction of the hydrogeological framework. The model evaluated post-excavation water inflow rates and associated impacts on the surrounding groundwater regime. The principal findings are summarized as follows:
(1)
Under natural conditions (unlined tunnel scenario), tunnel construction would induce substantial perturbations in the groundwater flow field. Significant water inflows are predicted. Conventional grouting reduced inflows by 27–97% across sections, most effectively in shafts (>90% reduction at 20/24 segments). Microfine cement grouting enhanced mitigation to a 49–98% reduction, particularly in high-inflow zones.
(2)
Implementation of appropriate seepage control measures can also significantly mitigate these construction-related impacts on the local groundwater environment. Unlined excavation would desiccate two springs and reduce discharge at others. Conventional grouting prevents the drying up of spring points and effectively reduces the decrease in spring flow. Microfine cement grouting can further mitigate the impact of tunnel construction on the GEPTS.

Author Contributions

Z.C. (Zhou Chen): conceptualization, formal analysis, writing—review and editing, visualization; H.Z.: software, formal analysis, investigation, writing—original draft; Q.S.: software, validation, formal analysis, investigation; Z.C. (Zihao Chen): conceptualization, formal analysis, writing—review and editing, visualization; K.W.: resources and software; C.C.: conceptualization and investigation. All authors have read and agreed to the published version of the manuscript.

Funding

This work was supported by the Jiangsu Provincial Natural Science Foundation General Project (BK20221507), General Program of National Natural Science Foundation of China (42377079).

Data Availability Statement

Data is contained within the article.

Acknowledgments

The authors acknowledge valuable comments from the reviewers, which led to significant improvement of the paper.

Conflicts of Interest

Author Changsheng Chen was employed by the company Changjiang Survey Planning Design and Research. The remaining authors declare that the research was conducted in the absence of any commercial or financial relationships that could be construed as a potential conflict of interest.

References

  1. Chen, Z.; He, C.; Zhang, Y.; Xu, Z.; Li, Z.; Yu, B. The impact of formation heterogeneity on water discharge and groundwater depletion of an excavated tunnel. J. Hydrol. 2023, 627, 130403. [Google Scholar] [CrossRef]
  2. Gokdemir, C.; Rui, Y.; Rubin, Y.; Li, X. A framework for assessing tunnel drainage-induced impact on terrestrial vegetation. Tunn. Undergr. Space Technol. 2023, 132, 104917. [Google Scholar] [CrossRef]
  3. Zhang, C.; Liu, N.; Chen, K.; Ren, F. Study on drainage mode and anti-clogging performance of new waterproofing and drainage system in a tunnel. Sci. Rep. 2023, 13, 5354. [Google Scholar] [CrossRef] [PubMed]
  4. Teng, Z.; Liu, Y.; Zhou, Y.; Li, Y.; Mei, S.; Chen, Q.; Chen, L.; Du, B. Investigation of a new reverse drainage construction and the pressure-reducing effect of a tunnel in a water-rich karst location. Tunn. Undergr. Space Technol. 2024, 145, 105580. [Google Scholar] [CrossRef]
  5. Guo, F.; Jiang, G.; Yuan, D.; Polk, J.S. Evolution of major environmental geological problems in karst areas of Southwestern China. Environ. Earth Sci. 2012, 69, 2427–2435. [Google Scholar] [CrossRef]
  6. Liu, N.; Pei, J.; Cao, C.; Liu, X.; Huang, Y.; Mei, G. Geological investigation and treatment measures against water inrush hazard in karst tunnels: A case study in Guiyang, southwest China. Tunn. Undergr. Space Technol. 2022, 124, 104491. [Google Scholar] [CrossRef]
  7. Bi, J.; Jiang, H.; Ding, W. Analytical solution for calculating the flow rate in a lined tunnel with drainage systems. Tunn. Undergr. Space Technol. 2023, 138, 105132. [Google Scholar] [CrossRef]
  8. Zarei, H.R.; Uromeihy, A.; Sharifzadeh, M. A new tunnel inflow classification (TIC) system through sedimentary rock masses. Tunn. Undergr. Space Technol. 2013, 34, 1–12. [Google Scholar] [CrossRef]
  9. Hwang, J.-H.; Lu, C.-C. A semi-analytical method for analyzing the tunnel water inflow. Tunn. Undergr. Space Technol. 2007, 22, 39–46. [Google Scholar] [CrossRef]
  10. Perrochet, P. A simple solution to tunnel or well discharge under constant drawdown. Hydrogeol. J. 2004, 13, 886–888. [Google Scholar] [CrossRef]
  11. Cheng, P.; Zhao, L.; Luo, Z.; Li, L.; Li, Q.; Deng, X.; Peng, W. Analytical solution for the limiting drainage of a mountain tunnel based on area-well theory. Tunn. Undergr. Space Technol. 2019, 84, 22–30. [Google Scholar] [CrossRef]
  12. Farhadian, H.; Katibeh, H.; Huggenberger, P.; Butscher, C. Optimum model extent for numerical simulation of tunnel inflow in fractured rock. Tunn. Undergr. Space Technol. 2016, 60, 21–29. [Google Scholar] [CrossRef]
  13. Yang, Z.-M.; Wu, S.-C.; Gao, Y.-T.; Jin, A.-B.; Cong, Z.-J. Time and technique of rehabilitation for large deformation of tunnels in jointed rock masses based on FDM and DEM numerical modeling. Tunn. Undergr. Space Technol. 2018, 81, 669–681. [Google Scholar] [CrossRef]
  14. Long, Y.-Y.; Tan, Y. Soil arching due to leaking of tunnel buried in water-rich sand. Tunn. Undergr. Space Technol. 2020, 95, 103158. [Google Scholar] [CrossRef]
  15. Yin, Z.-Y.; Wang, P.; Zhang, F. Effect of particle shape on the progressive failure of shield tunnel face in granular soils by coupled FDM-DEM method. Tunn. Undergr. Space Technol. 2020, 100, 103158. [Google Scholar] [CrossRef]
  16. Zhang, L.; Chen, Y.; Xu, L.; Zhou, S.; Zhou, J.; Su, N. Effects of cyclic loading on soil arching within pile-supported embankment with artificial crust: A coupled DEM-FDM approach. Transp. Geotech. 2023, 42, 101099. [Google Scholar] [CrossRef]
  17. Lv, Y.; Jiang, J.; Chen, L.; Hu, W.; Jiang, Y. Elaborate simulation and predication of the tunnel drainage effect on karst groundwater field and discharge based on Visual MODFLOW. J. Hydrol. 2022, 612, 128023. [Google Scholar] [CrossRef]
  18. Zheng, X.; Yang, Z.; Wang, S.; Chen, Y.-F.; Hu, R.; Zhao, X.-J.; Wu, X.-L.; Yang, X.-L. Evaluation of hydrogeological impact of tunnel engineering in a karst aquifer by coupled discrete-continuum numerical simulations. J. Hydrol. 2021, 597, 125765. [Google Scholar] [CrossRef]
  19. Tian, C.; Xiao, Z.; Ye, F.; Tong, Y.; Cao, X.; Sun, J.; Li, Z. The impact of extreme rainfall and drainage system failure on rock tunnels: A case study of deep-buried karst tunnel. Eng. Fail. Anal. 2025, 171, 109345. [Google Scholar] [CrossRef]
  20. Chen, Z.; Su, Z.; Li, M.; Shen, Q.; Fan, L.; Zhang, Y. Investigation of the Tunnel Water Inflow Prediction Method Based on the MODFLOW-DRAIN Module. Water 2024, 16, 1078. [Google Scholar] [CrossRef]
  21. Huang, Y.; Xu, Y.; Chen, Z.; Shen, Q.; Chen, Z. Three-Dimensional Simulation of Subsurface Flow Dynamics in Karst Conduits at the Jingxian Pumped Storage Hydropower Plant. Water 2025, 17, 533. [Google Scholar] [CrossRef]
  22. Li, Z.; Xiao, J.; Wan, J.; Cheng, J.; Feng, H.; Zhan, H.; Yuan, S.; Huang, K. A dynamic modeling approach to predict water inflow during tunnel excavation in relatively uniform rock masses. Tunn. Undergr. Space Technol. 2024, 146, 105668. [Google Scholar] [CrossRef]
  23. Li, J.; Hong, A.; Yuan, D.; Jiang, Y.; Deng, S.; Cao, C.; Liu, J. A new distributed karst-tunnel hydrological model and tunnel hydrological effect simulations. J. Hydrol. 2021, 593, 125639. [Google Scholar] [CrossRef]
  24. Xu, X.; Huang, G.; Zhan, H.; Qu, Z.; Huang, Q. Integration of SWAP and MODFLOW-2000 for modeling groundwater dynamics in shallow water table areas. J. Hydrol. 2012, 412–413, 170–181. [Google Scholar] [CrossRef]
  25. Xia, Q.; Xu, M.; Zhang, H.; Zhang, Q.; Xiao, X.-x. A dynamic modeling approach to simulate groundwater discharges into a tunnel from typical heterogenous geological media during continuing excavation. KSCE J. Civ. Eng. 2018, 22, 341–350. [Google Scholar] [CrossRef]
  26. Bai, Y.; Wu, Z.; Huang, T.; Peng, D. A Dynamic Modeling Approach to Predict Water Inflow during Karst Tunnel Excavation. Water 2022, 14, 2380. [Google Scholar] [CrossRef]
  27. Vilhelmsen, T.N.; Christensen, S.; Mehl, S.W. Evaluation of MODFLOW-LGR in Connection with a Synthetic Regional-Scale Model. Groundwater 2011, 50, 118–132. [Google Scholar] [CrossRef] [PubMed]
  28. Duran, L.; Gill, L. Modeling spring flow of an Irish karst catchment using Modflow-USG with CLN. J. Hydrol. 2021, 597, 125971. [Google Scholar] [CrossRef]
  29. Kresic, N.; Panday, S. Modeling of groundwater flow and transport in coastal karst aquifers. Hydrogeol. J. 2020, 29, 249–258. [Google Scholar] [CrossRef]
  30. Harbaugh, A.W. MODFLOW-2005, the US Geological Survey Modular Ground-Water Model: The Ground-Water Flow Process; US Department of the Interior, US Geological Survey: Reston, VA, USA, 2005; Volume 6. [Google Scholar]
  31. Prudic, D.E. Documentation of a Computer Program to Simulate Stream-Aquifer Relations Using a Modular, Finite-Difference, Ground-Water Flow Model; No. 88-729; US Geological Survey: Reston, VA, USA, 1989. [Google Scholar]
  32. Liu, J.; Gokdemir, C.; Li, X.; Xi, Y. Experimental and Analytical Study on the External Water Pressure of a Composite Lining Considering the Waterproofing and Drainage System. Rock Mech. Rock Eng. 2024, 58, 1099–1115. [Google Scholar] [CrossRef]
  33. Wang, P.; Li, S.; Li, J.; Zhou, H.; Ma, P.; Tian, Y.; Yuan, C.; Feng, X. Seepage behavior and mechanical properties of two kinds of polyurethane/water glass in combined grouting experiment. Tunn. Undergr. Space Technol. 2023, 136, 105092. [Google Scholar] [CrossRef]
  34. Moreno-Gómez, M.; Kavousi, A.; Martínez-Salvador, C.; Reimann, T. Evaluation of inferred conduit configurations in the Yucatan karst system (Mexico) from gravity and aeromagnetic anomalies, using MODFLOW-CFPv2. Hydrogeol. J. 2024, 32, 1363–1375. [Google Scholar] [CrossRef]
  35. Pham, Q.B.; Kumar, M.; Di Nunno, F.; Elbeltagi, A.; Granata, F.; Islam, A.R.M.T.; Talukdar, S.; Nguyen, X.C.; Ahmed, A.N.; Anh, D.T. Groundwater level prediction using machine learning algorithms in a drought-prone area. Neural Comput. Appl. 2022, 34, 10751–10773. [Google Scholar] [CrossRef]
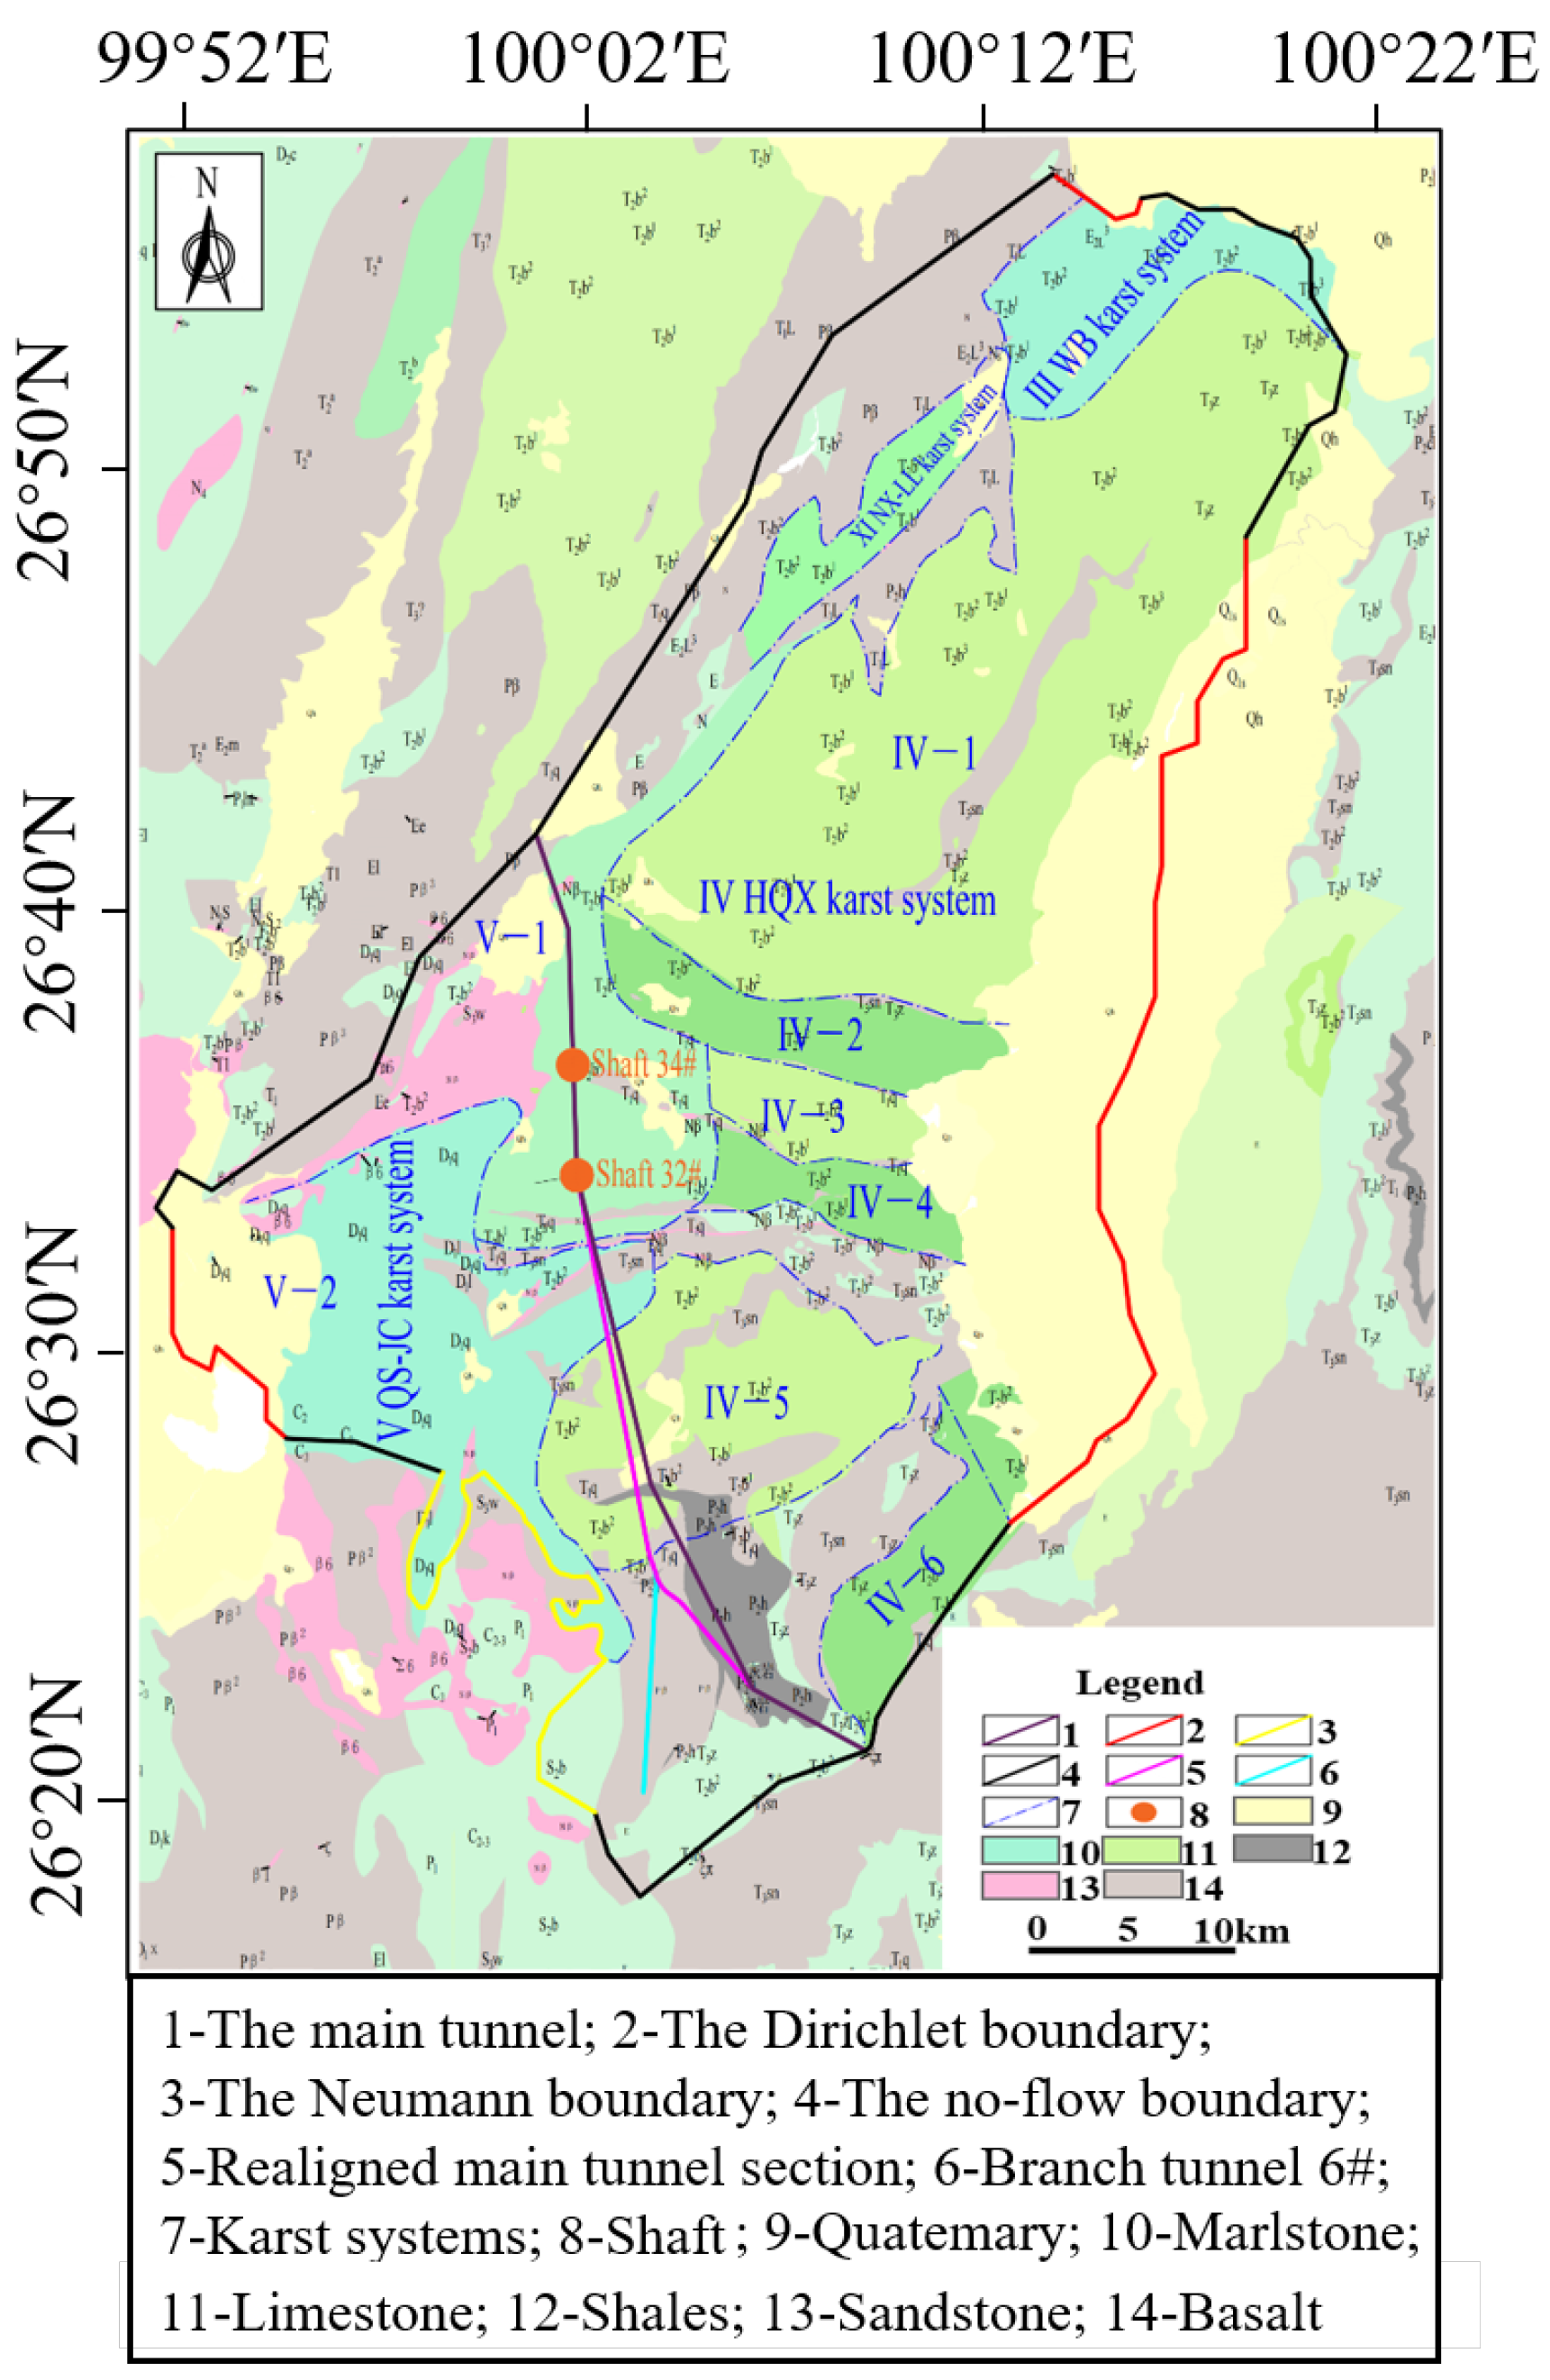
Figure 1. Site description and the boundary conditions of the research area.
Water 17 02383 g001
Figure 2. Schematic diagram of the location of groundwater environmentally sensitive points in the study area.
Water 17 02383 g002
Figure 3. Schematic diagram of meshing and lithology division of the study area. (a) Meshing—5× magnification vertically. (b) Lithological three-dimensional zoning.
Water 17 02383 g003
Figure 4. Zone of rainfall infiltration taking into account lithology and topography. (a) Lithologic zone of the study area. (b) Rainfall infiltration zone in the study area (numbers indicate zone IDs).
Water 17 02383 g004
Figure 5. Comparison of observed borehole water levels and simulated values.
Water 17 02383 g005
Figure 6. Model groundwater level map of (a) Branch tunnel 6# under natural condition, (b) Branch tunnel 6# under cement grouting condition, and (c) Branch tunnel 6# under microfine cement grouting condition.
Water 17 02383 g006
Table 1. Statistics on groundwater environmental protection targets.
No.Groundwater Environmental Protection TargetSpatial Relationship to Tunnel Alignment
GEPT 1Runan River 2 (Hongmai Village Spring)4 km northwest of Shaft 23#
GEPT 2Qingshuijiang Village Cluster Springs800 m west of Shaft 32#
GEPT 3Xideng Village Spring2.7 km southeast of Shaft 34#
GEPT 4Xiaomachang Spring570 m west of realigned main tunnel section
GEPT 5Damachang Spring1.3 km west of realigned main tunnel section
GEPT 6Heinishao Spring600 m east of realigned main tunnel section
GEPT 7Aqinggou Upstream Spring #1160 m west of branch tunnel 6#
GEPT 8Aqinggou Spring #2790 m west of branch tunnel 6#
GEPT 9Loushan River Irrigation Spring #11.3 km southeast of realigned main tunnel section
Table 2. Range of rock mass permeability coefficients.
LithologyRange of Permeability Coefficients K(cm/s)
Quatemary2.00 × 10−4–1.00 × 10⁻²
Sandstone1.00 × 10−7–1.00 × 10⁻³
Limestone1.00 × 10−5–5.00 × 10⁻³
Mudstone3.00 × 10−8–6.00 × 10⁻⁴
Shale1.00 × 10−8–1.00 × 10⁻⁶
Basalt2.00 × 10−8–3.00 × 10⁻⁴
Intrusive rock2.00 × 10−7–5.00 × 10⁻⁵
Fault1.00 × 10−4–1.00 × 10⁻¹
Table 3. Metrics for model calibration.
MetricValueUnit
MAR3.06m
RMSE4.01m
RSS128.75m2
Target Minimum2250m
Target Maximum2750m
Table 4. Value of rock mass permeability coefficients.
LithologyPermeability Coefficients in the x Direction—Kx (cm/s)Kx/KyKx/Kz
Quatemary8.64 × 10−4110
Sandstone7.76 × 10−611
Limestone4.32 × 10−411
Mudstone3.88 × 10−512
Shale3.46 × 10−5110
Basalt1.78 × 10−612
Intrusive rock2.16 × 10−612
Fault1.39 × 10−3110
Table 5. Numerical simulation results of tunnel water inflow under different working conditions.
TunnelLithologyLength of Tunnel Section (m)Total Water Inflow (m3/d)Percentage Reduction in Water
Inflow Compared with Natural
Condition
Natural ConditionConventional Cement
Grouting
Microfine
Cement
Grouting
Cement
Grouting
Microfine Cement Grouting
Shaft 32#Limestone441809.8198.3675.194.57%95.85%
Limestone1404813.14180.39116.7596.25%97.57%
Limestone1407798.37219.73137.297.18%98.24%
Limestone1407977.26225.07140.1397.18%98.24%
Limestone1406061.65196.97126.8796.75%97.91%
Limestone501253.38180.42118.3285.61%90.56%
Limestone441809.8198.3675.194.57%95.85%
Shaft 34#Limestone1101659.3861.1141.0196.32%97.53%
Limestone2716736138.1180.497.95%98.81%
Sandstone2368322.36176.48100.2197.88%98.80%
Sandstone1358456.16183.15104.2697.83%98.77%
Basalt1356260.35158.7792.5697.46%98.52%
Basalt501152.56143.784.6387.53%92.66%
Basalt251024134.8879.8586.83%92.20%
Branch tunnel 6#Basalt1437599.415539.173854.2827.11%49.28%
Basalt4187602.005541.383902.2527.11%48.67%
Basalt8057612.545548.443909.4427.11%48.64%
Basalt18678362.055572.883919.0633.36%53.13%
Basalt10118362.055813.894051.2230.47%51.55%
Basalt216411,178.466387.484308.4142.86%61.46%
Realigned main
tunnel section
Basalt66451752558135250.57%73.87%
Fault4789246420647.98%76.91%
Basalt5142261105225653.47%88.68%
Fault346583417648.18%88.45%
Limestone74311,2275622152449.92%86.43%
Fault396093169448.11%84.56%
Limestone89220,60212,66296238.54%95.33%
Limestone128724,31117,400136628.43%94.38%
Limestone203134,73620,850214239.98%93.83%
Fault4368134510049.34%85.32%
Limestone67813,246714749946.04%96.23%
Limestone22396651410346.79%89.34%
Mudstone31131621612931.65%59.18%
Fault5963838210040.13%84.33%
Basalt4601838119051835.26%71.82%
Basalt481173915727599.60%56.35%
Basalt446213,8618800434236.51%68.67%
Fault5334626018024.86%47.98%
Basalt161359403478130841.45%77.98%
Fault18874140325045.61%66.26%
Basalt156641252716106334.16%74.23%
Fault8770141319841.08%71.75%
Mudstone31243024917042.09%60.47%
Table 6. Numerical simulation results of flow reduction under different conditions.
Groundwater Environmental Protection TargetsThe Degree of Flow Reduction at the Spring Point Under Different Conditions (%)
Natural ConditionConventional Cement GroutingMicrofine Cement Grouting
GEPT 12.420.270.13
GEPT 242.1521.358.23
GEPT 367.9428.5612.38
GEPT 412.6310.467.61
GEPT 58.506.622.49
GEPT 6Dry16.7113.28
GEPT 7Dry12.7911.92
GEPT 849.407.382.53
GEPT 915.554.642.03
Disclaimer/Publisher’s Note: The statements, opinions and data contained in all publications are solely those of the individual author(s) and contributor(s) and not of MDPI and/or the editor(s). MDPI and/or the editor(s) disclaim responsibility for any injury to people or property resulting from any ideas, methods, instructions or products referred to in the content.