Article

Spatial Heterogeneity and Controlling Factors of Heavy Metals in Groundwater in a Typical Industrial Area in Southern China

1
State Key Laboratory of Biogeology and Environmental Geology & MOE Key Laboratory of Groundwater Circulation and Environment Evolution, China University of Geosciences, Beijing 100083, China
2
School of Water Resources and Environment, China University of Geosciences, Beijing 100083, China
*
Author to whom correspondence should be addressed.
Water 2025, 17(13), 2012; https://doi.org/10.3390/w17132012
Submission received: 28 May 2025 / Revised: 25 June 2025 / Accepted: 2 July 2025 / Published: 4 July 2025

Abstract

Heavy metal contamination in groundwater has emerged as a significant environmental issue, driven by rapid industrialization and intensified human activities, particularly in southern China. Heavy metal pollution in groundwater often presents complex spatial patterns and multiple sources; understanding the spatial heterogeneity and controlling factors of heavy metals is crucial for pollution prevention and water resource management in industrial regions. This study applied spatial autocorrelation analysis and self-organizing maps (SOM) coupled with K-means clustering to investigate the spatial distribution and key influencing factors of nine heavy metals (Cr, Fe, Mn, Ni, Cu, Zn, As, Ba, and Pb) in a typical industrial area in southern China. Heavy metals show significant spatial heterogeneity in concentrations. Cr, Mn, Fe, and Cu form local hotspots near urban and peripheral zones; Ni and As present downstream enrichment along the river pathway with longitudinal increase trends; Zn, Ba, and Pb exhibit a fluctuating pattern from west to east in the piedmont region. Local Moran’s I analysis further revealed spatial clustering in the northwest, riverine zones, and coastal outlet areas, providing insight into potential source regions. SOM clustering identified three types of groundwater: Cluster 1 (characterized by Cr, Mn, Fe, and Ni) is primarily influenced by industrial pollution and present spatially scattered distribution; Cluster 2 (dominated by As, NO3, Ca2+, and K+) is associated with domestic sewage and distributes following river flow; Cluster 3 (enriched in Zn, Ba, Pb, and NO3) is shaped by agricultural activities and natural mineral dissolution, with a lateral distribution along the piedmont zone. The findings of this study provide a scientific foundation for groundwater pollution prevention and environmental management in industrialized areas.

1. Introduction

In recent decades, groundwater quality has received increasing attention due to the acceleration of industrialization and urbanization [1]. Heavy metal contamination in groundwater has emerged as a global environmental concern, given its persistent, invisible nature and the considerable challenges associated with remediation [2,3,4,5]. Long-term exposure to heavy metals in groundwater poses significant risks to ecosystems and human health [6,7]. While certain mineral-bound trace metals have been shown to play ecological roles, for instance, serving as essential cofactors in anaerobic nitrogen fixation [8], the issue of heavy metal overaccumulation in groundwater remains a serious environmental and public health threat [8]. In many rapidly developing regions of southern China, intensive industrial activities and human-induced disturbances have exacerbated the problem of groundwater pollution [9]. Numerous studies have reported elevated concentrations of heavy metals such as Cr, Fe, Mn, Ni, Cu, Zn, As, Ba, and Pb in groundwater around industrial zones [10,11,12], often exceeding national drinking water standards and raising serious concerns for ecological safety and public health [13,14].
The sources and controlling factors of groundwater heavy metal pollution are typically complex, involving both natural factors (e.g., geological background, hydrogeological conditions) and anthropogenic sources (e.g., industrial discharges, sewage leakage) [15]. The interaction of these factors contributes to the spatial heterogeneity of contaminants, making source identification and characterization of distribution patterns particularly challenging, particularly in the typical industrial zones in southern China, characterized by a mixture of factories, densely populated urban areas, and agricultural activities occurring along the urban fringe.
Various analytical techniques have been developed to explore spatial patterns and pollution sources. Among them, self-organizing maps (SOMs), a type of unsupervised artificial neural network, have proven effective in capturing nonlinear relationships in high-dimensional data and have been increasingly applied in water quality assessment and pollution clustering [16]. To improve clustering accuracy and interpretability, SOM coupled with K-means clustering allows for post-mapping classification of neurons into distinct groups. For instance, Santos et al. employed SOMs and K-means clustering to classify hydrochemical types in the Serra Geral aquifer in Brazil, revealing geologically driven spatial differentiation [17]. Similarly, Urme et al. used SOMs to identify spatial patterns of As, Mn, and Fe in groundwater in northwestern Bangladesh and assess potential health risks [18]. Despite these advances, comprehensive applications of SOMs and spatial autocorrelation methods for groundwater heavy metal analysis in industrial regions of southern China remain limited. Previous studies have frequently employed self-organizing maps (SOMs) and Local Moran’s I for analyzing water chemistry or heavy metal pollution [19,20,21]. However, few studies have applied these methods to identify spatial heterogeneity and controlling factors of heavy metals in groundwater within typical industrial parks in southern China, a region characterized by complex hydrogeological conditions and multiple pollution sources.
This study integrated spatial autocorrelation analysis (Moran’s I) and SOMs coupled with K-means clustering in a typical industrial area in southern China. It aimed to (1) systematically identify the spatial distribution pattern of heavy metals (Cr, Fe, Mn, Ni, Cu, Zn, As, Ba, Pb) in groundwater and (2) analyze the controlling factors of the heavy metals in groundwater by applying Local Moran’s I and SOMs based on groundwater heavy metal concentrations and associated hydrogeochemical components. This study provides scientific support for groundwater pollution control and water resource management in industrial regions.

2. Materials and Methods

2.1. Study Area

The study area is located in a typical industrial city (referred to as City A) in southern China. The region features a humid subtropical monsoon climate, with an average annual temperature of 21.8–23 °C and annual precipitation ranging from 1400 to 1800 mm, mainly concentrated between April and June [22,23]. The topography of the study area generally slopes from north to south. The northern region is characterized by mountainous terrain with high elevations and steep slopes; the southeastern and southwestern areas are dominated by hills; the central and southern parts consist mainly of plains with gradually decreasing elevations; the eastern region features coastal sandy zones; and the southwestern part includes river estuary areas. The southern region comprises flat lowlands with minimal surface slopes. The main river originates in the northern mountainous region and flows southward to the sea (Figure 1). The study area comprises three aquifer systems: Quaternary unconsolidated sediments pore aquifer in the plains (10–50 m thick, composed of gravel and fine sand, with high permeability), and granite fissure aquifer and clastic rocks pore-fissure aquifer in the hilly and mountainous regions, with relatively low permeability. Most groundwater samples are located in the Quaternary pore aquifer. The grain size distribution of sediments in the Quaternary pore aquifer varies significantly from north to south. In the northern piedmont zone, coarse-grained sediments such as coarse sand and gravelly sand are predominant, with particle diameters generally exceeding 0.25 mm and the occasional presence of larger gravels, while in the southern coastal plain and estuarine region, finer materials such as silt, silty clay, and clay prevail, with grain sizes generally below 0.05 mm [24]. City A has a well-established industrial base, with industries such as petrochemicals, electroplating, and mining. Human activities increasingly disturb the groundwater system, raising potential environmental risks [25,26,27].

2.2. Sample Collection and Analysis

In July 2024, 38 groundwater samples and 12 river water samples were collected evenly based on land use, population distribution, and potential pollution sources to ensure representativeness. Groundwater samples were mainly drawn from household wells (10–40 m depth), and a few from large-diameter wells for domestic and irrigation use. River water was collected below the river surface, approximately 20 cm.
In situ measurements of temperature, pH, conductivity (CON), and oxidation–reduction potential (ORP) were conducted using a portable multiparameter water quality analyzer (Manta, Eureka Water Probes, Austin, TX, USA). The instrument provided a precision of ±0.1 °C for temperature, ±0.01 units for pH, ±1% for EC, and ±20 mV for ORP. Groundwater samples were collected using bailers, and sampling bottles were rinsed with sample water 2–3 times prior to collection. Samples for anion analysis were filtered through 0.45 μm membranes (Millipore, Billerica, MA, USA) and stored in 250 mL bottles. Cation and heavy metal samples were filtered and acidified with nitric acid (Sinopharm Chemical Reagent Co., Shanghai, China; pH < 2). All samples were refrigerated below 4 °C before analysis [28]. The sampling procedures and in situ measurements were performed in accordance with standard groundwater monitoring guidelines and consistent with the methodologies stated in previous studies [29,30].
Major ions (K+, Na+, Ca2+, Mg2+, Cl, SO42−, NO3) were analyzed at the National Institute of Natural Hazards, Ministry of Emergency Management of China. Anions were measured by ion chromatography (DX-120, Dionex Corporation, Sunnyvale, CA, USA). The analytical precision was 0.01 mg/L [31]. Cations were analyzed by inductively coupled plasma optical emission spectrometry (ICP-OES; SPECTROBLUE SOP, SPECTRO Analytical Instruments, Kleve, Germany), with a precision of 0.01 mg/L and a detection limit of 0.01–0.05 mg/L depending on the cations. Heavy metals (Cr, Fe, Mn, Ni, Cu, Zn, As, Ba, Pb) were analyzed using(ICP-MS, Agilent 7900, Santa Clara, CA, USA), with a detection limit of 0.01 μg/L and recovery rates between 85% and 110% [32]. All metal concentrations are expressed as total concentrations. The relative standard deviation (RSD) was used to indicate the precision of the analytical measurements. Quality control was ensured through blank, duplicate, and standard samples, with measurement precision within 5% RSD. Heavy metals such as Cr, Fe, Mn, Ni, Cu, Zn, As, Ba, and Pb are frequently monitored in industrial groundwater pollution studies due to their representativeness and environmental relevance [33,34]. Considering the presence of electroplating industries, domestic sewage input, and a complex geological setting in the study area, these metals were selected to reflect potential contamination sources. Major ions were also included, as they are essential for hydrogeochemical characterization and source identification [29,30].

2.3. Statistical and Spatial Analysis Methods

2.3.1. Self-Organizing Map (SOM) and K-Means Clustering

In this study, a self-organizing map (SOM) was applied to analyze groundwater samples based on heavy metal concentrations, major ions, and in situ parameters. SOM is an unsupervised artificial neural network model developed by Finnish researcher Teuvo Kohonen in 1982 [35]. The underlying principle of SOM is to map high-dimensional input data onto a low-dimensional (typically two-dimensional) topological space, thereby enabling clustering and visualization of complex data structures [36]. The input dataset in the present study included the concentrations of Cr, Fe, Mn, Ni, Cu, Zn, As, Ba, Pb, K+, Ca2+, Na+, Mg2+, Cl, SO42−, and NO3, as well as pH and ORP, which are related to heavy metal concentrations. For heavy concentrations below detection limits, half the detection limit value was used as a proxy, following established practice [37,38]. For undetected heavy metal values, half of the detection limit was used as a substitute to ensure data completeness for SOM training. This approach is commonly adopted in water quality studies to avoid introducing missing values [39]. The number of neurons in the SOM network was estimated using the empirical formula M = 5 n , where M is the number of neurons and n is the number of samples. Each groundwater sample was treated as an input vector. The SOM algorithm was trained with an appropriate network size and number of iterations to produce a topological map representing the clustering of samples. In most cases, the number of neurons on the SOM output map exceeds the actual number of target groups, making it unsuitable for direct clustering purposes. To obtain a more appropriate number of quantitative clusters, an additional clustering step, such as K-means analysis, was applied to the SOM results. The K-means method is known for its fast convergence and strong interpretability. Therefore, the coupling of SOM with K-means (KM) clustering can enhance clustering performance. A two-dimensional self-organizing map (SOM) with a 9 × 4 hexagonal grid (36 neurons) was constructed to classify the normalized groundwater heavy metal data. The optimal map size was selected by evaluating quantization and topographic errors (QE and TE) across map sizes ranging from 3 × 3 to 10 × 10. Training was conducted using MATLAB R2014a (MathWorks, Natick, MA, USA) with the default SOM Toolbox settings, with an initial learning rate of 0.05 that gradually decreased throughout training, and iterations automatically adjusted to ensure convergence. The optimal number of clusters was determined using a combination of the K-means algorithm and the Davies–Bouldin index (DBI) [40].

2.3.2. Local Moran’s I

Local Moran’s I was employed to quantify the spatial autocorrelation of heavy metal concentrations in groundwater at each sampling point and its surrounding neighborhood. This method focuses on detecting localized spatial associations of contaminant levels. For each point, the Local Moran’s I value was calculated, and statistical significance testing was conducted to identify spatial clustering patterns [41]. A positive I value indicates spatial aggregation, where high concentration points are surrounded by other high values (High–High, HH clusters) or low values cluster with low values (Low–Low, LL clusters). In contrast, negative values suggest spatial dispersion or outlier patterns, where high values are surrounded by low ones (High–Low, HL clusters) or low values are adjacent to high ones (Low–High, LH clusters) [42]. This approach provides deeper insight into the localized spatial dependence of groundwater heavy metal contamination and facilitates the identification of spatial hotspots, thus offering a scientific basis for delineating high-risk pollution zones [43,44].

3. Results and Discussion

3.1. Spatial Distribution of Heavy Metals

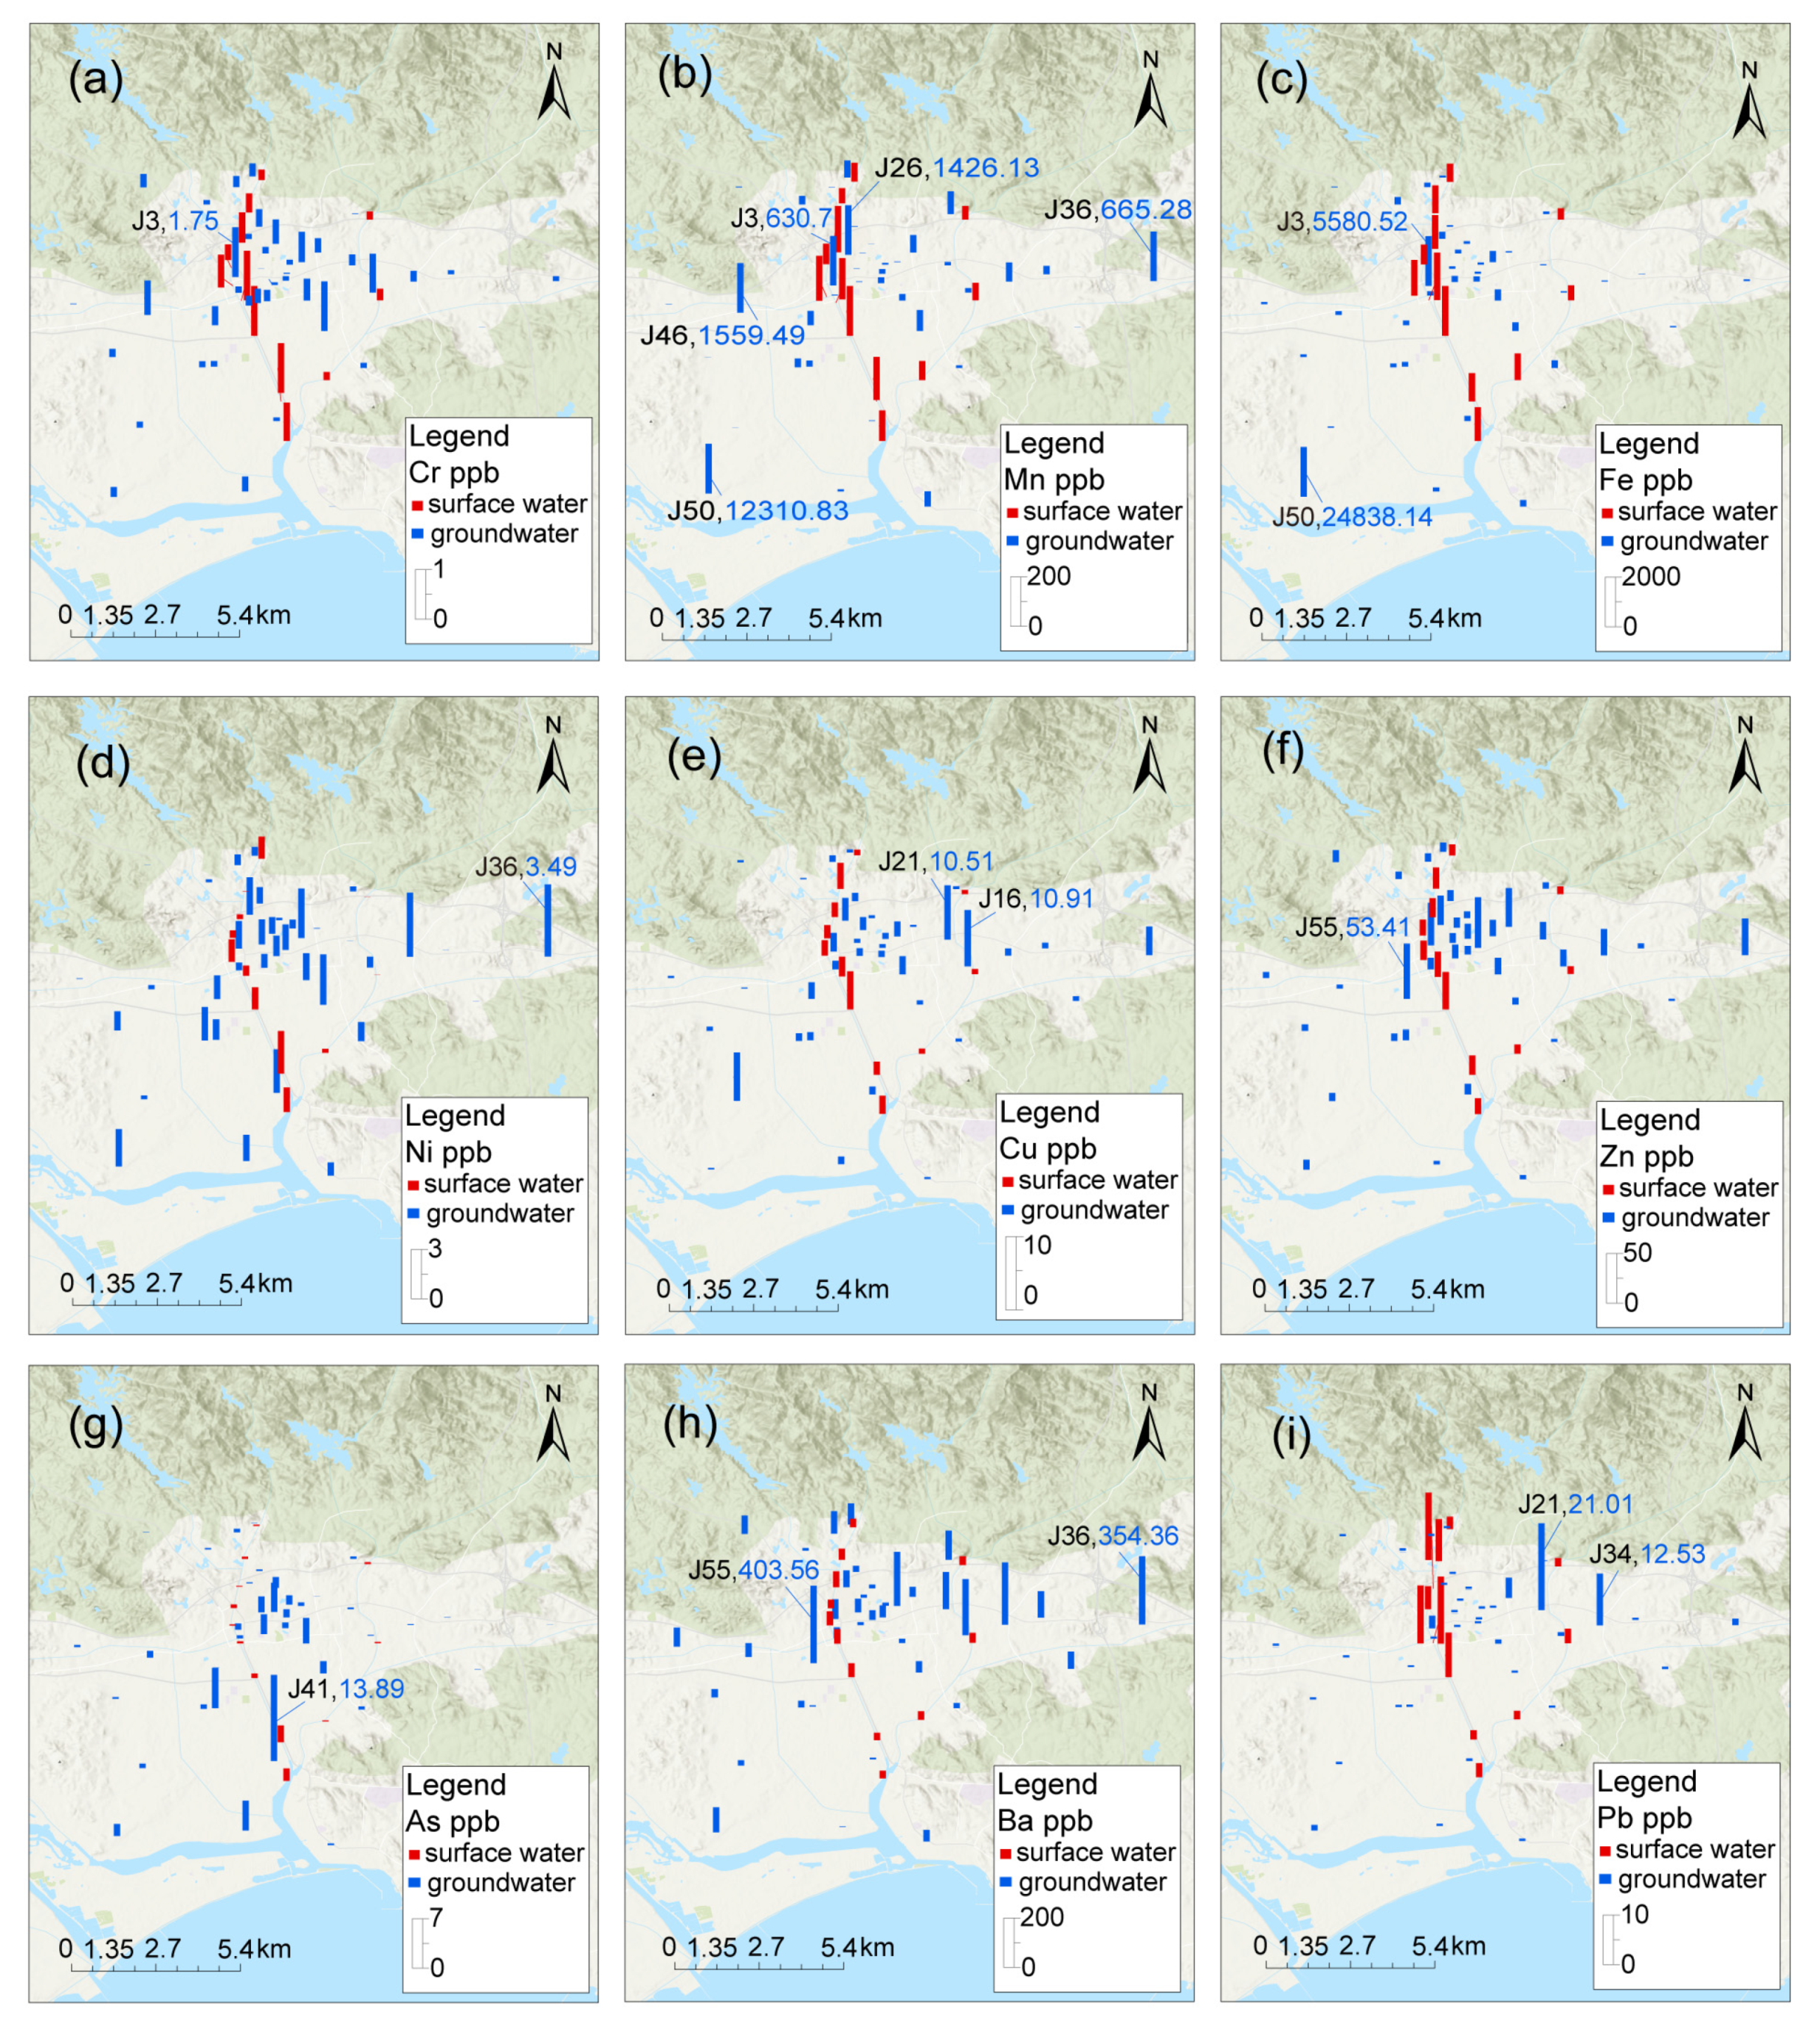
The spatial distributions of nine heavy metals (Cr, Fe, Mn, Ni, Cu, Zn, As, Ba, Pb) in groundwater across the study area are shown in Figure 2. The groundwater Cr concentration varied significantly across sampling sites, ranging from 0 to 1.75 μg/L (Figure 2, Table 1). In this study, the concentrations of major ions and heavy metals in river water and groundwater were evaluated with the surface water and groundwater standard limits in China to assess the water quality status and potential risks [45,46]. High values were mainly observed near the urban fringe areas, while lower concentrations appeared in the city center and rural areas (the south and east of the study area). The highest Cr level in groundwater (1.75 μg/L) was detected at point J3 in the central region. Though Cr levels did not exceed the national groundwater standard (GB/T 14848-2017) [46], the elevated values near rivers and urban boundaries indicate potential pollution risk. The Cr concentration in river water ranged from 0.16 to 2.03 μg/L (Table 2). The Cr concentration in river water is generally slightly higher than that in groundwater, especially near densely populated or industrialized zones. This suggests a possible influence of anthropogenic inputs (Figure 2a).
The groundwater Mn concentration ranged from 0.25 to 12,310.83 μg/L, showing wide variation. Some high-Mn samples (J3, J26) were near river water, while others occurred in eastern and western sites (J36, J46, J50) in the study area (Figure 2b). In total, 10 of the 38 groundwater samples exceeded the Class III standard in China (≤0.10 mg/L), with the highest value reaching 8.2 times higher than the Class V limit of Mn in groundwater. Excessive Mn in drinking water may affect the nervous, digestive, and immune systems in the human body [47]. River water generally had higher Mn concentration than groundwater, ranging from 83.19 to 303.69 μg/L. The spatial distribution of Mn in river water was similar to that of Cr, with high concentration observed in the midstream sections (Figure 2b), likely influenced by anthropogenic activities.
The groundwater Fe concentration ranged from 5.45 to 24,838.14 μg/L. Apart from one distant site (J50) to river water, a high Fe concentration was mainly found in river samples or groundwater sample sites adjacent to rivers (Figure 2c). Five groundwater samples exceeded the Class III limit of Fe (≤0.3 mg/L), with the maximum value 12 times higher than the Class V standard value. In river water, the Fe concentration ranged from 389.14 to 1727.18 μg/L, significantly higher than that of groundwater (Table 1). Similar to Mn, the spatial pattern of Fe in river water resembled that of Cr, with elevated levels observed in the midstream sections.
Groundwater Ni ranged from 0 to 3.49 μg/L. Its concentration showed a spatial pattern: increasing from west to east and from north to south. High Ni occurred in eastern sites; low values were found in central urban areas. All Ni levels were within drinking water limits. In river water, Ni concentrations, ranging from 0 to 2.06 μg/L, were generally lower than those in groundwater. High Ni concentration in river water occurred in the downstream area (Figure 2d).
The groundwater Cu concentration (0.2–10.91 μg/L) showed no clear spatial trend (Figure 2e). High groundwater values were found at the urban fringe zone and southeast and northwest of the study area, while both central urban and remote rural water samples had low Cu levels. All Cu values were within safety standards. In river water, the Cu concentration ranged from 0.8 to 7.35 μg/L. The spatial distribution of Cu in river water showed elevated levels in both upstream and downstream sections near the urban area.
Zn concentration in groundwater ranged from 2.1 to 53.41 μg/L, with a horizontal spatial trend (Figure 2f). High groundwater values occurred near the urban fringe zone, especially in the south-central zone. Zn levels were low in the urban center and outlying areas, decreasing with distance from the city. All values met the drinking water standard. In river water, Zn concentration ranged from 7.19 to 35.96 μg/L. The spatial distribution of Zn in river water was similar to that of Cu, with elevated levels in both upstream and downstream sections adjacent to urban areas, indicating possible anthropogenic input.
Arsenic (As) in groundwater ranged from 0 to 13.89 μg/L, showing a longitudinal increase trend from the mountain to the ocean (Figure 2g). A high concentration was found in southern areas, particularly near the river confluence (the urban and village areas). Northern and river-distant groundwater sites had low values. Only one groundwater sample (J41) exceeded the drinking water standard. In river water, Zn concentrations, ranging from 0.14 to 2.7 μg/L, were considerably lower than those in groundwater, but similarly exhibited an increasing trend from upstream to downstream.
Ba in groundwater ranged from 1.97 to 403.56 μg/L. High groundwater Ba concentrations showed a lateral distribution pattern across the piedmont region and were found near the urban fringe zones, especially in the south-central zone (Figure 2h). All the water Ba values decreased toward the southern region. None exceeded safety thresholds. In river water, the Ba concentration ranged from 28.64 to 61.42 μg/L, lower than that in groundwater. Its spatial distribution was similar to that of Cu and Zn, with slightly elevated values in both upstream and downstream areas near the city.
Pb in groundwater ranged from 0 to 21.01 μg/L. Elevated Pb levels were mainly distributed across the piedmont plain in a lateral zone, showing an increasing trend from west to east (Figure 2i). Two elevated sites (J21, J34) exceeded drinking water limits. In most groundwater, Pb was undetectable or below detection limits. In river water, Pb concentrations ranged from 1.99 to 16.28 μg/L and were generally higher than those in groundwater. The highest Pb concentrations in river water were observed in the midstream section.
Overall, Cr, Mn, Fe, Ni, and Cu showed similar spatial distribution characteristics in both groundwater and river water, with elevated concentrations appearing in midstream river sections and in groundwater near urban fringe zones with a local hotspot distribution pattern. This may be attributed to the scattered distribution of industrial areas in the region, where heavy metals from industrial processes infiltrate the soil and subsequently contaminate the shallow aquifer, resulting in elevated concentrations of these metals (Figure 2). Zn, Ba, and Pb also show comparable patterns. High values were observed in both upstream and downstream river sections adjacent to urban areas, and relatively high groundwater concentrations were distributed across an east–west high-value zone in the piedmont region.
Compared with typical industrial areas in the other studies, most heavy metal concentrations in the study area are relatively low. For instance, the average Cr concentration (0.27 μg/L) is lower than those reported in Bangladesh (70.9 μg/L), India (80 μg/L), and Henan Province in China (4.67 μg/L) [33,48]. Similar trends are observed for Ni, Cu, Zn, and Pb [49]. In contrast, Mn and Fe exhibit significantly elevated concentrations in the study area, with average values of 467.81 μg/L and 929.41 μg/L, respectively, higher than those in India, Turkey, and even the industrial area of Henan province (Mn: 103.90 μg/L; Fe: 701.41 μg/L) [34]. The observed discrepancies in groundwater heavy metal concentrations between this study and previous studies may be due to the regional sampling strategy adopted here, as well as variations in sources of heavy metal.

3.2. Spatial Autocorrelation Analysis

In the spatial analysis of heavy metal pollution, relying solely on concentration distribution often fails to capture the full extent of contamination characteristics. Local Moran’s I, an effective method for assessing spatial autocorrelation, can not only reveal clustering patterns of individual elements across the study area but also identify potential spatial outliers and pollution sources [50,51]. By analyzing the relationship between each sampling point and its neighboring locations, this method offers deeper insight into the spatial tendencies and heterogeneity of contaminants [52]. Statistical significance is assessed using the p-value; a p-value below 0.05 is generally considered indicative of non-random clustering or dispersion, suggesting that the spatial distribution may be driven by specific pollution sources or environmental controls [53]. In this study, the spatial clustering patterns of Cr, Mn, Fe, and Ni illustrated in Figure 3 exemplify the utility of Local Moran’s I in detecting localized hotspots and spatial outliers in heavy metal contamination.
Cr exhibited high-value clustering (HH) in the northwestern part of the study area, while low-value clusters (LL) appeared in the central urban core (Figure 3a), indicating more severe Cr contamination at the urban fringe zone, possibly influenced by nearby industrial activities. Mn showed a significant LL cluster in the city center along with several HL and LH spatial outliers, reflecting a more complex local contamination pattern (Figure 3b), potentially resulting from distributed point sources [54]. Fe presented LL clustering in the eastern urban area, accompanied by a few LH outliers (Figure 3c). Combining the concentration distribution of Fe, high Fe values appeared in midstream river areas, suggesting a potential link to industrial pollution [55]. Ni displayed prominent HH clusters in the south and LL clusters in the northeastern industrial zone, with HL and LH outliers indicating strong local variation (Figure 3d), possibly related to uneven distribution of industrial point sources [56].
Cu exhibited mostly HL outliers, located at the urban periphery, suggesting isolated high-concentration sites surrounded by lower background values (Figure 3e). Some LH anomalies were also identified, possibly indicating pollutant input. Zn showed high-value clustering in the southwestern urban region and LL clustering at the southwestern edge (Figure 3f), suggesting localized accumulation with limited dispersion, possibly influenced by both anthropogenic activities and topographic conditions.
Arsenic (As) formed LL clusters in the northern part of the study area, while HH clusters were observed near the southern river confluence (Figure 3g). This spatial pattern suggests that arsenic may migrate along the flow direction and accumulate downstream, influenced by hydrodynamic conditions [57]. Notably, the majority of HH arsenic sites were located within village areas, implying that anthropogenic activities may also play a significant role in shaping the spatial distribution of arsenic. Ba exhibited HH clusters in the east and LL clusters in the south, forming a north–south differentiation (Figure 3h), likely affected by a combination of geological, hydrological, and anthropogenic factors. Pb formed HH clusters in the western and southeastern urban areas, with LL clustering in the urban core and western part, as well as multiple LH anomalies around the urban fringe zone (Figure 3i). These findings suggest localized Pb pollution with distinct spatial irregularity, possibly associated with point-source discharges and human disturbances [58].
Previous studies have consistently demonstrated that heavy metals exhibit significant spatial clustering in areas affected by industrial activities. For instance, in the Meghna Ghat industrial zone of Bangladesh, Cr shows high–high cluster patterns, primarily concentrated in areas influenced by industrial wastewater [59]; in an industrial region in southern China, Cr and Cd were found to cluster near railways and gas stations, indicating anthropogenic impacts [60]; in a mining area of north China, As and B displayed notable aggregation in the western part of the mining zone due to geological conditions and mining disturbances [57]. In the present study, Cr, Mn, Fe, and Cu also exhibited localized high-value clusters, primarily around urban fringes and industrial park zones, which aligns with the patterns reported in the aforementioned studies.

3.3. Controlling Factor Analysis

3.3.1. SOM Identifying Controlling Factor

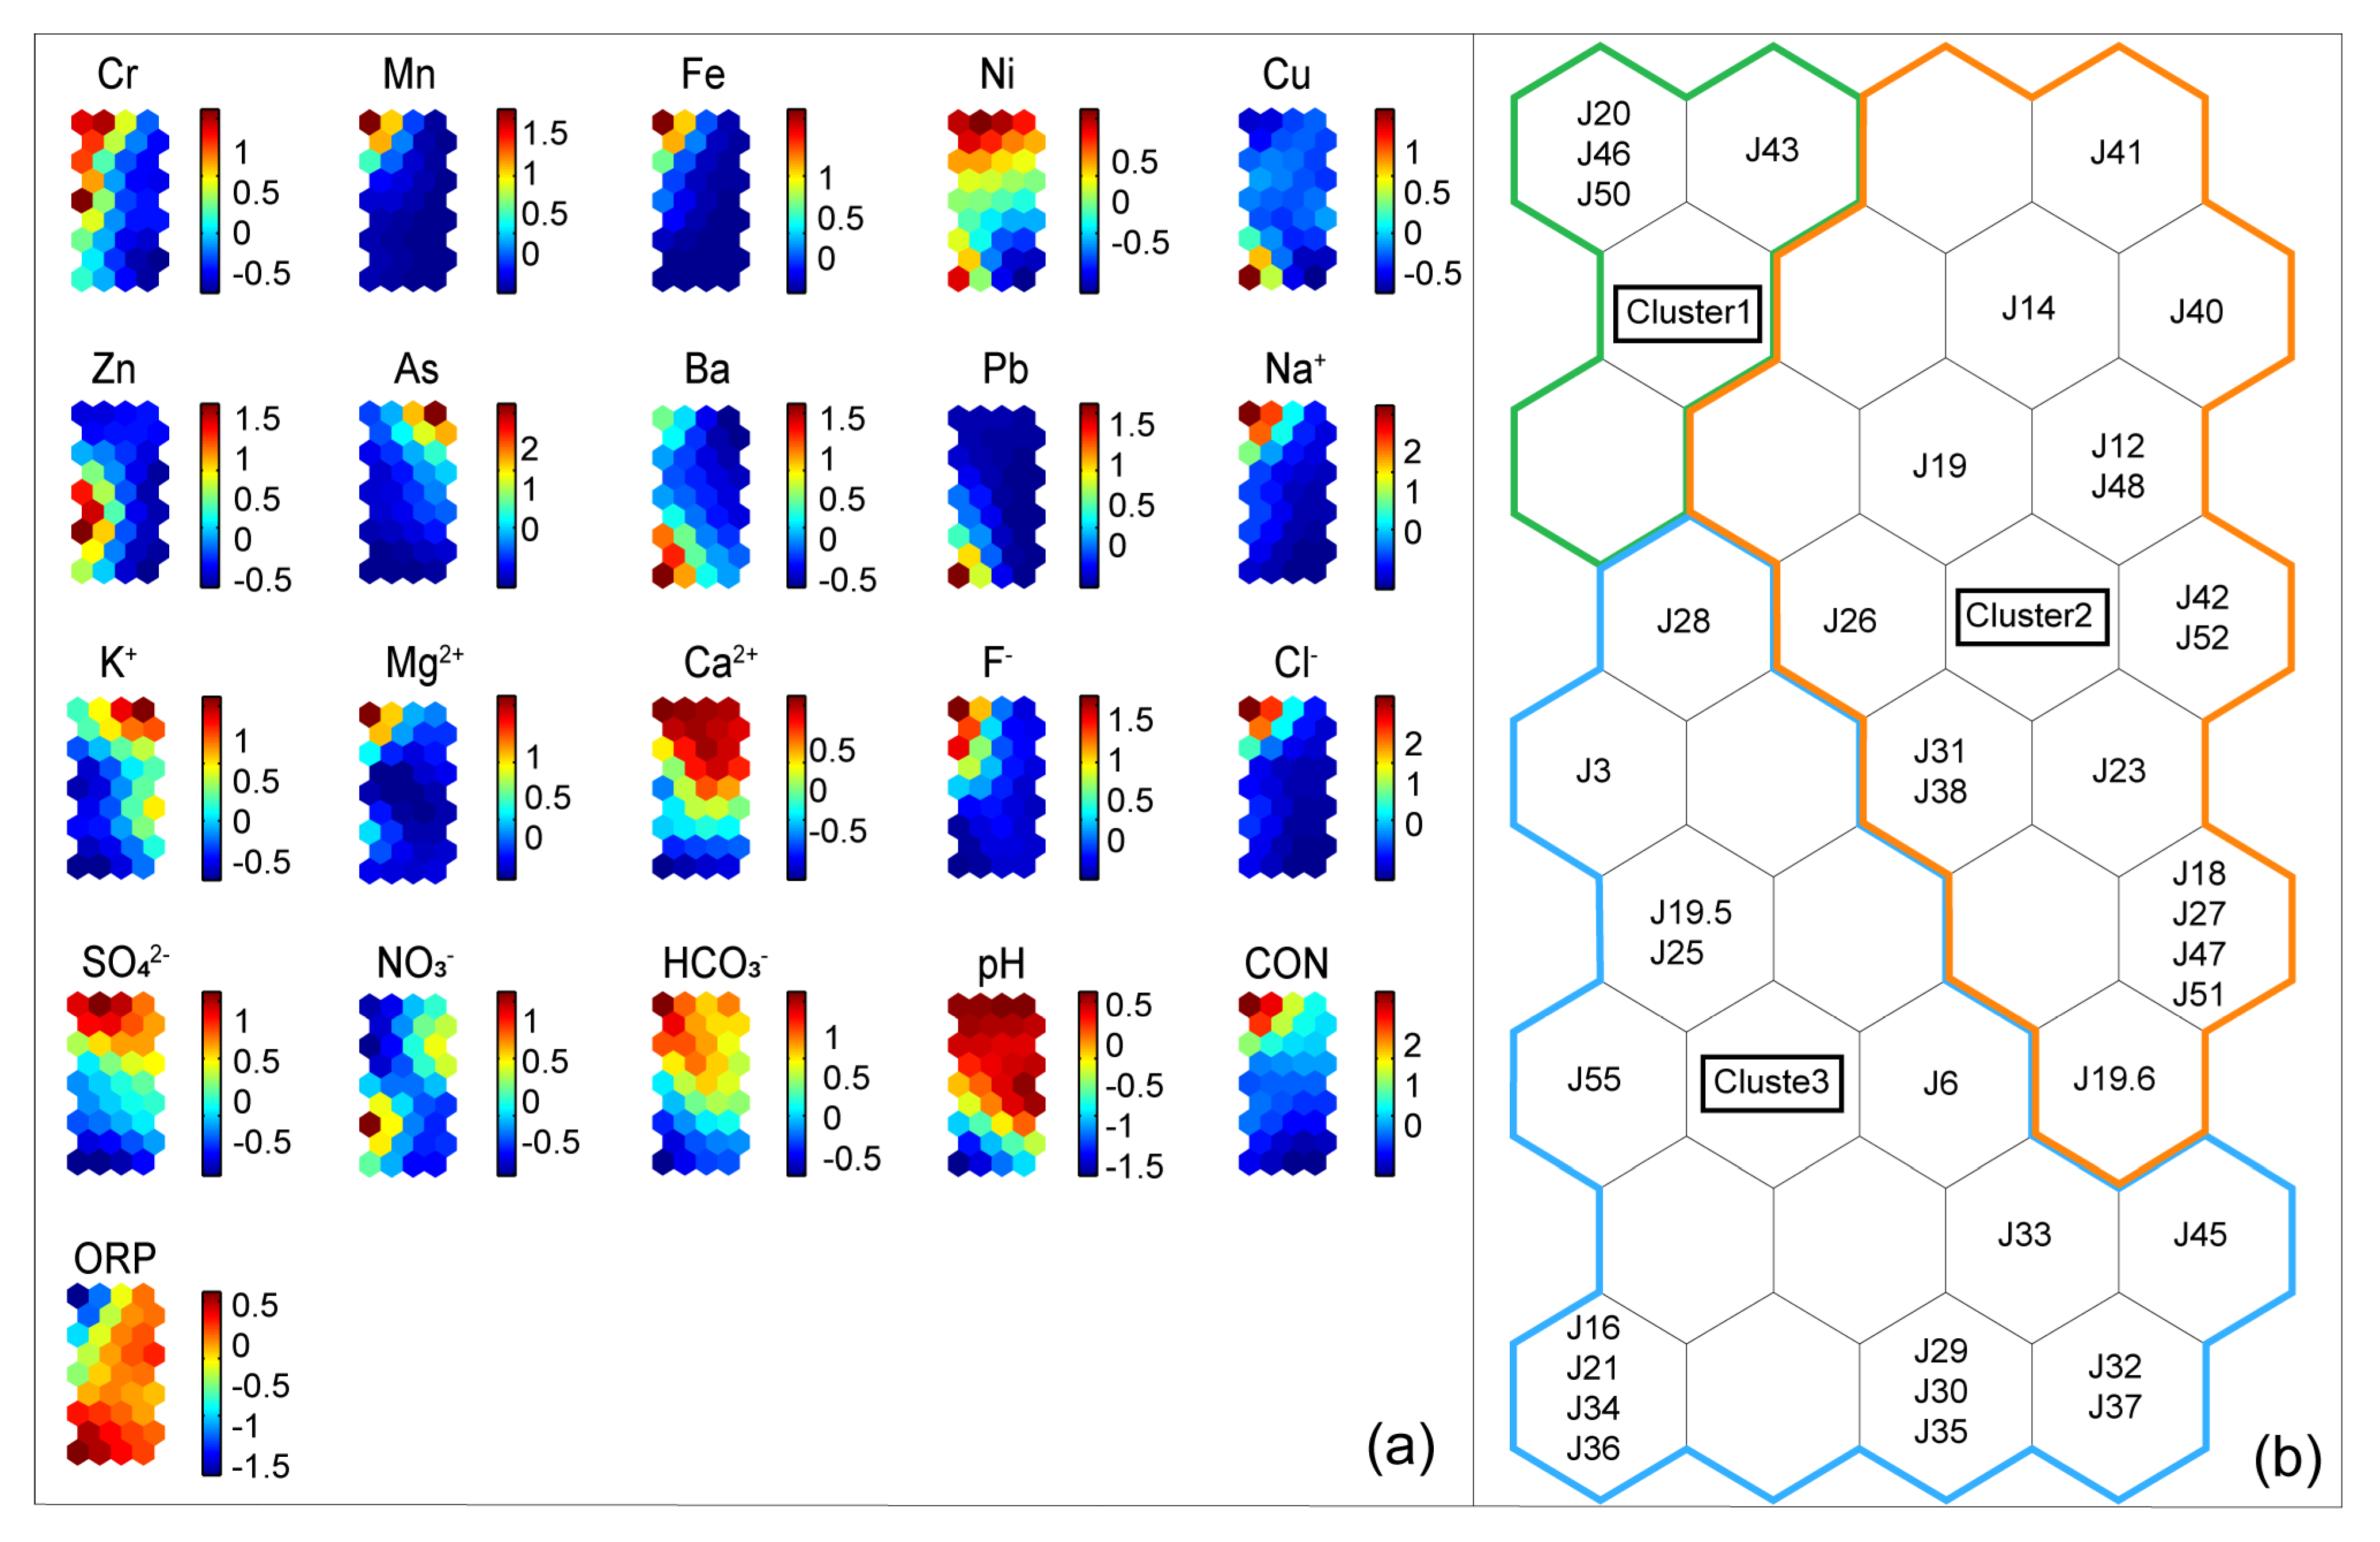
In the SOM clustering map, each grid cell is color-coded with a gradient ranging from red to blue, representing the relative response strength of each variable in different neurons. Areas in red indicate stronger responses, while blue signifies weaker responses [61]. Variables such as Cr, Mn, Fe, Na+, and Cl present similar color transition patterns, suggesting potential common sources or shared environmental control factors (Figure 4a). In the clustering matrix, neurons located closer in the topology represent higher similarity, and thus indicate greater resemblance among groundwater samples [62]. The SOM clustering results divided the groundwater samples into three groups, corresponding to distinct types of groundwater influenced by different controlling factors.
The spatial distribution of sample locations within each cluster is clearly illustrated in Figure 4b. Cluster 1 is located in the upper left of the SOM grid and includes four spatially scattered sampling sites (J20, J46, J50, J43, Figure 4b), dominated by Cr, Mn, Fe, and Ni. Combined with spatial distribution and autocorrelation analysis, these samples are inferred to be predominantly influenced by industrial pollution [63]. Cluster 2 appears on the right side of the SOM grid, with sampling sites mainly distributed in urban centers and surrounding rural village areas (Figure 5). Dominant elements include As, NO3, Ca2+, and K+. Based on their spatial patterns, this groundwater type is preliminarily interpreted to be impacted by domestic sewage. Cluster 3 is located in the lower left region of the SOM grid, with elevated levels of Zn, Ba, Pb, and NO3. Groundwater in Cluster 3 is primarily distributed across piedmont plains, northern county areas, urban outskirts, and along major roads, showing a clear west–east zonal distribution pattern (Figure 5). Although heavy metal concentrations in this group are relatively low, high NO3 levels suggest that groundwater in this cluster is mainly influenced by a combination of agricultural activity and natural mineral dissolution; we will discuss this further in Section 3.3.

3.3.2. Statistical Analysis of Heavy Metals and Associated Variables Identifying Controlling Factors

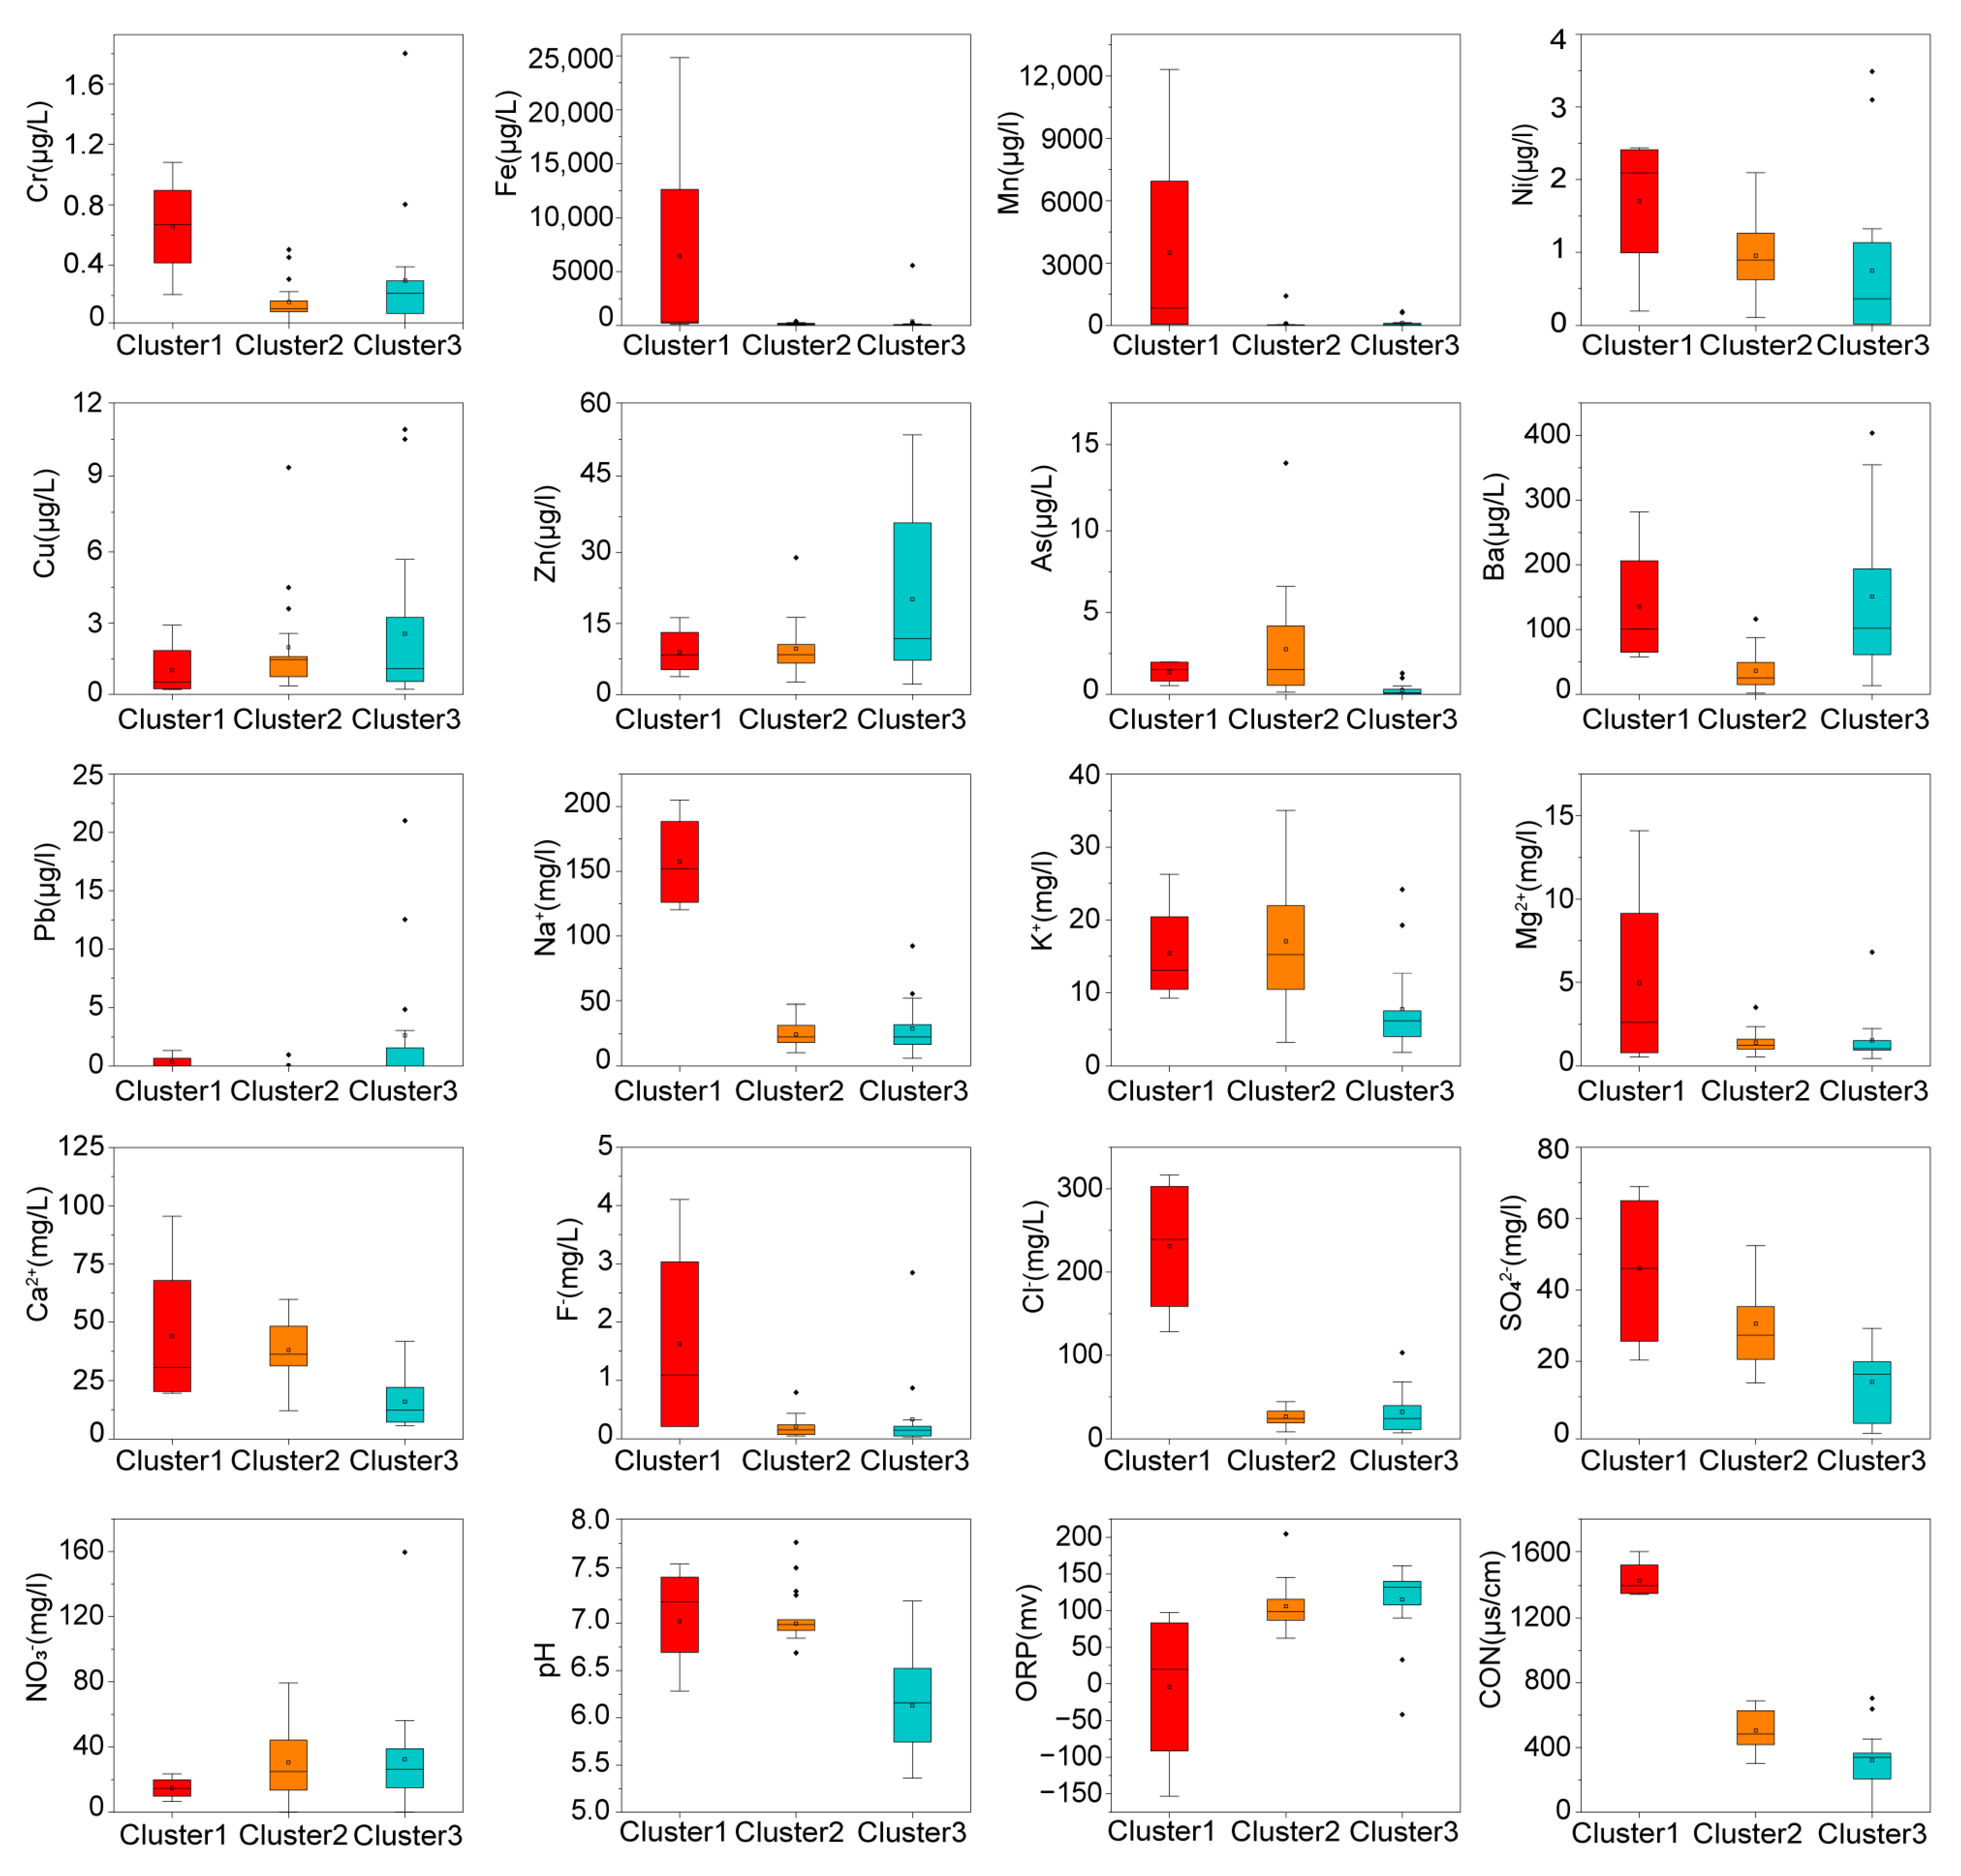
A boxplot analysis was used to present the difference in values of heavy metals and associated variables in three clusters (Figure 6). The concentrations of Cluster 1—related heavy metals (Cr, Mn, Fe, Ni, Na+, and Cl) identified by SOM methods are significantly higher than those in the other two clusters (Figure 6, Table 1), reflecting a prominent contamination signature [64]. The median values of As, K+, and Ca2+ are highest in Cluster 2, with most heavy metal concentrations higher than those in Cluster 1 and lower than those in Cluster 3. Notably, Clusters 2 and 3 present elevated NO3 concentrations in groundwater. Cluster 3 shows the highest median values of NO3, Zn, Ba, and ORP (Figure 4), indicating stronger oxidative conditions typically associated with agricultural activity [65]. Except for NO3. The groundwater in Cluster 3 presents the lowest concentrations of major ions and the lowest CON values among all clusters, which may indicate natural sources.
The spatial distribution pattern of each cluster also aligns closely with land use and pollution sources. Groundwater in Cluster 1 is located primarily around industrial zones, groundwater in Cluster 2 is located primarily in urban centers and residential areas, and groundwater in Cluster 3 is located across piedmont plains and regions with agricultural activity. Among the nine heavy metals, Cr, Mn, Fe, and Ni present strong spatial discreteness, with notably higher concentrations in polluted zones and much lower concentrations in background areas, indicating control by localized industrial pollution [66]. High As concentrations occur in groundwater in the urban and village areas, suggesting domestic sewage as a key influence. High concentrations of Zn, Ba, and Pb display a horizontal distribution pattern in the piedmont with agricultural activities, indicating co-influence by agricultural sources and natural mineral dissolution [67]. The spatial associations between land use and groundwater heavy metals are broadly consistent with previous studies in industrial and urban regions, and further source-specific validation would strengthen these interpretations [9,68]. These spatial patterns and boxplot analysis further validate the SOM clustering results.

3.4. Correlation Analysis Identifying Controlling Factors

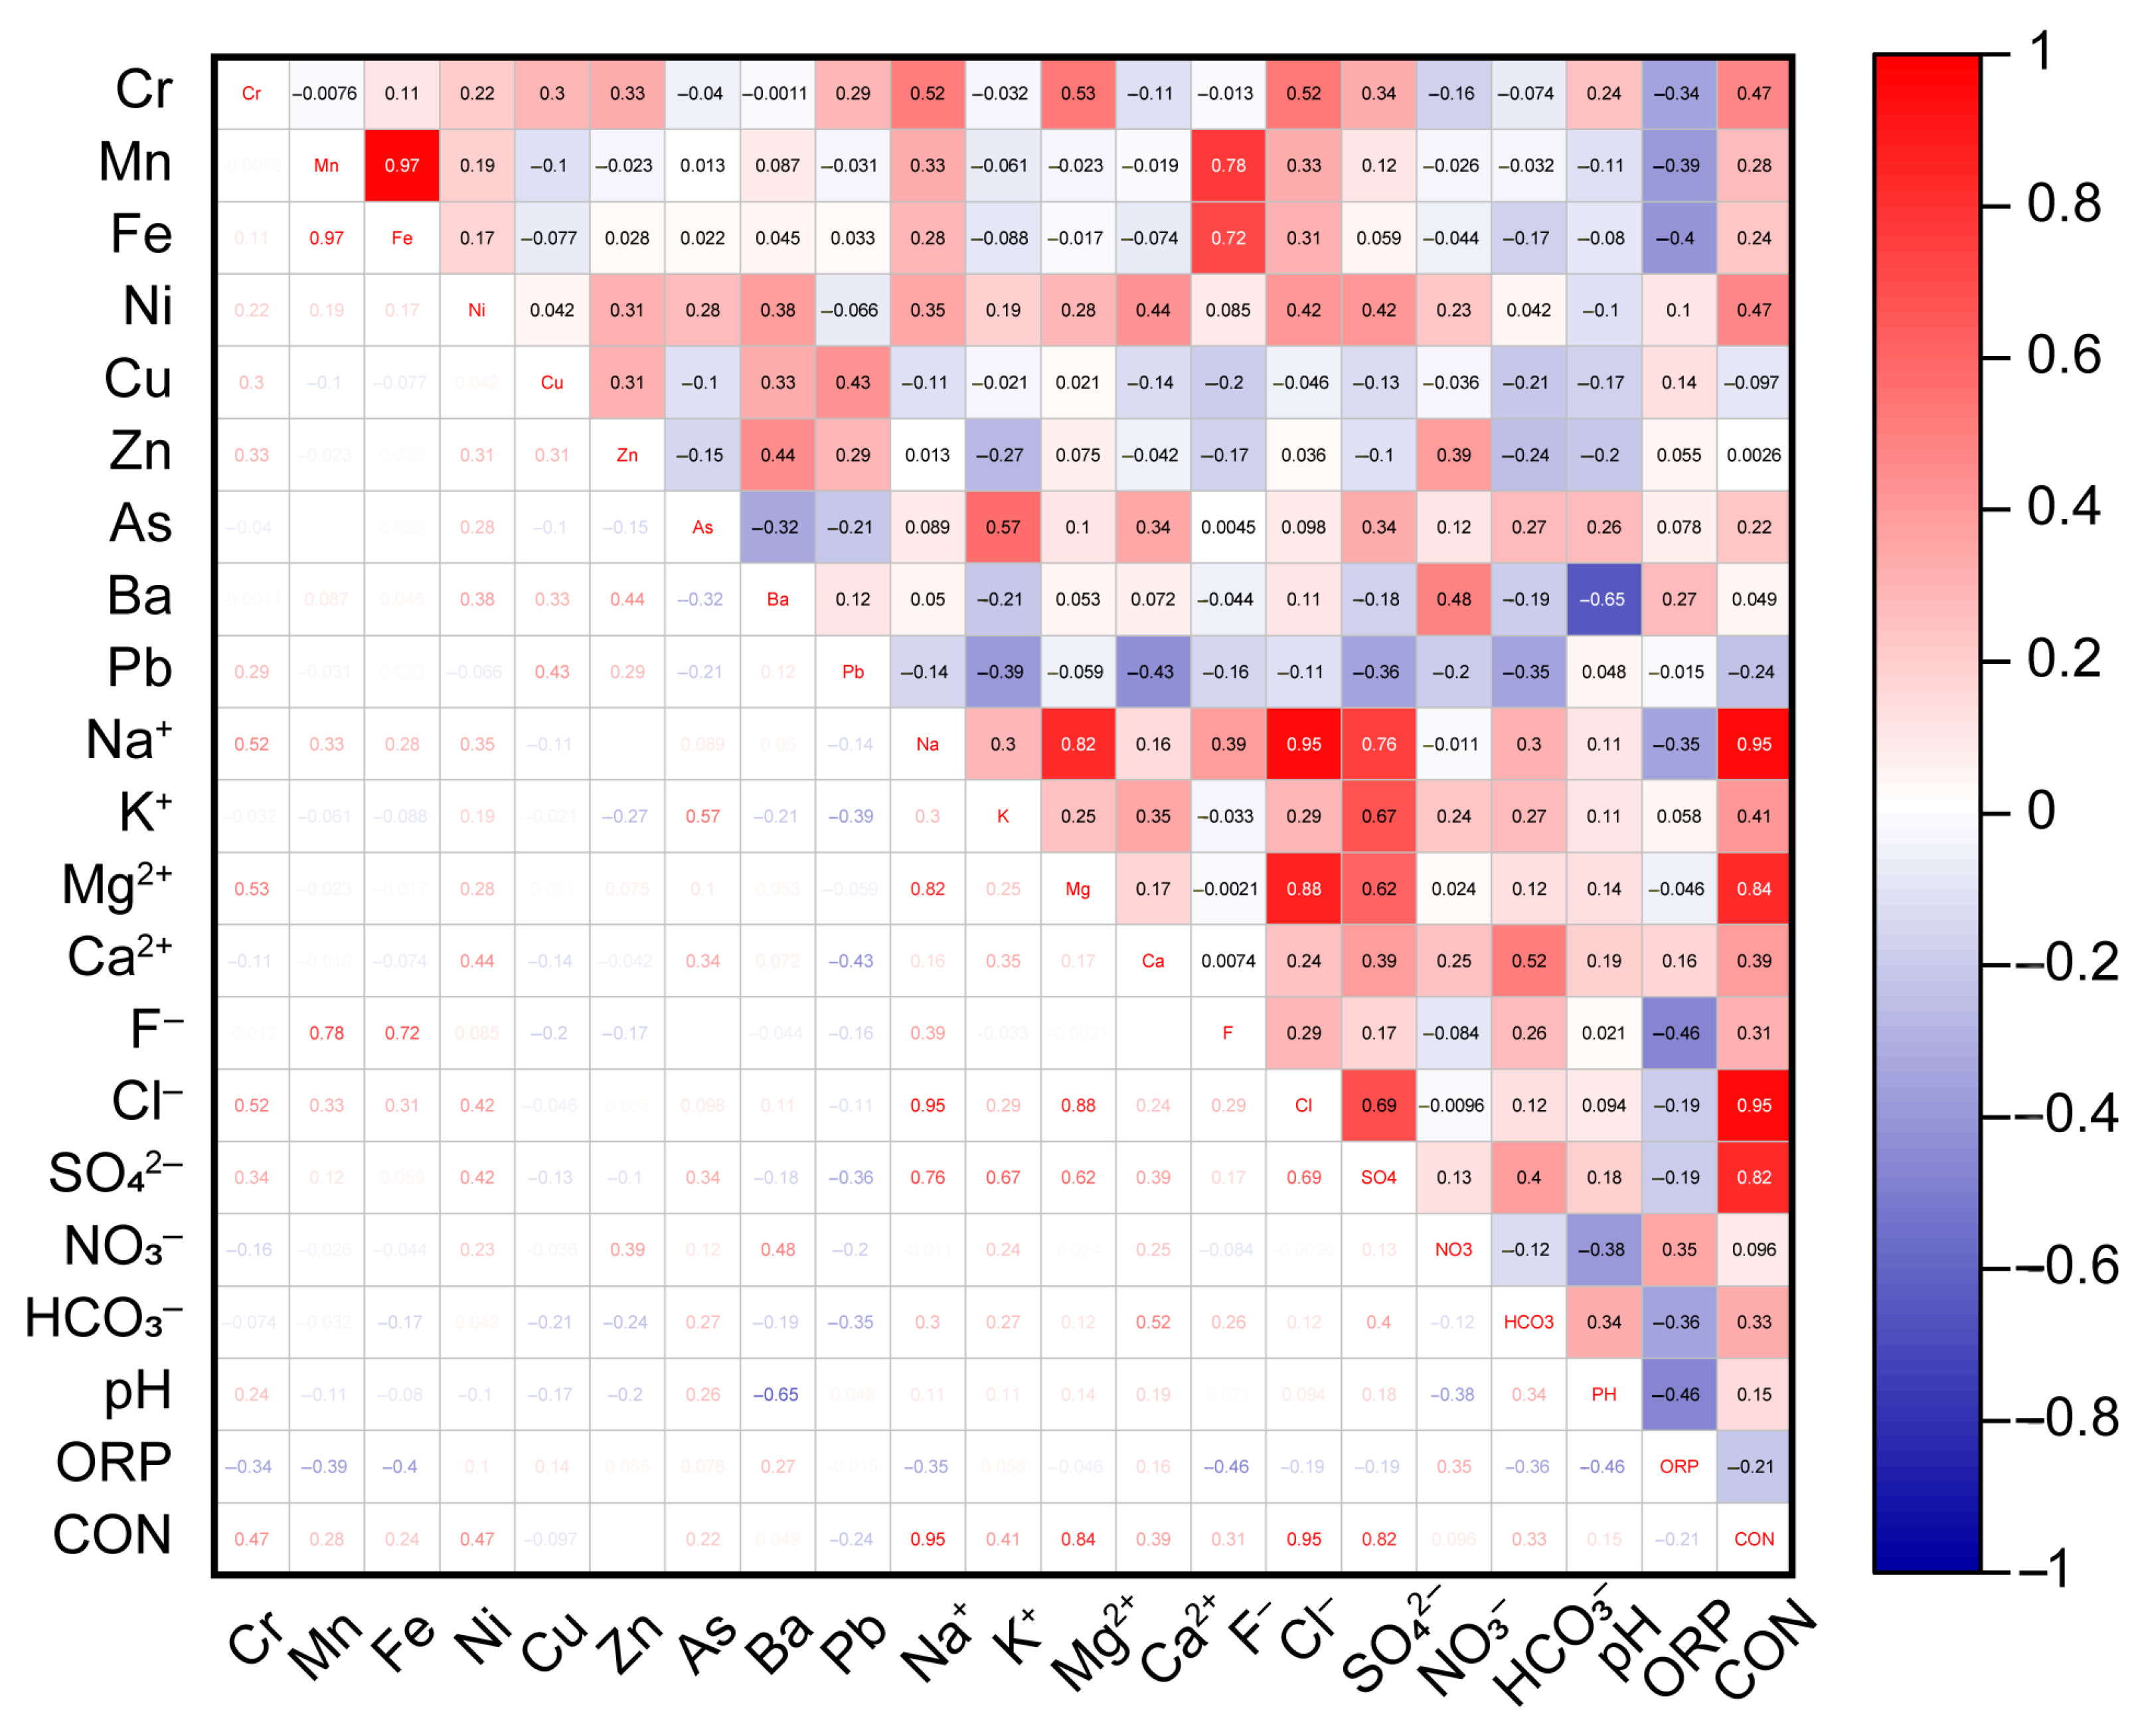
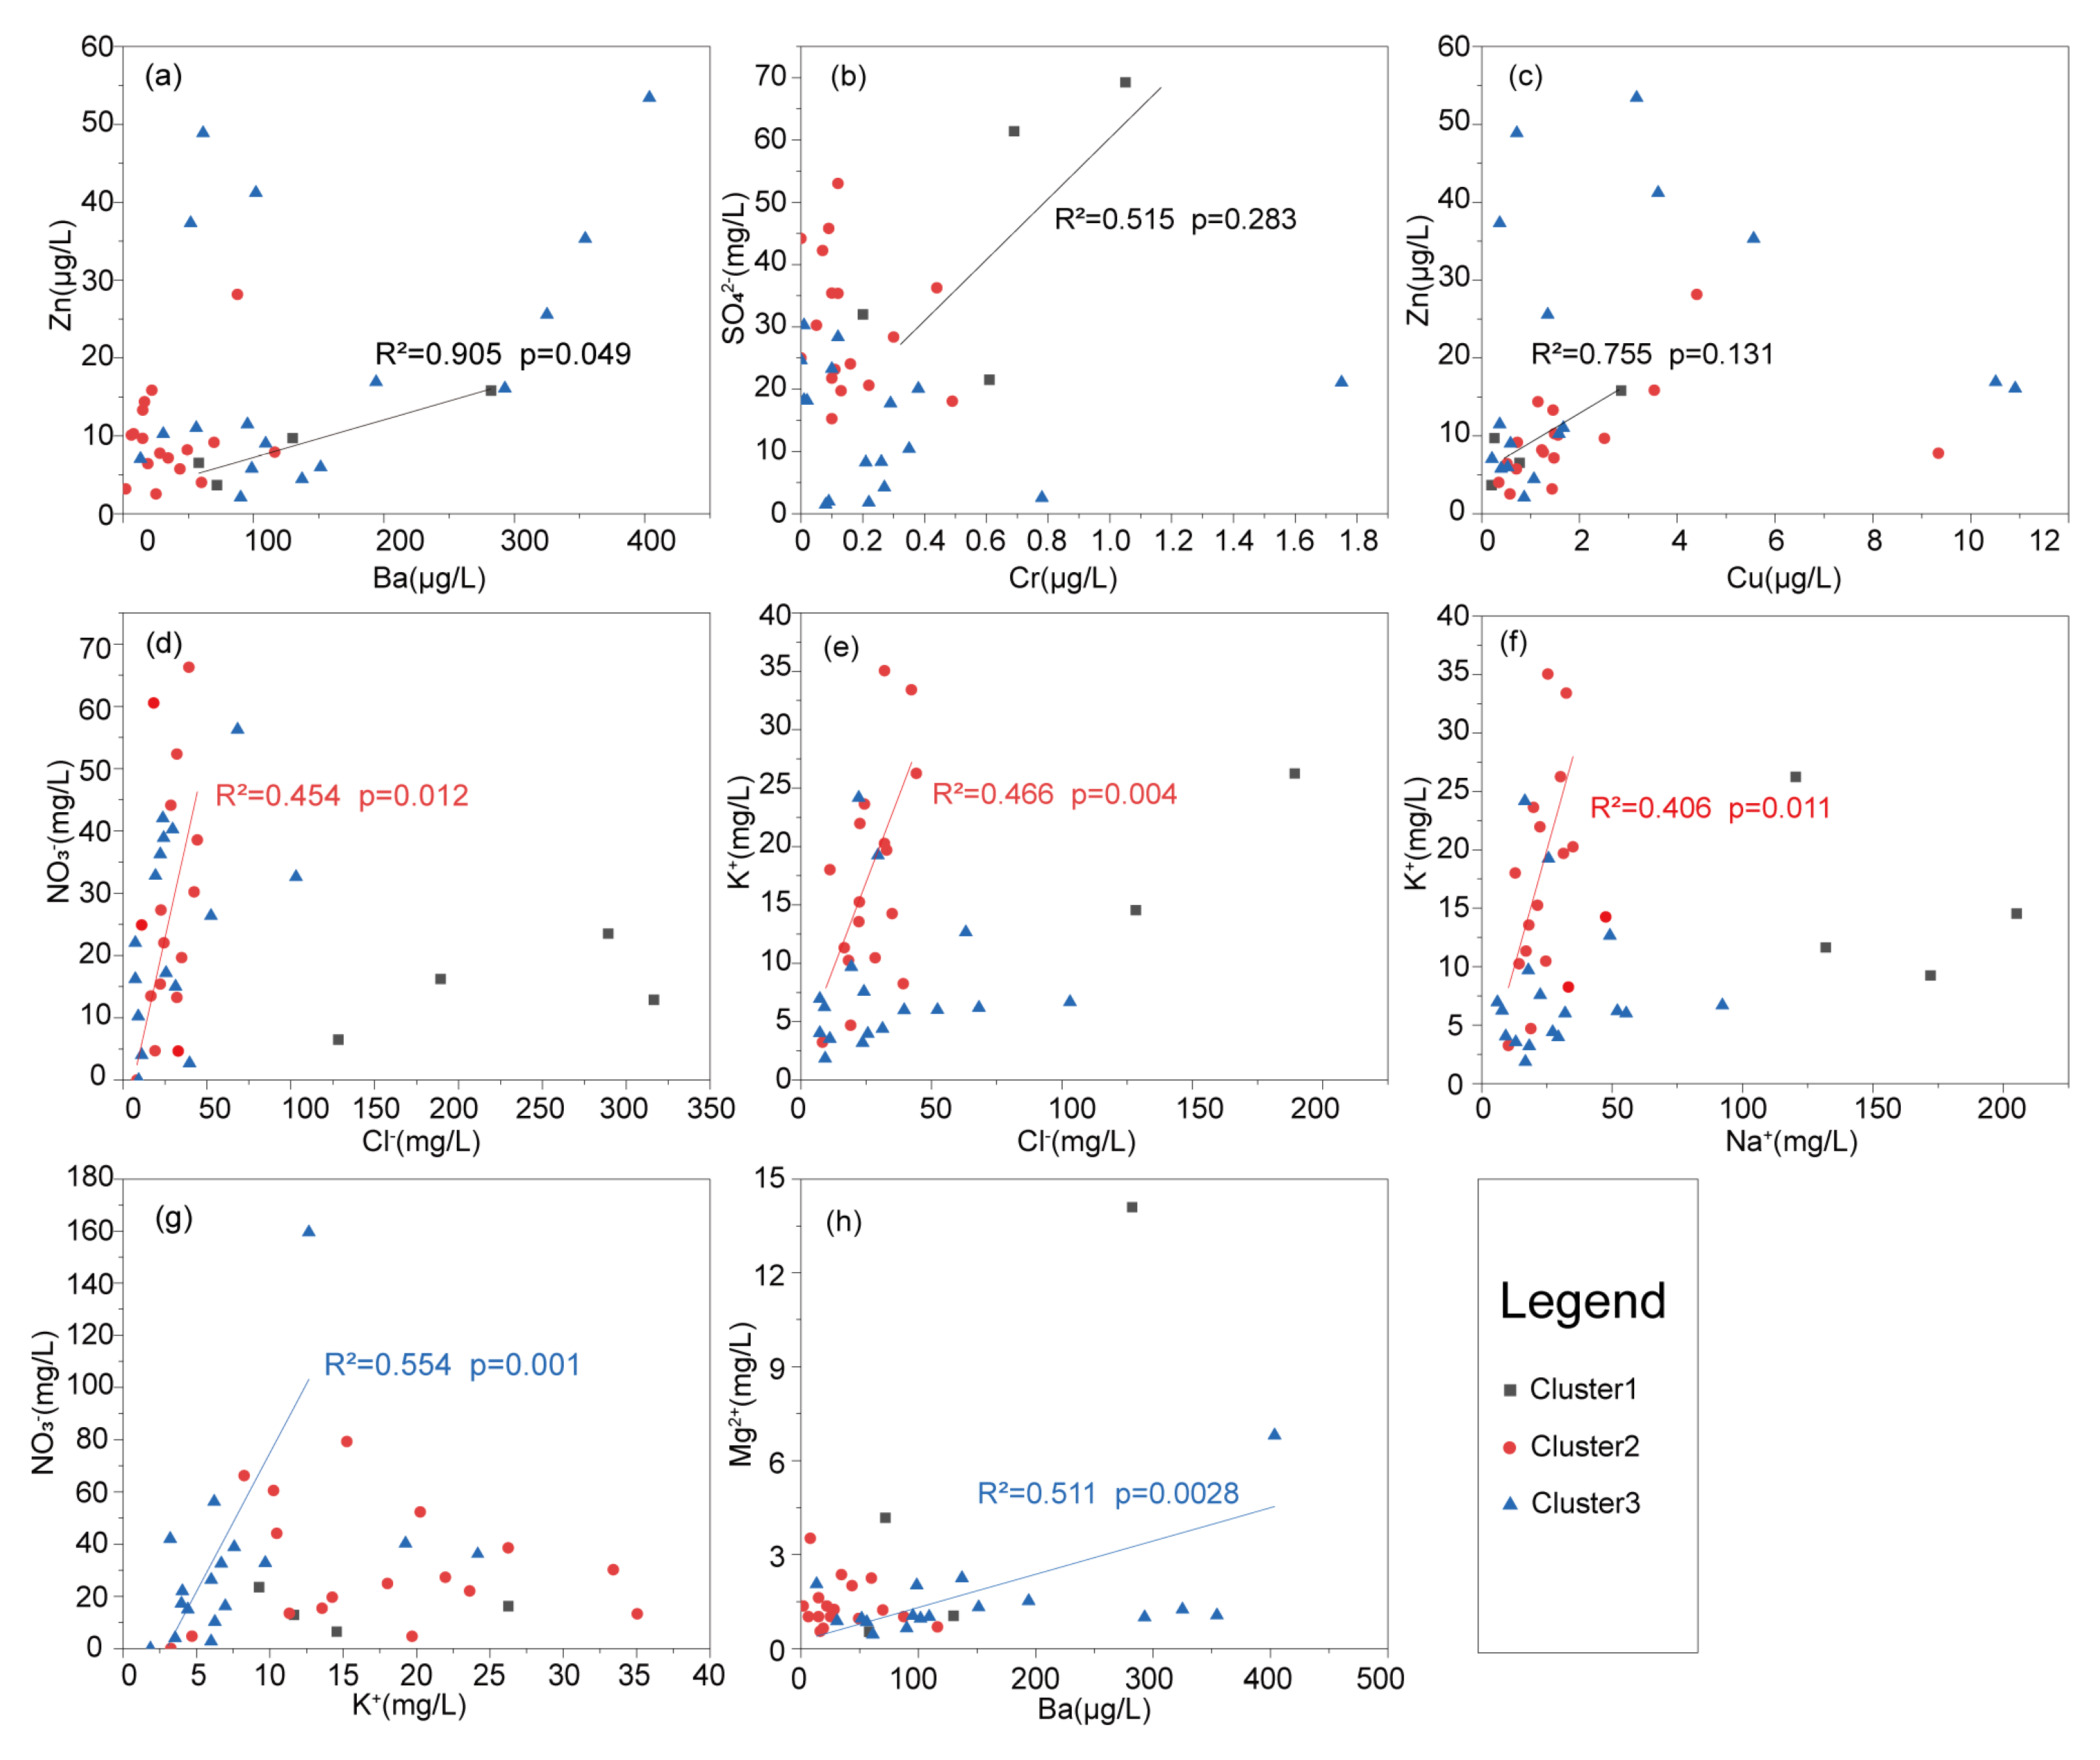
Cluster 1 showed markedly elevated concentrations of Cr, Mn, Fe, Ni, Na+, and Cl compared to the other clusters; these samples are typically located near petrochemical and electroplating factories. Electroplating often involves sulfuric acid-based solutions, chemical production of chromic acid or sodium dichromate, and the use of sulfuric acid as a reaction medium, and it can release Cr- and SO42−-bearing contaminants into the subsurface [69] Correlations between ions in groundwater can serve as effective indicators for tracing the same sources and similar evolution of groundwater [70,71]. Theoretically, correlations are expected to exist between Cr and SO42− and among heavy metals [72]. Although Cr and SO42− show weak correlations (R = 0.34) across the entire groundwater samples (Figure 7), a strong correlation is observed within Cluster 1 (R2 = 0.52) (Figure 8). Additionally, Ba–Zn (R2 = 0.91) and Cu–Zn (R2 = 0.76) also present strong pairwise relationships within this cluster (Figure 8), further supporting the hypothesis that the heavy metals in Cluster 1 groundwater are primarily sourced from industrial activities. Although the small sample size (n = 4) in Cluster 1 limits statistical significance (with some p-values exceeding 0.05), the elevated concentrations of heavy metals and proximity to industrial zones support the conclusion that industrial releases are the dominant controlling factor in this cluster (Figure 5 and Figure 6).
In Cluster 2, concentrations of As, Ca2+, NO3, and K+ in groundwater are relatively high, and the samples are primarily located in urban centers and village zones in the southern portion of the study area. The spatial enrichment of As may relate to groundwater flow and domestic wastewater inputs [73], which is consistent with the commonly observed downstream accumulation of arsenic in river systems. A correlation between NO3 and Cl is observed (R2 = 0.45, Figure 8), a typical indicator of groundwater impacted by domestic sewage [74]. Potassium and sodium are common in domestic water usage; additional correlations between Cl–K+ (R2 = 0.47) and Na+–K+ (R2 = 0.41) further support the interpretation that Cluster 2 is primarily influenced by domestic sewage sources [75]. Overall, heavy metal concentrations in Cluster 2 lie between those of Clusters 1 and 3, suggesting that sewage transport may be responsible for secondary heavy metal input.
Cluster 3 is characterized by generally elevated concentrations of Zn, Ba, Pb, and NO3. The groundwater in Cluster 3 is mainly located in the northern piedmont plain region and shows a horizontal distribution pattern. Except for isolated sites (e.g., J37 and J45, located at the far western and southeastern corners of the study area), there is a strong positive correlation between K+ and NO3 (R2 = 0.55, Figure 8), suggesting that NO3 in this cluster primarily originates from agricultural fertilization practices [76]. In addition, in Cluster 3, Mg2+ and Ba in groundwater present a positive relationship (R2 = 0.51), which may be associated with local mineral dissolution. It should be noted that only groundwater in Cluster 3 originates from aquifers other than the Quaternary unconsolidated sediment pore aquifer. Specifically, part of the groundwater in Cluster 3 is derived from the granite fissure aquifer (Figure 1), which is less susceptible to anthropogenic influences. Considering the cluster’s geographic distribution in a piedmont setting and low major ion concentrations, the groundwater in Cluster 3 is inferred to be affected by a combination of mineral weathering and agricultural pollution.
Specifically, Cluster 1 is mainly affected by industrial activities such as petrochemical production and electroplating, which contribute to elevated heavy metal concentrations and a scattered spatial distribution near industrial sites. Cluster 2 is influenced by domestic sewage inputs, distributed along river flow paths in residential and village areas. Cluster 3 reflects the combined effects of agricultural fertilization and natural mineral weathering, with groundwater exhibiting a lateral distribution along the northern piedmont zone.

4. Conclusions

This study investigated the spatial heterogeneity and dominant controlling factors of nine heavy metals (Cr, Fe, Mn, Ni, Cu, Zn, As, Ba, Pb) in the groundwater in a typical industrial city in southern China, using a combination of self-organizing maps (SOM) coupled with K-means clustering, local Moran’s I analysis, and correlation analysis.
The results reveal spatial variability in heavy metal concentrations, indicating pronounced spatial heterogeneity across the study area. Cr, Mn, Fe, and Cu concentrations are high in the midstream river sections and in groundwater near urban fringe zones with a local hotspot distribution pattern, while their concentrations remain low in central urban areas. Cr formed a high-value cluster in the northwest; Mn and Fe formed low-value clusters in central and eastern urban areas, with relatively stable spatial patterns and few outliers. Cu presented HL outliers mainly in the central and southwestern zones. Groundwater Ni presented high concentrations in the south and low values in central urban areas, with HH clusters in the south and LL clusters in the northeast. Zn, Pb, and Ba showed a lateral spatial pattern, with high groundwater values occurring near the urban fringe zones in the piedmont region. Zn clustered in the southwest; Pb and Ba formed HL and LH outliers in the piedmont region, and Pb also showed an LL cluster. High arsenic (As) concentrations were found in the urban and village areas, and an HH cluster of arsenic (As) was shown in the village areas along the river.
The SOM results classified groundwater into three clusters. Groundwater in Cluster 1, characterized by elevated concentrations of Cr, Mn, Fe, Ni, Na+, and Cl, presents a spatially scattered distribution near petrochemical and electroplating facilities, indicating a dominant influence from industrial pollution. Cluster 2, dominated by As, NO3, Ca2+, and K+, shows a strong correlation between NO3 and Cl and is primarily located in urban centers and residential areas, suggesting domestic sewage as the main source of contamination. Cluster 3, defined by Zn, Ba, Pb, and NO3, is distributed across piedmont plains and agricultural zones. It is characterized by relatively low concentrations of major ions and a strong positive correlation between K+ and NO3, indicating the combined influence of agricultural activities and natural mineral dissolution.
In conclusion, this study systematically demonstrated a multi-source composite control mechanism of groundwater heavy metal contamination by integrating spatial distribution characteristics, clustering patterns, and elemental correlation. Not only in southern China but also in many other regions, industrial zones are commonly intertwined with urban and agricultural activities, resulting in complex and overlapping sources of groundwater heavy metal contamination. The methods proposed in this study (a combination of SOM with K-means, local Moran’s I analysis, boxplot analysis, and correlation analysis) for characterizing spatial heterogeneity and identifying the controlling factors of groundwater heavy metals are both practical and easily adaptable, making them suitable for broader application in similar settings. This study provides theoretical insights and technical support for groundwater pollution prevention and water resource protection in industrialized areas.

Author Contributions

J.D.: Conceptualization; Methodology; Software; Validation; Formal analysis; Data curation; Visualization; Writing—original draft. F.L.: Conceptualization; Supervision; Resources; Validation; Writing—review and editing; Project administration; Funding acquisition. Z.Z.: Investigation; Validation; Writing—review and editing. A.D.: Investigation. J.Q.: Investigation. All authors have read and agreed to the published version of the manuscript.

Funding

This research was funded by the National Key Research and Development Program of China, grant number 2022YFC3702300.

Data Availability Statement

All processed data generated or used during the study appear in the submitted article. Raw data will be provided upon reasonable request from the corresponding author.

Conflicts of Interest

The authors declare no conflicts of interest.

References

  1. Wang, Z.; Gao, Z.; Wang, S.; Liu, J.; Li, W.; Deng, Q.; Lv, L.; Liu, Y.; Su, Q. Hydrochemistry characters and hydrochemical processes under the impact of anthropogenic activity in the Yiyuan city, Northern China. Environ. Earth Sci. 2021, 80, 60. [Google Scholar] [CrossRef]
  2. Lu, J.; Wu, J.; Zhang, C.; Zhang, Y. Possible effect of submarine groundwater discharge on the pollution of coastal water: Occurrence, source, and risks of endocrine disrupting chemicals in coastal groundwater and adjacent seawater influenced by reclaimed water irrigation. Chemosphere 2020, 250, 126323. [Google Scholar] [CrossRef]
  3. Tam, V.T.; Batelaan, O.; Le, T.; Nhan, P. Three-dimensional hydrostratigraphical modelling to support evaluation of recharge and saltwater intrusion in a coastal groundwater system in Vietnam. Hydrogeol. J. 2014, 22, 1749–1762. [Google Scholar] [CrossRef]
  4. Wen, X.; Lu, J.; Wu, J.; Lin, Y.; Luo, Y. Influence of coastal groundwater salinization on the distribution and risks of heavy metals. Sci. Total Environ. 2019, 652, 267–277. [Google Scholar] [CrossRef]
  5. Jiang, W.; Liu, H.; Sheng, Y.; Ma, Z.; Zhang, J.; Liu, F.; Chen, S.; Meng, Q.; Bai, Y. Distribution, Source Apportionment, and Health Risk Assessment of Heavy Metals in Groundwater in a Multi-mineral Resource Area, North China. Expo. Health 2022, 14, 807–827. [Google Scholar] [CrossRef]
  6. Doyi, I.; Essumang, D.; Gbeddy, G.; Dampare, S.; Kumassah, E.; Saka, D. Spatial distribution, accumulation and human health risk assessment of heavy metals in soil and groundwater of the Tano Basin, Ghana. Ecotoxicol. Environ. Saf. 2018, 165, 540–546. [Google Scholar] [CrossRef]
  7. Manoj, S.; RamyaPriya, R.; Elango, L. Long-term exposure to chromium contaminated waters and the associated human health risk in a highly contaminated industrialised region. Environ. Sci. Pollut. Res. 2021, 28, 4276–4288. [Google Scholar] [CrossRef]
  8. Sheng, Y.; Baars, O.; Guo, D.; Whitham, J.; Srivastava, S.; Dong, H. Mineral-Bound Trace Metals as Cofactors for Anaerobic Biological Nitrogen Fixation. Environ. Sci. Technol. 2023, 57, 7206–7216. [Google Scholar] [CrossRef]
  9. Su, C.; Meng, J.; Zhou, Y.; Bi, R.; Chen, Z.; Diao, J.; Huang, Z.; Kan, Z.; Wang, T. Heavy Metals in Soils From Intense Industrial Areas in South China: Spatial Distribution, Source Apportionment, and Risk Assessment. Front. Environ. Sci. 2022, 10, 820536. [Google Scholar] [CrossRef]
  10. Chen, H.; Teng, Y.; Lu, S.; Wang, Y.; Wang, J. Contamination features and health risk of soil heavy metals in China. Sci. Total Environ. 2015, 512–513, 143–153. [Google Scholar] [CrossRef]
  11. Wu, H.; Wang, X.; Ren, H.; Gao, M.; Cai, J.; Cheng, J. Groundwater Heavy Metal Pollution Characteristics and Health Risk Assessment in Typical Industrial Parks in Southwest China. Water 2024, 16, 3435. [Google Scholar] [CrossRef]
  12. Zhang, Y.; Yu, Y.; An, G.; Huang, T.; Huang, J. Spatial Distribution of Pollutants and Risk Assessment of Heavy Metals in Farmland Groundwater around a Traditional Industrial Park—A Case Study of Shifang City, Southwestern China. Sustainability 2023, 15, 14903. [Google Scholar] [CrossRef]
  13. Jiang, C.; Zhao, Q.; Zheng, L.; Chen, X.; Li, C.; Ren, M. Distribution, source and health risk assessment based on the Monte Carlo method of heavy metals in shallow groundwater in an area affected by mining activities, China. Ecotoxicol. Environ. Saf. 2021, 224, 112679. [Google Scholar] [CrossRef]
  14. Mirzabeygi, M.; Abbasnia, A.; Yunesian, M.; Nodehi, R.N.; Yousefi, N.; Hadi, M.; Mahvi, A.H. Heavy metal contamination and health risk assessment in drinking water of Sistan and Baluchistan, Southeastern Iran. Hum. Ecol. Risk Assess. Int. J. 2017, 23, 1893–1905. [Google Scholar] [CrossRef]
  15. Wang, S.; Cai, L.-M.; Wen, H.-H.; Luo, J.; Wang, Q.-S.; Liu, X. Spatial distribution and source apportionment of heavy metals in soil from a typical county-level city of Guangdong Province, China. Sci. Total Environ. 2019, 655, 92–101. [Google Scholar] [CrossRef]
  16. Li, T.; Sun, G.; Yang, C.; Liang, K.; Ma, S.; Huang, L. Using self-organizing map for coastal water quality classification: Towards a better understanding of patterns and processes. Sci. Total Environ. 2018, 628–629, 1446–1459. [Google Scholar] [CrossRef]
  17. Santos, M.R.; Roisenberg, A.; Iwashita, F.; Roisenberg, M. Hydrogeochemical spatialization and controls of the Serra Geral Aquifer System in southern Brazil: A regional approach by self-organizing maps and k-means clustering. J. Hydrol. 2020, 591, 125602. [Google Scholar] [CrossRef]
  18. Urme, O.; Reza, A.S.; Adham, M.I.; Sattar, G.S. Arsenic, manganese, and iron concentration in groundwater of northwestern part of Bangladesh using self-organizing maps: Implication for health risk assessment. Heliyon 2025, 11, e41805. [Google Scholar] [CrossRef]
  19. Liu, J.; Tang, L.; Peng, Z.; Gao, W.; Xiang, C.; Chen, W.; Jiang, J.; Guo, J.; Xue, S. The heterogeneous distribution of heavy metal(loid)s at a smelting site and its potential implication on groundwater. Sci. Total Environ. 2024, 948, 174944. [Google Scholar] [CrossRef]
  20. Zhu, G.; Wu, X.; Ge, J.; Liu, F.; Zhao, W.; Wu, C. Influence of mining activities on groundwater hydrochemistry and heavy metal migration using a self-organizing map (SOM). J. Clean. Prod. 2020, 257, 120664. [Google Scholar] [CrossRef]
  21. Li, J.; Wang, G.; Liu, F.; Cui, L.; Jiao, Y. Source Apportionment and Ecological-Health Risks Assessment of Heavy Metals in Topsoil Near a Factory, Central China. Expo. Health 2020, 13, 79–92. [Google Scholar] [CrossRef]
  22. Li, Y.; Deng, Y.; Cheung, H.-N.; Zhou, W.; Yang, S.; Zhang, H. Amplifying subtropical hydrological transition over China in early summer tied to weakened mid-latitude synoptic disturbances. npj Clim. Atmos. Sci. 2022, 5, 40. [Google Scholar] [CrossRef]
  23. Li, Z.; Yang, S.; He, B.; Hu, C. Intensified Springtime Deep Convection over the South China Sea and the Philippine Sea Dries Southern China. Sci. Rep. 2016, 6, 30470. [Google Scholar] [CrossRef]
  24. Guo, Q. Regional Geological Survey Report of Shantou Sheet F-50-3 and Huilai Sheet F-50-9, 1:200,000 Scale; Guangdong Regional Geological Survey Team: Guangzhou, China, 1973. [Google Scholar]
  25. Devic, G.; Djordjevic, D.; Sakan, S. Natural and anthropogenic factors affecting the groundwater quality in Serbia. Sci. Total Environ. 2014, 468–469, 933–942. [Google Scholar] [CrossRef]
  26. Li, H.; Boufadel, M.C. Long-term persistence of oil from the Exxon Valdez spill in two-layer beaches. Nat. Geosci. 2010, 3, 96–99. [Google Scholar] [CrossRef]
  27. Yin, X.; Jiang, B.; Feng, Z.; Yao, B.; Shi, X.; Sun, Y.; Wu, J. Comprehensive evaluation of shallow groundwater quality in Central and Southern Jiangsu Province, China. Environ. Earth Sci. 2017, 76, 400. [Google Scholar] [CrossRef]
  28. Barbieri, M.; Franchini, S.; Barberio, M.D.; Billi, A.; Boschetti, T.; Giansante, L.; Gori, F.; Jonsson, S.; Petitta, M.; Skelton, A.; et al. Changes in groundwater trace element concentrations before seismic and volcanic activities in Iceland during 2010–2018. Sci. Total Environ. 2021, 793, 148635. [Google Scholar] [CrossRef]
  29. Zhuang, S.; Wang, G.; Zhou, X.; Shi, Z.; Yuan, D.; Tian, J.; He, M.; Zeng, Z.; Yan, Y.; Yao, B.; et al. Deciphering the distribution and enrichment of arsenic in geothermal water in the Red River Fault Zone, southwest China. J. Hazard. Mater. 2025, 485, 136756. [Google Scholar] [CrossRef]
  30. Wang, C.; Liao, F.; Wang, G.; Qu, S.; Mao, H.; Bai, Y. Hydrogeochemical evolution induced by long-term mining activities in a multi-aquifer system in the mining area. Sci. Total Environ. 2023, 854, 158806. [Google Scholar] [CrossRef]
  31. Huang, X.; Wang, G.; Liang, X.; Cui, L.; Ma, L.; Xu, Q. Hydrochemical and Stable Isotope (δD and δ18O) Characteristics of Groundwater and Hydrogeochemical Processes in the Ningtiaota Coalfield, Northwest China. Mine Water Environ. 2017, 37, 119–136. [Google Scholar] [CrossRef]
  32. Wang, P.; Song, X.; Han, D.; Zhang, Y.; Liu, X. A study of root water uptake of crops indicated by hydrogen and oxygen stable isotopes: A case in Shanxi Province, China. Agric. Water Manag. 2010, 97, 475–482. [Google Scholar] [CrossRef]
  33. Raja, V.; Lakshmi, R.V.; Sekar, C.P.; Chidambaram, S.; Neelakantan, M.A. Health Risk Assessment of Heavy Metals in Groundwater of Industrial Township Virudhunagar, Tamil Nadu, India. Arch. Environ. Contam. Toxicol. 2021, 80, 144–163. [Google Scholar] [CrossRef]
  34. Demirel, Z. Monitoring of heavy metal pollution of groundwater in a phreatic aquifer in Mersin-Turkey. Environ. Monit. Assess. 2007, 132, 15–23. [Google Scholar] [CrossRef]
  35. Kohonen, T. Self-organized formation of topologically correct feature maps. Biol. Cybern. 1982, 43, 59–69. [Google Scholar] [CrossRef]
  36. Hazrati-Yadkoori, S.; Datta, B. Adaptive Surrogate Model Based Optimization (ASMBO) for Unknown Groundwater Contaminant Source Characterizations Using Self-Organizing Maps. J. Water Resour. Prot. 2017, 9, 193–214. [Google Scholar] [CrossRef]
  37. Reff, A.; Eberly, S.I.; Bhave, P.V. Receptor modeling of ambient particulate matter data using positive matrix factorization: Review of existing methods. J. Air Waste Manag. Assoc. 2007, 57, 146–154. [Google Scholar] [CrossRef]
  38. Zanotti, C.; Rotiroti, M.; Fumagalli, L.; Stefania, G.A.; Canonaco, F.; Stefenelli, G.; Prévôt, A.S.H.; Leoni, B.; Bonomi, T. Groundwater and surface water quality characterization through positive matrix factorization combined with GIS approach. Water Res. 2019, 159, 122–134. [Google Scholar] [CrossRef]
  39. Jiang, W.; Meng, L.; Liu, F.; Sheng, Y.; Chen, S.; Yang, J.; Mao, H.; Zhang, J.; Zhang, Z.; Ning, H. Distribution, source investigation, and risk assessment of topsoil heavy metals in areas with intensive anthropogenic activities using the positive matrix factorization (PMF) model coupled with self-organizing map (SOM). Environ. Geochem. Health 2023, 45, 6353–6370. [Google Scholar] [CrossRef]
  40. Nguyen, T.T.; Kawamura, A.; Tong, T.N.; Nakagawa, N.; Amaguchi, H.; Gilbuena, R. Clustering spatio–seasonal hydrogeochemical data using self-organizing maps for groundwater quality assessment in the Red River Delta, Vietnam. J. Hydrol. 2015, 522, 661–673. [Google Scholar] [CrossRef]
  41. Zhang, C.; Luo, L.; Xu, W.; Ledwith, V. Use of local Moran’s I and GIS to identify pollution hotspots of Pb in urban soils of Galway, Ireland. Sci. Total Environ. 2008, 398, 212–221. [Google Scholar] [CrossRef]
  42. Frankl, A.; Stal, C.; Abraha, A.; Nyssen, J.; Rieke-Zapp, D.; De Wulf, A.; Poesen, J. Detailed recording of gully morphology in 3D through image-based modelling. Catena 2015, 127, 92–101. [Google Scholar] [CrossRef]
  43. Shanin, V.N.; Komarov, A.S.; Bykhovets, S.S. Simulation modelling for sustainable forest management: A case-study. Procedia Environ. Sci. 2012, 13, 535–549. [Google Scholar] [CrossRef]
  44. Paoli, L.; Loppi, S. A biological method to monitor early effects of the air pollution caused by the industrial exploitation of geothermal energy. Environ. Pollut. 2008, 155, 383–388. [Google Scholar] [CrossRef]
  45. GB 3838-2002; Environmental Quality Standards for Surface Water. Ministry of Ecology and Environment of the People’s Republic of China: Beijing, China, 2002.
  46. GB/T 14848-2017; Standard for Groundwater Quality. Ministry of Ecology and Environment of the People’s Republic of China: Beijing, China, 2017.
  47. Mukherjee, I.; Singh, U.K.; Singh, R.P.; Anshumali; Kumari, D.; Jha, P.K.; Mehta, P. Characterization of heavy metal pollution in an anthropogenically and geologically influenced semi-arid region of east India and assessment of ecological and human health risks. Sci. Total Environ. 2020, 705, 135801. [Google Scholar] [CrossRef]
  48. Lü, H.; Dang, X.; Zhu, Y.; Zhao, L.; Hou, H.; Xu, R.; Xu, X. Groundwater quality analysis and health risk assessment of heavy metal in industrial areas of Henan Province, China. J. Agro-Environ. Sci. 2023, 42, 2740–2751. (In Chinese) [Google Scholar]
  49. Rahman, M.A.T.M.T.; Paul, M.; Bhoumik, N.; Hassan, M.; Alam, M.K.; Aktar, Z. Heavy metal pollution assessment in the groundwater of the Meghna Ghat industrial area, Bangladesh, by using water pollution indices approach. Appl. Water Sci. 2020, 10, 186. [Google Scholar] [CrossRef]
  50. Huo, X.N.; Zhang, W.W.; Sun, D.F.; Li, H.; Zhou, L.D.; Li, B.G. Spatial pattern analysis of heavy metals in Beijing agricultural soils based on spatial autocorrelation statistics. Int. J. Environ. Res. Public Health 2011, 8, 2074–2089. [Google Scholar] [CrossRef]
  51. Anselin, L. Local Indicators of Spatial Association—LISA. Geogr. Anal. 2010, 27, 93–115. [Google Scholar] [CrossRef]
  52. Serville-Tertullien, M.; Charlemagne, K.; Eristhee, N.; McDermott, K.; Majury, A.; Schirmer, T.; Sultana, T.; Metcalfe, C.D. Sources of microbial contamination in the watershed and coastal zone of Soufriere, St. Lucia. Environ. Monit. Assess. 2022, 194, 225. [Google Scholar] [CrossRef]
  53. Getis, A.; Ord, J.K. The Analysis of Spatial Association by Use of Distance Statistics. Geogr. Anal. 2010, 24, 189–206. [Google Scholar] [CrossRef]
  54. Liu, J.; Zhang, X.; Xia, J.; Wu, S.; She, D.; Zou, L. Characterizing and explaining spatio-temporal variation of water quality in a highly disturbed river by multi-statistical techniques. Springerplus 2016, 5, 1171. [Google Scholar] [CrossRef]
  55. Romero-Natale, A.; Palchetti, I.; Avelar, M.; González-Vergara, E.; Garate-Morales, J.L.; Torres, E. Spectrophotometric Detection of Glyphosate in Water by Complex Formation between Bis 5-Phenyldipyrrinate of Nickel (II) and Glyphosate. Water 2019, 11, 719. [Google Scholar] [CrossRef]
  56. Yang, G.; Zhao, Y.; Xing, H.; Fu, Y.; Liu, G.; Kang, X.; Mai, X. Understanding the changes in spatial fairness of urban greenery using time-series remote sensing images: A case study of Guangdong-Hong Kong-Macao Greater Bay. Sci. Total Environ. 2020, 715, 136763. [Google Scholar] [CrossRef]
  57. Ju, Q.; Hu, Y.; Xie, Z.; Liu, Q.; Zhang, Z.; Liu, Y.; Peng, T.; Hu, T. Characterizing spatial dependence of boron, arsenic, and other trace elements for Permian groundwater in Northern Anhui plain coal mining area, China, using spatial autocorrelation index and geostatistics. Environ. Sci. Pollut. Res. Int. 2023, 30, 39184–39198. [Google Scholar] [CrossRef]
  58. Wang, W.; Lin, C.; Wang, L.; Jiang, R.; Liu, Y.; Lin, H.; Chen, J. Effects of Human Activities on the Spatial Distribution, Ecological Risk and Sources of PTEs in Coastal Sediments. Int. J. Environ. Res. Public Health 2021, 18, 12476. [Google Scholar] [CrossRef]
  59. Vasileiou, E.; Papazotos, P.; Dimitrakopoulos, D.; Perraki, M. Expounding the origin of chromium in groundwater of the Sarigkiol basin, Western Macedonia, Greece: A cohesive statistical approach and hydrochemical study. Environ. Monit. Assess. 2019, 191, 509. [Google Scholar] [CrossRef]
  60. Zhou, R.; Chen, J.; Cui, S.; Li, L.; Qian, J.; Zhao, H.; Huang, G. A data-driven framework to identify influencing factors for soil heavy metal contaminations using random forest and bivariate local Moran’s I: A case study. J. Environ. Manag. 2025, 375, 124172. [Google Scholar] [CrossRef]
  61. Costa, E.L.R.; Braga, T.; Dias, L.A.; Albuquerque, É.L.d.; Fernandes, M.A.C. Analysis of Atmospheric Pollutant Data Using Self-Organizing Maps. Sustainability 2022, 14, 10369. [Google Scholar] [CrossRef]
  62. Belkhiri, L.; Mouni, L.; Tiri, A.; Narany, T.S.; Nouibet, R. Spatial analysis of groundwater quality using self-organizing maps. Groundw. Sustain. Dev. 2018, 7, 121–132. [Google Scholar] [CrossRef]
  63. Cheng, F.; Liu, S.; Yin, Y.; Zhang, Y.; Zhao, Q.; Dong, S. Identifying trace metal distribution and occurrence in sediments, inundated soils, and non-flooded soils of a reservoir catchment using Self-Organizing Maps, an artificial neural network method. Environ. Sci. Pollut. Res. Int. 2017, 24, 19992–20004. [Google Scholar] [CrossRef]
  64. Andersen, C.P.; Ritter, W.; Gregg, J.; Matyssek, R.; Grams, T.E. Below-ground carbon allocation in mature beech and spruce trees following long-term, experimentally enhanced O3 exposure in Southern Germany. Environ. Pollut. 2010, 158, 2604–2609. [Google Scholar] [CrossRef]
  65. Bhowmick, S.; Pramanik, S.; Singh, P.; Mondal, P.; Chatterjee, D.; Nriagu, J. Arsenic in groundwater of West Bengal, India: A review of human health risks and assessment of possible intervention options. Sci. Total Enviorn. 2018, 612, 148–169. [Google Scholar] [CrossRef]
  66. Lu, X.; Wang, L.; Lei, K.; Huang, J.; Zhai, Y. Contamination assessment of copper, lead, zinc, manganese and nickel in street dust of Baoji, NW China. J. Hazard. Mater. 2009, 161, 1058–1062. [Google Scholar] [CrossRef]
  67. Peng, H.; Xie, W.; Li, D.; Wu, M.; Zhang, Y.; Xu, H.; Ye, J.; Ye, T.; Xu, L.; Liang, Y.; et al. Copper-resistant mechanism of Ochrobactrum MT180101 and its application in membrane bioreactor for treating electroplating wastewater. Ecotoxicol. Environ. Saf. 2019, 168, 17–26. [Google Scholar] [CrossRef]
  68. Xiao, R.; Guo, D.; Ali, A.; Mi, S.; Liu, T.; Ren, C.; Li, R.; Zhang, Z. Accumulation, ecological-health risks assessment, and source apportionment of heavy metals in paddy soils: A case study in Hanzhong, Shaanxi, China. Environ. Pollut. 2019, 248, 349–357. [Google Scholar] [CrossRef]
  69. Fu, F.; Wang, Q. Removal of heavy metal ions from wastewaters: A review. J. Environ. Manag. 2011, 92, 407–418. [Google Scholar] [CrossRef]
  70. Mao, H.; Wang, G.; Liao, F.; Shi, Z.; Huang, X.; Li, B.; Yan, X. Geochemical evolution of groundwater under the influence of human activities: A case study in the southwest of Poyang Lake Basin. Appl. Geochem. 2022, 140, 105299. [Google Scholar] [CrossRef]
  71. Qiao, Z.; Sheng, Y.; Wang, G.; Chen, X.; Liao, F.; Mao, H.; Zhang, H.; He, J.; Liu, Y.; Lin, Y.; et al. Deterministic factors modulating assembly of groundwater microbial community in a nitrogen-contaminated and hydraulically-connected river-lake-floodplain ecosystem. J. Environ. Manag. 2023, 347, 119210. [Google Scholar] [CrossRef]
  72. Wang, J. Short-term geochemical investigation and assessment of dissolved elements from simulated ash reclaimed soil into groundwater. Environ. Pollut. 2019, 247, 302–311. [Google Scholar] [CrossRef]
  73. Olson, K.R.; Chau, K.M. Natural and Anthropic Sources of Arsenic in the Groundwater and Soils of the Mekong Delta. Open J. Soil Sci. 2022, 12, 541–570. [Google Scholar] [CrossRef]
  74. Kimball, B.A.; Runkel, R.L.; Walton-Day, K. An approach to quantify sources, seasonal change, and biogeochemical processes affecting metal loading in streams: Facilitating decisions for remediation of mine drainage. Appl. Geochem. 2010, 25, 728–740. [Google Scholar] [CrossRef]
  75. Arienzo, M.; Christen, E.W.; Quayle, W.; Kumar, A. A review of the fate of potassium in the soil-plant system after land application of wastewaters. J. Hazard. Mater. 2009, 164, 415–422. [Google Scholar] [CrossRef]
  76. Jang, C.S. Geostatistical estimates of groundwater nitrate-nitrogen concentrations with spatial auxiliary information on DRASTIC-LU-based aquifer contamination vulnerability. Environ. Sci. Pollut. Res. Int. 2023, 30, 81113–81130. [Google Scholar] [CrossRef]
Figure 1. Sampling locations (a) and hydrogeological map (b) of the study area.
Water 17 02012 g001
Figure 2. Spatial distribution of heavy metals in groundwater and river water in the study area. (ai) are spatial distributions of Cr, Mn, Fe, Ni, Cu, Zn, As, Ba, and Pb, respectively.
Water 17 02012 g002
Figure 3. Local spatial autocorrelation of heavy metals in groundwater. (ai) are local spatial autocorrelations of Cr, Mn, Fe, Ni, Cu, Zn, As, Ba, and Pb, respectively.
Water 17 02012 g003
Figure 4. Self-organizing map (SOM) clustering results. (a) Component planes showing the normalized weights of input variables; (b) SOM topology map showing the clustering of groundwater samples.
Water 17 02012 g004
Figure 5. Spatial distribution of SOM clusters of groundwater in the study area.
Water 17 02012 g005
Figure 6. Box plots of heavy metals and associated variables in three clusters.
Water 17 02012 g006
Figure 7. Correlation analysis of heavy metals and associated variables in groundwater.
Water 17 02012 g007
Figure 8. Relationship between representative variables. The black, red, and blue lines are the fitting lines for Clusters 1, 2, and 3, respectively. (a) Relationship between Zn and Ba; (b) Relationship between SO42− and Cr; (c) Relationship between Zn and Cu; (d) Relationship between NO3 and Cl; (e) Relationship between K+ and Cl; (f) Relationship between K+ and Na+; (g) Relationship between NO3 and K+; (h) Relationship between Mg2+ and Ba.
Water 17 02012 g008
Table 1. Descriptive statistics of heavy metal concentrations (ug/L) in groundwater samples.
ElementNumber of CasesMinimumMaximumMeanStandard
Deviation
VarianceLimited
Values
Cr380.001.750.270.340.1250
Mn380.2512,310.83467.812004.384,017,548.84100
Fe385.4524,838.14929.414081.1916,656,142.67300
Ni380.003.490.950.880.7820
Cu380.2010.912.142.717.341000
Zn382.1053.4114.2612.95167.751000
As380.0013.891.502.596.7010
Ba381.97403.5698.08103.5610,724.68700
Pb380.0021.011.233.9615.6710
Note: Limit values are based on the Class III groundwater quality standards in China [46].
Table 2. Descriptive statistics of heavy metal concentrations (ug/L) in surface water samples.
ElementNumber of CasesMinimumMaximumMeanStandard
Deviation
VarianceLimited
Values
Cr120.162.030.680.610.3750
Mn1283.19303.69183.4685.797360.70100
Fe12389.141727.181002.89417.24174,086.77300
Ni120.002.060.640.650.4220
Cu120.807.352.851.933.721000
Zn127.1935.9616.738.1967.001000
As120.142.700.650.830.6950
Ba1228.6461.4241.2311.81139.39700
Pb121.9916.287.425.7132.6450
Note: Limit values are based on the Class III surface water quality standards in China [45].
Disclaimer/Publisher’s Note: The statements, opinions and data contained in all publications are solely those of the individual author(s) and contributor(s) and not of MDPI and/or the editor(s). MDPI and/or the editor(s) disclaim responsibility for any injury to people or property resulting from any ideas, methods, instructions or products referred to in the content.