Abstract
The article investigates the development of local scour downstream of a damming structure, emphasizing the dynamic equilibrium of river morphology influenced by both natural processes and human interventions like the construction of weirs. It distinguishes between clear-water and live-bed conditions, discussing how sediment transport interacts with hydraulic forces to shape the riverbed. The introduction of a damming structure disrupts sediment flow and initiates local scour formation, which varies depending on stream conditions. In the experimental section, a physical model of a damming weir was tested under controlled conditions. The laboratory model was inspired by an existing damming weir on the Radomka River in Poland. Granulometric analysis and eleven flow series were conducted to assess scour evolution over time. The results showed the fastest erosion in the first hours, followed by stabilization in scour depth but continued elongation of the scour hole. The analysis identified four phases of scour development: initiation, intensive growth, stabilization, and equilibrium. Despite depth stabilization, scour length continued to increase, indicating that full equilibrium had not been reached. The study highlights the complexity of predicting scour behavior and recommends incorporating both depth and length evolution into design analyses to improve the resilience of such damming structures. The innovative aspect of the present study lies in the inclusion of coarse sediment transport, previously accumulated in the upstream reach due to the weir’s impoundment effect, into the scour development process. This specific effect has not been addressed in the studies cited by other authors. This research provides crucial insights for the sustainable design of hydraulic structures and effective sediment management strategies, contributing to the long-term stability and safety of riverine infrastructure.
1. Introduction
The intensity and course of channel-forming processes are influenced by natural factors, such as a river’s hydrological regime, the type of channel material, and the horizontal and vertical arrangement of the river [1,2]. These processes are also affected by anthropogenic factors, including regulatory and hydrotechnical development [3]. Variable water flow and sediment transport conditions, determined by natural factors, drive the continuous but slow process of shaping river habitats. However, anthropogenic interventions often accelerate this process, inducing significant morphological changes in river channels [4,5,6,7,8].
The morphology of river channels formed in alluvial deposits is shaped by fluvial processes, including the flow of water and the sediment transport induced by it. Both of these processes occur according to a feedback loop, which means that hydraulic flow conditions and the morphology of the riverbed shaped by them undergo mutual adjustments to maintain the river in a state of dynamic equilibrium between the current flow intensity and the sediment transport rate [9,10,11].
Rivers in a state of hydrodynamic equilibrium are characterized by long-term stability in the fundamental parameters of the channel (width, depth, and uniform bed slope). This state of dynamic equilibrium does not preclude the occurrence of short-term morphological changes in the riverbed, which result from the natural hydrological cycle. In such cases, changes in the morphological parameters of the riverbed are insignificant and fluctuate around the long-term average values [9,10,12,13], whereas extreme flood events induce significantly greater morphological transformations. Directly after such surges, new conditions of dynamic equilibrium are established [9,10,14].
The introduction of damming structures into a riverbed results in a loss of hydrodynamic equilibrium. Consequently, the channel alters its morphology, the sediment transport regime, and often the bedload grain size distribution [15]. Excessive erosion can change the channel shape, cutting off meanders and thus leading to the loss of valuable habitat, as well as increasing the bed slope. The stream then accelerates, achieving a significantly higher flow velocity, and the riverbed is threatened by local scouring.
Hydrodynamic equilibrium in the local scouring phenomenon is recognized when the depth of the local scour stabilizes and further deepening ceases. The dynamic nature of underwater topography and continuous bed transformations introduce significant complexity to the erosion process, complicating the measurement of scour geometry downstream of weirs [16]. The approaching stream transports bedload, which could either be accumulated upstream of the sill, disrupting sediment transport continuity, or actively contribute to the formation of local scour. Accordingly, scour hole evolution can develop under clear-water or live-bed conditions (Figure 1).
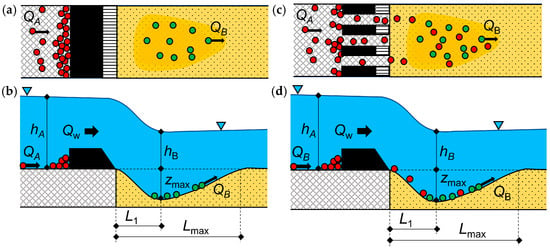
Figure 1.
Sediment transport arrangements within the local scour. (a) Clear-water conditions—plan view, (b) clear-water conditions—profile view, (c) live-bed conditions—plan view, (d) live-bed conditions—profile view; QA, QB (m3 s−1) denote the sediment transport capacity upstream and downstream of the hydraulic structure; Qw (m3 s−1) is the water discharges; hA, hB (m) are the water depth upstream and downstream of the hydraulic structure; zmax (m) is the maximal local scour depth; L1 (m) is the distance between the weir foundation and the deepest local scour level; and Lmax (m) is the maximal local scour length.
While significant research has explored local scour under clear-water and live-bed conditions, the specific role of coarse sediment accumulated upstream of a low-threshold damming structure and its subsequent transport into the downstream scour hole has received limited attention. Previous studies have often assumed that coarse sediment is either trapped upstream due to high thresholds or that bedload transport originates solely from the immediate vicinity of the scour. Consequently, this study uniquely investigates how the downstream conveyance of such previously impounded coarse sediment, facilitated by the low height of the weir’s threshold, actively contributes to and modifies the scour evolution dynamics, presenting a crucial differentiation from existing models.
Clear-water conditions also occur when the bed shear stress upstream of the scour hole remains below the critical value, meaning the incoming water does not carry material toward the scour area. As a result, washed-out particles are not replaced by material brought by the water, and the process of scour hole deepening ceases. In live-bed conditions, the bed shear stress within the scour hole decreases until it reaches zero, allowing sediment from upstream to accumulate within the scour hole, thereby reducing its depth. Subsequently, this diminished depth results in local velocity acceleration, leading to an increase in bed shear stress [17,18]. In clear-water conditions, the depth of the scour hole stabilizes, while in live-bed conditions, some oscillation around an average value is observed [17,18,19].
Recent studies highlight that local scour processes are significantly intensified under ice-covered conditions compared to open-channel flow. The presence of an ice cover alters flow hydraulics by increasing flow velocity gradients near the bed and reducing turbulence dissipation at the surface, resulting in greater bed shear stress and deeper scour holes [20,21]. Moreover, an ice cover restricts free-surface flow, producing a more uniform velocity profile and suppressing secondary flow structures that otherwise help redistribute sediment [22]. These conditions amplify local scouring effects, particularly downstream of hydraulic structures such as weirs, sills, and bridge piers.
Experimental and numerical investigations confirm that the maximum scour depth under ice-covered conditions may exceed that observed during open-channel flow by up to 30–50% under similar hydraulic conditions [23,24]. This is particularly relevant for cold-region rivers, where the presence of ice is seasonal but can influence long-term morphodynamics. Studies also emphasize the importance of accurately modeling ice roughness and thermal effects in simulations of scour evolution under such conditions [25]. These findings underscore the need to differentiate between local scour mechanisms in open-channel and ice-covered scenarios, both of which play a crucial role in sediment transport continuity, infrastructure safety, and habitat stability.
While extensive research has focused on local scour under various clear-water and live-bed conditions, a significant research gap exists concerning the dynamic interplay of coarse sediment—specifically, that accumulated upstream due to weir impoundment—as it is mobilized and transported into the downstream scour hole, particularly in structures with low sills. Previous studies have often overlooked this crucial mechanism, leading to potential inaccuracies in scour prediction for such hydraulic structures. Therefore, the primary objective of this study is to experimentally investigate the evolution of local scour downstream of a low-threshold damming weir, with a particular focus on understanding how the transport of previously accumulated coarse sediment from the upstream reach influences the scour depth, length, and overall morphological development. This research aims to provide improved insights for the sustainable design and long-term stability assessment of similar hydraulic structures. Accordingly, the evaluation of scour development must consider seasonal flow regimes and account for the complex interplay between hydraulic, thermal, and sedimentary processes.
2. Materials and Methods
2.1. Field Survey
The Piaseczno damming weir, located on the Radomka River in Central Poland (Figure 2) (51°30′34″ N, 21°8′5″ E), served as the conceptual model for laboratory investigations. The weir is a monolithic reinforced concrete dock structure. The total weir passage is divided by two pillars into three spans. The following main dimensions were measured: width of the weir opening: 5.00 m; width of the weir plate: 16.50 m; width of the footbridge: 4.45 m; width of the communication footbridge: 1.00 m; width of pillars: 0.80 m; length of pillars: 6.35 m.
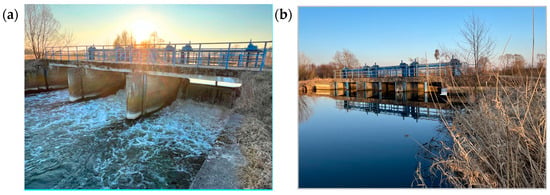
Figure 2.
The Piaseczno damming weir on the Radomka River. (a) View from tailwater; (b) view from headwater.
The average discharge of the Radomka River at its mouth is 9.4 m3 s−1; its basin area is 2100 km2, and its total length is 109 km. The studied weir is located at the 44th kilometer of the river. The surrounding land, within the area affected by the backwater, is mainly covered with grasses, farm buildings, and dense trees. The impact of the weir on crops was analyzed before its construction. The effects of the river on wildlife and its biodiversity have not been studied, but the stream parameters of water depth and velocity, as well as the granulometric characteristics of the sediment debris, can be used to characterize the hydraulic and habitat conditions of the riverbed in assessing the variation in habitat morphology upstream and downstream from this structure.
2.2. Granulometric Studies
Sieve analysis was conducted on three soil samples collected from the riverbed during field investigations of the full-scale weir. The results were then averaged and plotted on a grading curve. One type of sand filled the downstream side, where erosional processes were taking place (grain size curve “2” in Figure 3). In contrast, the upper side was filled with stained sand (grain size curve “1” in Figure 3). For this investigation, granulometric characterization was performed on a set of three extracted samples. Statistical parameters of the bedload grain size distribution were determined by a graphical method, using percentiles read from the cumulative grain size curve. The grain size curve was developed according to the actual dimensions of di sieves (mm). The experimental methodology adhered to standard procedures of soil recognition according to PN-EN ISO 14688:2006 [26], classifying the soil as medium sand with a density of 2.62 g/cm3. Characteristic diameters of the studied soil were as follows: D5 = 0.273 mm, D10 = 0.300, D50 = 0.475, D60 = 0.505 mm, D90 = 0.800 mm, D95 = 0.869 mm.
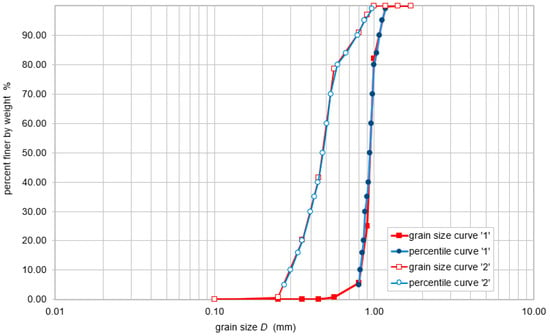
Figure 3.
Grain size curves of bedload grains used in own research.
For the arranged grain size curves by grain size Di (mm), the following characteristics were determined:
- Dm (mm)—the nominal diameter of the grain D50 = 0.475 mm, for which 50% of the weight content of the sample has a diameter larger/smaller than specified;
- Dp (mm)—the average diameter of the grain, calculated as a weighted average of the considered interval of the weight percentage pi of the analyzed dimension Di, from the following formula:
- Cc—the index of curvature of the grain size curve is calculated using characteristic grain diameters according to the formula [26]:
- Cu—the index of material grain size homogeneity (Hazen sorting coefficient):
- Ck—differential grain size index according to Knoroz:
- Cd—dominance characteristic, reflecting the predominance of grains larger or smaller than the nominal diameter D50:
Table 1 and Table 2 present a summary of the key characteristics of the grain size distribution curve for the tested soil, calculated using the formulas specified in Equations (1)–(5). Based on the applied classification criteria, the sample material is classified as monofractional, predominantly consisting of grains with dimensions exceeding the nominal diameter Dm = D50.

Table 1.
Summary of grain size characteristics of stain sand (grain size curve “1”).

Table 2.
Summary of grain size characteristics of natural aggregate (grain size curve “2”).
The characteristic values of the grain size curves provided in Table 1 and Table 2 indicate that coarser bedload with a D50 of 0.944 mm was deposited in the upstream reach of the weir, while finer bedload with a D50 of 0.475 mm was found in the downstream reach. Both the upstream and downstream bedloads are characterized as monofractional and well-sorted (upstream bedload Table 1: Cc ≈ 1, Cu < 6—monofractional material, Ck ≤ 4 ÷ 5—well-sorted material; downstream bedload Table 2: Cc ≈ 1, Cu < 6—monofractional material, Ck ≤ 4 ÷ 5—well-sorted material). These characteristic values suggest that not only does bedload segregation occur at the weir, but also implies the sorting and downstream transport of finer particles.
The Cd < 1 (particles with a diameter smaller than D50) value for the upstream bedload and Cd > 1 (particles with a diameter larger than D50) value for the downstream bedload indicate that bedload finer than D50 = 0.944 mm was deposited in the upstream reach, and bedload coarser than D50 = 0.475 mm was deposited in the downstream reach. Consequently, due to the weir’s influence, bedload finer than D50 = 0.475 mm is transported out of the downstream reach beyond the river section where the weir is located, and carried further downstream.
2.3. Weir Physical Model
Laboratory tests provided insights into changes in bed formation and the development of maximum local scour under clear-water conditions. These conditions were confirmed by the accumulation of material transported from the upstream section of the structure model on the sill, which acted as a barrier, disrupting the continuity of sediment transport. The final step of the laboratory experiment was to conduct 11 series of measurements with varying hydraulic conditions and analyze the results obtained.
A model of the weir, a 1:30-scale reproduction of the full-scale object (Figure 4), was developed in the laboratory and mounted within a 9.0 m long flume with a cross-section of 0.58 m in width and 0.70 m in height. Sheets of Plexiglas were used, joined with acrylic glue and sealed with silicone (Figure 4a). The voids in the pillars and threshold were filled with mounting foam to ensure the structure’s stability (Figure 4b). The structural elements were covered with sand, which was then fixed with varnish, to replicate the roughness of hydraulic concrete. Each span of the weir measures 16.0 cm. The thickness of the abutments is 2.0 cm, and their length is 48.5 cm. The pillars were designed with a 3.0 cm thickness and 23.0 cm length. The threshold height is 3.5 cm and the abutment and pillar height is 50 cm.
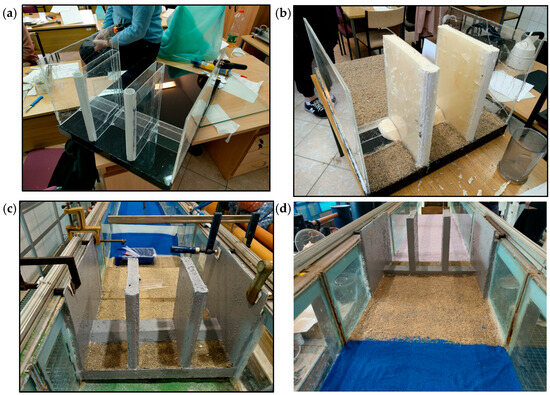
Figure 4.
Model of the damming weir during the construction phase: (a) Plexiglas framework, (b) filling the framework with polyurethane foam, (c) bonding the framework to the flume’s glass walls, (d) painted model—top view of the downstream side.
2.4. Laboratory Experiment
The sandy bed topography was recorded using a movable disc-type probe mounted on linear guides. Transparent glass walls enabled direct visual monitoring of sediment transport and particle motion. The water surface elevation was measured with a vertically adjustable pin-type gauge, also guided along precision rails. The water surface level was controlled by a tailgate installed at the downstream end of the laboratory flume. The flow rate of water supplied through the inlet pipeline from the upper tank was regulated using an electromagnetic flow meter. The hydraulic circuit in the experimental model was closed, with water circulation driven by a suction-pressure pump (Figure 5).
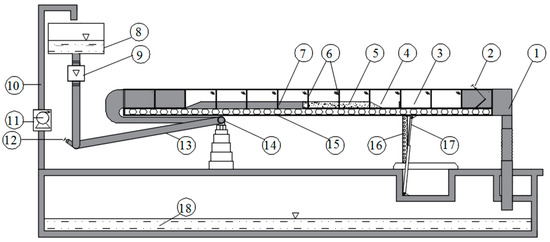
Figure 5.
Schematic diagram of the laboratory flume, where 1—discharge chamber, 2—control gate, 3—glass wall, 4—sediment collection chamber, 5—sandy bed, 6—glass wall supports, 7—concrete bed, 8—upper tank, 9—electromagnetic flow meter, 10—inlet pipeline, 11—pump, 12—control valve, 13—supply pipeline, 14—hinged support, 15—flume support, 16—flume slope adjustment support, 17—hydraulic cylinder, 18—lower tank.
The laboratory flume model assumed no external sediment supply, with bed material transport occurring solely through erosion and downstream displacement from the upstream section. The sediment conveyed to the downstream end of the experimental flume was accumulated in a collection chamber with an internal baffle. Due to the increase in flow resistance along the flume length, resulting from the varying roughness of the fixed (non-erodible) and sandy bed sections, a rise in the hydraulic gradient occurred within the scour zone, which in turn led to an increase in bed shear stress. Once the critical shear stress was exceeded, bed erosion commenced and could be observed and recorded through the glass walls using a camera. Before each successive test, the sediment accumulated in the collection chamber was extracted and uniformly redeposited along the channel bed, then leveled to a fixed zero baseline elevation using a custom wooden frame and compacted with a 3.5 kg hand tamper.
A series of tests was carried out under steady-state flow Qw conditions ranging from 0.004 to 0.040 m3 s−1 and water depth downstream over the uneroded bottom from hB = 0.0350 to 0.1200 m. These depths were measured downstream of the hydraulic structure before scour formation, under the Froude number conditions Fr < 1, ensuring subcritical stream movement (Table 3). In series 1–9 and 11, the average velocity in the downstream section was sufficient to initiate the erosion process. This was demonstrated by comparing the cross-sectional average velocity with the non-scouring velocity vn calculated using the Gončarov formula for eroded material (grain size curve “2”) (Equation (6)) [27].
where g (m s−2)—gravity acceleration and , (kg m−3)—the volume weight of the sediment and water.

Table 3.
Summary of the hydraulic properties of the measurement series for eroded material (grain size curve “2”).
In series 10, the flow velocity was below the non-scouring velocity; however, slight scour was still observed due to the spatial distribution of velocity downstream. Each measurement series lasted 8 h. Bed elevations were measured using a sound probe at cross-sections distributed along the flume length (Figure 6) at established time steps: 1, 2, 4, 6, and 8 h. The water surface level was measured with an accuracy of ±0.1 mm in the flume centerline using a movable pin gauge. The accuracy of the scour depth measurement was ±1.0 mm. The flow rate was estimated with 0.0001 m s−1 accuracy, linear dimensions (flume width, length) with 0.001 m accuracy, time with 1 s accuracy, and grain diameter with 0.00001 m accuracy.
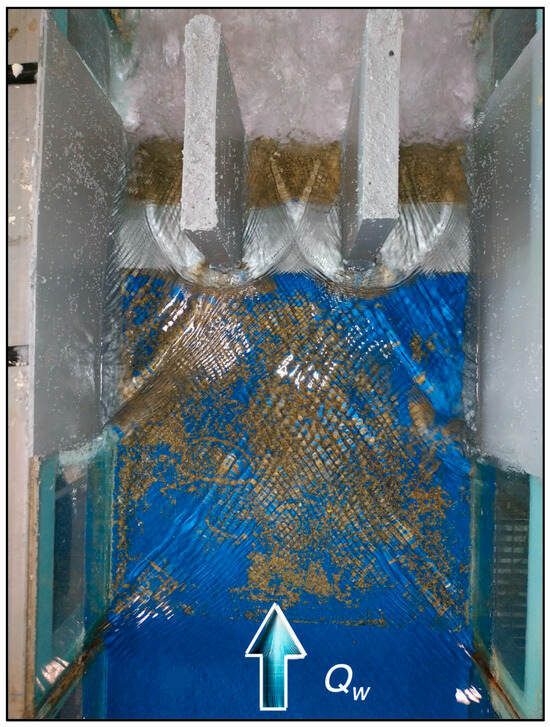
Figure 6.
Model of the weir during the operational phase for test series 6, showing characteristic flow structures: stream contraction, bow waves forming at the pillar heads, and lee-wake vortices.
The upstream and downstream sections of the flume were filled with an alluvial granular material, which was classified as coarse sand. The local scour developed under clear-water conditions, which are characterized by either sediment accumulating upstream of the sill or by bed shear stress in the upstream section remaining below the critical value. This was evidenced by the absence of sediment transport from the upstream section into the scour area. The sediment transported downstream from the scour area was captured in a collection chamber, allowing its volume to be precisely measured after the flume was drained. Local erosion was defined here as a lowering of the bed level by more than 10% of the water depth above the uneroded bottom. The simulations showed that at higher water velocities in series (3, 4, 7), the assumed “clear-water” conditions were not met because there was a flow of sediment from the upstream to the downstream section.
3. Results
An analysis of the maximum local scour depth and its length evolution over time is presented in Table 4 and Figure 7. For the initial conditions (T = 0 h), the flume bed was horizontal, which corresponds to a maximum scour depth zmax of 0.0 m and maximal scour length Lmax of 0.0 m.

Table 4.
Results of maximal local scour depth zmax and length Lmax downstream of the weir.
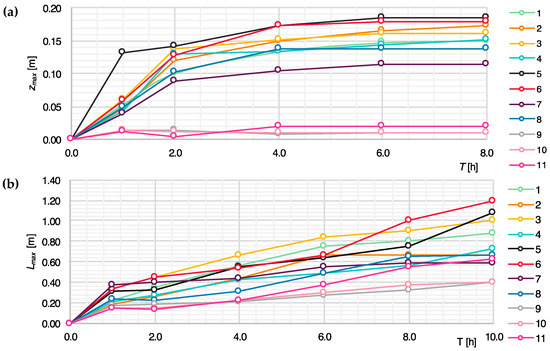
Figure 7.
Parameters of local scour evolution. (a) Maximal of local scour depths zmax; (b) lengths maximal of local scour depths Lmax.
The classification of channel bed erosion identifies four distinct phases of scour development [28], which are defined by the increase in the maximum scour depth Dz(t,t+1) = (zmax(t) − zmax(t+1)).
- Phase A: Initial onset of scour, increasing growth Dz(t,t+1);
- Phase B: Intensive development of the scour hole, constant growth Dz(t,t+1);
- Phase C: Stabilization of the process, decreasing growth Dz(t,t+1);
- Phase D: Dynamic equilibrium of the phenomena, no growth Dz(t,t+1) ≡ 0.
These phases are characterized by the relative scour depth (zmax/hB) and the relative scour time (T/To), where zmax denotes the maximum scour depth, (m); hB is the water depth downstream of the weir above the undisturbed bottom; T is the scour time in (h); and To is the time in (h) at which the maximum scour depth equals the water depth (zmax = hB). Figure 8 illustrates the scour development curve derived from the experiments conducted. However, To can only be calculated for measurements where zmax reaches or exceeds hB. Two distinct regions of the scour phases are delineated on the curve:
- (T/To) ≤ 1.0: the region of initiation and initial development of scour;
- (T/To) > 1.0: the region of final development, stabilization, attenuation, and equilibrium of the scour process.
For the ratio (T/To) ≤ 1.0, the scour curves showed a consistent trend, indicating that the scour process progressed uniformly across all tested scenarios. This uniformity allowed the process to be described by a single equation (Equation (7)) applicable to all measurements where scour occurred, valid for:
where r (–)—correlation coefficient and R2 (–)—determination coefficient.
For the ratio (T/To) > 1.0, the behavior of the curve depends on other factors. A key factor identified is the relationship between the average velocity vB (ms−1) at water depth hB (m) and two threshold velocities: the velocity of intense scouring vr and the non-scouring velocity vd. These threshold velocities were determined from the Hjulström diagram [28] at the boundary between the sediment transport and erosion phase. For the material from grain size curve “1” (Dm = D50 = 0.944 mm), the values are vr = 0.500 m/s and vd = 0.090 m/s. For the material from grain size curve “2” (Dm = D50 = 0.475 mm), the values are vr = 0.350 m/s and vd = 0.040 m/s. The following equations were obtained:
- For vB ≤ vr (series numbers 3, 4, 7):
- For vB > vr (series numbers 1, 2, 5, 6, 8):
The obtained correlation coefficient (r) values indicate that the correlation is very high.
At lower flow velocities, the progression of maximum local scour occurs more expeditiously compared to scenarios with elevated downstream velocities. Ultimately, however, the maximum local scour approaches a comparable final value, irrespective of the flow velocity (Figure 8).
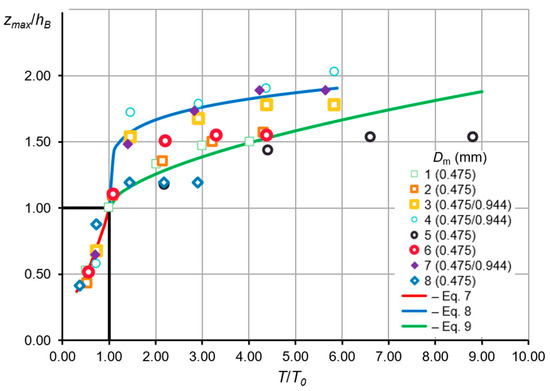

Figure 8.
Local scouring curve (own elaboration), where hB (m)—water depth over the unwashed bottom, zmax (m)—maximal scour depth; T (h)—the scouring time; and T0 (h)—the time at which the maximum scour depth is equal to the depth of hB.
A similar classification was proposed by Breusers [29], Dietz [30], and Zanke [31], distinguishing four phases of scour hole development: initial, intensive development, stabilization, and equilibrium. These phases can be recognized based on the interrelationship between the water depth, the scour depth, and the rate of scour hole development. In Figure 9, this classification, as presented in graphical form by Hoffmans and Pilarczyk [32], is compared with the results of our own research. When coarse bed material accumulates upstream of the weir, elevated flow velocities promote its downstream conveyance, which in turn affects the scour development dynamics in the downstream zone.
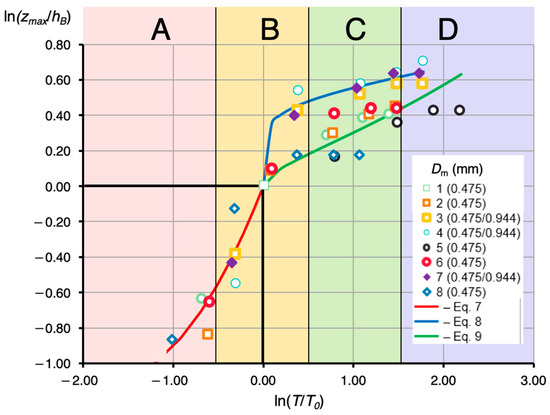
Figure 9.
The local scour depth during the experiment, where hB (m)—the stream depth above the non-washed bottom, zmax (m)—maximal scour depth, T (h)—time, To—the time at which the maximum scour depth is equal to the depth of hB (zmax = hB), A—initiation phase, B—development phase, C—stabilization phase, and D—equilibrium phase.
- For T > T0, at low water velocities (v < vr; series 3, 4, 7), the sediment transport process upstream of the structure begins at higher velocities than the movement of the finer fraction downstream. This results in a rapid increase in the downstream scour; the scour curve is steep, and the onset of the scour stabilization phase (Phase D) occurs earlier.
- For T > T0, at high water velocities (v > vr; series 1, 2, 5, 6, 8), the sediment transport process upstream of the structure begins simultaneously with scour initiation downstream. The delivery of the coarse fraction from the upstream section into the local scour area causes partial armoring of the bottom and a reduction in the intensity of scour formation. The scour hole continues to deepen; however, the stabilization process is longer, and the scour curve becomes gentler.
4. Discussion
The results obtained provide a valuable dataset on local scour formation downstream of a damming structure. Based on this analysis, the most intensive transformation of the downstream bed occurs during the first two hours of the experiment. This is evidenced by the largest increase in the depth and volume of the local scour. This stage can be referred to as the initiation phase. During this period, the highest intensity of sediment transport also occurs. Subsequently, the maximum local scour depth stabilizes due to a decrease in bed shear stress. The sediment transport intensity then decreases, in some cases, to zero. This stage can be termed the stabilization phase.
Breusers [29] demonstrated that the most rapid stabilization occurs within 4–8 h, when the scour depth reaches about 40% of the downstream water depth. His findings suggest that the scour depth stabilizes at a value of 80% of the water depth after 20 h. Beyond this point, full stabilization may not be achieved even after 100 h of testing, as the scour pit continues to deepen slowly. Balachandar and Kells [33] confirmed that the maximum scour depth follows a power-law relationship with time and stabilizes after 144 h under clear-water conditions downstream of a sluice gate in a 4.9 m-long laboratory flume.
In a study by Aminpour et al. (2018) [34] on the development of erosion downstream of stepped spillways, it was noted that the scour profile reached a quasi-equilibrium state after about 24 h of experimentation. However, under actual hydrodynamic conditions, this process can take much longer. The observations confirm that the evolution of the scour hole can be described by a power equation, whose coefficients depend on hydraulic and granulometric properties.
A critical aspect of our experimental setup, specified in Section 2.3, was the assumption of no external sediment supply to the flume. While this approach allowed us to precisely control the sediment budget originating solely from the scour process and the remobilization of previously accumulated upstream material, it represents a simplification of natural river systems. In real-world rivers, bedload transport is a continuous process, with sediment constantly supplied from upstream reaches, influencing scour dynamics and the attainment of morphological equilibrium. The absence of a continuous external sediment feed in our model means that the observed scour evolution, particularly the prolonged increase in scour length despite depth stabilization, might differ from scenarios where upstream sediment supply is continuously available to fill the scour hole. This limitation implies that while our findings provide valuable insights into the fundamental mechanisms of scour under conditions where local erosion and upstream-accumulated sediment remobilization are dominant, direct quantitative extrapolation to prototype conditions with continuous upstream sediment supply should be approached with caution. Future research could investigate the impact of varying external sediment supply rates on the long-term evolution and equilibrium state of local scour downstream of low-threshold structures.
Farhoudi and Shayan [35] give the following formula for defining the time evolution of the scour hole downstream of an ogee spillway:
where zmax (m)—maximal scour depth, hB (m)—the stream depth above the non-washed bottom, T (h)—time, To (h)—the time at which the maximum scour depth is equal to the depth of hB (zmax = hB), and k and a are dimensionless parameters of the equation.
A comparison of these parameters downstream of various hydraulic structures, as developed by different researchers for diverse types of downstream apron configurations, is presented in Table 5 [29,35,36]. Figure 10 provides an overview of the local scour development over time obtained in the present studies and according to Equations (11)–(13). Figure 10 demonstrates that the progression of scour, and thus the geometry of the resulting scour curve, is governed by the type of structure—specifically, its ability to transmit coarse bedload to the downstream section.

Table 5.
Comparison of k and a downstream of different hydraulic structures.
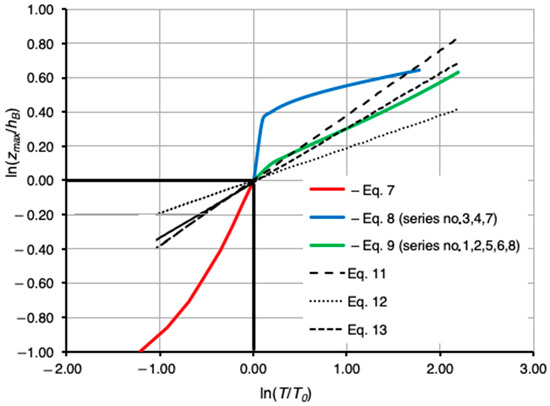
Figure 10.
The local scour depth evolution curves according to chosen research approaches.
It should be noted that local scour formation is ongoing; despite the stabilization of the hole’s depth over time, its extent, expressed by the length parameter, continues to increase. Therefore, it can be concluded that the final phase of local scour formation was not completed under the presented research conditions. Dąbkowski, Siwicki, and Urbański [37] came to a similar conclusion, noting that on an overflow model at a 1:30 geometric scale, the scour hole was still lengthening even after 48 h, despite reaching a relatively stable maximum depth.
Referring to the definition, the final phase—the achievement of a hydrodynamic equilibrium state—is recognized when the maximum scour depth has stabilized under clear-water conditions. However, given the observed increase in the local scour hole’s length, the studied section of the alluvial flume cannot be considered to have reached a stabilized hydromorphological state.
The insights gained from this experimental study, particularly regarding the distinct phases of scour development and the observed continuous increase in scour length despite depth stabilization, are of significant practical relevance. For structural design, these findings underscore the necessity of considering not only the maximum scour depth but also the potential for persistent scour hole elongation over prolonged periods. This implies that protective measures downstream of low-threshold weirs, such as riprap or other energy dissipators, should be designed with a broader footprint to account for the long-term spatial extent of scour, rather than solely focusing on maximum depth. Furthermore, the demonstrated influence of coarse sediment transport from the upstream reach on scour dynamics, a unique aspect of this study, provides crucial empirical data. This data can serve as valuable input for calibrating and validating numerical models aiming to simulate complex sediment transport processes around hydraulic structures, especially those where upstream sediment impoundment and subsequent remobilization are significant. Incorporating such fine-grained experimental data into numerical simulations will enhance their predictive capabilities, leading to more resilient and safely designed hydraulic structures.
The innovative aspect of the present study lies in incorporating the transport of coarse sediment, previously accumulated in the upstream reach, into the scour development process. This was made possible by the low height of the threshold. For high thresholds, coarse sediment is typically unable to pass over the crest; it can only be conveyed through bottom outlets, which were not present in this study. This specific effect has not been addressed in other cited studies [29,36,37].
5. Conclusions
Predicting the size and shape of a scour hole at the design stage of a structure is considered a complex research issue due to the inherent complexity of local scouring and the multitude of factors affecting it. This problem is also significant in assessing the condition of structures and determining their safety from loss of stability due to changes in foundation conditions during operation. One of the most reliable forecasting methods is conducting laboratory tests on physical models. Analyzing the bed shapes downstream of weirs allows for the creation of erosion development forecasts for the full-scale structure.
Therefore, we propose extending the scope of local scour analysis in hydrodynamic equilibrium state research. This extension should include an examination of the rate of scour hole evolution over time.
Studies revealed that local scour development and its depth increment have a different character at various water velocities. For water velocities close to the non-scouring threshold, the scouring process does not occur despite the presence of a hydraulic structure. When stream velocities gradually increase to the limiting velocity for sediment transport, the initial scour forms quickly near the structure and moves away from it over time. When tailwater velocities increase dynamically and reach a value corresponding to mass sediment movement, erosion occurs more slowly and appears further from the structure. In the end, however, the maximum scour depth approaches the same value.
The study revealed that increased flow velocity destabilizes sediment particles, causing their transport from the upstream pool further downstream. This intensified sediment transport is accompanied by the formation of an armor layer of coarse particles in the downstream scour hole, thereby mitigating subsequent scour activity. The operational management of small weirs on lowland rivers must account for the periodic opening of gates to facilitate sediment flushing. It would be advantageous to simultaneously induce a flow circulation capable of mobilizing accumulated sediment in the headwater.
Analyzing the stabilization of both parameters—that is, the maximum depth and length—provides a far more accurate basis for predicting river channel formation and the development of a stable morphology, thereby offering critical guidance for the robust design of foundations and protection works downstream of hydraulic structures. It is also necessary to consider the time horizon for conducting such studies, both in models and in situ. In this regard, numerical modeling can be helpful; however, such models must be properly calibrated.
Author Contributions
Conceptualization, M.K.; Methodology, M.K., S.B., J.U. and P.S.; Formal analysis, M.K. and S.B.; Investigation, S.B.; Writing—original draft, M.K.; Writing—review & editing, S.B., J.U. and P.S.; Visualization, M.K.; Supervision, S.B.; Funding acquisition, M.K. and S.B. All authors have read and agreed to the published version of the manuscript.
Funding
This research received no external funding.
Data Availability Statement
The original contributions presented in this study are included in the article. Further inquiries can be directed to the corresponding author.
Conflicts of Interest
The authors declare no conflicts of interest.
References
- Copeland, R.; Soar, P.; Thorne, C. Channel-forming discharge and hydraulic geometry width predictors in meandering sand-bed river. In Impacts of Global Climate Change; American Society of Civil Engineers: Reston, VA, USA, 2005; Volume 1, pp. 1–12. [Google Scholar] [CrossRef]
- Simon, A.; Castro, J.; Rinaldi, M. Channel form and adjustment: Characterization, measurement, interpretation and analysis. In Tools in Fluvial Geomorphology, 1st ed.; Kondolf, M., Piégay, H., Eds.; John Wiley & Sons, Ltd.: New York, NY, USA, 2016; Volume 11, pp. 237–259. [Google Scholar] [CrossRef]
- Kirvel, I.; Kukshinov, M.; Volchek, A.; Kilvel, P. Channel formation in rivers downstream of water reservoirs. Limnol. Rev. 2018, 18, 47–57. [Google Scholar] [CrossRef][Green Version]
- Akstinas, V.; Krisciunas, A.; Šidlauskas, A.; Čalnerytė, D.; Meilutyte-Lukauskiene, D.; Jakimavičius, D.; Fyleris, T.; Nazarenko, S.; Barauskas, R. Determination of river hydromorphological features in low-land rivers from aerial imagery and direct measurements using machine learning algorithms. Water 2022, 14, 4114. [Google Scholar] [CrossRef]
- Feng, C.; Kong, L.; Wang, Y.; Lu, J. Experimental study on scouring by submerged pulsed waterjet vertically impinging on cohesive bed. Ocean Eng. 2024, 298, 117308. [Google Scholar] [CrossRef]
- Jafari, S.; Vaghefi, M.; Mahmoudi, A. Experimental investigation of temporal evaluations of scouring downstream of culvert. Appl. Water Sci. 2024, 14, 128. [Google Scholar] [CrossRef]
- Choudhary, A.; Das, B.S.; Devi, K.; Khuntia, J.R. ANFIS- and GEP-based model for prediction of scour depth around bridge pier in clear-water scouring and live-bed scouring conditions. J. Hydroinformatics 2023, 25, 1004–1028. [Google Scholar] [CrossRef]
- Kumar, V.; Baranwal, A.; Das, B.S. Prediction of local scour depth around bridge piers: Modelling based on machine learning approaches 2023. Eng. Res. Express 2023, 6, 015009. [Google Scholar] [CrossRef]
- Kiraga, M.; Popek, Z. Using a modified Lane’s relation in local bed scouring studies in the laboratory channel. Water 2016, 8, 16. [Google Scholar] [CrossRef]
- Kiraga, M.; Markiewicz, A. Lane’s relation in local scour investigations. IEEE Access 2020, 8, 146967–146975. [Google Scholar] [CrossRef]
- Dust, D.; Wohl, E. Conceptual model for complex river responses using an expanded Lane’s relation. Geomorphology 2012, 139, 109–121. [Google Scholar] [CrossRef]
- Hohensinner, S.; Hauer, C.; Muhar, S. River morphology, channelization, and habitat restoration. In Riverine Ecosystem Management, 1st ed.; Schmutz, S., Sendzimir, J., Eds.; Springer Open: Cham, Switzerland, 2018; Volume 8, pp. 41–65. [Google Scholar] [CrossRef]
- Mugade, U.; Sapkale, J. Influence of aggradation and degradation on river channels: A review. Int. J. Eng. Tech. Res. 2015, 3, 209–212. [Google Scholar]
- Kayitesi, N.; Guzha, A.; Mariethoz, G. Impacts of land use land cover change and climate change on river hydro-morphology—A review of research studies in tropical regions. J. Hydrol. 2022, 615, 128702. [Google Scholar] [CrossRef]
- Bajkowski, S. Sediment segregation on weirs of lowland rivers. Ann. Wars. Univ. Life Sci.-SGGW Land Reclam. 2010, 42, 177–185. [Google Scholar] [CrossRef]
- Guan, D.; Melville, B.; Friedrich, H. Live-bed scour at submerged weirs. J. Hydraul. Eng. 2015, 141, 04014071. [Google Scholar] [CrossRef]
- Barbhuiya, A.; Dey, S. Local scour at abutments: A review. Sadhana 2004, 29, 449–476. [Google Scholar] [CrossRef]
- Wang, L.; Melville, B.; Guan, D.; Whittaker, C. Local scour at downstream sloped submerged weirs. J. Hydraul. Eng. 2018, 144, 04018044-2. [Google Scholar] [CrossRef]
- Haron, N.A.; Yusuf, B.; Sulaiman, M.S.; Razak, M.S.A.; Nurhidayu, S. Morphological assessment of river stability: Review of the most influential parameters. Sustainability 2022, 14, 10025. [Google Scholar] [CrossRef]
- Cheng, T.; Wei, J.; Ni, J.; Wang, J.; Lu, H.; Cheng, K.; Fu, H. The impact of ice on river morphology and hydraulic structures: A Review. Water 2025, 17, 480. [Google Scholar] [CrossRef]
- Smith, K.; Cockburn, J.M.H.; Villard, P.V. Rivers under ice: Evaluating simulated morphodynamics through a riffle-pool sequence. Water 2023, 15, 1604. [Google Scholar] [CrossRef]
- Le, T.; Koyuncu, B. On the impacts of ice cover on flow profiles in a bend. Water Resour. Res. 2022, 58, e2021WR031742. [Google Scholar] [CrossRef]
- Wang, J.; Wang, K.; Fang, B.; Sui, J. A revisit of the local scour around bridge piers under an ice-covered flow condition—An experimental study. J. Hydrodyn. 2021, 33, 928–937. [Google Scholar] [CrossRef]
- Namaee, M.; Sui, J.; Wu, P. Experimental study of local scour around side-by-side bridge piers under ice-covered flow conditions. In Current Practice in Fluvial Geomorphology—Dynamics and Diversity; Ghosh, K.G., Mukhopahyay, S., Eds.; IntechOpen: London, UK. [CrossRef]
- Peng, W.; Hirshfield, F.; Sui, J.; Wang, J.; Chen, P. Impacts of ice cover on local scour around semi-circular bridge abutment. J. Hydrodyn. Ser. B 2015, 26, 10–18. [Google Scholar] [CrossRef]
- PN-EN ISO 14688-1:2006; Badania Geotechniczne. Oznaczanie I Klasyfikowanie Gruntów. Część 1: Oznaczenie I Opis. Polish Standard PN-EN: Warsaw, Poland, 2006. (In Polish)
- Hammerling, M.; Zawadzki, P.; Walczak, N.; Wierzbicki, M. The bed load transport in rivers. Part II: Boundary velocity and the traction intensity. Acta Sci. Polonorum. Form. Circumiectus 2014, 13, 121–131. [Google Scholar] [CrossRef]
- Miedema, S.A. An analytical method to determine scour. In Proceedings of the Western Dredging Association Technical Conference. 28th 2008. (and the 39th Texas A&M Dredging Seminar), St. Louis, MO, USA, 8–11 June 2008. [Google Scholar]
- Breusers, H.N.C. Conformity and time scale in two-dimensional local scour. In Proceeding of the Symposium on Model and Prototype Conformity; Hydraulic Research Laboratoria: Poona, India, 1966; pp. 1–8. [Google Scholar]
- Dietz, J.W. Kolkbildung in Feiner Oder Leichten Sohlmaterialien Bei Strömen dem Abfluß, Mitteilungen des Theodor Rehbock Flußbaulaboratorium; Universitat Fridericiana Karlsruhe: Karlsruhe, Germany, 1969. [Google Scholar]
- Zanke, U. Zussamenhänge Zwischen Strömung und Sedimenttransport. Teil 2. Berechnung des Sedimenttransportes Hinter Befestigten Sohlenstreckn. Sonderfall Zweidimensionaler Kolk; Mittelungen des Franzius-Instituts de TU Hannover: Hannover, Germany, 1978. [Google Scholar]
- Hoffmans, G.; Pilarczyk, K. Local scour downstream of hydraulic structures. J. Hydraul. Eng. 1995, 121, 326–340. [Google Scholar] [CrossRef]
- Khalili, S.H.; Farhoudi, J. Local scour profiles downstream of adverse stilling basins. Sci. Iran. 2014, 22, 1–14. [Google Scholar]
- Aminpour, Y.; Farhoudi, J.; Khalili, S.H.; Roshan, R. Characteristics and time scale of local scour downstream stepped spillways. Iranica 2018, 25, 532–542. [Google Scholar] [CrossRef]
- Farhoudi, J.; Shayan, H.K. Investigation on local scour downstream of adverse stilling basins. Ain Shams Eng. J. 2014, 5, 361–375. [Google Scholar] [CrossRef]
- Farhoudi, J.; Smith, K.V.H. Local scour profiles downstream hydraulic jump. J. Hydraul. Res. 1985, 23, 342–358. [Google Scholar] [CrossRef]
- Dąbkowski, S.; Siwicki, P.; Urbański, J. Influence of scale models of the dam on local scour. Acta Sci. Pol. Archit. 2004, 3, 55–66. [Google Scholar]
Disclaimer/Publisher’s Note: The statements, opinions and data contained in all publications are solely those of the individual author(s) and contributor(s) and not of MDPI and/or the editor(s). MDPI and/or the editor(s) disclaim responsibility for any injury to people or property resulting from any ideas, methods, instructions or products referred to in the content. |
© 2025 by the authors. Licensee MDPI, Basel, Switzerland. This article is an open access article distributed under the terms and conditions of the Creative Commons Attribution (CC BY) license (https://creativecommons.org/licenses/by/4.0/).