Abstract
The Yangtze River Basin, the largest river basin in China, faces complex challenges in population, economy and water issues. This study builds a Systemic Deduction Model of the Development of Yangtze River Basin (SDMY), which is based on system dynamics coupled with the water environmental model. It generalizes the Yangtze River Basin into five subsystems at the province level as well as two subsystems at the river basin level, quantifying the interaction and feedback relationships within and among each subsystem through functions. SDMY has passed the feasibility verification and the sensitivity analysis. The application results from 2000 to 2100 of SDMY show the positive development trend of gross domestic product (GDP), grain production, energy consumption, and forest coverage, as well as the significant risk of population decline. The water pollutants chemical oxygen demand (COD) and total phosphorus (TP), the water security level, and the river longitudinal connectivity of the Yangtze River Basin show reasonable and meaningful development trends, as the results indicate. This paper proves that SDMY could be a quantitative simulation tool for analyzing the long-term mutual feedback and evolution of the human–water relationship and society–economy–environment system in a large river basin.
1. Introduction
The global issues and challenges for human are becoming increasingly complex. The production and distribution of clean water, affordable clean energy, and sufficient and affordable food are intertwined with issues such as biodiversity and climate change, affecting human well-being and the long-term development and evolution of nature at different regional scales [1,2,3,4,5,6]. Among them, the river basin, as the area of land drained by the river and its tributaries, is not only the natural unit that embodies the characteristics of water environment, water ecology, and water resources, but also carries the production and living activities of different human gathering areas such as towns, villages, and industrial and mining areas. The river basin is, becoming the important geographical unit that connects nature, economy, and society with water as the link [7,8,9]. As a result, to understand the complex relationship between socioeconomic activities and nature, especially the water system, and to solve the sustainable development problems of human society under internal and external pressures, it is important to study the long-term development process of the unit of the river basins.
Understanding and identifying the dynamic mechanism between socioeconomic activities and nature requires interdisciplinary cooperation. System dynamics is a commonly used quantitative modeling method. The World3 model released by the Club of Rome in 1972 [10] was the first attempt to use system dynamics to describe the global development process on a hundred year scale. The model depicted and discussed the “limits” of human development in nonrenewable resources, pollution, food, and other aspects, and the book “The Limits to Growth” [10,11] has had a profound impact. Subsequently, many research teams worldwide have built models based on system dynamics to study global or national level socioeconomic development changes. For example, a team from Canada has developed the ANEMI model, which is a comprehensive global change assessment model that emphasizes the role of water resources [12]. It reproduces the main characteristics of eight sectors in the society–biosphere–climate system: climate, carbon cycle, land use, population, surface water flow, water use, water quality, and the economy. The subsequent research have optimized and expanded ANEMI, i.e., the ANEMI_2 model can reflect climate change and energy-economy additionally [13], the ANEMI3 model added the water supply and farmland sectors [14] and this method is applied in the Yangtze River Basin through the downscaling method ANEMI-Yangtze [15]. For another example, the Threshold 21 model is a national-scale model that includes four sectors: economy, society, environment, and resources. Some researchers developed the Threshold 21 China 2050 model based on the actual situation in China and conducted policy scenario analysis [16], while others have extended the Threshold 21 model as an iSDG model to assess the contributions of synergies of national sustainable development [17]. At the same time, the research of the Club of Rome has been ongoing. Based on the World3 model, the Earth4All model was released in 2022, which innovates in multiple aspects such as inequality, ecology, public modules, finance, labor, population simulation methods, social welfare, and social tension [18].
When applying system dynamics to the simulation of the composite environment–society–economy systems, most studies take administrative regions as boundaries, such as countries, provinces, or cities [15,16,19]. These studies consider relatively comprehensive subsystems, such as the composite “water resources–environment–economy” (WEE) system [20] and the “society–human–ecology” coupling coordination system [21], etc. The research on the river basins generally focused on small- or medium-sized river basins [20] while a few looked at large river basins. The research mostly focuses on the water system itself, such as the hydrological processes, the carrying capacity or the allocation of water resources [22,23], the hydropower generation capacity [24] and the water environment carrying capacity [25], etc. This research mostly focuses on the single system such as hydrology, water resources and water environment, while only a few studies could comprehensively simulate different systems such as water resources, water security, water environment, and water ecology in the river basin. Furthermore, there are relatively few studies that regard the river basin as a whole of nature, population, and economy and study its sustainable development process.
When studying the composite environmental–social–economic systems, system dynamics could be used as an independent modeling and result evaluation method, or as a part of the coupled models or methods. The coupling application of system dynamics and non-mechanism models or methods is relatively abundant. It is relatively common that system dynamics are coupled with various evaluation methods. For instance, system dynamics are coupled with the energy evaluation method to assess the level of circular economy in cities [26], industrial parks [27], etc. System dynamics coupled with the Multi-Criteria Decision-Making (MCDM) method is used to evaluate sustainability in a built environment [28]. System dynamics could be used as an economic model, which couples with various footprint methods [29], life cycle valuation (LCA), material flow analysis, and other environmental assessment methods [30] to build various Economic–Environment Integrated Models (EEIMs). System dynamics could also be combined with econometric models such as spatial Logit models [31], or bottom-up cellular automata models [32], to improve the simulation accuracy of the spatial pattern of urban land change. Establishing a dynamic feedback relationship between socioeconomic systems and biophysical processes is crucial for understanding the laws of system development and identifying the impact of decision-making [33]. However, the research on the coupling models of system dynamics and mechanism models concerning environmental issues is relatively scarce [34], and most of the research merely focuses on water resources. For example, a team has developed the software Tinamït [35], which couples system dynamics with the soil salinity model, the hydrological SWAT model, and other mechanism models. Tinamït simplifies the model coupling process and facilitates better decision making in water resource management. There are also studies that couple hydrological models with economic input–output models within the framework of system dynamics [36], analyzing the impact of spatial distribution of economic activities on hydrological models and identifying water scarcity.
Overall, the aforementioned application of system dynamics to study the composite development of society, economy, and environment exhibits the following characteristics. From the perspective of simulation elements, although a large number of studies simulate the “society–economy–environment” complex system, the environmental system generally only involves the modules directly linked to the social and economic systems. Generally, the environmental elements could be directly represented by the equations related to certain social and economic elements, without simulating their own physical processes. For water systems as an example, a typical simulation concerns the supply and consumption of water resources, the feedback of which could be established with population, production activities, etc., without simulating its hydrological or hydrodynamic characteristics. For the simulation of water environment, the output is generally the pollutant emission rather than the water quality, as the water quality could not be explained merely by the social and economic activities. Therefore, in terms of modeling methods, existing system dynamics models rarely couple with mechanistic models, especially water environment models. Furthermore, due to the absence of physical processes simulation, existing system dynamics models generally use administrative districts as research units, and generally do not simulate spatial relationships among the units. Therefore, in studies relating to water environment, it is not common to use river basins, which have the upstream and downstream spatial relationships, as the study units, or simulate physical processes such as hydrology and hydrodynamics.
Currently, there is still a lack of understanding regarding the relationship between human activities and natural geography, especially their relationship with water systems, as well as the long-term evolution process in large river basins. Therefore, this study aims to develop a new model that can simulate both the primary elements of social and economic activities and the characteristics of water systems centered on surface water environmental quality. Consequently, this research explores the coupling method between system dynamics and water environment mechanism models. In terms of spatial unit selection, “administrative regions” serve as the statistical units for social and economic activities and form the foundation of the social and economic systems in the model. Meanwhile, this study also introduces “river basin” as units, serving as the foundation for a water environment system. The goal is to establish a coupled system dynamics model based on both river basin and administrative region units.
The Yangtze River is the largest river in China, with a drainage area of 1.8 million km2. The Yangtze River Basin accounts for 18.8% of the land area, 33% of the population, and 35.4% of the gross domestic product (GDP) in China. It is one of the river basins with the most energetic population and economic growth in China. The intensive and disorderly industrial and agricultural production and engineering construction in the past have worsened the environment and ecology of the Yangtze River. With the high attention paid by China to ecological and environmental protection in the past decade, the strategy of “to step up conservation of the Yangtze River and stop its over development” has been proposed and implemented, leading to a significant improvement in the environment and ecology in the Yangtze River Basin. However, in such a vast river basin, the interaction between human socioeconomic activities and natural factors, especially the water environment, ecology and security is still not fully understood. To enhance our understanding of the complex interactions between human and water systems, simulate the long-term development trend under different polices, and provide insights for science-based policy-making for the sustainable development of the Yangtze River Basin, we developed the Systemic Deduction Model of the Development of the Yangtze River Basin, referred to as SDMY. This article focuses on the model construction method of SDMY. It introduces how to build upon feedback among the different social, economic, and natural subsystems in both the administrative area level and the river basin level, and it gives an application example of the years 2000 to 2100 which verifies SDMY and shows meaningful development results. More application about policy scenarios and sustainability assessment by using SDMY will be discussed in future articles.
2. Research Area
2.1. The Overview of the Yangtze River Basin and Its Administrative Regions
The Yangtze River flows eastward from the sparsely populated Qinghai-Tibet Plateau in Western China, eventually emptying into the sea at the densely populated and economically vibrant Yangtze River Delta. The main stream and tributaries of the Yangtze River flow through 19 provincial-level administrative regions, including 9 provinces and 2 municipalities that encompass the majority of the basin’s area and population, namely Sichuan, Yunnan, Chongqing, Guizhou, Hubei, Hunan, Jiangxi, Anhui, Jiangsu, Zhejiang, and Shanghai. These 11 provinces and municipalities (hereafter referred to as provinces) collectively form the Yangtze River Economic Belt, which stands as one of China’s most crucial strategic regions for development. The geographical relationship between the Yangtze River Basin and the Yangtze River Economic Belt is illustrated in Figure 1.
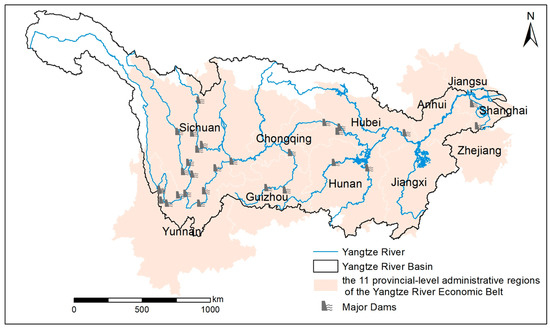
Figure 1.
Illustration of the Yangtze River, the Yangtze River Basin, the Yangtze River Economic Belt, and the major dams on the Yangtze River system.
2.2. Main Problems and Challenges in the Yangtze River Basin
The first challenge is water environment. After years of effort, the water environment quality in the Yangtze River Basin has significantly improved. By 2023, the proportion of Class I-III water quality sections in the Yangtze River Basin has reached 98.5%. However, due to the application of fertilizers and pesticides, and the development inertia of the phosphorus chemical industry, phosphorus pollution is still severe in some areas [37,38]. There also remains the problem of unbalanced and uncoordinated improvement in the water environment quality, with inconsistent pollution discharge stages in different regions. The nitrogen and phosphorus emissions in upstream areas (especially in Yunnan and Guizhou provinces) have not crossed or are near the inflection point, and the emissions may continue to increase for a certain period of time with the economy development [39].
The second challenge is water ecology and water security. There are over 50,000 reservoirs in the Yangtze River Basin which could hinder the natural connectivity of rivers and result in an insufficient ecological flow for some rivers. Fish habitats have shrunk and fragmented due to lake reclamation and dam construction. In the Yangtze River Basin, 337,000 km2 of soil erosion needs controlling, especially in the upstream areas where soil erosion is more severe. The Yangtze River Basin used to be an area with frequent flood and drought disasters. Since the 21st century, with the construction, operation, and the joint scheduling of the giant cascade reservoirs (such as Wudongde, Baihetan, Xiluodu, Xiangjiaba, and Three Gorges, see Figure 1) on the main stream of the Yangtze River, the flood control pressure and disaster losses have been effectively reduced. But with global climate change, the Yangtze River Basin may face more frequent extreme weather events, posing risks to a large population and economy.
Another important challenge is population and economy. The Yangtze River Basin has an aging society. Based on the population census results from 1990 to 2020, the size of the elderly population in the Yangtze River Basin has increased by more than three times, and the trend of population aging has spread from downstream areas to middle and upper reaches. As for green economic development, the Yangtze River Basin has a relative advantage in terms of economic development efficiency, as the GDP per capita of the Yangtze River Basin is 8.7% higher and the carbon dioxide emission intensity is 20.8% lower than that of the national average. Under China’s carbon peaking goal in 2030 and carbon neutrality goal in 2060, the Yangtze River Basin has become a leading area for green and low-carbon development in China. The low-carbon development of the Yangtze River Basin relies on strengthening the development of clean energy and promoting low-carbon upgrading of industries and consumption.
3. Methods
3.1. Overview of Methods
Based on the problem identification and risk prediction of the Yangtze River Basin above, this study constructs SDMY, which focuses on the holistic and systematic nature of the Yangtze River Basin. The Yangtze River Basin comprises all the provinces along the Yangtze River and its tributaries. The rivers and lakes in the Yangtze River Basin provide inhabitants of the provinces with water for living, production, and ecological use. They transmit and absorb water pollutants, and provide carriers for the formation and evolution of the ecosystem. To better reflect the relationship between the river basins as a whole and their various parts, namely the 11 provinces, and to demonstrate the system characteristic that the whole is greater than the sum of parts, SDMY links the population development, economic development, water conservancy projects, water environment, and water ecology of each province through the Yangtze River and its tributaries (Figure 2). SDMY aims to simulate the interactive relationship between the administrative regions and the river basin. It not only simulates basic socioeconomic activities based on the administrative unit of provinces, but also simulates the environmental, ecological, and security functions of water systems in the river basin as a unified whole.
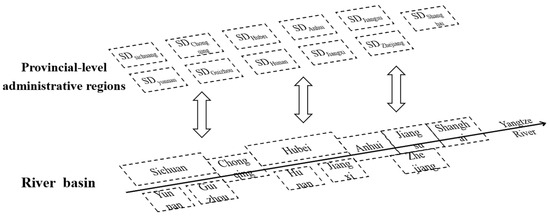
Figure 2.
Spatial relationship between the Yangtze River Basin and its administrative regions, with the Yangtze River as the link.
This study pays attention to the prediction of the long-term evolution of the river basin. The development of the Yangtze River Basin faces both practical problems and long-term risks and challenges. Most of the existing research on the regional sustainable development focuses on evaluating the past and present development processes based on mainly historical data, without coupling up long-term simulation tools and methods, and therefore is lacking in future predictions. This model stands on a hundred-year time scale and uses the system dynamics to deduce the long-term evolution process of the river basin, to identify the trend of the development, and help adapt to future challenges.
3.2. Systematic Generalization of the Yangtze River Basin and the Structure of the Model
The sustainable development of the Yangtze River Basin is a complex, multi feedback nonlinear system problem that involves many factors such as population, economy, resources, and environment. The relationships between these factors exhibit significant spatial differences across the upper, middle, and lower reaches of the Yangtze River. Therefore, this study constructs subsystems for population, economy, pollutant, resources (including grain, forest, and energy), and disaster, with the province serving as the basic unit. At the same time, the water environment and the water security–ecology subsystems are constructed at the river basin level to depict the spatial connections between each province. The relationships between each subsystem are shown in Figure 3. Among them, population and economy are the core of the subsystem. They are closely connected and provide input conditions for other subsystems, while also relying on the material basis and guarantees provided by resources and environment, namely resources and pollutant subsystems. In this way, the model establishes a relationship of mutual interaction and constraint among various subsystems.
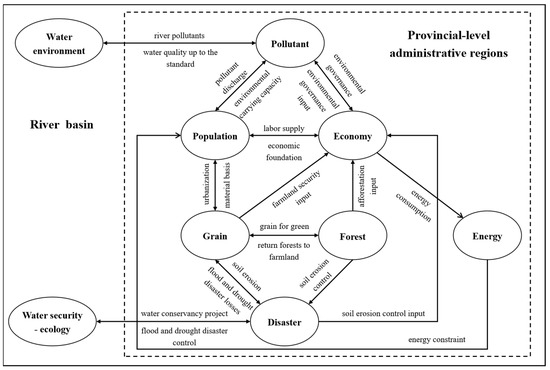
Figure 3.
Schematic diagram of the structure of the SDMY.
Due to the fact that the model contains 9 subsystems with complex influencing factors and relationships, it is difficult to consider them comprehensively. Therefore, based on the main research objectives, the model primarily adopts the following assumptions: (1) This study assumes that the model has a closed boundary, only considering the interaction among the internal elements of the system, and temporarily excluding the dynamic interaction of the external environment, such as climate change and other factors. (2) This study selects grain, forest, and energy as three typical resources and analyzes their interaction relationships with other subsystems. (3) The model parameters remain invariant throughout the study period, similarly, the functional relationships among the variables are assumed to be fixed.
3.2.1. The Causal Loop Based on Provinces: Population–Economy–Resource Subsystem
The causal loop diagram of the main variables and their relationships in the population–economy–resource subsystem is shown in Figure 4. The main causal loop includes (1) Population growth fuels economic development by providing a sufficient labor force, while economic advancement accelerates urbanization, impacting birth rates and, subsequently, restraining population growth; at the same time, it also increases life expectancy to reduce mortality rates, thereby promoting population growth which forms a positive and negative loop between population and economy subsystem. (2) The decrease in per capita grain yield promotes an increase in farmland area through policy variables, forming a negative loop within the grain subsystem. At the same time, the increase in grain yield per capita increases life expectancy and reduces population mortality, while population growth causes a decrease in farmland area, thereby inhibiting the increase in grain yield per capita and forming a negative loop between population and grain subsystem. (3) When the forest coverage rate is lower than the expected target, afforestation input is increased to accelerate the growth of the forest area, conversely, when the forest coverage rate reaches or even exceeds the expected target, afforestation input is appropriately reduced, this forms a negative loop within the forest subsystem. (4) Population growth and economic development promotes household and production energy consumption to increase the total energy consumption, while the increase in energy consumption per capita leads to a decrease in life expectancy and an increase in mortality rates, which inhibiting population growth, forms a negative loop among population, economy, and energy subsystem.
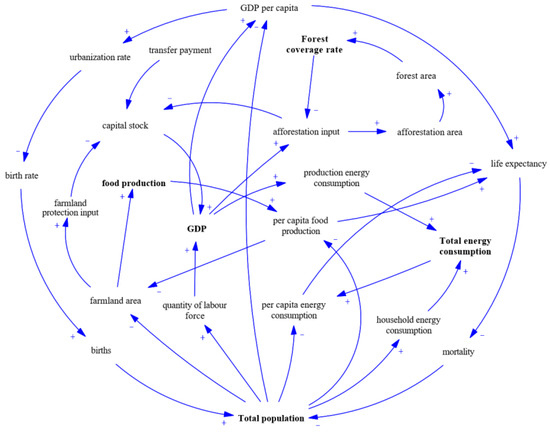
Figure 4.
Population–economy–resource subsystem causal loop diagram. Note: “+” indicates positive effect, and “-” indicates negative effect.
3.2.2. The Causal Loop Coupling Provinces and the River Basin: Population–Economy–Pollutant Subsystem
The pollutant subsystem selects chemical oxygen demand (COD) and total phosphorus (TP) as typical environmental pollutants, and describes pollution emissions and environmental governance from both provincial and river basin levels. The causal loop diagram of the main variables and their relationships in the population–economy–pollutant subsystem is shown in Figure 5. The main causal loop includes (1) Population and economy development which cause enormous pressure on the environment due to sewage and pollutant emissions, while environmental pollution also threatens population survival and affects economic development, forming a negative loop among the population, economy, and pollutant subsystem. (2) When the water quality of the cross-section is significantly below the standard, pollutant control must be urgently strengthened to reduce pollutant emissions, thereby improving the compliance rate of water quality at the cross-section and forming a negative loop between the provincial pollutant subsystem and the water environment subsystem in the river basin level.
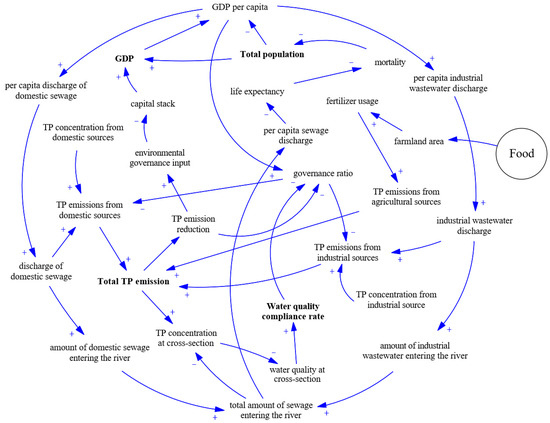
Figure 5.
Population–economy–pollutant subsystem causal loop diagram (taking TP as an example, COD is similar). Note: “+” indicates positive effect, and “-” indicates negative effect.
3.2.3. The Causal Loop Coupling Provinces and the River Basin: Water Security–Ecology Loop
The causal circuit diagram of the main variables and their relationships in the water ecology–security loop is shown in Figure 6. The main causal loop includes (1) When water security is improved, reducing the area of farmland affected by floods and droughts can increase grain yield, thereby accelerating the process of returning farmland to forests and grasslands to reduce soil erosion, fully utilizing the comprehensive regulation and storage function of water conservancy projects to further improve water security, and forming a positive loop within the grain, disaster, and water security–ecology subsystem. (2) Controlling soil erosion through measures such as afforestation could improve water security. However, excessive input in soil and water conservation and safety affects economic development thus, affecting afforestation input conversely. It forms a negative loop within the economy, forest, disaster, and water security–ecology subsystems.
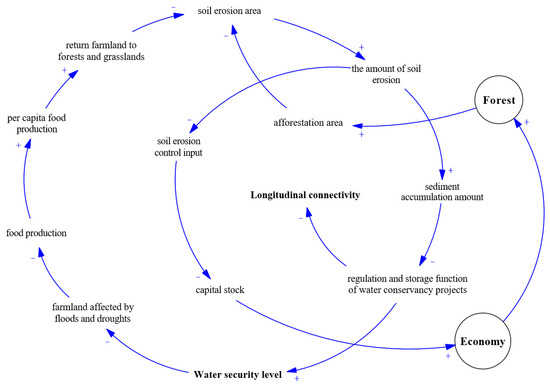
Figure 6.
Water security–ecology subsystem causal loop diagram. Note: “+” indicates positive effect, and “-” indicates negative effect.
The meaning of “water security” is relatively broad. SDMY mainly considers water security from the perspective of soil erosion and its prevention and impact on the river basin. Due to the lack of mature and universal indicators, based on the Driving force-State-Response (DSR) conceptual model and combined with the system components of the model, we selected three types of dimensional variables, namely soil erosion, flood control, and disaster relief projects, and flood and drought disasters to propose the “water security level” indicator. This indicator focuses on soil erosion and reflects the interaction within flood–drought disasters, reservoir construction, ecological construction (afforestation, soil erosion control, etc.), flood control projects (embankment construction), and non-engineering measures in the upper, middle, and lower reaches of the Yangtze River Basin. Soil erosion causes sediment in the water system, reducing the water security level of the river basin. The ecological construction, as a major influencing factor, indirectly affects the water security level by affecting the amount of soil erosion in various regions.
There are many indicators currently available that characterize water ecology. In order to better reflect the impact of river water conservancy projects on water ecology, we selected the “longitudinal connectivity” indicator and adopted the barrier coefficient method and calculated the longitudinal connectivity of the basin based on the situation of river-blocking structures [40,41]. A total of 20 rivers from all the main rivers in the secondary water resources area of the Yangtze River Basin were involved, including 4 main streams and 16 primary tributaries.
3.3. Model Structure
On the basis of the analysis on the subsystem causal loops above, SDMY was constructed, and its system stock and flow diagram is shown in Figure 7.
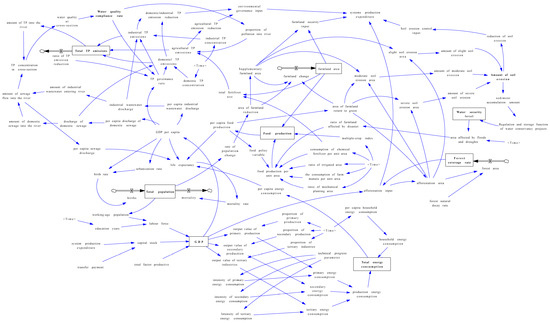
Figure 7.
System stock and flow diagram of SDMY. Note: the blue arrows indicate the influence between variables, and the black arrows indicate the inflows and outflows of the stock variables.
3.3.1. Population Subsystem
The population subsystem primarily focuses on studying the changes in total permanent population, age structure, and population quality of each provincial unit under certain economic, resource, and environmental conditions. The total population is taken as the level variable, the number of births and deaths is taken as the rate variable, and the fertility rate and life expectancy are taken as auxiliary variables and parameters. The discrete population development equation model [42] is used to predict the future changes in population of different ages, wherein the parameters for total fertility rate and life expectancy are predicted using regression analysis formulas. Please see the detailed regression formulas in Appendix A.
The main equations of the population subsystem include
in which is population status vector corresponding to the year t, consisting of the population of each age (0–100 years old); is population fertility matrix, where is age-specific birth rate, is total fertility rate, is proportion of women, and is fertility rate of women of childbearing age (15–49 years old); is population state transition matrix, where is age-specific mortality rate, which can be derived from .
3.3.2. Economy Subsystem
The economy subsystem primarily focuses on studying the changes in the economic gross output (real GDP, referred to as GDP) of each province, considering both intra-provincial production expenditures and inter-provincial transfer payments. GDP is taken as the level variable, and human capital and capital stock are taken as the auxiliary variables and parameters. The Cobb–Douglas production function with added human capital variables [43] is used to calculate GDP, where the number of the labor force is calculated based on the population of working age (15–60 years old). In the calculation of capital stock, it is assumed that consumption expenditures outside the system boundary remains constant, mainly considering the consumption expenditure within the province and the transfer payments among provinces. Please see the detailed regression formulas in Appendix A.
The main equations of the economy subsystem include
in which is GDP, is total factor productivity, are elasticity coefficients of capital and labor, respectively (assuming constant returns to scale, i.e., 1), is capital stock, is depreciation rate (generally taken as 0.9), is investment rate, is labor input, is population aged 15–60 (namely the number of the labor force), is human capital, expressed as a function of average years of education .
3.3.3. Resources Subsystem (Grain, Forest, and Energy)
The grain subsystem primarily focuses on studying the changes in grain yield and farmland area of each province. Assuming that the ratio of planting area to farmland area remains constant, the grain yield is mainly affected by farmland area, grain yield per unit area, and multiple-crop index. The farmland area is showing a decreasing trend due to the impact of population growth and urbanization development, and is also affected by policies such as farmland balance and returning farmland to forests or grasslands. Please see the detailed regression formulas in Appendix A.
The main variable equations of the grain subsystem include
where is grain yield, is grain yield per unit area, is multiple-crop index, is farmland area, represents farmland area reduced due to population growth, represents the supplemented farmland area, represents the area of farmland returned to forests and grasslands.
The forest subsystem primarily focuses on studying the changes in forest area of each province. The increase in forest area mainly relies on afforestation and returning farmland to forests, and afforestation input is influenced by the expected target of forest coverage (the proportion of forest area to total area of the province).
The main variable equations of the forest subsystem include
where is the forest area, is the natural rate of change of forest area, is afforestation input, is afforestation cost per unit area, is area of farmland returned to forests or grasslands, is GDP, is forest coverage rate, is expected target of forest coverage, and the others are constant coefficients.
The energy subsystem primarily focuses on studying the energy consumption and its structure changes in each province. The total energy consumption includes both the energy consumption from the production sector calculated based on the output of the three major industries, and the energy consumption from the household sector calculated based on the total population.
The main variable equations of the energy subsystem include
where is the total energy consumption, is the output of the three major industries, is energy consumption intensity corresponding to the three major industries, is total population, and EULA is the household energy consumption per capita.
3.3.4. Pollutant Subsystem
The pollutant subsystem primarily focuses on the emission and treatment of water pollutants in each province. The subsystem divides the pollutant sources into three categories: domestic source, industrial source, and agricultural source. Firstly, the regression analysis method is used to establish an equation that relates GDP per capita to the prediction of wastewater discharge per capita of domestic and industrial sources. Then, based on the pollutant emission concentrations of domestic and industrial sources, the pollutant emissions of both sources can be obtained. The pollutant emissions from agricultural sources are mainly calculated based on the consumption of chemical fertilizer on farmland. The treatment rate is a parameter that characterizes the effectiveness of the pollutant treatment and is influenced by various parameters such as GDP per capita, pollutant emission reduction rate, and water quality compliance rate. Please see the detailed regression formulas in Appendix A.
The main variable equations of the pollutant subsystem include
where is sewage discharge, represents pollutant emission, represent pollutant emissions of domestic, industrial, and agricultural sources, respectively, represents treatment rate, represents discharge concentration of domestic (or industrial) pollutants after treatment, represents discharge concentration of domestic (or industrial) pollutants, is the consumption of chemical fertilizer per unit area, is the farmland area, represents the supplemented farmland area, represents the inflow coefficient of the agricultural source pollutant, and the others are constant coefficients.
3.3.5. Disaster Subsystem
The disaster subsystem mainly studies the changes in soil erosion and the areas affected by flood and drought in each province. Soil erosion is divided into mild, moderate, and severe categories, and the change of the soil erosion area is mainly influenced by the change of farmland area, afforestation, etc. Considering the randomness of flood and drought disasters, the areas affected by floods and droughts are predicted by a logistic simulation equation with random variables based on the average area affected by floods and droughts in the past decade.
The main variable equations of the disaster subsystem include
where, is the amount of soil erosion, are the area of mild, moderate, and severe soil erosion, LAFD, LADD represent the area affected by floods or droughts, represent the average area affected by floods or droughts in the past decade, is farmland area, is the ratio of farmland affected by disaster, represents water security level, and the others are constant coefficients.
3.3.6. Water Environment Subsystem
The input-response relationship between the pollutants of the provinces and the water quality of the river basin is established in the water environment subsystem, simulating the spatiotemporal changes in water quality at cross-sections in the river basin. A spatial topology relationship of “river basin-water quality control unit-province” based on the spatial data and pollutant emission of control units is established. First, assuming that the proportion of pollutant emissions remains constant across control units within each province for each year, the pollutant emission of each control unit in the simulating years is proportionally estimated based on the total emission of all the 11 provinces. Then, based on the spatial relationship among control units, a one-dimensional degradation water quality model is used to describe the migration process of pollutants along the river flows within the river basin, and the water quality and its compliance status of each control unit are calculated sequentially.
The main variable equations of the water environment subsystem include
where represents the pollutant concentration in the control unit, represent the pollutant emissions entering the river from the control unit itself and its upstream unit, respectively, represents the sewage discharge within the control unit, represents the incoming water flow from the upstream control unit, is transport distance, is river flow velocity, is the pollutant degradation coefficient.
3.3.7. Water Security–Ecology Subsystem
In order to characterize the water security and water ecology status in the river basin, the indicator “water security level” and “longitudinal connectivity” are constructed, respectively, reflecting the evolution of water security and water ecology pattern in the river basin based on the amount of soil erosion and the area affected by floods and droughts in the disaster subsystem. Similar to the water environment subsystem, the river basin is divided into several storage units based on the reservoir catchment areas and their spatial relationship, and a spatial topology relationship of “river basin-storage unit-province” is established. Based on the proportion of each storage unit area to the area of the corresponding province, the total amount of soil erosion in each province is proportionally allocated to each storage unit, then the storage capacity of each storage unit can be calculated. After that, the water security level of the river basin is obtained by using the affected area by floods and droughts, and the parameters of water security level and longitudinal connectivity of the disaster subsystem are updated accordingly.
The main variable equations of the water security–ecology subsystem include
where is the water security level, is the parameter representing the storage capacity of reservoirs, is the flood control standard for dikes (i.e., 1% is for 100-year flood), and are the proportion of the area affected by floods and droughts; is the effective storage capacity of each reservoir in the storage unit, represents the corresponding annual runoff of each reservoir, represents the catchment area corresponding to each reservoir, represents the total river basin, is the amount of soil erosion, is the sediment yield coefficient, is river longitudinal connectivity index, is length of the river, and is blocking coefficient, where the blocking coefficient for an ordinary reservoir is 1, for a reservoir with a navigation lock it is 0.75, and for a reservoir with fish passage facilities it is 0.5; and the others are constant coefficients.
3.4. Data Sources
The data used in this study mainly originates from various statistical yearbooks, census data, and specialized datasets, ensuring accuracy and reliability. Specifically, population, economy, and energy data mainly originates from the statistical yearbooks of all the 11 provinces along the Yangtze River. The economic data are converted using 2000 as the basic year. The grain and forest data are, respectively, sourced from the China Rural Statistical Yearbook and the National Forest Resources Census, both of which constitute inter-provincial panel data. For environmental data, the pollution declaration data from each province are used. The water security data are mainly sourced from the first national water resources census and other related datasets. The sources of these data are listed in Table 1. The data of 2000 are used as the model input, while the data from other years are mainly utilized to determine model parameters and variable equations through mathematical calculations, regression analysis, fitting methods, empirical formula methods, etc.

Table 1.
Main data used in SDMY.
The simulating time of this research spans from 2000 to 2100, with the time step of 1 year. The period from 2000 to 2018 serves as the testing period, and the effectiveness of the model is verified by comparing simulated data with actual data. The period from 2018 to 2100 constitutes the prediction period, and the development trend of the Yangtze River Basin is predicted.
4. Results and Discussion
4.1. Model Validation and Sensitivity Analysis
After the model construction, it is necessary to test the rationality and applicability of the model, which include historical testing and sensitivity testing. Considering the availability of historical data, this article tested four level variables with relatively complete data, namely the total population, actual GDP, energy consumption, and COD emission of all the 11 provinces, and the results are shown in Figure 8. The results indicated that the mean absolute error (MAE) between the simulated values and historical values of the total population and actual GDP was within 5%, and the mean absolute error (MAE) of energy consumption and COD emissions is within 20% and 40%, respectively. This indicates that SDMY has a high degree of fit and can accurately describe the basic status of the system, verifying the effectiveness of the model.
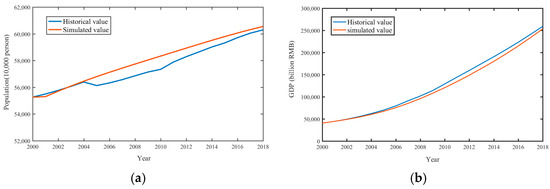
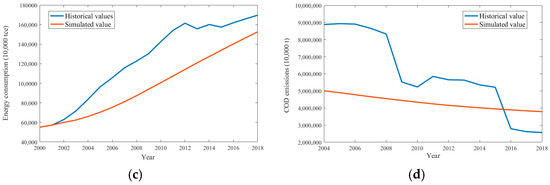
Figure 8.
Historical test results of SDMY: (a) the test results of population; (b) the test results of GDP; (c) the test results of energy; (d) the test results of pollutants.
In order to test the sensitivity of population and economy subsystems, this study selected gender ratio, initial life expectancy, capital depreciation rate, and growth of education years as sensitive parameters, and examined the changes in total population and GDP when these parameters varied within a range of ±20%. The test results are shown below (Figure 9). The results showed that the sensitivity parameters varied within a reasonable range (±20%), and there were no significant fluctuations in the total population and GDP, indicating that SDMY’s sensitivity to parameter changes was not high and the model had relatively good stability.
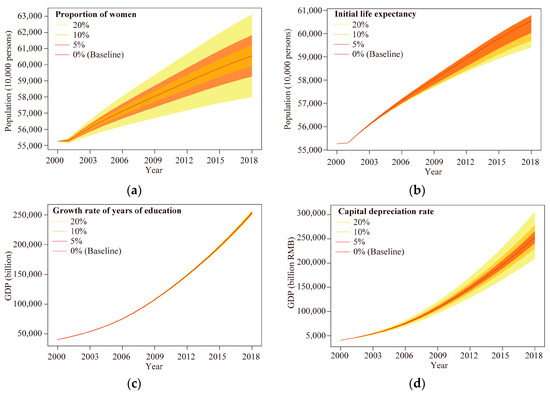
Figure 9.
Sensitivity test results of SDMY: (a) the results of total population when the proportion of women changes; (b) the results of total population when the initial life expectancy changes; (c) the results of GDP when the growth rate of years of educations changes; (d) the results of GDP when the capital depreciation rate changes.
4.2. Simulated Results and Discussion of the Provinces
Model results for provincial-level administrative divisions are shown in Figure 10 and Figure 11. Figure 10 presents the simulation results of five indicators—population, GDP, grain yield, energy consumption, and forest coverage—for the 11 provinces and municipalities in the Yangtze River Basin from 2000 to 2100. Figure 11 shows the aggregated totals of these 11 provinces and municipalities, with all indicators normalized.
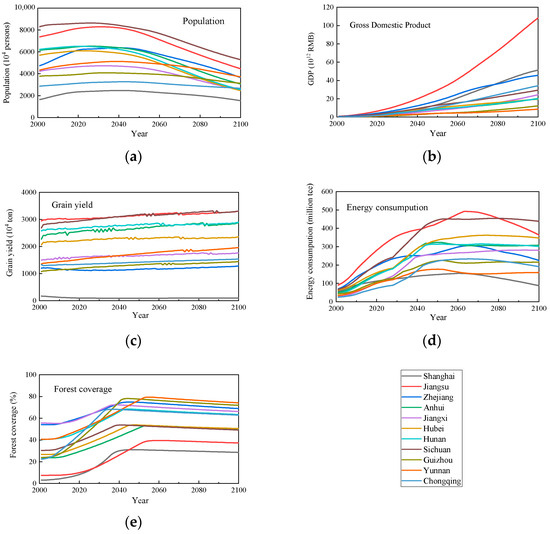
Figure 10.
Major simulated results for each of the 11 provinces: (a) population results; (b) GDP results; (c) grain yield results; (d) energy consumption results; (e) forest coverage results.
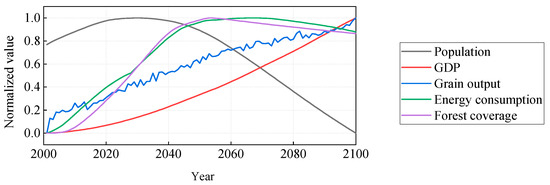
Figure 11.
The dimensionless simulated results of the total amount of the 11 provinces.
In terms of population, the total population of each province reaches its peak between 2020 and 2030 and remains stable until around 2050, after that it decreases significantly (Figure 10a). The total population of 11 provinces in 2100 declines by about 38% compared to 2000 (Figure 11). The simulation results of this model for the population development trend in the Yangtze River Economic Belt are similar to those in other studies [15,45], indicating that the population will reach its peak between 2020 and 2030 and then decline. The main reason is that the model assumes that the birth rate gradually decreases with economic growth while life expectancy gradually increases, and that the proportion of elderly population will gradually increase over time. Therefore, without effective population fertility incentives, the total population will decline. For actual data, China’s population has decreased for three years since 2022. Since 2022, the population in the Yangtze River Economic Belt has almost stopped growing [46], although it is one of the most economically vibrant regions in China and is attractive to the population. Therefore, the simulation results of the model are consistent with reality. However, since this model treats the Yangtze River Basin as a closed system and does not consider population migration from other regions of China into the basin, the population prediction results may be underestimated. Comparing all the provinces, from 2000 to 2020, Jiangsu, Zhejiang, and Shanghai have exceptional population attraction capabilities leading to a substantial and rapid increase in population that persists until around 2030. After 2060, the population decline rate in Yunnan, Guizhou, Chongqing, and Shanghai is slightly slower compared to other provinces. The reason for this could be deduced because Yunnan and Guizhou have relatively high fertility rates, while Chongqing and Shanghai, as municipalities directly under the central government, could maintain a relatively stable population by attracting populations from other provinces (Figure 10a).
In terms of economy, over a century, the GDP of all provinces and the Yangtze River Economic Belt have been consistently increasing and have generally shown exponential growth. (Figure 10b and Figure 11). The relative positions of the economic output of various provinces have remained largely unchanged, with downstream provinces, i.e., Jiangsu, Zhejiang, and Shanghai, continuing to lead the way. Jiangsu maintains its position as the top economic province, while upstream regions such as Yunnan and Guizhou have relatively lower economic output, and the gap between these upstream regions and the downstream provinces continues to widen over time. Compared with the predicted results in the other literature, the exponential growth trend of GDP in the Yangtze River Basin is consistent with some studies, but the predicted GDP growth rate is higher [15,45,47]. The main reason may be that SDMY uses the production function to simulate and extrapolate GDP based on the actual GDP growth of the Yangtze River Economic Belt from 2000 to 2018. The model considers a limited number of influencing factors, with the decisive factor being the exponential growth of capital stock. It does not account for constraints such as energy and natural resources, adopts an optimistic perspective on technological progress without setting an upper limit, and does not consider the impact of “black swan” events like the pandemic. Therefore, the economic predictions are generally optimistic, especially for downstream provinces, where GDP has maintained rapid growth in the first two decades of the 21st century (Figure 10b). Moreover, the simulated results show an expanding GDP gap between upstream and downstream provinces. The primary reason is that downstream provinces not only have a larger base of capital stock but can also rapidly increase this based on current trends. Additionally, the investments in ecological environment protection and food security of the downstream provinces account for a smaller proportion of their economic output compared to mid-upstream provinces, resulting in greater benefits for downstream provinces in the development of the Yangtze River Basin. Although SDMY includes economic compensation mechanisms between upstream and downstream provinces, which somewhat reduces the economic disparities, the overall gap continues to widen.
In terms of resources, except for Shanghai (which has a high urbanization rate and limited farmland), the grain yield of the other 10 provinces increase slightly over time, and the growth rates among provinces are not significantly different, as shown in Figure 10c. The gradual increase in grain yield mainly caused by technological progress, and the sporadic fluctuations in yield, as illustrated in Figure 10c and Figure 11, come from the random floods and droughts. The energy consumption of each province rises constantly around 2000–2040, reaching its peak between 2050 and 2070 and then stabilizing or decreasing slightly thereafter (Figure 10d). The total energy consumption of 11 provinces is expected to peak around 2060 and then decrease slightly (Figure 11), which could have a significant impact on China’s 2060 carbon neutrality target. Some studies predict that energy demand will grow consistently [15]. The reason why this model produces a result of first increasing and then decreasing is twofold. On the one hand, energy consumption in the model mainly comes from production sectors, and the industrial energy-saving technology progress factors designed in SDMY will continuously improve with economic growth and are not assumed capped. On the other hand, due to the trend of population first increasing and then decreasing, energy consumption in the residential sector will follow the same trend. In terms of forest resources, with the continuous increase in afforestation investment, the forest coverage rate of each province will increase steadily from 2000 to 2050 (Figure 10e), which could also have a significant impact on China’s 2060 carbon neutrality target. Subsequently, due to natural endowment limitations, the forest coverage remains relatively stable.
4.3. Simulated Results and Discussion of the River Basin
The simulated results of SDMY at the river basin level are confined to the regions of 11 provinces that fall within the boundaries of the Yangtze River Basin.
In terms of the water environment, COD, TP emission, and cross-sectional water quality compliance rate are selected as typical results for display. As shown in Figure 12a, COD emission decreases continuously from 2000, and the rate of decline slows down around 2020. In 2100, the emission decreases by about 64.8% compared to 2000. TP emission peaks around 2030 and remains relatively stable until it declines after 2050. TP emission in 2100 decreases by about 16.8% compared to 2000 and by 21.4% compared to the peak period in 2030. The trend above reflects that the peak of TP emission occurs later than that of COD emission, indicating the greater difficulty of reducing TP emission. This result is consistent with existing research, which predicts that in the future, COD concentrations at most water quality monitoring stations along the Yangtze River will meet the required standards, but approximately one-third of these stations will fail to meet TP concentration standards [48].
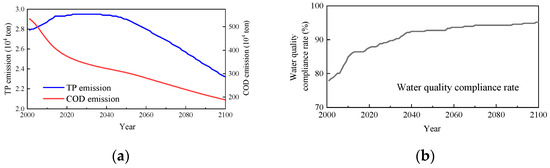
Figure 12.
Simulated results of the water environment of the Yangtze River Basin: (a) the results of TP and COD emission; (b) the results of the water quality compliance rate.
Both COD and TP emissions are highly correlated with the socio-economic system. In the model, COD primarily comes from domestic and industrial sources. Effective control of COD in China began before 2000. During the simulation period, although domestic source emissions increase with rising per capita GDP, treatment rates also increase. Industrial source emissions are mainly negatively correlated with treatment rates, which improve as per capita GDP rises. Both result in the overall negative correlation between COD emissions and economic growth. TP emissions, in addition to domestic and industrial sources, are mostly derived from agricultural sources [49,50]. In the model, TP emissions are primarily positively correlated with fertilizer application rates. Due to the difficulty of treating agricultural pollution through centralized facilities, TP reduction primarily depends on reducing fertilizer use. The fertilizer application rate in the Yangtze River Economic Belt rose before 2015, with upstream provinces still experiencing growth until 2020. Consequently, the turning point for fertilizer application rates to decline with economic growth arrives late in the model, leading to a late start in TP emission reductions. Water quality compliance rates are calculated on both COD and TP. By 2030, COD has been effectively controlled, and after 2030, all the non-compliance is due to TP. Due to the effective control in reducing COD emissions rapidly, the overall non-compliance could improve significantly especially in the first half century. As shown in Figure 12b, the water quality compliance rate in the Yangtze River Basin improves constantly from 80% or less, and it exceeds 90% by 2030 and maintains at around 95% after 2060. This indicates the long-term positive effects of water environment pollution prevention and control in China.
In terms of water security, as shown in Figure 13a, from 2000 to 2030, the water security level of the river basin rises constantly, mainly due to the successive operation of large-scale water conservancy projects along the Yangtze River. For example, from upstream to downstream, projects Wudongde, Baihetan, Xiluodu, Xiangjiaba and Three Gorges were completed and put into operation in 2020, 2021, 2013, 2012, and 2003, respectively, raising the storage capacity effectively, improving the overall flood control capacity of the river basin greatly, and enhancing water security. After 2020, because almost no more new large-scale reservoirs have been put into operation, the overall water security remains stable, with slight fluctuations due to changes in soil erosion caused by random flood and drought disasters. The relevant literature studies show that the overall water security in the Yangtze River Basin is improving [51,52], which is effectively consistent with the simulation results of this model.
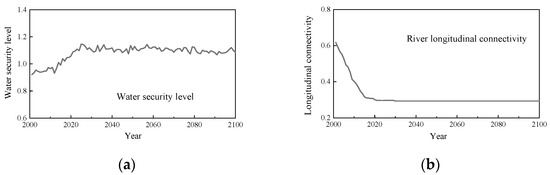
Figure 13.
Simulated results of water security and ecology of the Yangtze River Basin: (a) the results of the water security level; (b) the results of the river longitudinal connectivity.
In terms of water ecology, as shown in Figure 13b, contrary to water security, the operation of water conservancy projects reduces the overall longitudinal connectivity of rivers significantly. Therefore, the indicator “longitudinal connectivity” decreases before 2020 and remains effectively unchanged afterwards with the completion of large-scale water conservancy project construction.
5. Conclusions
The high-quality development of the Yangtze River Economic Belt is currently one of the key strategies in China. To address population, economic, and water system-related challenges facing the Yangtze River basin in its development, this study has developed a Systemic Deduction Model of the Development of the Yangtze River Basin, referred to as SDMY. SDMY generalizes the Yangtze River Basin system, which integrates provincial units with river basin units and is composed of seven subsystems: population, economy, pollution, resources (grain, forest, and energy), disasters, water environment, and water security–ecology. SDMY primarily uses system dynamics and is deeply coupled with a water environment mechanism model. It focuses on constructing the “population–economy–resources” loop based on provincial units, as well as the “population–economy–environment” and “water security–ecology” loops based on coupling provincial and basin units. Moreover, it establishes feedback equations among the internal and external key elements of each subsystem.
The effectiveness of SDMY has been verified by comparing the simulation results with historical data. The robustness of the model has been validated by analyzing the impact of changes in key parameters on the output. The simulation of the development process of the Yangtze River Basin from 2000 to 2100 demonstrates the applicability of SDMY. From the perspective of provincial-level administrative regions, the total population in 11 provinces decreases significantly after reaching its peak around 2030 with mid-upstream provinces seeing a more pronounced decrease. The economic output of all provinces are expected to continue to rise, but the economic disparities between mid-upstream and downstream provinces may widen. Over the whole century, the grain yield is projected to continue to increase, and food security could be sufficiently ensured regardless of extreme circumstances. The total energy consumption rises at first with economic development but decreases slightly after reaching its peak in 2060. The forest coverage maintains stability after increasing for the first four decades. From the perspective of the whole river basin, TP emission of the Yangtze River Basin increases in the first three decades and then decreases, and it is more difficult to be reduced compared to COD emission which shows a constant decline over the century. However, the overall change of TP emission does not exceed 20%, so it would not hinder the steady improvement of the water quality compliance rate in the Yangtze River Basin. Benefiting from investments in disaster prevention and mitigation, as well as the construction of water conservancy projects, the overall water security in the Yangtze River Basin improves significantly between 2000 and 2025, and remains relatively stable thereafter. However, the intensive construction of water conservancy projects results in a significant decrease in the river longitudinal connectivity of the Yangtze River Basin during this period, causing adverse effects on water ecology to a certain extent. As a whole, SDMY could be used to deduce the long-term development process of the society–economy–environment composite system at both the provincial level and the river basin level along the Yangtze River, providing an effective quantitative tool for analyzing the relationship between humans and water in the river basin and the long-term mutual feedback evolution relationship between the society, economy, and water system.
Based on the feedbacks of existing socio-economic and environmental factors, extrapolation suggests that the socio-economic and environmental conditions in the Yangtze River Basin this century will not face significant risks of deterioration. However, certain situations may arise that require decision-makers to pre-deploy relevant policies. First, the most significant and long-term challenge stems from population aging and decline, and particularly, the reduction in labor force in upstream and midstream provinces may be detrimental to economic development. For policymakers, scientifically formulating policies to encourage childbirth and attract population from other provinces will be beneficial for the medium- to long-term development of the province. Second, economically, it is crucial to prevent the continuous widening of the GDP gap between upstream, midstream provinces, and downstream provinces. Therefore, policies such as inter-provincial transfer payments and ecological compensation, which contribute to regional balance, need to be strengthened in a timely manner. Third, in terms of food security, emergency preparedness should be made for potential production losses due to extreme climate disasters. Forth, regarding energy, it is essential to make advance preparations for the peak energy demand before the mid-century. Additionally, under China’s dual carbon goals, the development of clean energy should be prioritized. Fifth, for water environment, it is recommended to promote more efficient measures for TP emission reduction or reuse. Lastly, concerning water security and ecology, on the one hand, it is necessary to ensure the safe and stable operation of reservoirs and dams in the Yangtze River Basin, and make continuous investment in disaster prevention and mitigation. On the other hand, it is suggested enhancing the connectivity of existing dams as much as possible, such as adding fish ladders or other fish passage facilities, while actively applying ecological measures like fish enhancement and releasing to mitigate the impact of river blockage on aquatic organisms.
During the SDMY construction process, constrainted by cognitive limitations, data availability, and computational costs, we adopted idealized assumptions and simplify the relationships among system variables to reduce modeling complexity, and did not fully account for development constraints and material limits, causing deviations between the model simulation and the real-world situation. For example, it adopts the traditional economic framework that ignoring external factors such as changing environment (e.g., global trade, climate change), unexpected events (e.g., pandemic, war). Additionally, it overlooks resource carrying capacities (e.g., forests, energy) and implicitly assuming no upper bounds on technological progress. For the reasons above, the simulated results of SDMY may be overly optimistic. Additionally, flood and drought disasters that only consider random factors cannot fully reflect the complexity of natural disasters and their impact on subsystems such as water security and grain. In essence, SDMY simulates the development trend of the Yangtze River Basin in an ideal and undisturbed state. To accurately reflect intergenerational population changes, we set the simulation period to 100 years (2000–2100), but this also greatly increases the uncertainty of the SDMY. The time-invariant parameters and the fixed relationships among the variables within the model may gradually diverge from initial assumptions over extended periods. The closed-system assumption further limits responsiveness to exogenous shocks, such as the 2020 pandemic, leading to accumulating errors over extended periods (e.g., 2050-2100). In essence, limited by the model structure, the prediction range of the SDMY simulation results after 2050 may be further deviated due to the uncertainty of the model.
This model can be improved in several aspects. First, additional constraints can be added, such as the upper limits of technological progress, the carrying capacity, or maximum availability of resources like forests and food, etc. Second, the energy subsystem can be further enriched by including different energy structures and, on this basis, incorporating a carbon emissions subsystem. Third, for the simulation of the water system, the outputs of the water ecology can be further optimized, and the feedback relationships with the socio-economic system can be strengthened. Although this model is developed based on the Yangtze River basin, its methodology can also be applied to other river basins. The core is to select administrative units within the basin with the data as complete as possible, clarify the upstream and downstream spatial relationships among the control units within the basin, as well as the spatial relationships among administrative units, and generalize the system into two levels, i.e., river basin and administrative units, for modeling.
Author Contributions
Conceptualization, C.L.; methodology, C.L., T.Y., N.J., and P.Y.; software, C.L. and T.Y.; validation, T.Y.; formal analysis, C.L., T.Y., and N.J.; investigation, C.L., T.Y., and N.J.; resources, C.L. and Q.X.; data curation, C.L. and T.Y.; writing—original draft preparation, T.Y., N.J., and P.Y.; writing—review and editing, N.J.; visualization, T.Y. and N.J.; supervision, Q.X.; project administration, N.J.; funding acquisition, C.L. All authors have read and agreed to the published version of the manuscript.
Funding
This research was funded by the National Key Research and Development Program of China (grant number 2022YFC3203500) and China Three Gorges Corporation (grant number NBWL202200489).
Data Availability Statement
Data will be made available on request.
Conflicts of Interest
The authors declare that this study received funding from China Three Gorges Corporation. The funder was not involved in the study design, collection, analysis, interpretation of data, the writing of this article, or the decision to submit it for publication.
Abbreviations
The following abbreviations are used in this manuscript:
| SDMY | Systemic Deduction Model of the Development of Yangtze River Basin |
Appendix A
Appendix A.1. Population Subsystem
In the population subsystem, we adopt the discrete population development equation model to predict the changes in the population in different age groups in the future. Among them, the control parameters of the number of births and deaths, the total fertility rate and life expectancy, are, respectively, based on historical data to establish regression analysis formulas. The results of the regression analysis show a coefficient of determination , indicating that the fitting effect of the formula is great.
in which is total fertility rate, and variables that affect total fertility rate include GDP per capita , urbanization rate , LE is , and variables that affect life expectancy include GDP per capita , grain yield per capita afd, energy consumption per capital , and sewage discharge per capita .
Meanwhile, the population quality is represented by the average years of education for all ages, and calculation is based on the assumption of linear growth within a certain range.
in which is average years of education, m, n are constant coefficients and vary with different provinces.
Appendix A.2. Economy Subsystem
In the economy subsystem, we calculate GDP using the Cobb–Douglas production function that adds the variable of human capital. Among them, the elasticity coefficients of the labor force and capital stock in each province are estimated by regression analysis based on historical data. The results of the regression analysis listed in Table A1 show a coefficient of determination , indicating that the estimation effect of the parameters is great.
Table A1.
Estimation results of the Cobb–Douglas production function parameters.
Table A1.
Estimation results of the Cobb–Douglas production function parameters.
| Province | Elasticity Coefficients of the Labor Force | Elasticity Coefficients of the Capital Stock | |
|---|---|---|---|
| Shanghai | 0.134 | 0.866 | 0.996 |
| Jiangsu | 0.227 | 0.773 | 0.998 |
| Zhejiang | 0.247 | 0.753 | 0.997 |
| Anhui | 0.302 | 0.698 | 0.998 |
| Jiangxi | 0.289 | 0.711 | 0.991 |
| Hubei | 0.245 | 0.755 | 0.998 |
| Hunan | 0.304 | 0.696 | 0.996 |
| Sichuan | 0.225 | 0.775 | 0.993 |
| Guizhou | 0.27 | 0.73 | 0.994 |
| Yunnan | 0.426 | 0.574 | 0.998 |
| Chongqing | 0.181 | 0.819 | 0.989 |
The model assumes that the proportion of expenditures outside the system boundary to the GDP of the current year remains unchanged each year. Based on the differences in economic development levels among different provincial regions within the basin, in addition to the expenditures of various systems such as environmental governance, farmland security, afforestation, and soil erosion control, it is also necessary to consider the horizontal transfer payments among different provincial units within the basin. In order to more accurately capture the contribution of labor input to economic growth, not only the quantity of the labor force but also its “quality” should be considered, Thereby, we adopt the average years of education of the labor force to reflect human capital [43]. Meanwhile, it assumes that the rate of technological progress changes linearly within a certain range.
in which is human capital, expressed as a function of average years of education , is investment rate, is the fixed outside the system boundary to GDP, is the ratio of expenditure in each subsystem to GDP, including environmental governance input , farmland security input , afforestation input , and soil erosion control input , is ratio of transfer payments to GDP. is total factor productivity, technological progress rate.
Appendix A.3. Resources Subsystem (Grain)
In the grain subsystem, since the prediction of grain yield involves many factors, we select several indicators that have significant impact on grain yield and are easy to quantify, and establish a variable coefficient prediction equation for grain yield per unit area [53]. Then regression analysis is used to estimate the coefficients of the equation based on historical data. The results of the regression analysis show a coefficient of determination , indicating that the fitting effect of the formula is good.
where is grain yield per unit area, is the ratio of farmland affected by disaster, is the consumption of chemical fertilizer per unit area, is the ratio of irrigated area, is the ratio of mechanical planting area, is the consumption of farm manure per unit area, is aggregate index of price parities between industrial and agricultural products, is a moderating variable that takes the value of 1 when the grain self-sufficiency rate is low, and 0 otherwise, k are constant coefficients and vary with different provinces.
Appendix A.4. Pollutant Subsystem
In the pollutant subsystem, we use regression analysis method to establish an equation that relates GDP per capita to the prediction of wastewater discharge per capita of domestic and industrial sources. The results of the regression analysis show a coefficient of determination , indicating that the fitting effect of the formula is good.
where is sewage discharge, are per capita domestic sewage and industrial wastewater discharge, respectively, is total population, is GDP per capita, b, c are constant coefficients and vary with different provinces.
Appendix A.5. Disaster Subsystem
In the disaster subsystem, we divide soil erosion into mild, moderate, and severe categories, and the change of the soil erosion area is mainly influenced by the change of farmland area, afforestation, etc.
where, are the area of mild, moderate, and severe soil erosion, is afforestation area, represents the area of farmland returned to forests or grasslands, represents the supplemented farmland area.
References
- Hoang, A.T.; Nižetić, S.; Olcer, A.I.; Ong, H.C.; Chen, W.H.; Chong, C.T.; Thomas, S.; Bandh, S.A.; Nguyen, X.P. Impacts of COVID-19 pandemic on the global energy system and the shift progress to renewable energy: Opportunities, challenges, and policy implications. Energy Policy 2021, 154, 112322. [Google Scholar] [CrossRef]
- Rockström, J.; Williams, J.; Daily, G.; Noble, A.; Matthews, N.; Gordon, L.; Wetterstrand, H.; DeClerck, F.; Shah, M.; Steduto, P.; et al. Sustainable intensification of agriculture for human prosperity and global sustainability. Ambio 2017, 46, 4–17. [Google Scholar] [CrossRef]
- Haque, F.; Ntim, C.G. Environmental policy, sustainable development, governance mechanisms and environmental performance. Bus. Strategy Environment. 2018, 27, 415–435. [Google Scholar] [CrossRef]
- Xu, Z.; Chau, S.N.; Chen, X.; Zhang, J.; Li, Y.; Dietz, T.; Wang, J.; Winkler, J.A.; Fan, F.; Huang, B.; et al. Author Correction: Assessing progress towards sustainable development over space and time. Nature 2020, 592, E28. [Google Scholar] [CrossRef]
- Olawumi, T.O.; Chan, D.W. A scientometric review of global research on sustainability and sustainable development. J. Clean. Prod. 2018, 183, 231–250. [Google Scholar] [CrossRef]
- Costanza, R.; Daly, L.; Fioramonti, L.; Giovannini, E.; Kubiszewski, I.; Mortensen, L.F.; Pickett, K.E.; Ragnarsdottir, K.V.; De Vogli, R.; Wilkinson, R. Modelling and measuring sustainable wellbeing in connection with the UN Sustainable Development Goals. Ecol. Econ. 2016, 130, 350–355. [Google Scholar] [CrossRef]
- Cheng, G.; Li, X.; Zhao, W.; Xu, Z.; Feng, Q.; Xiao, S.; Xiao, H. Integrated study of the water–ecosystem–economy in the Heihe River Basin. Natl. Sci. Rev. 2014, 1, 413–428. [Google Scholar] [CrossRef]
- Hope, R.A. Evaluating social impacts of watershed development in India. World Dev. 2007, 35, 1436–1449. [Google Scholar] [CrossRef]
- Wagner, W.; Gawel, J.; Furumai, H.; De Souza, M.P.; Teixeira, D.; Rios, L.; Ohgaki, S.; Zehnder, A.J.B.; Hemond, H.F. Sustainable watershed management: An international multi-watershed case study. Ambio 2002, 31, 2–13. [Google Scholar] [CrossRef]
- Meadows, D.H.; Meadows, D.L.; Randers, J.; Behrens, W. Limits to Growth; Universe Books: New York, NY, USA, 1972. [Google Scholar]
- Meadows, D.H.; Randers, J.; Meadows, D.L. Limits to Growth: The 30-Year Update; Chelsea Green Publishing: White River Junction, VT, USA, 2004. [Google Scholar]
- Davies, E.G.; Simonovic, S.P. ANEMI: A new model for integrated assessment of global change. Interdiscip. Environ. Rev. 2010, 11, 127–161. [Google Scholar] [CrossRef]
- Akhtar, M.K.; Wibe, J.; Simonovic, S.P.; MacGee, J. Integrated assessment model of society-biosphere-climate-economy-energy system. Environ. Model. Softw. 2013, 49, 1–21. [Google Scholar] [CrossRef]
- Breach, P.A.; Simonovic, S.P. ANEMI3: An updated tool for global change analysis. PLoS ONE 2021, 16, e0251489. [Google Scholar] [CrossRef] [PubMed]
- Jiang, H.; Simonovic, S.P.; Yu, Z. ANEMI_Yangtze v1.0: A coupled human–natural systems model for the Yangtze Economic Belt–model description. Geosci. Model Dev. 2022, 15, 4503–4528. [Google Scholar] [CrossRef]
- Qu, W.; Shi, W.; Zhang, J.; Liu, T. T21 China 2050: A tool for national sustainable development planning. Geogr. Sustain. 2020, 1, 33–46. [Google Scholar] [CrossRef]
- Pedercini, M.; Arquitt, S.; Collste, D.; Herren, H. Harvesting synergy from sustainable development goal interactions. Proc. Natl. Acad. Sci. USA 2019, 116, 23021–23028. [Google Scholar] [CrossRef] [PubMed]
- Dixson-Declève, S.; Gaffney, O.; Ghosh, J.; Randers, J.; Rockstrom, J.; Stoknes, P.E. Earth for All: A Survival Guide for Humanity; New Society Publishers: Gabriola Island, BC, Canada, 2022. [Google Scholar]
- Zhang, X.; Xu, L.; Li, C. Sustainability of water resources in Shandong province based on a system dynamics model of water-economy-society for the lower yellow river. Sustainability 2022, 14, 3412. [Google Scholar] [CrossRef]
- Wang, A.; Wang, S.; Liang, S.; Yang, R.; Yang, M.; Yang, J. Research on Ecological Protection and High-Quality Development of the Lower Yellow River Based on System Dynamics. Water 2023, 15, 3046. [Google Scholar] [CrossRef]
- Cheng, G.; Li, G.; Pu, X.; Chen, C.; He, Y. Advancing coupling coordination simulation in the social-human-ecological system of the Three Gorges Reservoir Area: A multi-scenario system dynamics approach. Ecol. Indic. 2024, 158, 111504. [Google Scholar] [CrossRef]
- Madani, K.; Mariño, M.A. System dynamics analysis for managing Iran’s Zayandeh-Rud river basin. Water Resour. Manag. 2009, 23, 2163–2187. [Google Scholar] [CrossRef]
- Abdi-Dehkordi, M.; Bozorg-Haddad, O.; Salavitabar, A.; Goharian, E. Developing a sustainability assessment framework for integrated management of water resources systems using distributed zoning and system dynamics approaches. Environ. Dev. Sustain. 2021, 23, 16246–16282. [Google Scholar] [CrossRef]
- Sharifi, A.; Kalin, L.; Tajrishy, M. System dynamics approach for hydropower generation assessment in developing watersheds: Case study of Karkheh River basin, Iran. J. Hydrol. Eng. 2013, 18, 1007–1017. [Google Scholar] [CrossRef]
- Wang, Z.; Fu, X. Scheme simulation and predictive analysis of water environment carrying capacity in Shanxi Province based on system dynamics and DPSIR model. Ecol. Indic. 2023, 154, 110862. [Google Scholar] [CrossRef]
- Ma, H.; Wang, Q.; Zhang, Y.; Hussain, M.B.; Xu, Y.; Tian, S.; Yuan, X.; Ma, Q.; Yuan, R.; Jia, Y. Research on sustainable development evaluation and improvement path of resource-based cities based on coupling of emergy and system dynamics. Environ. Dev. Sustain. 2024, 26, 5959–6006. [Google Scholar] [CrossRef] [PubMed]
- Zhao, Y.; Yu, M.; Xiang, Y.; Chang, C. An approach to stimulate the sustainability of an eco-industrial park using coupled emergy and system dynamics. Environ. Dev. Sustain. 2023, 25, 11531–11556. [Google Scholar] [CrossRef]
- Francis, A.; Thomas, A. System dynamics modelling coupled with multi-criteria decision-making (MCDM) for sustainability-related policy analysis and decision-making in the built environment. Smart Sustain. Built Environ. 2023, 12, 534–564. [Google Scholar] [CrossRef]
- Jiang, L.; Wu, Y.; He, X.; Fu, Q.; Wang, Z.; Jiang, Q. Dynamic simulation and coupling coordination evaluation of water footprint sustainability system in Heilongjiang province, China: A combined system dynamics and coupled coordination degree model. J. Clean. Prod. 2022, 380, 135044. [Google Scholar] [CrossRef]
- Beaussier, T.; Caurla, S.; Bellon-Maurel, V.; Loiseau, E. Coupling economic models and environmental assessment methods to support regional policies: A critical review. J. Clean. Prod. 2019, 216, 408–421. [Google Scholar] [CrossRef]
- Güneralp, B.; Reilly, M.K.; Seto, K.C. Capturing multiscalar feedbacks in urban land change: A coupled system dynamics spatial logistic approach. Environ. Plan. B Plan. Des. 2012, 39, 858–879. [Google Scholar] [CrossRef]
- Han, J.; Hayashi, Y.; Cao, X.; Imura, H. Application of an integrated system dynamics and cellular automata model for urban growth assessment: A case study of Shanghai, China. Landsc. Urban Plan. 2009, 91, 133–141. [Google Scholar] [CrossRef]
- Malard, J.J.; Inam, A.; Hassanzadeh, E.; Adamowski, J.; Tuy, H.A.; Melgar-Quiñonez, H. Development of a software tool for rapid, reproducible, and stakeholder-friendly dynamic coupling of system dynamics and physically-based models. Environ. Model. Softw. 2017, 96, 410–420. [Google Scholar] [CrossRef]
- Chen, Z.; Wei, S. Application of system dynamics to water security research. Water Resour. Manag. 2014, 28, 287–300. [Google Scholar] [CrossRef]
- Harms, J.Z.; Malard-Adam, J.J.; Adamowski, J.F.; Sharma, A.; Nkwasa, A. Dynamically coupling system dynamics and SWAT+ models using Tinamït: Application of modular tools for coupled human-water system models. Hydrol. Earth Syst. Sci. 2023, 27, 1683–1693. [Google Scholar] [CrossRef]
- Abdolabadi, H.; Amaya, M.; Little, J.C. Intimate coupling of a hydrologic model with an economic input–output model using system dynamics. Appl. Water Sci. 2023, 13, 75. [Google Scholar] [CrossRef]
- Chen, F.; Li, X.; Wang, W. Study on the spatiotemporal variation characteristics of total phosphorus in the Yangtze River Basin from 2018 to 2022. Express Water Resour. Hydropower 2023, 44, 91–97+105. (In Chinese) [Google Scholar]
- Li, H.; Yang, Q.; Zhao, Y. Focusing on water eco-environment problems and sustainably promoting ecological conservation and restoration of the Yangtze River. J. Environ. Eng. Technol. 2022, 12, 336–347. (In Chinese) [Google Scholar]
- Liu, L.; Huang, G.; Wang, F.; Chu, Z.; Li, H. Main Problems, Situation and Countermeasures of Water Eco-Environment Security in the Yangtze River Basin. Res. Environ. Sci. 2020, 33, 1081–1090. (In Chinese) [Google Scholar]
- Jumani, S.; Deitch, M.J.; Valle, D.; Machado, S.; Lecours, V.; Kaplan, D.; Krishnaswamy, J.; Howard, J. A new index to quantify longitudinal river fragmentation: Conservation and management implications. Ecol. Indic. 2022, 136, 108680. [Google Scholar] [CrossRef]
- Lyu, J.; Wang, X.; Liu, W.; Wang, Y.; Wei, C.; Wu, J. Longitudinal connectivity and fish habitat of main tributaries in Songhuajiang River Basin. Water Resour. Prot. 2017, 33, 155–160. (In Chinese) [Google Scholar]
- Song, J.; Yu, J.; Li, G. Prediction of Population Development Process. Sci. China 1980, 9, 920–932. (In Chinese) [Google Scholar]
- Lu, Y.; Cai, F. The impact of demographic changes on potential growth rates: A comparison between China and Japan. J. World Econ. 2014, 37, 3–29. (In Chinese) [Google Scholar]
- Shan, H. Re-estimation of China’s capital stock K. J. Quant. Technol. Econ. 2008, 25, 17–31. (In Chinese) [Google Scholar]
- Zhu, M.; Zhang, Z.; Zhu, B.; Kong, R.; Zhang, F.; Tian, J.; Jiang, T. Population and economic projections in the Yangtze River Basin based on shared socioeconomic pathways. Sustainability 2020, 12, 4202. [Google Scholar] [CrossRef]
- National Bureau of Statistics of China. China Statistical Yearbook 2024; China Statistics Press: Beijing, China, 2024.
- Lu, Y.; Cai, F. From Demographic Dividend to Reform Dividend: Based on China’s Potential Growth Rate Simulation. World Econ. 2016, 39, 3–23. (In Chinese) [Google Scholar] [CrossRef]
- Dong, W.; Zhang, Y.; Zhang, L.; Ma, W.; Luo, L. What will the water quality of the Yangtze River be in the future? Sci. Total Environ. 2023, 857, 159714. [Google Scholar] [CrossRef]
- Liu, D.; Bai, L.; Li, X.; Zhang, Y.; Qiao, Q.; Lu, Z.; Liu, J. Spatial characteristics and driving forces of anthropogenic phosphorus emissions in the Yangtze River Economic Belt, China. Resour. Conserv. Recycl. 2022, 176, 105937. [Google Scholar] [CrossRef]
- Li, J.; Chen, Y.; Cai, K.; Fu, J.; Ting, T.; Chen, Y.; Folberth, C.; Liu, Y. A high-resolution nutrient emission inventory for hotspot identification in the Yangtze River Basin. J. Environ. Manag. 2022, 321, 115847. [Google Scholar] [CrossRef]
- Yang, L.; Liu, H.; Wang, H.; Zhang, R.; Zhao, Z. Construction and application of system dynamic model for ‘four water’ and socio-economic in the Yangtze River Economic BeltⅠ: Model construction and verification. Yangtze River 2022, 53, 1–7. (In Chinese) [Google Scholar]
- Yang, L.; Zhang, R.; Liu, H.; Wang, H.; Zhao, Z. Construction and application of system dynamic model for ‘four water’ and socio-economic in the Yangtze River Economic BeltⅡ: Scenario analysis of development model in 2035. Yangtze River 2022, 53, 1–7+25. (In Chinese) [Google Scholar]
- Chen, X.; Guo, J. Prediction of China’s Grain Production Development and Analysis of Its Guarantee Level. J. Nat. Resour. 1996, 3, 197–202. (In Chinese) [Google Scholar]
Disclaimer/Publisher’s Note: The statements, opinions and data contained in all publications are solely those of the individual author(s) and contributor(s) and not of MDPI and/or the editor(s). MDPI and/or the editor(s) disclaim responsibility for any injury to people or property resulting from any ideas, methods, instructions or products referred to in the content. |
© 2025 by the authors. Licensee MDPI, Basel, Switzerland. This article is an open access article distributed under the terms and conditions of the Creative Commons Attribution (CC BY) license (https://creativecommons.org/licenses/by/4.0/).