Article

Identifying Worst Transient Cases and Optimizing Surge Protection for Existing Water Networks

by
Hossam Mohamed Ahmed
1,*,
Yehya Emad Imam
1,*,
Hamdy Ahmed El-Ghandour
2 and
Amgad Saad Elansary
1
1
Faculty of Engineering, Irrigation and Hydraulics Department, Cairo University, Giza 12613, Egypt
2
Faculty of Engineering, Civil Engineering Department, Damietta University, Damietta 34511, Egypt
*
Authors to whom correspondence should be addressed.
Water 2025, 17(12), 1816; https://doi.org/10.3390/w17121816
Submission received: 14 April 2025 / Revised: 7 June 2025 / Accepted: 12 June 2025 / Published: 17 June 2025
(This article belongs to the Special Issue Machine Learning Applications in the Water Domain)

Abstract

:
Previous studies of transients in existing water distribution networks (WDNs) accounted for only single worst cases in optimizing surge protection measures, considered only pressure at pipe end nodes, and did not examine the effect of regulating the duration of demand increase. This study presents a comprehensive model for identifying the minimal set of worst transient cases for which optimized surge protection achieves zero Surge Damage Potential Factor (SDPF) for all transient loading cases. The model introduces S D P F P to account for pressure at all computational nodes along pipes, as opposed to relying on S D P F N , which considers pressure at pipe end nodes only. The existing New York Tunnel network was used for model validation and for determining the optimal diameters for additional duplicate pipes to achieve higher pressure under steady-state conditions and protect the network from transients due to demand increase. Compared to previous studies, the model achieved S D P F N = 0 with a lower cost for sudden demand increase at a single predefined node. For concurrent sudden demand increase at two nodes, the model identified a total of 8 critical transient cases and corresponding optimum duplicate pipe diameters that achieved S D P F N = 0 and S D P F P = 0 with 46% and 74% higher costs than previous studies, respectively. The higher costs are necessary; previous studies did not achieve zero S D P F N and S D P F P in 39% and 91% of transient cases, respectively. To reduce duplicate pipe costs, the model was used to examine the effect of regulating the duration for a gradual demand increase. Using only the pipes optimized for steady-state service, the minimum duration for satisfying the transient pressure constraints was identified as ~260 s for the concurrent demand increase scenario. Slight relaxation of the minimum allowable pressure constraint allows a reduction in the duration to 150 s. For applying a demand increase over a smaller duration, duplicate pipes would be needed and can be optimized using the model. These results indicate the advantage of the proposed model in achieving full protection of existing WDNs while maintaining computational efficiency and cost-effectiveness.

1. Introduction

The optimal design of a water distribution network (WDN) aims to minimize cost while satisfying hydraulic constraints pertaining to pressure, flow velocity, and water demands. Numerous studies have applied various optimization techniques to determine optimum WDN pipe diameters based on steady-state conditions for several benchmark WDNs, including the two-loop, Hanoi, New York Tunnel (NYT), and GoYang networks. Many of these studies—particularly recent ones—have relied on evolutionary algorithms given their efficiency and ability to solve complex problems to obtain near-optimal solutions [1,2]. Examples include the application of Ant Colony optimization (Maier et al. [3], Zecchin et al. [4], Zecchin et al. [5], Mehdi and Massoud [6]), Particle Swarm (PSO) optimization (Babu and Vijayalakshmi [7], Ezzeldin et al. [8], Surco et al. [9]), the Whale Optimization algorithm (Ezzeldin and Djebedjian [10]), and Differential Evolution (Vasan and Simonovic [11]; Mansouri et al. [12]; Yazdi et al. [13]). Among the various evolutionary optimization algorithms, numerous studies applied the genetic algorithm (GA) due to its robust and efficient performance. Recent examples include Jung and Karney [14], EL-Ghandour and Elansary [15], Kim and Kim [16], Huang et al. [17], Jung [18], and Sangroula et al. [19] as well as Ghobadian and Mohammadi [20] and Naidu et al. [21], who applied the non-dominated genetic algorithm with multi-objective optimization to minimize the network cost and the total network pressure deficiency.
In contrast to the large number of studies that applied optimization methods to WDNs under steady-state conditions, relatively few studies focused on the optimization of protection measures against transients in existing WDNs. Four different protection strategies were considered including pipe replacement (Djebedjian et al. [22], and El-Ghandour and Elansary [23]), addition of parallel pipes (Jung and Karney [14,24], Jung [18], El-Ghandour et al. [25]), use of surge protection devices such as surge tanks and pressure relief valves (EL-Ghandour and Elansary [15], Jung and Karney [26,27], Skulovich et al. [28]), and controlling valve closure pattern (Skulovich et al. [29,30], Bohorquez and Saldarriaga [31], Carvajal and Bohorquez [32]). Most of these studies assumed a critical scenario for one or more transient event types. For example, Jung and Karney [33] and Jung et al. [34] arbitrarily selected a transient scenario for a sudden demand increase. Their arbitrarily selected scenario was also used later by El-Ghandour and Elansary [23] and El-Ghandour et al. [25]. Another example is the study by Djebedjian et al. [22], who selected a scenario for three different transient events, including pump power failure, valve sudden closure, and sudden demand change. No justification was given for the selected scenarios. Also, a separate set of optimum pipe diameters was determined for each transient scenario without indication of the overall optimum diameters. In contrast, Jung and Karney [14,24,27] and Jung [18] identified the worst scenario for a suggested transient event by maximizing a Surge Damage Potential Factor (SDPF) based on nodal pressures simulated with only the existing pipes. Additional pipes running in parallel to the existing pipes were used for surge protection in the existing New York Tunnel (NYT) network. The optimal diameters for the additional pipes were determined by applying an evolutionary algorithm considering the identified worst case.
The deficiency in this approach is the consideration of only a single worst transient scenario and the assumption that the proposed surge protection measures that are determined based on this scenario are adequate for other transient scenarios that originally had a lower SDPF. This assumption is not necessarily valid and requires a more comprehensive analysis. Another deficiency in many—if not all—previous studies (e.g., Jung and Karney [14,24], and Jung [18], El-Ghandour and Elansary [23], El-Ghandour et al. [25]) is that only transient pressure heads at pipe end nodes were considered when examining the deviation from the minimum and maximum allowable heads. However, pressure heads along the pipes may have been higher or lower than at the pipe end nodes. Accordingly, pressure head constraints were not necessarily satisfied along the pipes and identified surge protection strategies may be insufficient to fully protect WDNs from water hammer events.
Another deficiency in previous studies that considered transients due to demand increase in WDNs is the assumption of an almost sudden, abrupt increase. While this assumption gives the most critical scenario for creating extreme transient pressures, it is perhaps overly conservative; control devices for large users can be regulated to extend the opening and closure durations. Even for the operation of fire hydrants, firefighters are instructed and trained on gradually opening and closing the hydrants to reduce transients [35,36]. Accordingly, it is important to include the duration over which the demand increase occurs as a decision variable when identifying optimal surge protection measures.
This study aims to overcome these deficiencies by proposing an efficient and reliable model for identifying the minimum set of worst transient scenarios that should be considered for the protection of existing WDNs against transient loadings. The proposed model, referred to hereafter as optWDN, applies the genetic algorithm to achieve minimum protection cost while satisfying the constraints on allowable steady-state and transient pressures along the pipes and not just at pipe end nodes. The model’s performance is demonstrated through application to the existing NYT network. In comparison to previous studies, the focus was on determining the optimal diameters for additional duplicate pipes to achieve higher pressure under steady-state conditions and to protect the network from transients due to sudden demand increase. The optWDN model also determines the minimum duration for the application of gradual demand increase to avoid the need for additional or larger duplicate pipes beyond what is needed to satisfy steady-state requirements. Depending on the viability of this minimum duration, a hybrid transient protection scheme can subsequently be used by employing a shorter feasible duration for applying demand increase and using the model to identify the corresponding optimal duplicate pipe diameters.
This paper begins by presenting the formulation and components of the proposed optWDN model. Afterwards, the essential information about the NYT network is given, and details about the model validation and application to this case study are described. The results section includes comparisons with previous studies, SDPF evaluation based on simulated pressure along pipes, identification of worst transient cases, final optimized diameters for additional duplicate pipes, and minimum duration for demand increase without transient protection. Finally, the benefits provided by the model are summarized, and recommendations regarding further model improvements are given.

2. Model Formulation

2.1. Model Scope and Components

The optWDN model applies a genetic algorithm (GA) to determine the optimum diameters for pipes to be added in parallel to existing WDN pipes. The objective is to identify the pipe diameters that provide surge protection for the WDN and give the least cost. The optWDN model was coded in MATLAB version 2018a and consists of two hydraulic simulators and two modules (Figure 1). The hydraulic simulators are the steady-state simulator (SS) and the transient simulator (TS). The modules are the Optimization (OPT) module and the Worst Transient Case (WTC) module. The model workflow is summarized next, and a detailed description of the model components is given in the following sections.
As shown in Figure 1, the optWDN model starts by applying the WTC module, which runs the steady-state simulator for the selected existing network. The steady-state results are then utilized as initial conditions for simulating the transients that arise from all possible scenarios of a specified sudden demand increase at one or more nodes. The worst transient case with the highest SDPF is identified and used by the OPT module to determine the optimal diameters for the additional duplicate pipes. The cycle of applying WTC and OPT modules repeats to identify additional worst transient cases and obtain a new set of optimum pipe diameters. The model run cycles are continued until the diameters determined based on the relatively few identified worst cases give zero SDPF for all possible transient loading cases, ensuring full protection. This iterative approach is more efficient than optimizing for all possible transient cases simultaneously, which requires substantial runtime and computational resources, particularly for large networks with simultaneous sudden demand changes at multiple nodes.

2.2. Steady-State Simulator

The steady-state simulator (SS) conducts a hydraulic analysis of the existing WDN under steady-state demands using the EPANET v2.2 hydraulic model [37]. Using the EPANET MATLAB Toolkit v2.1, the SS modifies input data files exported from the EPANET program, runs the model, and transfers results to the transient simulator. The input data file includes design parameters for all network elements, including pipes, nodes, and reservoirs.
In performing steady-state simulations, the friction energy head loss is determined based on the Darcy–Weisbach equation [38],
h f = f L V 2 2 g D
where h f is the friction head loss over a WDN pipe, V is flow velocity in the pipe, f is the Darcy–Weisbach friction factor, L is the pipe length, D is the pipe diameter, and g is the gravitational acceleration.

2.3. Transient Simulator

The transient simulator (TS) calculates pressure heads H and flow velocities V in a WDN for a specified transient scenario by solving the unsteady mass balance and momentum equations [39],
H t + a 2 g V x + V s i n θ + V H x = 0
V t + g H x + f V | V | 2 D + V V x = 0
where x is the along-pipe length, t is time, θ is the pipe angle with the horizontal, and a is the wave speed. Equations (2) and (3) are solved subject to boundary conditions imposed on velocity and/or pressure heads at reservoirs, valves, demand nodes, and junctions connecting multiple pipes. With the imposed boundary conditions and initial conditions based on steady-state simulations, the equations are solved numerically using the method of characteristics (MOC) [39,40]. The results are used within the OPT and WTC modules to identify the worst transient cases and the optimum pipe diameters, respectively.
For performing the transient analysis using MOC, the temporal and spatial domain is simultaneously discretized [41]. Each pipe i in the WDN is divided into a number of segments N s i such as that of [39],
Δ t min L i N s i V i + a i
where Δ t is the computational time step, L i is the pipe length, V i is the flow velocity in the pipe, and a i is the wave speed in the pipe, and the subscript i   = 1,2 , 3 N P denotes the pipe number with N P representing the total number of pipes in the WDN. Equation (4) ensures that the time step Δ t is set to or lower than the shortest wave travel time for pipe segments [33].

2.4. Optimization Module

The Optimization (OPT) module applies a single objective function that aims to minimize cost by identifying the optimum diameters of additional pipes. Optimization is performed subject to hydraulic constraints on steady-state and transient pressure heads along pipes. The objective function is,
F = C p + P S S + P T S
where C p = Σ i U D i × L i is the cost of the additional pipelines i = 1,2 , in which L i is the length of pipe i , and U D i is the diameter-dependent unit cost of pipes. In Equation (5), P S S and P T S are penalties applied to account for violation of pressure head constraints under steady-state and transient conditions, respectively. The penalties are calculated using,
P S S = C p × i = 1 N n   max 0 , h i h S S m a x + max 0 ,   h S S m i n h i  
P T S = C p + C p o × S D P F Δ t
where C p o is the cost of the existing pipes, N n is the total number of network nodes, h i is the steady pressure head at the end node of pipe i ; and h S S m i n and h S S m a x are the minimum and maximum allowable pressure heads during steady-state, respectively. The definition of SDPF is provided below in Section 2.5.
A genetic algorithm (GA) is applied to minimize the objective function. The optimization decision variables are the diameters for duplicate pipes running parallel to all existing WDN pipes. Possible values for the decision variables are the commercially available diameters, which are represented in GA using integers in the range from 1 to the total number of available diameters. In addition, a value of 0 is allowed to include the possibility of not having a duplicate pipe. Starting with an initial population that satisfies the bounds on decision variables, GA applies selection, crossover, and mutation operators to build new generations. The cycle continues until a stopping criterion is satisfied and a near-optimal solution is achieved.

2.5. Worst Transient Case (WTC) Module

The Worst Transient Case (WTC) module determines the Surge Damage Potential Factor (SDPF) and identifies the worst transient case with the highest SDPF by searching among a predefined set of possible sudden demand increase scenarios for one or more nodes. The objective for determining the worst transient cases is to maximize the SDPF calculated using,
S D P F = k = 1 N t j = 1 N n i = 1 N p m = 1 N s i Δ t   max 0 , H m , i , k H T S m a x + max 0 ,   H T S m i n H m , i , k  
where N n and N P are the total number of network nodes and pipes, respectively; N t is the total number of time steps in the transient simulation; N s i is the total number of segments in pipe i ; H m , i , k is the transient pressure head at the end node of segment m of pipe i at time step k ; and H T S m i n and H T S m a x are the minimum and maximum allowable pressure heads during transients, respectively.
As defined in Equation (8), the SDPF represents the sum of magnitudes of deviations of simulated pressure heads H m , i , k from the minimum and maximum allowable transient pressure heads H T S m i n   a n d   H T S m a x when these limits are exceeded. Previous researchers, including Jung and Karney [14,24], Jung [18], El-Ghandour and Elansary [23], and Jung et al. [34], calculated the SDPF based only on transient pressure heads at pipe end nodes, referred to hereafter as S D P F N . This study introduces an additional SDPF version, S D P F P , calculated from transient pressure heads at all computational nodes along pipes, including pipe end nodes. An S D P F N = 0 indicates no exceedance at pipe end nodes, while an S D P F P = 0 indicates no exceedance along the full length of WDN pipes. In Equation (8), N n equals 2 for S D P F N and the total number of all computational nodes for S D P F P .

3. Model Validation and Application

3.1. Case Study Description

The optWDN model was applied to the New York Tunnel (NYT) network, examined in several previous studies [14,18,23,24,25,27,34]. The network includes a single reservoir, 19 nodes, and 21 pipes (Figure 2). The reservoir water level is 91.44 m above the datum, node elevations are 0.00 m, pipe diameters range between 1500 and 5100 mm, pipe lengths range between 2225 and 11,707 m, and the Hazen–Williams roughness coefficient for all pipes is 100 [2,25,42]. Under peak steady-state conditions, node demand ranges between 0.0283 and 4.818 m3/s with a total of 57.13 m3/s.
According to Maier et al. [3], population growth in the region served by the aging NYT network has led to insufficient steady-state pressure heads at several locations. To restore adequate pressure levels, numerous studies proposed adding duplicate pipes and applied optimization algorithms to identify optimum diameters [2,3,43]. The objective was to minimize cost while satisfying pressure head constraints. Dany et al. [40], El-Ghandour and Elbeltagi [2], Maier et al. [3], and Eusuff and Lansay [43] identified 6 duplicate pipes with a total cost ranging between 38.13 and 38.79 million USD (Table 1).
Few studies focused on optimizing protection against transient events, considering only sudden demand increase. As the NYT network is gravity-driven with no pumps, pump power failure events are not relevant. For sudden valve closure, transients are most effectively mitigated by controlling the valve closure duration and applying an appropriate closure pattern [23,29,30,31,32,44].

3.2. Model Parameters

The optWDN model was applied to the NYT network with a computational time step of 0.55 s, and a simulation duration of 300 s. The node-dependent minimum allowable steady-state pressure head ranges between 77.7 m and 91.5 m [2], with minimum and maximum allowable transient pressure heads of 54.9 m and 304.9 m, respectively [23]. Similar to El-Ghandour et al. [25] and Jung [18], new duplicate pipe sizes were selected from a set of 15 diameters ranging from 900 mm to 5100 mm with a step of 300 mm. The unit cost (USD/m) for different pipe diameters (mm) was calculated using
U D i = 0.06665 × D i 1.2401
where the same material for existing pipes was used for duplicate pipes to avoid multiple pressure wave reflections due to material mismatch at junctions, which may lead to cyclic stress loading and fatigue failure for pipes [45,46,47]. In line with previous NYT studies, a constant transient wave speed of 1000 m/s was applied for both existing and new duplicate pipes [23]. For application of the optWDN application, the Hazen–Williams roughness coefficient for the pipes was converted to the Darcy–Weisbach friction factor using
f = 133.32 C H W 1.852 V 0.15   D 0.17
where the GA was applied within the optWDN model, population sizes of 20, 30, 50, and 100 were examined. For each initial population, 30 trial runs were conducted with a maximum number of generations of 1000. Results given by the different population sizes were evaluated using multiple metrics, including a Reliability indicator R , Efficiency-Rate metric E , and Performance indicator η a l g [2,10,48]. The metrics were calculated using
R = N s u c c N s i m ( % )
E = R × T S P F E N O T × f c · ( % )
η a l g = 100 0.99 log 10 N g e n   + 0.01   log 10 N g e n N o b j e v a l + 1   ( % )
where N s u c c is the number of trials that obtained the minimum cost, N s i m is the total number of trials, T S P is the total solution space given by the number of commercial pipes to the power of the number of WDN pipes, F E N O T is the number of objective functions to reach the optimum results during the first simulation trial, f c is an arbitrary constant set to 10−21 [2], N g e n is the product of the maximum number of generations and the population size, and N o b j e v a l is the number of minimum function evaluations. For the NYT network, T S P was set to 16 21 = 1.93 × 10 25 [2].
As given by Equations (11)–(13), the values for the three metrics R , E , and η a l g range between 0 and 100%. Higher values indicate better performance, with 100% indicating an ideal optimization model.

3.3. Model Validation

For validating the optWDN model, the model was applied to the NYT network to determine optimum diameters for new parallel pipes needed for protection against two sudden demand increase scenarios. Scenario S1 included a demand increase from 0.0283 m3/s to 4.818 m3/s over 1 s at node 10 and results were compared with those of El-Ghandour and Elansary [23], El-Ghandour et al. [25], and Jung et al. [34]. Scenario S2 involved a simultaneous demand increase by 3 m3/s over 1 s at two nodes. All possible combinations of the two nodes were tested to identify the worst case with the highest SDPF. Results were compared with those of Jung and Karney [14,24] and Jung [18]. Comparison included calculating the Nash–Sutcliffe model efficiency coefficient (NSE) using [49],
N S E = 1 l = 1 n y p l y c l 2 l = 1 n y p l y ¯ p 2
where n is the number of points used for comparing the two-time series ( n is about 540 in this study), y ¯ p is the average simulated pressure head in the previous study, y p l is the head simulated in the previous study at a given time step and node, and y c l is the corresponding head from the current study. As given by Equation (14), NSE values range from negative infinity to 1, with 1.0 representing perfect agreement with previous results.

3.4. Testing Model Performance

The effect of including pressure at computational nodes along pipes on identifying pressure extremes and calculating SDPF was examined using scenario S1. Minimum and maximum pressure heads along pipes were compared to those pressure extremes at pipe end nodes without duplicate pipes. The optWDN model was then applied to identify duplicate pipe diameters that minimized cost and achieved zero SDPF calculated based on pressure along all computational nodes along the network pipes. The identified optimal pipe diameters were compared to those identified considering only pressure heads at pipe ends to examine if the latter approach was sufficient for transient protection.
Finally, the performance of the optWDN model in identifying the worst transient cases and the optimal duplicate pipe diameters for full protection was examined using scenario S2 with simultaneous sudden demand increase at two nodes. The model was run in successive cycles (Section 2.1), with two alternatives for the initial cycle: one using a single worst transient case, and another using 9 worst cases, amounting to about 5% of the total number of possible transient cases for scenario S2. Results were analyzed by the total number of cycles to achieve zero SDPF at pipe end nodes and along pipes for all possible node combinations. Final diameters and costs were compared to those of Jung [18].

3.5. Examining the Effect of Gradual Demand Increase

The optWDN transient simulator was used to determine the duration for demand increase that does not require additional surge protection and can be accommodated by the duplicate pipes optimized for only steady-state conditions (as given by Dany et al. [40], El-Ghandour and Elbeltagi [2], and shown in Table 1). This duration was determined by conducting transient simulations that started with a sudden demand increase, extending the duration by 1 s increments until the simulated pressure head reached the minimum allowable transient head. This scheme was applied to the single worst transient case of scenarios S1 and S2. For S2, the final demand increase duration was applied to all 171 transient cases to ensure that the minimum allowable transient head was satisfied in all cases.

4. Results and Discussion

4.1. Validation of Transient Simulator

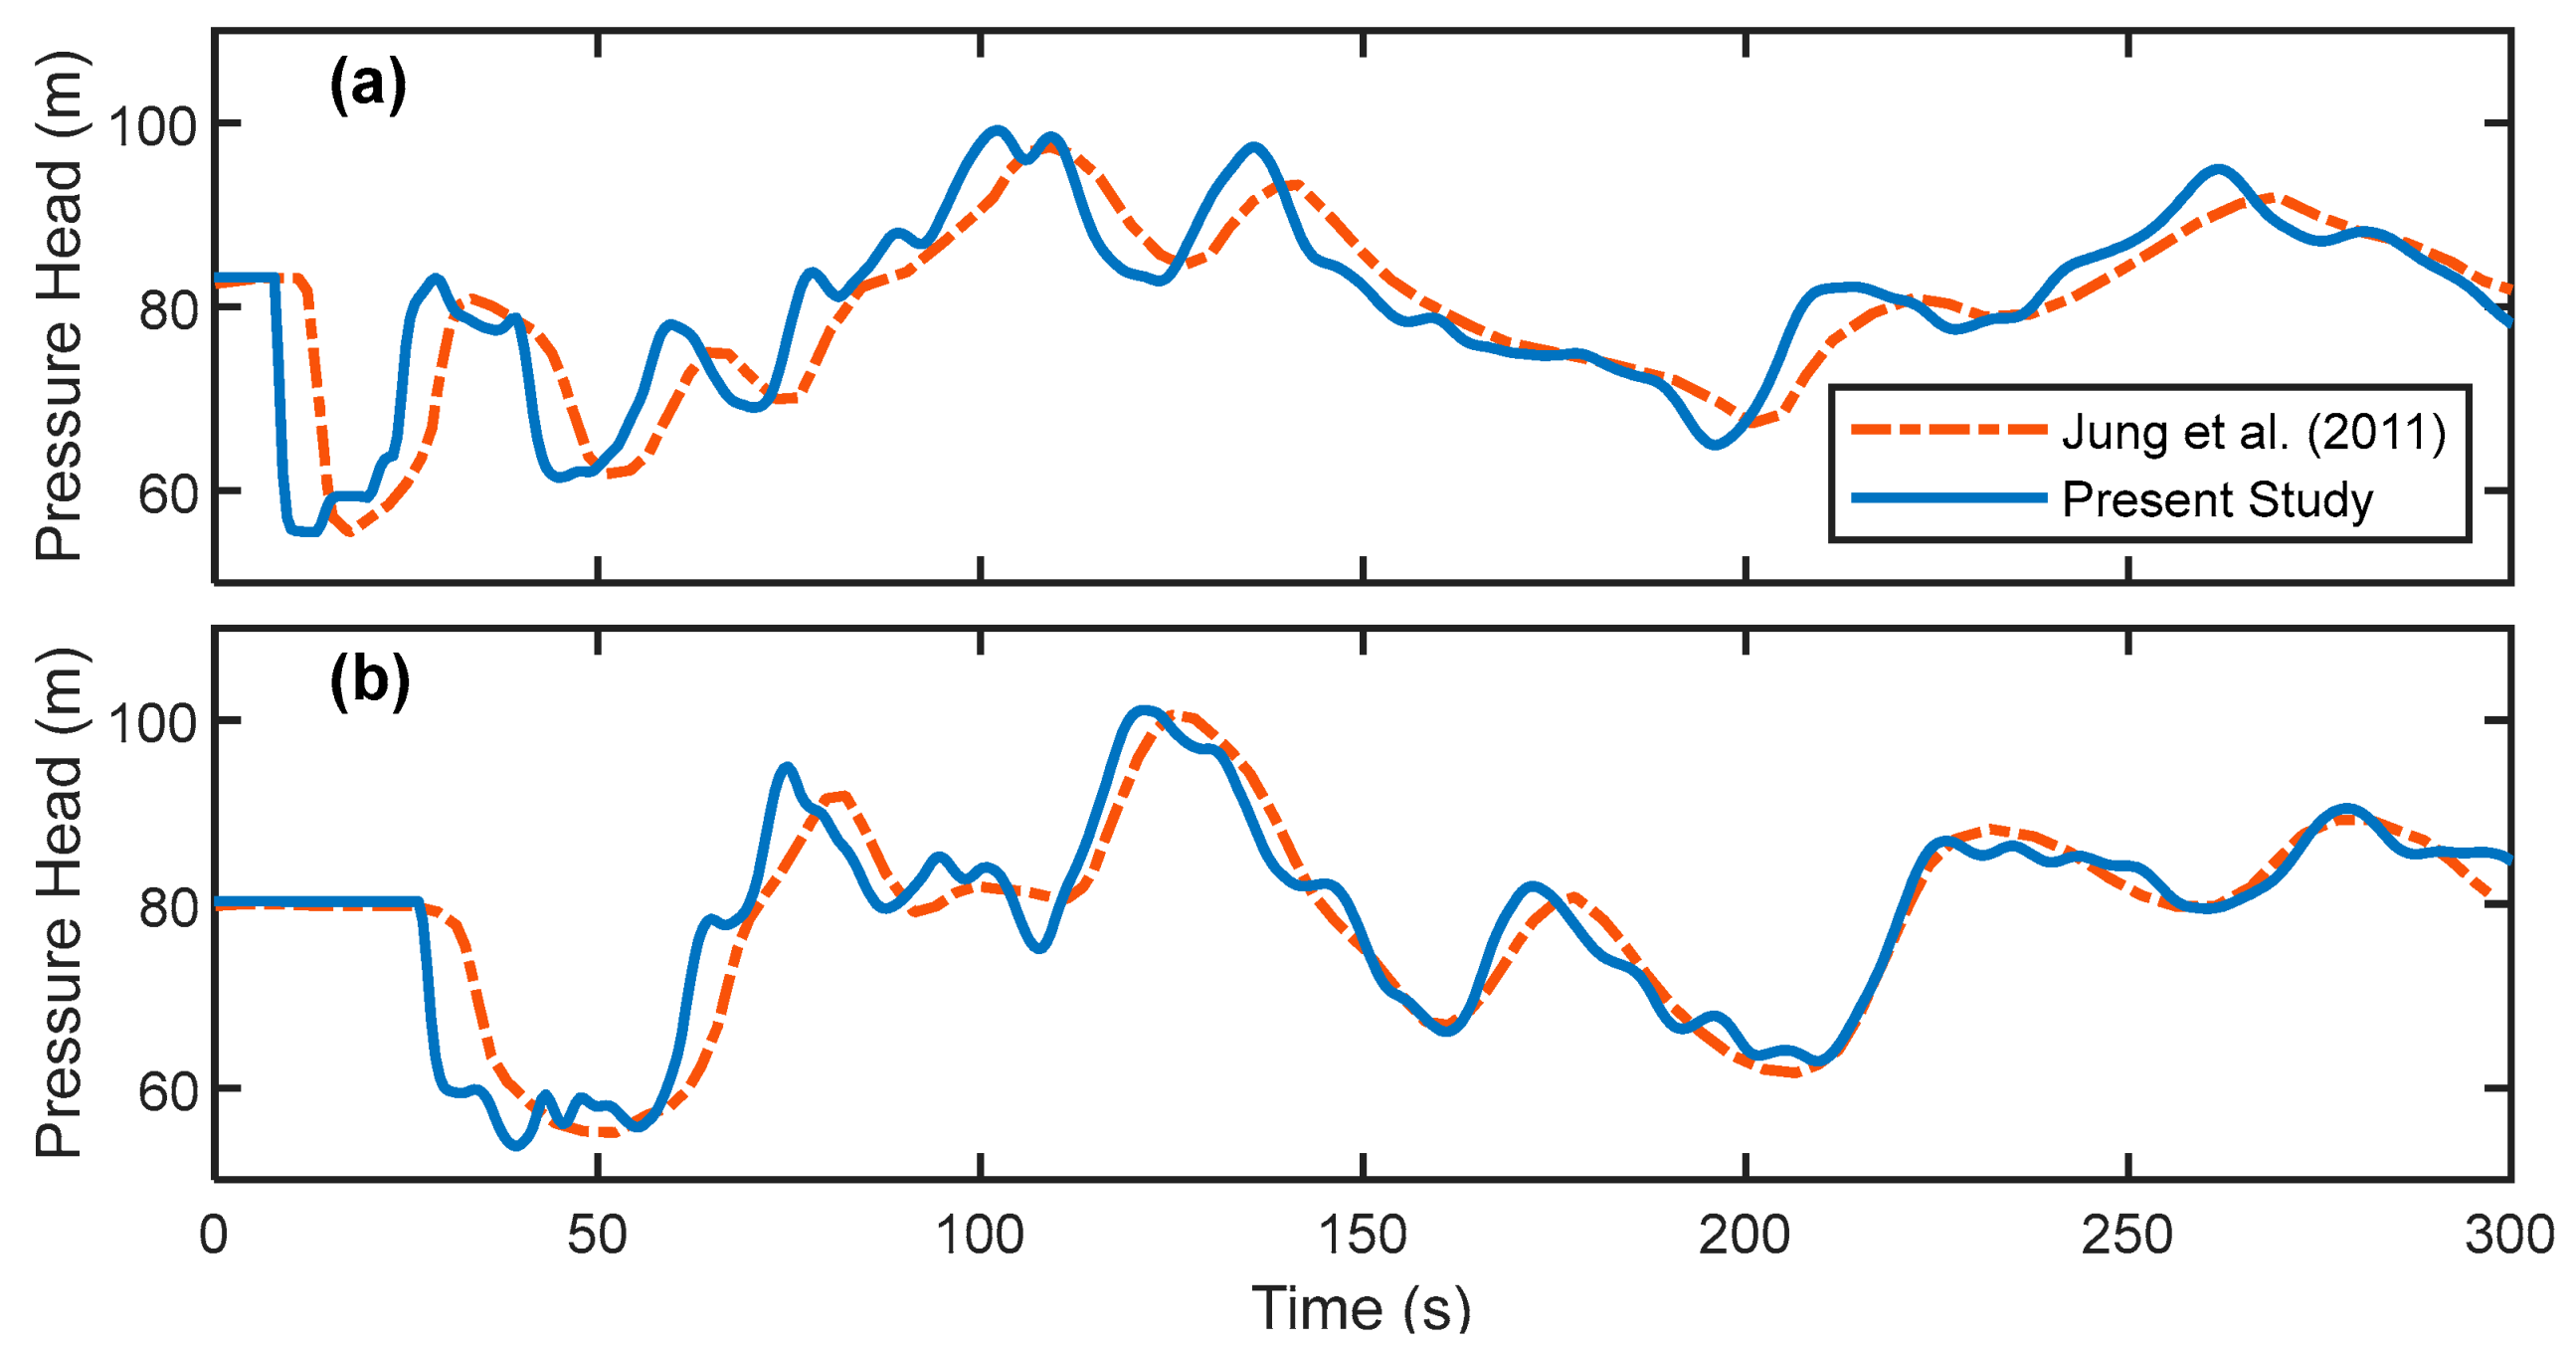
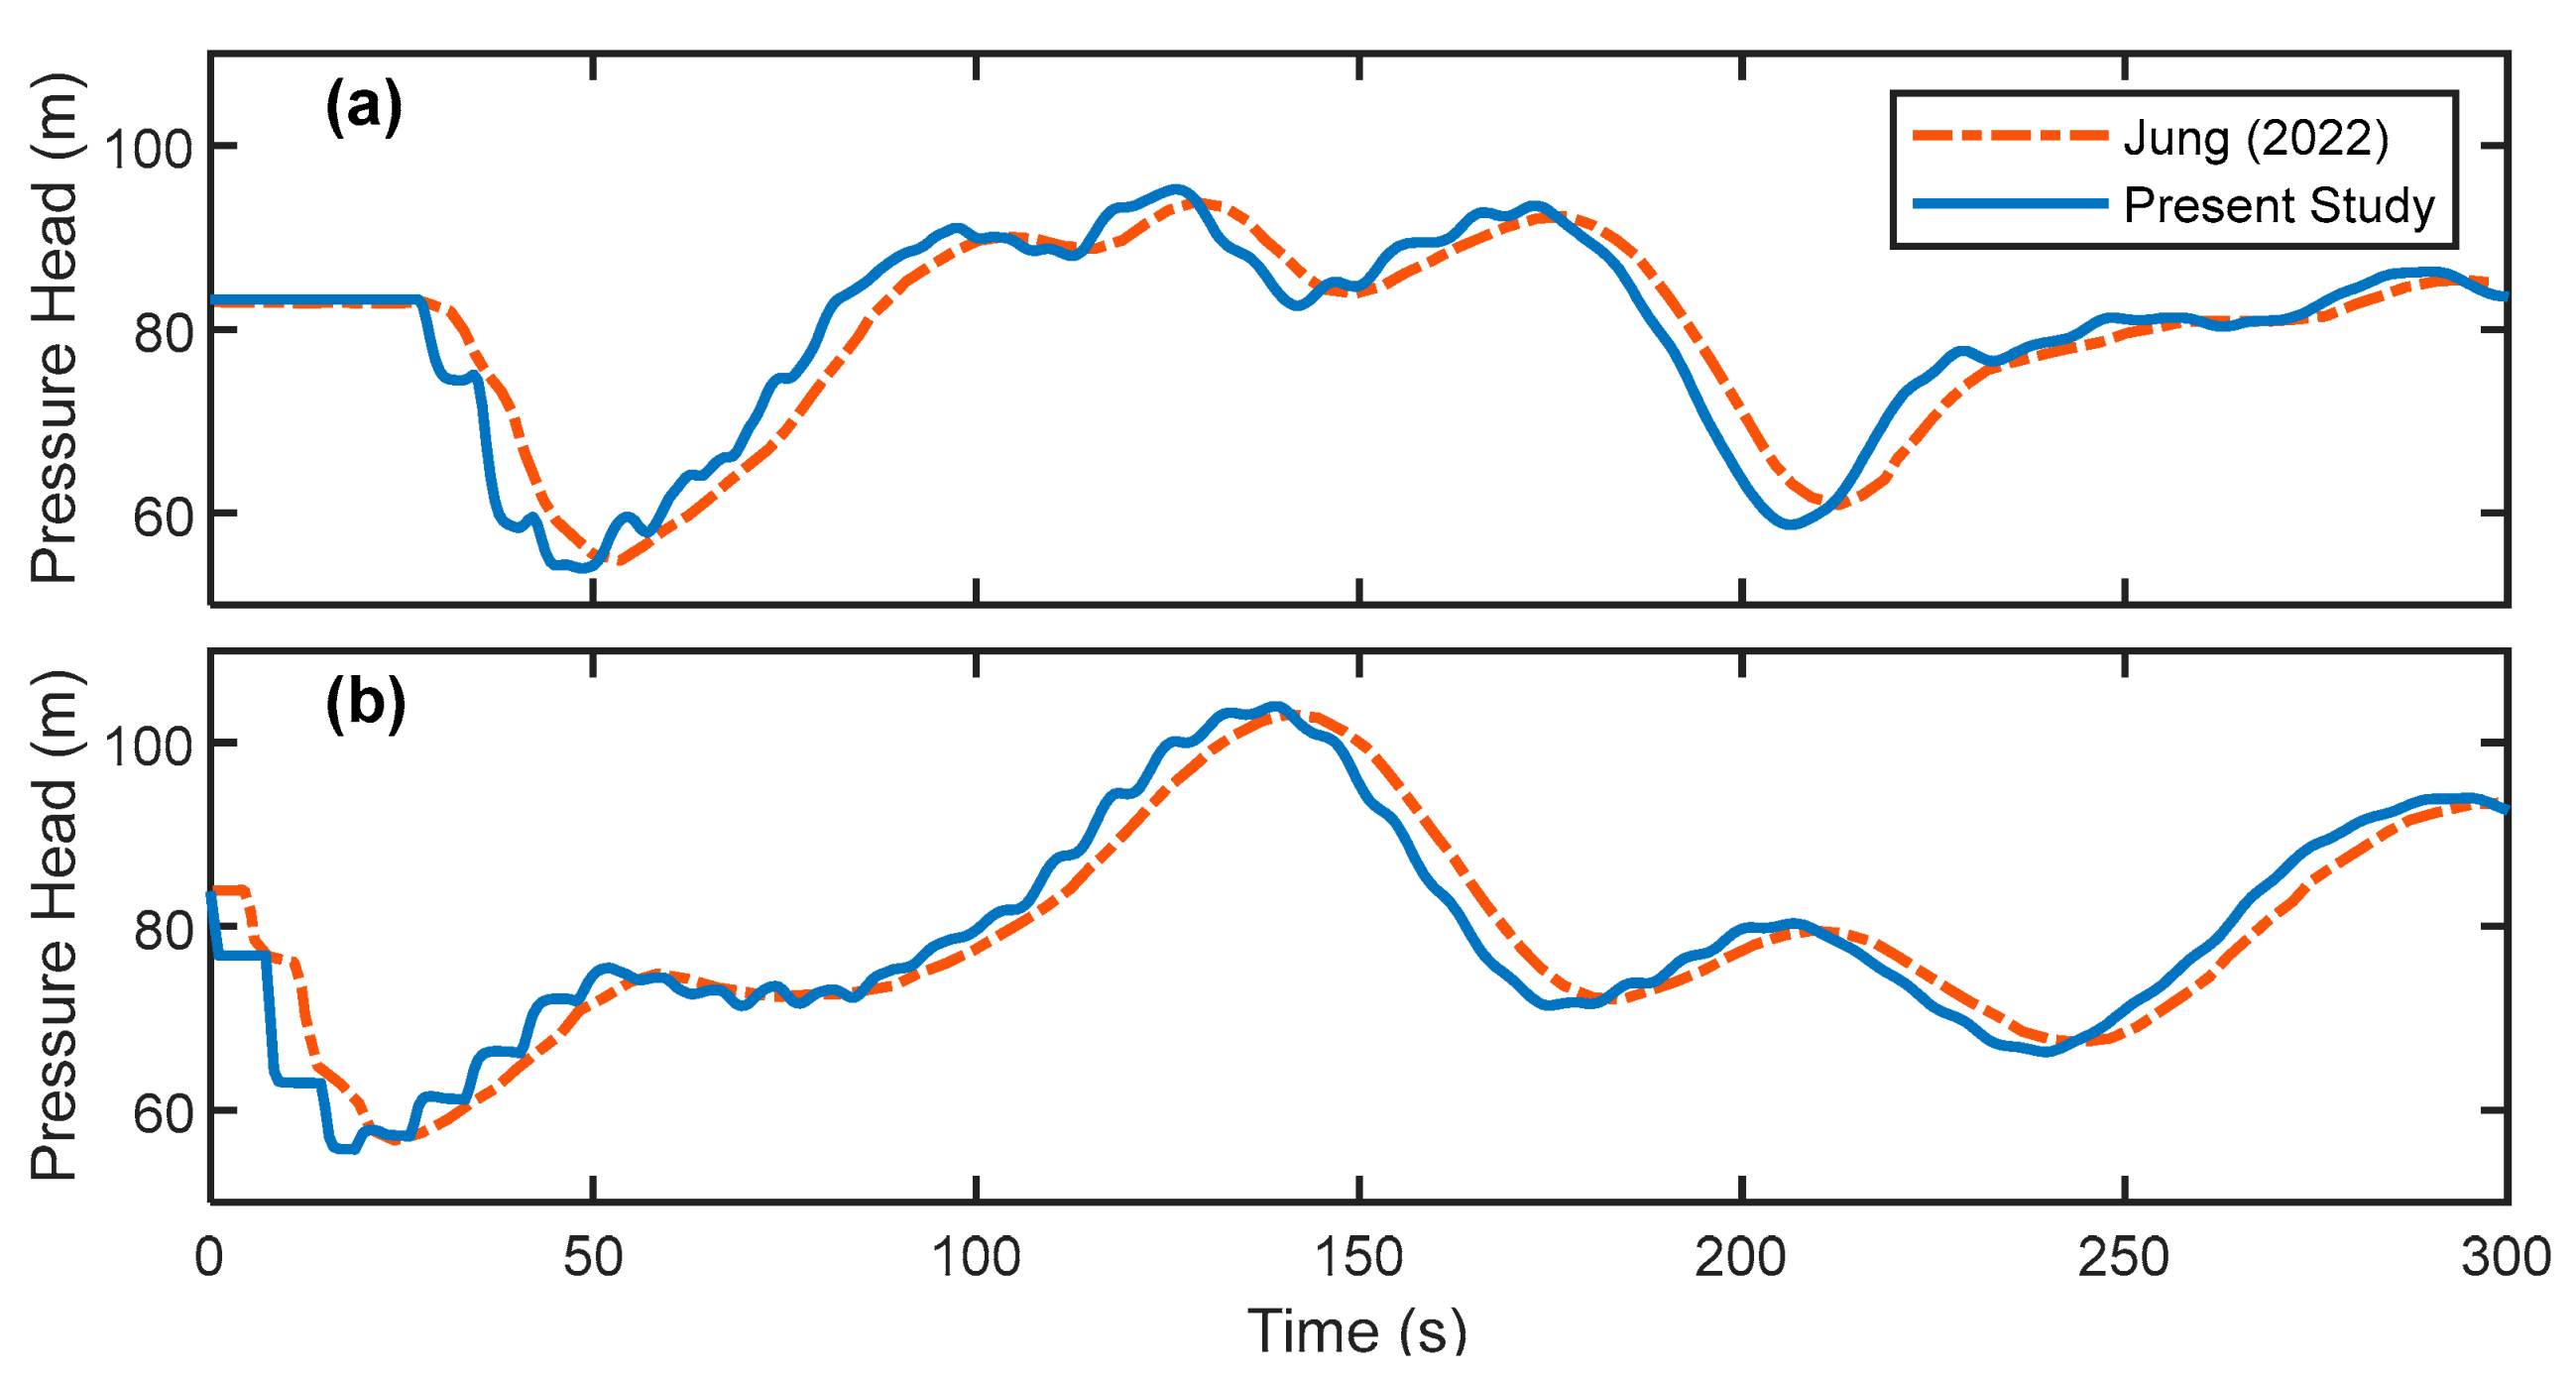
Compared to Jung [18] and Jung et al. [34], the transient pressure heads simulated in this study show similar trends for scenarios S1 and S2 (Figure 3 and Figure 4). NSE values were 0.633 for node 17 and 0.843 for node 19 compared to Jung et al. [34]. Furthermore, NSE values were 0.889 for node 17 and 0.916 for node 18 compared to Jung [18]. These relatively high NSE values indicate that the transient simulator in the optWDN model provides reasonable transient results. The lack of perfect agreement with previous results may be due to slight differences in initial steady-state conditions, simulation time steps, and estimated transient wave speed, which were not specified explicitly by these authors.

4.2. Validation of Optimization Module

For scenario S1 with sudden demand change at node 10 [34], applying different GA population sizes to optimize duplicate pipe diameters gave identical reliability metric R values and similar performance indicator η a l g values. In contrast, the efficiency-rate metric E ranged between 2.7% and 15.4% (Table 2). The population size of 30 gave the highest value of 15.4% for the metric E and was selected to be applied in the rest of this study.
From 30 independent GA runs, the optWDN model identified 7 duplicate pipes out of the 21 existing pipes, similar to El-Ghandour and Elansary [23] and Jung et al. [34], and less than the 8 duplicate pipes given by El-Ghandour et al. [25]. The identified pipes were identical to those by El-Ghandour and Elansary [23], with similar or smaller diameters except for pipe 7 (Table A1).
The total costs of the duplicate pipes identified by El-Ghandour and Elansary [23] and Jung et al. [34] were 47.2 and 49.1 million USD, respectively. The total cost identified by the optWDN model was 46.37 million USD, less by 5.7% than the cost in Jung et al. [34], less by 1.9% than the cost in El-Ghandour and Elansary [23], and ~0.3% higher than the 46.25 million USD in El-Ghandour et al. [25]. The solution with the slightly lower cost was not reproduced, as the corresponding duplicate pipe diameters violated the minimum allowable head constraint of 54.90 m at node 19 with the minimum head of 54.81 m.
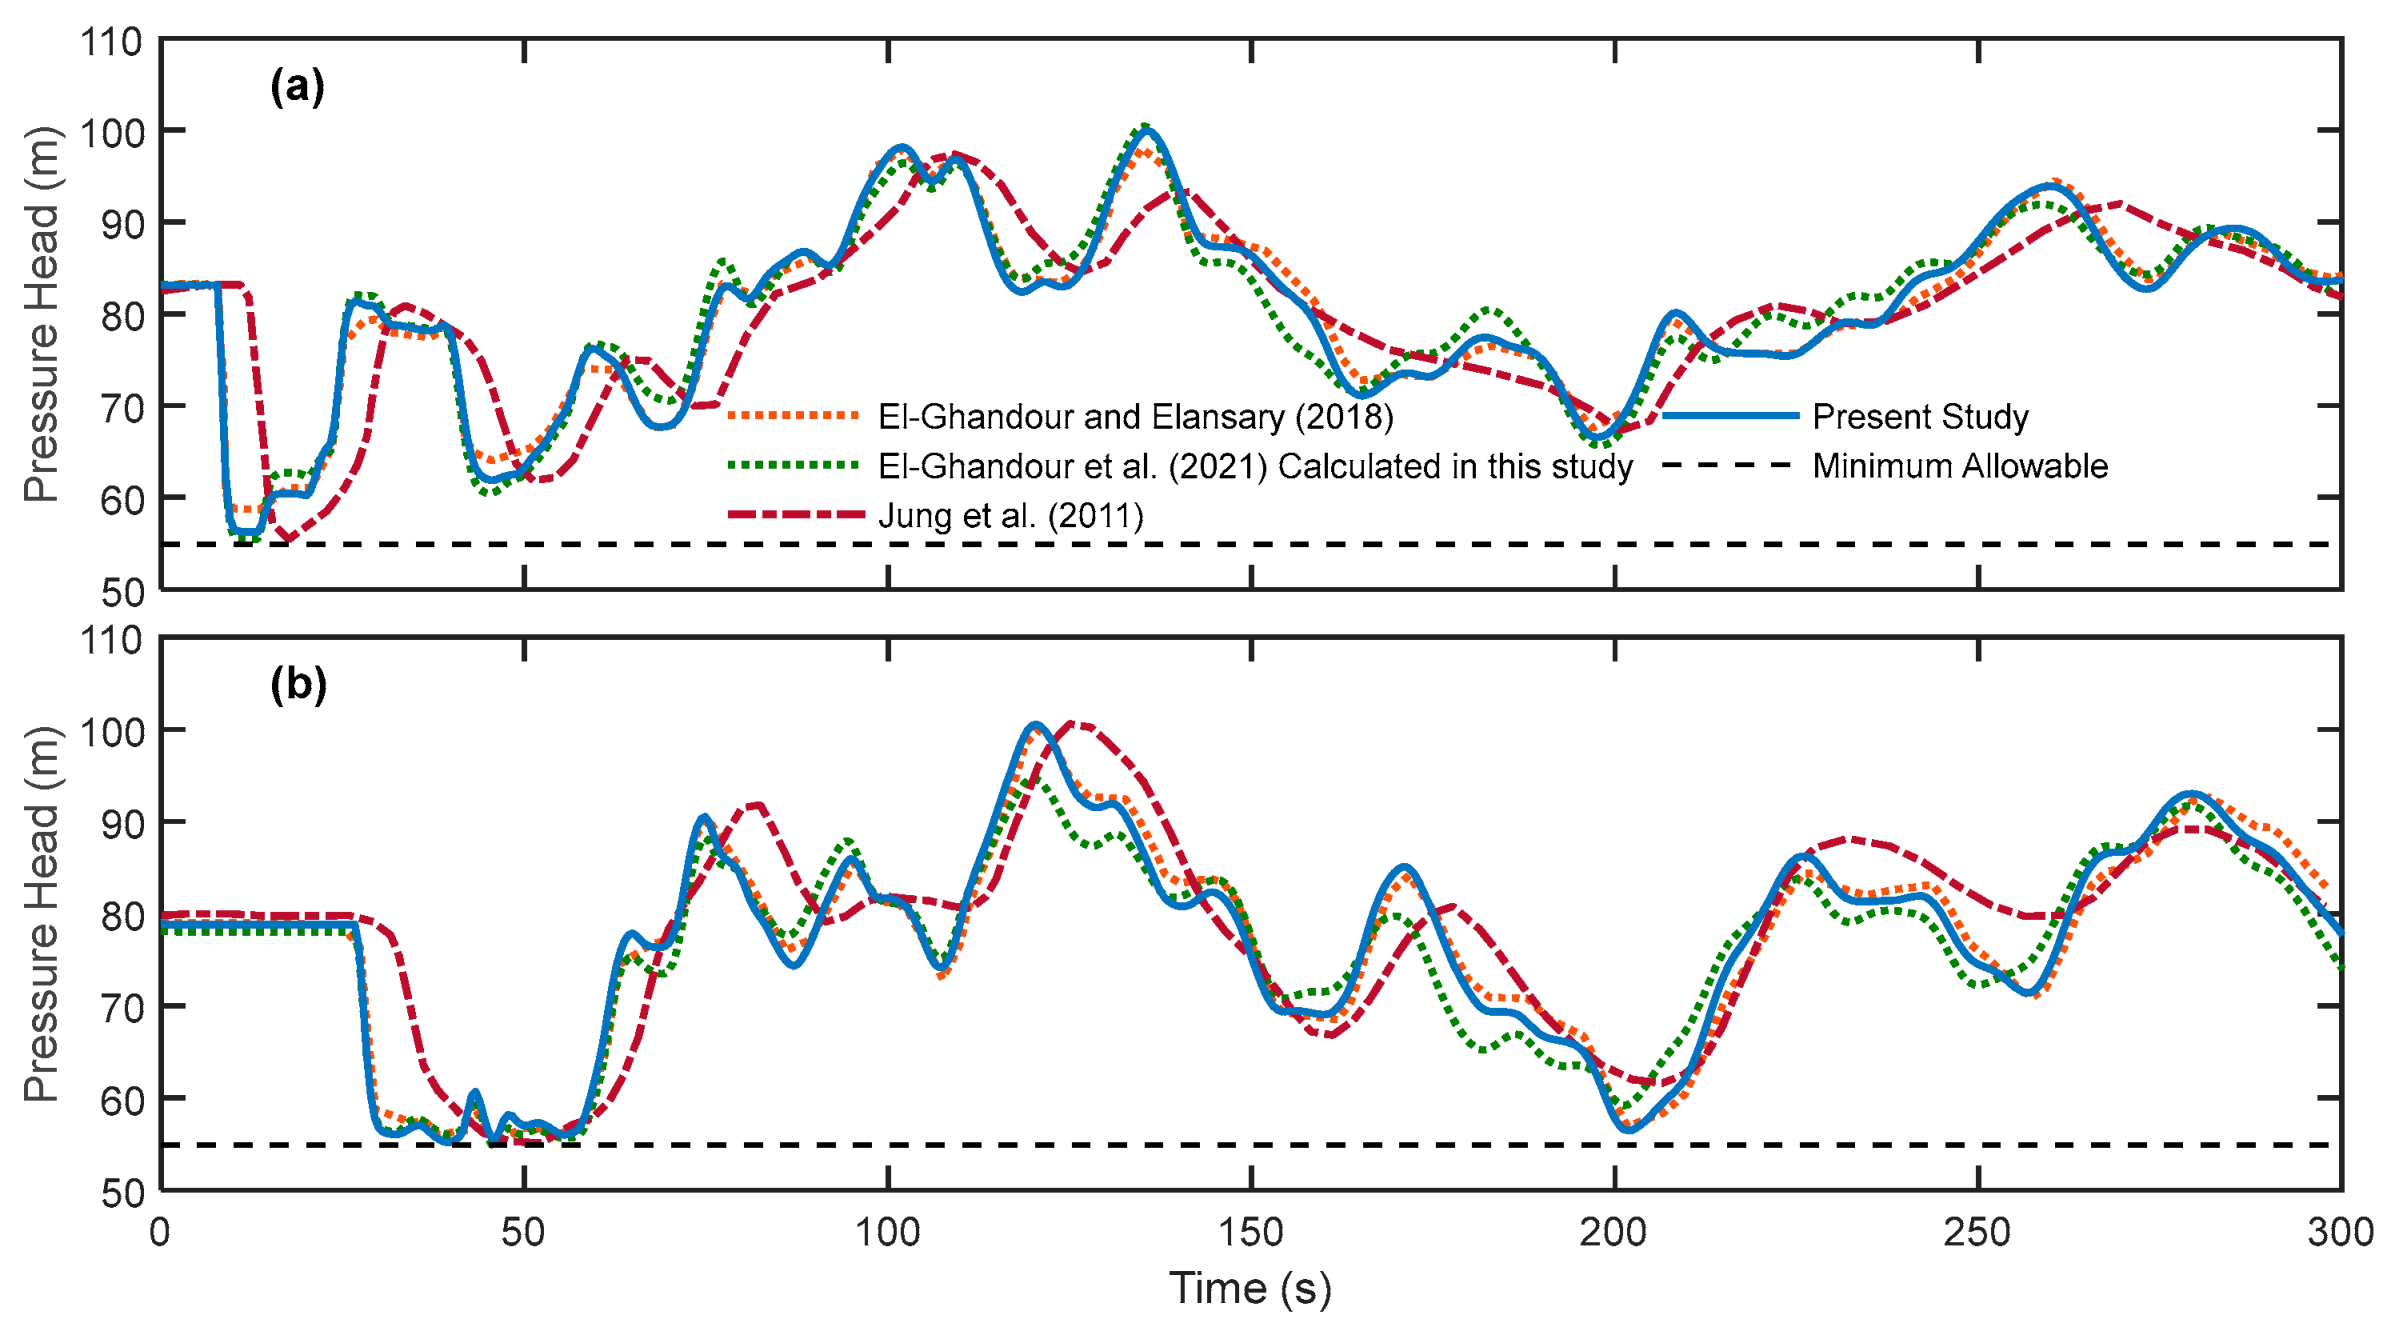
The optimal duplicate pipe diameters identified by the optWDN model gave an S D P F N of zero, indicating compliance with allowable pressure head constraints at all the network nodes. As an example, the pressure heads simulated at nodes 17 and 19 varied between 55.0 and 101.0 m similar to the range in previous studies (Figure 5).

4.3. Validation of Worst Transient Case Module

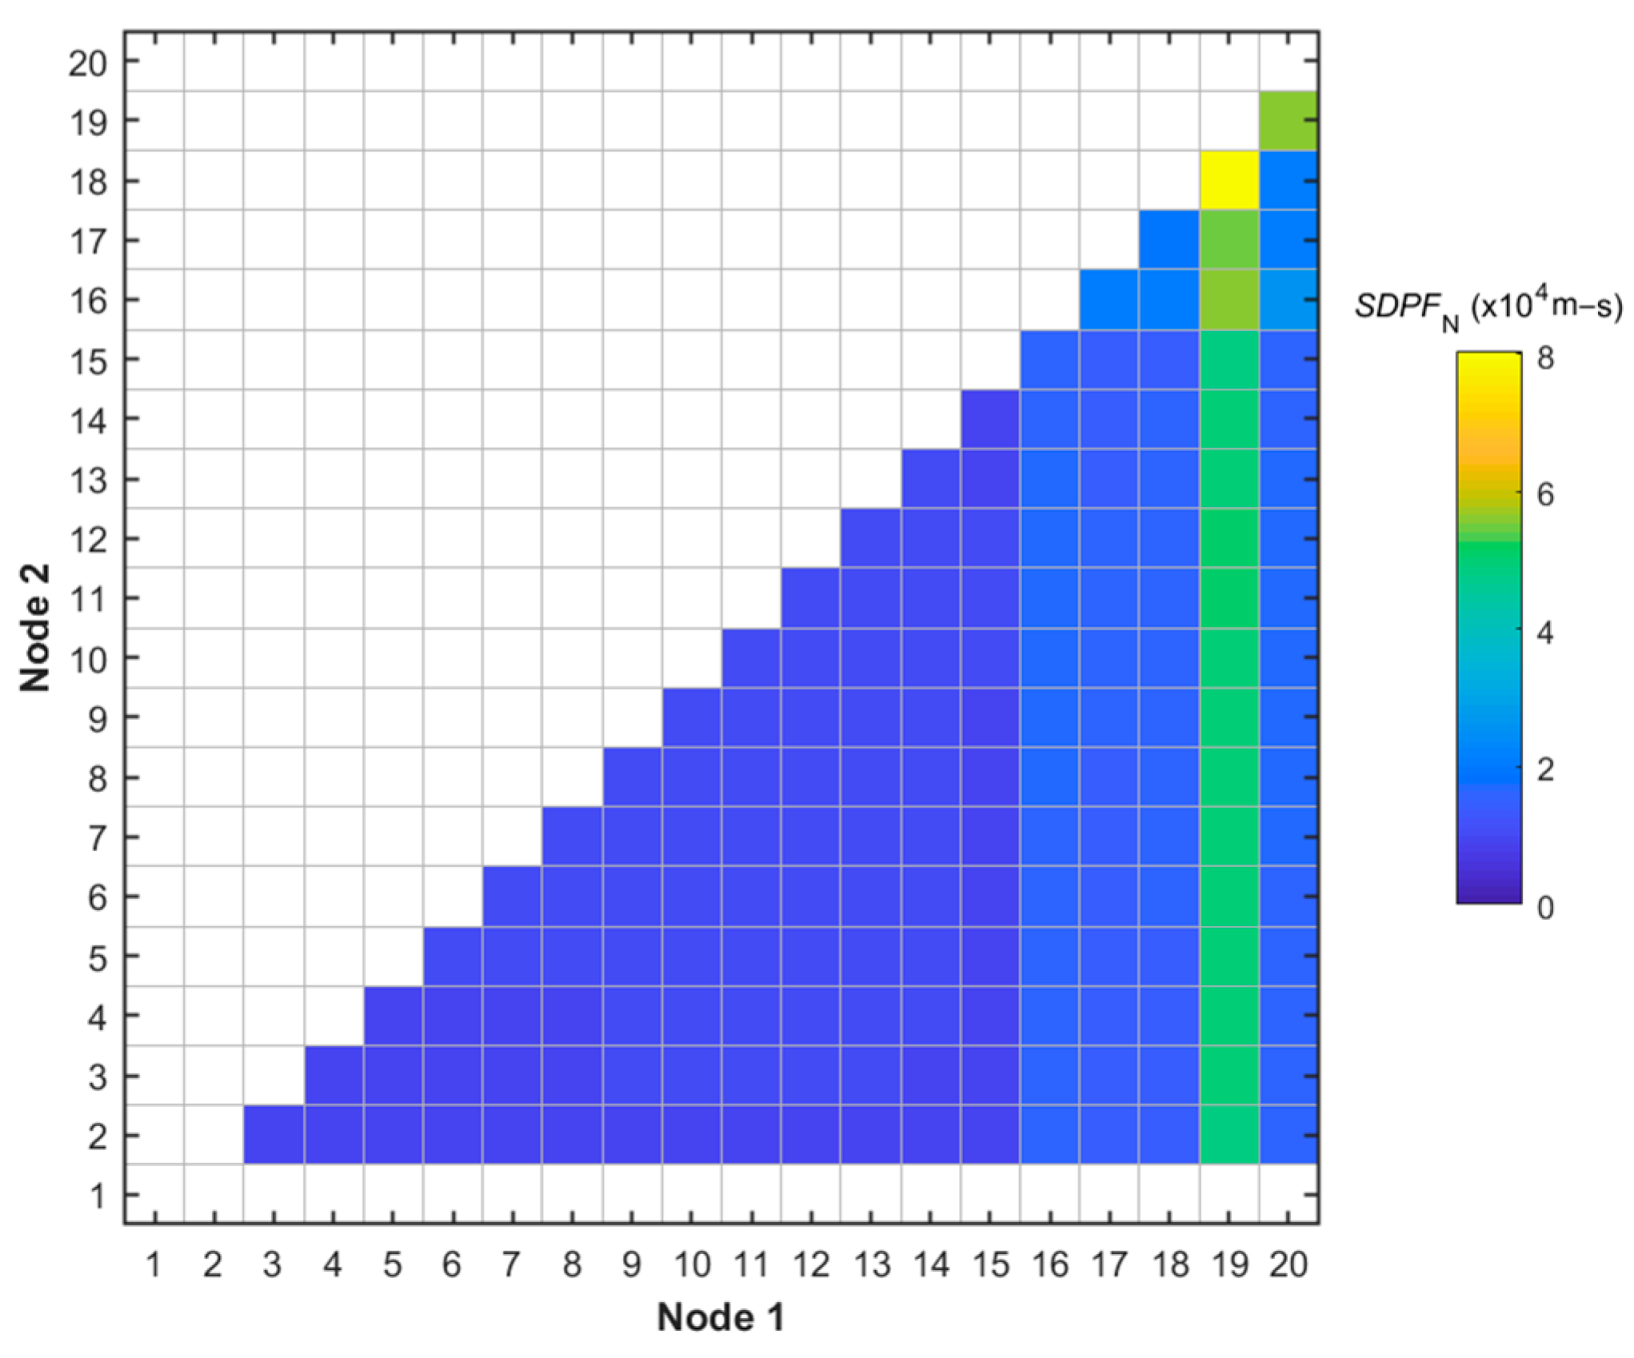
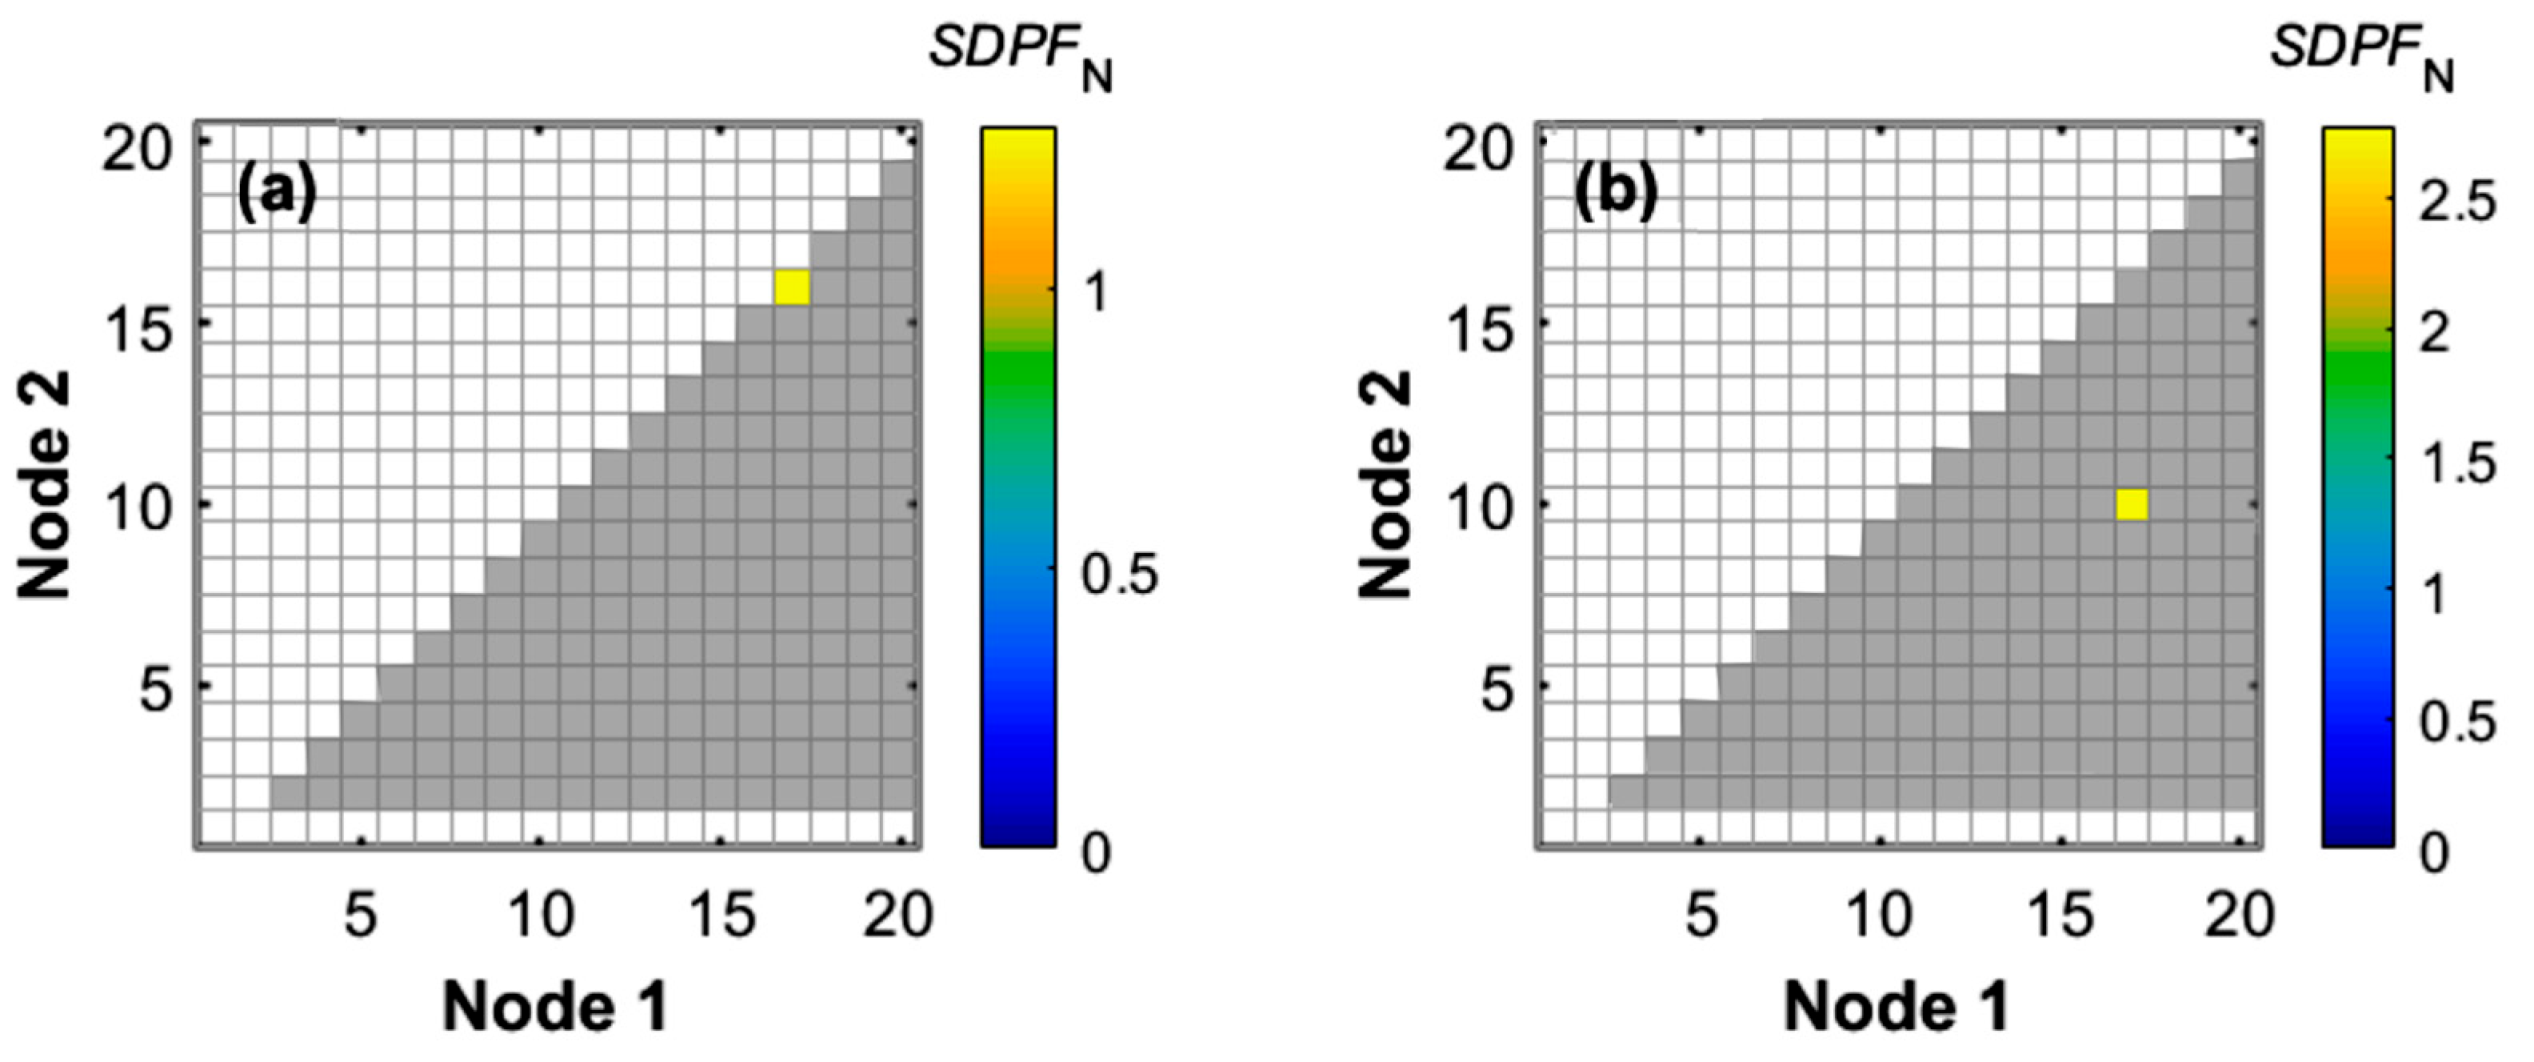
The WTC module in the optWDN model was applied to scenario S2 to identify the worst transient case with the highest S D P F N . The worst transient case consisted of a simultaneous sudden demand increase at nodes 18 and 19, consistent with Jung [18] since both nodes are located in dead-end pipes outside loops. The optWDN model gave an S D P F N of 8.04 × 10 4 m-s for the worst transient case, slightly higher than the value of 7.90 × 10 4 m-s reported by Jung [18]. Because node 19 is at a dead-end, the optWDN model results showed that, besides the worst transient case, all other cases with sudden demand change at node 19 also gave relatively high S D P F N values ranging between 4.86 × 10 4 and 5.61 × 10 4 m-s (Figure 6). This finding highlights the importance of considering multiple transient cases as opposed to just a single worst case when optimizing duplicate pipe diameters to achieve comprehensive transient protection.

4.4. Effect of SDPF Calculation Approach

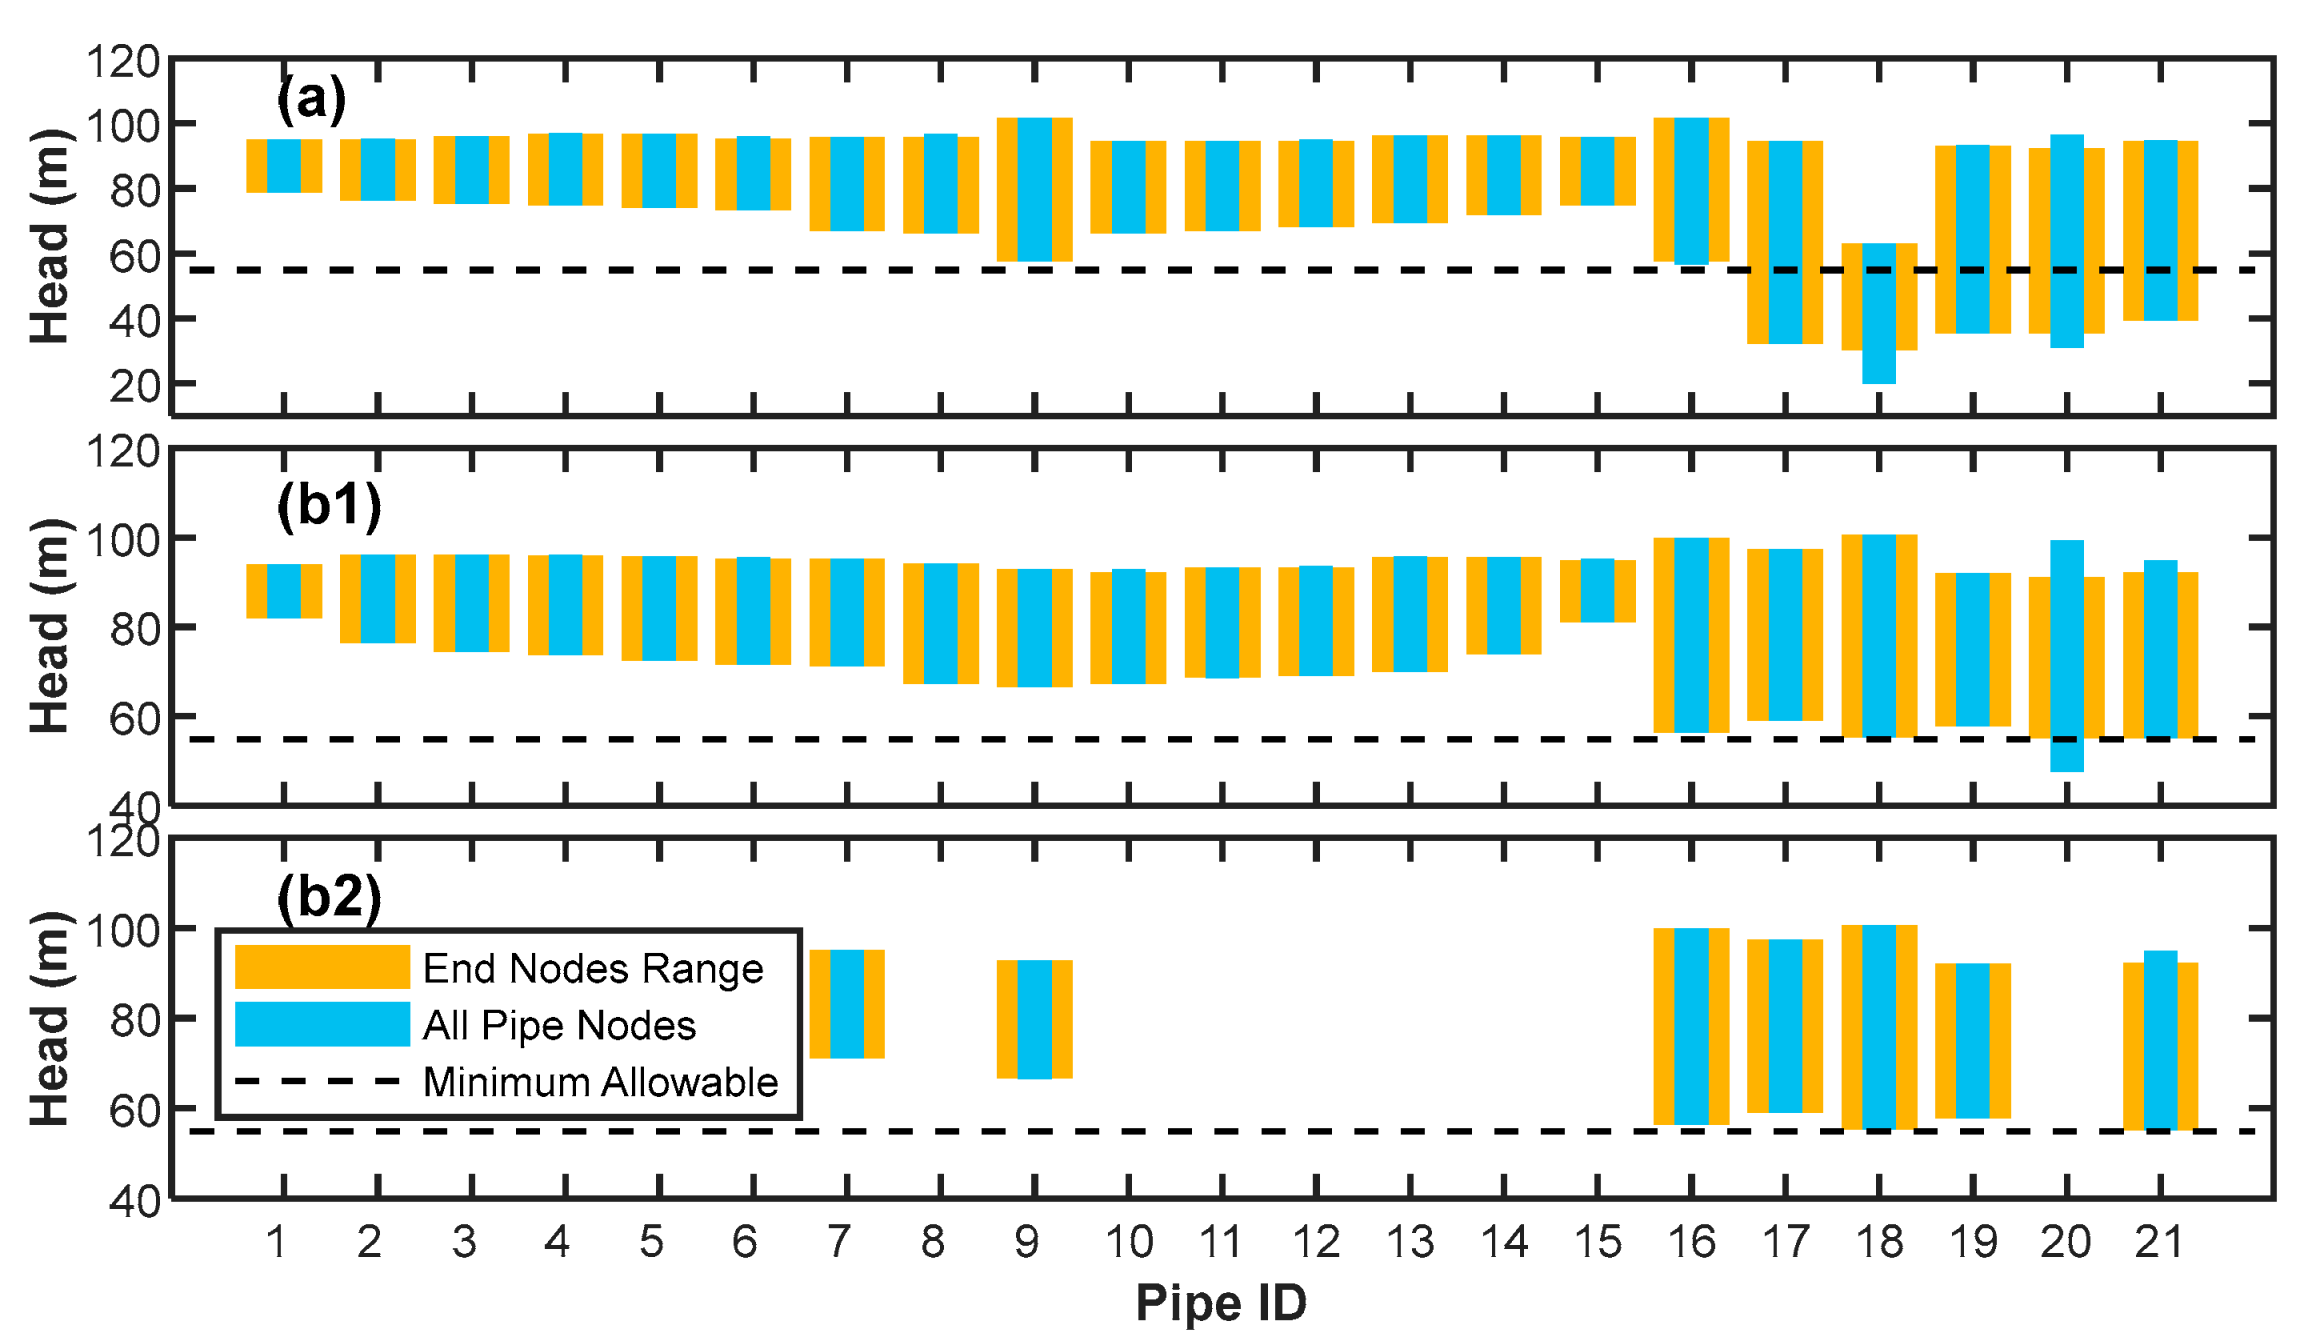
For scenario S1 with sudden demand change at node 10, transient simulations in the optWDN model showed that the pressure heads simulated at internal nodes along a number of pipes were more extreme than at the pipe end nodes for 9 out of 21 pipes (pipes 2, 4, 6, 7, 8, 12, 19, 20, and 21). The minimum pressure head at the internal nodes of the three pipes 16, 18, and 20 was also less than the minimum head at the end nodes of these pipes (Figure 7a) with deviations limited to about 4.45 m except for pipe 18, which connects nodes 18 and 19, where the internal minimum pressure head was 10.4 m lower. Given that pressure heads along pipes may be more extreme than at pipe end nodes, it is important to consider the pressure heads along pipes for transient protection.
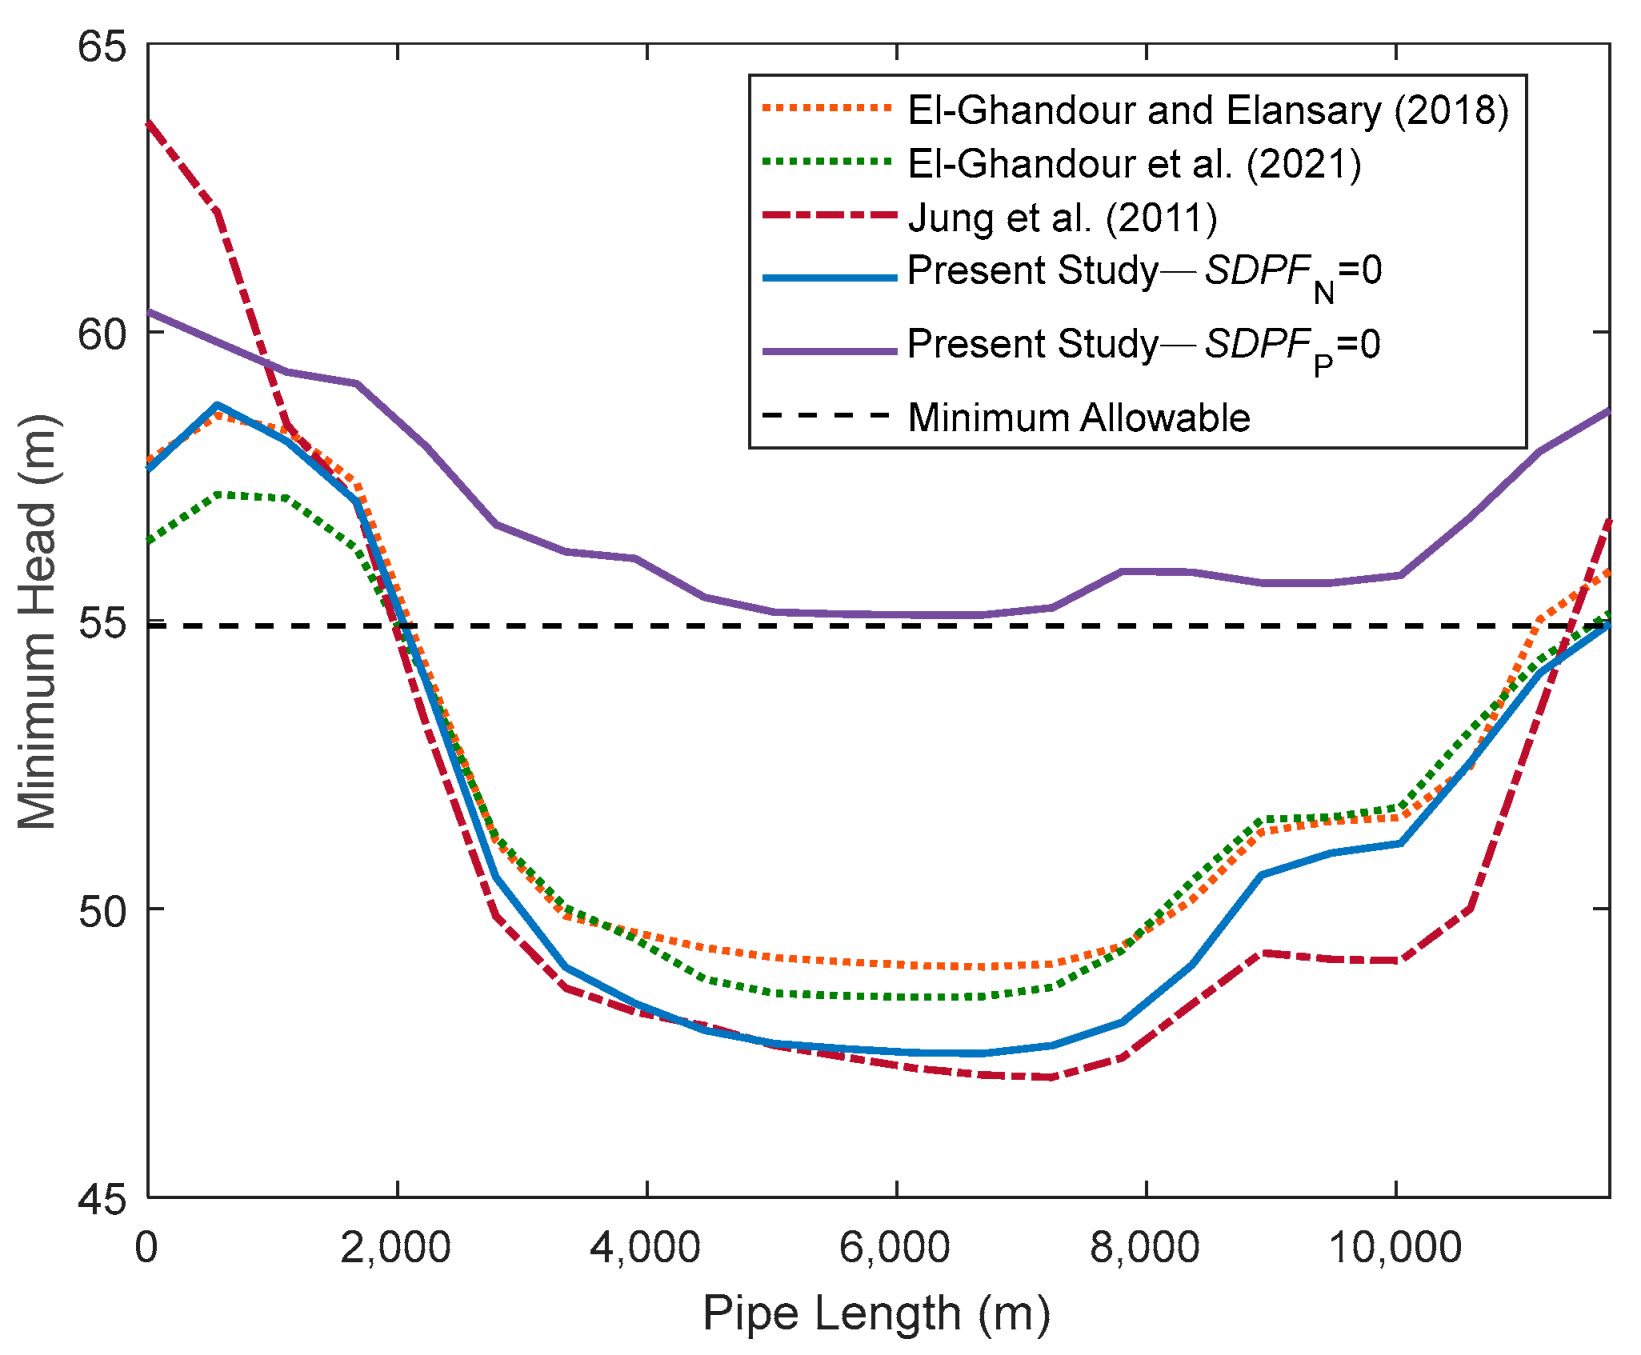
As shown in Figure 7a for the existing pipes of the NYT network, simulated transient pressure heads within pipes 17 to 21 were less than the minimum allowable head. For the set of optimal duplicate pipe diameters identified in Section 4.2 with S D P F N = 0 , the pressure heads at pipe ends satisfied the minimum allowable as expected (Figure 7(b1,b2)). However, the pressure head along pipe 20 dropped below the end-node pressure for this pipe and up to 7.4 m below the minimum allowable head. These results indicate that satisfying the allowable pressure heads at pipe-end nodes does not guarantee that the allowable heads at pipe-internal nodes are also achieved. Indeed, optimal duplicate pipe diameters from Jung et al. [34], El-Ghandour and Elansary [23], and El-Ghandour et al. [25] satisfied the minimum allowable pressure head constraint at the end nodes of pipe 20 but allowed most of the pipe to experience minimum pressures that were lower than the minimum allowable value (Figure 8). Therefore, setting S D P F N = 0 alone is likely insufficient to fully protect WDNs from water hammer events.
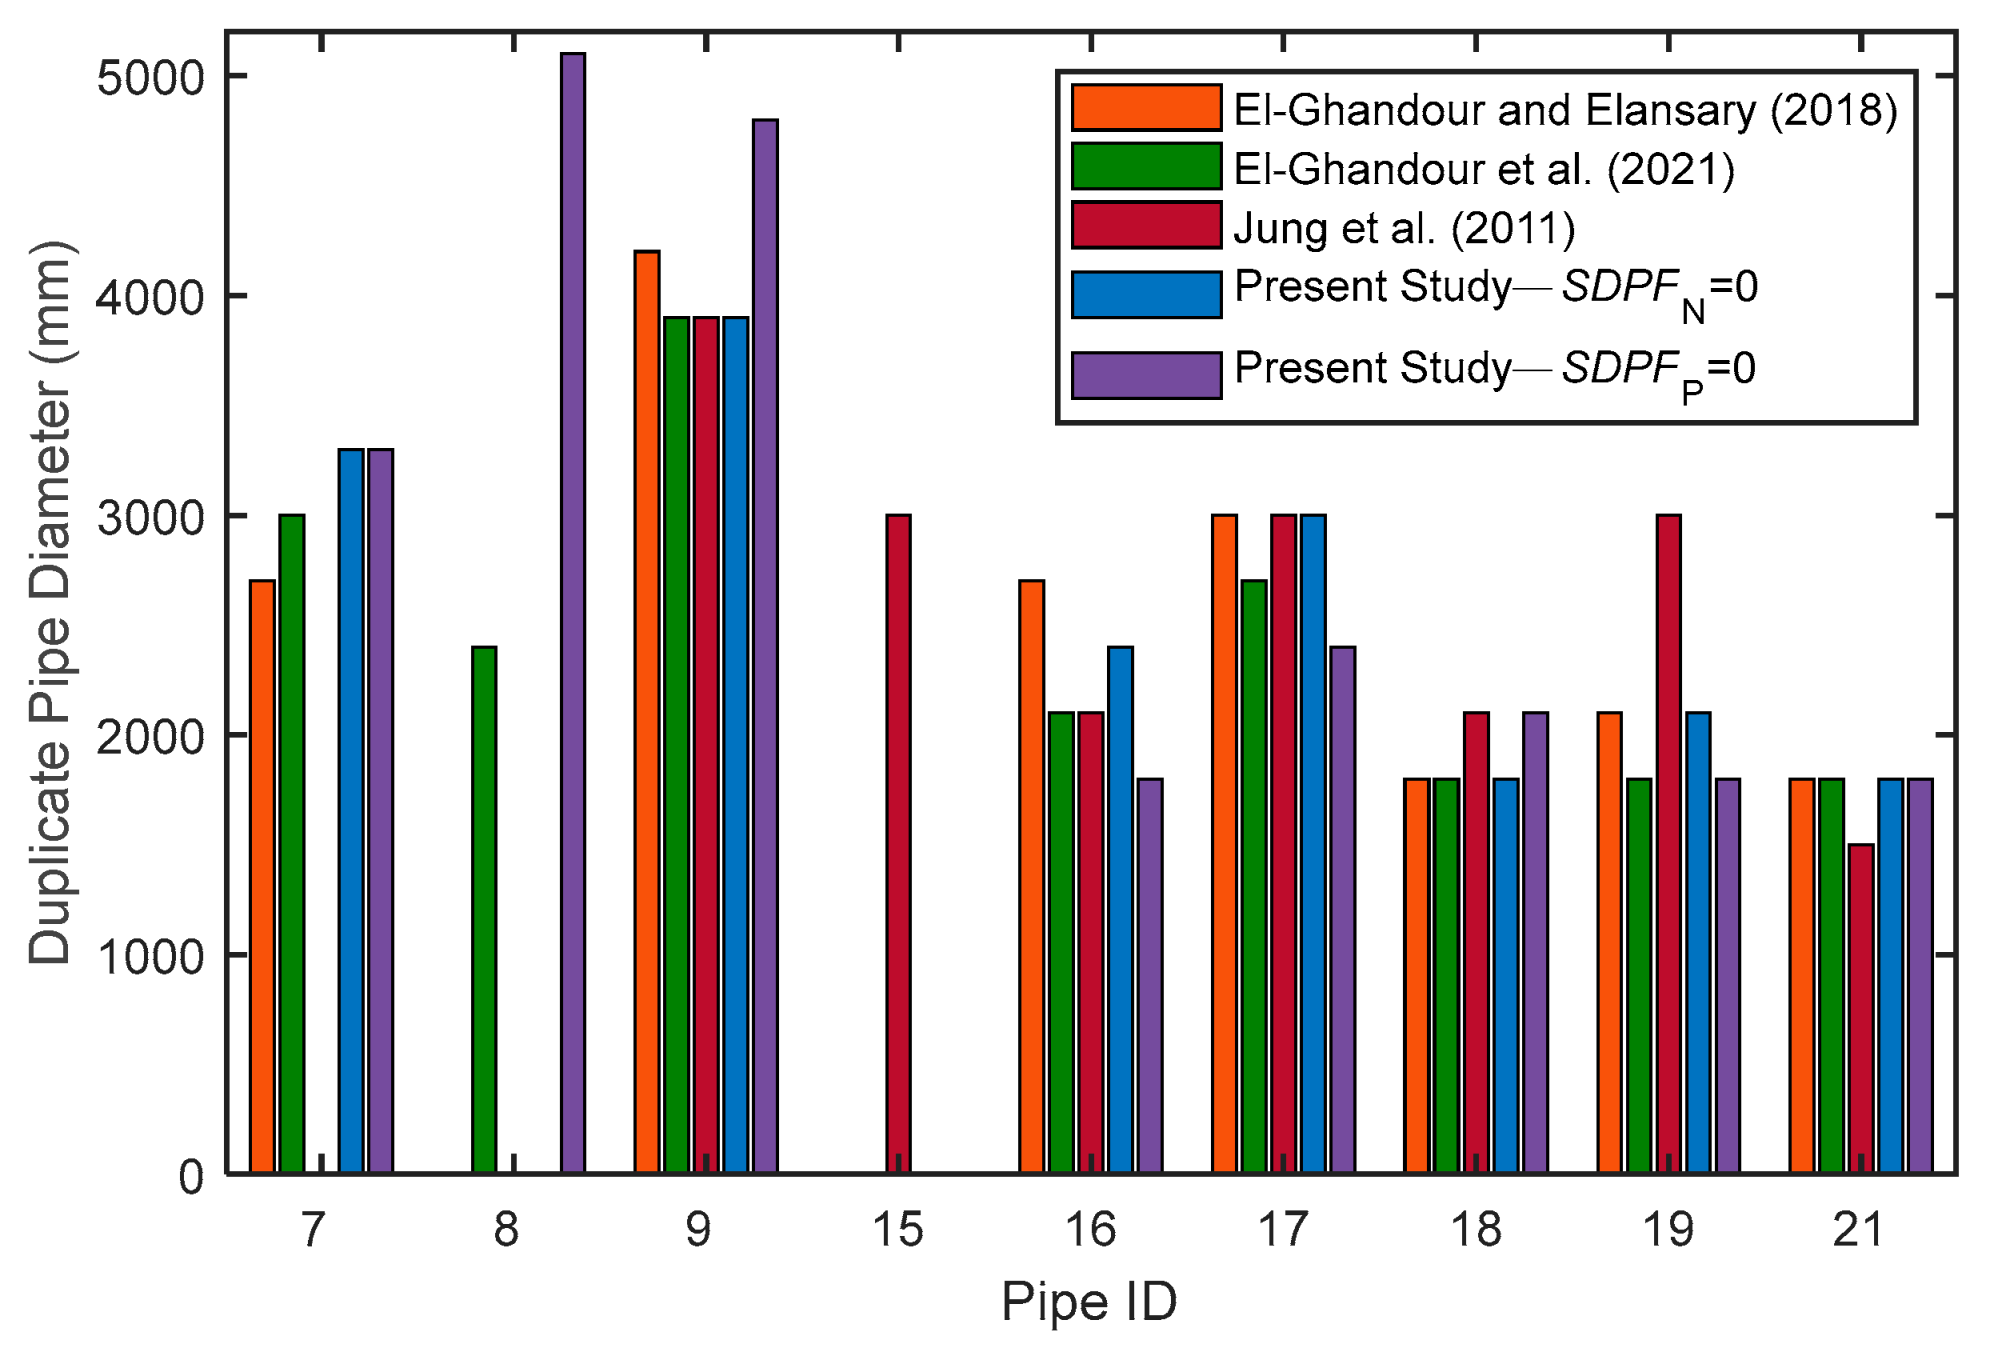
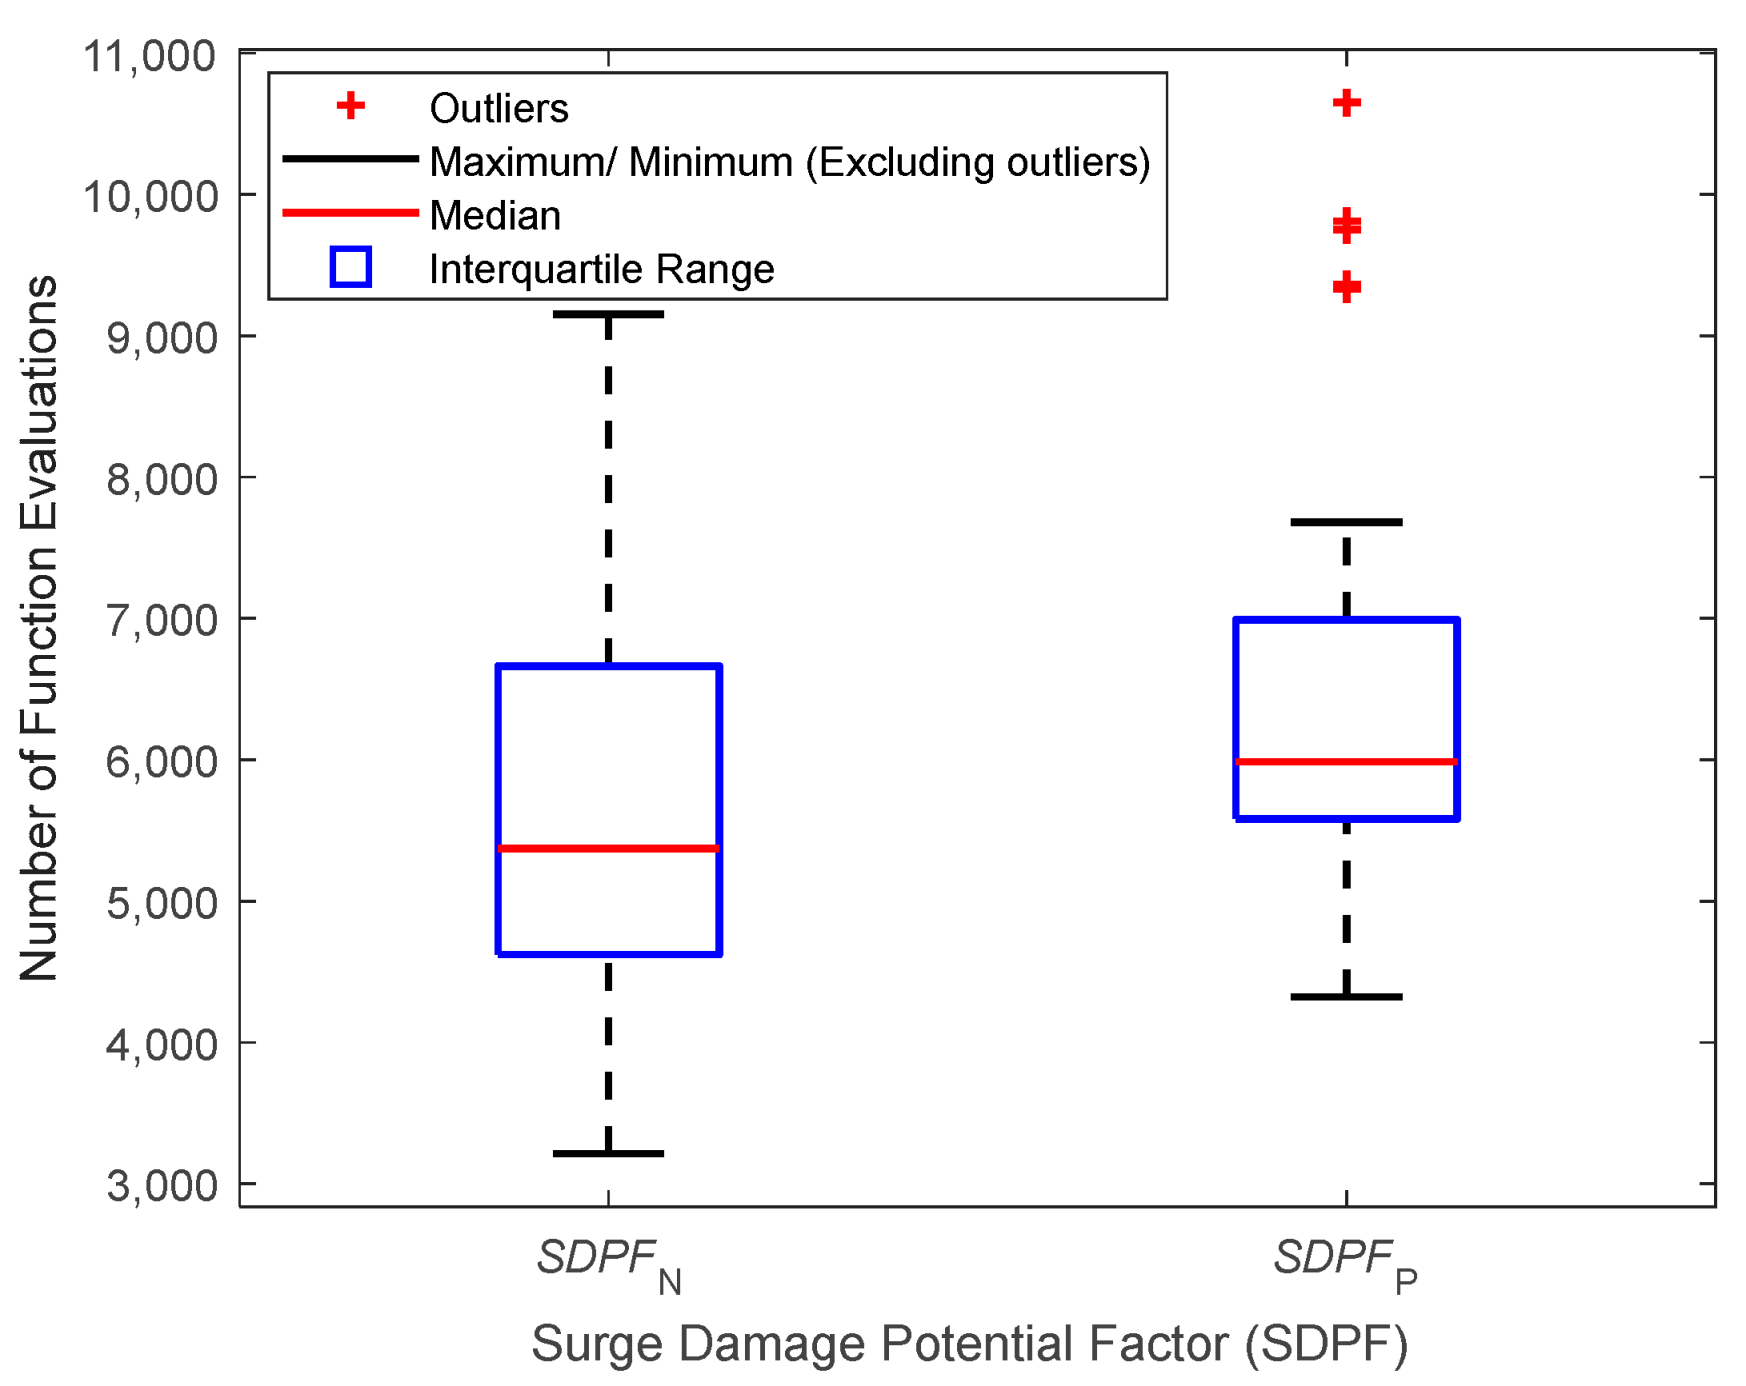
Accordingly, the optWDN model was reapplied to scenario S1 by setting S D P F P = 0 to satisfy the allowable pressure head constraints at all computational nodes along pipes. The optimization module selected duplicate pipes for 8 of 21 existing pipes, similar to the number given by El-Ghandour et al. [25] and higher than those in El-Ghandour and Elansary [23], Jung et al. [34], and the application of S D P F N = 0 in this study, all of which required 7 duplicate pipes. The identified pipes were identical to those by El-Ghandour et al. [25], with mostly similar or higher diameters except for pipes 16 and 17 (Figure 9 and Table A1). The resulting total cost was 52.83 million USD, higher than all previous estimates and 14% greater than S D P F N = 0 solution. The higher cost for S D F P P = 0 was essential to satisfy the transient pressure constraints at all computational nodes along pipes. The optimized duplicate pipe diameters eliminated violations of the minimum allowable pressure along the entire length of pipe 20 (Figure 8). These results indicate that imposing S D P F P = 0 provides optimum duplicate pipe diameters that can fully protect existing WDNs from water hammer effects. The additional computational effort associated with imposing S D P F P = 0 was relatively minor, requiring 15% more function evaluations across 30 runs, with a median increase of 11.5% (Figure 10).

4.5. Optimum Protection for Worst Transient Cases

For scenario S2 with simultaneous sudden demand increase at two nodes, the optWDN model took 8 run cycles to achieve S D P F N = 0 for all 171 possible cases when initialized with the worst transient case (nodes 18 and 19). Within the next two run cycles, the total number of cases with non-zero S D P F N diminished rapidly to 3, but increased to 15 in run cycle 4, before decreasing again to 3 in the next cycle, and then steadily decreased, getting to zero by the end of cycle 8 (Table 2 and Figure 11). A similar pattern was observed for the maximum S D P F N for the selected worst cases in each cycle (Table 3). By the end of run cycle 8, the worst transient cases identified included three cases in which one of the locations for sudden demand change was nodes 16, 17, 19, and 20. Sudden demand changes at nodes 7, 8, 10, and 18 occurred in single cases. Compared to a cost of 103.36 million USD for the duplicate pipe diameters in cycle 8, applying the model over 30 trials with the set of cases from cycle 8 produced a more optimal selection of duplicate pipe diameters with a slightly lower cost of 102.11 million USD.
As a slight modification to the above model application, the first run cycle of the optWDN model accounted for the top 5% (9 out of 171 cases) with the highest S D P F N values as obtained in Section 4.3. An additional worst case was considered in each subsequent run cycle, S D P F N = 0 was achieved in 3 cycles (Table 4 and Figure 12). The last cycle considered 11 worst transient cases and yielded a cost of 114.68 million USD, which was reduced to 102.26 million USD after 30 GA trials, only 0.15% higher than the cost from the single initial worst-case alternative. Although the alternative initialized with 9 cases accounted for a total of 30 cases over all run cycles compared to 36 cases for the earlier alternative with a single initial worst case, the single initial case alternative resulted in a shorter overall run time as well as fewer final worst cases, enabling a slightly lower cost solution.
The final optimal diameters with a cost of 102.11 million USD gave S D P F N = 0 for all possible transient cases under scenario S2, indicating that the model results satisfied the allowable pressure head constraints at all pipe end nodes. As an example, the pressure heads simulated at nodes 17 and 18 due to the worst transient case at nodes 18 and 19 varied between 55.0 and 105.0 m, similar to previous studies (Figure 13). Simulations for another worst transient case at nodes 17 and 20 ensured that the identified final duplicate pipes satisfied the allowable pressure heads at all the network nodes for all 171 cases (total S D P F N equal zero). The pressure heads simulated based on the final optimum diameters varied between 55.0 and 105.0 m, similar to previous studies (Figure 13).
For comparison, the OptWDN model was applied to the optimum pipe diameters identified by Jung [18] under the same transient case. While the resulting transient head at node 18 satisfied the allowable transient head constraints, the allowable minimum head constraint was violated at node 17 (Figure 13). Overall, 66 transient cases had non-zero S D P F N , indicating that the optimum pipe diameters based only on a single worst transient case, as given by Jung [18], were insufficient to satisfy all other transient cases.
The above results correspond to S D P F N = 0 . However, as concluded in the previous section, this condition does not guarantee that pressure head constraints are satisfied along the full pipe length. Accordingly, the optWDN model was applied for scenario S2 to achieve zero S D P F P for all 171 possible cases. First, the WTC module identified the initial worst transient case with the highest S D P F P value. Similar to the result of S D P F N = 0 , nodes 18 and 19 were identified as the initial worst transient cases for simultaneous sudden demand increase. The calculated S D P F P was 80.22 × 10 4 m-s for the worst transient case, which is higher compared to the S D P F N of 8.04 × 10 4 m-s calculated earlier.
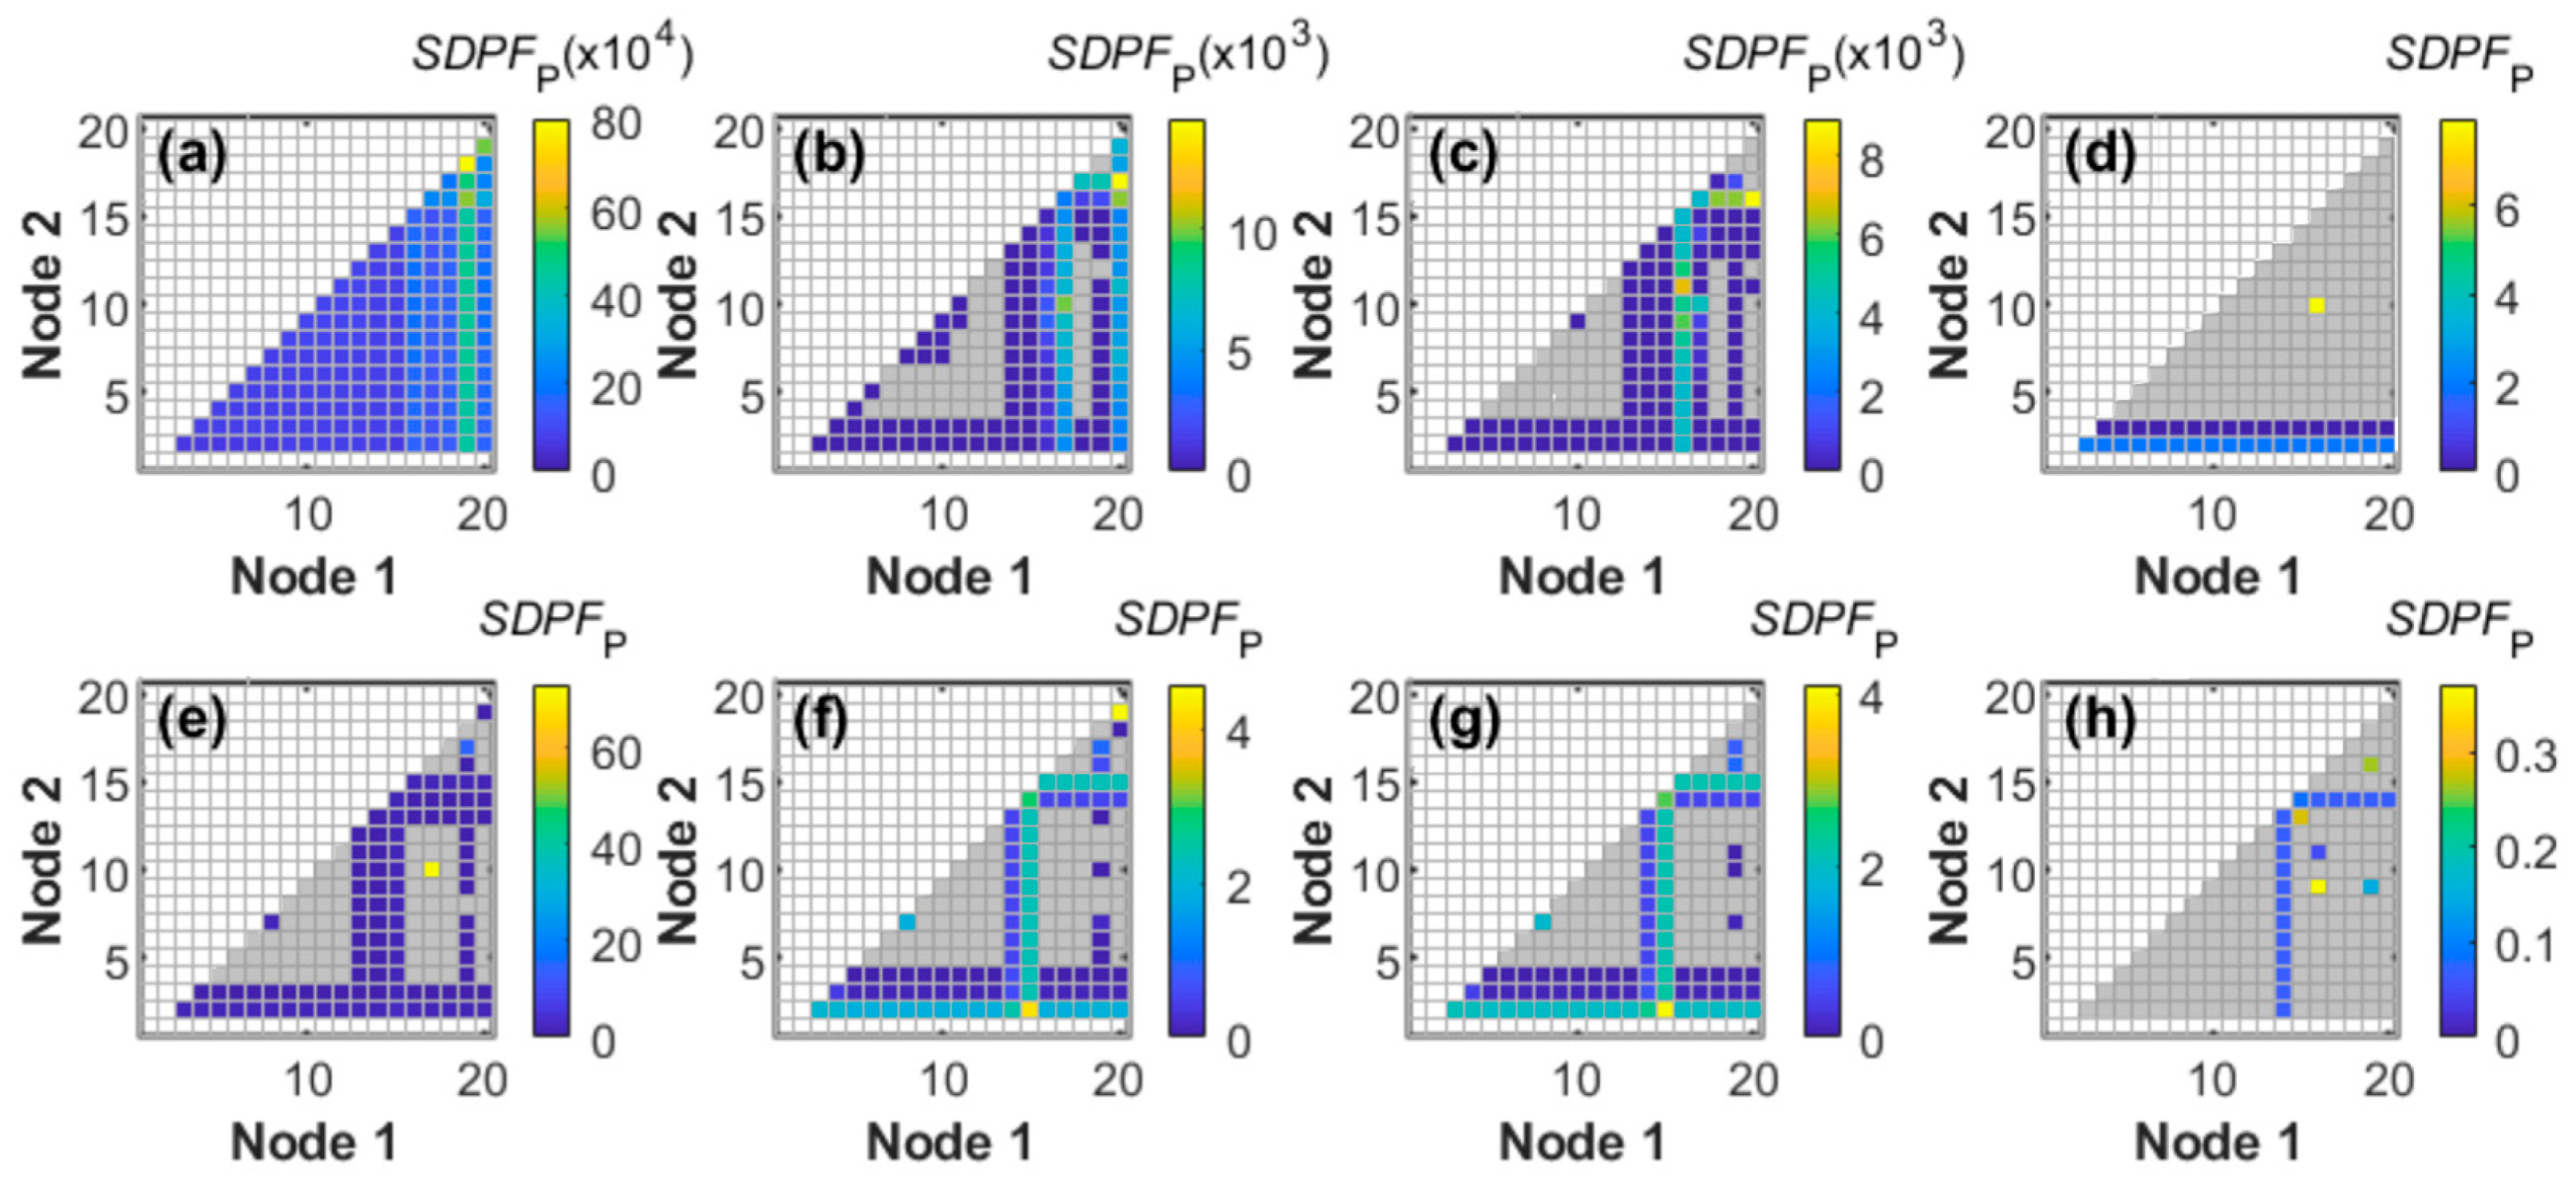
Achieving S D P F P = 0 required 8 run cycles, similar to the results for S D P F N = 0 . However, only 5 out of the total 8 worst transient cases were similar to the results for S D P F N = 0 (Table 5 and Figure 14). By the end of run cycle 8, the worst transient cases included three cases in which one of the locations for sudden demand change was nodes 16, 19, and 20. Sudden demand changes at nodes 10 and 17 occurred in two cases, while each of nodes 2, 15, and 18 occurred in a single case. Compared to a cost of 138.54 million USD for the duplicate pipe diameters in cycle 8, applying GA over 30 trials with the set of cases from cycle 8 produced a lower cost of 124.38 million USD. While this total cost was 22% higher than for S D P F N = 0 , the increase was necessary to achieve S D P F P = 0 and satisfy the allowable minimum and maximum pressure constraints along all pipes.
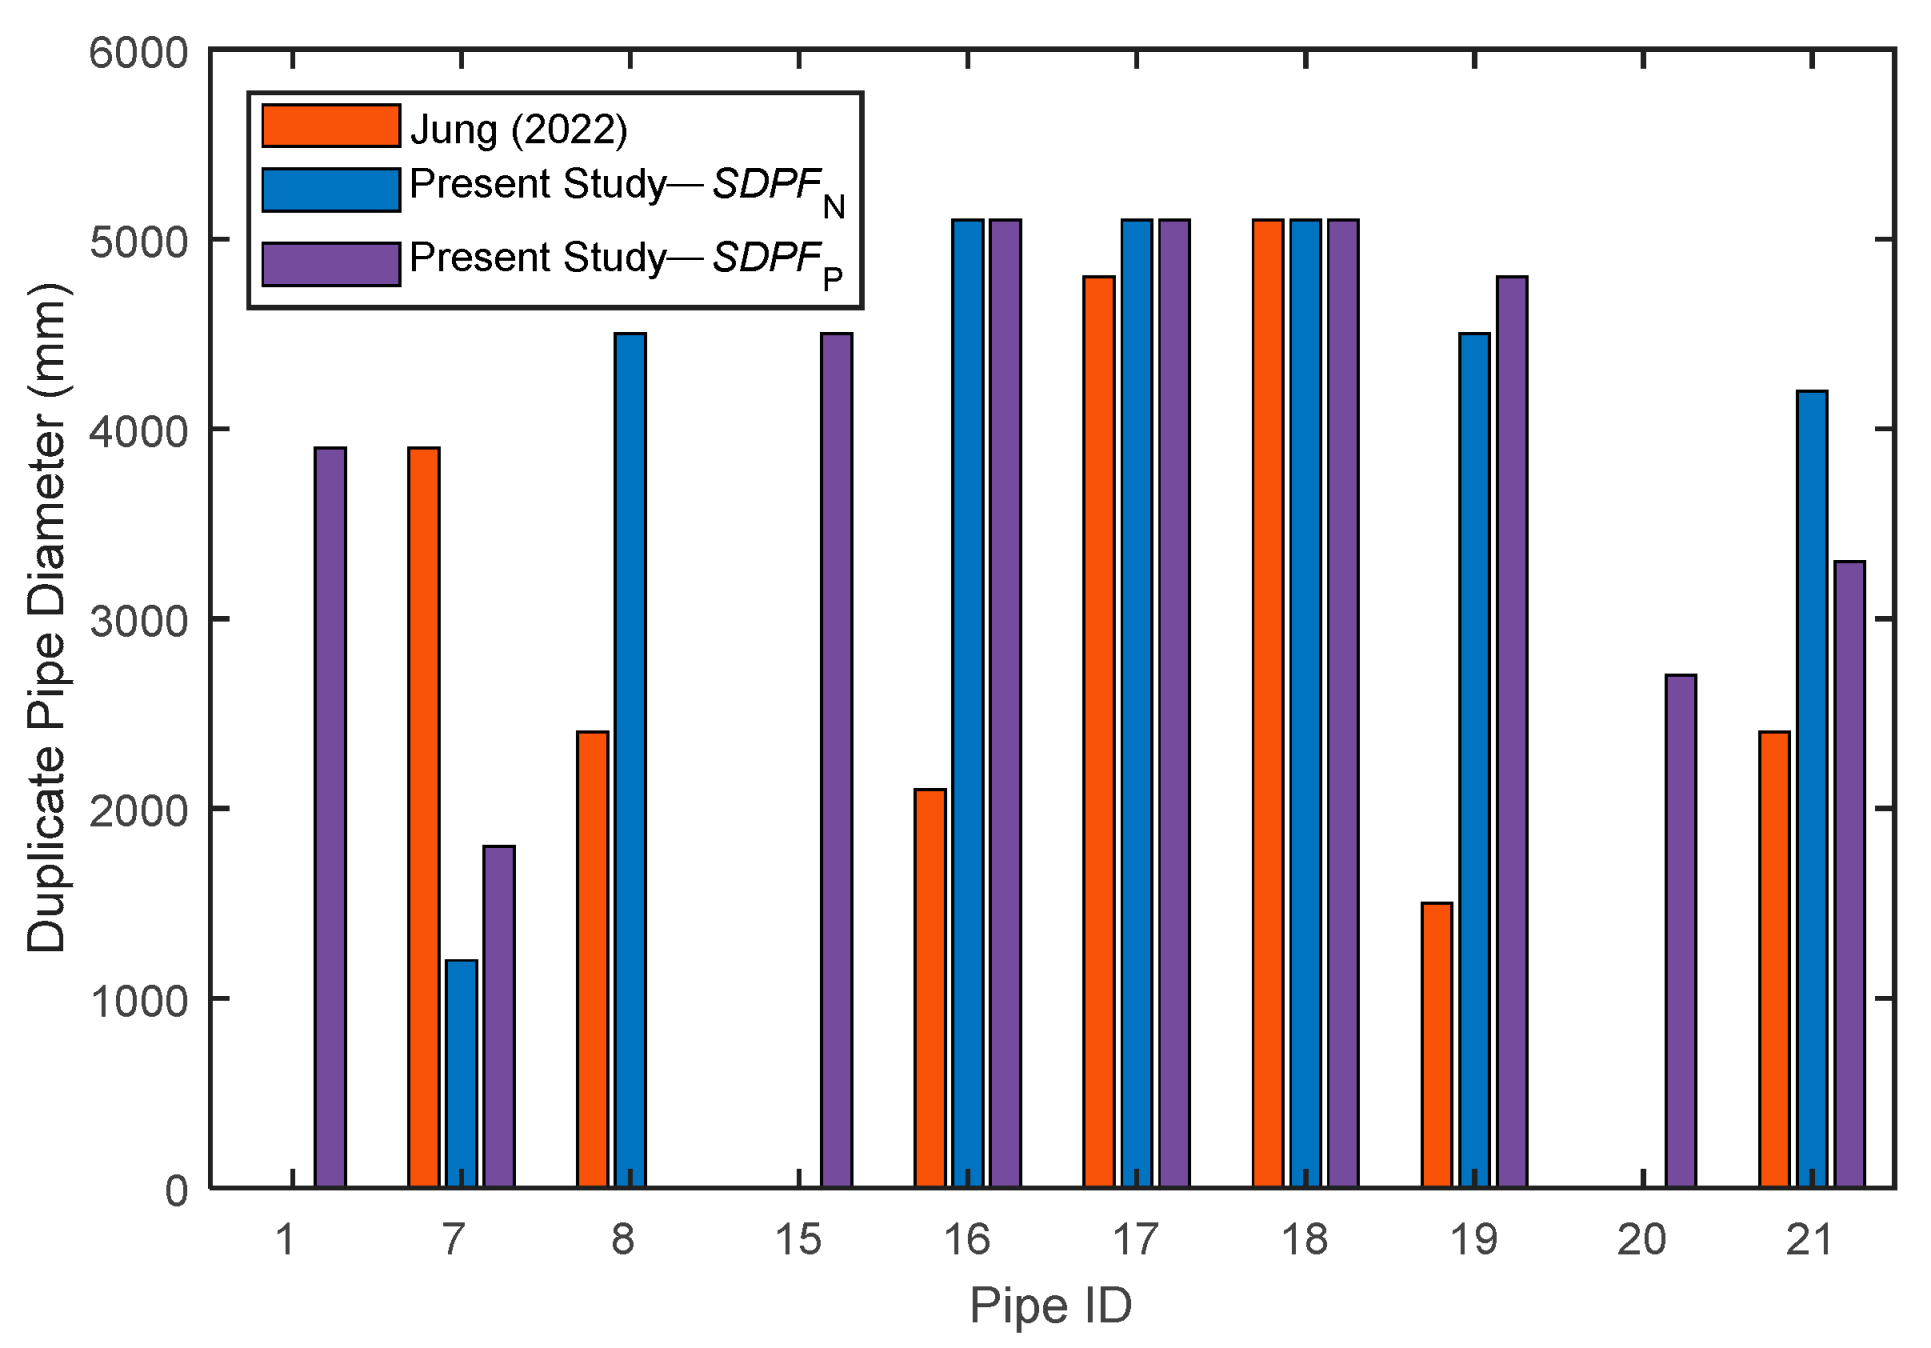
The final optimum duplicate pipe diameters identified by the optWDN model to achieve an S D P F N = 0 included 7 duplicate pipes out of 21 existing pipes, similar to the number in Jung [18], with similar or higher diameters except for pipe 7 (Figure 15 and Table A2). The total cost was 102.11 million USD, higher by 46% than the 70 million USD cost reported by Jung [18] to satisfy all 171 cases.
For S D P F P = 0 , the final optimum results included 9 duplicate pipes higher than the number in Jung [18], with lower or similar diameters except for pipes 1, 15, 19, and 20 (Figure 15 and Table A2). The total cost was 122.24 million USD, 74% higher than Jung [18] and 22% higher than the cost with S D P F N = 0 in this present study. This higher cost satisfied the allowable minimum and maximum transient conditions at all computational nodes for all 171 cases. In contrast, the set of duplicate pipe diameters given by Jung [18] gave non-zero S D P F P in about 91% of the possible transient cases, confirming again that relying solely on a single worst transient case fails to provide adequate protection.

4.6. Cost Reduction for Surge Protection

Based on unit costs from Equation (9), the total cost for the original pipes in the NYT network amounts to 179.80 million USD. The lowest cost of duplicate pipes for improving network performance under steady-state conditions without surge protection was 38.13 million USD [43], giving a total cost of 217.93 million USD (Table 1). In comparison, the cost for the optimal solution given by the optWDN model, considering both steady-state and transients (with S D P F P = 0 ) was 52.83 million USD for scenario S1 and 122.24 million USD for S2. By subtracting the cost of 38.13 million USD for steady-state service improvement, the incremental cost for protection against transients amounts to 14.70 and 84.11 million USD for scenarios S1 and S2, respectively. These costs represent about 6.7% for S1 and 38.6% for S2 compared to the total cost of 217.93 million USD for steady-state service.
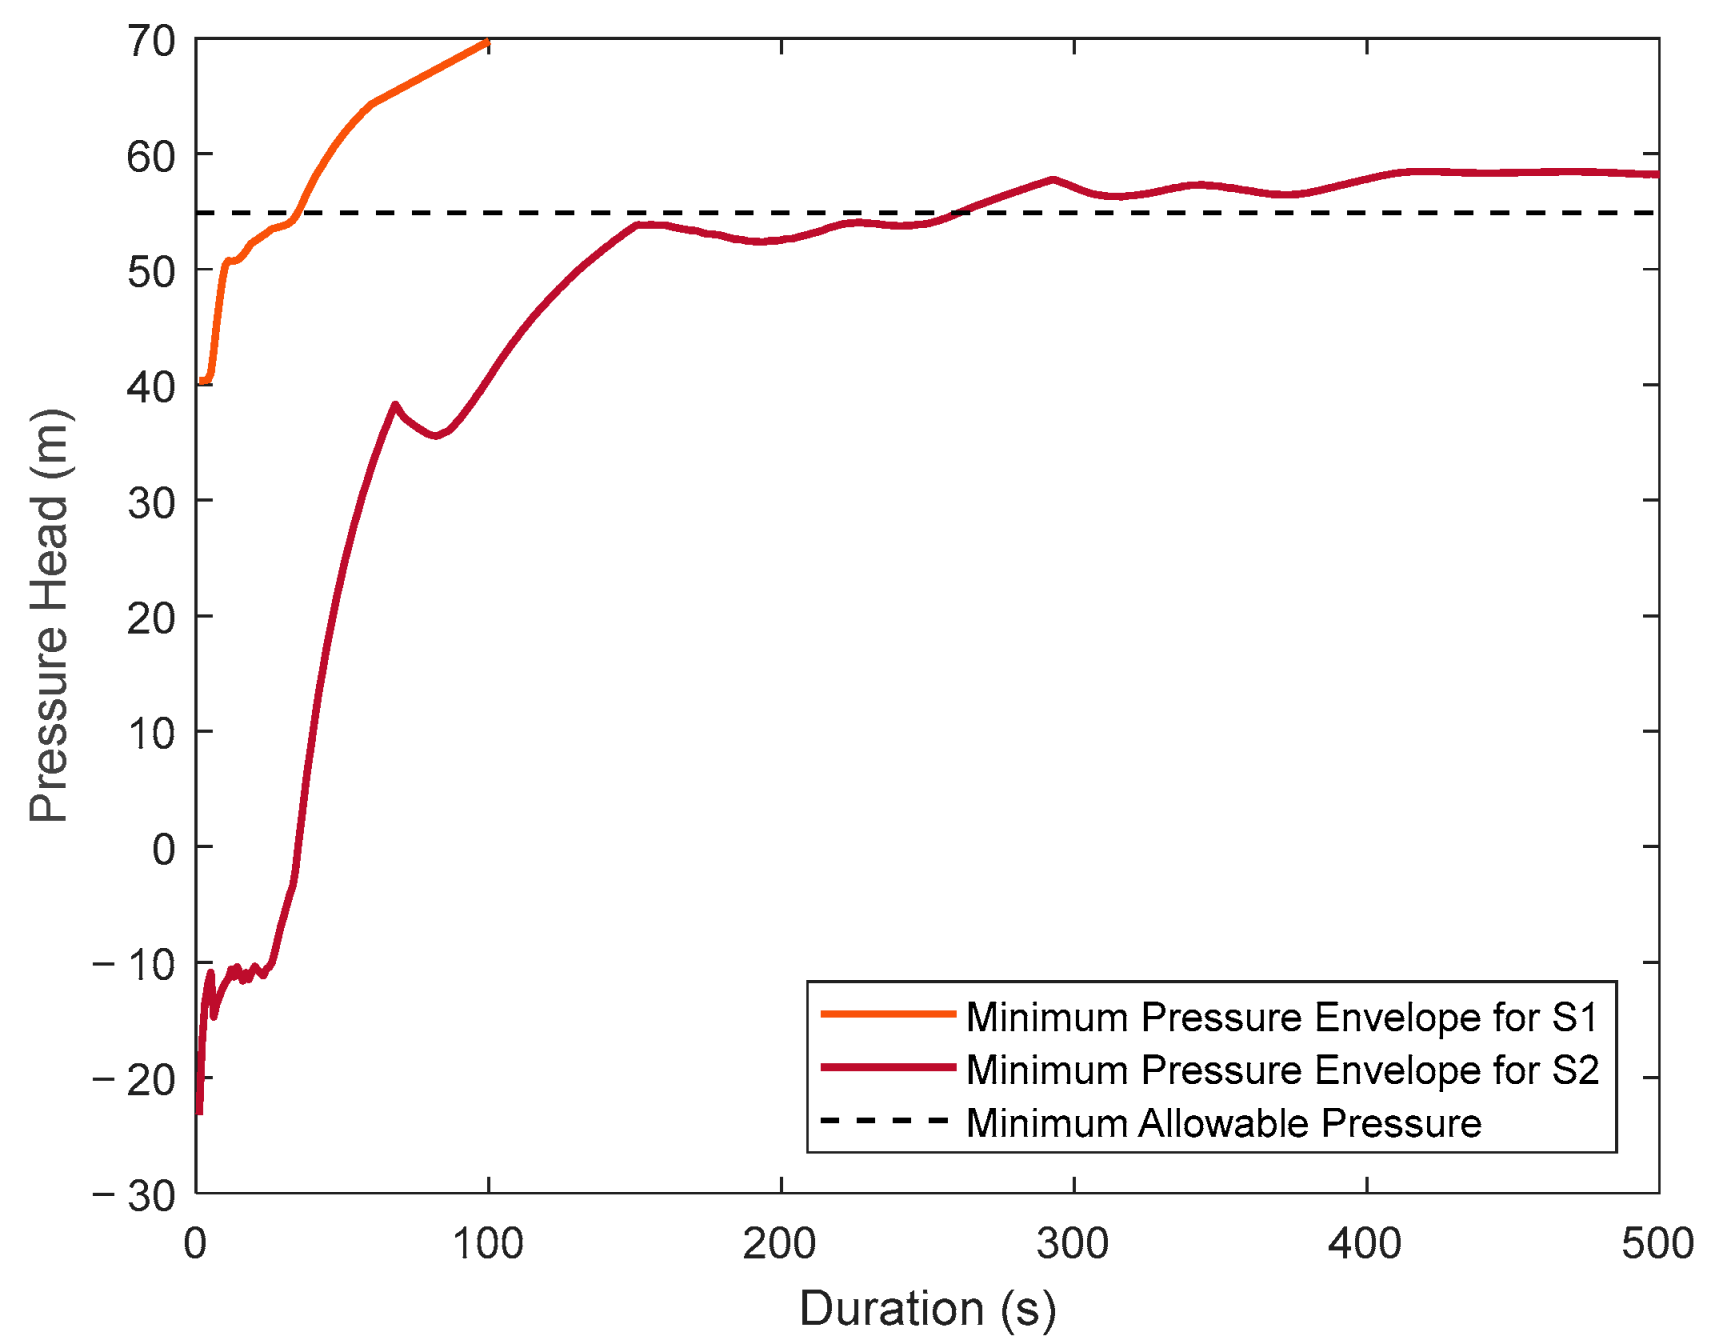
To eliminate these additional costs, the optWDN was used to examine the effect of the duration of demand increase on transient pressures using only the duplicate pipes from Dany et al. [40] and El-Ghandour and Elbeltagi [2] for steady-state service improvement (Figure 16). A minimum duration of 35 s was required to satisfy the transient pressure constraints for scenario S1 with demand change at node 10, and a much longer minimum duration of ~260 s was identified for scenario S2 with simultaneous demand increase at nodes 18 and 19. These durations achieved zero S D P F P values, indicating that the minimum and maximum allowable pressure heads were satisfied over the entire network.
The long duration of 260 s for the demand increase is likely impractical, particularly with the opening of fire hydrants. By slightly relaxing the minimum pressure constraint from 54.9 m to 53.72 m, a shorter duration of 150 s was achieved, though this remains too long for practical application. A more viable solution could be to use a combination of duplicate pipes along with the regulation of the demand increase duration. There are two possible approaches to applying this hybrid solution. In the first approach, the designer selects a feasible duration to be used for regulating the demand increase (e.g., 15 s for operating fire hydrants [36]) and applies the optWDN model to optimize the duplicate pipe diameters needed to satisfy pressure constraints. Alternatively, the pressure envelope versus duration, as shown in Figure 16, can be utilized to select a suitable value for the demand increase duration that minimizes pressure violations or is within relatively flat regions of the envelope curve where slight variations in duration would not cause excessive changes in the corresponding minimum pressure. For example, as indicated by the envelope curve for S2, a duration of about 80 s would cause a minimum simulated pressure of 35.65 m, less by 19.25 m below the 54.9 m limit. Even if the duration control was not completely successful and the duration decreased by ~12% to 70 s, the resulting minimum simulated pressure would not decrease below the allowable threshold.
Aside from the cost savings, controlling demand increases duration, minimizes cyclic pressure fluctuations, and reduces fatigue. As shown in Figure 17, the standard deviation for the pressure head at node 19 over 1000 s amounted to 8.7 m and 3.1 m for the durations of 1 and 261 s, respectively. The nearly threefold decrease in standard deviation for the longer duration clearly demonstrates the reduction in pressure fluctuations through gradual sudden demand.

5. Conclusions

This study developed a comprehensive model, optWDN, to identify the set of worst transient cases instead of relying on a single arbitrarily chosen case as in previous studies. The model achieves efficiency by identifying the set of cases that are most critical instead of accounting for all possible cases. For quantifying violations of pressure constraints, the model relied on the calculation of the Surge Damage Potential Factor (SDPF). Two versions of SDPF were considered: S D P F N , based on the pressure at pipe end nodes (similar to previous studies), and S D P F P , based on pressure at all computational nodes along pipes.
The existing New York Tunnel network was selected as a case study for model validation and for demonstration of model performance. The focus was on identifying the optimal diameters for additional duplicate pipes to achieve higher pressure under steady-state conditions and to protect the network from transients caused by sudden demand increases while minimizing cost. For a sudden demand increase event at a single predefined node, optWDN achieved S D P F N = 0 at a lower cost for duplicate pipes compared to previous studies. However, the corresponding set of optimum duplicate pipe diameters, as well as the optimum diameters from previous studies, were found to be insufficient to fully protect the WDN from transient events. To achieve full protection ( S D P F P = 0 ) , the optWDN model identified a different set of duplicate pipe diameters, resulting in a 14% higher cost and an 11.5% longer computational time.
The optWDN model was also applied to determine the worst transient cases and the corresponding optimum duplicate pipe diameters for a scenario with concurrent sudden demand increase at two nodes. The model reproduced the worst transient case identified by previous studies, considering the highest S D P F N , but also revealed numerous transient cases with very similar high SDPF values, highlighting the importance of considering multiple transient cases when optimizing duplicate pipe diameters. Through an iterative scheme starting with a single worst case and adding a single case per run cycle, the optWDN identified a total of 8 cases that were critical for optimization. This approach was more efficient than starting with a fixed percentage of about 5% (9 cases) of all possible cases. The final set of optimum duplicate pipe diameters was 46% and 74% more costly than previous studies to achieve S D P F N = 0 and S D P F P = 0 , respectively. However, the higher cost given by the optWDN model was crucial to provide full protection; optimum diameters identified by previous studies were inadequate.
The above results were based on a nearly sudden demand increase. Cost savings can be achieved by regulating the duration of the demand increase. Using only steady-state optimized pipes, minimum durations for satisfying the transient pressure constraints were identified as 35 and 261 s for the single and concurrent demand increase scenarios, respectively. For the latter scenario, a slight relaxation of the minimum allowable pressure constraint allows the reduction in the duration to 150 s. Further reduction would require the use of duplicate pipes along with control of the demand increase duration.
Besides demand increase, the optWDN framework can be extended to account for other critical transient events, such as pump failure and valve closure, by identifying the minimum set of worst transient cases necessary to achieve zero SDPF for all possible transient loading cases under different transient events. Additional future improvements could include allowing different surge protection devices, incorporating extended period simulations, employing network skeletonization to effectively manage the complexity of real WDNs, and extending the optimum design of new proposed WDNs.

Author Contributions

Conceptualization, H.M.A.; methodology, software, validation, formal analysis, investigation, data curation, writing—original draft preparation, H.M.A. and Y.E.I.; writing—review and editing, supervision, Y.E.I., H.A.E.-G. and A.S.E. All authors have read and agreed to the published version of the manuscript.

Funding

This research received no external funding.

Data Availability Statement

All the data used in this study are available upon request.

Conflicts of Interest

The authors declare that they have no conflicts of interest.

Appendix A

Table A1. Optimized diameters (mm) for duplicate pipes with total cost identified by the present studies as well as by Jung et al. [34] for scenario S1.
Pipe IDJung et al. [34] Present   Study   with   S D P F N = 0 Present   Study   with   S D P F P = 0
7-33003300
8--5100
9390039004800
153000--
16210024001800
17300030002400
18210018002100
19300021001800
21150018001800
Total optimized pipe
Cost (million USD)
49.146.3752.83
Table A2. Optimized diameters (mm) for duplicate pipes with total cost identified by the present study as well as by Jung [18] for scenario S2.
Pipe IDJung [18] Present   Study   with   S D P F N = 0 Present   Study   with   S D P F P = 0
1--3900
7390012001800
824004500-
15--4500
16210051005100
17480051005100
18510051005100
19150045004800
20--2700
21240042003300
Total optimized pipe Cost (million USD)70102.11122.24

References

  1. Zhou, X.; Gao, D.Y.; Simpson, A.R. Optimal design of water distribution networks by a discrete state transition algorithm. Eng. Optim. 2016, 48, 603–628. [Google Scholar] [CrossRef]
  2. El-Ghandour, H.A.; Elbeltagi, E. Comparison of five evolutionary algorithms for optimization of water distribution networks. J. Comput. Civ. Eng. 2018, 32, 04017066. [Google Scholar] [CrossRef]
  3. Maier, H.R.; Simpson, A.R.; Zecchin, A.C.; Foong, W.K.; Phang, K.Y.; Seah, H.Y.; Tan, C.L. Ant colony optimization for design of water distribution systems. J. Water Resour. Plan. Manag. 2003, 129, 200–209. [Google Scholar] [CrossRef]
  4. Zecchin, A.C.; Simpson, A.R.; Maier, H.R.; Nixon, J.B. Parametric study for an ant algorithm applied to water distribution system optimization. IEEE Trans. Evol. Comput. 2005, 9, 175–191. [Google Scholar] [CrossRef]
  5. Zecchin, A.C.; Maier, H.R.; Simpson, A.R.; Leonard, M.; Nixon, J.B. Ant colony optimization applied to water distribution system design: Comparative study of five algorithms. J. Water Resour. Plan. Manag. 2007, 133, 87–92. [Google Scholar] [CrossRef]
  6. Mehdi, D.; Massoud, T. Optimal renovation planning of water distribution networks considering hydraulic and quality reliability indices. Urban Water J. 2019, 16, 249–258. [Google Scholar]
  7. Babu, K.J.; Vijayalakshmi, D.P. Self-adaptive PSO-GA hybrid model for combinatrial water distribution network design. J. Pipeline Syst. Eng. Pract. 2013, 4, 57–67. [Google Scholar] [CrossRef]
  8. Ezzeldin, R.M.; Djebedjian, B.; Saafan, T. Integer discrete particle swarm optimization of water distribution networks. J. Pipeline Syst. Eng. Pract. 2014, 5, 04013013. [Google Scholar] [CrossRef]
  9. Surco, D.F.; Vecchi, T.P.; Ravagnani, M.A. Optimization of water distribution networks using a modified particle swarm optimization algorithm. Water Sci. Technol. Water Supply 2018, 18, 660–678. [Google Scholar] [CrossRef]
  10. Ezzeldin, R.M.; Djebedjian, B. Optimal design of water distribution networks using whale optimization algorithm. Urban Water J. 2020, 17, 14–22. [Google Scholar] [CrossRef]
  11. Vasan, A.; Simonovic, S.P. Optimization of water distribution network design using differential evolution. J. Water Resour. Plan. Manag. 2010, 136, 279–287. [Google Scholar] [CrossRef]
  12. Mansouri, R.; Torabi, H.; Hoseini, M.; Morshedzadeh, H. Optimization of the water distribution networks with differential evolution (DE) and mixed integer linear programming (MILP). J. Water Resour. Prot. 2015, 7, 715. [Google Scholar] [CrossRef]
  13. Yazdi, J.; Choi, Y.H.; Kim, J.H. Non-dominated sorting harmony search differential evolution (NS-HS-DE): A hybrid algorithm for multi-objective design of water distribution networks. Water 2017, 9, 587. [Google Scholar] [CrossRef]
  14. Jung, B.S.; Karney, B.W. Revisiting Transient Optimization of Water Supply Systems. In Proceedings of the 38th IAHR World Congress Panama, Panama City, Panama, 1–6 September 2019. [Google Scholar]
  15. El-Ghandour, H.A.; Elansary, A.S. Optimal selection of pressure relief valve parameters for surge pressure control in water distribution systems. Urban Water J. 2019, 16, 269–276. [Google Scholar] [CrossRef]
  16. Kim, H.; Kim, S. Optimization of pressure relief valve for pipeline system under transient induced cavitation condition. Urban Water J. 2019, 16, 718–726. [Google Scholar] [CrossRef]
  17. Huang, Y.; Zheng, F.; Duan, H.F.; Zhang, Q. Multi-objective optimal design of water distribution networks accounting for transient impacts. Water Resour. Manag. 2020, 34, 1517–1534. [Google Scholar] [CrossRef]
  18. Jung, B.S. Water Distribution System Optimization Accounting for Worst-Case Transient Loadings. J. Environ. Inform. Lett. 2022, 7, 20–29. [Google Scholar] [CrossRef]
  19. Sangroula, U.; Han, K.H.; Koo, K.M.; Gnawali, K.; Yum, K.T. Optimization of water distribution networks using genetic algorithm based SOP–WDN program. Water 2022, 14, 851. [Google Scholar] [CrossRef]
  20. Ghobadian, R.; Mohammadi, K. Optimal design and cost analysis of water distribution networks based on pressure-dependent leakage using NSGA-II. Appl. Water Sci. 2023, 13, 92. [Google Scholar] [CrossRef]
  21. Naidu, M.N.; Vasan, A.; Varma, M.R.; Patil, M.B. Multiobjective design of water distribution networks using modified NSGA-II algorithm. Water Supply 2023, 23, 1220–1233. [Google Scholar] [CrossRef]
  22. Djebedjian, B.; Mohamed, M.S.; Mondy, A.G.; Rayan, M.A. Cost optimization of water distribution systems subjected to water hammer. In Proceedings of the Thirteenth International Water Technology Conference, Hurghada, Egypt, 12–15 March 2009; pp. 491–513. [Google Scholar]
  23. El-Ghandour, H.A.; Elansary, A.S. Optimal transient network rehabilitation using multi-objective ant colony optimization algorithm. Urban Water J. 2018, 15, 645–653. [Google Scholar] [CrossRef]
  24. Jung, B.S.; Karney, B.W. Pipeline Optimization Accounting For Transient Conditions: Exploring The Connections Between System Configuration, Operation, And Surge Protection. In Proceedings of the World Environmental and Water Resources Congress 2013: Showcasing the Future, Cincinnati, OH, USA, 19–23 May 2013; pp. 903–912. [Google Scholar]
  25. El-Ghandour, H.A.; Elabd, S.M.; Elbeltagi, E. Assessment of optimal water distribution systems design under steady-state and transient conditions due to pipe roughness uncertainty. Ain Shams Eng. J. 2021, 12, 465–473. [Google Scholar] [CrossRef]
  26. Jung, B.S.; Karney, B.W. Hydraulic optimization of transient protection devices using GA and PSO approaches. Water Resour. Plan. Manag. 2006, 132, 44–52. [Google Scholar] [CrossRef]
  27. Jung, B.S.; Karney, B.W. Systematic surge protection for worst-case transient loadings in water distribution systems. J. Hydraul. Eng. 2009, 135, 218–223. [Google Scholar] [CrossRef]
  28. Skulovich, O.; Bent, R.; Judi, D.; Perelman, L.S.; Ostfeld, A. Piece-wise mixed integer programming for optimal sizing of surge control devices in water distribution systems. Water Resour. Res. 2015, 51, 4391–4408. [Google Scholar] [CrossRef]
  29. Skulovich, O.; Perelman, L.; Ostfeld, A. Modeling and optimizing hydraulic transients in water distribution systems. Procedia Eng. 2014, 70, 1558–1565. [Google Scholar] [CrossRef]
  30. Skulovich, O.; Perelman, L.; Ostfeld, A. Optimal closure of system actuators for transient control: An analytical approach. J. Hydroinform. 2016, 18, 393–408. [Google Scholar] [CrossRef]
  31. Bohorquez, J.; Saldarriaga, J. Valve operation optimization for minimizing transient flow effects in water distribution systems (WDS): Application to main pipes in Bogota, Colombia. In Proceedings of the World Environmental and Water Resources Congress, Austin, TX, USA, 17–21 May 2015; pp. 890–901. [Google Scholar]
  32. Carvajal, J.D.; Bohorquez, J. Estimation of Marginal Time in Water Distribution Systems for Valve Closure Considering Transient Flow Effects: (149). In Proceedings of the WDSA/CCWI Joint Conference Proceedings, Kingston, ON, Canada, 23–25 July 2018; Volume 1. [Google Scholar]
  33. Jung, B.S.; Karney, B.W. Fluid transients and pipeline optimization using GA and PSO: The diameter connection. Urban Water J. 2004, 1, 167–176. [Google Scholar] [CrossRef]
  34. Jung, B.S.; Boulos, P.F.; Altman, T. Optimal transient network design: A multi-objective approach. J. Am. Water Work. Ass. 2011, 103, 118–127. [Google Scholar] [CrossRef]
  35. Walski, T.M. Not So Fast!: Close Hydrants Slowly. Opflow 2009, 35, 14–16. [Google Scholar] [CrossRef]
  36. Lingireddy, S.; Ormsbee, L.E.; Kamojjala, S.; Hall, A.M. How Slow Is Slow? Managing Fire Hydrant Operation for Protecting Water Infrastructure. AWWA Water Sci. 2022, 4, e1290. [Google Scholar] [CrossRef]
  37. Rossman, L.A. EPANET 2: Users Manual; United States Environmental Protection Agency: Washington, DC, USA, 2000. [Google Scholar]
  38. Larock, B.E.; Jeppson, R.W.; Watters, G.Z. Hydraulics of Pipeline Systems; CRC Press: Boca Raton, FL, USA, 1999. [Google Scholar]
  39. Wylie, E.B.; Streeter, V.L. Fluid Transients in Systems; Prentice Hall: Englewood Cliffs, NJ, USA, 1993. [Google Scholar]
  40. Chaudhry, M.H. Applied Hydraulic Transients New York; Springer: Berlin/Heidelberg, Germany, 2014; Volume 415, pp. 31–42. [Google Scholar]
  41. Xing, L.; Sela, L. Transient simulations in water distribution networks: TSNet python package. Adv. Eng. Softw. 2020, 149, 102884. [Google Scholar] [CrossRef]
  42. Dandy, G.C.; Simpson, A.R.; Murphy, L.J. An improved genetic algorithm for pipe network optimization. Water Resour. Res. 1996, 32, 449–458. [Google Scholar] [CrossRef]
  43. Eusuff, M.M.; Lansey, K.E. Optimization of water distribution network design using the shuffled frog leaping algorithm. J. Water Resour. Plan. Manag. 2003, 129, 210–225. [Google Scholar] [CrossRef]
  44. Yazdi, J.; Hokmabadi, A.; JaliliGhazizadeh, M.R. Optimal Size and Placement of Water Hammer Protective Devices in Water Conveyance Pipelines. Water Resour. Manag. 2019, 33, 569–590. [Google Scholar] [CrossRef]
  45. Lee, J.S.; Zeng, W.; Lambert, M.; Hilditch, T.; Gong, J. Fatigue analysis of metallic-plastic-metallic pipeline systems: A numerical study. Results Eng. 2023, 17, 100986. [Google Scholar] [CrossRef]
  46. Jara-Arriagada, C.; Stoianov, I. Pressure-induced fatigue failures in cast iron water supply pipes. Eng. Fail. Anal. 2024, 155, 107731. [Google Scholar] [CrossRef]
  47. Konstantinou, C.; Jara-Arriagada, C.; Stoianov, I. Investigating the impact of cumulative pressure-induced stress on machine learning models for pipe breaks. Water Resour. Manag. 2024, 38, 603–619. [Google Scholar] [CrossRef]
  48. Rao, S.S. Reliability-Based Design; McGraw-Hill: New York, NY, USA, 1992. [Google Scholar]
  49. McCuen, R.H.; Knight, Z.; Cutter, A.G. Evaluation of the Nash–Sutcliffe efficiency index. J. Hydrol. Eng. 2006, 11, 597–602. [Google Scholar] [CrossRef]
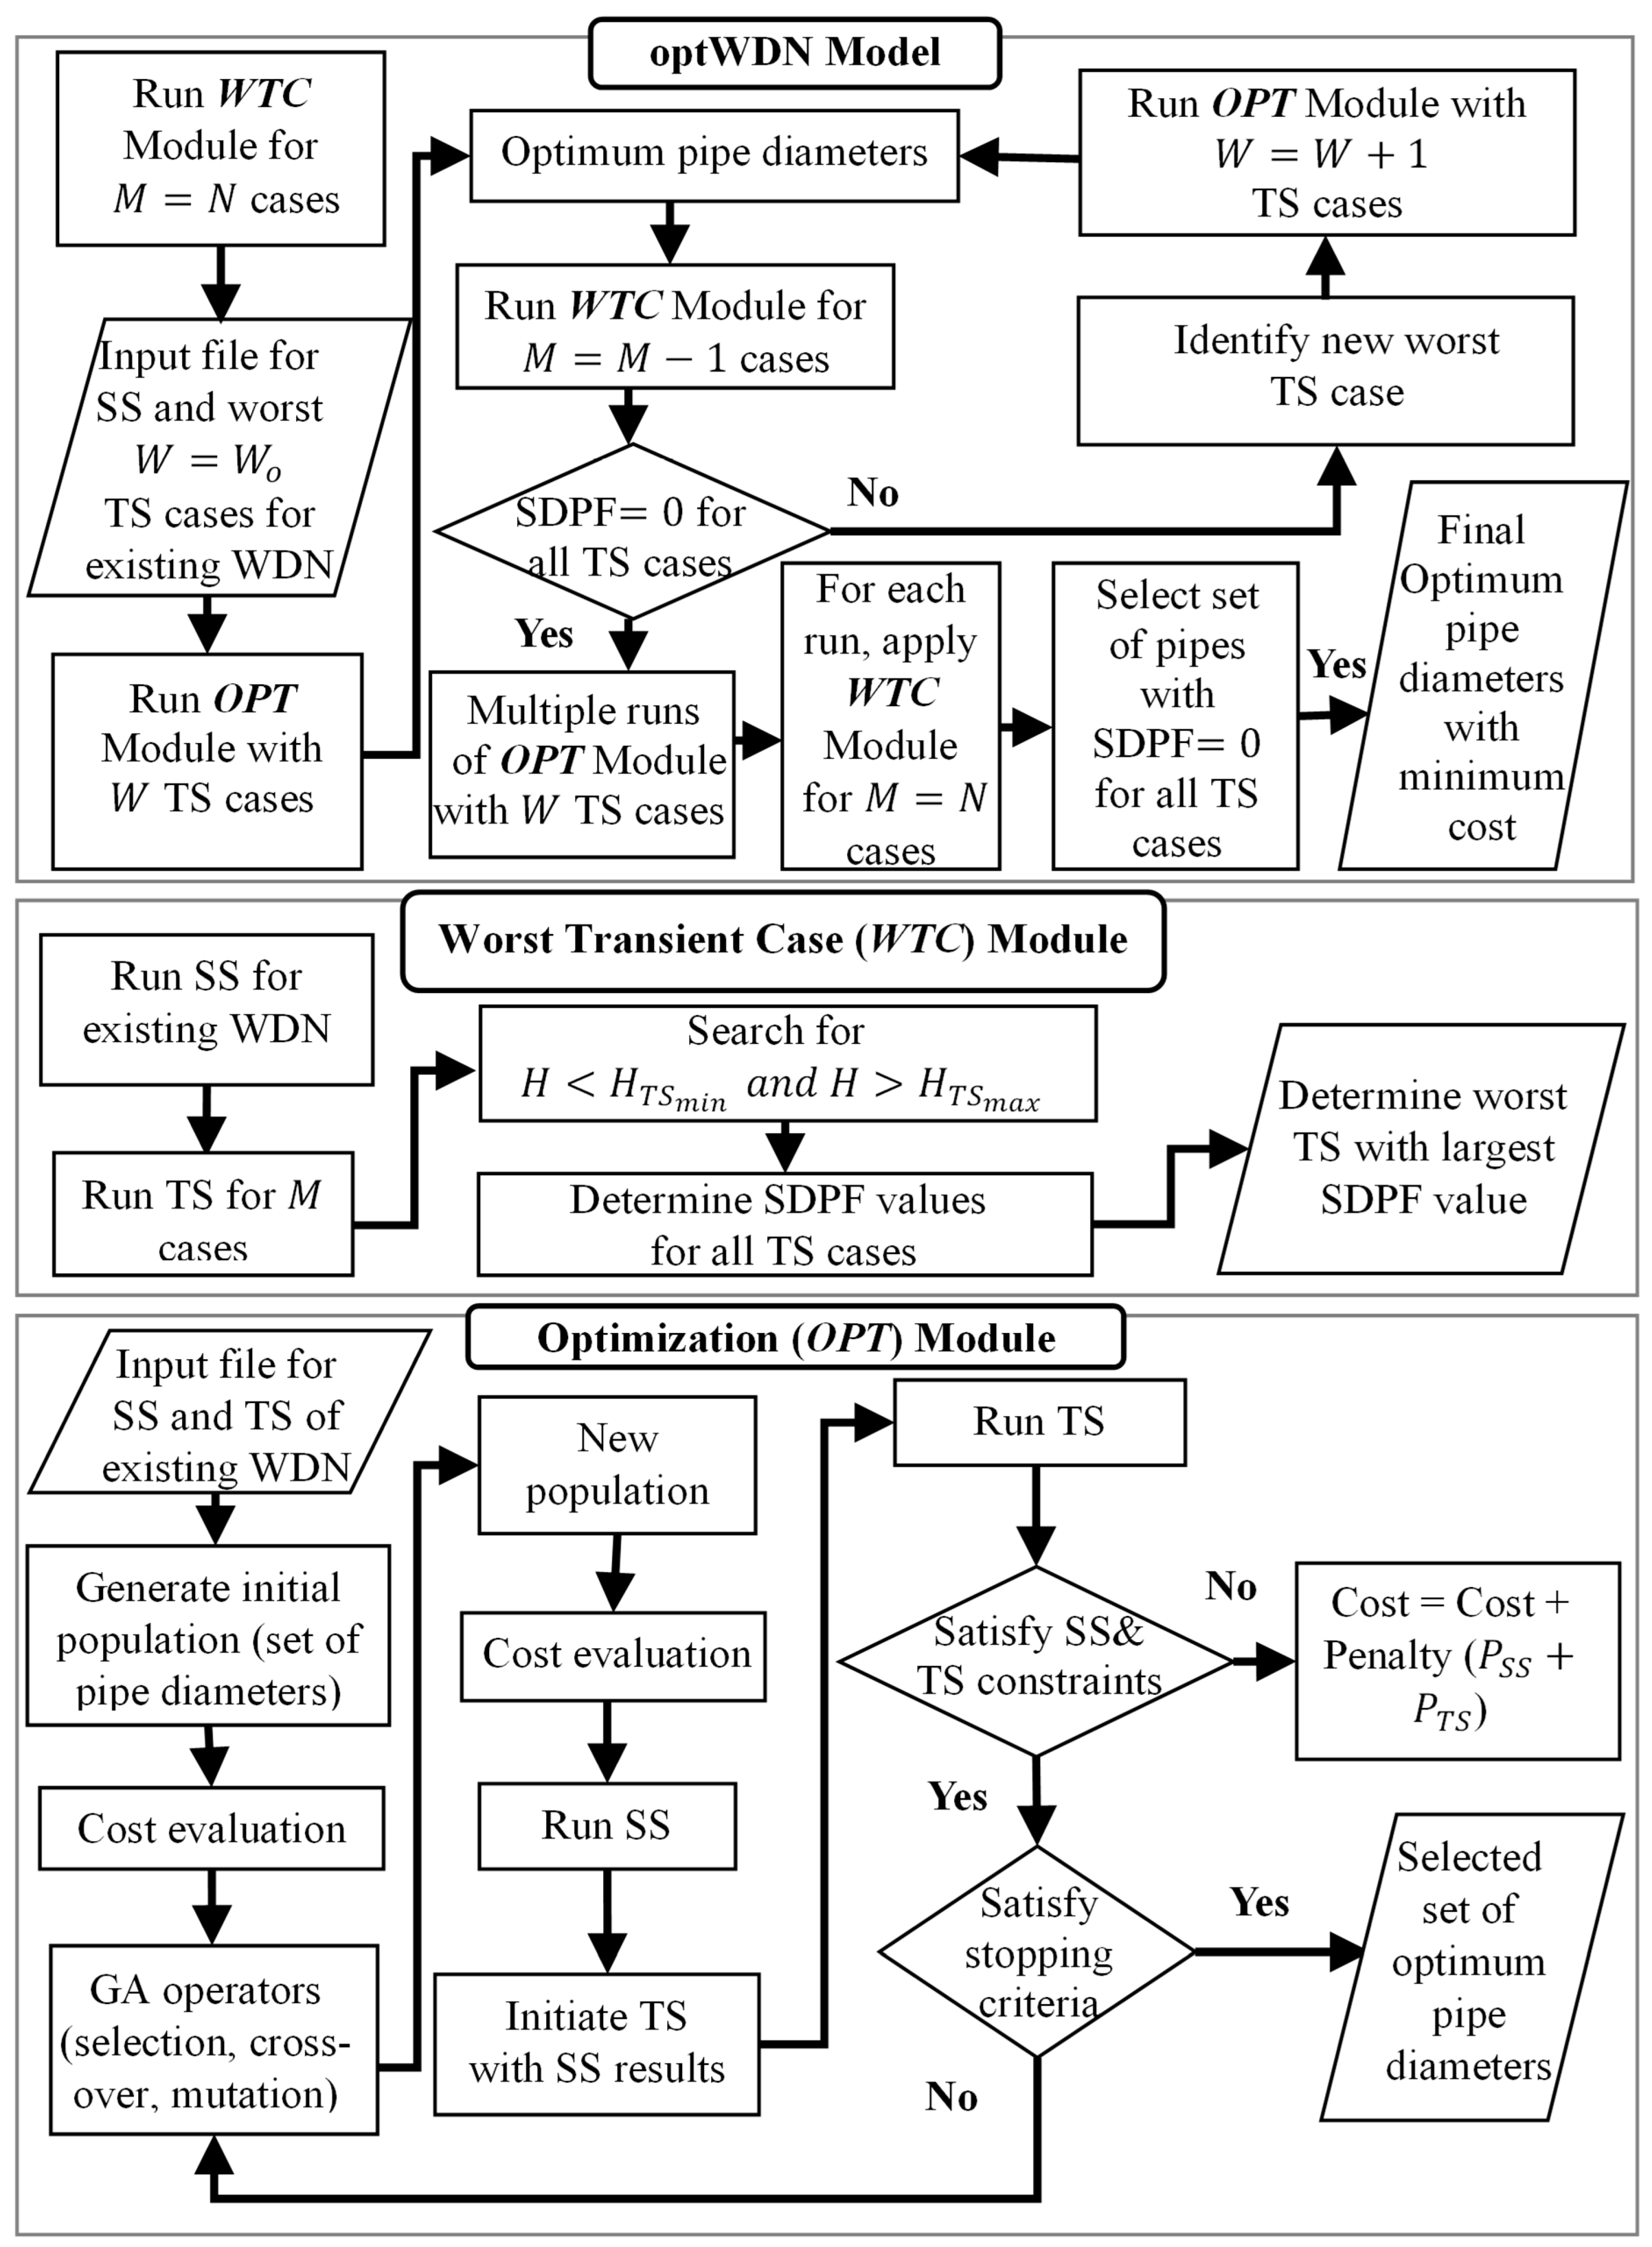
Figure 1. Flowchart for the proposed optWDN model. N denotes the total number of possible transient cases. M denotes a monotonically decreasing number of transient cases in each model run. W denotes a monotonically increasing number of worst transient cases in each model run. W o denotes the initial number of worst transient cases that are selected for application in the first model run cycle.
Water 17 01816 g001
Figure 2. Layout of the existing NYT network (after Jung and Karney [14]).
Water 17 01816 g002
Figure 3. Variation in simulated pressure head with time at (a) node 17 and (b) node 19 due to sudden demand change at node 10 (scenario S1). Shown are results from the optWDN model and from Jung et al. [34].
Water 17 01816 g003
Figure 4. Variation in simulated pressure head with time at (a) node 17 and (b) node 18 due to simultaneous, identical sudden demand changes at nodes 18 and 19 (scenario S2). Shown are results from the optWDN model and from Jung [18].
Water 17 01816 g004
Figure 5. Variation in simulated pressure head with time at (a) node 17 and (b) node 19 due to sudden demand change at node 10 (scenario S1). Simulated pressure is for the existing network with duplicate pipes identified in the present study, as well as by El-Ghandour and Elansary [23], El-Ghandour et al. [25], and Jung et al. [34].
Water 17 01816 g005
Figure 6. S D P F N for all possible combinations of simultaneous sudden demand increase at two nodes (scenario S2).
Water 17 01816 g006
Figure 7. Range of simulated transient pressure heads for the (a) existing pipes of the NYT network without duplicate pipes and for the (b1) existing pipes of the NYT network with (b2) optimal duplicate pipes identified for scenario S1 using S D P F N = 0 . Orange bars show the range of transient pressure heads at the two end nodes of each pipe, while cyan bars show the range along each pipe. The dashed line indicates the minimum allowable pressure head.
Water 17 01816 g007
Figure 8. Lower envelope of simulated transient pressure head along pipe 20 under scenario S1. Simulations are for the existing network with different sets of optimal duplicate pipes identified in this study and in previous studies [23,25,34]. The dashed line indicates the minimum allowable transient pressure head.
Water 17 01816 g008
Figure 9. Optimized diameters of additional duplicate pipes as identified in the present study, as well as by El-Ghandour and Elansary [23], El-Ghandour et al. [25], and Jung et al. [34].
Water 17 01816 g009
Figure 10. Box plot of the number of function evaluations required to achieve zero SDPF values ( S D P F N and S D P F P ) for 30 independent runs under scenario S1.
Water 17 01816 g010
Figure 11. S D P F N for all possible combinations of simultaneous sudden demand increase at two nodes (scenario S2) corresponding to optimized duplicate pipe diameters in each run cycle of the optWDN model. Panels (a) Run 1; (b) Run 2; (c) Run 3; (d) Run 4; (e) Run 5; (f) Run 6; (g) Run 7 correspond to run cycles 1 and 7 with 1 and 7 worst cases, respectively. Grey shading denotes node combinations giving S D P F N = 0 .
Water 17 01816 g011
Figure 12. S D P F N for all possible combinations of simultaneous sudden demand increase at two nodes (scenario S2) corresponding to optimized duplicate pipe diameters in each run cycle of the optWDN model. Panels (a,b) correspond to run cycles 1 and 2 with 9 and 10 worst cases, respectively. Grey shading denotes node combinations giving S D P F N = 0 .
Water 17 01816 g012
Figure 13. Variation in pressure head with time at (a) node 17 and (b) node 18 due to simultaneous, identical sudden demand changes at nodes 18 and 19 and at nodes 17 and 20, with duplicate pipes identified in the present study as well as by Jung [18].
Water 17 01816 g013
Figure 14. S D P F P for all possible combinations of simultaneous sudden demand increase at two nodes (scenario S2) corresponding to optimized duplicate pipe diameters in each run cycle of the optWDN model. Panels (a) Run 0; (b) Run 1; (c) Run 2; (d) Run 3; (e) Run 4; (f) Run 5; (g) Run 6; (h) Run 7 correspond to run cycles 0 to 7 with 0 and 7 worst cases, respectively. Grey shading denotes node combinations giving S D P F P = 0 .
Water 17 01816 g014
Figure 15. Optimized diameters for duplicate pipes identified by the present studies, as well as by Jung [18].
Water 17 01816 g015
Figure 16. Envelope for minimum pressure head versus duration for demand increase at node 10 (scenario S1) and, simultaneously, identical demand change at nodes 18 and 19 (scenario S2).
Water 17 01816 g016
Figure 17. Variation in simulated pressure head at node 19 with time due to simultaneous, identical sudden demand change at nodes 18 and 19 (scenario S2) for demand increase durations of 1 s and 261 s.
Water 17 01816 g017
Table 1. Optimized diameters (mm) given by previous studies for duplicate pipes under steady-state conditions. Also shown is the total cost for the duplicate pipes.
Pipe NumberDany et al. [38] Ghandour and Elbeltagi [2] Maier et al. [3]Eusuff and Lansay [43]
7--36003300
1530003000--
162100210024002400
172400240024002400
182100210021002100
191800180030001800
211800180015001800
Total Cost (million USD)38.7938.7938.6438.13
Table 2. Performance metrics for different population sizes used in applying GA to the NYT Network case study.
Population Size203050100
Reliability ,   R (%)3.343.343.343.34
Efficiency - Rate   metric ,   E (%)13.315.45.52.7
Performance   indicator ,   η a l g (%)95.7095.5295.3095.00
Table 3. Outcome of run cycles of the optWDN model with S D P F N = 0 for scenario S2. The number of considered worst transient cases was initially set to 1 and was subsequently increased from one cycle to the next.
Run CycleNumber of Worst Transient
Cases
Set   of   Nodes   for   Sudden   Demand   Change   Considered   in   the   O P T Module Number   of   Transient   Cases   with   Non - Zero   S D P F N Maximum   S D P F N over All 171 CasesTotal Duplicate Pipe Cost (Million USD)
00-17180.5 × 103-
11(18, 19)631.32 × 10373.68
22(18, 19); (17, 20)280.19 × 10397.30
33(18, 19); (17, 20); (16, 20)32.81103.65
44(18, 19); (17, 20); (16, 20); (19, 20)1590.095.29
55(18, 19); (17, 20); (16, 20); (19, 20); (10, 17)313.1142.46
66(18, 19); (17, 20); (16, 20); (19, 20); (10, 17); (16, 19)21.47104.47
77(18, 19); (17, 20); (16, 20); (19, 20); (10, 17); (16, 19); (16, 17)10.47108.75
88(18, 19); (17, 20); (16, 20); (19, 20); (10, 17); (16, 19); (16, 17); (7, 8)00103.36
30 GA
independent trial runs
(18, 19); (17, 20); (16, 20); (19, 20); (10, 17); (16, 19); (16, 17); (7, 8)00102.11
Table 4. Outcome of run cycles of the optWDN model with S D P F N = 0 for scenario S2. The number of considered worst transient cases was initially set to 5% of the total number of possible cases and was subsequently increased by 1 from one cycle to the next.
Run CycleNumber of Worst Transient
Cases
Set   of   Nodes   for   Sudden   Demand   Change   Considered   in   the   O P T Module Transient   Cases   Non - Zero   S D P F N Maximum   S D P F N over All 171 CasesTotal Duplicate Pipe Cost (Million USD)
00-17180.5 × 103-
19(18, 19) & (19, 20) & (16, 19) & (17, 19) & (12, 19) & (11, 19) & (9, 19) & (10, 19) & (13, 19)11.29113.04
210(18, 19) & (19, 20) & (16, 19) & (17, 19) & (12, 19) & (11, 19) & (9, 19) & (10, 19) & (13, 19) & (16, 17)12.77107.58
311(18, 19) & (19, 20) & (16, 19) & (17, 19) & (12, 19) & (11, 19) & (9, 19) & (10, 19) & (13, 19) & (16, 17) & (10, 17)00114.68
30 GA independent trial runs(18, 19) & (19, 20) & (16, 19) & (17, 19) & (12, 19) & (11, 19) & (9, 19) & (10, 19) & (13, 19) & (16, 17) & (10, 17)00102.26
Table 5. Outcome of run cycles of the optWDN model with S D P F P = 0 for scenario S2.
Run CycleNumber of Worst Transient
Cases
Set   of   Nodes   for   Sudden   Demand   Change   Considered   in   the   O P T Module Transient   Cases   with   Non - Zero   S D P F P Maximum   S D P F P for All 171 CasesTotal Duplicate Pipe Cost (Million USD)
00-171802,284.7-
11(18, 19)12414,50787.67
22(18, 19); (17, 20)1158943.6297.90
33 (18, 19); (17, 20); (16, 20)367.95134.44
44(18, 19); (17, 20); (16, 20); (10, 16)9373.24112.17
55(18, 19); (17, 20); (16, 20); (10, 16); (10, 17)904.58115.31
66(18, 19); (17, 20); (16, 20); (10, 16); (10, 17); (19, 20)864.11118.00
77(18, 19); (17, 20); (16, 20); (10, 16); (10, 17); (19, 20) (2, 15)230.37130.59
88(18, 19); (17, 20); (16, 20); (10, 16); (10, 17); (19, 20) (2, 15); (9, 16)00138.54
30 GA independent trial runs(18, 19); (17, 20); (16, 20); (10, 16); (10, 17); (19, 20) (2, 15); (9, 16)00122.24
Disclaimer/Publisher’s Note: The statements, opinions and data contained in all publications are solely those of the individual author(s) and contributor(s) and not of MDPI and/or the editor(s). MDPI and/or the editor(s) disclaim responsibility for any injury to people or property resulting from any ideas, methods, instructions or products referred to in the content.