Article

Assessment of Water Ecological Health in the Lower Reaches of the Jinsha River Based on the Integrity Index of Periphytic Algae

1
China Three Gorges Corporation, Beijing 101199, China
2
China Yangtze Power Co., Ltd., Yichang 443000, China
3
China Institute of Water Resources and Hydropower Research, Beijing 100038, China
*
Author to whom correspondence should be addressed.
Water 2025, 17(12), 1769; https://doi.org/10.3390/w17121769
Submission received: 29 April 2025 / Revised: 7 June 2025 / Accepted: 9 June 2025 / Published: 12 June 2025

Abstract

To investigate the spatiotemporal characteristics of periphytic algae community structure and the Benthic Index of Biotic Integrity (B-IBI) in the Jinsha River, this study conducted two sampling surveys on periphytic algae and physicochemical factors at 15 representative sampling sites in November 2023 (dry season) and May 2024 (normal water period). Results showed that a total of 118 species of periphytic algae belonging to 59 genera and 7 phyla were detected, including 48 species from 5 phyla in the dry season of 2023 and 95 species from 6 phyla in the normal water period of 2024. Spatially, the distribution trends of total species richness and abundance of periphytic algae were basically consistent, both showing a gradually increasing trend from the downstream reservoir section of the Jinsha River to the upstream conservation section of the Yangtze River. Temporally, both the abundance and species richness of periphytic algae in the normal water period were higher than those in the dry season. Overall, the physicochemical indices of the Jinsha River water showed a decreasing trend from the reservoir areas to the river channels, with slightly higher values in the normal water period than in the dry season. Through parameter value distribution range analysis, discriminant ability analysis, and redundancy analysis of candidate parameters, the B-IBI index system for the study area was determined. The baseline values of the periphytic algae integrity index were 6.04 in the dry season of 2023 and 6.62 in the normal water period of 2024. The water ecological health status of the conservation section of the upper reaches of the Yangtze River is generally in a healthy state, and the overall water ecological health status gradually improves with the increase of the distance from the cascade reservoirs in the lower reaches of the Jinsha River.

1. Introduction

In recent years, the water environment quality of the Yangtze River has significantly improved, but issues such as imbalances in the aquatic ecosystem and reductions in aquatic biodiversity have become prominent shortcomings in the high-quality development of the Yangtze River Economic Belt [1]. As an important technical tool for assessing river health status, scientifically analyzing river–lake problems, and strengthening the implementation of the river and lake chief system [2,3], river health evaluation has gradually gained attention from river–lake managers and scholars and been continuously improved. It has evolved from the initial single water quality assessment to the evaluation of ecological flow protection [4], and now to the comprehensive assessment of water quality, quantity, and aquatic ecology [5]. Currently, multiple guiding documents on river health evaluation have been issued by various ministries and commissions [6,7], standardizing processes such as index system construction, evaluation index screening, and health grade classification.
The Index of Biotic Integrity (IBI) was first proposed by Karr [8] in 1981, establishing the Fish Index of Biotic Integrity (F-IBI) using fish as the research object. Kerans [9] et al. proposed the Benthic Index of Biotic Integrity (B-IBI) in 1994 to evaluate the river ecological health of the Tennessee Valley in the United States. Subsequently, under the advocacy and promotion of the U.S. Environmental Protection Agency, IBI was extended to studies on algae, phytoplankton, zooplankton, aquatic plants, and other taxonomic groups [10,11,12]. Compared with traditional river health evaluation methods, IBI integrates multiple biological indicators to assess river ecological environment status, considering both the physiological characteristics and functional attributes of organisms, such as community structure, feeding habits, sensitivity, pollution tolerance, and diversity. It breaks through the limitations of single biological evaluation indicators and has advantages of comprehensiveness, sensitivity, and accuracy, becoming an effective tool for current river ecological environment quality assessment [7,13,14]. As primary producers in river ecosystems, periphytic algae play a crucial role in maintaining aquatic biodiversity and ecological functions. They not only provide a basic food source for zooplankton, benthic animals, and fish but also directly influence the material and energy conversion processes in river ecosystems through their participation in nutrient cycling and energy flow. In fast-flowing river sections, periphytic algae can effectively adhere to riverbed substrates and reduce water erosion by secreting extracellular polysaccharides, while also significantly bioaccumulating nutrient elements such as nitrogen and phosphorus in water [10]. Characterized by relatively stable habitats, high sensitivity to changes in aquatic ecosystems, high species diversity, and short growth cycles, periphytic algae can rapidly reflect short-term changes in the water environment at monitoring sections, thus becoming one of the main aquatic biological groups indicating the health status of river ecosystems [11,12].
The construction of cascade hydropower stations in the lower Jinsha River has significantly altered the downstream hydrological conditions, disrupting the river’s continuity and modifying its hydrodynamic characteristics. This has not only had a major impact on fish but also on other aquatic organisms such as benthic animals and plankton, further affecting the stability of the food chain. Wang Ning analyzed plankton communities before and after the construction of WDD Hydropower Station, observing a declining trend in zooplankton density, biomass, and biodiversity [15]. Similarly, Ru Huijun’s investigation of benthic animals in the four cascade reservoir areas of the lower Jinsha River from 2017 to 2018 revealed that the WDD Reservoir had the highest number of benthic animal species, while the XLD Reservoir had the lowest [16]. Gao Xingchen evaluated the river ecological health of the downstream Jinsha River using the phytoplankton Index of Biotic Integrity (P-IBI) before the operation of cascade hydropower stations [17]. Current research mainly focuses on analyzing the characteristics of various aquatic biological communities. However, studies specifically addressing the integrity index of periphytic algae remain scarce. In light of this, this study aims to evaluate the aquatic ecological health of the lower Jinsha River using the Index of Biotic Integrity of periphytic algae. This evolves carrying out aquatic biological monitoring, identifying reference and impaired sites, screening and recommending indicators for calculating the periphytic algae integrity index and their baseline values, and conducting water ecological health evaluation and analysis for the downstream Jinsha River. If the results of the phytoplankton are consistent with the trend of previous studies, it can be assumed that the construction of the Jinsha River power plant will have a significant impact on the downstream hydrology.

2. Materials and Methods

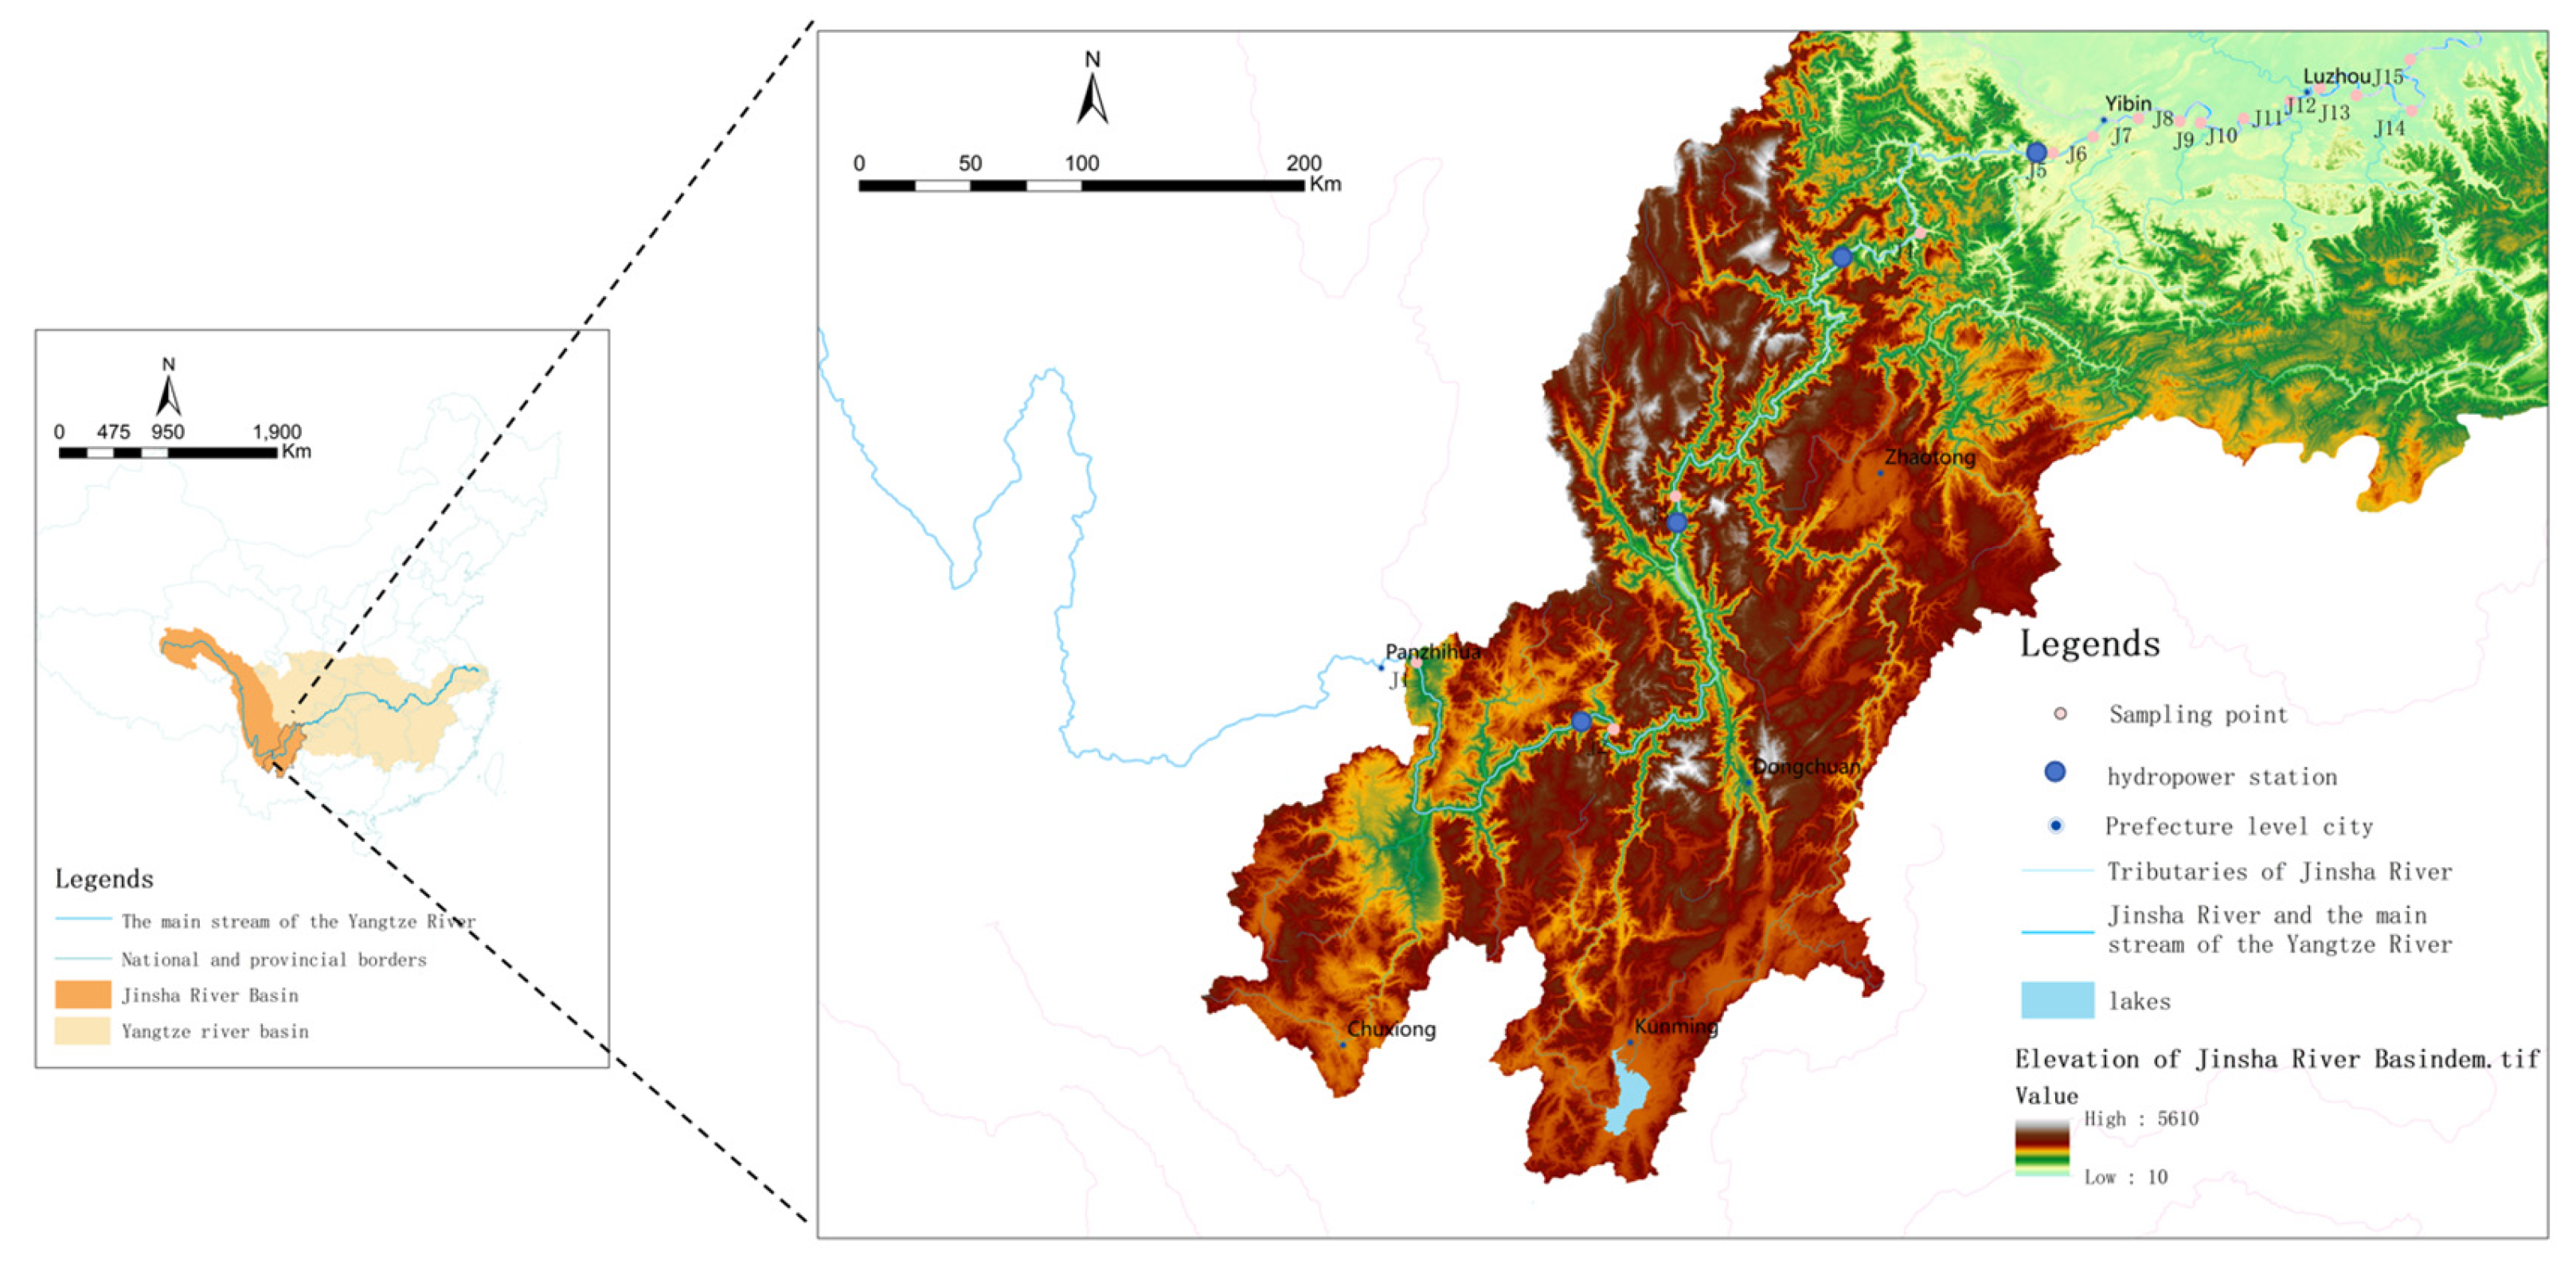
2.1. Study Area Overview and Sampling Point Arrangement

The lower reaches of Jinsha River comprise a mountainous torrential river section in southwestern China. Prior to dam construction, the riverbed was deeply incised, with riffles and pools alternating and flow velocities varying between rapid and slow. The riverbed substrate was primarily composed of gravel and sandy mud, supporting abundant food organisms and fish species adapted to fast-flowing, torrential, and slow-current environments. Currently, four cascade hydropower stations have been built in the lower Jinsha River, arranged sequentially from upstream to downstream: WDD, BHT, XLD, and XJB. XLD and XJB began operations in 2014, while BHT and WDD were commissioned in 2021. With a total installed capacity of 42.96 million kilowatts, the four reservoirs on the lower reaches of the Jinsha River generate 187.57 billion kilowatt-hours of electricity annually, ensuring the demand for electricity in eastern and southern China, with an annual economic return of more than CNY 50 billion, making it an important economic link [18].
Periphytic algae sampling surveys were conducted in the study area during two periods: 10–25 November 2023 (dry season) and 10–25 May 2024 (normal water period). Based on geographical location, aquatic ecological characteristics, and land-use patterns, a total of 15 sampling sites were established along the mainstream of the Jinsha River. Among these, five sites (J1–J5) are located in the downstream section of the Jinsha River, while ten sites (J6–J15) are situated within the reserve section (Figure 1).

2.2. Determination of Physicochemical Parameters of Water Bodies

The determination of water physicochemical factors combined on-site measurements with laboratory analyses. In the field, physical factors such as dissolved oxygen (DO) and pH were measured using a US YSI Water Quality Meter (ProQuatro-C) meter. At each sampling site, 1.5 L of water was collected, stored at low temperature, and transported back to the laboratory within 24 h. Chemical indices including total phosphorus (TP), total nitrogen (TN), and ammonia nitrogen (NH3-N) were then determined in the laboratory following the fourth edition of Methods for Monitoring and Analysis of Water and Wastewater.

2.3. Collection and Identification of Benthic Algae

For the collection of the adherent algae, within 100 m near the sampling point, find four stones with different flow rates and water depths with an area larger than 25 cm2, cover the algae with a square plastic sheet of 5 cm × 5 cm, brush off the surrounding part with a brush, then brush the covered part with a brush into a tray, rinse the remaining algae on the stones into the tray with pure or purified water, and finally collect all the algae in the tray into a 500 mL bottle. The identification of benthic algae was conducted using a Japanese Olympus CX23 microscope at 400× magnification, following the classification tools provided in “The freshwater algae of China: systematics, taxonomy, and ecology” [19], “The freshwater algae of China” [20], the website of “China Species Library Algae” and relevant literature [21,22].

2.4. Data Processing and Analysis

2.4.1. Calculation of Dominant Species and Diversity Indices

In this study, the McNaughton dominance index (Y) was utilized to determine the composition of dominant species. Algae with a dominance index (Y) > 0.02 were classified as dominant species, while algae with a dominance index (Y) > 0.1 were considered absolutely dominant species [23]. The indices used to analyze the α-diversity of benthic algae included the Shannon–Wiener diversity index (H′), Margalef’s species richness (d), and the Pielou evenness index (J′). The calculation formulas are as follows:
Y = f i × n i / N
H = i = 1 s p i ln p i
J = H / l n S
D m = ( S 1 ) ln N
In Equation (1), f i refers to the frequency of occurrence of the ith species; n i represents the density of the ith species; N denotes the total density. In Equations (2)–(4), p i stands for the relative density of the ith benthic algal species at that sampling point; S represents the total number of taxonomic units of benthic algae at that sampling point; N signifies the total number of individuals of benthic algae [24].

2.4.2. Community Dissimilarity Analysis

The Bray–Curtis distance is commonly used by scholars to study the similarity of biological communities. The specific calculation formula can be found in Equation (5). Utilizing the ‘vegan’ package in the R language version 4.3.2, the Bray–Curtis distance is chosen as a metric to evaluate the similarity between different communities, and the ‘pheatmap’ package is used to generate clustered heat maps. Based on the Bray–Curtis distances calculated from the abundance data of benthic algae at each sampling point, non-metric multidimensional scaling (NMDS) was employed to analyze the community structure characteristics of benthic algae in different seasons and river sections of the Jinsha River. Permutational multivariate analysis of variance (PERMANOVA) was further used to test the significance of the differences between seasons and spaces of the periphytic algae. Permutation multivariate analysis of variance (PERMANOVA), and non-metric multidimensional scaling analysis (NMDS) are used with the vegan package in R.
D B r a y C u r t i s ( j , k ) = i = 1 n x i j x i k i = 1 n x i j + x i k
In Equation (5), D B r a y C u r t i s ( j , k ) represents the Bray–Curtis distance between the jth and kth sampling points; n is the number of species; x i k is the abundance data of species i at the jth sampling point; x i k is the abundance data of species i at the kth sampling point.

2.5. Constructing P-IBI Index System

2.5.1. Build Candidate Parameter List

Based on the national standard GB/T 43476-2023 [25] Technical Guidelines for Water Ecological Health Assessment and the Technical Guidelines for the Development of Water Ecological Benchmarks issued by the Chinese Society for Environmental Sciences, and combined with the basin conditions of the study area, parameter indicators for the periphytic algae integrity index were screened according to the principles of representativeness, sensitivity, and applicability. A total of 24 parameters (as shown in Table 1) were selected from four aspects: species richness, community composition, species diversity, and standing stock as candidate parameters for the biotic integrity index of periphytic algae in the downstream Jinsha River. These parameters were chosen to comprehensively reflect the response of periphytic algae to environmental changes.

2.5.2. Filter Core Parameters

The screening of core parameters for the Periphytic Algae Biotic Integrity Index (P-IBI) mainly includes three steps: parameter value distribution range analysis, discriminant ability analysis, and redundancy analysis.
Parameter value distribution range analysis: After selecting candidate biotic parameters, the distribution range of parameters across sampling sites should be further analyzed to exclude two types of parameters: (1) those with a narrow distribution range, a limited response interval to environmental stress, and insufficient sensitivity; (2) those with high variability within reference sites.
Discriminant ability analysis: Sensitivity analysis of candidate biotic indices was performed based on reference and impaired sites. This study used the boxplot method to evaluate discriminant ability by comparing the overlap of interquartile ranges (25–75% quantile boxes) and medians between reference and impaired sites. Parameters were assigned scores according to the degree of overlap. When the discriminant index (IQ) ≥ 2, the parameter was considered capable of distinguishing environmental stress and advanced to the next analysis step.
Redundancy analysis: Normality tests were first conducted on qualified parameters. For parameters conforming to a normal distribution, Pearson correlation analysis was used; for non-normally distributed parameters, Spearman correlation analysis was applied. Parameters with a correlation coefficient |r| < 0.75 were retained to eliminate redundant parameters.

2.5.3. Construction of Biotic Integrity Index of Periphytic Algae

After screening the core parameters, it is necessary to standardize the dimensions of the parameters. Common methods include the tertile method [20], quartile method [21], and ratio method [22]. Wang Beixin compared these three methods and found that they are highly linearly correlated, with the ratio method being superior to the tertile method and quartile method. Therefore, this study uses the ratio method to standardize the dimensions of core parameters.
The standardized value I S of core parameters after dimension unification is calculated using Formula (6):
I S = I T I O I T I E × 10
In the formula,
I S —Standardized value of core parameters after dimension unification;
I O —5th (95th) percentile of all sampling sites for core parameters that respond to external stress with a decrease (increase);
I T —Measured value of core parameter I;
I E —95th (5th) percentile of all sampling sites for core parameters that respond to external stress with a decrease (increase);
10—A set constant used to convert the basic distribution range of IS to 0–10.
If I S > 10, it is set to 10; if I S < 0, it is set to 0 [26].

3. Results

3.1. Changes in Water Physical and Chemical Factors

The variations in water physicochemical factors during the dry and normal water periods in the Jinsha River are illustrated in Figure 2. Overall, water physicochemical parameters exhibited a decreasing trend from the reservoir areas to the river channels, with slightly higher values observed during the normal water period compared to the dry season. The pH values at sampling sites ranged from 7.33 to 7.89 during the dry season and 7.72 to 8.25 during the normal water period, indicating a slightly alkaline environment. A gradual decrease in pH was noted as one moved from the reservoir areas to the river channels.
DO concentrations in the Jinsha River were higher in the reservoir areas than in the river channels during the dry season, but slightly higher in the river channels than in the reservoir areas during the normal water period. This variation in DO concentration was positively correlated with algal content [27]. During the dry season, algal cell density decreased from the reservoir areas to the river channels, leading to a reduction in DO concentration; conversely, during the normal water period, an increase in algal cell density from the reservoir areas to the river channels resulted in an elevation of DO concentration. Total phosphorus (TP), total nitrogen (TN), and ammonia nitrogen (NH3-N) generally exhibited higher levels during the normal water period compared to the dry season, with higher concentrations observed in the river channels than in the reservoir areas.

3.2. Characteristics of Algal Community Structure

3.2.1. Species Composition

A total of 118 species of periphytic algae, classified into 59 genera and 7 phyla, were identified in the Jinsha River during the dry season of 2023 and the normal water period of 2024. These included 74 species in Bacillariophyta, 17 in Cyanophyta, 19 in Chlorophyta, 4 in Euglenophyta, 3 in Cryptophyta, 2 in Chrysophyta, and 1 in Dinophyta. Specifically, during the dry season of 2023, 48 species from 5 phyla were detected, whereas during the normal water period of 2024, 95 species from 6 phyla were recorded. Throughout the year, Bacillariophyta, Chlorophyta, and Cyanophyta were the dominant groups of periphytic algae in the Jinsha River. The species richness during the normal water period of 2024 was significantly higher than that during the dry season of 2023 (Figure 3), and the species richness in the river channels exceeded that in the reservoir areas (Figure 4). Based on sampling and identification results, the abundance of periphytic algae at each sampling site during the dry season of 2023 ranged from 0.12 to 6.78 × 10⁶ cells/cm2, with an average of 2.02 × 10⁶ cells/cm2. Notably, significant spatial variations in abundance were observed, with the highest abundance recorded at site J5 (6.78 × 10⁶ cells/cm2), where Chlorophyta predominated (Figure 5). During the normal water period of 2024, the abundance of periphytic algae ranged from 0.18 to 9.92 × 10⁶ cells/cm2, with an average of 3.65 × 10⁶ cells/cm2. Both abundance and biomass exhibited substantial spatial heterogeneity, with the highest abundance observed at site J10 (13.25 × 10⁶ cells/cm2), where Cyanophyta dominated (Figure 5).

3.2.2. Dominant Species

According to the dominance formula, species with a dominance value Y ≥ 0.02 were defined as dominant species in the basin, and those with Y ≥ 0.1 were classified as absolute dominant species. The dominant species of periphytic algae in the Jinsha River and their dominance values are presented in Table 2. Calculations showed that three dominant species were identified in the 2023 dry season: Achnanthes (Bacillariophyta), Gomphonema (Bacillariophyta), and Lyngbya (Cyanophyta), among which Achnanthes and Lyngbya were absolute dominant species due to Y ≥ 0.1. In the 2024 normal water period, four dominant species were observed: Melosira granulata (Bacillariophyta), Oscillatoria (Cyanophyta), Lyngbya (Cyanophyta), and Leptolyngbya (Cyanophyta), with no absolute dominant species identified (none had Y ≥ 0.1). Notably, the majority of dominant periphytic algae species belonged to Cyanophyta, as shown in Table 2. The dominant species during the dry season are mainly diatoms, but they shift to cyanobacteria during the normal water period, indicating that problems such as eutrophication and rising water temperature occur during the normal water period.

3.2.3. Alpha Diversity

The α-diversity indices of periphytic algae communities in the Jinsha River during the 2023 dry season and 2024 normal water period are shown in Figure 6. The Shannon–Wiener index ranged from 0.05 to 2.76 (mean = 1.06) in the dry season and 0.72 to 3.00 (mean = 2.43) in the normal water period. Pielou’s evenness index ranged from 0.02 to 0.98 (mean = 0.39) in the dry season and 0.31 to 0.98 (mean = 0.84) in the normal water period. The Margalef richness index ranged from 0.81 to 2.91 (mean = 1.73) in the dry season and 1.46 to 4.31 (mean = 3.04) in the normal water period. Temporally, the α-diversity of periphytic algae communities varied significantly between periods, with the Shannon–Wiener index, Pielou’s evenness index, and Margalef richness index all higher in the 2024 normal water period than in the 2023 dry season. Spatially, α-diversity values were lower in the reservoir areas than in the river channels.

3.3. Based on the Analysis of Community Structure Differences Between Bray–Crutis

Based on the abundance data of periphytic algae in the Jinsha River, the Bray–Curtis dissimilarity coefficient matrix was used to determine the similarity of each sampling site, and spatial and temporal non-metric multidimensional scaling (NMDS) analyses were conducted for the periphytic algae communities, as shown in Figure 7. The stress value was 0.072, which is less than 0.2, indicating that the ordination meets the requirements. As depicted, the community structures of periphytic algae showed significant differences between different periods, as well as obvious distinctions between the river channels and reservoir areas. A permutational multivariate analysis of variance (PERMANOVA) showed that there were significant inter-seasonal and spatial differences in the periphytic algae community, with R2 = 0.214, p < 0.001 in 2023 during the dry season, R2 = 0.156, p < 0.001 in 2024 during the flat season, R2 = 0.237, p < 0.001 in the reservoir areas, and R2 = 0.175, p < 0.001 in the river course.

3.4. Biotic Integrity Index of Periphytic Algae

3.4.1. Alpha Diversity Analysis

To comprehensively evaluate river habitat conditions, this study selected 10 key indicators from the habitat evaluation system established by Zhang Yuan et al. [21], including substrate, habitat complexity, velocity/depth (V/D) combined characteristics, riverbank stability, channels change, river water quantity status, vegetation diversity, water quality status, human activity intensity, and riparian land-use type, to score the sampling sites. Each indicator was scored out of 20 points, and sampling sites with a total score of over 150 were defined as reference sites [22], indicating minimal anthropogenic disturbance and good habitat conditions. Finally, J1, J8, J10, J11, and J12 were selected as reference sites, with the remaining classified as impaired sites.

3.4.2. Core Parameters

Through the screening of reference and impaired sites, the selected parameters for the 2023 dry season were M6, M10, M11, M14, M18, M19, and M22, as shown in Figure 8; the indicators screened for the 2024 normal water period were M6, M13, M14, M17, and M19, as shown in Figure 9.

3.4.3. Redundancy Analysis

Normality tests were conducted on the above parameters. Parameters conforming to a normal distribution were analyzed using Pearson correlation, while non-normally distributed parameters used Spearman correlation analysis. Parameters with a correlation coefficient |r| ≥ 0.75 were excluded, and the remaining parameters were retained as core parameters.
For the 2023 dry season, the core parameters retained through correlation analysis were M10, M19, and M22, as shown in Figure 10. For the 2024 normal water period, correlation analysis (Figure 11) resulted in the retention of core parameters M6, M13, and M17.

3.4.4. Construction of Biotic Integrity Index of Periphytic Algae

The IBI value is calculated as the ratio of the sum of standardized scores of core parameters to the number of core parameters. The P-IBI scores for each sampling site in the Jinsha River are shown in Figure 12.
Result validation is shown in Figure 13. Since the discriminant index (IQ) was ≥ 2 for both the 2023 dry season and 2024 normal water period and meets the requirements, the parameter system is reasonably constructed.

3.4.5. Proposed Benchmark

Following the Technical Guidelines for the Development of Water Ecological Benchmarks issued by the Chinese Society for Environmental Sciences, and according to the specific characteristics of the Jinsha River, the 95th percentile of P-IBI values from 15 sampling sites across different periods was selected as the optimal value. This optimal value was divided into five equal intervals, representing “excellent,” “good,” “moderate,” “poor,” and “very poor” water ecological status, respectively. The interval closest to the 95th percentile was designated as the water ecological benchmark for the lower reaches of the Jinsha River. The expected values and critical values of each index calculated by P-IBI for different periods are shown in Table 3.

3.5. Relationship Between Periphytic Algae Community Parameters and Water Environment Factors

Pearson correlation analysis was conducted on the benthic algal total number of taxonomic units (TNOTU), cell density, biomass, Shannon–Wiener index and P-IBI in the lower reaches of the Jinsha River, and the results are shown in Figure 14. Overall, TN, TDN and NO3-N showed extremely significant positive correlations (p < 0.01), as did NH3−N and DO (p < 0.01). TNOTU had an extremely significant positive correlation with DO (p < 0.01) and significant correlations with NO2-N and TSi (0.01 < p < 0.05). Cell density had extremely significant positive correlations with TN and TP (p < 0.01). Biomass had extremely significant positive correlations with NO3-N, DSi, and DO (p < 0.01). The Shannon–Wiener index had significant positive correlations with NH3-N, TSi, DSi, DO, and V (p < 0.01). The P-IBI had extremely significant positive correlations with TSi and DSi (p < 0.01).

4. Discussion

4.1. Characteristics of Community Structure of Periphytic Algae in the Jinsha River

The species composition of periphytic algae in the Jinsha River was primarily dominated by Bacillariophyta, Cyanophyta, and Chlorophyta, consistent with the community structures reported in the upper Yangtze River, Yalong River [24], and Chishui River [28]. Seasonally, species richness followed the order of normal water period > dry season. The Shannon–Wiener index, Margalef richness index, and species counts all exhibited a decreasing trend from the reservoir areas to the river channels across different hydrological periods—a pattern also observed in benthic animal communities of the Jinsha River [29]. This gradient is attributed to intensified anthropogenic disturbances in reservoir areas, whereas the river channels (proximal to the Yangtze River Conservation Zone) experienced minimal human impact, leading to a decline in α-diversity of periphytic algae from relatively undisturbed riverine zones to disturbed reservoir zones. During different hydrological periods, relative abundances of periphytic algae varied significantly among sampling sites. Bacillariophyta dominated in abundance across all sites during both the dry season and normal water period, with slightly higher values in the latter. This seasonal difference is likely driven by temperature: the normal water period (spring–summer) provided optimal temperatures for algal growth, whereas the dry season (winter) featured lower temperatures unsuitable for vigorous algal proliferation. The dominant species shifted from Bacillariophyta-dominated Achnanthes, Gomphonema, and Lyngbya in the 2023 dry season to Cyanophyta-dominated Melosira granulata, Oscillatoria, Lyngbya, and Leptolyngbya in the 2024 normal water period. Prior to pollution, Bacillariophyta dominated, but post-disturbance, the community structure transitioned to dominance by filamentous Chlorophyta or single-celled Chlorophyta/Cyanophyta, accompanied by a shift in Bacillariophyta taxa from narrow-tolerance to broad-tolerance species [30,31]. Using the Bray–Curtis dissimilarity coefficient matrix to assess the similarity among sampling sites yielded a stress value of 0.072, which is less than 0.2, indicating a valid ordination. Significant differences in community structure were observed between different hydrological periods, as well as between the river channels and reservoir areas.

4.2. Biotic Integrity Index of Periphytic Algae in Jinsha River

Sites with values above the benchmark were classified as “excellent,” while those below the benchmark were divided into four equal intervals representing “good,” “moderate,” “poor,” and “very poor.” According to the established health assessment criteria, the health evaluation results of the Jinsha River are shown in Table 4 below. The results indicate that among the 15 samples collected in the two campaigns, the overall river health status during the 2023 dry season was superior to that during the 2024 normal water period. Additionally, health conditions in the river channels were better than those in the reservoir areas. The overall aquatic health gradually improved as the distance from the cascade reservoirs in the lower reaches of the Jinsha River increased. Among them, during the dry season of 2023, the water quality at points such as J3 and J4 changed from moderate to poor, indicating that eutrophication problems might have occurred during the normal water period as the water temperature rose [32].

4.3. Response Relationship Between Algae Community Structure and Water Environmental Factors in Jinsha River

Survey results from the lower Jinsha River indicate that TN, TDN, and NO3-N are highly positively correlated (p < 0.01), likely due to their shared N element, causing similar concentration changes in water. The total number of taxonomic units (TNOTU) is highly positively correlated with DO (p < 0.01), suggesting that higher DO levels in the surveyed sites favor diverse benthic algal species and increase species richness. TNOTU also shows significant correlations with NO2-N and TSi (0.01 < p < 0.05), possibly because these factors are key components of diatoms and can stimulate their growth. Cell density is highly positively correlated with TN and TP (p < 0.01), consistent with previous studies, indicating algal density is controlled by water nutrient levels. Biomass is highly positively correlated with NO3-N, DSi, and DO (<0.01), highlighting the need for abundant nutrients and oxygen in algal growth and metabolism, and the role of photosynthesis in increasing DO to support these processes. The Shannon–Wiener index correlates significantly with NH3-N, TSi, DSi, DO, and V, indicating that these water environment factors can influence the structure and diversity of algal communities. Under favorable conditions, they can enhance algal diversity and evenness. The P-IBI is highly positively correlated with TSi and DSi (p < 0.01), indicating that higher concentrations of these can improve the P-IBI, reflecting better algal community health and water quality.

5. Conclusions

A total of 118 species of periphytic algae belonging to 59 genera across 7 phyla were detected in the Jinsha River in this study, including 48 species from 5 phyla in the dry season of 2023 and 95 species from 6 phyla in the 2024 normal water period. Spatially, the distribution trends of total species richness and abundance of periphytic algae were basically consistent, both showing a gradual increasing trend from the reservoir section in the lower reaches of the Jinsha River to the conservation zone in the upper reaches of the Yangtze River. Temporally, the abundance and species richness of periphytic algae were higher in the normal water period than in the dry season. Overall, water physicochemical indices in the Jinsha River exhibited a decreasing trend from the reservoir areas to the river channels, with slightly higher values in the normal water period than in the dry season. Using the Bray–Curtis dissimilarity coefficient matrix to assess the similarity of sampling sites, the stress value was 0.072 (<0.2), indicating significant differences in community structure between different periods and obvious distinctions between the river channels and the reservoir areas. Meanwhile, the PERMANOVA test showed significant inter-seasonal and spatial differences in periphytic algae communities. The P-IBI (Index of Biotic Integrity of Periphytic Algae) indicator system for the study area was determined through parameter value range analysis, discriminant ability analysis, and redundancy analysis of candidate parameters. The results showed that the evaluation benchmark for the periphytic algae integrity index was 6.04 during the 2023 dry season and 6.62 during the 2024 normal water period. Based on the two water ecological sampling datasets, the water ecological health evaluation of the study area revealed that the water ecological health in the upper Yangtze River conservation zone was generally in a healthy state, while the reservoir areas in the lower reaches of the Jinsha River was in a poor state. This is consistent with the results hypothesized in the previous introductory section, suggesting that the construction of terrace reservoirs has an impact on the water ecology of the Jinsha River. Additionally, the overall aquatic health gradually improved as the distance from the cascade reservoirs in the lower reaches of the Jinsha River increased. There are still some limitations in the current study, the sampling sites are not enough, and the time series is not long enough, thus the sampling of the periphytic algae in the Jinsha River should be enriched to further improve the current study.

Author Contributions

Conceptualization, Z.X. and L.Y.; methodology, L.Y.; software, L.S.; validation, Y.H.; formal analysis, L.Y.; investigation, J.L., L.L., L.X., and X.C.; writing—original draft preparation, L.S. All authors have read and agreed to the published version of the manuscript.

Funding

This research was funded by the National Key Research Program of China (No. 2022YFC3202003) and the China Yangtze Power Co. Research Project (Z542402001).

Data Availability Statement

The original contributions presented in this study are included in the article. Further inquiries can be directed to the corresponding author.

Conflicts of Interest

Zhi Xu and Lili Liang are employed by the company China Three Gorges Corporation. Xiao Chen, Liwen Xu, and Jun Luan are employed by the company China Yangtze Power Co., Ltd. The remaining authors declare that the research was conducted in the absence of any commercial or financial relationships that could be construed as potential conflicts of interest.

References

  1. Yu, F.; Liu, F.; Xia, Z.; Lin, P.; Xu, C.; Wang, J.; Hou, M.; Zou, X. Classification and assessment methods for mountain channel habitats in the Chishui River basin, China. Water 2022, 14, 515. [Google Scholar] [CrossRef]
  2. Ding, R.; Yu, K.; Fan, Z.; Liu, J. Study and application of urban aquatic ecosystem health evaluation index system in river network plain area. Int. J. Environ. Res. Public Health 2022, 19, 16545. [Google Scholar] [CrossRef] [PubMed]
  3. Jin, J.; Li, M.; Zhou, R.; Zhang, S.; Bai, X.; Cui, Y. Application of subtraction set pair potential method in river ecological health evaluation and diagno. Water Resour. Prot. 2022, 38, 198–204. (In Chinese) [Google Scholar]
  4. Chen, D.; Hu, M.; Guo, Y.; Dahlgren, R.A. Changes in river water temperature between 1980 and 2012 in yongan watershed, eastern China: Magnitude, drivers and models. J. Hydrol. 2016, 533, 191–199. [Google Scholar] [CrossRef]
  5. Wang, Y.; Xu, M.; Xu, J.; Xu, J.; Yang, J.; Li, Y.; Zhu, L.; Tang, C. Zooplankton succession characteristics and water quality evaluation of typical lakes in the hinterland of Lixia River. He Hai Da Xue Xue Bao 2022, 50, 49. [Google Scholar]
  6. SL/T 793-2020; Technical Guidelines for River and Lake Health Assessment. Food and Agriculture Organization: Rome, Italy, 2020.
  7. HJ 1295-2023; Technical Guidelines for Water Ecological Monitoring—Aquatic Organism Monitoring and Evaluation of Rivers (on Trial). Ministry of Environmental Protection of the People’s Republic of China: Beijing, China, 2023.
  8. Karr, J.R. Assessment of biotic integrity using fish communities. Fisheries 1981, 6, 21–27. [Google Scholar] [CrossRef]
  9. Kerans, C.; Lucia, F.J.; Senger, R.K. Integrated Characterization of Carbonate Ramp Reservoirs Using Permian San Andres Formation Outcrop Analogs. AAPG Bull. 1994, 78, 181–216. [Google Scholar] [CrossRef]
  10. Zhu, H.; Zhang, Y.; Peng, Y.; Shi, B.; Liu, T.; Dong, H.; Wang, Y.; Ren, Y.; Xi, Y. Assessing the ecological health of the Qingyi River basin using multi-community indices of biotic integrity. Ecol. Indic. 2023, 156, 111160. [Google Scholar] [CrossRef]
  11. Cui, Z.; Fan, W.; Chen, C.; Mo, K.; Chen, Q.; Zhang, Q.; He, R. Ecosystem health evaluation of urban rivers based on multitrophic aquatic organisms. J. Environ. Manag. 2024, 349, 119476. [Google Scholar] [CrossRef]
  12. Liu, X.; Wang, Y.; Meng, X.; Zhang, C.; Chen, Z. Improved method for benthic ecosystem health assessment by integrating chemical indexes into multiple biological indicator species—A case study of the baiyangdian lake, China. J. Environ. Manag. 2023, 335, 117530. [Google Scholar] [CrossRef]
  13. Zhao, Y.; Wang, F.; Wu, D.; Huang, X.; Chen, J.; Zhou, L.; Kong, F. Health Assessment of Haihe River Basin Based on Benthic Index of Biotic Integrity. Ecol. Environ. 2023, 32, 1785. [Google Scholar] [CrossRef]
  14. Pan, Z.; He, J.; Liu, D.; Wang, J.; Guo, X. Ecosystem health assessment based on ecological integrity and ecosystem services demand in the middle reaches of the Yangtze River economic belt, China. Sci. Total Environ. 2021, 774, 144837. [Google Scholar] [CrossRef]
  15. Zhang, Y.H.; Qv, X.D.; Wang, S.M.; Zhu, Y.; Liu, H.B.; Zhang, H.P.; Zhang, M.; Sun, S.J. River health assessment of Hun River Basin based on benthic index of biological integrity. Resour. Environ. Yangtze Basin 2020, 29, 1374–1386. [Google Scholar]
  16. Ru, H.J.; Zhang, Y.; Wu, X.X. Macrozoobenthos community structure and its relationship with envi-ronmental factors in the riparian zone of the lower Jinsha River. J. Fish. Sci. China 2022, 29, 1679–1692. [Google Scholar] [CrossRef]
  17. Hao, X.C.; Zhang, Q.; Su, W. Ecosystem Health Assessment of Lower Jinsha River Based on the Phytoplanktonic Index of Biotic Integrity(P-IBI). J. Hydroecology 2025, 46, 11–19. [Google Scholar] [CrossRef]
  18. Liu, B.; Niu, Y.; Wang, K.; Dai, D. Characteristic analysis and control measures for debris flow in baitan gully of WDD hydropower station. Chin. J. Geotech. Eng. 2016, 38, 225–230. [Google Scholar] [CrossRef]
  19. Hu, H.J.; Wei, Y.X. Chinese Freshwater Algae-System, Classification and Ecology; Science Press: Beijing, China, 2006. [Google Scholar]
  20. Hu, H.J.; Li, Y.Y.; Wei, Y.X.; Zhu, H.Z.; Chen, J.Y.; Shi, Z.X. The Freshwater Algae of China; Shanghai Science and Technology Press: Shanghai, China, 1980; pp. 1–225. [Google Scholar]
  21. Mei, H.; Zhao, X.F.; Guo, B.; Liu, G.X.; Hu, Z.Y. Advances in freshwater algal biodiversity in China. Ecol. Sci. 2003, 22, 356–359. [Google Scholar] [CrossRef]
  22. Di, F.; Han, D.; Wang, G.; Zhao, W.; Zhou, D.; Rong, N.; Yang, S. Characteristics of bacterial community structure in the sediment of Chishui River (China) and the response to environmental factors. J. Contam. Hydrol. 2024, 263, 104335. [Google Scholar] [CrossRef]
  23. Liu, F.; Liu, H. Effectiveness and challenges of aquatic ecological restoration of Chishui River in upper Yangtze River. Bull. Chin. Acad. Sci. (Chin. Vers.) 2023, 38, 1883–1893. [Google Scholar] [CrossRef]
  24. Ma, B.S.; Wei, K.J.; Xu, J.; Lu, J.; Xu, B.; Zhu, X. Diversity and spatial distribution of periphytic algae in the lower reaches of the Yalong River and its main tributary, the Anning River. J. Fish. Sci. China 2021, 28, 1602–1611. [Google Scholar] [CrossRef]
  25. GB/T 43476-2023; National Technical Committee for Standardization of Environmental Management (SAC/TC 207). Technical Guidelines for Water Ecological Health Assessment. Standards Press of China: Beijing, China, 2023.
  26. Hu, J.; Song, Z.; Zhou, J.; Tan, L.; Tang, T. Comparative study on planktonic and periphytic algal community patterns and their relationships with environmental variables in the upper reaches of the Jinsha River. Acta Ecol. Sin. 2022, 42, 590–599. [Google Scholar] [CrossRef]
  27. Zhang, P.L.; Sun, C.J. The influence of algae growing on pH and DO in surface water. Environ. Monit. China 2004, 20, 49–50. [Google Scholar] [CrossRef]
  28. Hu, J.C.; Guo, S.H.; Tang, T. Using benthic diatom-based multi-metric indices to assess ecological conditions of the Chishui River. Environ. Monit. China 2020, 36, 94–104. [Google Scholar] [CrossRef]
  29. Yan, B.; Cui, G.; Sun, S.; Wang, P.; Wang, C.; Wu, C.; Chen, J. Distribution characteristics and influencing factors of abundant and rare planktonic microeukaryotes in Jinsha River. Huanjing Kexue 2023, 44, 3864–3871. [Google Scholar] [CrossRef]
  30. Xie, C.L.; Wang, T.; Hu, J.J.; Yan, C.L.; Pei, G.F. Autumn benthic diatom community structure and water quality assessment in the Chishui river basin. J. Hydroecol. 2022, 43, 43–50. [Google Scholar] [CrossRef]
  31. Feng, T.Y.; Song, C.; Chen, J.Z. Environmental indication function of aquatic algae. Agric. Sci. Technol. 2011, 27, 257–265. [Google Scholar] [CrossRef]
  32. Dunck, B.; Felisberto, S.A.; de Souza Nogueira, I. Effects of freshwater eutrophication on species and functional beta diversity of periphytic algae. Hydrobiologia 2019, 837, 195–204. [Google Scholar] [CrossRef]
Figure 1. Sampling sites of benthic algae in Jinsha River.
Water 17 01769 g001
Figure 2. Physical and chemical factors of Jinsha River in different periods. (a) TN; (b) TP; (c) pH; (d) NH3-N; (e) DO.
Water 17 01769 g002
Figure 3. Species composition of periphytic algae in Jinsha River in different seasons.
Water 17 01769 g003
Figure 4. Species composition of periphytic algae in different periods in Jinsha River reservoir areas.
Water 17 01769 g004
Figure 5. Abundance of periphytic algae in different periods in Jinsha River reservoir areas.
Water 17 01769 g005
Figure 6. Violin plot of algal α diversity index and number of species in the Jinsha River. (a) Shannon–Wiener diversity index (H′), (b) Pielou evenness index (J′), (c) Margalef richness index.
Water 17 01769 g006
Figure 7. Non-metric multidimensional scaling analysis (NMDS) ordination map of algal communities in Jinsha River.
Water 17 01769 g007
Figure 8. Box diagram of candidate parameters in dry season in 2023 IQ ≥ 2.
Water 17 01769 g008
Figure 9. Box diagram of candidate parameters in 2024 normal water period IQ ≥ 2.
Water 17 01769 g009
Figure 10. Correlation analysis of parameters in 2023 dry season. * represents p < 0.05.
Water 17 01769 g010
Figure 11. Correlation analysis of parameters in 2024 normal water period. * represents p < 0.05.
Water 17 01769 g011
Figure 12. P-IBI scores of sampling points in Jinsha River.
Water 17 01769 g012
Figure 13. Jinsha River P-IBI box line diagram.
Water 17 01769 g013
Figure 14. Mantel correlation analysis chart of benthic algal community and water environment factors in the lower reaches of the Jinsha River.
Water 17 01769 g014
Table 1. Candidate indexes and their response to interference.
Taxonomic GroupCandidate ParameterParameter CodeResponse to Disturbance
Species RichnessTotal number of taxonomic unitsM1Decrease
Number of taxonomic units in Bacillariophyta, Chlorophyta, and CyanophytaM2Decrease
Number of taxonomic units in BacillariophytaM3Decrease
Number of taxonomic units in ChlorophytaM4Increase
Number of taxonomic units in CyanophytaM5Increase
Community CompositionBacillariophyta cell density (%)M6Decrease
Chlorophyta cell density (%)M7Increase
Cyanophyta cell density (%)M8Increase
Dominant species cell density (%)M9Increase
Bacillariophyta taxonomic unit proportion (%)M10Decrease
Chlorophyta taxonomic unit proportion (%)M11Decrease
Cyanophyta taxonomic unit proportion (%)M12Decrease
Species DiversityShannon–Wiener indexM13Decrease
Pielou evenness indexM14Decrease
Margalef richness indexM15Decrease
Standing StockCell densityM16Decrease
Bacillariophyta densityM17Decrease
Chlorophyta densityM18Decrease
Cyanophyta densityM19Decrease
Dominant species cell densityM20Decrease
BiomassM21Decrease
Bacillariophyta biomassM22Decrease
Chlorophyta biomassM23Increase
Cyanophyta biomassM24Increase
Table 2. Dominant species and dominance of periphytic algae in Jinsha River.
Dry Season Flat Water
Period
PhylumDominant SpeciesDominance ValuePhylumDominant SpeciesDominance Value
BacillariophytaAchnanthes0.117BacillariophytaMelosira granulata0.051
BacillariophytaGomphonema0.027CyanophytaOscillatoria0.034
CyanophytaLyngbya0.661CyanophytaLyngbya0.041
CyanophytaLeptolyngbya0.027
Table 3. Water ecological benchmark of Jinsha River P-IBI.
PeriodIIEI0Benchmark Value
2023 Dry seasonM132.190.16.04
M2274.791.31
M100.920.64
2024 Flat water periodM60.90.196.62
M16965.9551.4
M20185.1210.37
Table 4. Assessment of ecological health of algal water in Jinsha River.
SiteNov—2023May—2024
J1ExcellentGood
J2GoodVery Poor
J3ModeratePoor
J4ModeratePoor
J5ModerateModerate
J6ModerateExcellent
J7GoodPoor
J8PoorModerate
J9ExcellentPoor
J10ExcellentGood
J11GoodModerate
J12GoodModerate
J13GoodPoor
J14ModeratePoor
J15ExcellentPoor
Disclaimer/Publisher’s Note: The statements, opinions and data contained in all publications are solely those of the individual author(s) and contributor(s) and not of MDPI and/or the editor(s). MDPI and/or the editor(s) disclaim responsibility for any injury to people or property resulting from any ideas, methods, instructions or products referred to in the content.

