Article

Divergent Response of Blue Carbon Components and Microbial Communities in Sediments to Different Shellfish Zones of Geligang, Liaodong Bay, China

by
Qingbiao Hu
1,2,3,
Bingyu Li
4,*,
Yongan Bai
5,
Fangliang Zheng
1,
Muzhan Sun
5,
Ruiqi Zeng
1,
Xuetong Wang
1,
Xiaodong Li
2,3,5 and
Chunyu Zhu
1,*
1
School of Life Sciences, Liaoning University, Shenyang 110362, China
2
College of Animal Science and Veterinary Medicine, Shenyang Agricultural University, Shenyang 110866, China
3
Liaoning Panjin Wetland Ecosystem National Observation and Research Station, Shenyang 110866, China
4
College of Aquaculture and Life Sciences, Dalian Ocean University, Dalian 116023, China
5
Panjin Guanghe Crab Industry Limited Company, Panjin 124200, China
*
Authors to whom correspondence should be addressed.
Water 2025, 17(12), 1728; https://doi.org/10.3390/w17121728
Submission received: 7 April 2025 / Revised: 27 May 2025 / Accepted: 5 June 2025 / Published: 7 June 2025

Abstract

Coastal wetlands are critical components of blue carbon ecosystems, yet the functional roles of benthic shellfish species in regulating sediment carbon dynamics are not yet fully elucidated. To address this knowledge gap, we investigated the effects of different shellfish zones—gastropods (Bullacta exarata, Umbonium thomasi) and bivalves (Mactra veneriformis, Meretrix meretrix, Potamocorbula laevis)—on sediment carbon fractions and microbial communities in representative intertidal wetlands of Liaodong Bay, China. We analyzed dissolved organic carbon (DOC), particulate organic carbon (POC), microbial biomass carbon (MBC), enzyme activities, and microbial genomic profiles, with particular emphasis on carbon fixation gene abundance within the top 0–10 cm of sediment. The results showed that POC and MBC levels in gastropod zones were 56.11% and 99.83% higher, respectively, than in bivalve zones, while carbon fixation gene abundance was 14.54% lower. Structural equation modeling (SEM) further revealed that shellfish type had a significant direct effect on MBC (λ = 0.824, p < 0.001). This study provides novel evidence that shellfish community composition regulates blue carbon storage through both biogeochemical and microbial pathways, highlighting the importance of species-specific management in shellfish aquaculture to enhance carbon sequestration. These findings offer a theoretical foundation for future assessments of coastal wetland carbon sinks and ecosystem service valuation.

1. Introduction

The ocean, covering 71% of the Earth’s surface, constitutes the largest carbon pool in the global surface system, 20 to 50 times that of terrestrial and atmospheric carbon storage [1]. It acts as a major “buffer” in regulating global climate change [2,3]. Within this system, coastal wetlands play a critical role as core components of the “blue carbon” ecosystem. Due to the impact of periodic tidal inundation, coastal wetlands exhibit strong carbon sink capacity, which contributes significantly to reducing atmospheric CO2 concentrations and mitigating global climate change [4]. The uptake and long-term storage of CO2 in coastal wetlands is primarily driven by the fixation and transformation of carbon by marine organisms [5]. Marine ecosystems sequester at least 25% of anthropogenic CO2 annually, largely via blue carbon pathways. However, the specific contribution of shellfish—dominant benthic organisms in intertidal flats—to sedimentary blue carbon dynamics remains poorly understood and insufficiently quantified [6,7].
Soil organic carbon in coastal wetlands plays an important role in global carbon sequestration [8]. Microorganisms are key drivers of global carbon cycling [9], as they facilitate the decomposition, transformation, and stabilization of organic matter within the microbial food web [10]. Coastal wetland soil carbon occurs in multiple forms [11], including dissolved organic carbon (DOC), microbial biomass carbon (MBC), particulate organic carbon (POC), and other components. DOC serves as a readily available substrate for microbial metabolism [12], while POC and MBC offer further insights into organic matter processing and microbial turnover. Blue carbon in such systems is shaped by the combined actions of autotrophic fixation by plants, respiration by both flora and fauna, and microbial degradation processes. Previous studies have verified that blue carbon is affected by the wetland type and hydrological conditions [13].
Among biotic drivers, the composition and activity of microbial communities are critical for regulating sediment carbon transformations [14]. Despite these advances, significant knowledge gaps remain regarding the species-specific effects of shellfish on sediment carbon dynamics and associated microbial communities. Bullacta exarate, commonly known as mud snail, is a cephalaspidean gastropod (Family: Haminoeoidea) that dominates intertidal mudflats across the coastlines of northeastern China and southwestern Korea [15]. It is rich in proteins and carbohydrates, giving it considerable nutritional, edible, and commercial value. Umbonium thomasi is another gastropod species, widely distributed in estuarine beaches and mudflats around the Bohai Sea, and exhibits high biomass. Both B. exarata and U. thomasi are scraping feeders. The bivalve group includes three species Mactra veneriformis, Potamocorbula laevis, and Meretrix meretrix. These bivalves employ filter-feeding strategies and are widely distributed throughout coastal areas. Despite their ecological importance, the species-specific roles of these shellfish in shaping sedimentary carbon pools and microbial metabolic pathways have not been systematically studied. The physiological traits and feeding strategies of gastropods versus bivalves may drive differential responses in microbial structure and function, ultimately influencing blue carbon cycling. This study focuses on five dominant shellfish species in the wetlands of Liaodong Bay: two gastropods—Bullacta exarata (BE) and Umbonium thomasi (UT)—and three bivalves—Mactra veneriformis (MV), Meretrix meretrix (MM), and Potamocorbula laevis (PL). Our objectives were to (1) quantify sedimentary carbon components (DOC, POC, MBC) across different shellfish zones; (2) characterize the structure and function of microbial communities in these zones; and (3) elucidate the relationships among sediment chemical properties, microbial communities, and carbon components under the influence of different shellfish zones. By integrating biogeochemical measurements with metagenomics and structural equation modeling (SEM), this study offers new insights into how shellfish identity shapes sediment carbon dynamics. These findings contribute to improving future estimates of the blue carbon budget in coastal aquaculture zones.

2. Materials and Methods

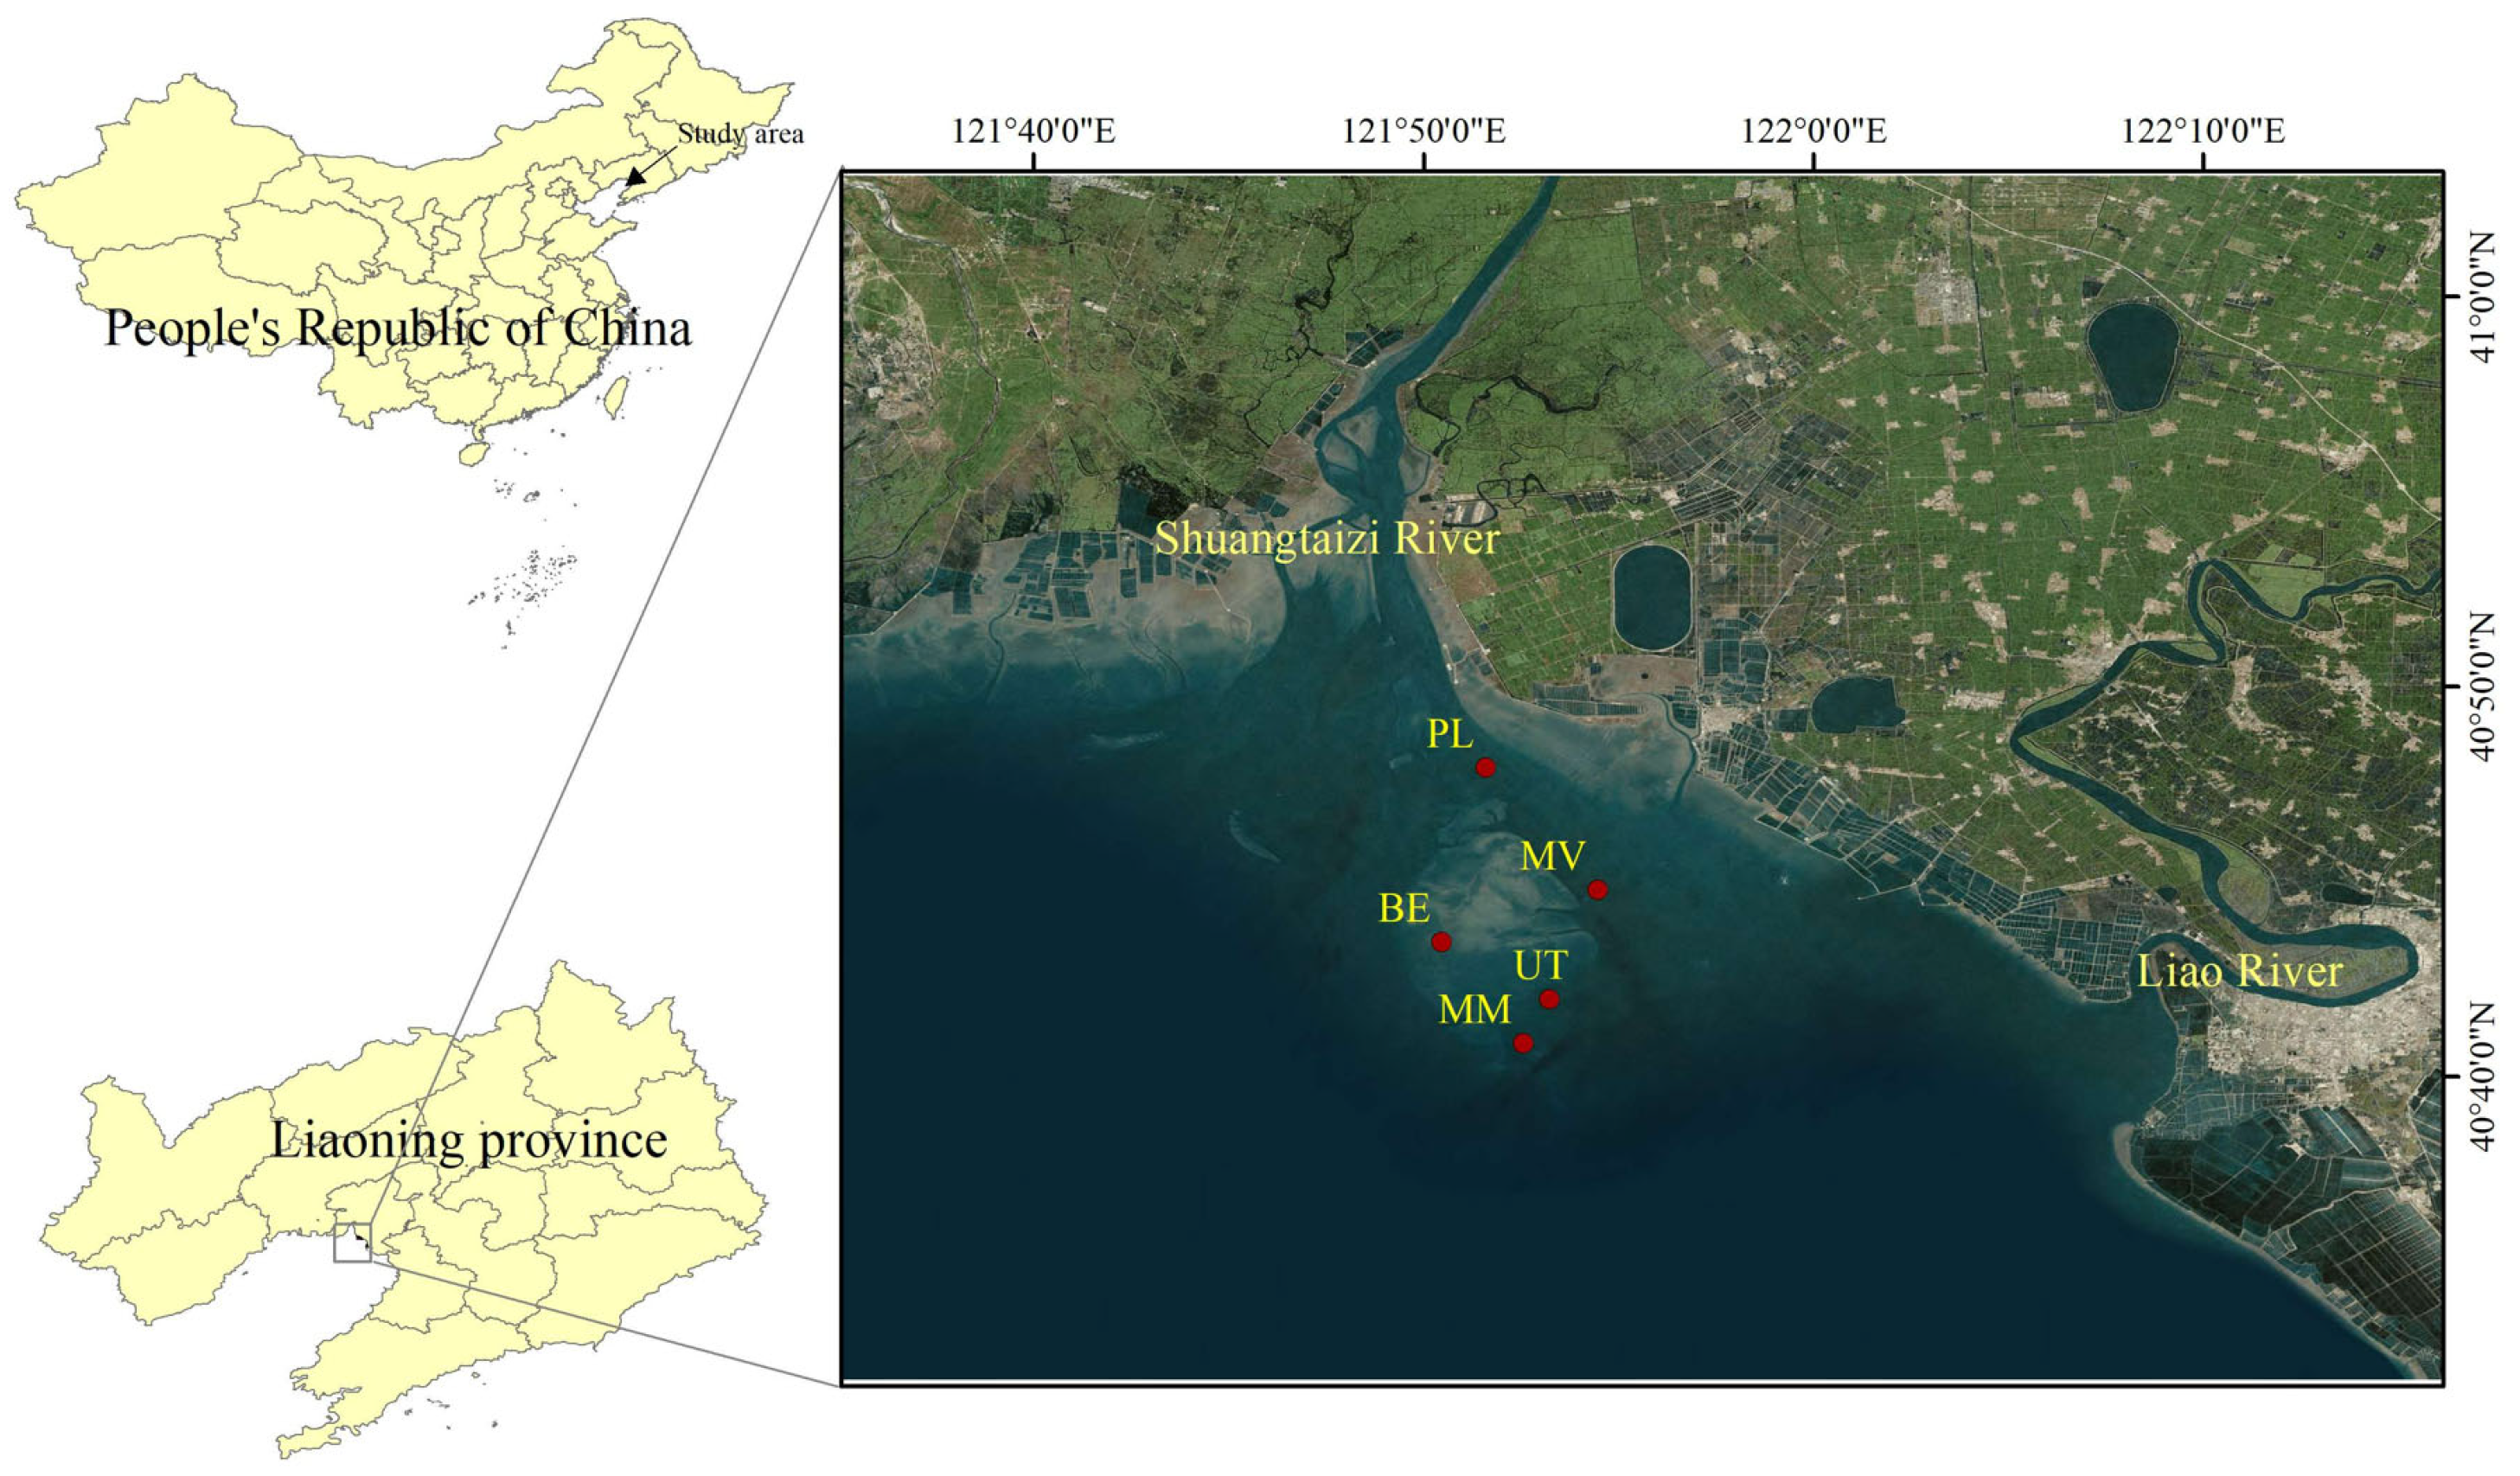
2.1. Study Area Description

The investigation was conducted in the Geligang tidal flat (40.6162–40.8016° N, 121.8094–121.9236° E), a previously unstudied intertidal ecosystem located in the northern Liaodong Bay, Panjin City, China. This region has a warm-temperate continental semi-humid monsoon climate, with mean annual temperatures ranging from 5.8 to 14.9 °C. Hydrologically, it is influenced by the confluence of the Shuangtaizi River and Liao River and supports a 10,000 ha intertidal shoal system known as the “Golden Shoal of the Bohai Sea”. As a key benthic resource in northern China, the tidal flat supports commercially important shellfish populations, including Meretrix meretrix, Mactra veneriformis, Potamocorbula laevis, Cyclina sinensis, and Umbonium thomasi. The ecosystem maintains natural ecological processes throughout most of the year, with anthropogenic impacts mainly limited to seasonal commercial harvesting activities.

2.2. Sample Design

Five major shellfish aquaculture zones were selected in the tidal flats of Geligang in mid-August 2022 (Figure 1, Table 1), encompassing two distinct functional groups (1) Gastropod group: including the production areas of Bullacta exarata (BE) and Umbonium thomasi (UT), (2) Bivalve group: including zones dominated by Mactra veneriformis (MV), Meretrix meretrix (MM), and Potamocorbula laevis (PL).
Three 5 km × 5 km sampling plots were systematically established in each shellfish cultivation zone. Within each plot, five 0.5 m2 quadrats were positioned along a 1 km interval transect using stratified random sampling. Surface sediments (0–10 cm depth) were collected from each quadrat during the one-hour post-low-tide window in mid-August 2022, under consistent weather and hydrological conditions, using a stainless steel corer (⌀5 cm× 20 cm). Each core yielded more than 1.2 kg of intact sediment, after which the sediments from the five 0.5 m2 quadrats were pooled into a single composite sample. This process resulted in a total of 15 geographically stratified composite samples.
After removing visible shellfish and other impurities under sterile conditions, a portion of the sediment samples (≥1 g) was transferred into 5 mL cryopreservation tubes and stored in portable liquid nitrogen containers (YDS-2-30, Chengdu Aiao Technology Co., Ltd., Chengdu, China). The samples were then transported and stored at −80 °C for microbial community analysis. The remaining sediments were stored at 4 °C for the measurement of basic sediment properties and blue carbon components, including dissolved organic carbon (DOC), particulate organic carbon (POC), and microbial biomass carbon (MBC).
Soil enzymes, as highly active biochemical components, play a vital role in the carbon cycle [16,17]. Organic carbon in sediments must first be enzymatically degraded before it can be assimilated by microorganisms [18]. Polyphenol oxidase (PPO, EC 1.10.3.1) facilitates organic carbon accumulation. Amylase (AMY, EC 3.2.1.2) reflects the decomposition rate of organic carbon. Invertase (INV, EC 3.2.1.26) is essential for carbon cycling. Catalase (CAT, EC 1.11.1.6) indicates the intensity of microbial activity. Accordingly, these four enzymes were selected for analysis. And the enzyme activities were measured using a 96-well microplate, following standard protocols [19].

2.3. Basic Sediment Properties

To assess the fundamental properties of the sediment, a subset of samples was air-dried under controlled laboratory conditions. The dried sediment was then sieved through a 2 mm mesh to homogenize the sample and remove coarse particles. The pH of the sediment was determined using a soil-to-water ratio of 1:2.5 (w/v), with deionized water as the solvent. pH measurements were conducted using a calibrated pH meter (PHB-1, Shanghai Sanxin Instrument Manufacturing Co., Ltd., Shanghai, China). For electrical conductivity (EC) and salinity determination, a soil-to-water ratio of 1:5 (w/v) was used. EC was quantified using a portable conductivity meter (Seven2Go, Mettler-Toledo Technology (China) Co., Ltd., Shanghai, China), while salinity was measured using a digital salinity meter (AR8212, Smart-sensor, Dongguan Wanchuang Electronic Products Co., Ltd., Dongguan, China).
Dissolved organic carbon (DOC) and particulate organic carbon (POC) were quantified using the potassium dichromate-concentrated sulfuric acid heating method. For DOC analysis, the supernatant was obtained by filtering the suspension through a 0.45 μm membrane filter. Prior to filtration, the samples were prepared by mixing water and sediment at a ratio of 5:1, followed by agitation at 250 rpm for 1 h and centrifugation at 4000 rpm for 5 min. For the determination of POC, 10 g of air-dried sediment was extracted with 30 mL of 5 g L−1 sodium hexametaphosphate solution for 15 h at 90 rpm. The resulting solution was then passed through a 53 μm sieve and rinsed with distilled water until the leachate ran clear. The POC retained on the sieve (>53 μm) [20] was dried to a constant weight at 60 °C, weighed, and then analyzed. Microbial biomass carbon (MBC) was determined using the chloroform fumigation-extraction method [21]. Specifically, one set of samples was fumigated with chloroform in the dark for 24 h, while another set was the unfumigated control. Both sets were then extracted with 0.5 M K2SO4 by shaking for 30 min, followed by immediate centrifugation at 4000 rpm. The organic carbon content in the extract was quantified, and MBC was calculated as the difference in organic carbon between the fumigated and unfumigated samples, divided by a correction factor of 0.45 [21].
The enzymatic activities of PPO, AMY, INV, and CAT were quantified using a microplate-based assay kit (Beijing Solarbio Science & Technology Co., Ltd., Beijing, China), following the manufacturer’s instructions.

2.4. Sediment DNA Extraction and Metagenome Sequencing

DNA was extracted from sediment samples using the cetyltrimethylammonium bromide (CTAB) method. The quality of extracted DNA, including degradation level, potential contamination, and concentration, was assessed using the Agilent 5400 system (Agilent Technologies Co., Ltd., Santa Clara, CA, USA). Sequencing libraries were prepared using the NEBNext® Ultra™ DNA Library Prep Kit for Illumina (New England Biolabs, Ipswich, MA, USA), following the manufacturer’s protocol. Unique index barcodes were incorporated to assign sequences to individual samples. The DNA samples were fragmented by sonication to achieve an average size of 350 bp, followed by end repair, A-tailing, and ligation to Illumina-compatible adapters. The resulting fragments were then amplified by PCR, and then, the PCR products were purified using the AMPure XP system. Library quality was assessed for fragment size distribution using the Agilent 2100 Bioanalyzer (Agilent Technologies Co., Ltd., Santa Clara, CA, USA) and quantified by real-time PCR. Index-coded libraries were clustered on a cBot Cluster Generation System in accordance with the manufacturer’s guidelines. Finally, sequencing was conducted on an Illumina NovaSeq 6000 platform (Illumina, San Diego, CA, USA) to generate paired-end reads. The raw sequencing data were deposited in the NCBI Sequence Read Archive (SRA) database and are publicly accessible under the accession number PRJNA1240366.
The raw data derived from sediment samples were obtained via metagenomic sequencing using the Illumina NovaSeq high-throughput platform. To ensure data reliability, the raw reads were preprocessed using Kneaddata, which included removal of sequencing adapters (parameter: ILLUMINACLIP: adapters_path: 2: 30: 10) and trimming of low-quality bases (default quality threshold value ≤ 20; parameter: SLIDINGWINDOW: 4: 20). Reads shorter than 50 base pairs (parameter: MINLEN: 50) were also discarded using Trimmomatic. Subsequently, FastQC was used to evaluate the quality and effectiveness of processing [22,23,24]. For taxonomic profiling, Kraken2 (version 2.0.7-beta) was applied with a confidence threshold set to 0.2, balancing sensitivity and specificity [25]. The reference database included bacterial, archaeal, fungal, and viral sequences from the NT nucleic acid database and the NCBI RefSeq whole genome database. To estimate the actual abundance of taxa, Bracken (version 2.0) was used to refine Kraken2 outputs at the species level, applying a minimum read threshold of 10 to minimize low-abundance noise [8]. Following quality control, clean reads were aligned to the Uniref90 database using HUMAnN2 (version 2.8.1, based on Diamond) with the following parameters: translated query coverage threshold = 90.0, prescreen threshold = 0.01, evaluated threshold = 1.0, and translated subject coverage threshold = 50.0. Annotation information and relative abundance tables were generated from each functional database based on the correspondence among Uniref90 IDs, the Kyoto Encyclopedia of Genes and Genomes (KEGG) database, and Enzyme Commission (EC) numbers (Figure S1).

2.5. Statistical Analysis

Statistical analyses were conducted using SPSS Statistics 23 (SPSS Inc., Chicago, IL, USA). One-way analysis of variance (ANOVA) was performed to assess differences in the activities of four enzymes (PPO, AMY, INV, and CAT) and the concentrations of carbon components (DOC, POC, and MBC) across different shellfish zones. The least significant difference (LSD) test was used to determine statistical significance among groups (p < 0.05). To identify potential drivers underlying the variations in DOC, POC, and MBC among shellfish zones, multiple regression models were fitted using IBM SPSS 20.0 software (IBM, NY, USA). A structural equation model (SEM) was then constructed using the ‘lavaan’ package in R (version 4.3.1), after Z-score standardization of the data. The contributions of the variables in the SEM were evaluated based on the ratio of the chi-squared statistic to degrees of freedom (χ2/df), p-value (p), and goodness-of-fit index (GFI) [26]. To evaluate differences in gene abundance among the shellfish zones, functional gene abundance was calculated as transcripts per kilobase million (TPM). Taxonomic profiles of microbial phyla based on Kraken2 annotations were visualized using Circos via the Wekemo Bioincloud (https://www.bioincloud.tech/, acessed on 6 March 2025) [27]. Stacked bar plots were generated using GraphPad Prism 6 (GraphPad Software, San Diego, CA, USA). Additionally, a graphical diagram was created using BioRender (https://www.biorender.com/, acessed on 6 March 2025) to illustrate the impacts of the different shellfish zones on carbon contents and carbon-cycling functional genes.

3. Results

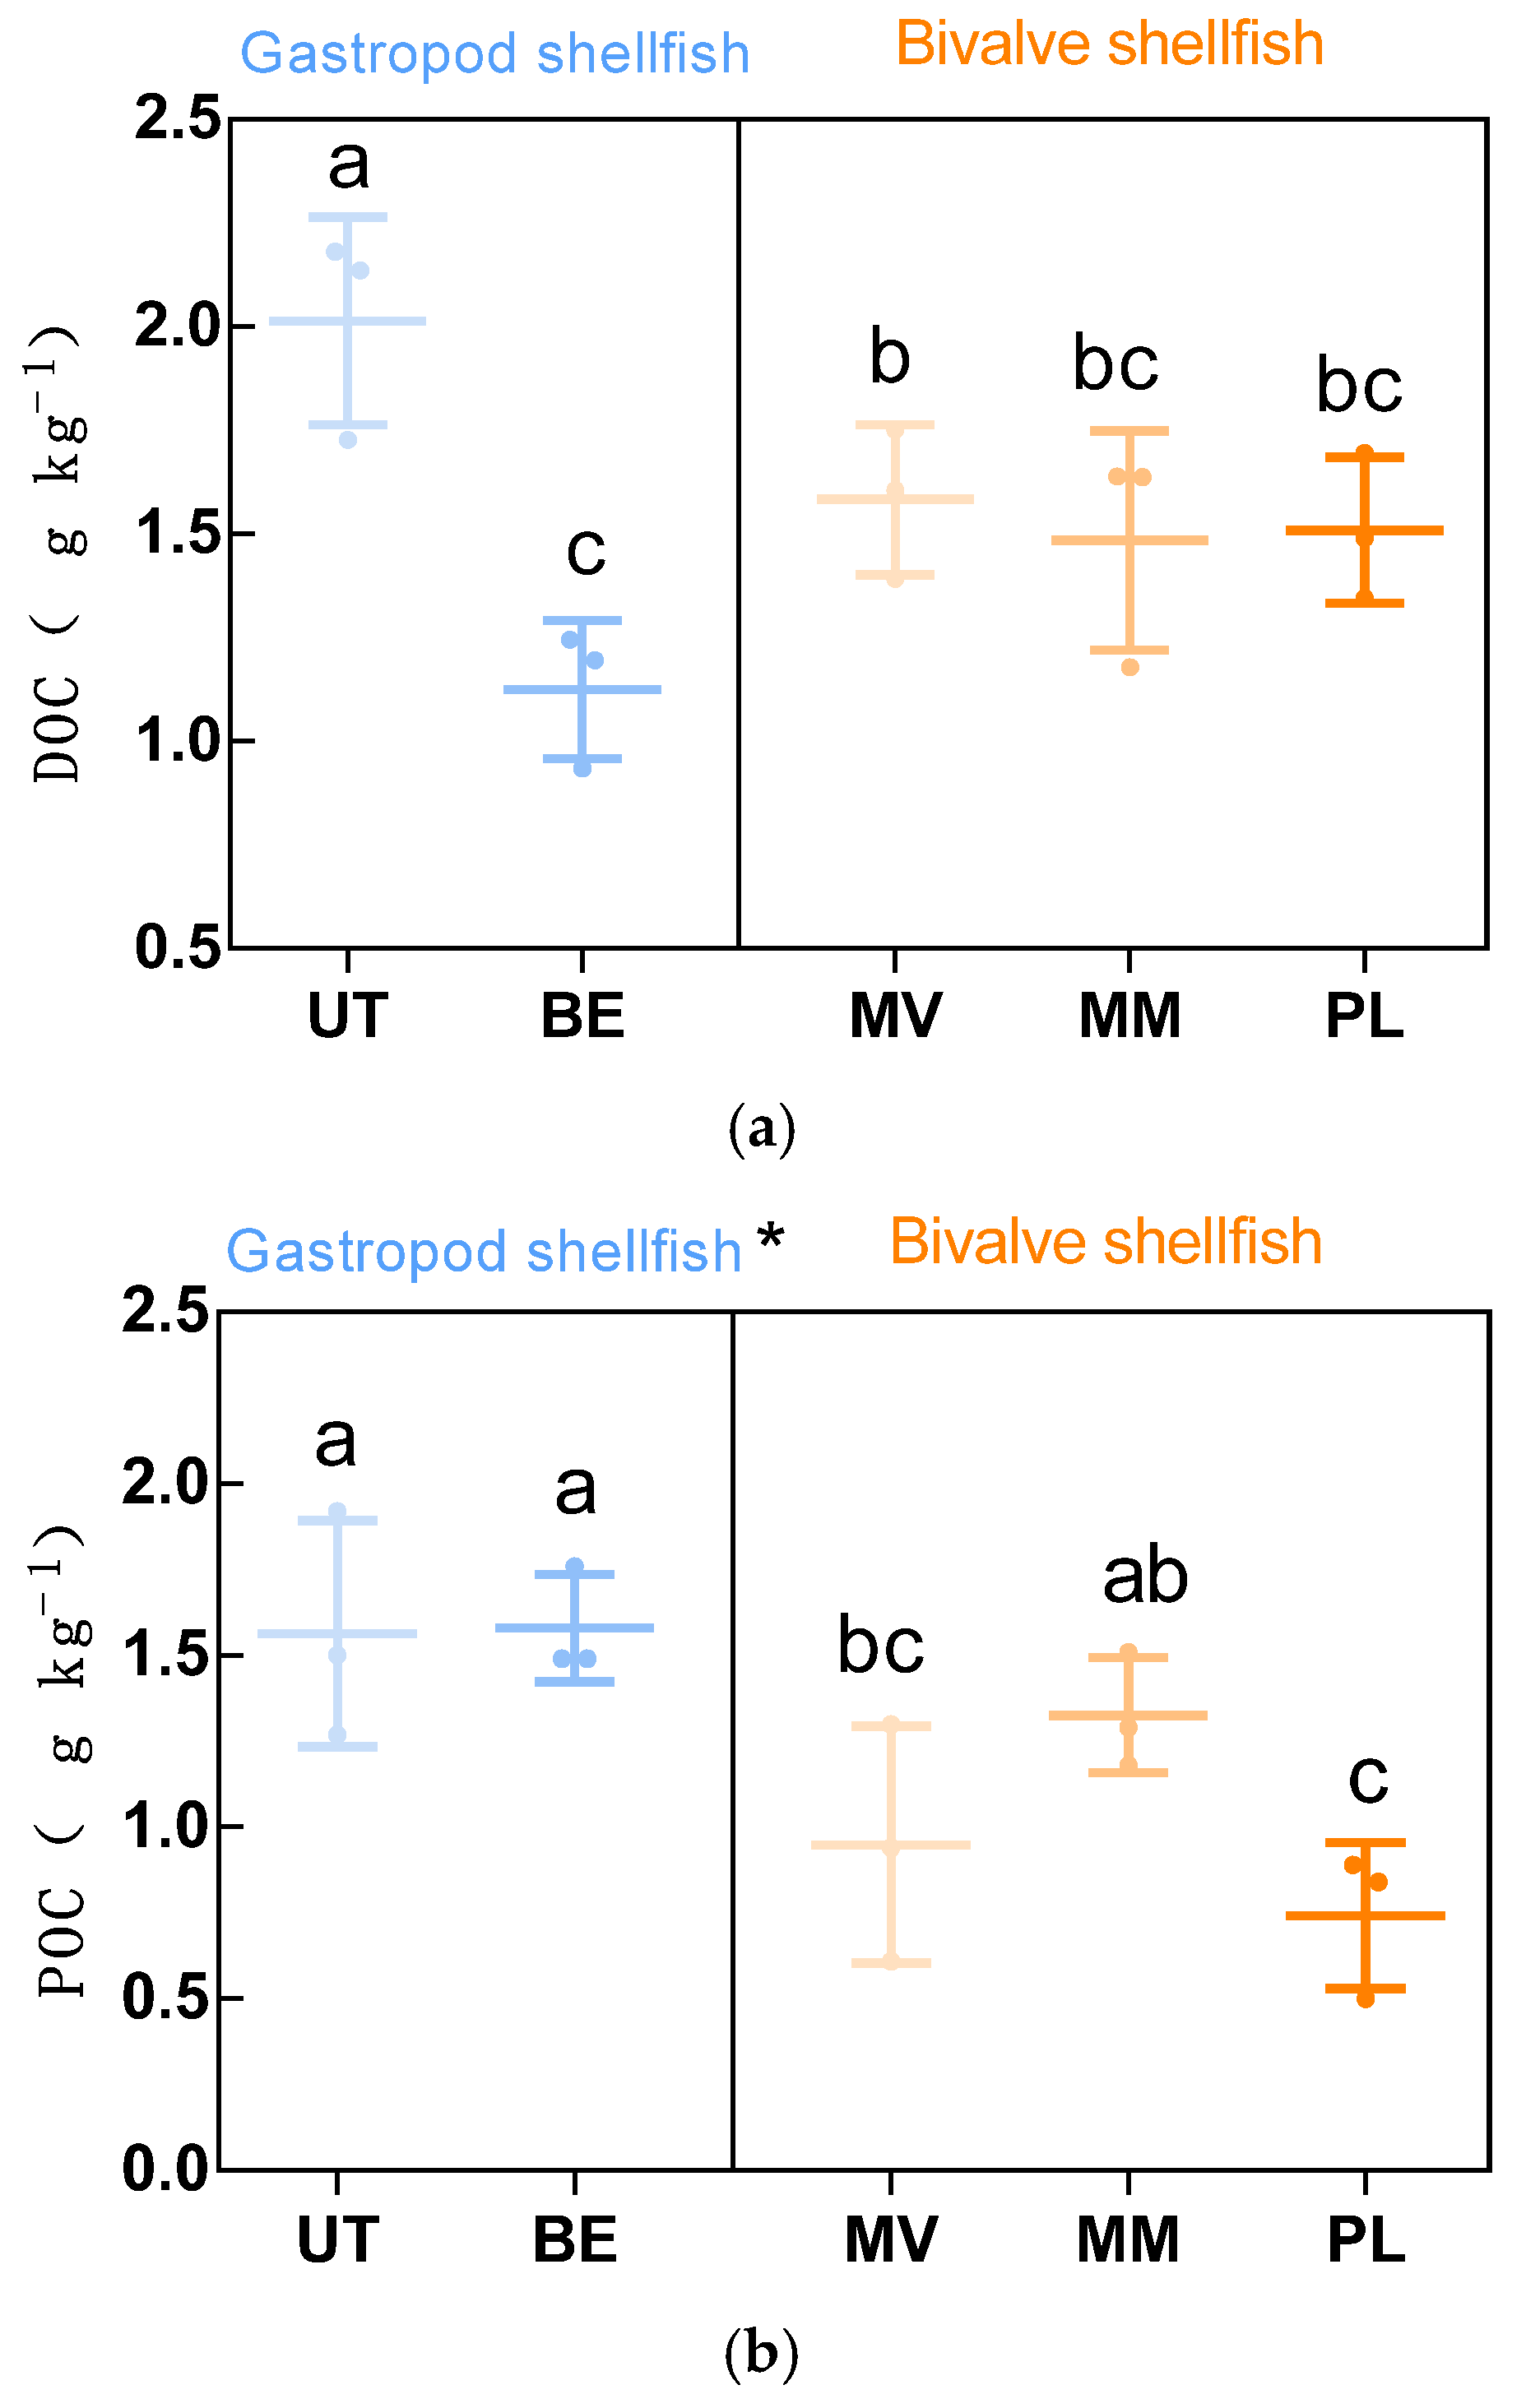
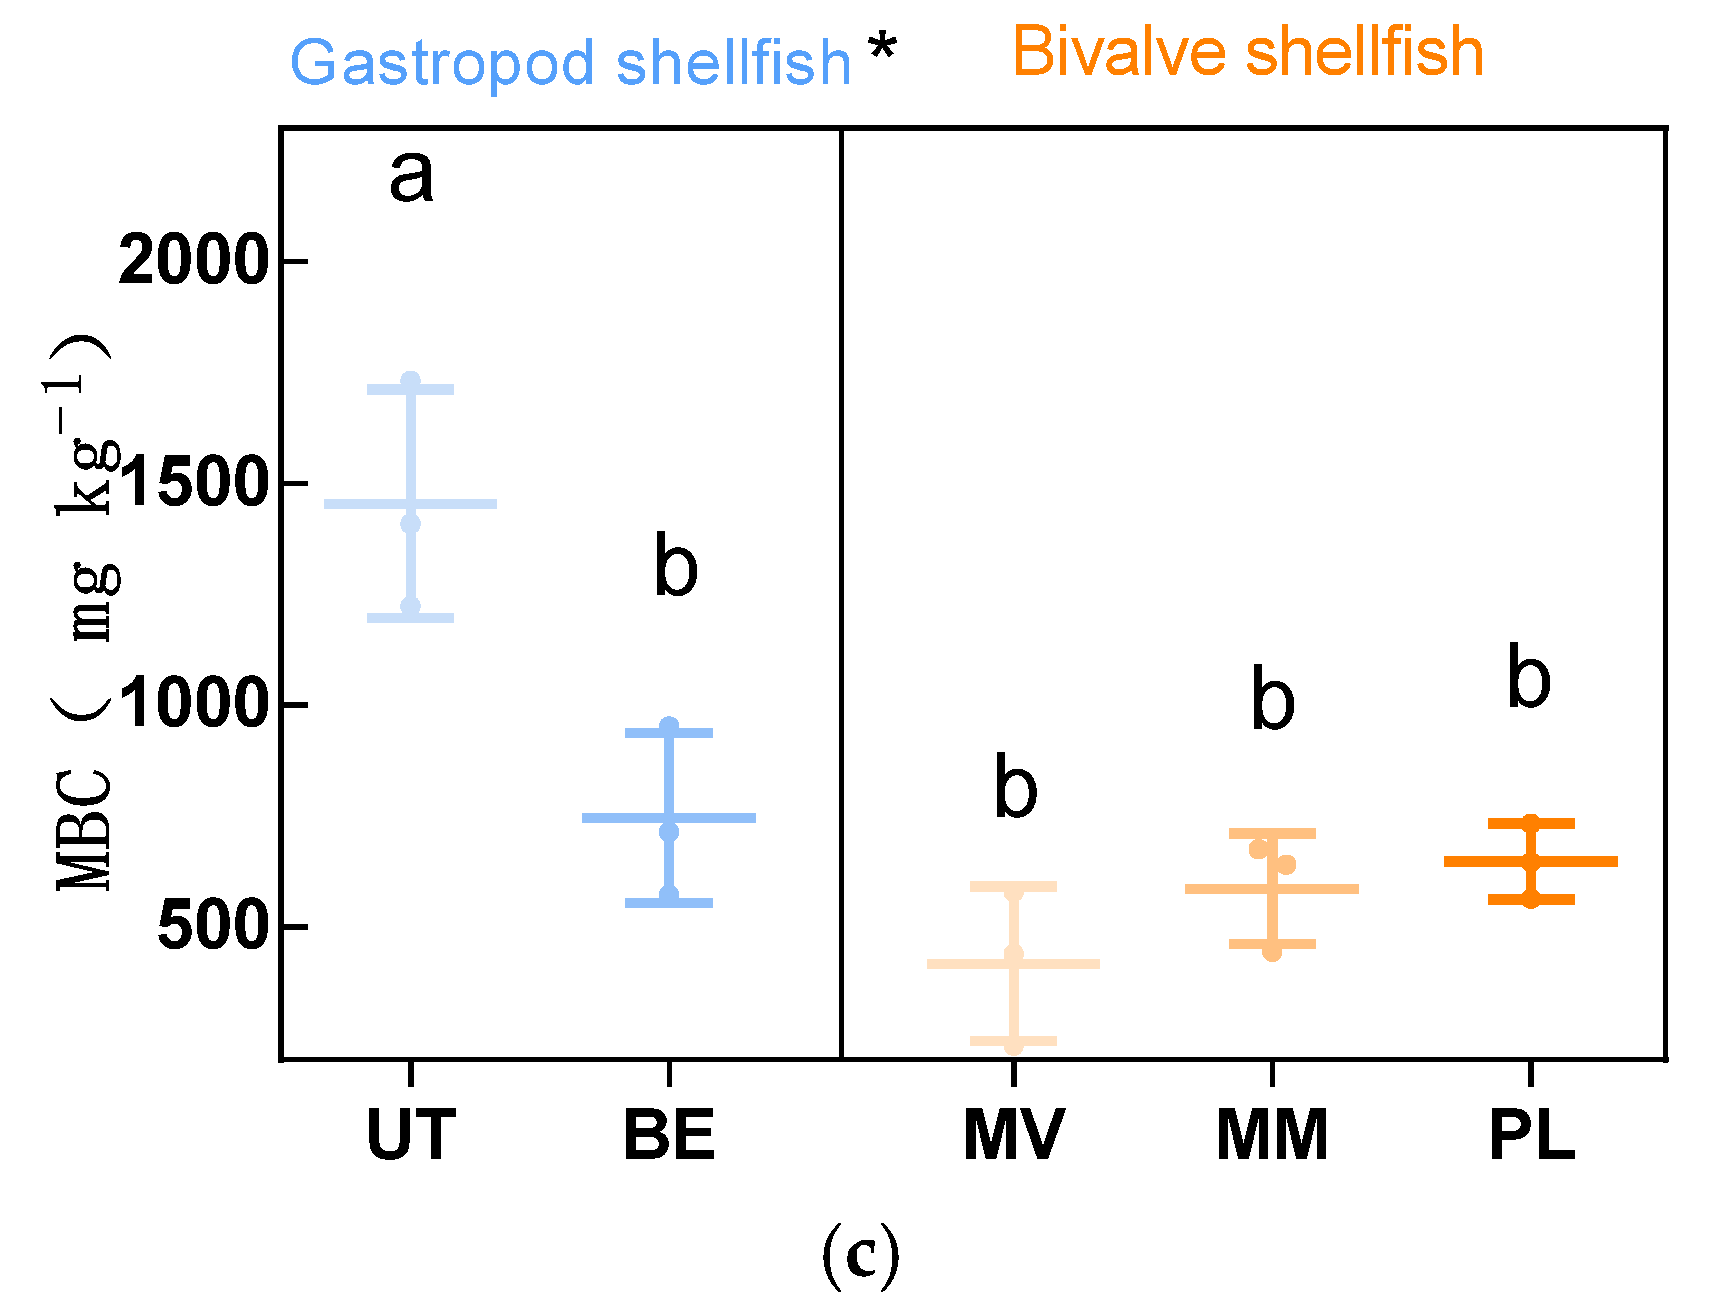
3.1. Distribution of DOC, POC, MBC

The concentrations of dissolved organic carbon (DOC) in the Geligang wetland ranged from (1.125 ± 0.167) to (2.014 ± 0.250) g·kg−1 (Figure 2a), while particulate organic carbon (POC) levels varied from (0.743 ± 0.212) to (1.580 ± 0.158) g·kg−1 (Figure 2b). Microbial biomass carbon (MBC) content ranged from (416.993 ± 173.792) to (1453.49 ± 256.908) mg·kg−1 (Figure 2c). The average DOC, POC, and MBC concentrations in the gastropod shellfish were 1.570 g·kg−1, 1.572 g·kg−1, and 1302.022 mg·kg−1, respectively. These values were all higher than those observed in bivalve shellfish, which recorded averages of 1.526 g·kg−1 for DOC, 1.007 g·kg−1 for POC, and 651.564 mg·kg−1 for MBC. Notably, the POC and MBC contents in gastropod shellfish were 56.11% and 99.83% higher, respectively, than those in bivalve shellfish (p < 0.05, Figure 2b,c). Furthermore, the UT (Umbonium thomasi) area exhibited significantly higher DOC, POC, and MBC levels than the bivalve shellfish (p < 0.05), with the exception of POC in the MM (Meretrix meretrix) area, which did not show a significant difference.

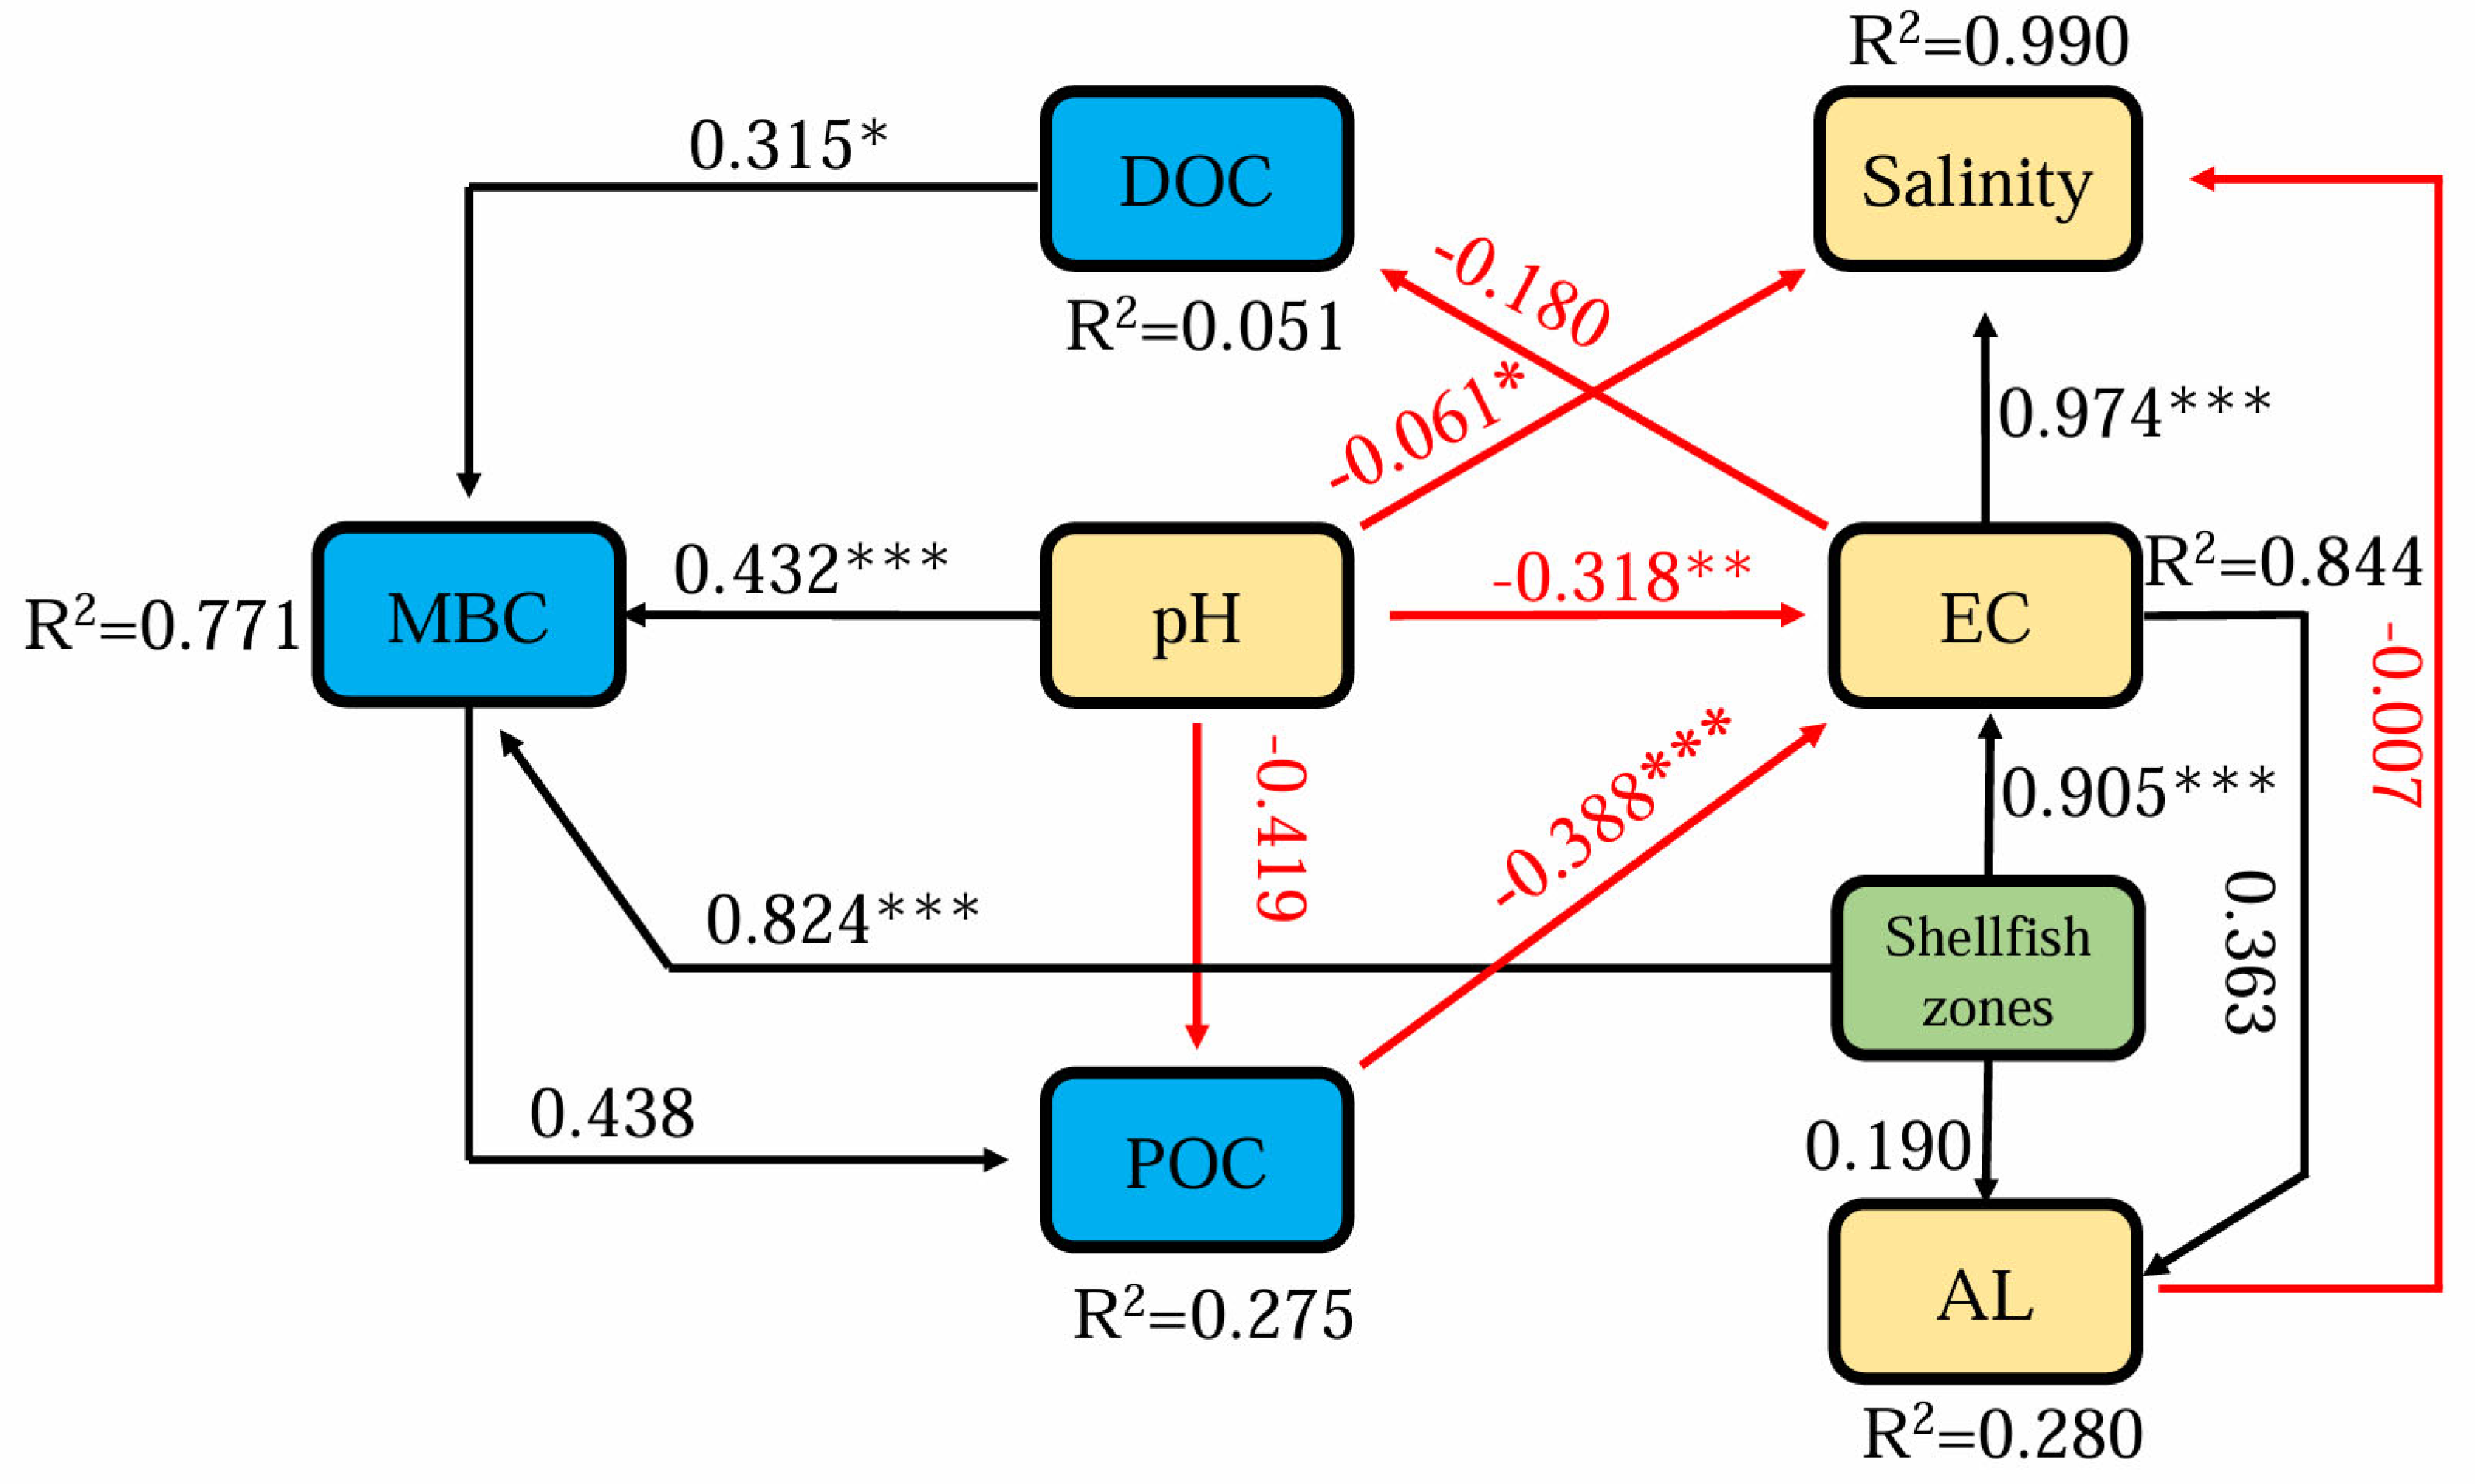
3.2. Relationship Among Sediment Enzyme Activity with Different Carbon Fractions

The average enzyme activity of invertase (INV) in sediments from gastropod shellfish was lower than that in bivalve shellfish (Figure 3b). Additionally, catalase (CAT) activity in the gastropod group was significantly lower than in the bivalve group (Figure 3d; p < 0.05). In contrast, amylase (AMY) activity showed the opposite trend (Figure 3c). Moreover, all four enzyme activities—polyphenol oxidase (PPO), AMY, INV, and CAT—in the PL (Potamocorbula laevis) region were significantly different from those in other regions (p < 0.05), suggesting potential site-specific regulation of microbial carbon cycling processes.
Changes in shellfish grouping across different production areas were significantly negatively correlated with DOC and MBC concentrations (Figure 4a,c; p < 0.01). Similarly, PPO activity exhibited a significant negative correlation with DOC and MBC (Figure 4a,c; p < 0.05). In addition, variations in invertase (INV) activity associated with different shellfish zones showed significant negative correlations with both POC and MBC (Figure 4b,c; p < 0.05), indicating a potential link between carbon fractions and microbial enzymatic responses under different shellfish influences.
To explore the ecological relationships between shellfish zones, sediment biogeochemical properties, and carbon components, a structural equation model (SEM) was developed based on existing theoretical and empirical literature.
Shellfish zones were included as ecological drivers due to their well-documented role in altering sediment conditions and microbial processes through bioturbation and biodeposition [28,29]. MBC and POC were selected as key biological carbon indicators representing microbial and particulate carbon pools, which are commonly used to reflect carbon cycling efficiency and ecological function in wetland systems [30]. Meanwhile, DOC, pH, EC, and AL were incorporated as mediating environmental factors, as they are known to influence carbon solubility, microbial carbon use efficiency, and organic matter aggregation [31]. Based on these hypothesized relationships, multiple direct and indirect paths were specified and tested in the SEM. The standardized path coefficients and model fit indices are presented below.
The SEM results showed that shellfish zones directly influenced MBC (λ = 0.824, p < 0.001). Additionally, the DOC, pH, and shellfish zones indirectly influenced POC through their effects on MBC, and the pathway were “Shellfish zones→MBC (λ = 0.824, p < 0.001)→POC”, “pH→MBC (λ = 0.432, p < 0.001)→POC” and “DOC→MBC (λ = 0.315, p < 0.05)→POC”, respectively (Figure 5). Furthermore, shellfish zones indirectly affected the sediment MBC through the pathway “Shellfish zones →Electrical conductivity (EC) (λ = 0.905, p < 0.001) →DOC (λ = −0.180, p > 0.05)→MBC (λ = 0.315, p < 0.05)”. These findings are consistent with the significant influence of shellfish zones on sediment MBC content, as illustrated in Figure 4c.

3.3. Effects of Different Shellfish Zones on C Cycling-Related Composition and Gene Abundance of Sediment Microbial Communities

The sediment microbial community’s eco-strategy exhibited differences between gastropods and bivalves. Specifically, the abundances of copiotrophic—Proteobacteria, Bacteroidetes, and Actinobacteria—were higher in the bivalve group than in the gastropod group (Figure 6a). In contrast, a type of oligotrophic microbe group Chloroflexi was more abundant in the gastropod group than in the bivalve group (Figure 6a). At the species level, microbial communities in the bivalve zones exhibited substantially higher species richness, with a 69.13% increase in the number of observed species compared to the gastropod zones (Figure 6b), indicating greater microbial diversity under bivalve influence.
The Circus and Venn diagram data were visualized using Circos in Wekemo Bioincloud (https://www.bioincloud.tech/, acessed on 6 March 2025).
The presence of shellfish significantly influenced the abundance of genes involved in carbon (C) fixation and degradation (Figure 7). Overall, the abundance of C fixation genes was 14.54% lower in the gastropods compared to the bivalves (Figure 6a, p < 0.01). Among the five studied zones, UT and BE, both belonging to the gastropods, exhibited significantly lower gene abundances than MM and PL, which are part of the bivalves (p < 0.05). Moreover, within the bivalve zones, a gradual increase in carbon fixation gene abundance was observed from MV to MM and PL, with the PL area exhibiting the highest levels among all sampling areas (p < 0.05; Figure 7a). Specifically, the PL zone showed significantly higher abundances of genes associated with the Calvin cycle (reductive pentose phosphate pathway), phosphate acetyltransferase-acetate kinase pathway, and incomplete reductive citrate cycle, compared to all other zones (p < 0.05). Additionally, with the exception of the MV zone, bivalve-associated areas exhibited significantly greater gene abundances for alternative carbon fixation pathways—including the reductive citrate cycle (Arnon-Buchanan cycle), dicarboxylate–hydroxybutyrate cycle, and 3-hydroxypropionate bi-cycle—than those in the gastropod zones (Figure 7a, p < 0.05).
No significant difference was observed in the abundance of carbon degradation genes between the gastropods and bivalves. However, the UT area within the gastropod group exhibited significantly lower gene abundance than the MM area of the bivalve group (Figure 7b, p < 0.05). No significant differences were observed among the other shellfish zones. C-degradation genes associated with various substrates demonstrated distinct variation across the five zones. Among them, the PL zone exhibited the highest abundance of carbon fixation genes (Figure 7a, p < 0.05). In contrast, the MM zone displayed the highest abundance of carbon degradation genes, whereas the UT zone showed the lowest (Figure 7b).
In the gastropod group, the abundance of carbon degradation genes associated with disaccharide and cellulose degradation in the UT zone was significantly higher than that in the BE zone. Within the bivalve group, the gene abundance related to the degradation of lignin, cellulose, and disaccharides in the MV and MM zones was significantly higher than that in the PL zone (Figure 7b, p < 0.05).
Among the five shellfish zones, the abundance of monosaccharides degradation genes was the highest overall (Figure 7b). The PL zone exhibited the highest abundance of degradation genes for chitin, aminosugars, and hemicellulose, with the gene abundances for chitin and hemicellulose in the PL zone being significantly higher than those in the other zones (Figure 7b, p < 0.05).

4. Discussion

In this study, we focus on the differential responses of (1) blue carbon components and (2) sediment microbial communities to spatial variations in shellfish zones within the Geligang wetlands, a representative coastal wetland in Liaodong Bay.

4.1. The Presence of Gastropods Increased Sediment POC and MBC

Mariculture of shellfish has been shown to accumulate various forms of carbon and contribute to the organic matter pool [32]. In this study, POC and MBC concentrations were significantly higher in gastropod zones compared to bivalve zones (Figure 2b,c), particularly in the UT area. These differences likely stem from contrasting bioturbation intensities, feeding behaviors, and associated microbial processes between the two shellfish groups.
Gastropods such as Umbonium thomasi and Bullacta exarata mainly graze on surface detritus, resulting in relatively low sediment disturbance and enhanced retention of particulate and microbial carbon. In contrast, bivalves (e.g., Meretrix meretrix, Potamocorbula laevis) exhibit stronger burrowing activity, increasing sediment mixing and oxygenation, which can promote deeper organic matter decomposition and reduce surface-layer carbon concentrations [33]. This is consistent with previous findings that bioturbation can enhance the exposure of labile carbon to microbial attack, thereby accelerating its mineralization [34,35,36].
The biogeochemical transformation of organic carbon is also influenced by the sediment environment. DOC, as a soluble and active carbon pool, can associate with humic substances and be converted to POC under saline–alkaline conditions [37]. Salinity increases electrostatic repulsion among particles, allowing extracellular polysaccharides released by bacteria to participate in flocculation processes, which facilitate POC formation [38,39]. Our findings showed slightly higher DOC concentrations in the gastropod group compared to the bivalve group (Figure 2a), similar to trends reported in the Jiaozhou Bay wetland [13].
Sediment enzyme activity patterns provide additional mechanistic insights. Amylase activity was significantly higher in gastropod zones (Figure 3c), potentially enhancing the breakdown of starch-like compounds into substrates favorable for microbial biomass accumulation. In contrast, catalase and invertase activities were elevated in bivalve zones (Figure 3b,d), reflecting intensified oxidative and hydrolytic processes that could accelerate organic carbon turnover [40,41,42]. These results align with studies showing that extracellular enzymes are sensitive indicators of microbial metabolic strategies in response to organic inputs [43,44].
Moreover, polyphenol oxidase (PPO), a key enzyme involved in aromatic compound degradation and humus formation, showed lower activity in gastropod zones and significant negative correlations with DOC and MBC (Figure 4a,c). This suggests that reduced PPO activity may limit humification, enabling more labile carbon to persist in the system [41,45]. The low PPO activity may also be attributed to inhibition under alkaline conditions (Figure 3a), as suggested by previous studies [42].
To further investigate microbial functional responses, we analyzed the abundance of carbon-related functional genes. The bivalve zones exhibited a higher relative abundance of genes associated with lignin and recalcitrant carbon degradation, consistent with elevated CAT activity and enhanced carbon turnover potential in these sediments (Figure 7b). These functional gene profiles reinforce the proposed linkage between shellfish community structure, enzymatic activity, and carbon cycling dynamics.
Overall, these findings suggest that higher POC and MBC levels in gastropod zones result from a combination of reduced sediment disturbance, enhanced carbon retention via biochemical processes, and microbially mediated enzymatic dynamics. This highlights the important regulatory role of benthic faunal composition in shaping sediment carbon cycling pathways.
The structural equation model (SEM) was a statistical method based on the covariance matrix of variables to analyze the relationship between variables [13]. In our study, the SEM revealed that 77.1% of the variation in MBC could be explained, with shellfish zones exerting the strongest direct influence on MBC (λ = 0.824, p < 0.001), followed by contributions from DOC and pH (Figure 5). This underscores the dominant role of shellfish zones in shaping microbial carbon dynamics in sediment ecosystems. Moreover, shellfish zones indirectly influenced DOC levels via their effect on electrical conductivity (EC), and DOC had a direct and significant effect on MBC (λ = 0.315, p < 0.05). A further indirect pathway was observed linking pH → MBC → POC, highlighting the importance of pH-mediated microbial processes in particulate carbon formation. Collectively, these pathways indicate that MBC functions as a central mediator that integrates multiple environmental and ecological inputs, ultimately regulating the distribution of particulate organic carbon (POC). These results demonstrate that shellfish are not merely passive indicators of sediment quality but active modulators of biogeochemical processes. Shellfish organisms, particularly filter-feeding bivalves, are known to alter redox gradients and organic matter availability through bioturbation and biodeposition, which can enhance microbial activity and stimulate carbon cycling [28,29]. The strong linkage between shellfish zones and MBC supports this ecological engineering role. Additionally, the path DOC → MBC → POC reflects the classical microbial loop in aquatic systems, in which dissolved organic carbon fuels microbial biomass, which, in turn, contributes to organic matter transformation and aggregation [30,31]. In summary, our findings suggest that shellfish zones represent key ecological drivers of microbial and particulate carbon pools in coastal sediment ecosystems, acting through both direct biological processes and indirect environmental pathways. The structural integration of biotic and abiotic variables in the SEM highlights the complex but traceable interactions that regulate blue carbon dynamics.
Blue carbon storage has been shown to vary substantially with sediment depth [46]. However, this study is specifically focused on surface sediment layers, examining components such as DOC, POC, and MBC, while deeper sediment strata were not included in the current analysis. Therefore, further investigations are necessary to determine whether comparable patterns of carbon variation occur at greater sediment depths.

4.2. Microbial Community Responses to Shellfish Habitat

It is well recognized that macrofaunal bioturbation significantly alters the physical, chemical, and biological properties of aquatic sediments, thereby enhancing the mineralization rates of organic matter [33,47].
Previous research has identified organic carbon content in sediments as a key determinant of microbial diversity, with high levels of organic carbon often associated with reduced microbial diversity [48]. In our study, the bivalve group exhibited lower concentrations of blue carbon components (including DOC, POC, and MBC) than the gastropod group (Figure 2). At the species level, the bivalve group demonstrated a substantially greater diversity of microbial species, with a 69.13% higher richness compared to the gastropod group (Figure 6b), which is consistent with the previous study [48].
The feeding habits of different shellfish species can exert distinct influences on microbial communities [49,50,51]. Previous studies have shown that the scraping feeding behavior of gastropods significantly reduces the abundance of surface microorganisms in sediments [52]. In contrast, bivalves, as filter-feeding organisms, deposit organic matter into sediments by filtering suspended particles from the water column [50]. This deposited organic matter provides a rich nutrient source for sediment-dwelling microorganisms, potentially leading to increased microbial populations. Furthermore, bivalves produce feces and pseudofeces, which may also influence microbial community structures. The previous study revealed that the presence of bivalves (Corbicula fluminea) enhances microbial diversity, with the production of feces and pseudofeces playing a notable role in this process [53]. Moreover, gastropods primarily rely on copiotrophic bacteria, supplemented by the consumption of detritus [54]. Our findings indicate that the copiotrophic bacterial population was higher in the bivalve group than in the gastropod group (Figure 6a). In agreement with previous research, our results further demonstrate that the bivalve group exhibited a higher microbial abundance in the sediment, supporting these observations.

4.3. The Presence of Shellfish in Sediment Influences Genes Involved in C Cycling

The observed differences in microbial community composition between bivalves and gastropods suggest that these two groups of organisms occupy distinct ecological niches. They also interact with their respective environments. The higher abundance of Proteobacteria, Bacteroidetes, and Actinobacteria in bivalves (Figure 6a) may be attributed to their specific habitat preferences and feeding strategies, which appear to favor the enrichment of these bacterial taxa. In contrast, the dominance of Chloroflexi in the gastropods may be attributed to their unique physiological traits and adaptation to particular environmental conditions.
Overall, the total number of species in the gastropod group was lower than that in the bivalve group. Additionally, the abundance of C fixation genes in the gastropod group was significantly lower than that in the bivalve group (Figure 7a). Functional genes are generally regarded as more direct indicators of microbial ecological functions, especially in C cycling [55,56]. Our results confirm that the bivalve group enhanced the microbial C-fixation capacity at the gene level compared to the gastropod group. Furthermore, the relative abundances of key CO2 fixation pathways—including the Calvin–Benson–Bassham (CBB) cycle, the 3-Hydroxypropionate (3HP) bi-cycle, and the reductive tricarboxylic acid (rTCA) cycle—were higher in the bivalve group than in the gastropod group (Figure S2). These findings suggest that bivalves may enhance the microbial capacity for CO2 fixation more effectively than gastropods.
Among all the carbon degradation genes, the genes related to monosaccharide degradation exhibited the highest abundance, followed by those associated with lignin, while genes related to chitin degradation showed the lowest abundance (Figure 7b). Notably, the abundance of chitin- and hemicellulose-degrading genes was significantly higher in the bivalve group than in the gastropod group, especially in the PL zone (p < 0.05). In soil environments, hemicellulose is known to stimulate microbial growth [57]. To meet their growth requirements, microorganisms in the bivalve group upregulated a greater number of genes encoding hemicellulose-degrading enzymes (Figure 7b). Within the study area, the presence of hemicellulose is likely influenced by tidal seawater dynamics, which consequently enhances the abundance of microorganisms. Additionally, bivalves significantly increased the abundance of chitin-degrading genes, especially in the PL zone (p < 0.05). This may be attributed to the accumulation of chitin, a key component in shell formation, with bivalves exhibiting higher chitin production rates. As a result, bivalves can directly influence microbial functional composition and promote the expression of genes encoding labile C-degradation enzymes, thereby accelerating sedimentary carbon decomposition.

5. Conclusions

In summary, the zones of gastropods (Bullacta exarate, Umbonium thomasi) and bivalves (Mactra veneriformis, Meretrix meretrix and Potamocorbula laevis) exerted significant influences on the blue carbon components (DOC, POC, MBC) and sedimentary microorganisms (Figure 8). Sediments within the gastropods group exhibited higher concentrations of blue carbon compared to those in the bivalves group, with particularly notable increases in POC and MBC levels—by 56.11% and 99.83%, respectively. This elevated blue carbon content was associated with a lower microbial richness and gene abundance, highlighting a potential trade-off between carbon storage and microbial diversity. These variations were primarily attributed to the distinct feeding strategies and ecological behaviors of different shellfish species. Furthermore, bivalves significantly enhanced the abundance of functional genes associated with carbon fixation, especially genes related to the Arnon–Buchanan cycle, hydroxypropionate-hydroxybutylate cycle, and 3-Hydroxypropionate bi-cycle. Consequently, the distinct biological traits of gastropods and bivalves drive differences in both blue carbon dynamics and microbial functionality. These findings underscore the necessity for species-specific ecological management strategies in shellfish aquaculture to optimize blue carbon sequestration in coastal wetlands. This study offers mechanistic insights into the interactions among shellfish types, microbial carbon-processing pathways, and sedimentary blue carbon pools, thereby providing a theoretical foundation for future assessments of carbon sink potential in coastal ecosystems.

Supplementary Materials

The following supporting information can be downloaded at: https://www.mdpi.com/article/10.3390/w17121728/s1. Figure S1: Metagenomic Sequencing and Data Processing Pipeline. Figure S2: Relative abundances of the pathways involved in the carbon cycle; Table S1: The gene names, database identifiers (KO, Kyoto Encyclopedia of Genes and Genomes) and functional descriptions of carbon degradation in our study; Table S2: The database identifiers (pathway module of KO, Kyoto Encyclopedia of Genes and Genomes) and functional descriptions of carbon fixation in our study.

Author Contributions

Q.H.: Writing—original draft, visualization, validation, methodology, investigation, formal analysis, data curation, and conceptualization. B.L.: Conceptualization, project administration, resources, writing—review and editing, investigation. F.Z.: Methodology. Y.B. and M.S.: Investigation and resources. R.Z. and X.W.: Investigation. X.L.: Conceptualization, resources, and supervision. C.Z.: Writing—review and editing, conceptualization, and supervision. All authors have read and agreed to the published version of the manuscript.

Funding

This research was funded by the National Key Research and Development Program of China, grant number 2023YFD2400800.

Data Availability Statement

All the raw sequencing reads from this study have been submitted to the NCBI Sequence Read Archive (SRA) under accession numbers PRJNA1240366 (they will be released during review).

Acknowledgments

The authors want to thank Panjin Guanghe Crab Industry Co., Ltd., for providing the experimental area and the crew members and employees of Panjin Guanghe Crab Industry Co., Ltd., who assisted in sea sampling to ensure our safety. We also want to thank Lin Fu, Xiangyu Wang, Chuanyu Han, Haishi Qi, Hongbo Jiang, and Yingying Zhao for their comments and suggestions on our study.

Conflicts of Interest

Yongan Bai, Muzhan Sun, and Xiaodong Li were employed by Panjin Guanghe Crab Industry Limited Company. The remaining authors declare that the research was conducted in the absence of any commercial or financial relationships that could be construed as a potential conflict of interest.

Abbreviations

The following abbreviations are used in this manuscript:
DOCDissolved organic carbon
POCParticulate organic carbon
MBCMicrobial biomass carbon
BEBullacta exarata
UTUmbonium thomasi
MVMactra veneriformis
MMMeretrix meretrix
PLPotamocorbula laevis
PPOPolyphenol oxidase
AMYAmylase
INVInvertase
CATCatalase
SEMStructural equation modeling
ECElectrical conductivity
ALAlkalinity
C cyclingCarbon cycling

References

  1. Holmén, K. 11—The Global Carbon Cycle. In International Geophysics; Jacobson, M.C., Charlson, R.J., Rodhe, H., Orians, G.H., Eds.; Academic Press: New York, NY, USA, 2000; pp. 282–321. [Google Scholar] [CrossRef]
  2. DeVries, T.; Holzer, M.; Primeau, F. Recent Increase in Oceanic Carbon Uptake Driven by Weaker Upper-Ocean Overturning. Nature 2017, 5427640, 215–218. [Google Scholar] [CrossRef]
  3. Friedlingstein, P.; O’Sullivan, M.; Jones, M.W.; Andrew, R.M.; Bakker, D.C.E.; Hauck, J.; Landschützer, P.; Le Quéré, C.; Luijkx, I.T.; Peters, G.P.; et al. Global Carbon Budget 2023. Earth Syst. Sci. Data 2023, 15, 5301–5369. [Google Scholar] [CrossRef]
  4. Bonan, G.B. Forests and Climate Change: Forcings, Feedbacks, and the Climate Benefits of Forests. Science 2008, 3205882, 1444–1449. [Google Scholar] [CrossRef]
  5. Jian, N.; Liang, Y.; Zhang, Y.; Liu, J.; Zhang, Y.; Zhang, R.; Zhao, M.; Dai, M.; Zhai, W.; Gao, K.; et al. Carbon pools and fluxes in the China Seas and adjacent oceans. Sci. China Earth Sci. 2018, 61, 1535–1563. [Google Scholar] [CrossRef]
  6. Jiao, N.; Wang, H.; Xu, G.; Aricò, S. Blue Carbon on the Rise: Challenges and Opportunities. Natl. Sci. Rev. 2018, 54, 464–468. [Google Scholar] [CrossRef]
  7. Zhang, J.; Liu, J.; Zhang, Y.; Li, G. Strategic Approach for Mariculture to Practice “Ocean Negative Carbon Emission. Bull. Chin. Acad. Sci. 2021, 3603, 252–258. [Google Scholar] [CrossRef]
  8. Lu, J.; Breitwieser, F.P.; Thielen, P.; Salzberg, S.L. Bracken: Estimating Species Abundance in Metagenomics Data. Peej Comput. Sci. 2017, 3, e104. [Google Scholar] [CrossRef]
  9. Abatenh, E.; Gizaw, B.; Tsegaye, Z.; Tefera, G. Microbial Function on Climate Change—A Review. Open J. Environ. Biol. 2018, 3, 001–007. [Google Scholar] [CrossRef]
  10. Liang, C.; Amelung, W.; Lehmann, J.; Kästner, M. Quantitative Assessment of Microbial Necromass Contribution to Soil Organic Matter. Glob. Chang. Biol. 2019, 2511, 3578–3590. [Google Scholar] [CrossRef]
  11. Zamanian, K.; Zarebanadkouki, M.; Kuzyakov, Y. Nitrogen Fertilization Raises CO2 Efflux from Inorganic Carbon: A Global Assessment. Glob. Chang. Biol. 2018, 247, 2810–2817. [Google Scholar] [CrossRef]
  12. Zhu, N.; Zhu, Y.; Li, B.; Jin, H.; Dong, Y. Increased Enzyme Activities and Fungal Degraders by Gloeophyllum Trabeum Inoculation Improve Lignocellulose Degradation Efficiency During Manure-Straw Composting. Bioresour. Technol. 2021, 337, 125427. [Google Scholar] [CrossRef] [PubMed]
  13. Yu, J.; Wang, X.; Yang, S.; Guo, Y.; Liu, M.; Xi, M. Divergent Response of Blue Carbon Components to Wetland Types and Hydrological Effects in Typical Estuarine Wetlands of Jiaozhou Bay, China. J. Environ. Manag. 2023, 347, 119233. [Google Scholar] [CrossRef]
  14. Wang, X.Y.; Bian, Q.; Jiang, Y.J.; Zhu, L.Y.; Chen, Y.; Liang, Y.T.; Sun, B. Organic Amendments Drive Shifts in Microbial Community Structure and Keystone Taxa Which Increase C Mineralization across Aggregate Size Classes. Soil Biol. Biochem. 2021, 153, 108062. [Google Scholar] [CrossRef]
  15. Malaquias, M.A.E. Systematics, Phylogeny, and Natural History of Bullacta Exarata (Philippi, 1849): An Endemic Cephalaspidean Gastropod from the China Sea. J. Nat. Hist. 2010, 44, 2015–2029. [Google Scholar] [CrossRef]
  16. Halmi, M.F.A.; Simarani, K. Effect of Two Contrasting Biochars on Soil Microbiota in the Humid Tropics of Peninsular Malaysia. Geoderma 2021, 395, 115088. [Google Scholar] [CrossRef]
  17. Li, Y.; Li, Y.; Chang, S.X.; Yang, Y.; Fu, S.; Jiang, P.; Luo, Y.; Yang, M.; Chen, Z.; Hu, S.; et al. Biochar reduces soil heterotrophic respiration in a subtropical plantation through increasing soil organic carbon recalcitrancy and decreasing carbon-degrading microbial activity. Soil Biol. Biochem. 2018, 122, 173–185. [Google Scholar] [CrossRef]
  18. Xu, P.; Liu, Y.; Zhu, J.; Shi, L.; Fu, Q.; Chen, J.; Hu, H.; Huang, Q. Influence Mechanisms of Long-Term Fertilizations on the Mineralization of Organic Matter in Ultisol. Soil Tillage Res. 2020, 201, 104594. [Google Scholar] [CrossRef]
  19. Jackson, C.R.; Tyler, H.L.; Millar, J.J. Determination of Microbial Extracellular Enzyme Activity in Waters, Soils, and Sediments Using High Throughput Microplate Assays. J. Vis. Exp. 2013, 80, 50399. [Google Scholar] [CrossRef]
  20. Paul, E.A.; Morris, S.J.; Bohm, S. The Determination of Soil C Pool Sizes and Turnover Rates: Biophysical Fractionation and Tracers. In Assessment Methods for Soil Carbon, 1st ed.; Kimble, J.M., Follett, R.F., Stewart, B.A., Eds.; CRC Press: Boca Raton, FL, USA, 2000; pp. 193–206. [Google Scholar] [CrossRef]
  21. Joergensen, R.G.; Wu, J.; Brookes, P.C. Measuring Soil Microbial Biomass Using an Automated Procedure. Soil Biol. Biochem. 2011, 435, 873–876. [Google Scholar] [CrossRef]
  22. Langmead, B.; Salzberg, S.L. Fast Gapped-Read Alignment with Bowtie 2. Nat. Methods 2012, 9, 357–359. [Google Scholar] [CrossRef]
  23. Martin, M. Cutadapt Removes Adapter Sequences from High-Throughput Sequencing Reads. EMBnet J. 2011, 17, 10–12. [Google Scholar] [CrossRef]
  24. Schmieder, R.; Edwards, R. Quality Control and Preprocessing of Metagenomic Datasets. Bioinformatics 2011, 27, 863–864. [Google Scholar] [CrossRef] [PubMed]
  25. Wood, D.E.; Salzberg, S.L. Kraken: Ultrafast Metagenomic Sequence Classification Using Exact Alignments. Genome Biol. 2014, 153, R46. [Google Scholar] [CrossRef]
  26. Kang, H.; Ahn, J.W. Model Setting and Interpretation of Results in Research Using Structural Equation Modeling: A Checklist with Guiding Questions for Reporting. Asian Nurs. Res. 2021, 153, 157–162. [Google Scholar] [CrossRef]
  27. Gao, Y.; Zhang, G.; Jiang, S.; Liu, Y.-X. Wekemo Bioincloud: A User-Friendly Platform for Meta-Omics Data Analyses. iMeta 2024, 31, e175. [Google Scholar] [CrossRef] [PubMed]
  28. Aller, R.C. Bioturbation and Remineralization of Sedimentary Organic Matter: Effects of Redox Oscillation. Chem. Geol. 1994, 114, 331–345. [Google Scholar] [CrossRef]
  29. Sun, X.; Filgueira, R.; Sun, Y.; Han, M.; Tang, Q.; Sun, Y. Intensive oyster farming enhances carbon storage in sediments over decades. Commun. Earth Environ. 2025, 6, 383. [Google Scholar] [CrossRef]
  30. Zhang, Y.; Huang, Z.; Li, Y.; Ling, Y.; Xiao, H. Dynamics Variation of Soil Labile Organic Carbon Fractions in Different Wetland Types of Dongting Lake under Seasonal Water Level Fluctuation. Sustainability 2021, 13, 13836. [Google Scholar] [CrossRef]
  31. Tranvik, L.J.; Bertilsson, S. Contrasting Effects of Solar UV Radiation on Dissolved Organic Sources for Bacterial Growth. Ecol. Lett. 2001, 4, 458–463. [Google Scholar] [CrossRef]
  32. Xu, L.; Yang, Y.; Cui, Z.; Wang, Q. Carbon Dynamics in Seawater and Sediment: A Case Study of Shellfish and Seaweed Mariculture Systems. Mar. Environ. Res. 2025, 204, 106897. [Google Scholar] [CrossRef]
  33. Shen, H.; Thrush, S.F.; Wan, X.; Li, H.; Qiao, Y.; Jiang, G.; Sun, R.; Wang, L.; He, P. Optimization of Hard Clams, Polychaetes, Physical Disturbance and Denitrifying Bacteria of Removing Nutrients in Marine Sediment. Mar. Pollut. Bull. 2016, 1101, 86–92. [Google Scholar] [CrossRef] [PubMed]
  34. Kristensen, E.; Bouillon, S.; Dittmar, T.; Marchand, C. What Is Bioturbation? The Need for a Precise Definition for Fauna in Biogeochemical Studies. Mar. Ecol. Prog. Ser. 2012, 446, 285–302. [Google Scholar] [CrossRef]
  35. Stief, P. Stimulation of Microbial Nitrogen Cycling in Aquatic Ecosystems by Benthic Macrofauna: Mechanisms and Environmental Implications. Biogeosciences 2013, 10, 7829–7846. [Google Scholar] [CrossRef]
  36. Middelburg, J.J. Reviews and Syntheses: To the Bottom of Carbon Processing at the Seafloor. Biogeosciences 2018, 15, 413–427. [Google Scholar] [CrossRef]
  37. Babur, E.; Uslu, Ö.S.; Battaglia, M.L.; Mumtaz, M.Z.; Danish, S.; Fahad, S.; Diatta, A.A.; Datta, R.; Ozlu, E. Nitrogen Fertilizer Effects on Microbial Respiration, Microbial Biomass, and Carbon Sequestration in a Mediterranean Grassland Ecosystem. Int. J. Environ. Res. 2021, 154, 655–665. [Google Scholar] [CrossRef]
  38. Del Giorgio, P.A.; Cole, J.J. Bacterial Growth Efficiency in Natural Aquatic Systems. Annu. Rev. Ecol. Syst. 1998, 29, 503–541. [Google Scholar] [CrossRef]
  39. Von Wachenfeldt, E.; Bastviken, D.; Tranvik, L.J. Microbially Induced Flocculation of Allochthonous Dissolved Organic Carbon in Lakes. Limnol. Oceanogr. 2009, 545, 1811–1818. [Google Scholar] [CrossRef]
  40. Baćmaga, M.; Wyszkowska, J.; Kucharski, J. Bioaugmentation of Soil Contaminated with Azoxystrobin. Water Air Soil Pollut. 2017, 2281, 19. [Google Scholar] [CrossRef]
  41. Qu, Y.; Tang, J.; Li, Z.; Zhou, Z.; Wang, J.; Wang, S.; Cao, Y. Soil Enzyme Activity and Microbial Metabolic Function Diversity in Soda Saline–Alkali Rice Paddy Fields of Northeast China. Sustainability 2020, 1223, 10095. [Google Scholar] [CrossRef]
  42. Girelli, A.M.; Mattei, E.; Messina, A.; Tarola, A.M. Inhibition of Polyphenol Oxidases Activity by Various Dipeptides. J. Agric. Food Chem. 2004, 5210, 2741–2745. [Google Scholar] [CrossRef]
  43. Allison, S.D.; Vitousek, P.M. Responses of Extracellular Enzymes to Simple and Complex Nutrient Inputs. Soil Biol. Biochem. 2005, 37, 937–944. [Google Scholar] [CrossRef]
  44. Burns, R.G.; DeForest, J.L.; Marxsen, J.; Sinsabaugh, R.L.; Stromberger, M.E.; Wallenstein, M.D.; Weintraub, M.N.; Zoppini, A. Soil Enzymes in a Changing Environment: Current Knowledge and Future Directions. Soil Biol. Biochem. 2013, 58, 216–234. [Google Scholar] [CrossRef]
  45. Sinsabaugh, R.L. Phenol Oxidase, Peroxidase and Organic Matter Dynamics of Soil. Soil Biol. Biochem. 2010, 42, 391–404. [Google Scholar] [CrossRef]
  46. He, J.Y.; Yin, J.J.; Wu, J.P.; Christakos, G. Accurate Carbon Storage Estimation for the Salt Marsh Ecosystem Based on Bayesian Maximum Entropy Approach—A Case Study for the Spartina Alterniflora Ecosystem. J. Environ. Manag. 2024, 354, 120278. [Google Scholar] [CrossRef]
  47. Yuan, S.Y.; Zhu, W.J.; Neori, A.; Zhang, Y.; Li, M.; Li, J.; Chang, Z.Q. Benthic Suspension-Feeding Clams Affect Sedimentary Microbial Communities and Nitrogen Cycling in Seawater Pond Imta. Aquaculture 2023, 563, 738907. [Google Scholar] [CrossRef]
  48. Deng, W.; Chen, S.; Chen, S.; Xing, B.; Chan, Z.; Zhang, Y.; Chen, B.; Chen, G. Impacts of Eutrophication on Microbial Community Structure in Sediment, Seawater, and Phyllosphere of Seagrass Ecosystems. Front. Microbiol. 2024, 15, 1449545. [Google Scholar] [CrossRef] [PubMed]
  49. Ackerman, J.D. Book Review: Ecology of Marine Bivalves: An Ecosystem Approach. Ecology 1998, 791, 353–354. [Google Scholar] [CrossRef]
  50. Newell, R.I.E. Ecosystem Influences of Natural and Cultivated Populations of Suspension-Feeding Bivalve Molluscs: A Review. J. Shellfish. Res. 2004, 23, 51–61. [Google Scholar]
  51. Prins, T.C. A Review of the Feedbacks between Bivalve Grazingand Ecosystem Processes. Aquat. Ecol. 1997, 31, 349–359. [Google Scholar] [CrossRef]
  52. Gutiérrez, J.L.; Jones, C.G.; Strayer, D.L.; Iribarne, O.O. Mollusks as Ecosystem Engineers: The Role of Shell Production in Aquatic Habitats. Oikos 2003, 1011, 79–90. [Google Scholar] [CrossRef]
  53. Novais, A.; Souza, A.T.; Ilarri, M.; Pascoal, C.; Sousa, R. Effects of the Invasive Clam Corbicula Fluminea (Müller, 1774) on an Estuarine Microbial Community. Sci. Total Environ. 2016, 566–567, 1168–1175. [Google Scholar] [CrossRef] [PubMed]
  54. Wang, X.C.; Li, C.L.; Wang, M.X.; Zheng, P. Stable Isotope Signatures and Nutritional Sources of Some Dominant Species from the Pacmanus Hydrothermal Area and the Desmos Caldera. PLoS ONE 2018, 13, e0208887. [Google Scholar] [CrossRef] [PubMed]
  55. Liao, J.; Dou, Y.; Yang, X.; An, S. Soil Microbial Community and Their Functional Genes During Grassland Restoration. J. Environ. Manag. 2023, 13, e0208887. [Google Scholar] [CrossRef] [PubMed]
  56. Yang, Y.; Wu, L.; Lin, Q.; Yuan, M.; Xu, D.; Yu, H.; Hu, Y.; Duan, J.; Li, X.; He, Z.; et al. Responses of the Functional Structure of Soil Microbial Community to Livestock Grazing in the Tibetan Alpine Grassland. Glob. Chang. Biol. 2013, 192, 637–648. [Google Scholar] [CrossRef]
  57. Liu, Z.; Ma, C.Q.; Gao, C.; Xu, P. Efficient Utilization of Hemicellulose Hydrolysate for Propionic Acid Production Using Propionibacterium Acidipropionici. Bioresour. Technol. 2012, 114, 711–714. [Google Scholar] [CrossRef]
Figure 1. Map of the study area in Geligang, Liaodong Bay, China. The region is located in Panjin City and is influenced by the watershed systems of the Shuangtaizi River and the Liao River. Five major shellfish production zones were selected as sampling sites: UT (Umbonium thomasi), BE (Bullacta exarate), MV (Mactra veneriformis), MM (Meretrix meretrix), and PL (Potamocorbula laevis).
Water 17 01728 g001
Figure 2. Distributions of sediment carbon components under different shellfish. (a) DOC; (b) POC; (c) MBC. The points represent the three measured values. The horizontal coordinate represents different shellfish areas: Umbonium thomasi (UT), Bullacta exarata (BE), Mactra veneriformis (MV), Meretrix meretrix (MM), and Potamocorbula laevis (PL). The UT and BE represent the gastropod shellfish, while the MV, MM, and PL represent the bivalve shellfish. The different lowercase letters above the box denote statistically significant differences (LSD test, p < 0.05) among shellfish zones. Additionally, the asterisk (*) signifies a statistically significant difference (LSD test, p < 0.05) between the gastropod and bivalve categories.
Water 17 01728 g002aWater 17 01728 g002b
Figure 3. The sediment enzyme activities in different shellfish zones: Polyphenol oxidase (a), Invertase (b), Amylase (c), and Catalase (d). UT: Umbonium thomasi, BE: Bullacta exarata, MV: Mactra veneriformis, MM: Meretrix meretrix, PL: Potamocorbula laevis. The different lowercase letters above the box denote significant differences (LSD test) among different shellfish zones at p < 0.05. Additionally, the asterisk (*) signifies a statistically significant difference (LSD test, p < 0.05) between the gastropod and bivalve categories.
Water 17 01728 g003
Figure 4. The model coefficient plot of the fitting multiple regression models for the effects of predictive variables in DOC (a), POC (b), and MBC (c), respectively. Whiskers are the 95% confidence interval. The five predictive variables included in the multiple regression are Polyphenol oxidase (PPO), Amylase (AMY), Invertase (INV), Catalase (CAT), and shellfish zones. * p < 0.05, ** p < 0.01.
Water 17 01728 g004
Figure 5. Structural equation model of different shellfish zones affecting sediment physico-chemical properties (pH, Salinity, Electrical conductivity (EC), and Alkalinity (AL)) and sediment carbon components. Results of the goodness-of-fit statistics for the model: Chi-square (χ2) = 20.158, degree of freedom (df) = 13, p = 0.091, goodness-of-fit index (GFI) = 0.977. Numbers next to the arrows are the standardized path coefficients, and the arrows in black and red colors represent the positive and negative effects, respectively. * p < 0.05, ** p < 0.01, *** p < 0.001. The R2 next to each response variable indicates the proportion of variance explained by relationships with other variables.
Water 17 01728 g005
Figure 6. (a) Circos showed the distribution of microbial phylum of two shellfish groups (bivalves and gastropods) based on the taxonomic classification from the Kraken2. Circles from outside to inside: first and second colored circles: the right half of the circle represents the species abundance composition in the two shellfish groups, with different colors indicating different species and the length representing the species abundance proportion in the shellfish group; the left half of the circle represents the distribution proportion of the two shellfish groups, with different colors indicating different groups, the length indicating the distribution proportion of the group in a certain species. The third circle: the colored strip inside the circle, one end connects the shellfish groups (right semicircle), and the width of the endpoint of the strip represents the distribution proportion of the shellfish groups in the corresponding species. (b) Venn diagram based on absolute abundance data illustrated the number of common (overlapped) and endemic (unoverlapped) species at the genus level in the two shellfish groups.
Water 17 01728 g006
Figure 7. Changes in carbon fixation (a) and degradation (b) genes abundance of the gastropods (UT, BE) and bivalves (MV, MM, PL). UT: Umbonium thomasi, BE: Bullacta exarata, MV: Mactra veneriformis, MM: Meretrix meretrix, PL: Potamocorbula laevis. Mean ± SD (n = 3). Different lowercase letters next to the error bars indicate significant differences between genes involved in the C cycling in zones based on the ANOVA and LSD test (p < 0.05). Different capital letters above the bars indicate significant differences between the sum of genes of five zones based on the ANOVA and LSD test (p < 0.05). ** indicate significant differences between Gastropods and Bivalves based on the ANOVA and LSD test (p < 0.01).
Water 17 01728 g007
Figure 8. Schematic illustration of the effects of different shellfish on blue carbon contents (POC, MBC, DOC) and microbes based on our research. Figure created by BioRender (https://www.biorender.com/, acessed on 6 March 2025). POC: particulate organic carbon, MBC: microbial biomass carbon, DOC: dissolved organic carbon.
Water 17 01728 g008
Table 1. The data of five research areas.
Site Longitude Latitude
BE area121.8381459840.70742592
UT area121.8858288540.68225399
MV area121.9072799540.73062954
MM area121.8741976340.66285293
PL area121.8577373840.78455639
Disclaimer/Publisher’s Note: The statements, opinions and data contained in all publications are solely those of the individual author(s) and contributor(s) and not of MDPI and/or the editor(s). MDPI and/or the editor(s) disclaim responsibility for any injury to people or property resulting from any ideas, methods, instructions or products referred to in the content.

