1. Introduction
The initial 15 km long stretch of the Hel Peninsula coast is one of the most popular tourist destinations along the Polish coast and in the entire country. Moreover, it is permanently inhabited by almost 1000 people living there [
1]. Therefore, protecting the peninsula’s shores from the open seaside is crucial, especially given the fact of the narrow width of the peninsula in its northwestern part, sometimes reaching less than 150 m. Another threat to the peninsula is the contemporary climate change and the associated global sea level rise, which combined with other processes, could potentially endanger the continuity of the spit, which has already been broken several times in the past [
2]. For that reason, continuous monitoring of the coastal morphodynamics of this area is crucial, along with assessing the degree of coastal erosion to promptly respond to this phenomenon using an engineering approach. Shore protection methods such as groynes, artificial nourishment, and in some places, even seawalls have been applied here for decades [
3].
Artificial nourishment is a widely used soft engineering method worldwide, allowing for the reconstruction of eroded shoreface, beaches, or dunes without permanent environmental impact. Such interventions are applied on shores similar to the Hel Peninsula’s open sea coast, e.g., in the southern Baltic Sea: the Pomeranian Bay coast [
4], the eastern part of Ustka Bay [
5], or on the German North Frisian Islands in the North Sea [
6], as well as for the restoration of other types of sandy beaches; for instance, in the Mediterranean Sea basin [
7], or even on oceanic coasts [
8]. Very often, nourishment operations are motivated by socio-economic reasons, such as beach erosion affecting valuable infrastructure located in their hinterland or beaches serving as tourist destinations [
9].
Within the Hel Peninsula’s context, the application of nourishment initiatives and groyne systems is oriented towards erosion mitigation and the preservation of coastal stability within the unique geographical parameters of a non-tidal sea characterized by shallow waters and intermediate wave dynamics. This investigation delineates a distinctive coastal management paradigm in contrast to analogous studies such as those conducted in Nags Head (NC, USA) and Bridgehampton–Sagaponack (NY, USA) [
10], which confront high-wave energy conditions. Analogous to Dutch research endeavors [
11], the efficacy assessment of nourishment and groyne systems on the Hel Peninsula can be evaluated based on factors such as beach and coastal dune system morphology. However, the Hel Peninsula’s unique coastal characteristics and morphological features, including specific bedforms, necessitate customizing erosion control strategies different from those observed in coastal areas studied in the Netherlands and the USA.
A well-organized coastal zone management system should consist of several consecutive elements: monitoring of coast volume changes (erosion or accretion) using, e.g., LiDAR measurements, identifying erosion-prone areas based on differences in digital terrain models (DTMs) from successive years using GIS analysis, replenishment of eroded parts of the coastal dune system through artificial nourishment, and assessing the effects of these interventions. Such a system helps to establish long-term coastal protection policies and make operational decisions [
12]. The application of LiDAR measurements in shoreline monitoring systems is widely employed worldwide [
13,
14,
15,
16]. In the considered region, this method has been utilized since 2008, and now a suitable dataset has been established enabling the analysis of morphodynamic changes over a span of approximately 15 years. Previously, these data were utilized in research on the assessment of coastal morphodynamics in Western Pomerania (Southern Baltic) [
17,
18] and nearshore bathymetry [
19,
20]. In particular, the assessment of spatio-temporal erosion of the moraine cliff on Wolin Island was conducted utilizing methods for determining beach volume similar to those employed in this study [
21]. A promising emerging technique for acquiring high-resolution topographic and bathymetric data within coastal zones is Unmanned Aerial Vehicle (UAV)-based photogrammetry, especially combined with satellite observations. In recent years, these methods have been tested along the southern coast of Lovns Broad in Limfjorden, Denmark [
22], the Chongming Dongtan Nature Reserve, China [
23], and the West Coast of South Korea [
24].
The wave-like nature of erosion along the first 15 km of the Hel Peninsula is explained by the model of alternating nodes and arrows along the coast, i.e., places with low and high morphodynamics [
25]. Furthermore, natural sediment transport, primarily occurring in the west-to-east direction due to littoral drift, is influenced by coastal protection structures. The port in Władysławowo impedes sediment transport, acting as an obstacle, while the seawalls securing the cliff in Rozewie and Jastrzębia Góra interrupt the natural source of sediments [
3,
26].
A crucial factor influencing morphodynamic pattern is seabed morphology, namely the presence of specific seabed relief along the first 15 km of the open sea coastline of the Hel Peninsula, including long troughs in the form of channels, which, with favorable wind directions aligned with their axes, can allow waves with greater energy to reach the shore compared to adjacent areas [
27,
28,
29,
30].
The purpose of this study is to assess the effectiveness of artificial shore nourishment methods in maintaining sediment balance along the 15 km stretch of the Hel Peninsula coast over a period of 15 years between 2008 and 2022. Additionally, it aims to identify trends in geomorphological changes across various sections of the studied coastal area using numerical terrain models generated based on LiDAR measurements collected over the past 15 years. The study demonstrates that artificial nourishment is essential for maintaining the stability of the Hel Peninsula, mitigating erosion processes induced by both human activity and natural forces.
3. Results
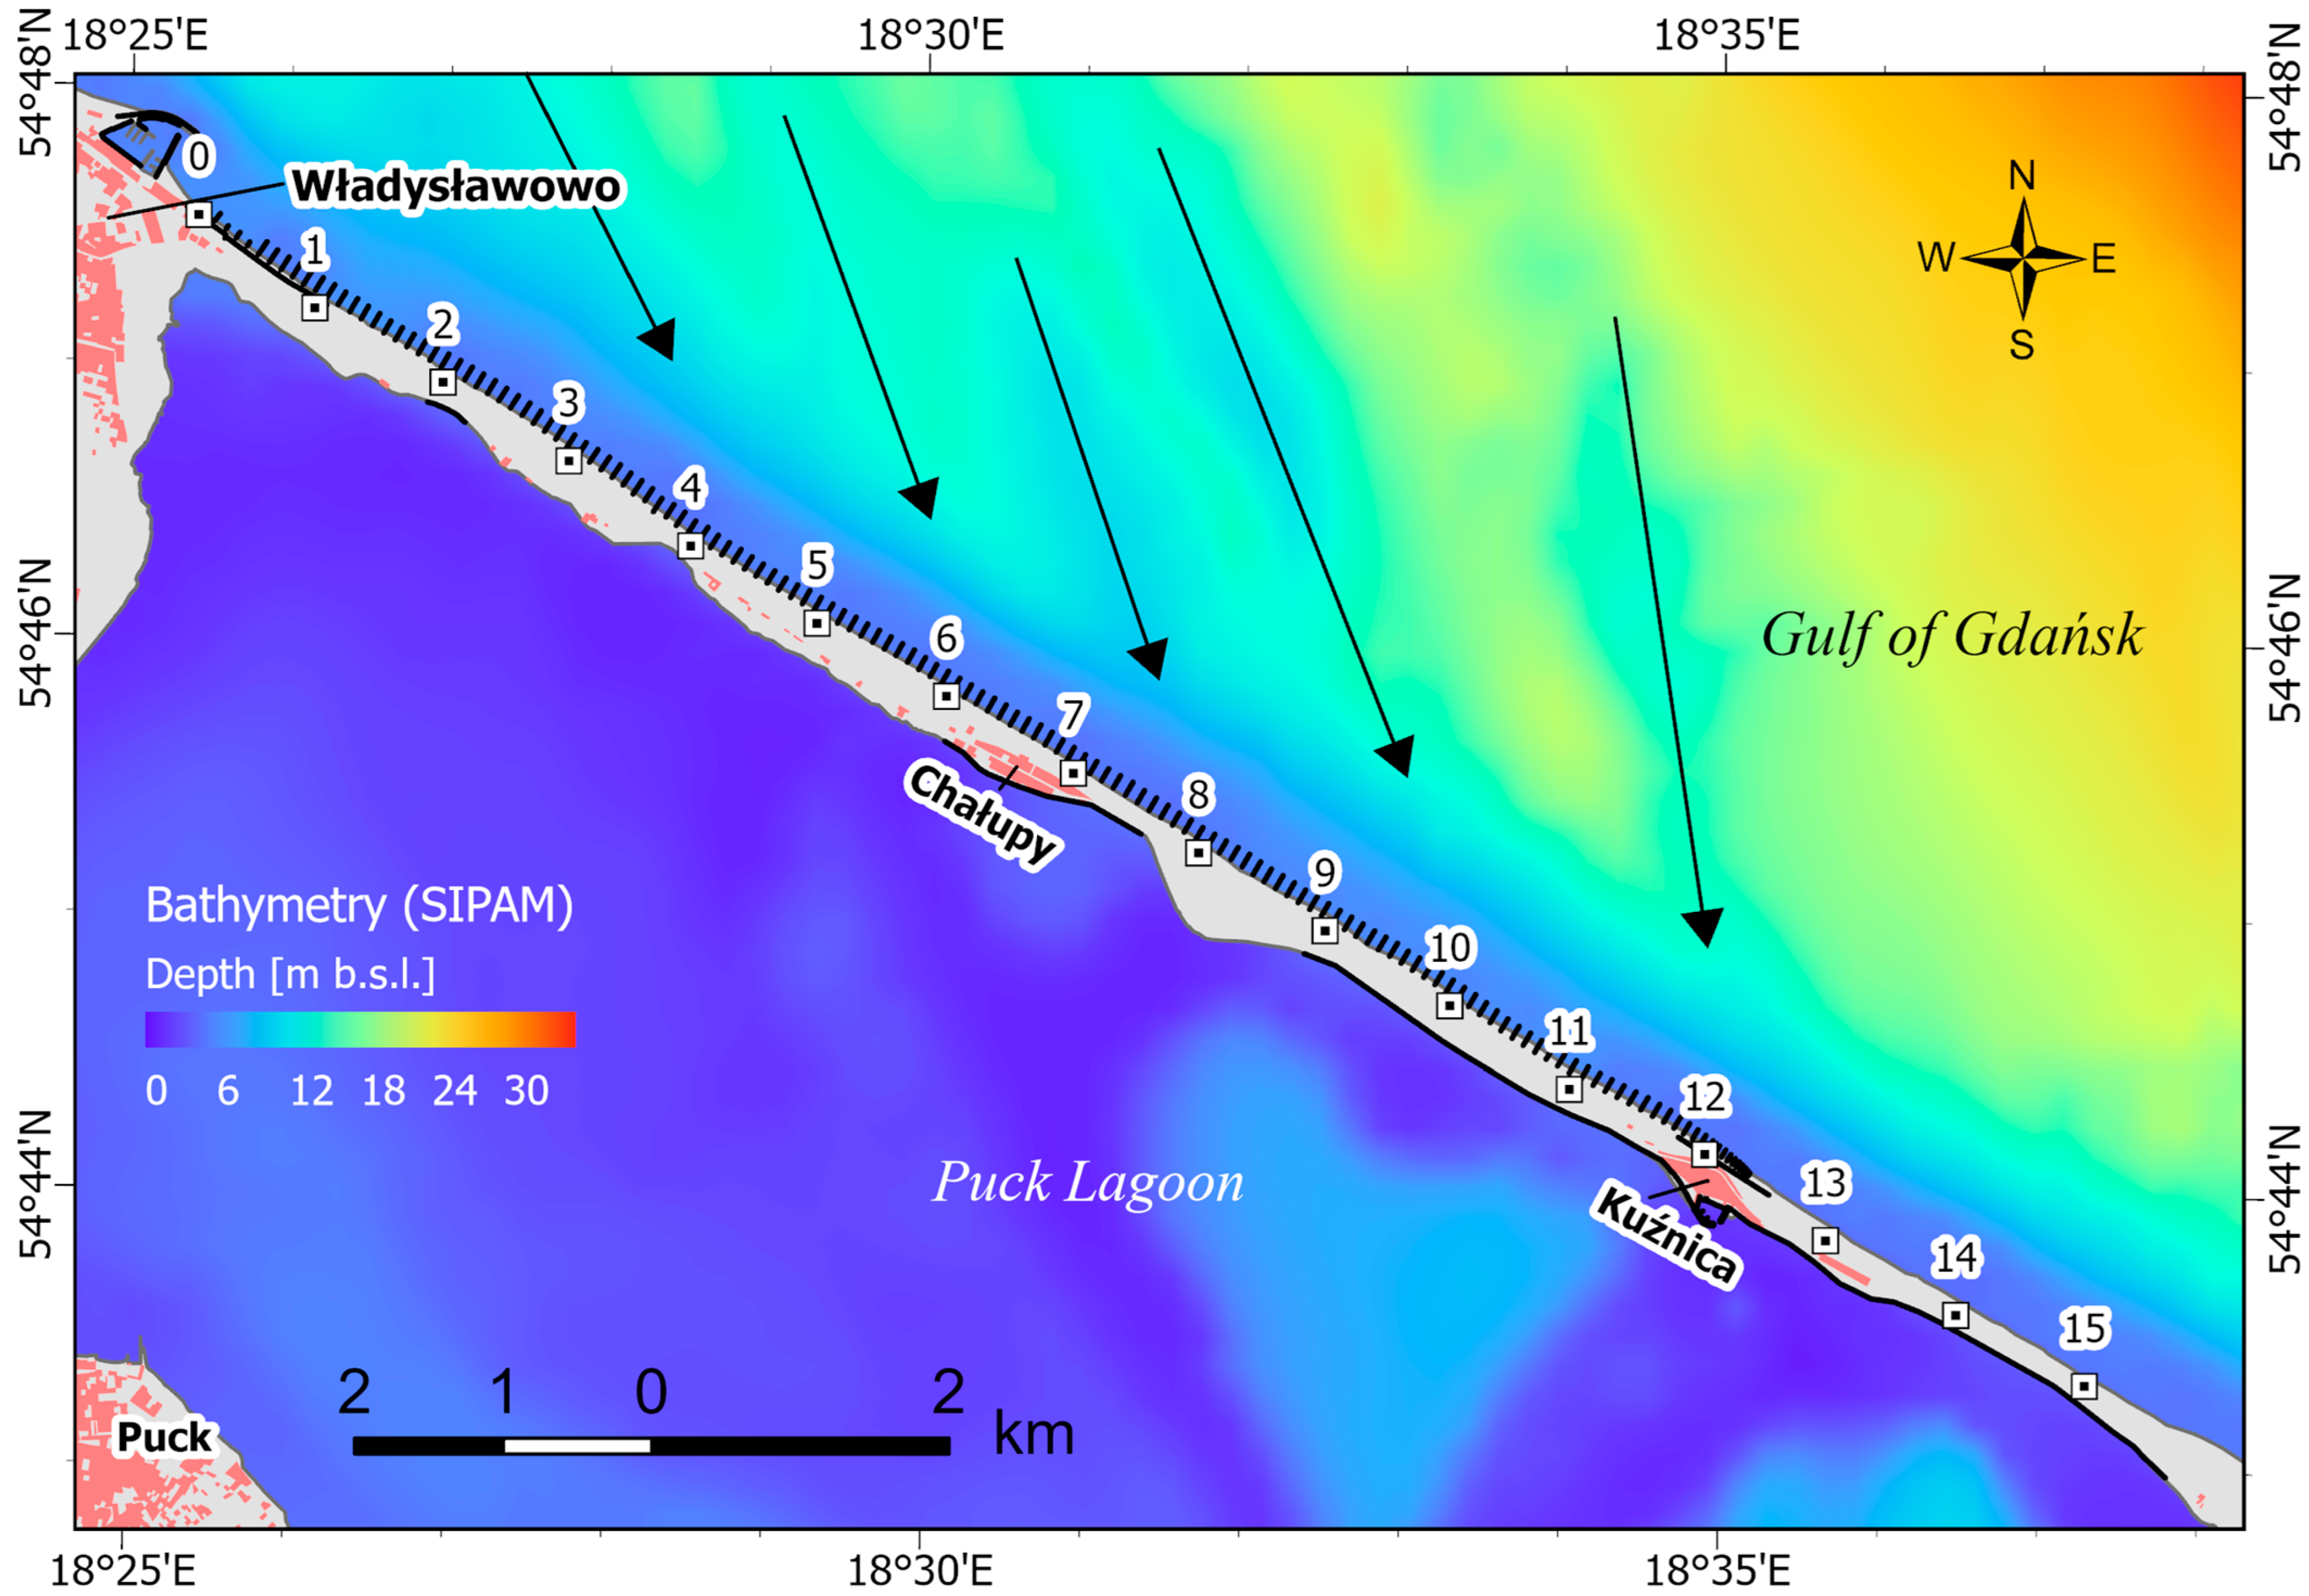
The morphodynamics of the study area (
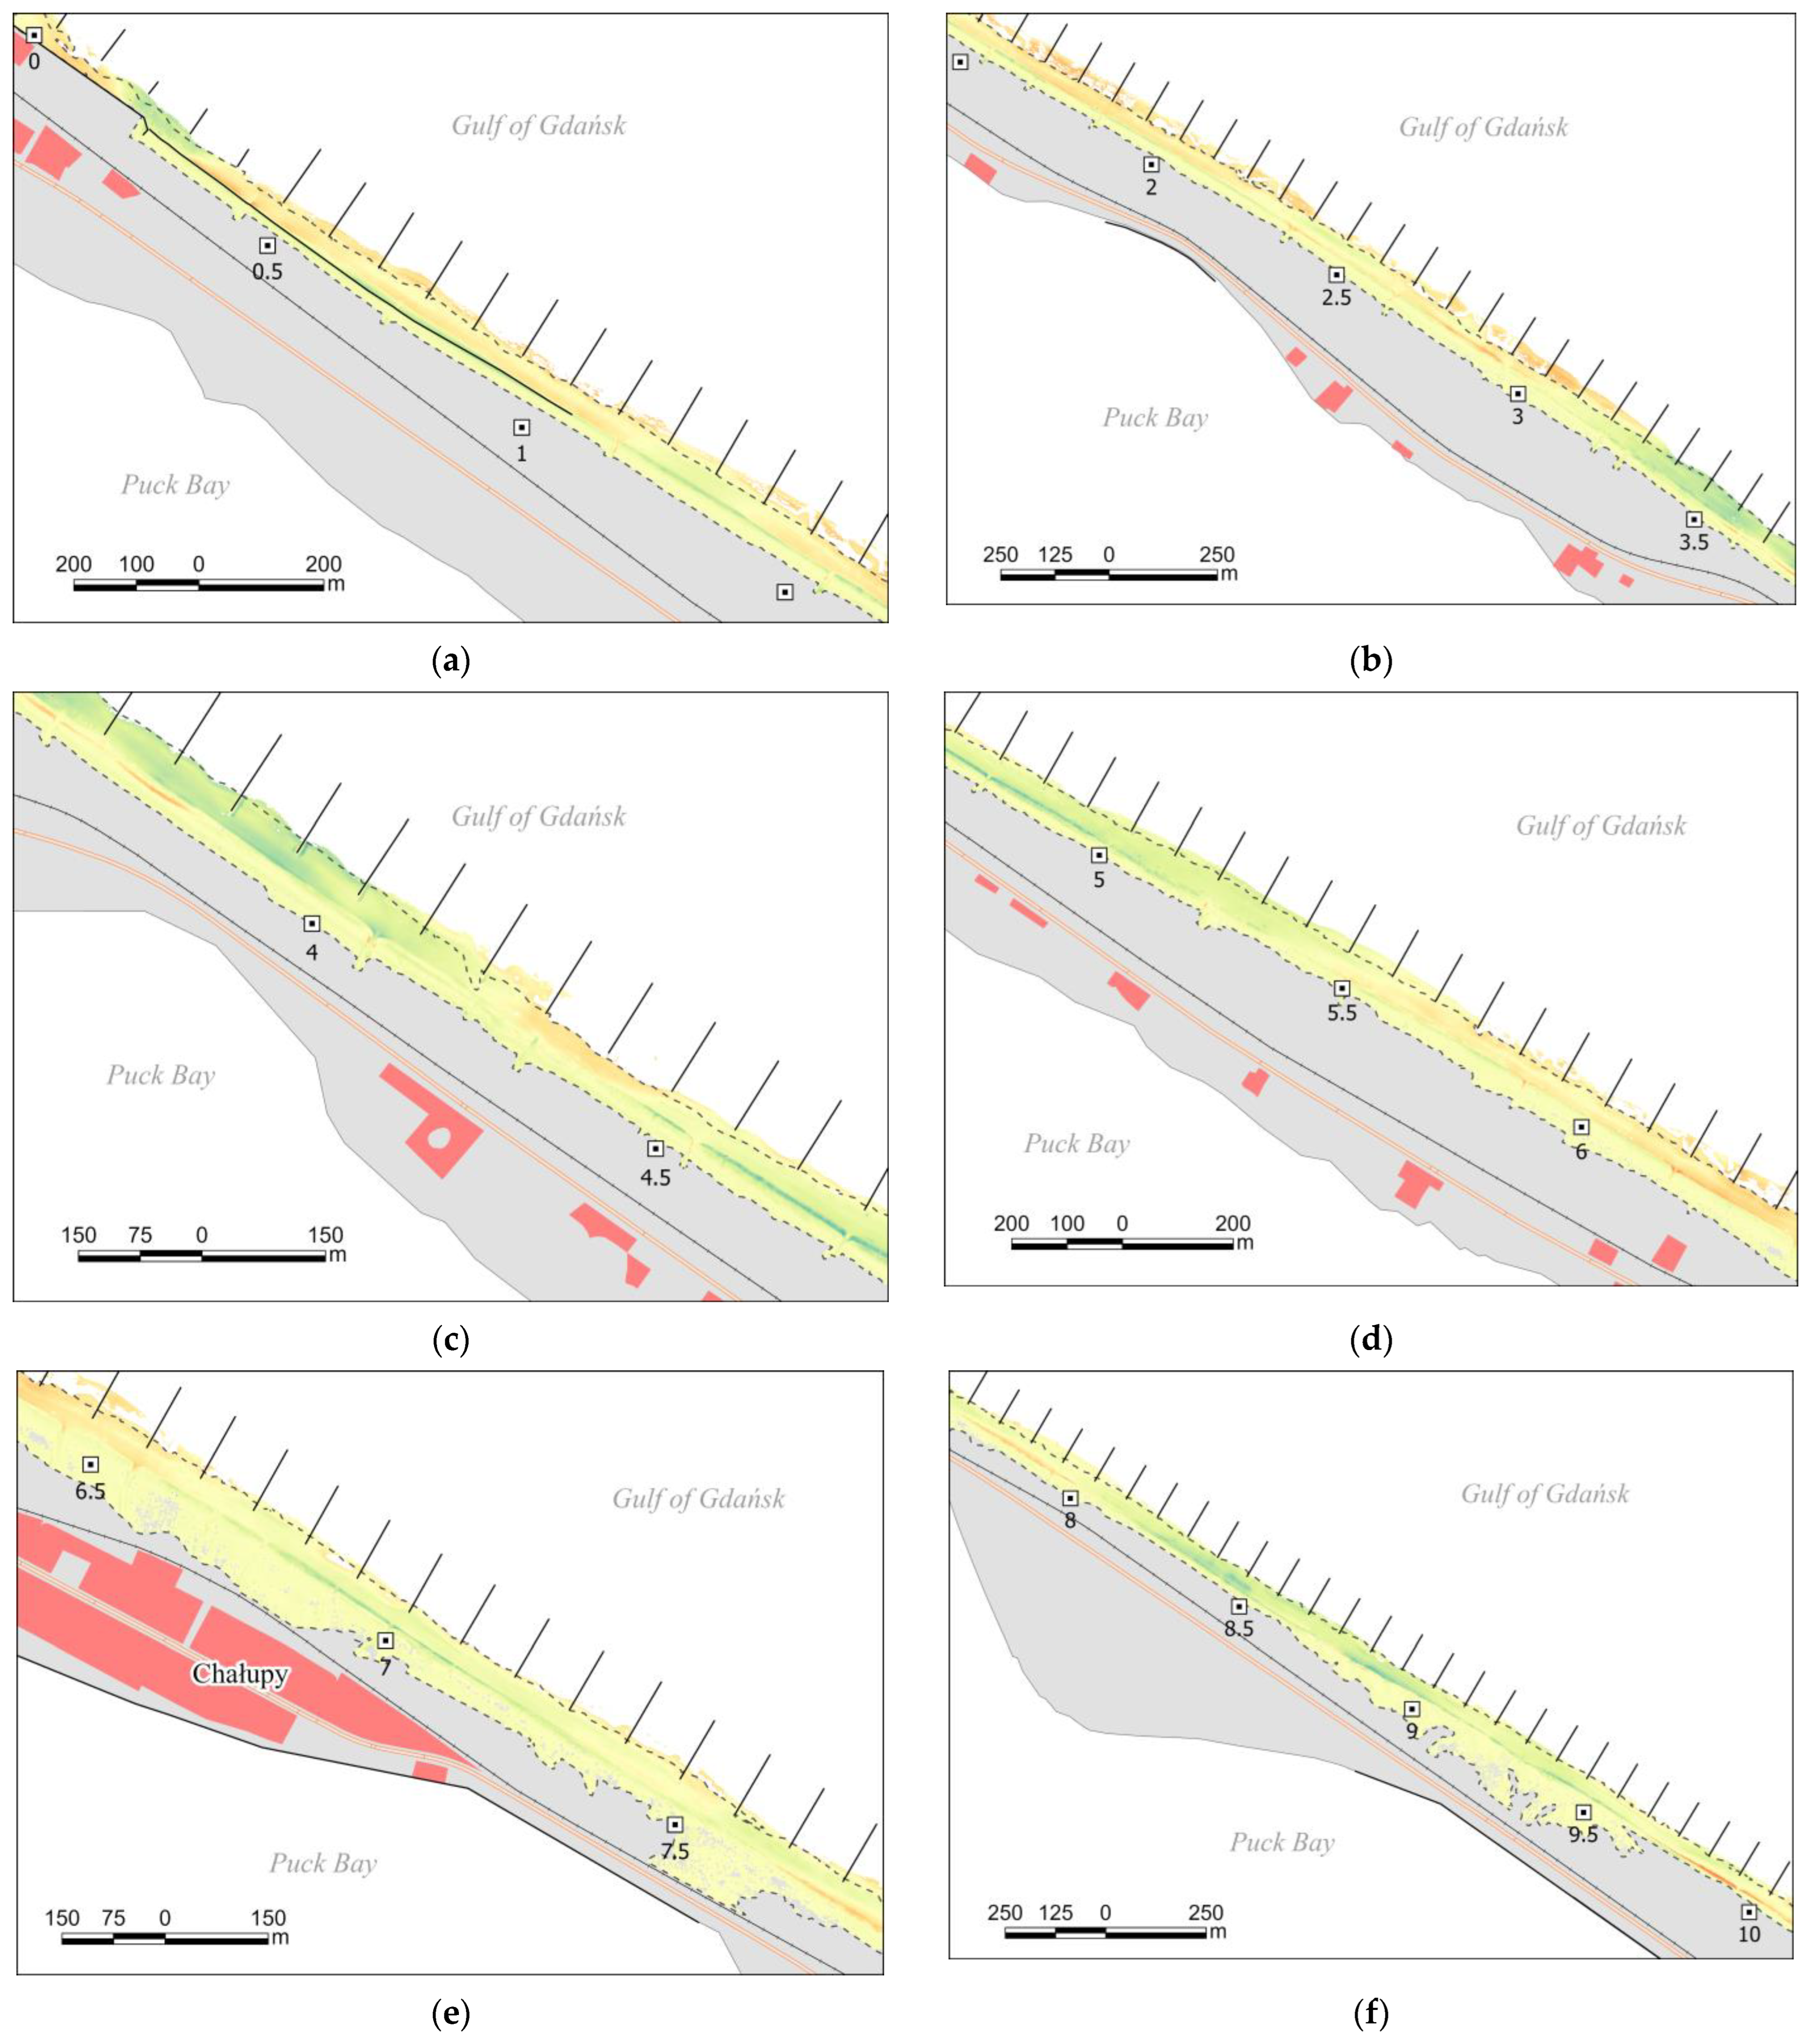
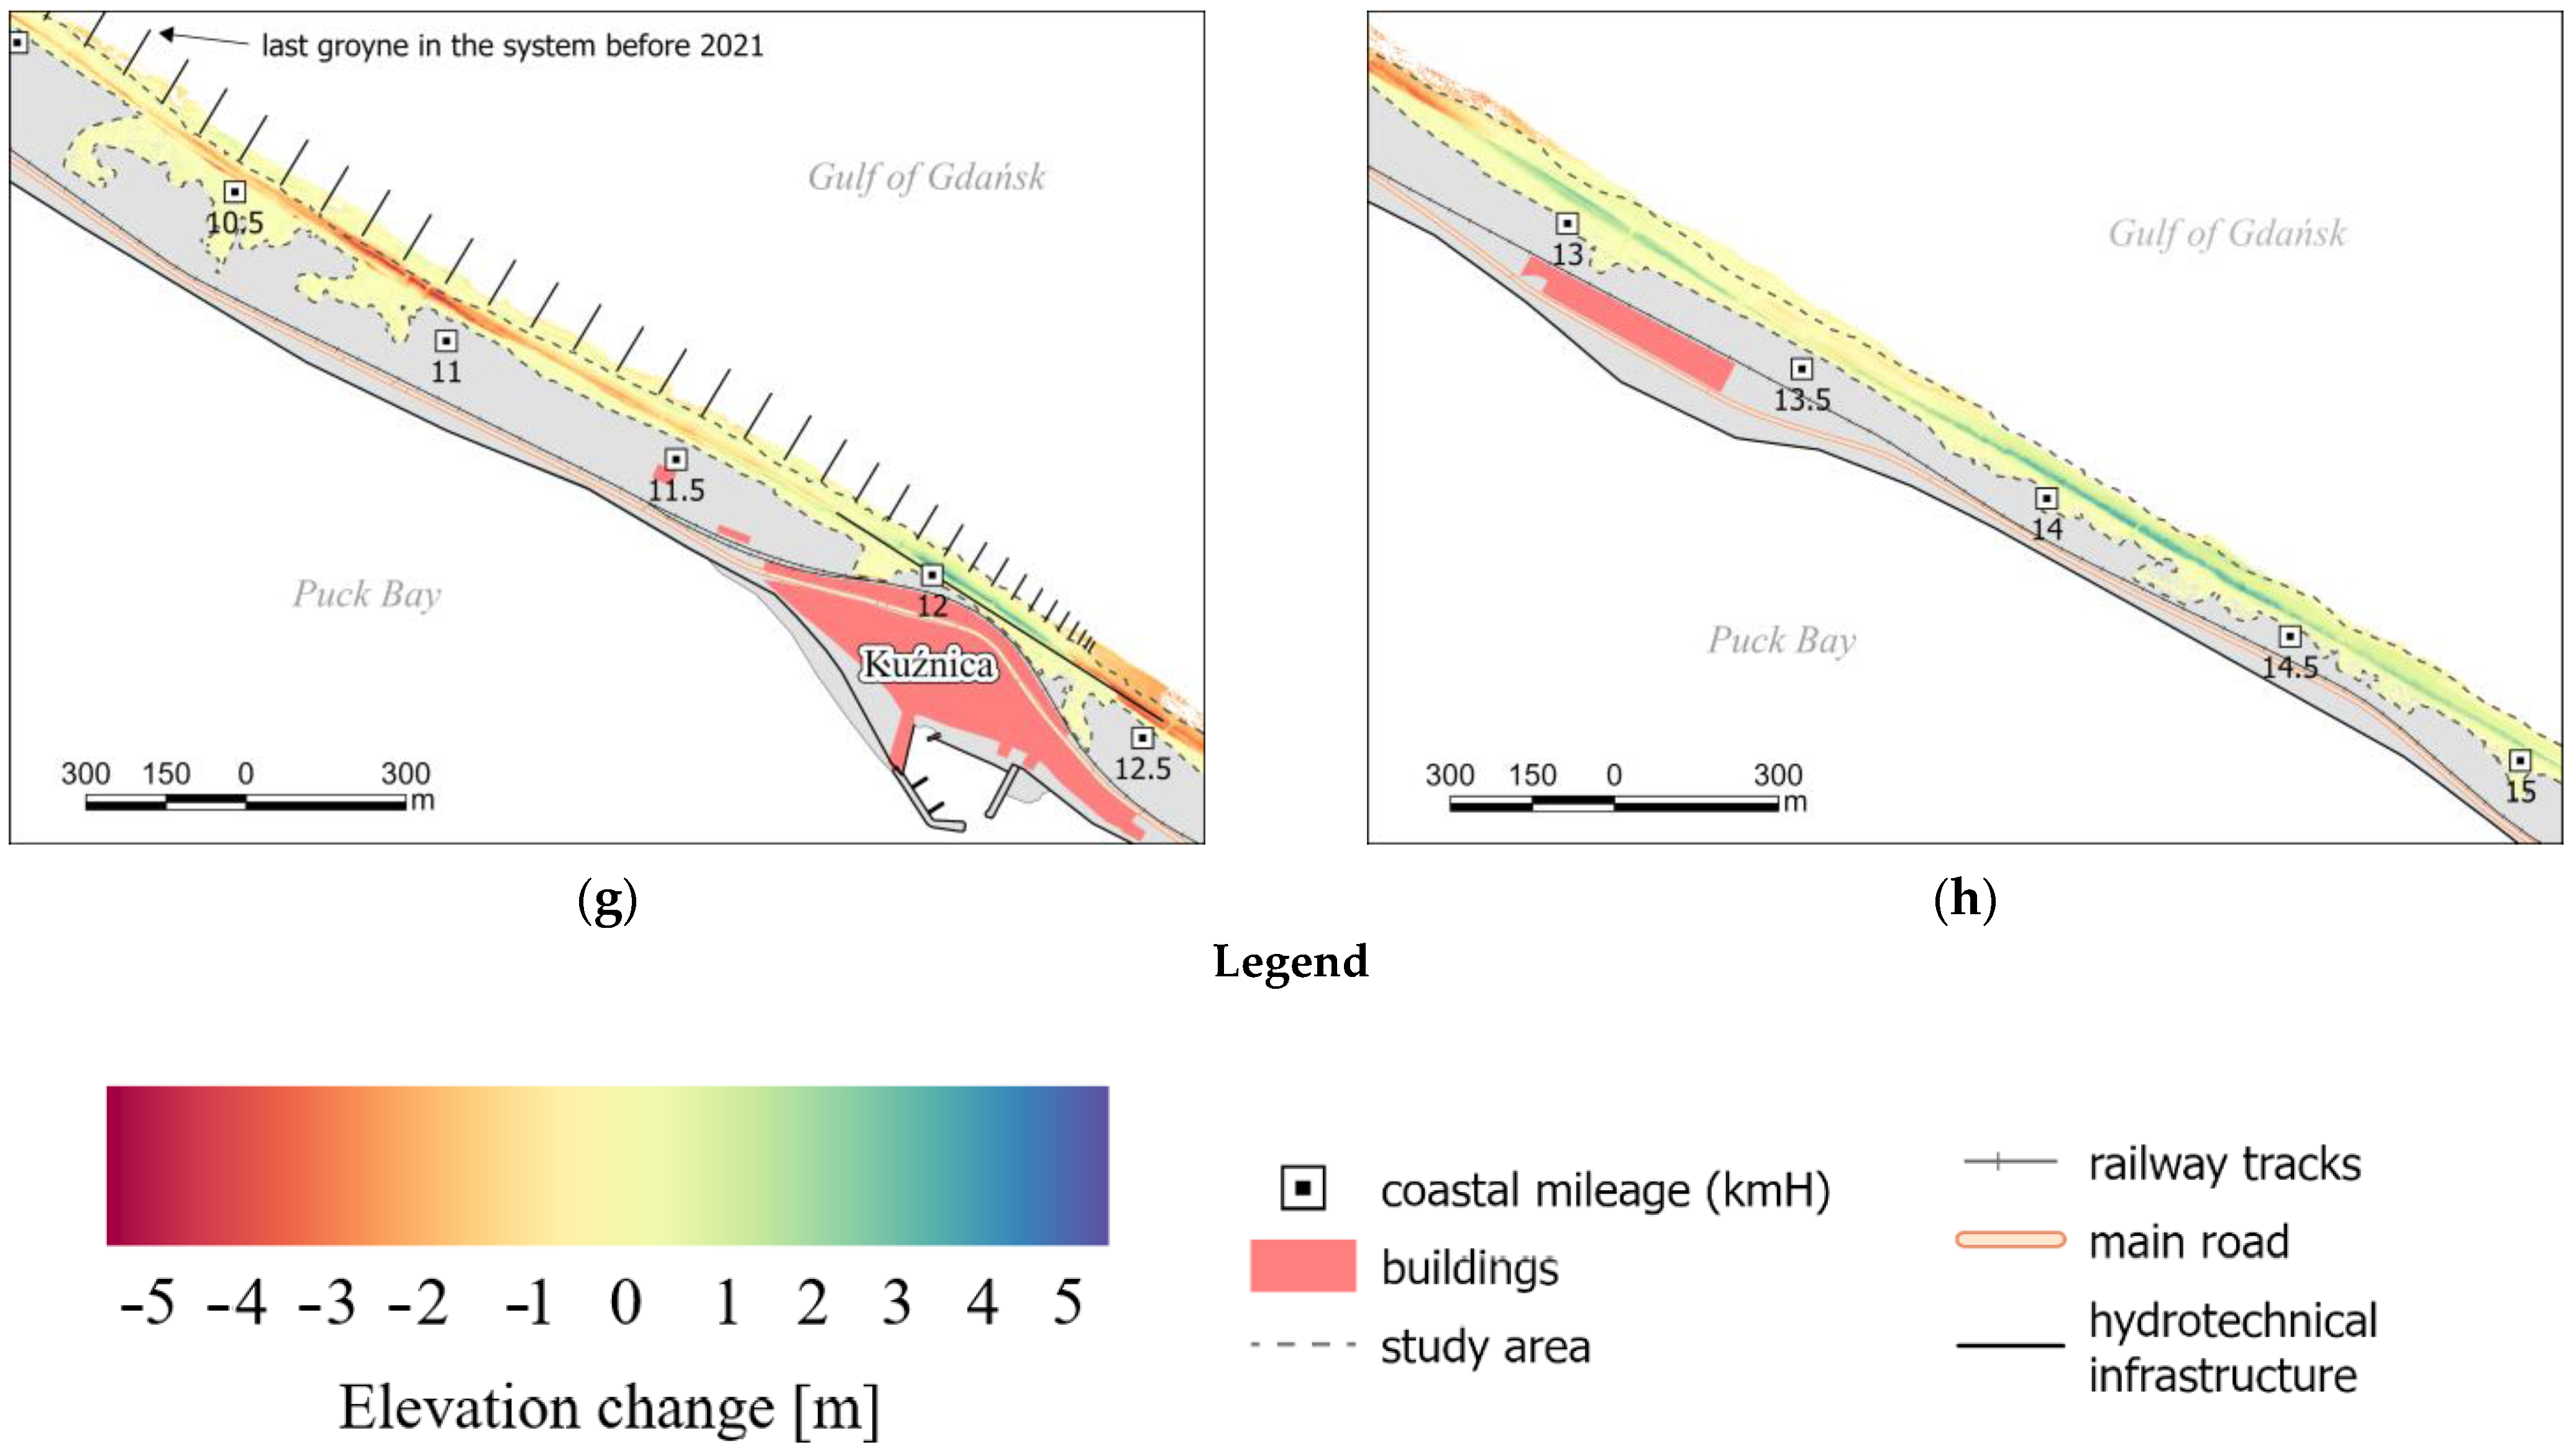
Figure 1b) were investigated by comparing numerical terrain models obtained from LiDAR data at the beginning and end of the study period. Digital Terrain Model (DTM) difference maps illustrate changes in terrain elevation between 2009 and 2023 year (
Figure 8). Regions experiencing the most intensive erosion (up to −5 m over 13 years) are marked in orange/red. Areas of greatest accumulation (up to 5 m over 13 years) are shown in green/blue.
The results obtained for each section have been summarized in
Table 3 and elaborated upon in detail below.
3.1. Subzone 0.0–1.5 km H
This is a shore segment located within the direct influence of the port in Władysławowo, lying on its lee side. Due to this fact, this area is cut off from the natural flow of sediments carried by the longshore current from west to east [
40]. The natural formation of sandbars in this area has also been disrupted, and currently, the line connecting their crests distinctly bulges towards the sea due to the existing obstacle in the form of port breakwaters (
Figure 1b) [
41]. The segment is entirely equipped with groynes, and to a significant extent, also with a seawall (0.0–1.0 km H), protecting the dune from intense erosion.
The 0.0–1.5 km H segment has been the most intensively and frequently nourished place along the examined stretch. Over the course of the 15 years analyzed, nearly 1.5 million m
3 of nourishment material has been delivered here (
Figure 7), mainly from the dredging fairway leading to the port in Władysławowo and from the sediments within the harbor basin.
The DTM difference map shows no major changes between 2009 and 2022 year within the beach and dune volume (
Figure 8a). Moderate erosion is visible directly at point 0.0 km H and in the 0.3–0.5 km H segment, which is protected by the seawall. However, a comparison of DTMs year by year (results for the whole subsection not presented graphically) revealed that a significant decrease in elevation occurred during the period 2021–2022. This is evident in the example of a selected cross-shore profile of 0.4 km H (
Figure 9). There is a seawall in the distance about 20 m from the baseline. The profile remained stable and underwent minimal change over time up to that point. Beyond the structure (distance from baseline above 20 m) the profile underwent changes over time, which were associated among other factors with conducted nourishment activities. A significant increase in elevation was observed in the 2014 year to the year 2009. The profile was kept stable in the period 2014–2021 with sediment refills of more than 200,000 m
3/100 m. This is the capacity of one medium-sized tanker. In the 2022 year, the profile was largely eroded down to the seawall (
Figure 9).
3.2. Subzone 1.5–3.7 km H
Over the course of 15 years analyzed, beach nourishment was not conducted here (
Figure 7). Comparing DTMs from 2009 and 2022 (
Figure 8b) stability of elevation is visible in the eastern part of this subzone over the multi-year period (2.0–3.7 km H). Within the 1.5–2.0 km H section, moderate erosion occurred, which was especially noticeable at the dune foot. When comparing year-to-year, erosion was observable in the 2.0–2.4 km H section in the period 2016–2017, 2.3–2.6 km H in the period 2017–2019, and 1.5–2.1 km H in the most recent period 2021–2022. However, the entire area remains exceptionally stable despite the lack of direct artificial nourishment. In some parts of this section, slow accretion occurs at the dune foot as shown in
Figure 10. Moreover, at a distance of about 25 m from the baseline an embryo dune formation is visible.
3.3. Subzone 3.7–4.8 km H
A kilometer-long shore section was nourished in 2009, 2015, 2016, and 2019. A total of 270.000 m
3 of nourishment material was delivered here between 2009 and 2019 (
Figure 7). The central area was most intensively nourished.
A comparison of DTMs from 2009 and 2022 (
Figure 8c) shows predominantly accumulative trends in the area. This primarily relates to the beach in the 3.6–4.2 km H section, as well as the dunes in the 4.5–4.8 km H section. Between 4.2 and 4.5 km H, a small erosive area on the beach was observed. Erosion in this short section recurred in the periods: 2021–2022, 2014–2015, and 2009–2014 (here 4.1–4.2 km H). In the periods 2015–2016, 2016–2017, and 2017–2019 large patches marked by accumulation after nourishment in the years 2015–2019 were observed there. The overall situation at 4.1–4.4 km H is well illustrated by the cross-shore profile in
Figure 11.
3.4. Subzone 4.8–6.5 km H
A 1.7 km stretch characterized by a quasi-natural state. No nourishment was performed at this shore section between 2008 and 2022.
Through comparisons of DTMs from 2009 and 2022 (
Figure 8d), the area reveals its dual nature. The western part (4.8–5.4 km H) had an accumulative character during this time, while the eastern part (5.4–6.5 km H) experienced erosion along almost the entire length of the cross-sectional profile (
Figure 12). The western part is a part of the accumulation coast, which was also marked in the previous section (4.5–5.5 km H). In the years 2021–2022, slight dune erosion was observed in the 6.1–6.3 km H section, in the years 2017–2019 in the 5.5–5.7 km H section, and in the period 2016–2017, erosion occurred in the 5.7–6.4 km H section. During the period 2009–2014, accumulation was evident in the 4.8–5.1 km H stretch and to a lesser degree at the 5.5–6.3 km H. The remaining intervals between consecutive LiDAR measurements showed no significant changes in beach and dune volume along this stretch.
3.5. Subzone 6.5–7.8 km H
The section was partially nourished in 2008, 2016, 2017, and 2020. A comparison of the two most temporally distant DTMs from 2009 and 2022 (
Figure 8e) indicates accumulation in the frontal part of the dune at the 6.6–7.6 km H section and erosion in both outermost parts (6.4–6.5 km H and 7.7–7.8 km H). The erosion is directly related to the dune, and near 6.5 km H, it affects the entire beach profile. Accumulation reached +2 m, while erosion reached −1.5 m. The difference map from 2008 to 2009 indicates the removal of sediment nourished in 2008 at the 6.9–7.4 km H section on the beach face. The situation stabilized on this stretch in the period 2009–2014. Nevertheless, further erosion occurred on a segment of the dune in the 6.9–7.05 km H section (
Figure 13). This is an example of an erosive profile nourished in 2016 and 2017 and systematically eroded in the past few years. A slight accumulation in the dune foot was observed in the 6.6–6.9 km H and 7.4–7.7 km H sections, despite the lack of nourishment. In subsequent years, there were no significant changes until the period 2016–2017, when the difference map reflected the effect of nourishment. It illustrates significant accumulation in the 6.5–7.1 km H section, sometimes covering the entire beach. During the same period, considerable erosion occurred on the dune front in the 7.3–7.8 km H section. Partial erosion of the nourishment occurred in the following period (2017–2019). In recent years, there have been no major changes in this stretch except for the period 2021–2022, when the entire subzone experienced minor to moderate erosion, mainly affecting the beach, slightly extending to the dune foot (7.0–7.1 km H).
3.6. Subzone 7.8–10.0 km H
A 2.2 km stretch was subjected to one-time shore nourishment in 2013 on a short segment at 9.4–9.5 km H with a volume of 17,000 m
3. The DTMs difference map from 2009 to 2022 (
Figure 8f) shows predominantly accumulative trends of this coastal stretch. Accumulation dominates in the central part 8.0–9.6 km H, i.e., in front of the largest dunes (
Figure 14). The areas affected by erosion were the ones located at the edges of the area, i.e., 7.7–8.0 km H and 9.6–10 km H. It is noteworthy that accumulation covered the entire shore profile, while erosion only affected the dune front in the edge areas. Similar changes are visible on the difference map from 2009 to 2014. In the period 2016–2017, noticeable erosion of the dune front occurred in sections 7.7–8.1, 9.0–9.4, and 9.5–9.7 km H, and in the following period 2017–2019 also in 9.6–9.9 and 7.7–7.9 km H (an enlargement of existing dune erosion) as well as in 8.4–8.6 km H. In the 7.9–8.5 km H section, significant beach accumulation (+2 m) was observed in the period 2020–2021.
3.7. Subzone 10.0–12.6 km H
The different parts of this section were subjected to beach nourishment in almost every considered year, except for the years 2009, 2012, and 2013. Over a period of 15 years, the area was nourished with sediment totaling over 1.4 million m
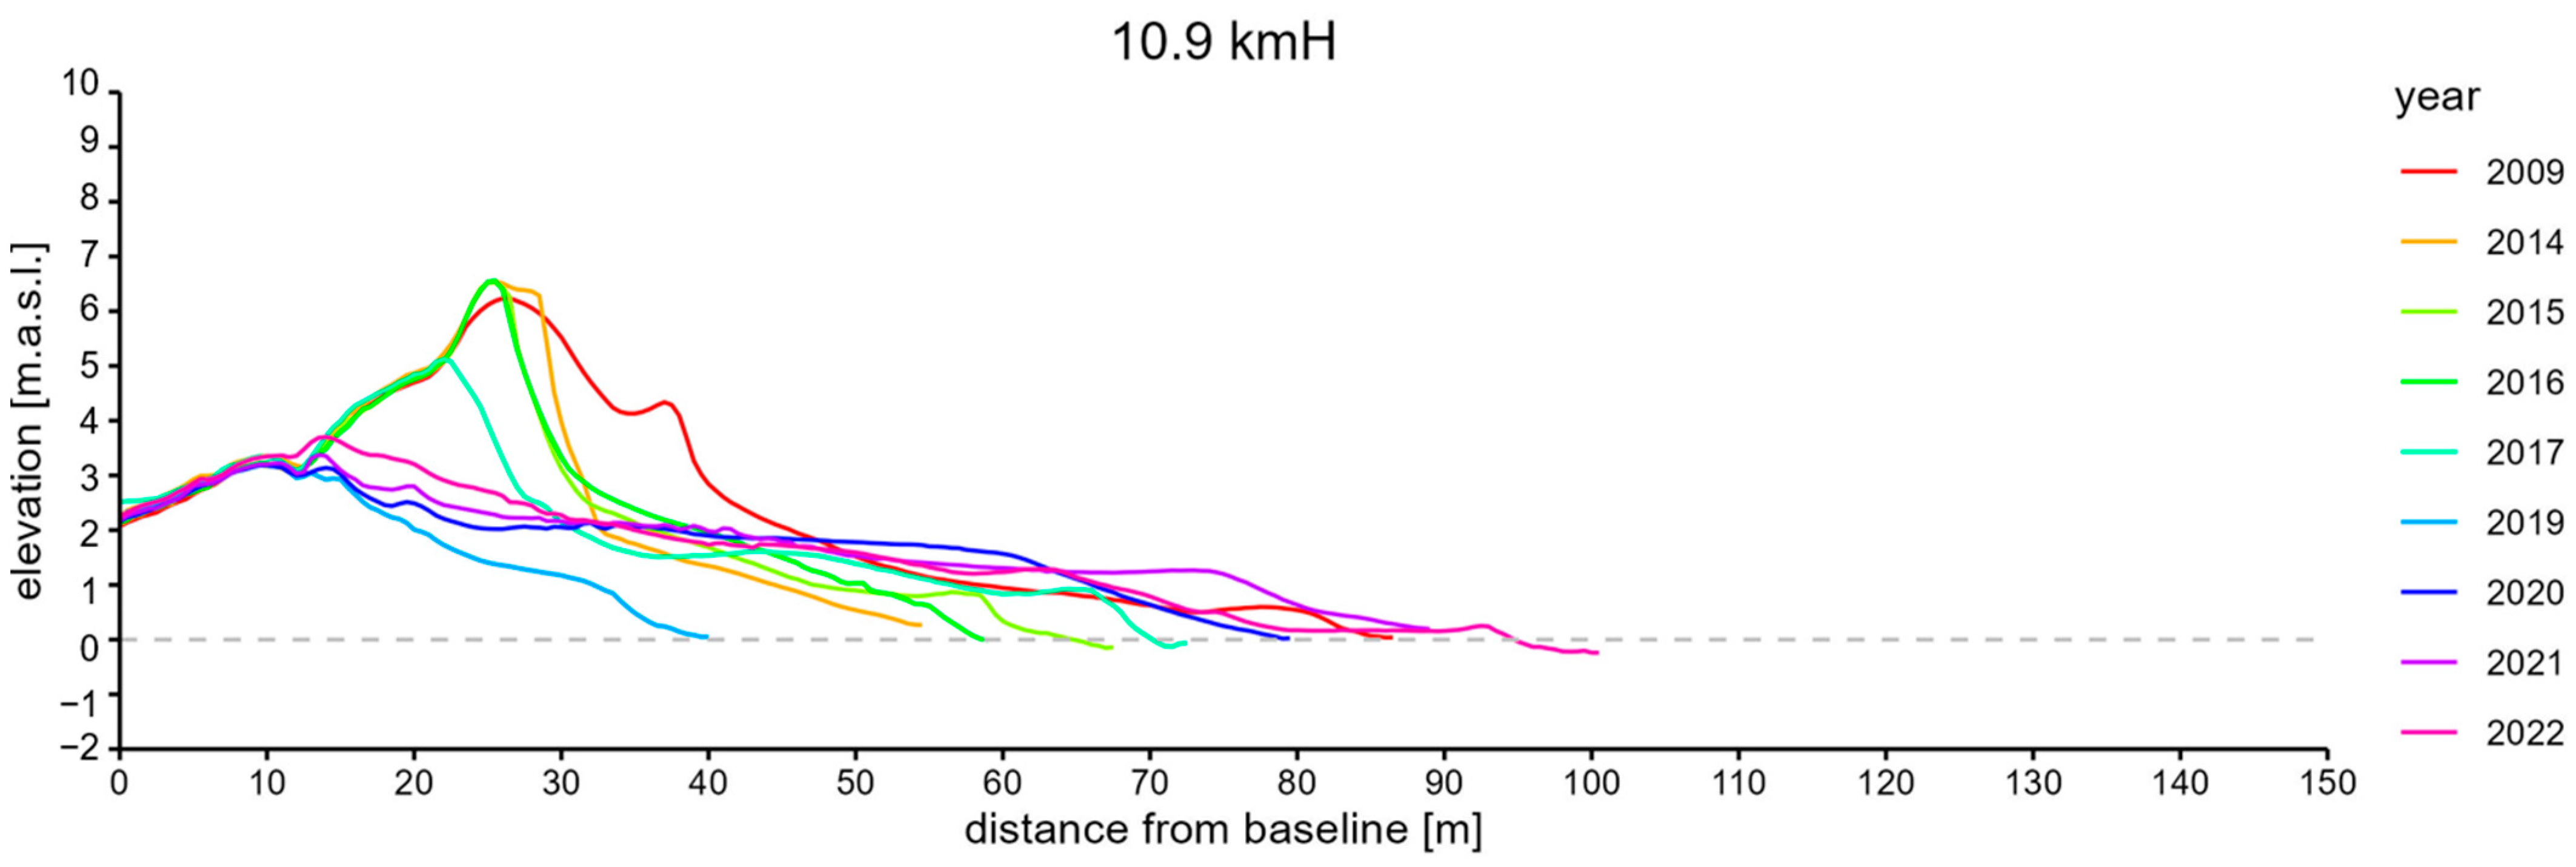
3, similar to the 0–1.5 km H section. The western part of the area, 10.0–11.1 km H (exemplary profile presented in
Figure 15), was nourished less frequently (only in 2015, 2016, and 2019). Nourishments were more frequent in the part surrounding the village of Kuźnica.
Considering the differences between DTMs from 2009 to 2022 (
Figure 8g), the studied section had an erosional character along its entire length, except for the foredune in the most critical section of 11.9–12.3 km H, where accumulation was observed due to cyclic nourishment practices (
Figure 16). In the past, this section alternated between erosion and accretion, thanks to almost annual nourishment treatments. On the southeast side of this area, there is a segment marked by the second-highest erosion values among the entire coastline. Beach and dune losses reached up to −3.4 m here from 2009 to 2022 in the 12.3–12.6 km H section (
Figure 17). The entire shore profile, along with the dune foot, was affected by erosion.
The second erosive area is northwest of Kuźnica in the 10.0–11.8 km H section, with a visible intensification of erosion in the central part, i.e., 10.7–11.1 km H (
Figure 16). Terrain height decreases here reaching up to −4 m. In this case, erosion affects the upper beach and the frontal part of the dune. Decay continued in the following year but only affected a narrow strip near the dune base. In 2015 and 2016, the area was intensively nourished, resulting in visible results in the DTM comparison from 2015 to 2016—accumulation almost along the entire length, reaching up to +1.5 m in terrain height. Unfortunately, in the subsequent comparative period (2016–2017) the area was again affected by erosion along almost its entire length, nullifying the achievements of the engineering works conducted a year earlier. From 2017 to 2019, erosion continued to escalate, particularly in the 10.9–11.7 km H section, where a significant part of the dune foot again experienced erosion. In 2019, the area was nourished again, and the subsequent DTM comparison (2019–2020) shows significant accumulation, especially in the foreshore. Some parts of the dune base were again affected by erosion. The final in the analyzed period stoppage of erosion was only achieved with the displacement of the groynes system 2 km southeastward. Since this area was protected by groynes, there were no major signs of erosion between 2020 and 2022 year.
3.8. Subzone 12.6–15.0 km H
The shore section was nourished across its entire length in 2022 mainly due to the availability of a large amount of dredged material from the fairway leading to the North Port in Gdańsk.
A comparison of the DTMs from 2009 to 2022 (
Figure 8h) provides information about the predominance of accumulation in this section, even before the extensive nourishment carried out in 2022. The only erosive area (12.6–12.8 km H) is an extension of the previously discussed section (10.0–12.6 km H), where the groynes system ends and its side effect occurs. The other parts of this section exhibit signs of accumulative or at least morphodynamically neutral behavior over a longer time scale. Accumulation at the dune foot is most marked in the sections 12.8–13.4 km H and 13.6–15 km H (
Figure 18). The greatest intensification in each of these subsections occurs in the central part. Terrain height increases in these areas are uniform and range from +2 m to as much as +3.5 m. In these areas, it was already noticeable in older periods (2009–2014—up to +2 m). In the time interval 2016–2017, erosion occurred in the 13.1–13.9 km H section (up to −1.5 m, but in a narrow strip). In the subsequent comparative period (2017–2019) erosion continued but with a slightly smaller extent: 13.3–13.8 km H. In the following years, the balance stabilized except for the period 2021–2022, where erosion from the end of the groynes system extended to 13.1 km H. Minor losses on the dune foot are also noticeable in the 13.5–13.6 km H section. In several other sections, there was erosion of the foreshore, but without affecting the higher parts of the shore profile.
3.9. Sediment Budget
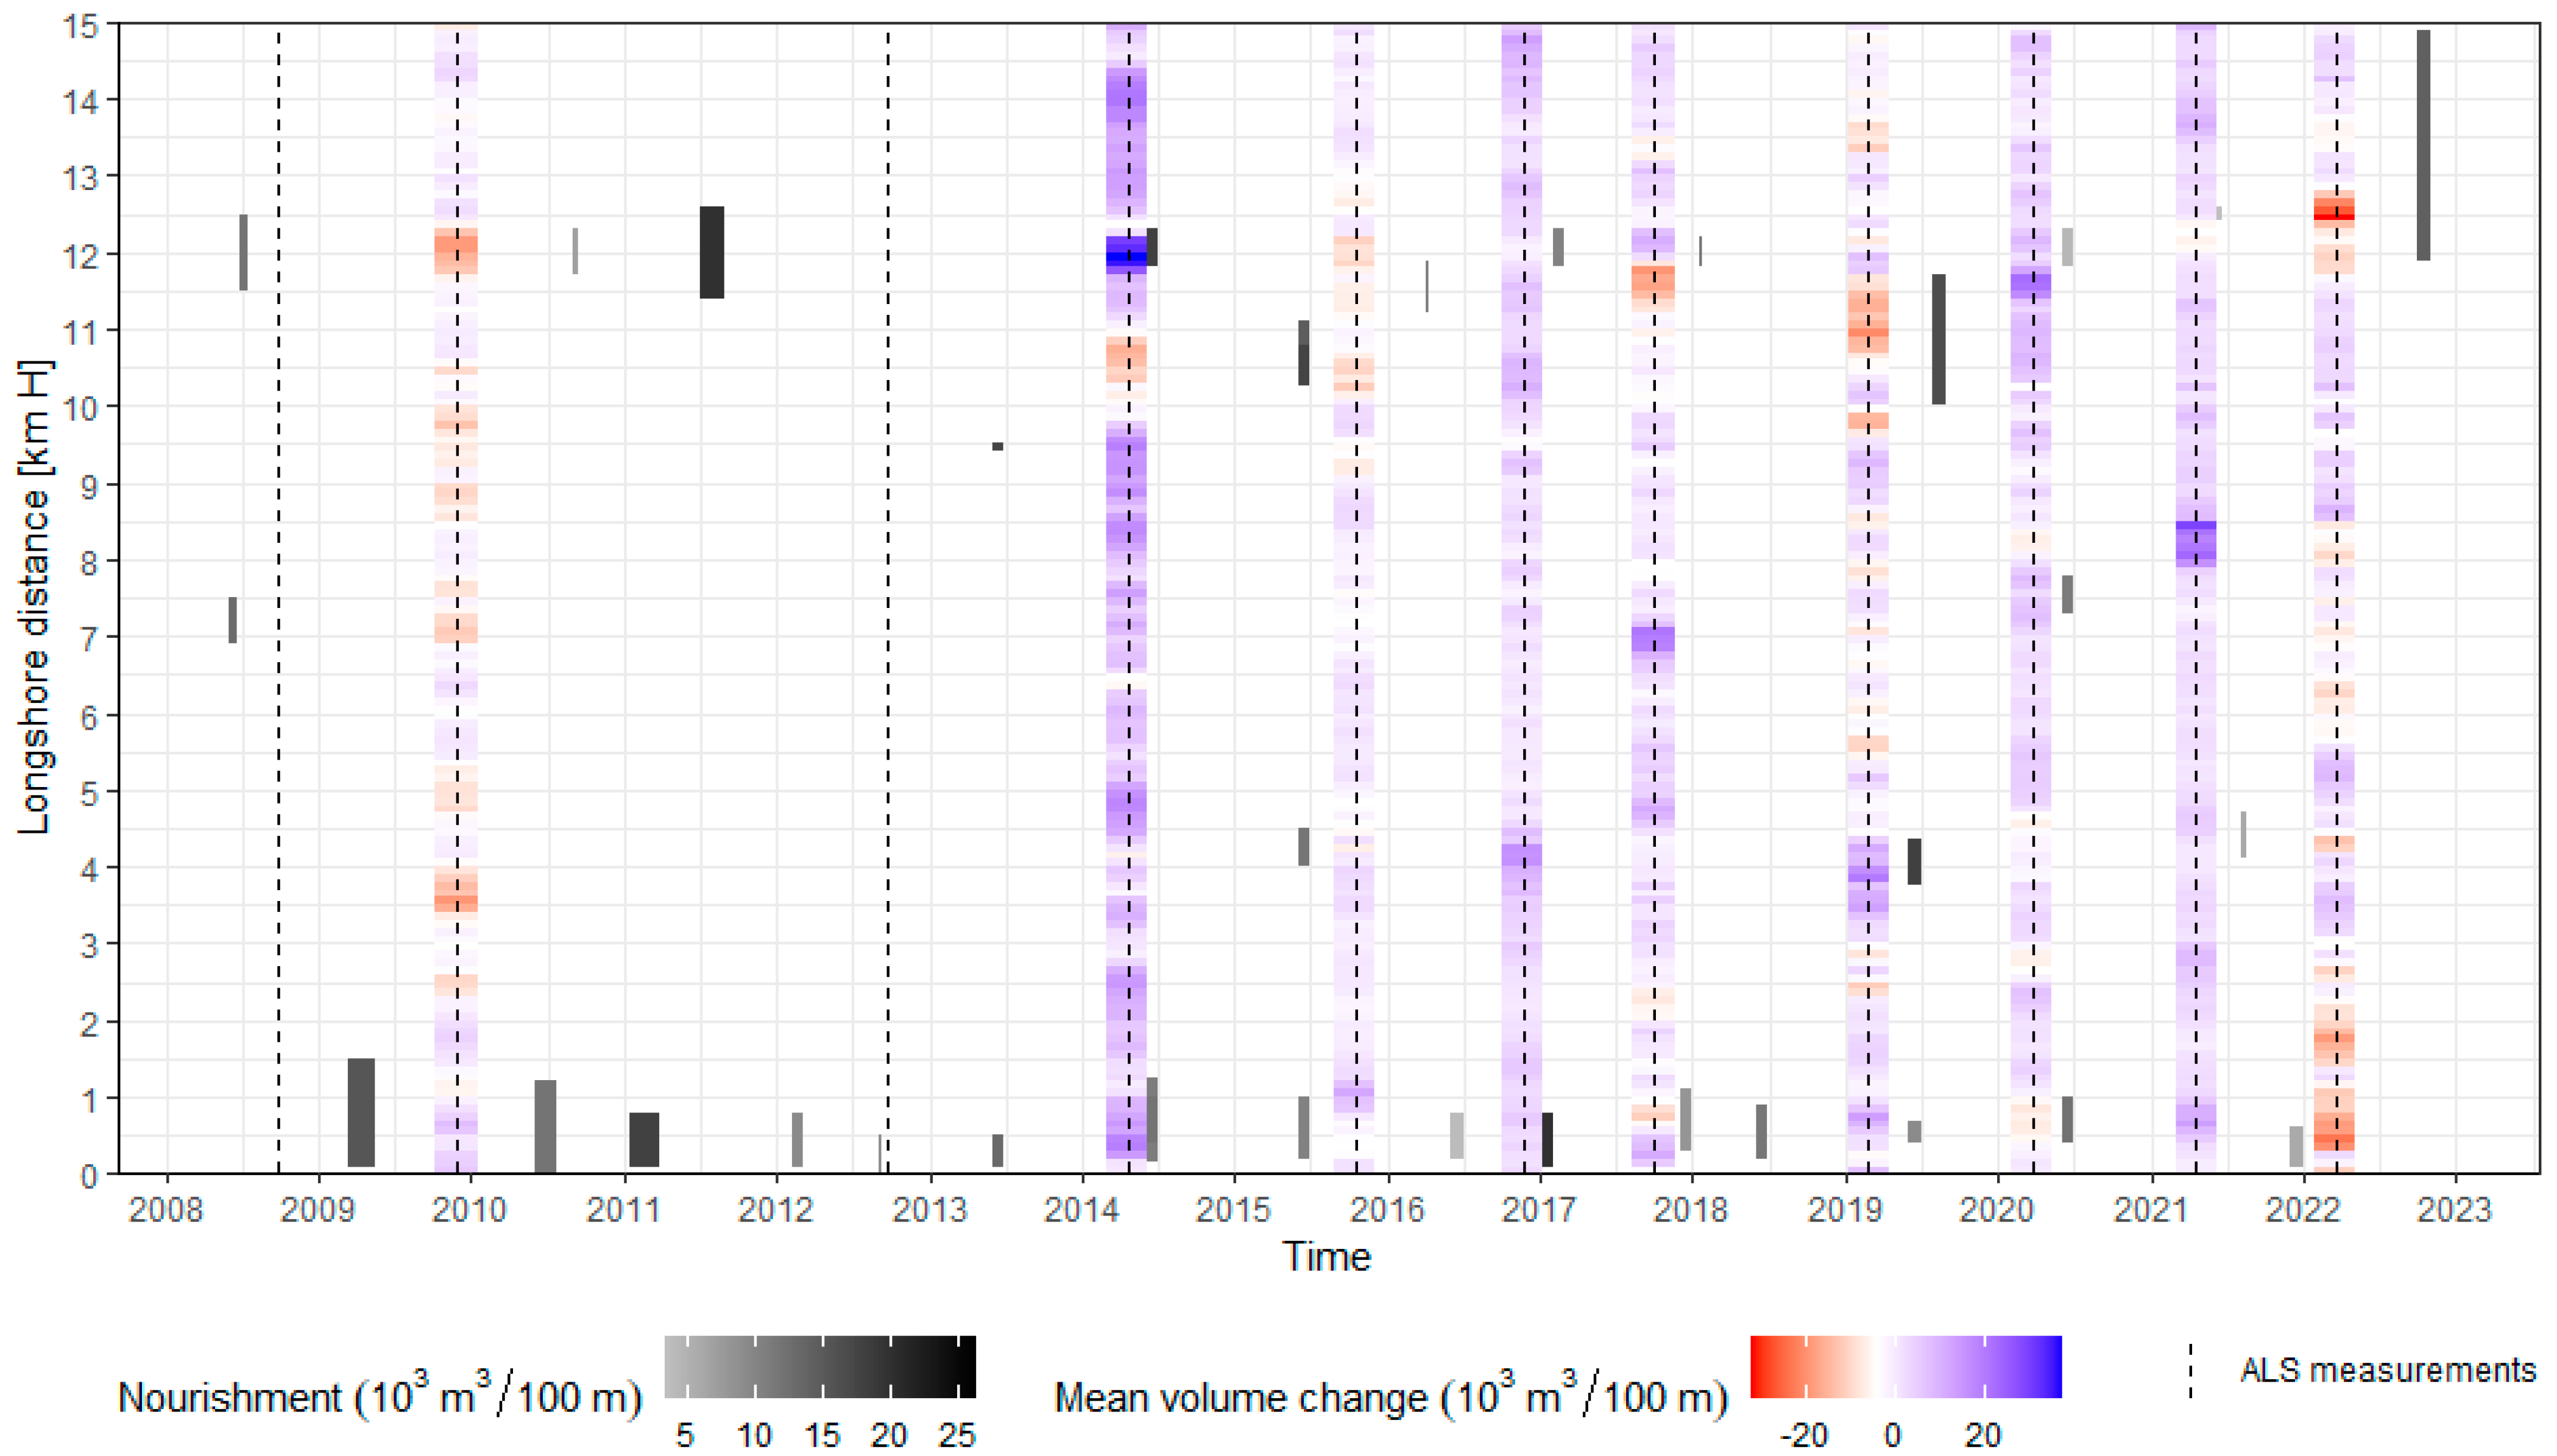
The spatial and temporal distribution of the sediment budget could be estimated based on data regarding successive beach nourishments (
Figure 7) and the differences between consecutively determined Digital Terrain Models (DTMs).
Figure 19 illustrates the spatio-temporal relationship between artificial beach nourishments conducted between 2008 and 2022 and the results of LiDAR surveys in terms of changes in beach and dune volume. The volume change in each of the 100-m segments is calculated based on the elevation changes between consecutive LiDAR surveys. The graph highlights the two most intensively nourished sections of the coast (0.0–1.5 km H and 10.0–12.6 km H), which are also the most exposed to erosion. The greatest increases in beach and dune volume were recorded in areas nourished with a large amount of material, just before the LiDAR survey was conducted. An example is the significant volume increase in the erosive section near 12 km H, in the vicinity of the Kuźnica village, between 2014 and 2009, preceded by two major and one minor nourishment, with the largest of them taking place in the same year as the ALS measurement. Interestingly, the same location experienced erosion already the following year. Similar situations are noticeable near 4 km H in 2018–2019 or at 0.5 km H in 2009–2014.
In several locations, large sediment volume increases in beaches and dunes were not preceded by nourishments. This was characteristic of the natural section of the coastline located southeast of Kuźnica (12.6–15.0 km H). Between 2009 and 2012, significant increases are observed along the entire coastline, probably due to extensive erosion of the entire coast during the November 2009 measurement following a major storm surge earlier in October. Between 2009 and 2014, another equally large storm surge occurred at the turn of 2011 and 2012, but two years after this event, the coast had to rebuild itself, despite no nourishments being conducted during that time on the remaining coastline sections except for the two areas with the highest erosion rates. The areas continuously accumulating sediment after 2014 are not extensive and occur, for example, near 8.6–9.0 km H, 5.2 km H, 3–4 km H, or 1.2 km H. Areas undergoing erosion in at least three out of nine comparative periods have been nourished at least once, except for the 2–3 km H section, which has not been nourished yet and experienced erosion in five out of seven comparative periods after 2014.
4. Discussion
The research results obtained in each section of the investigated coastline demonstrate various patterns of erosion and accretion, influenced by both natural processes and human interventions. Among the subzones affected directly by human interventions are 0.0–1.5 km H—heavily influenced by the presence of the port in Władysławowo and associated infrastructure, such as port breakwaters; 3.7–4.8 km H—subjected to intensive nourishment efforts; 6.5–7.8 km H and 7.8–10.0 km H—exhibit varying degrees of anthropogenic influence through nourishment activities; 12.6–15.0 km H—predominantly natural coastal stretch, with limited human interference, except for a single act of artificial nourishment in 2022. The described divisions into natural and human-transformed areas cannot be treated rigidly because the coastal system is a complex arrangement of many interacting factors, and hydrodynamic and aeolian processes influence beach and shoreline morphology in a broader context. However, to conclude the impact of applied coastal protection methods on morphology, simplifying assumptions need to be adopted.
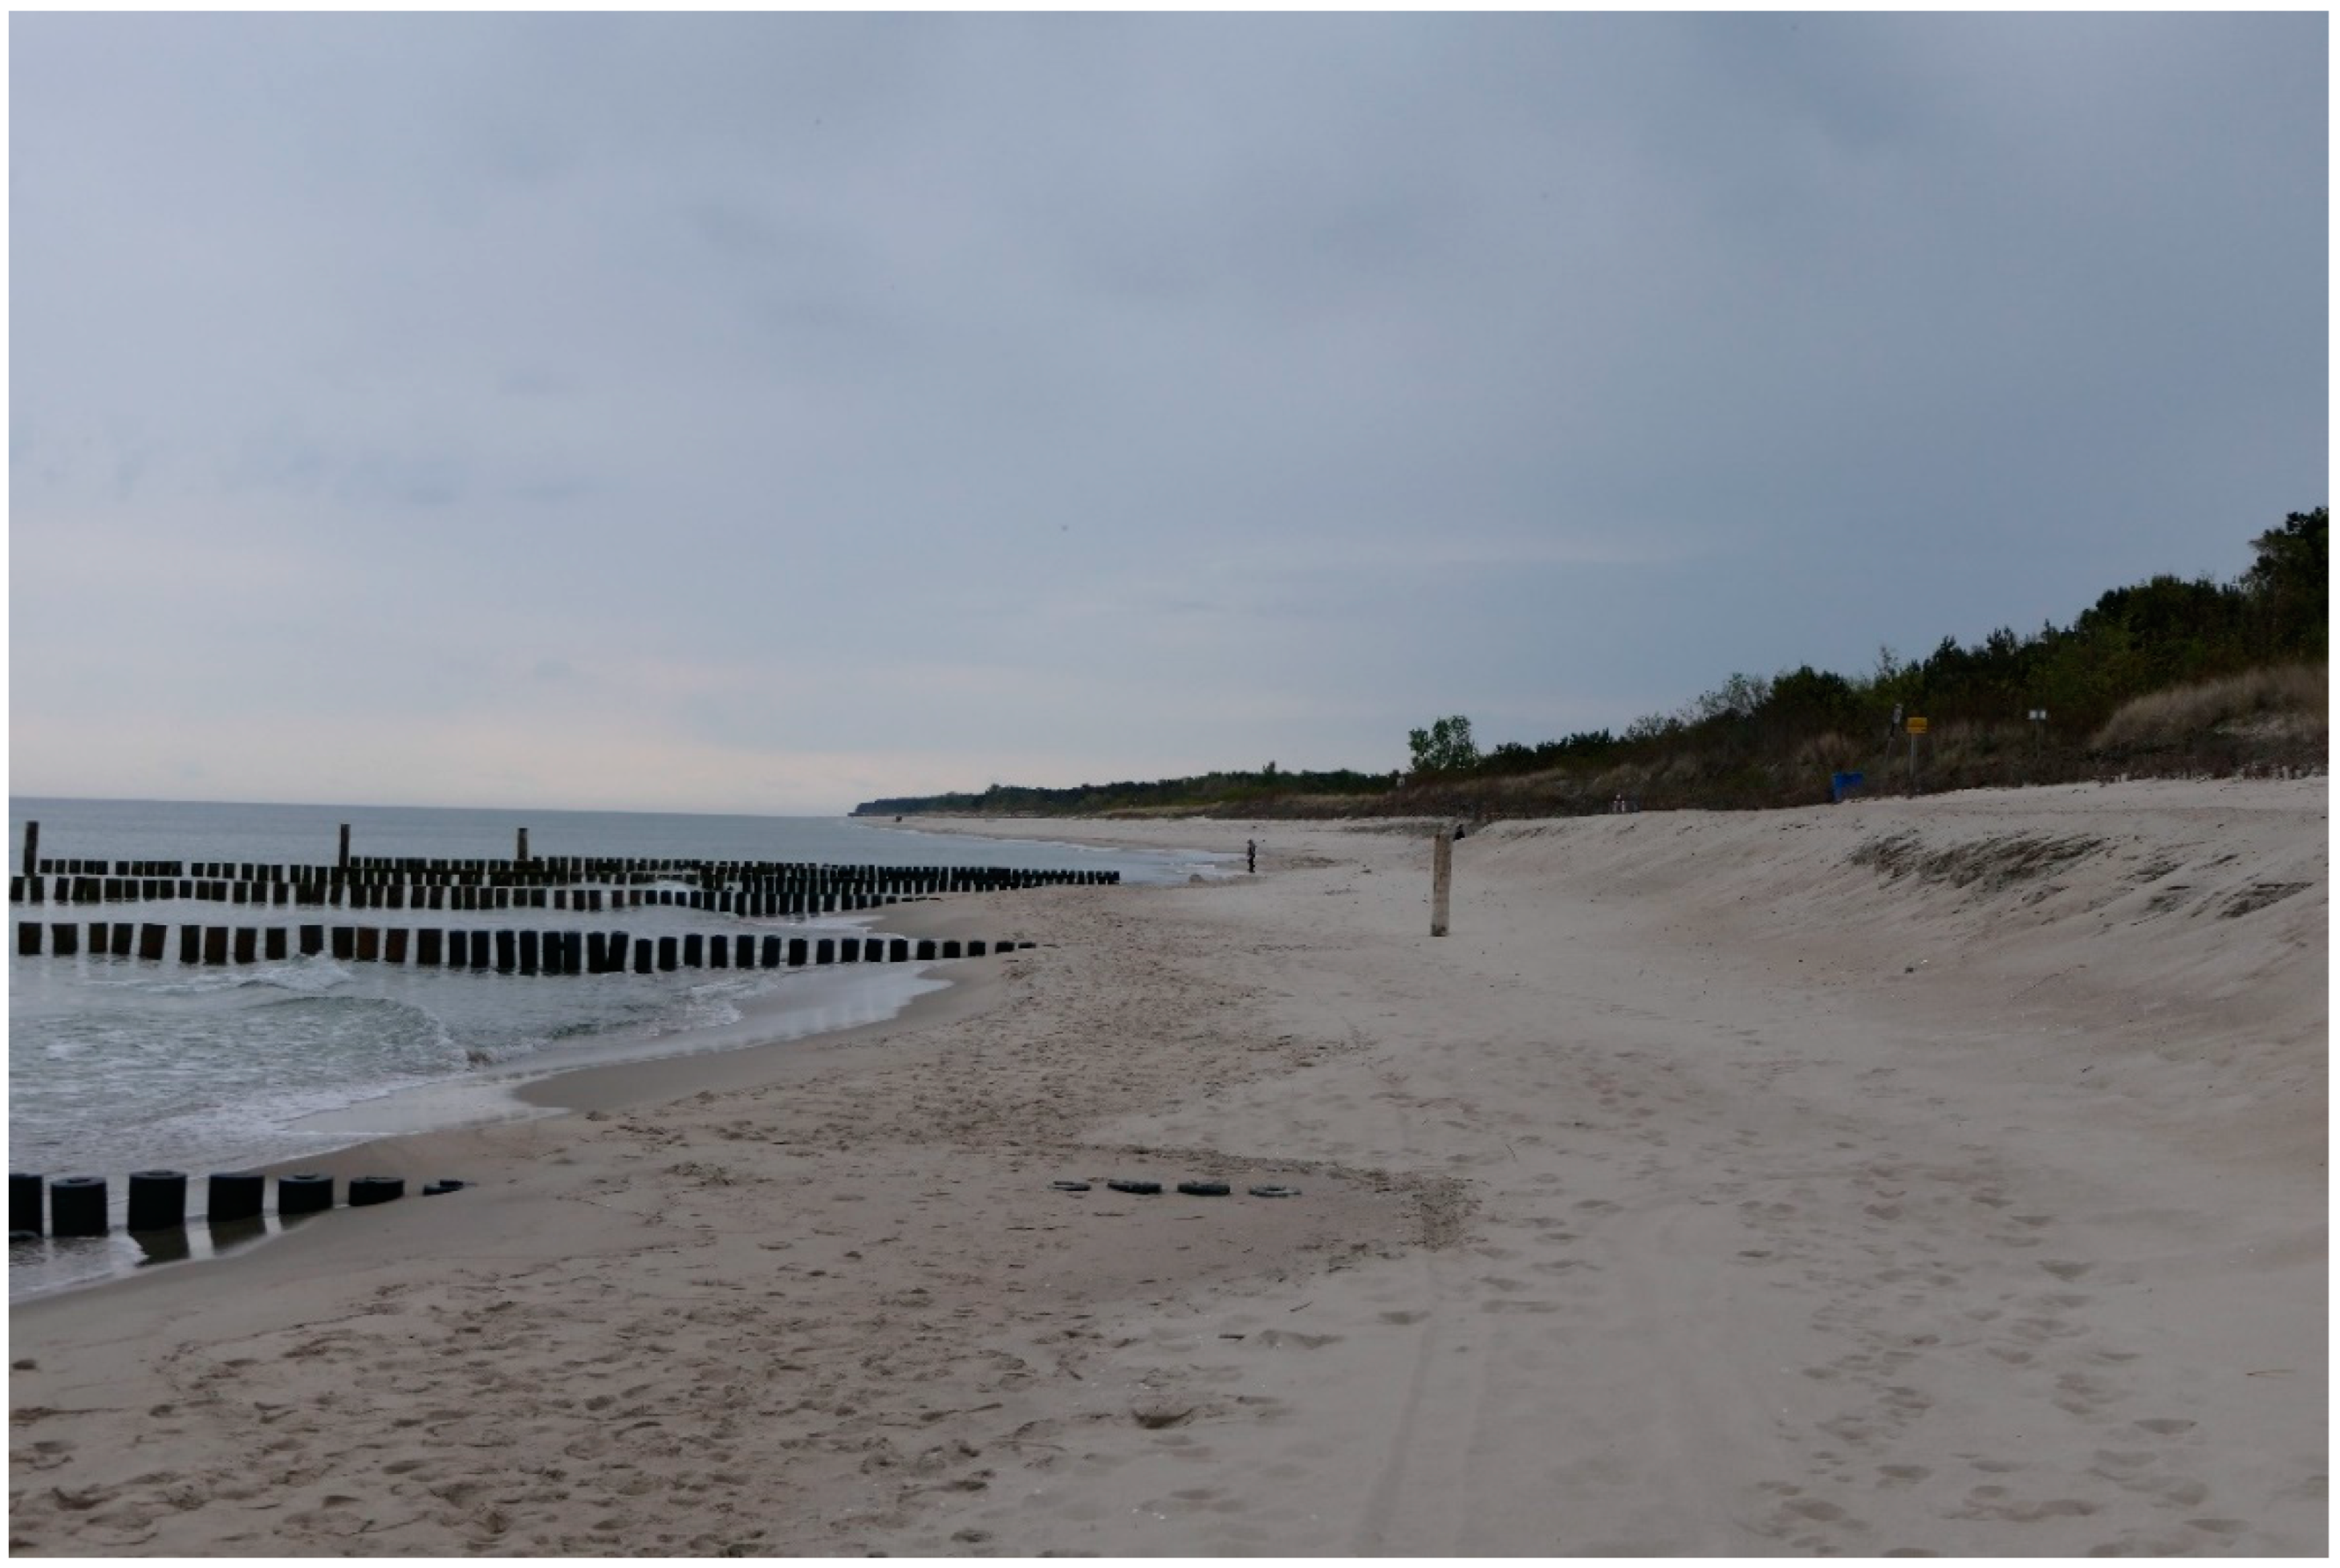
Notably, the considerable and persistent erosion of dunes at the 10.9 km H mark is indicative of the combined impacts of these factors. The primary contributing factor involves the installation of novel groynes, coinciding with a particularly severe storm event shortly after their construction. Erosion that occurs at the end of the groyne group is well known in the literature [
42,
43].
Figure 20, a photograph taken on 21 May 2021, during the LiDAR measurement, clearly shows the sea side effect associated with the intensification of erosion processes at the end of the newly constructed groynes.
The heightened dune erosion in the area may also be attributed to the long, oblique to the shore depressions present in the bottom topography. The issue has been under investigation since the 1990s. Among other research, in 1999 Gajewski et al. [
27] identified such seabed forms during extensive bathymetric surveys. Their research revealed non-uniform bottom topography at greater depths characterized by significant depressions called “runnels” resulting in wave energy concentration [
41]. These underwater features allow greater wave energy to reach the coast in favorable meteorological conditions. Notably, one such “energy window”, aligned with the area around km H 10.9, likely contributed to increased dune erosion along this stretch. Bathymetric maps suggest that in the nearshore zone of the northwestern part of the Hel Peninsula, there are at least five such energy windows at: 4.3, 6.4, 7.8, 10.9, and 12 km H (
Figure 21). All these “runnels” are oriented obliquely to the coast, and their axis is directed approximately from northwest to southeast, which, given the relatively frequent occurrence of northwesterly winds in the study area, increases the likelihood of intensified coastal erosion along these specific sections of the coast. The influence of bottom relief and similar seabed forms on erosion has already been confirmed on another section of the Polish coast in the vicinity of the Widowo Nature Reserve located approximately 20 km west of Władysławowo [
44].
Moreover, the literature underscores storm surge as a prominent natural process driving coastal erosion. For instance, Różynski et al., (2023) [
45] emphasize the duration of successive storms and storm clusters as pivotal factors impacting coastal resilience in the Baltic Sea. They emphasize that erosion may ensue from prolonged storm durations rather than solely from exceptionally high waves or storm surges. Another natural factor, which is pointed out as a key factor in enhanced erosion is diminishing ice cover [
26]. The causes of erosion should not be attributed to dredging activities, as the material for artificial nourishment of the Hel Peninsula’s open-sea side beaches, excluding the approach channel to the port in Władysławowo and its sediment trap, was sourced following the policy of not disturbing the seabed within the zone affected by wave breaking, i.e., the interbar zone, to avoid disrupting the natural sediment balance in the coastal zone [
46].
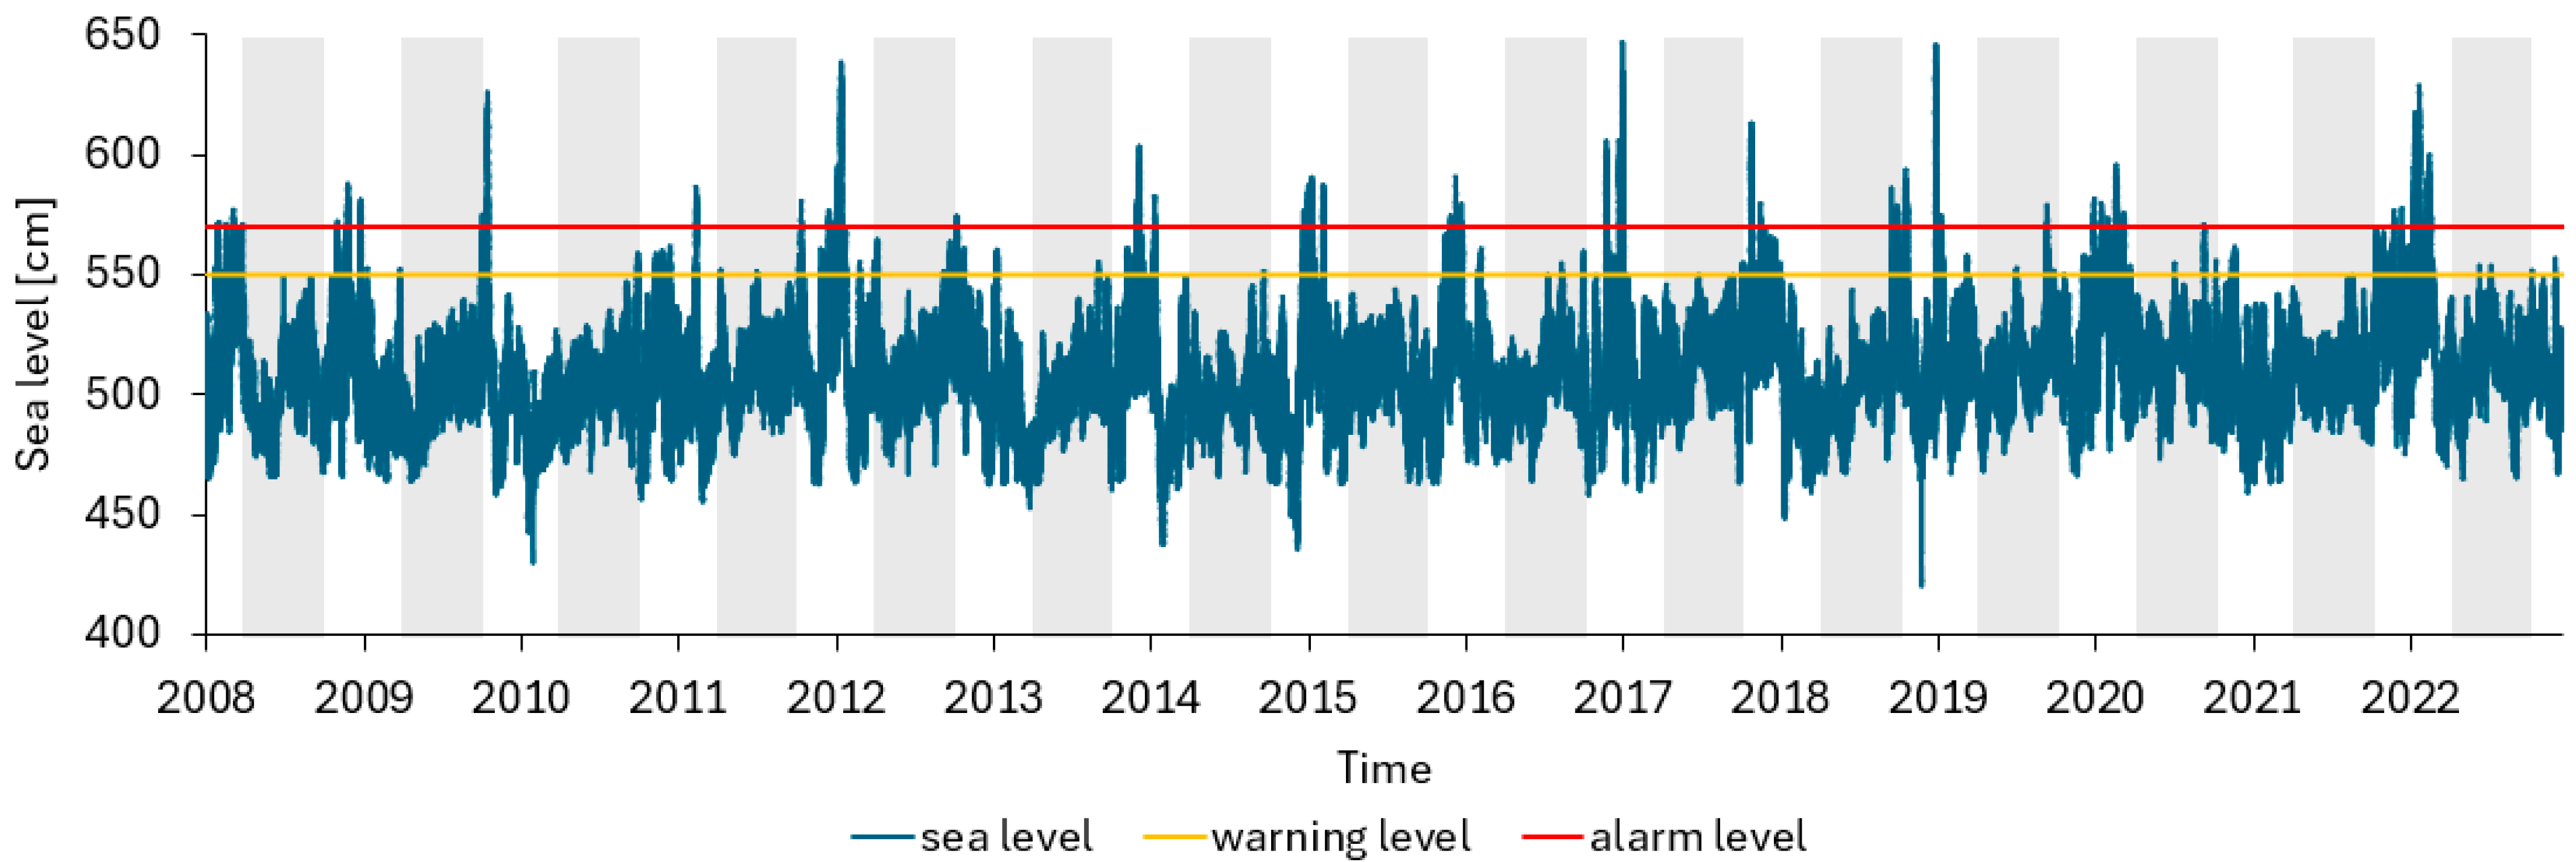
A qualitative comparison of the storm surge data (
Figure 3,
Table 1) and the results of the present erosion study does not allow for a possible correlation between erosion and the number of days with high sea levels. This is primarily due to the limited availability of data. During the course of this study, LiDAR data collected annually were only available for a period of 7 years (2016–2022), during which years with a higher number of days of elevated sea levels occurred in 2020 and 2022. However, investigating this relationship is not the subject of this study. Further research should explore the multifactorial dependence of erosion on wind speed and direction, the number of stormy days, elevated sea levels, shore nourishment, ice cover, and seabed morphology. Systematic, continued LIDAR measurements in the next years would provide a comprehensive database, enabling such multidimensional studies and in-depth examination of the complex interactions in the coastal zone that lead to morphodynamic changes. At this stage of the research, the gathered data on beach erosion and artificial nourishment enable a qualitative evaluation of the morphodynamic processes ongoing in the study area and their interplay with human activities. To delve deeper into the specifics of each area, we proceed to discuss individual sections in detail.
4.1. Subzone 0.0–1.5 km H
The segment is entirely built up with groynes and to a large extent, with a seawall (0.0–1.0 km H) protecting the dune from intense erosion. Due to the proximity of the source material for nourishment and its almost yearly repetition, this place seems to have a stable character in terms of sediment balance. The significance of nourishment is evident in the year 2022—following minor nourishment in 2021 compared to other years, the profile observed in 2022 (
Figure 9, pink line) indicates clear erosion.
4.2. Subzone 1.5–3.7 km H
This is an area still at least partially within the influence of the port in Władysławowo [
40]. However, since it has not undergone artificial nourishment during a considered 15-year period it bears the marks of natural processes. Along this section, there is still only one dune ridge, but with very diverse heights when viewed from west to east. The highest dunes occur at both boundaries of the surveyed area (1.5 and 3.7 km H). The entire section is also protected by groynes. The moderate accretion that occurs in the eastern part of the section can be considered of natural origin since no beach nourishment was conducted in the vicinity during the considered period.
4.3. Subzone 3.7–4.8 km H
The subzone without buildings up to the railway tracks along its entire length. The entire area is protected by groynes. The area was intensively nourished, especially its central part. The area is characterized by a single dune ridge with occasional small embryonic dune ridges. The height of the dunes gradually decreases towards the southeast. Despite intense nourishment, the short central section of the subzone is erosive. Protection through nourishment is needed at this location to maintain its stabilization.
4.4. Subzone 4.8–6.5 km H
A 1.7 km stretch characterized by a quasi-natural nature, due to no protection through nourishment in the considered period. The entire area is protected by groynes. Along the entire length, dune areas have relatively low heights compared to neighboring areas. The height of the dunes only increases at the eastern boundary of the subzone (6.4 km H). Dunes appear in variable configurations of single (5.0–5.5 km H) or double ridges (4.7–5.0, 5.5–6.5 km H). The subzone is an example of a natural, relatively stable shore profile with a slowly retreating dune foot and low morphodynamics.
4.5. Subzone 6.5–7.8 km H
A stretch of 1.3 km in length is located near the main buildings of the village of Chałupy, including near the railroad line surrounding the village to the north. Dunes appear in two or even three ridges along the section (at the highest bulge of the railway line). The dunes reach significant heights only in the northwestern part, i.e., in the vicinity of the village of Chałupy. South-east of it, their height decreases sharply along with their width. An exception is the extensive, high dune at 7.6 km H. The entire area is protected by groynes. The whole area was protected by nourishment during the considered period.
4.6. Subzone 7.8–10.0 km H
A 2.2 km stretch of coast, where nourishment works were conducted in one year in a limited area. Like the previous sections, it is entirely covered with groynes. It is located between the villages of Chałupy and Kuźnica. In the northwestern part of this long stretch, there are single, fairly narrow dune ridges with low heights. The height and complexity of the dunes increase towards the southeast, covering the segment 8.7–9.6 km H. Southeast of 9.6 km H, there is a subsequent decrease in dune height and width. The subzone can be considered as a region of natural accretion and embryo dune formation. Despite the lack of nourishment, in the 7.9–8.5 km H section significant beach accumulation (+2 m) was observed in the period 2020–2021. This phenomenon is possibly associated with the alongshore transfer of nourished sediment in 2020 from the 7.4–7.8 km H section and accumulation a few hundred meters southeast. However, this nourishment was eroded in the subsequent period (2022–2021) and may have been further transported southeastward or into the sea.
4.7. Subzone 10.0–12.6 km H
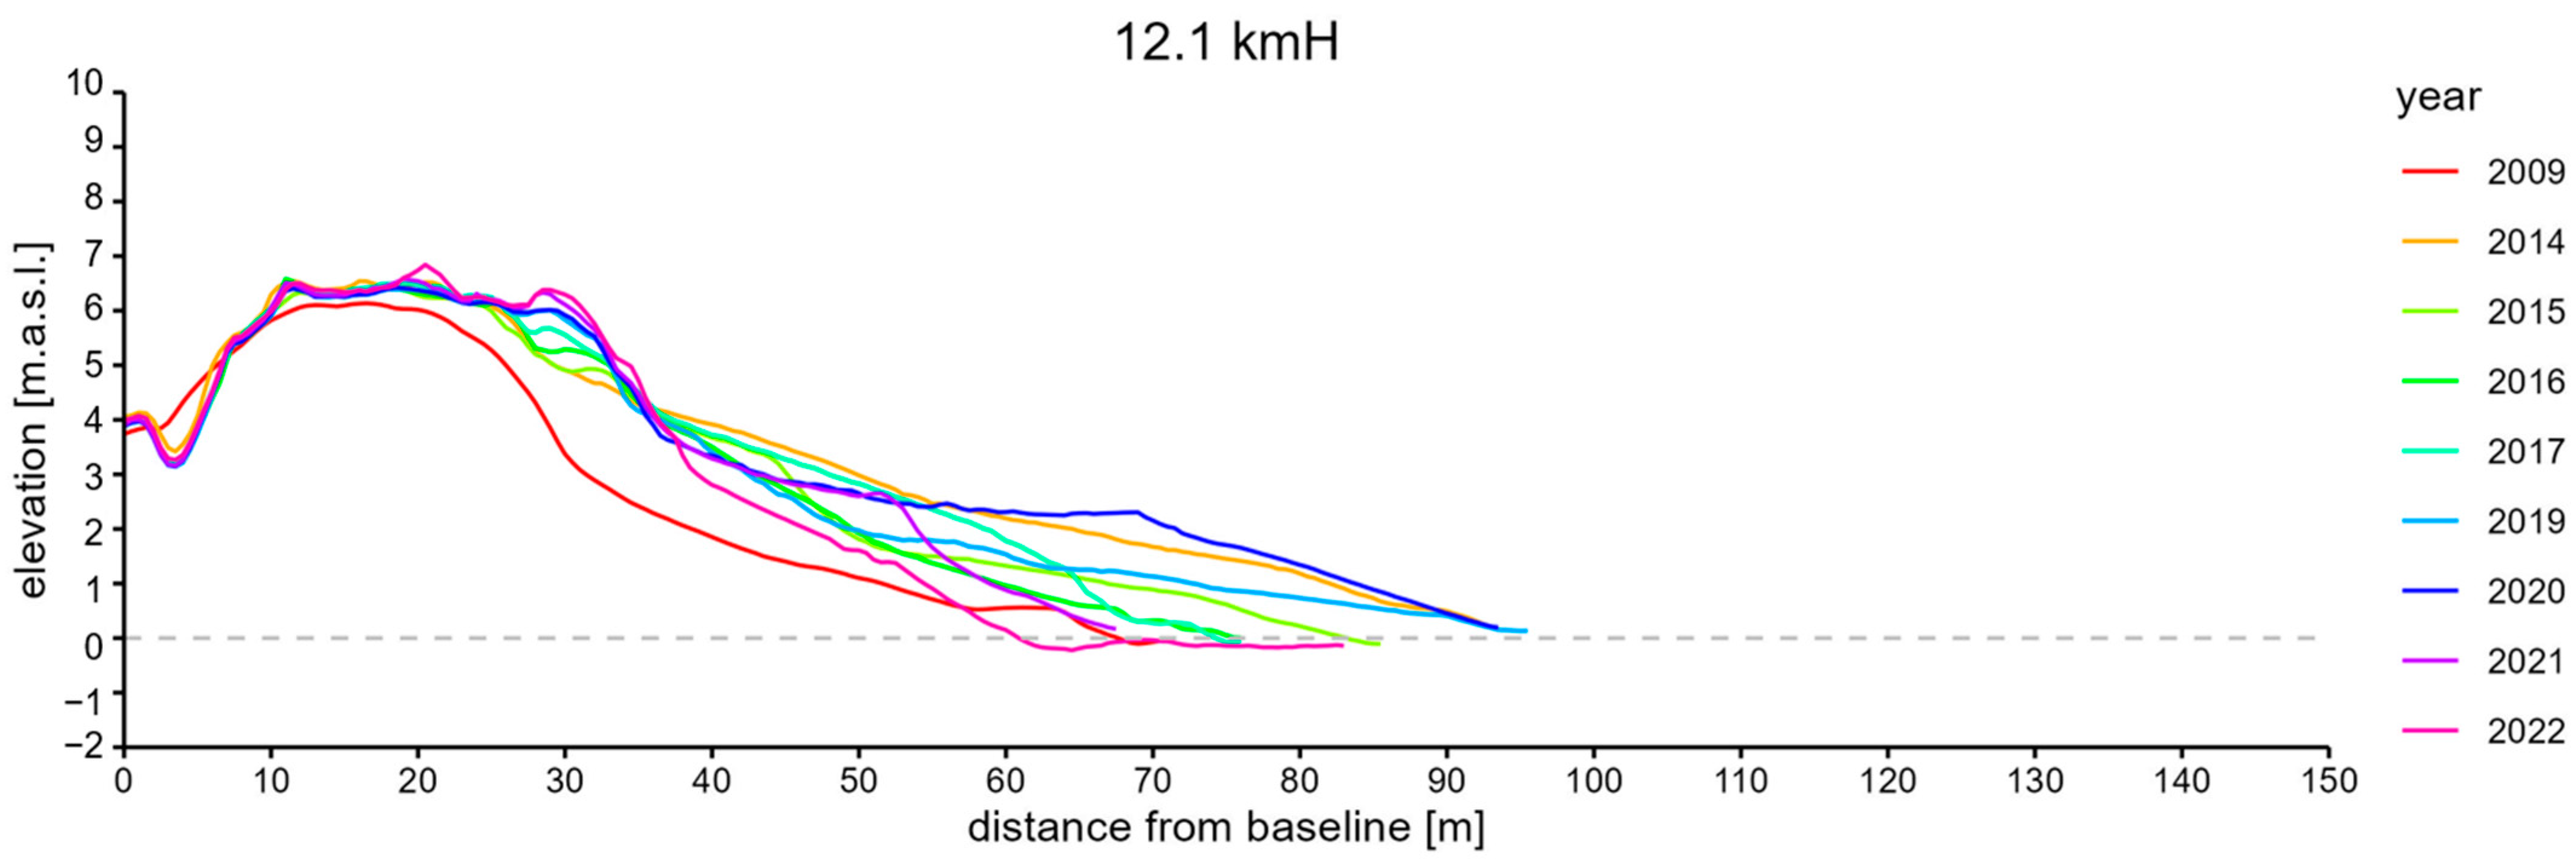
A 2.6 km stretch encircling the village of Kuźnica and its western outskirts constitutes the second of the two most intensively nourished sections along the analyzed coastline fragment. Nourishments were carried out here almost annually. Since 2020, almost the entire length of the subzone has been protected by groynes (up to 12.3 km H) after extending the system in 2020. Previously, the groynes ended approximately at 10.2 km H, about 2 km nearer to the northeast. The geomorphology of this coastline stretch is diverse. In general, the beaches are mostly bounded by a single dune ridge with low heights and very little width. In several places, foredunes or a second dune ridge consist of hills extended deep into the land with considerable heights. They occur between 10 and 11 km H, at 11.5 km H, and north of the Kuźnica and the railway line running through it, which bulges towards the sea here even more than in Chałupy (
Figure 22). In this case, the research area directly borders the railway line and is directly threatened by morphodynamic processes occurring on the adjacent dune. For this reason, a decision was made 30 years ago to build there a seawall similar to the one in Władysławowo. It directly protects the dune foot at 11.8–12.5 km H. It was rebuilt in 2020 after the storm in 2019, which damaged it.
In this subzone, an example of artificial erosion is visible after the 2020 year, caused by the side effect of groyne system shadow. In 2022, the dune was artificially transformed. In the vicinity of the end of the groynes system (12.3 km H) the occurrence of a side effect is visible and associated with the construction of hydrotechnical structures perpendicular to the shoreline. Intense erosion has only occurred there since 2020, confirming this hypothesis. The erosion in this area from 2008 to 2019 was at least partially a consequence of the formation of an erosion bay in the shadow of the end of the groynes system, which was then located at 10.2 km H.
4.8. Subzone 12.6–15.0 km H
The last of the sections within the studied area, with a length of 2.6 km, is located furthest southeast of the base of the Hel Peninsula in Władysławowo. It starts from the eastern outskirts of the last buildings of the main part of the village of Kuźnica and includes its further eastern settlement. Over the considered 15 years, this area was nourished only once, but across its entire length. This occurred in 2022 and was the result of obtaining a large amount of dredged material from deepening the fairway leading to the port of Gdańsk. The geomorphology of this section is diverse. In the northwest part, there is a wide strip of dunes with several ridges, then at around 13.4 km H, it narrows down to a single ridge, which continues to 13.7 km H, where the dunes widen again. From this point onwards, towards the southeast, extensive dune systems extend toward the land, with the highest dune of this section of the Hel Peninsula called Lubek (14.3 km H) reaching a height of 13.2 m above sea level. This area, unlike the others discussed, is not protected by a system of groynes, giving it an almost fully natural character, especially considering the single act of artificial nourishment in 2022 (outside the analysis period). Taking into account the increase in terrain height between the periods 2009–2022 and 2009–2014, accumulation in areas of the highest deposition occurred gradually, likely fueled by aeolian transport. In the future, a disruption in sediment balance can be expected in the northwest part of the section due to the influence of the end of the groynes system and at 13.5 km H, where there is a discontinuity in the accumulation area, which is most likely related to the low height and width of the dunes in this part of the section. It may act as a transit area for sand grains rather than accumulative.
4.9. The Applicability of LiDAR Technology for Erosion Assessment in the Southern Baltic Region
Multi-year LiDAR data proved valuable for estimating shoreline evolution in the study area. However, the use of this technology on sandy shores has some limitations influenced by environmental factors and weather conditions. For instance, adverse weather conditions such as cloud cover and high waves can hinder photogrammetric flights and affect the accuracy of ALS/ALB (airborne lidar bathymetry) measurements. Even under favorable conditions, issues such as increased sea level, high silting, and the presence of algae on the seabed can impact the quality of data obtained from LiDAR scans. Therefore, manual measurements or supplementary techniques may be necessary to overcome these limitations and ensure comprehensive coastal assessment. Another limitation is handling large data volumes and processing demands, particularly when dealing with coastal environments where complex topography and dynamic features may affect data quality. All these factors can impact the efficacy of LiDAR in accurately capturing coastal changes and erosion dynamics. Despite these limitations, innovative approaches and advancements in processing techniques can enhance LiDAR’s utility in coastal zone assessment, aiding in comprehensive coastal management strategies [
19].
The ALS method also presents constraints, such as scanning density and timing. For instance, the density of ALS data differed between 2009 and 2022, with four points per square meter in 2009 and 13 points per square meter in 2021. Additionally, some data was captured in spring, while the other was obtained in fall, leading to variations in vegetation density between these periods. Moreover, the accuracy of point surface representation may have been influenced by the effectiveness of filtering and automatic classification methods [
47].
In the modern history of the Peninsula, five periods can be distinguished: (1) The period until the end of the 16th century, when the Peninsula existed rather as a fairly complex morphological entity, about which little can be said at present. (2) The period from the 16th to the end of the 18th century, during which the continuity of the Peninsula was likely repeatedly interrupted and naturally restored, as visible on old maps. During this time, seasonal watercourses and natural channels existed on the Peninsula. (3) In the 19th century, the first coastal protection measures of the Peninsula’s shores were built in the form of embankments (structures constructed parallel to the shore aimed at preventing beach erosion). (4) During the period from 1910 to 1937, there was significant erosion of the shore, with an average retreat of 23.4 m, i.e., at an average rate of 0.84 m per year. The Peninsula was protected in many places during this time. For example, due to strong coastal embankments were built in the Chałupy, Kuźnica, and Jastarnia areas. (5) The period after the construction of the Port in Władysławowo [
48,
49].
The Hel Peninsula is an area where the largest, most expensive, and priority protective actions of coastal engineering are carried out. Nowhere else on the Polish coast are works undertaken on such a wide scale, to such an extent, and for so long [
2]. However, it should be noted that all actions taken do not eliminate the causes of erosion. They merely mitigate its effects. To eliminate the causes of erosion, the reasons for it should be identified, which, despite over 50 years of work, have not been satisfactorily conducted. As mentioned, coastal erosion on the Peninsula is associated with the nonlinear overlapping of three main causes: (1) disturbance of sediment transport from the cliffs of Jastrzębia Góra eastward, (2) exposure of the Peninsula to the largest storms from the NE directions, and (3) underwater “runnels” (so-called “energy windows” identified by Gajewski et al.), which bring more wave energy to the shore. On the other hand, as mentioned, in the past, the Peninsula was not a continuous structure; it was a morphological feature that seasonally changed its shape and position, with natural channels appearing and disappearing. As long as this area was not anthropologically utilized, it did not bother anyone. With the appearance of humans, there arose the need to secure the coast. In this context, it should be emphasized that all protective actions undertaken by humans after World War II; hence, the last 70 years are just a moment in the history of the Peninsula’s life. The coastal protection strategy implemented in the 1980s, the most serious and expensive protective actions conducted on the Polish coast, has been ongoing for only about 30 years [
50].
Predictions of climate change and rising prices of sediment used for beach nourishment prompt the question of whether the current strategy is appropriate. Perhaps it would be better to build a massive, hard coastal barrier along the Peninsula’s shore. This way, the Peninsula would be permanently secured. However, the obvious drawback of such an approach would be the irreversible destruction of the Peninsula’s beaches. Erosion occurring in front of such structures would cause significant damage to the Peninsula’s morphology. Fortunately, the Polish state strategy for coastal protection excludes the possibility of building hard, large coastal embankments in this location. Nevertheless, the authors of the study believe that discussions should not be about whether to protect the Hel Peninsula using artificial beach nourishment but rather how to do it. Perhaps a better solution would be to carry out artificial replenishment in the form of a SandMotor [
51], meaning that several million cubic meters of sand should be deposited in the Peninsula’s nearshore area. This way, it would be possible to eliminate (fill) the underwater energy windows that bring wave energy to the shore and eliminate the problem of sediment deficit caused by contractions. However, to carry out the Polish SandMotor Project, extensive interdisciplinary numerical, field, and study research on the processes of rebuilding the seabed and shoreline in the Hel Peninsula area is necessary. This work can be seen as the first, still uncertain, look at the idea of implementing innovative, other shoreline artificial beach nourishment projects in the South Baltic Sea.
5. Conclusions
The findings of this research provide insights into significant erosion patterns within the western segment of the Hel Peninsula. Variations in erosion intensity over time and space stem from both natural processes and human interventions. Despite ongoing efforts, areas experiencing erosion in 2008 still experience erosion in 2022 in 2022, with some locations showing continuous accumulation in the backshore and dune foot. Artificial nourishment has proven effective in compensating for sediment losses along certain parts of the coastline, yet specific areas, like the vicinity of Kuźnica, continue to present challenges despite groyne system expansions. In some coastal sectors, the impact of nourishment measures lasted only temporarily, with subsequent periods revealing varying degrees of erosion. The research highlights the importance of artificial nourishment in maintaining the stability of the Hel Peninsula, mitigating erosion resulting from both anthropogenic activities and natural forces. Annual ALS measurements yield valuable insights into monitoring the effects of artificial nourishment and identifying new areas requiring intervention.
The historical context of the Hel Peninsula illustrates a complex interplay between natural morphological changes and human interventions aimed at coastal protection. Despite historical efforts, erosion persists due to a combination of factors including disturbances in sediment transport, exposure to severe storms, and underwater geological features. While conventional coastal engineering measures have been employed, their effectiveness in the face of climate change and rising sea levels remains uncertain. Innovative solutions, such as the SandMotor project, offer promising alternatives to traditional replenishment methods. However, the implementation of such projects necessitates careful consideration of their environmental impact and long-term sustainability. Extensive interdisciplinary research is crucial to evaluate the feasibility and effectiveness of these approaches within the unique coastal dynamics of the Hel Peninsula.
In conclusion, although challenges persist in addressing coastal erosion on the Hel Peninsula, ongoing research and technological advancements provide opportunities for sustainable solutions that balance coastal protection with environmental preservation.


