
Multiscale Spatiotemporal Dynamics of Drought within the Yellow River Basin (YRB): An Examination of Regional Variability and Trends

Abstract
1. Introduction
2. Data and Methods
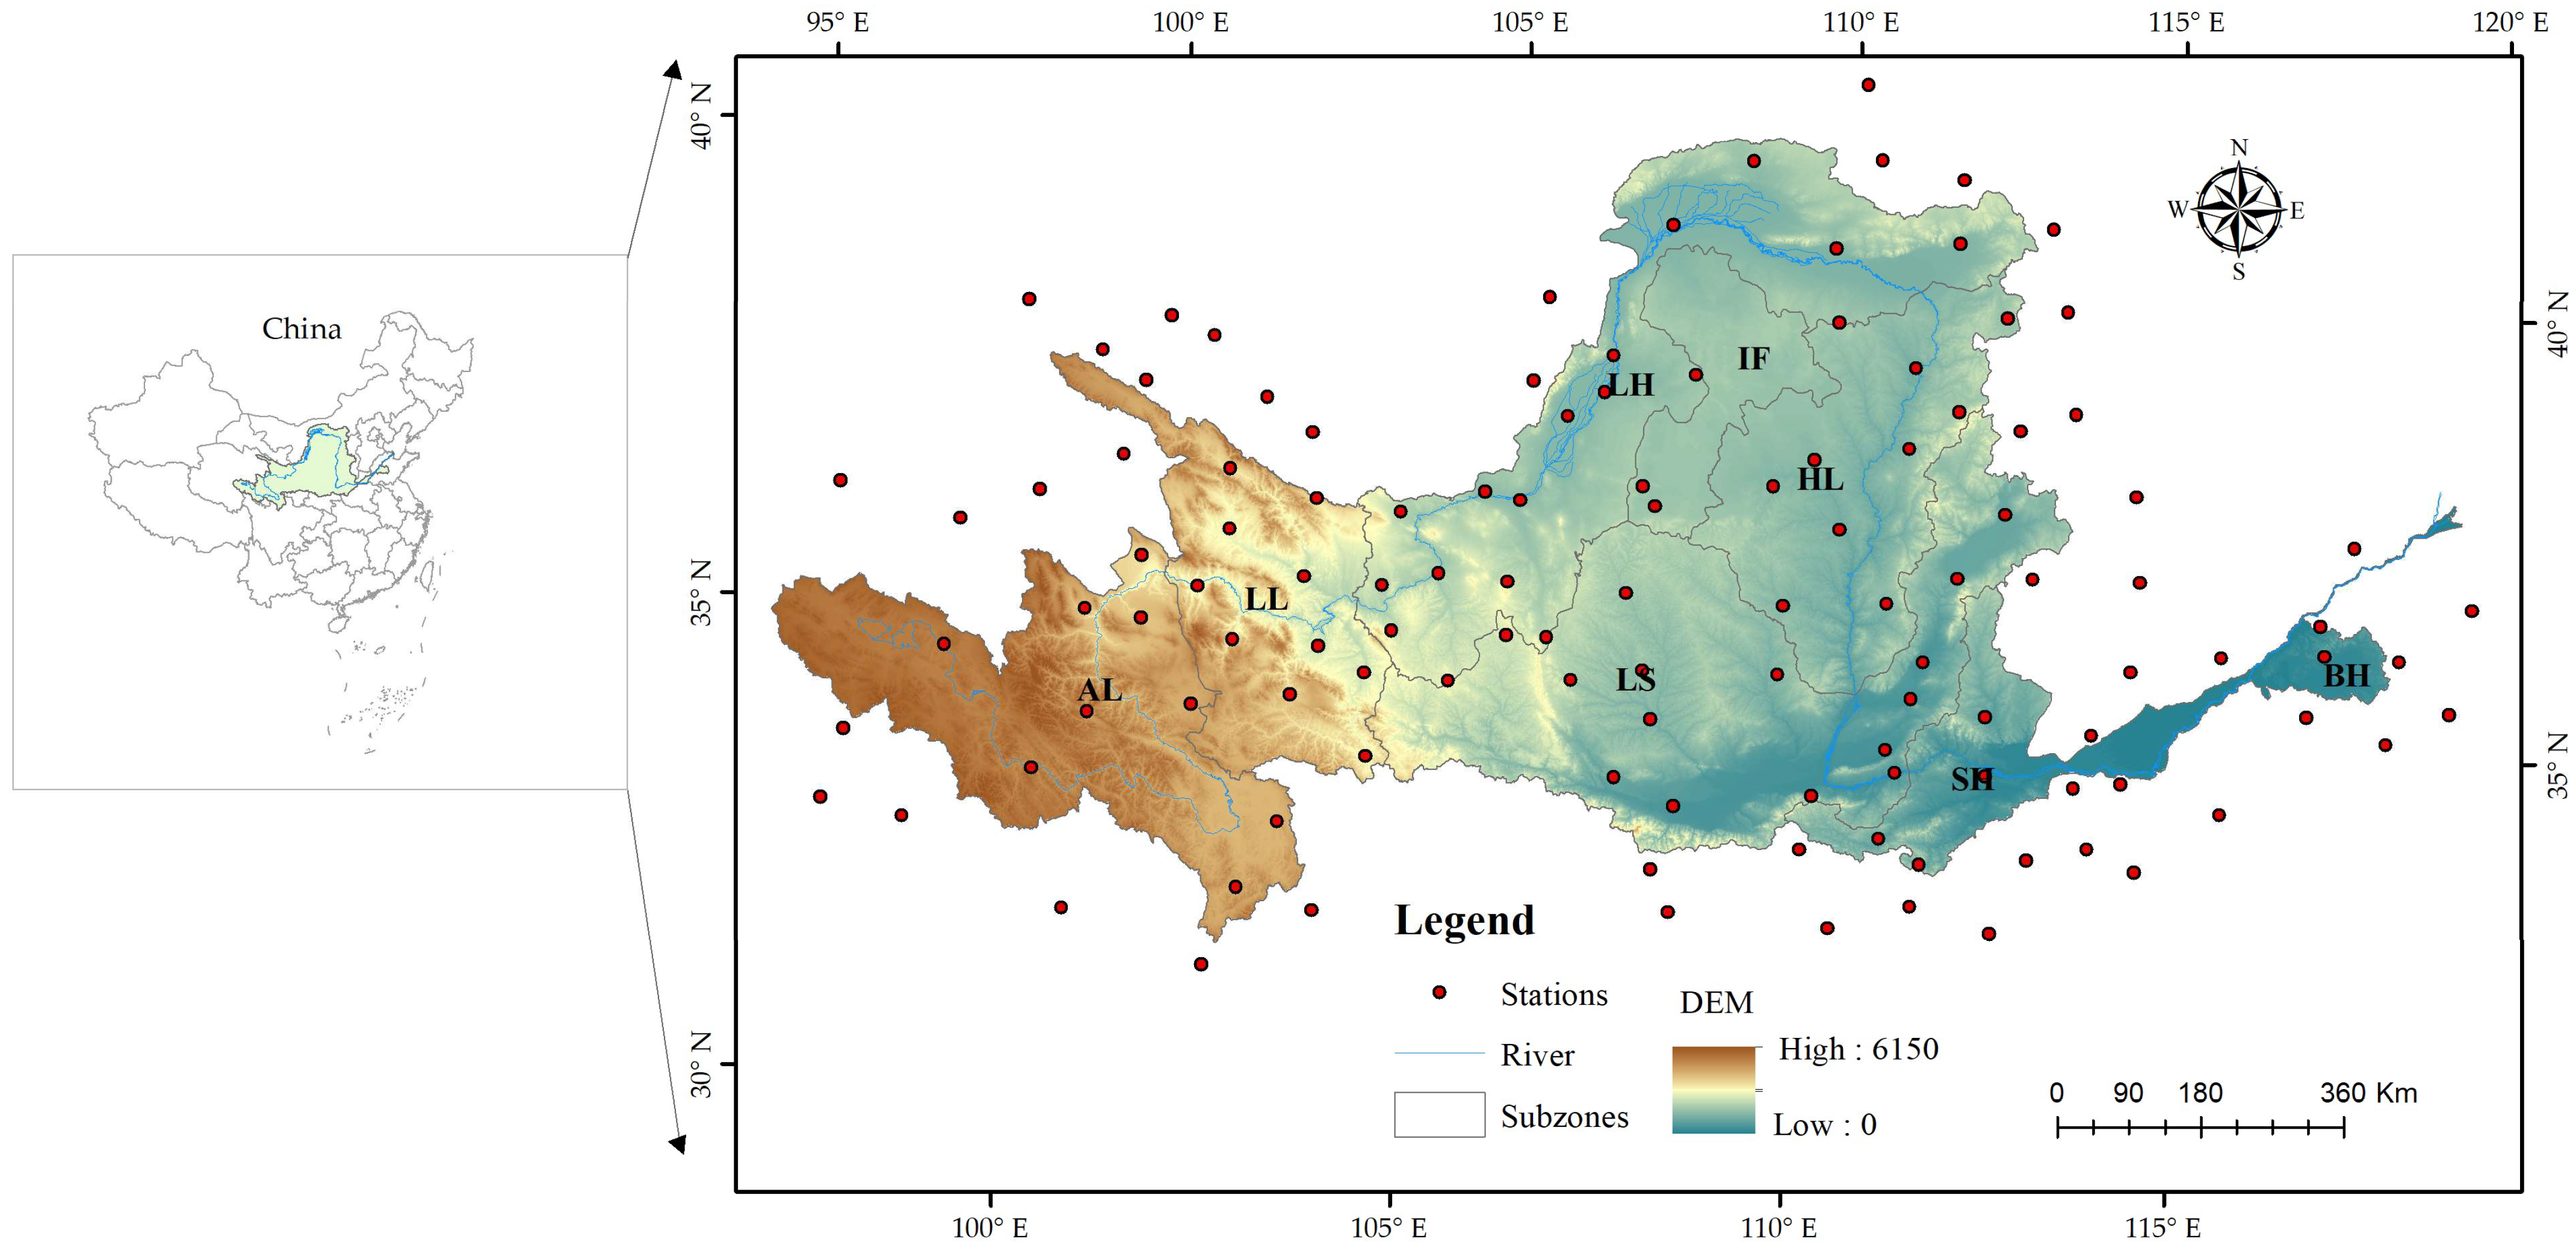
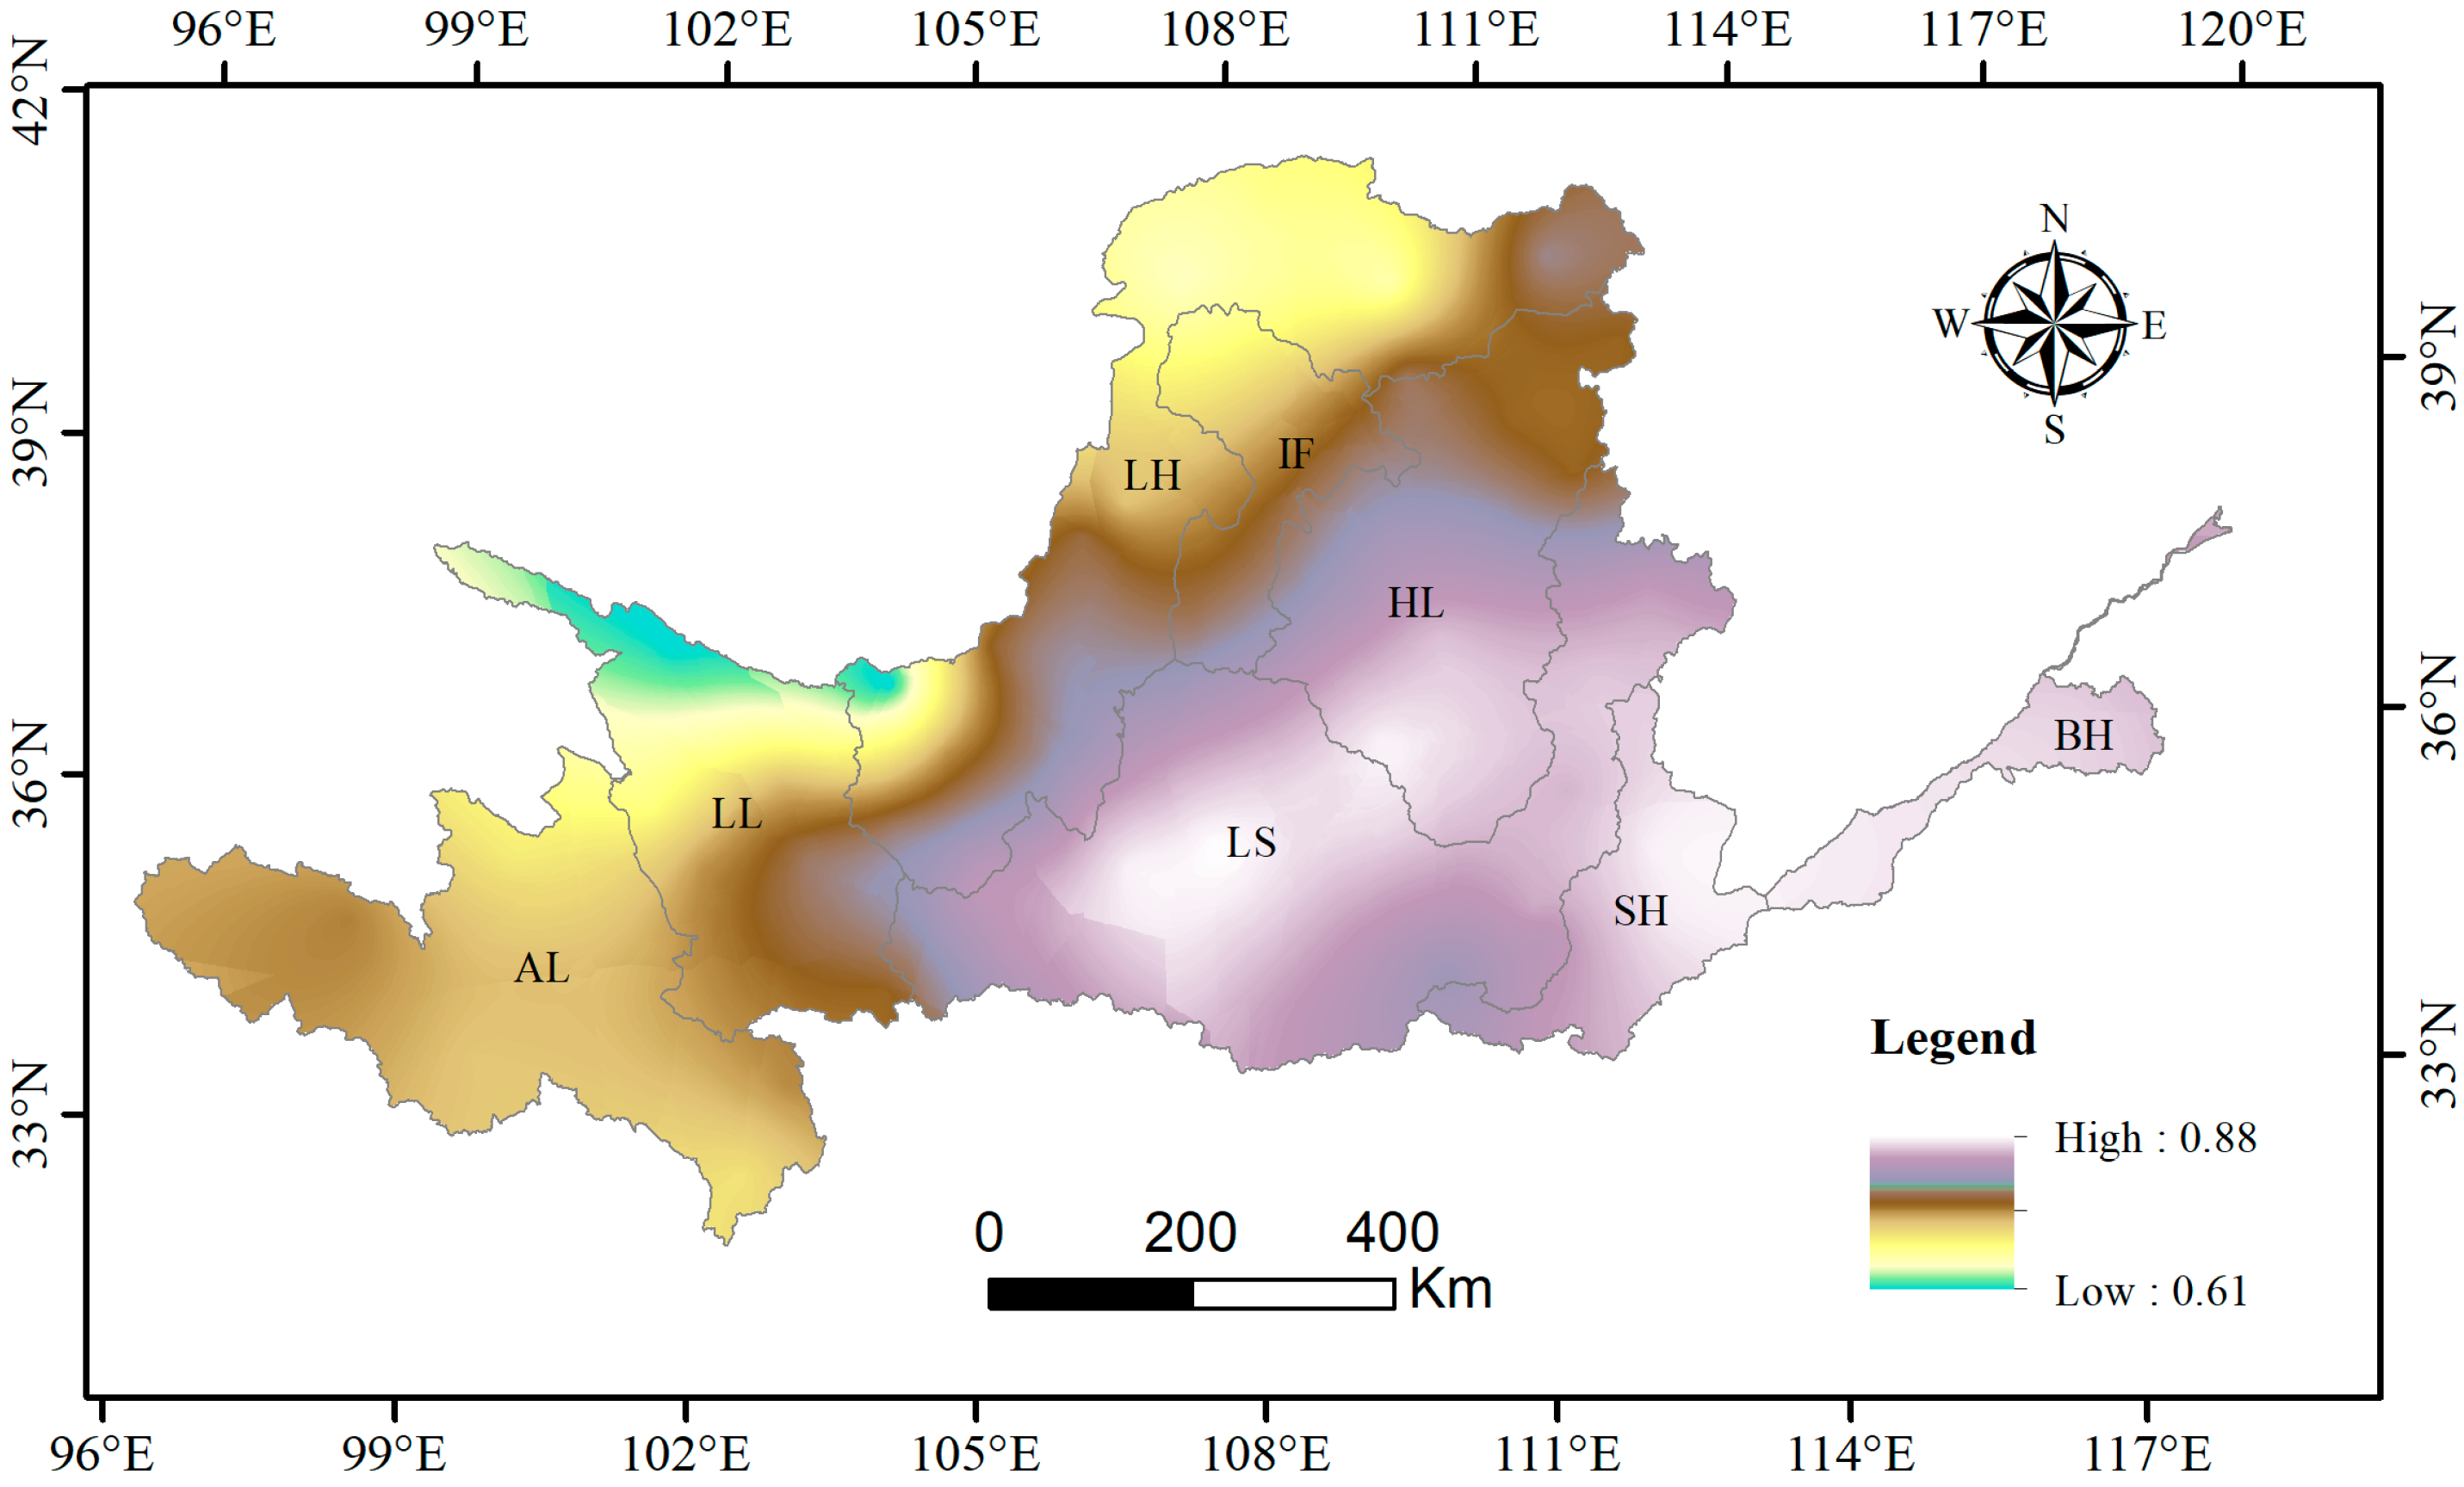
2.1. Study Area
2.2. Data
2.3. Methodology
2.3.1. Standardized Precipitation Evapotranspiration Index (SPEI)
2.3.2. Self-Calibrating Palmer Drought Severity Index (scPDSI)
2.3.3. Methodology for Trend Detection
3. Results
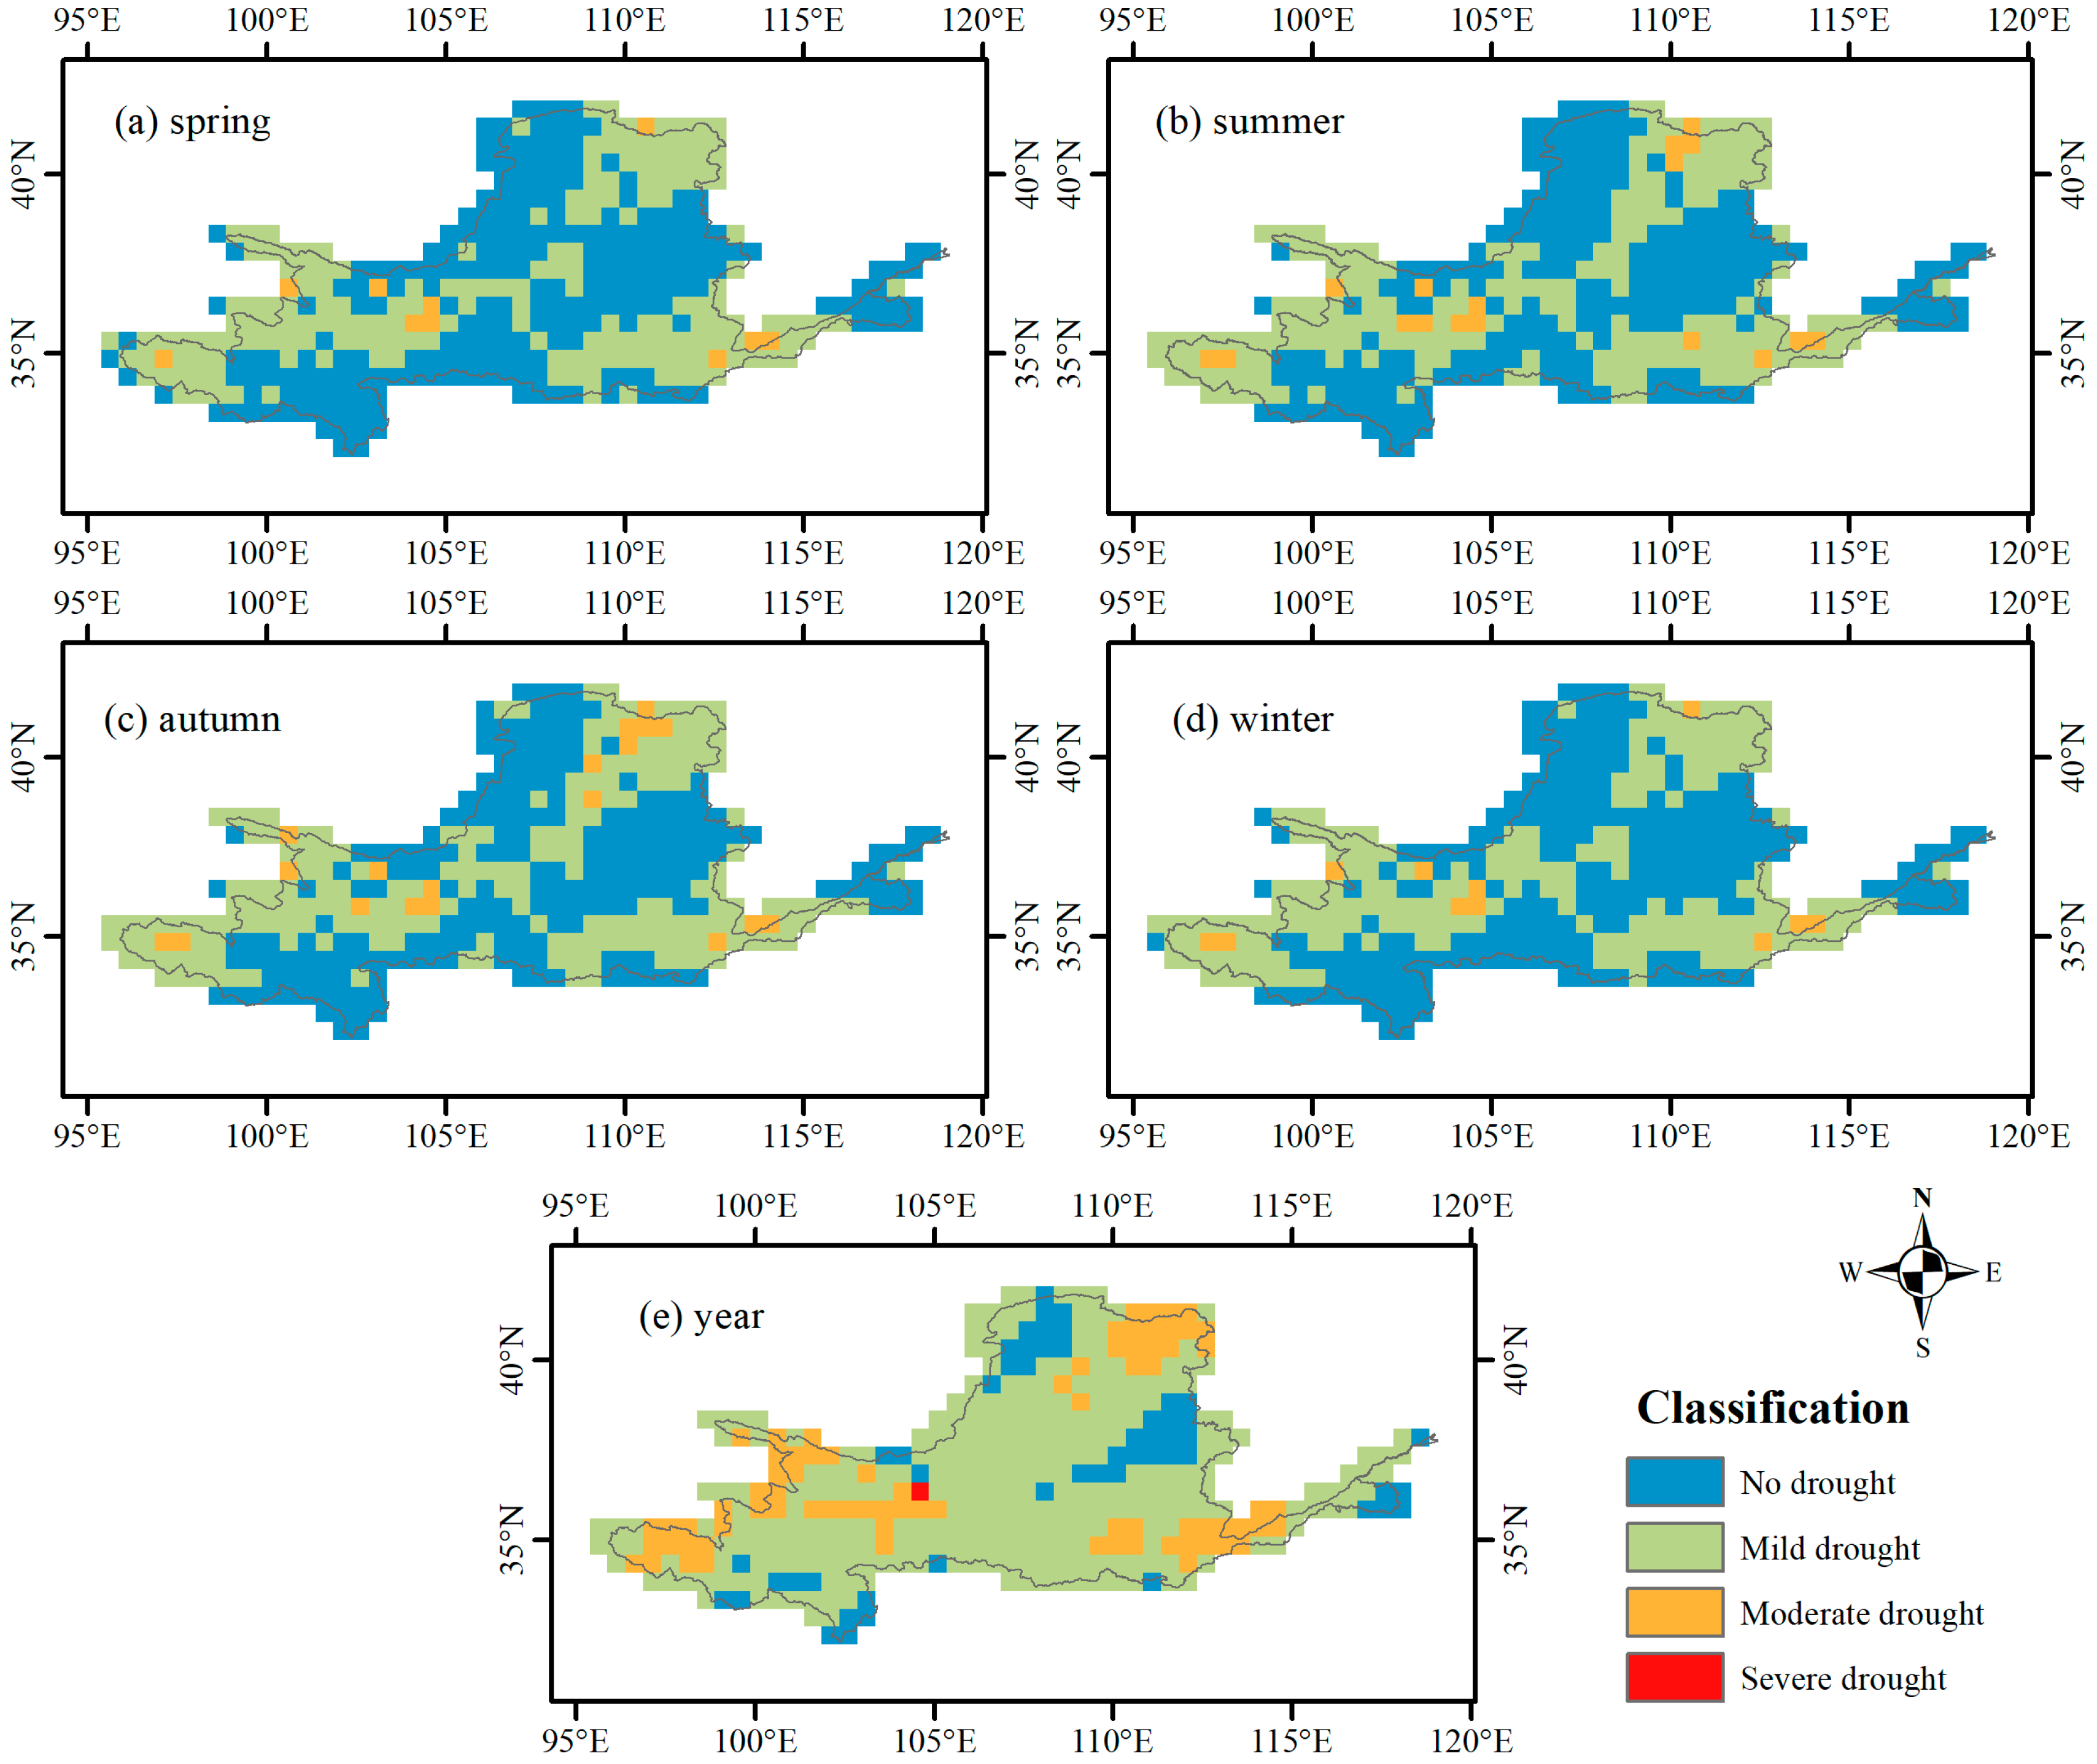
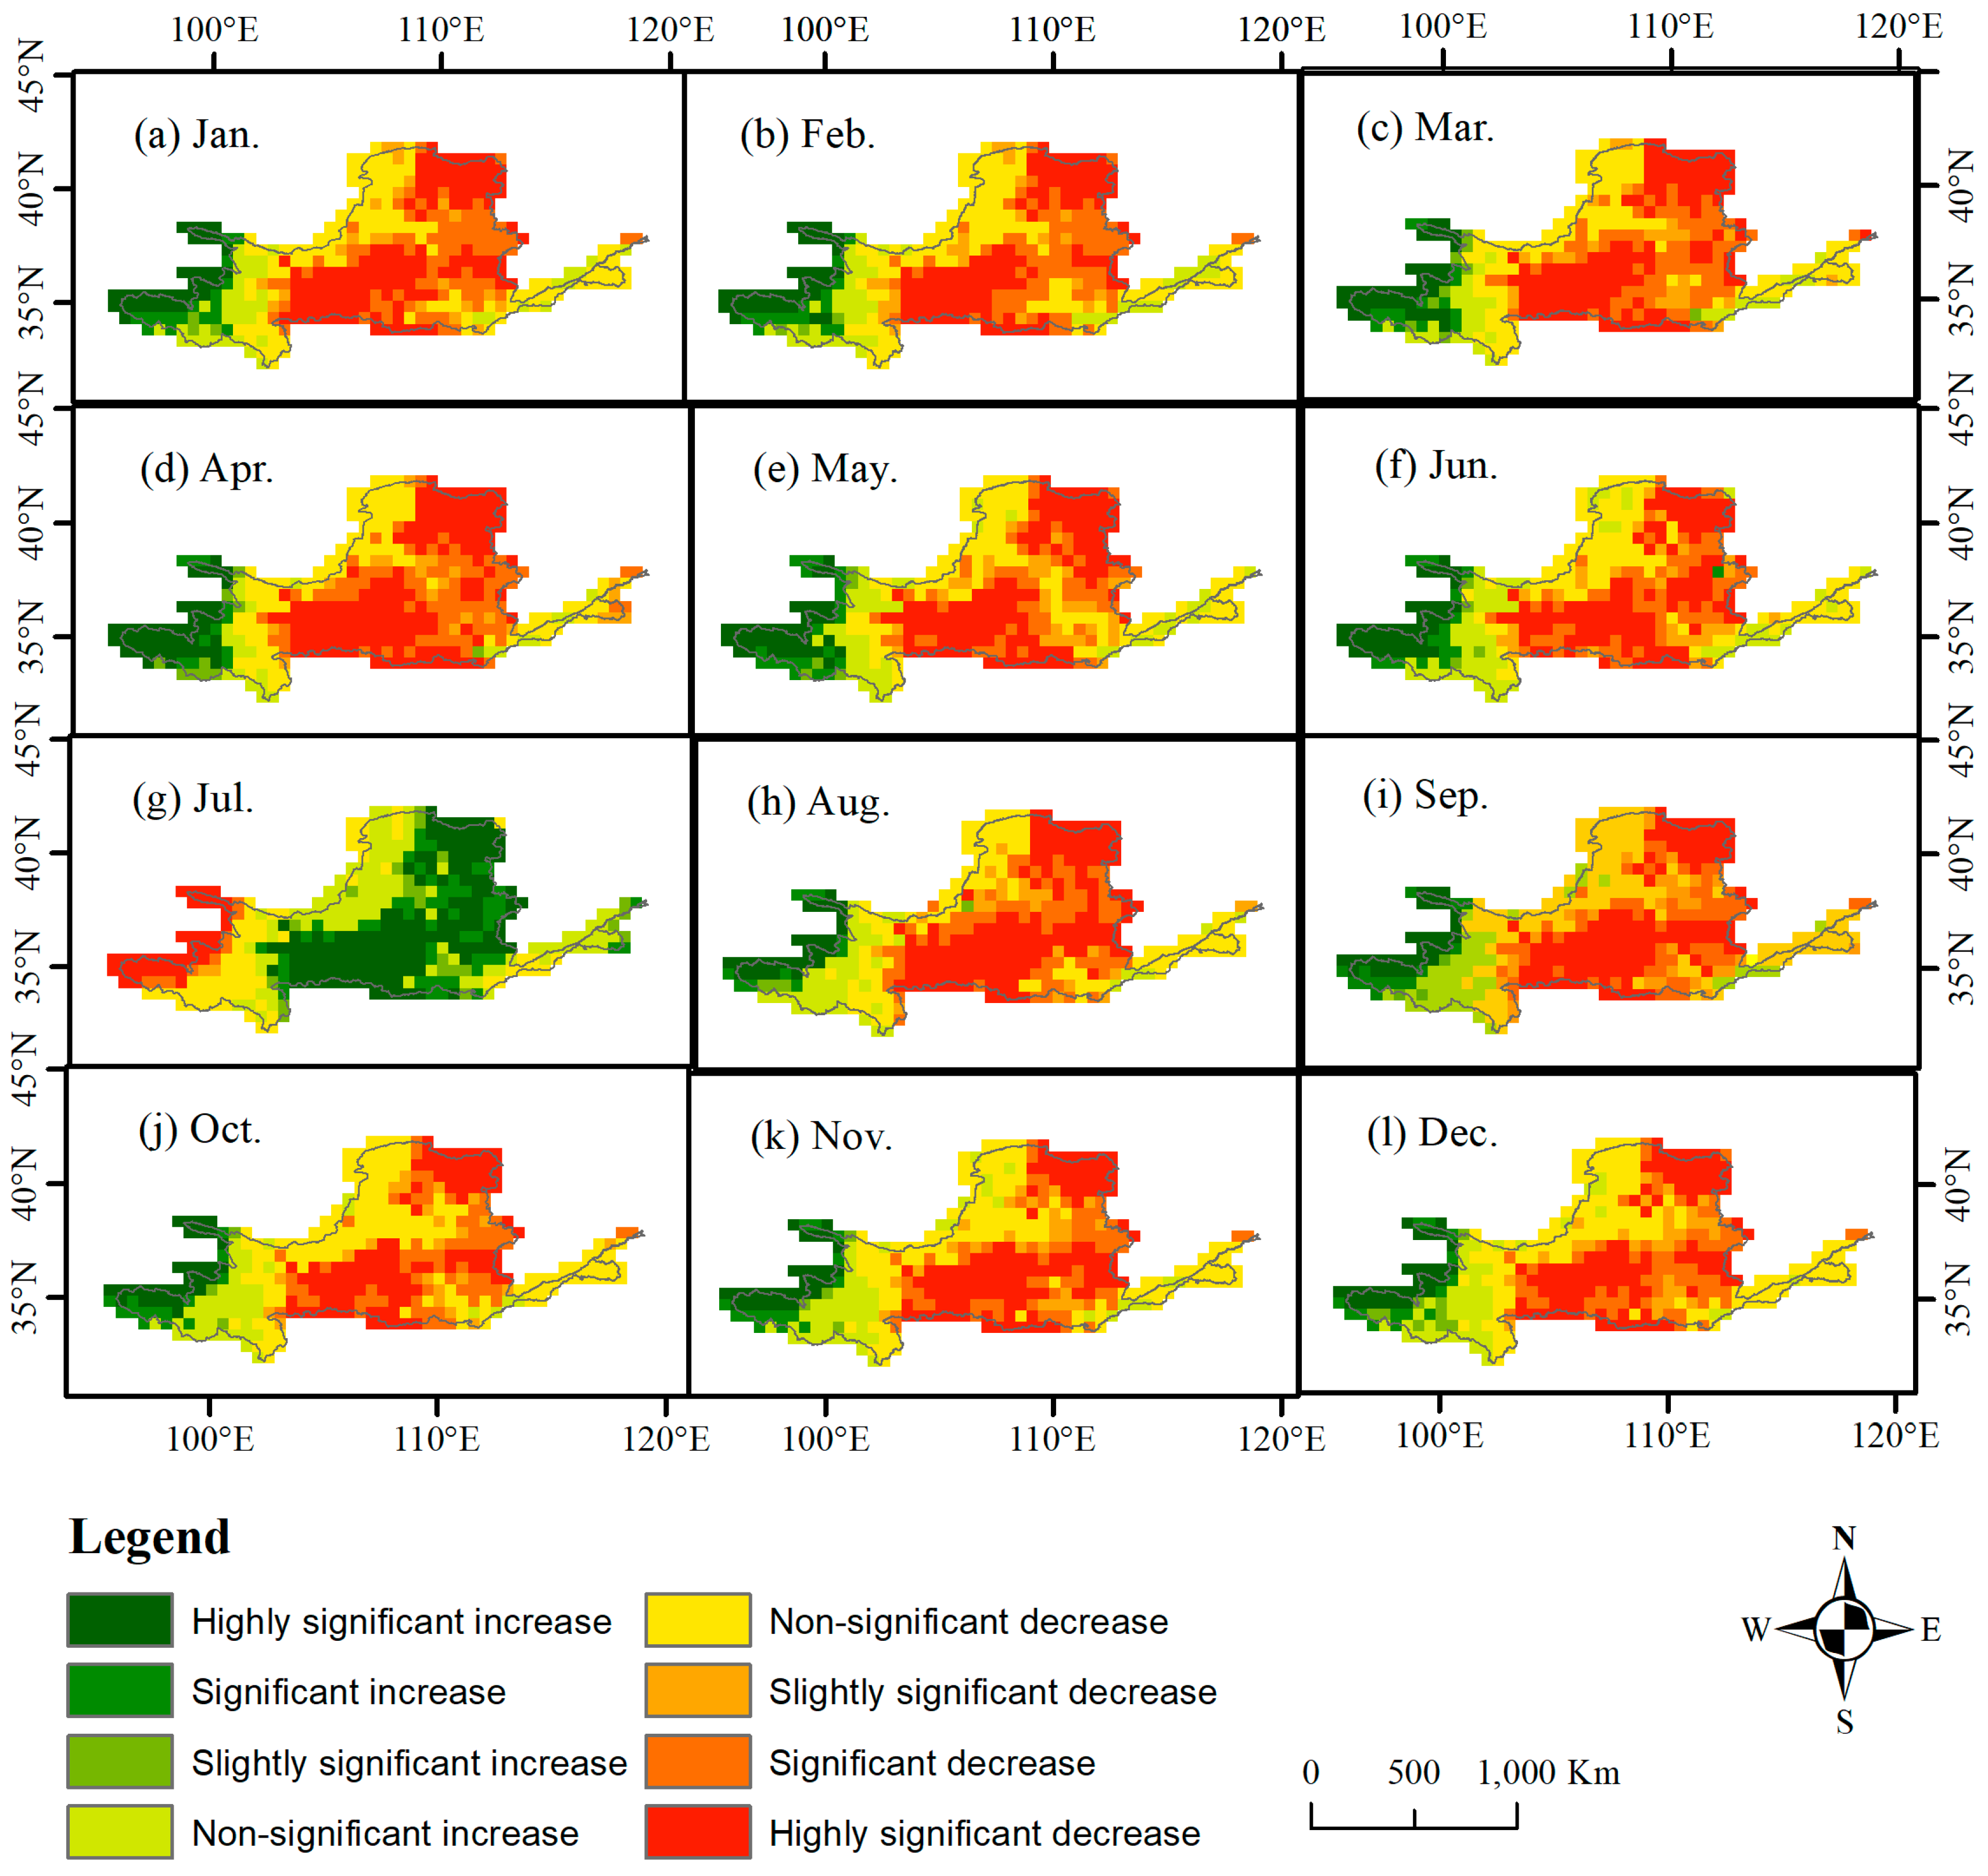
3.1. Drought Assessment Based on the SPEI Index
3.2. scPDSI-Based Drought Analysis
3.3. Comparative Evaluation of Two Drought Indices
4. Discussion
5. Conclusions
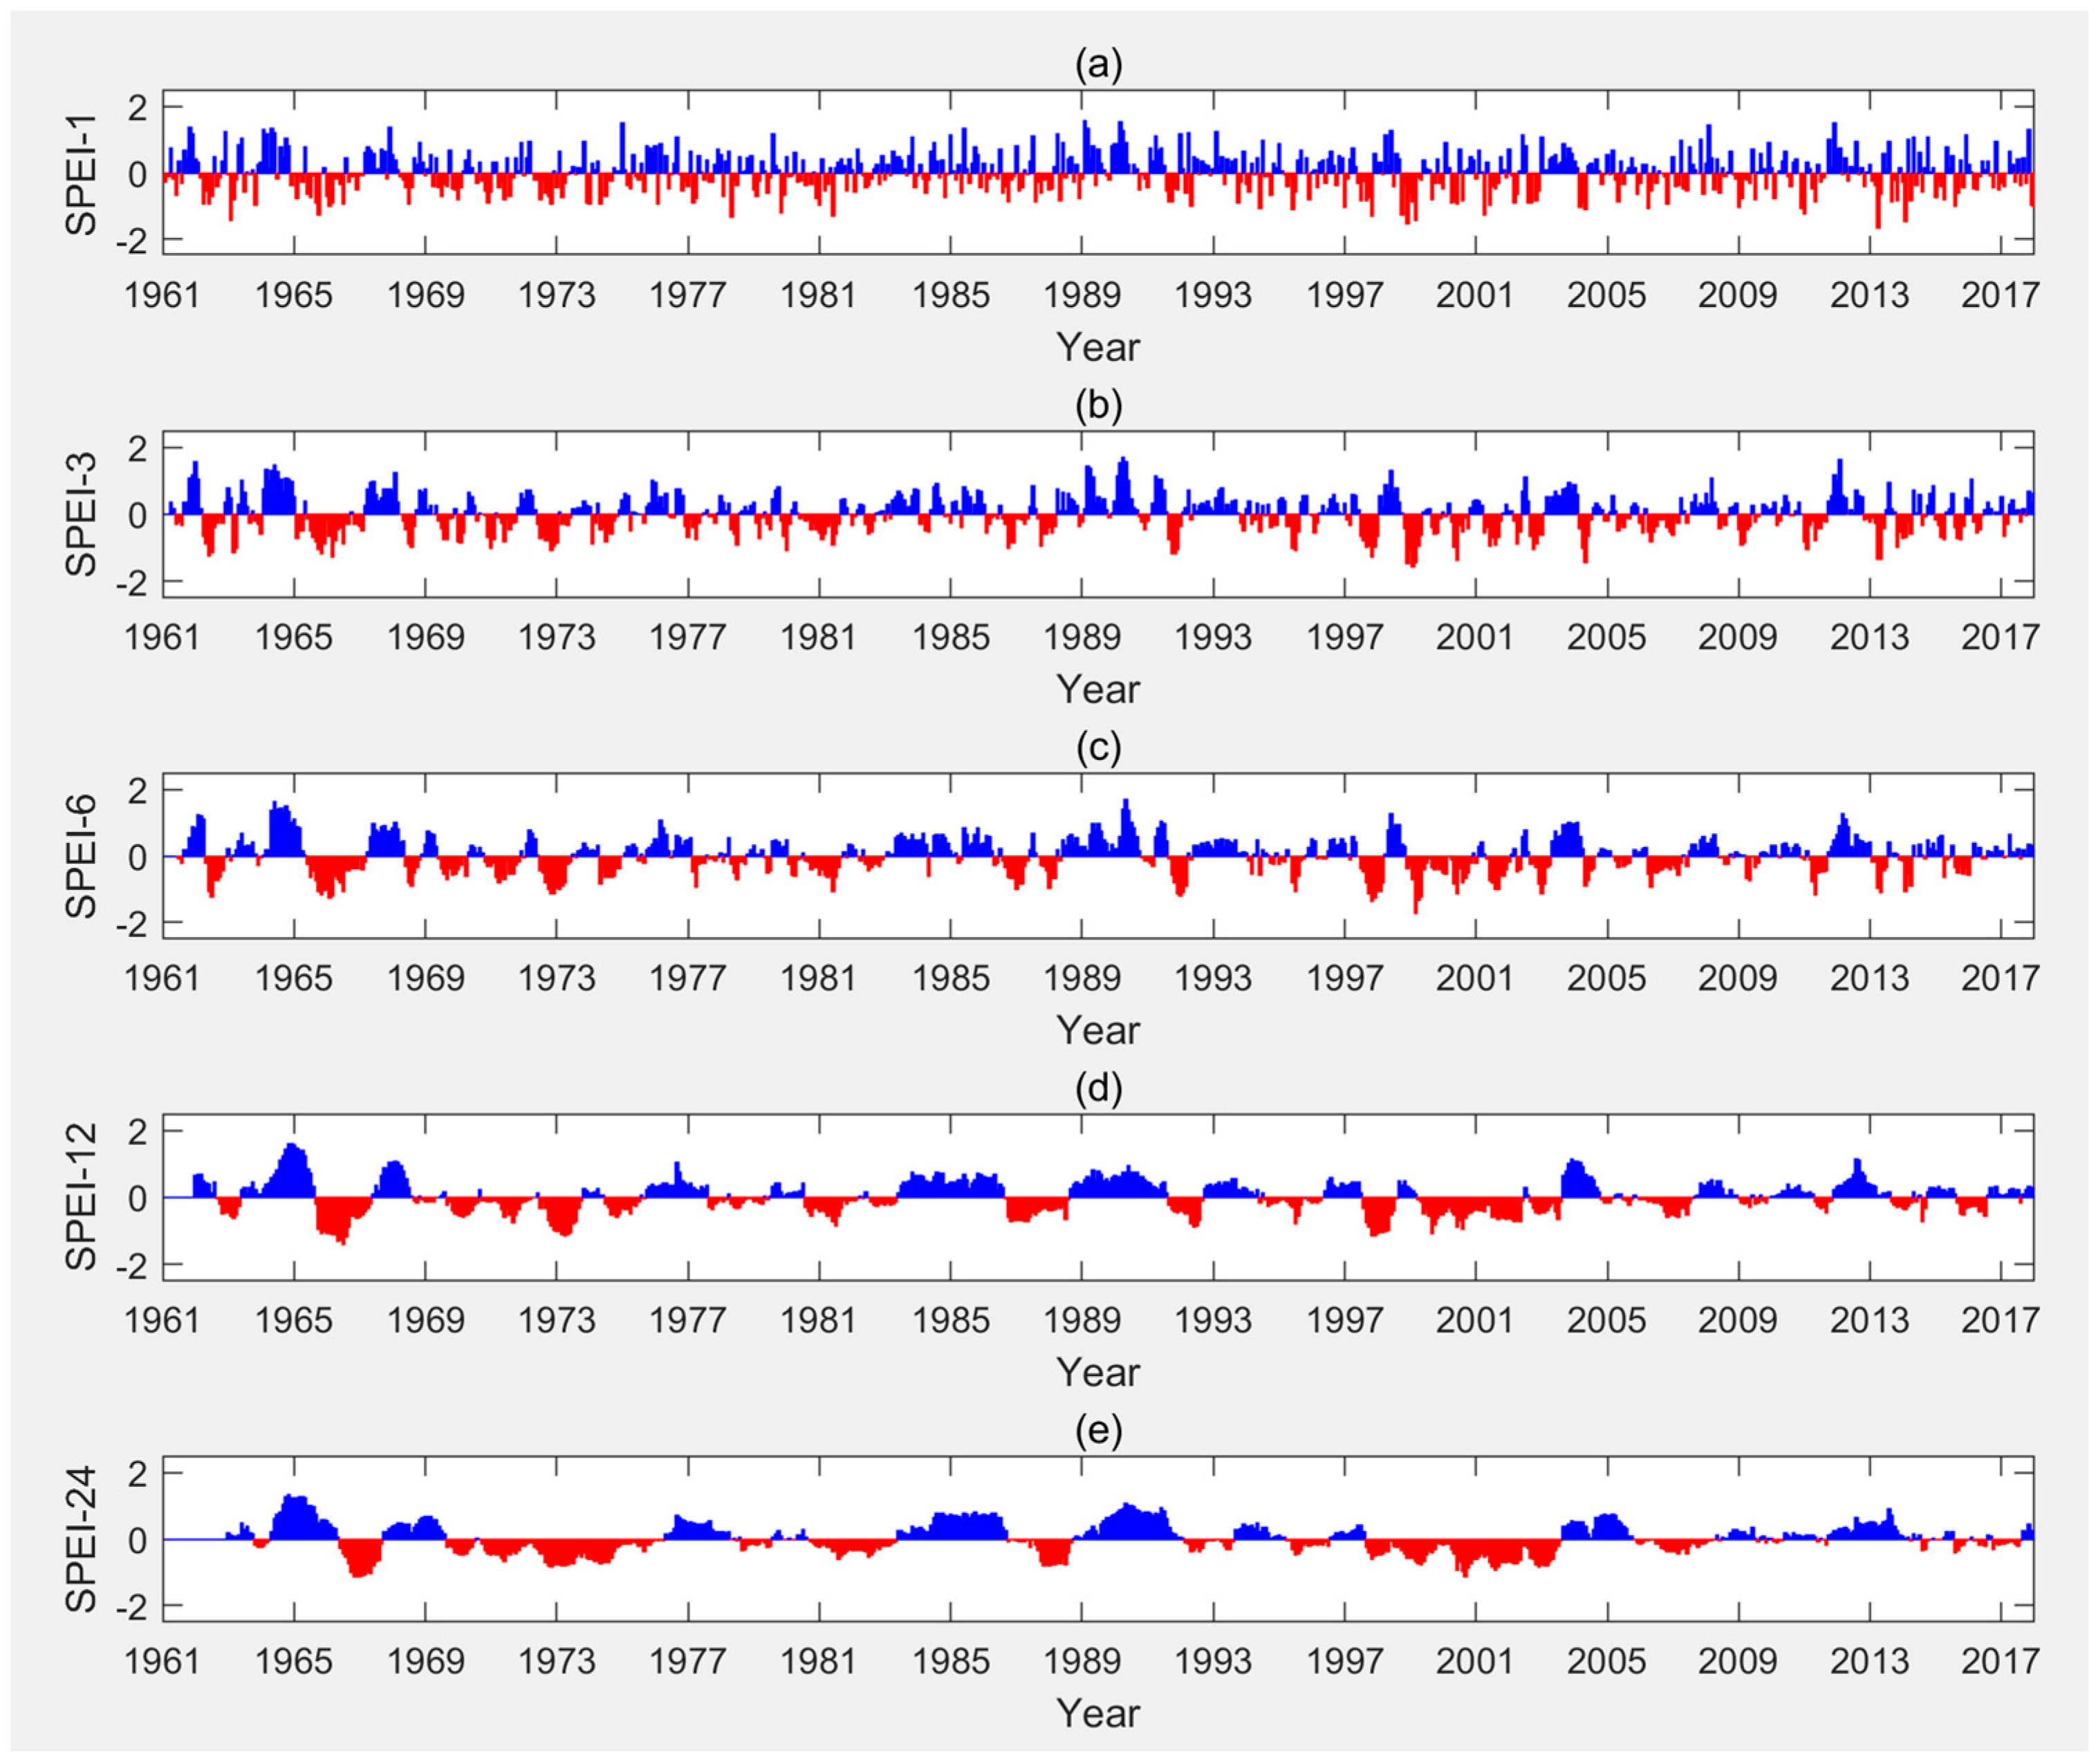
- (1)
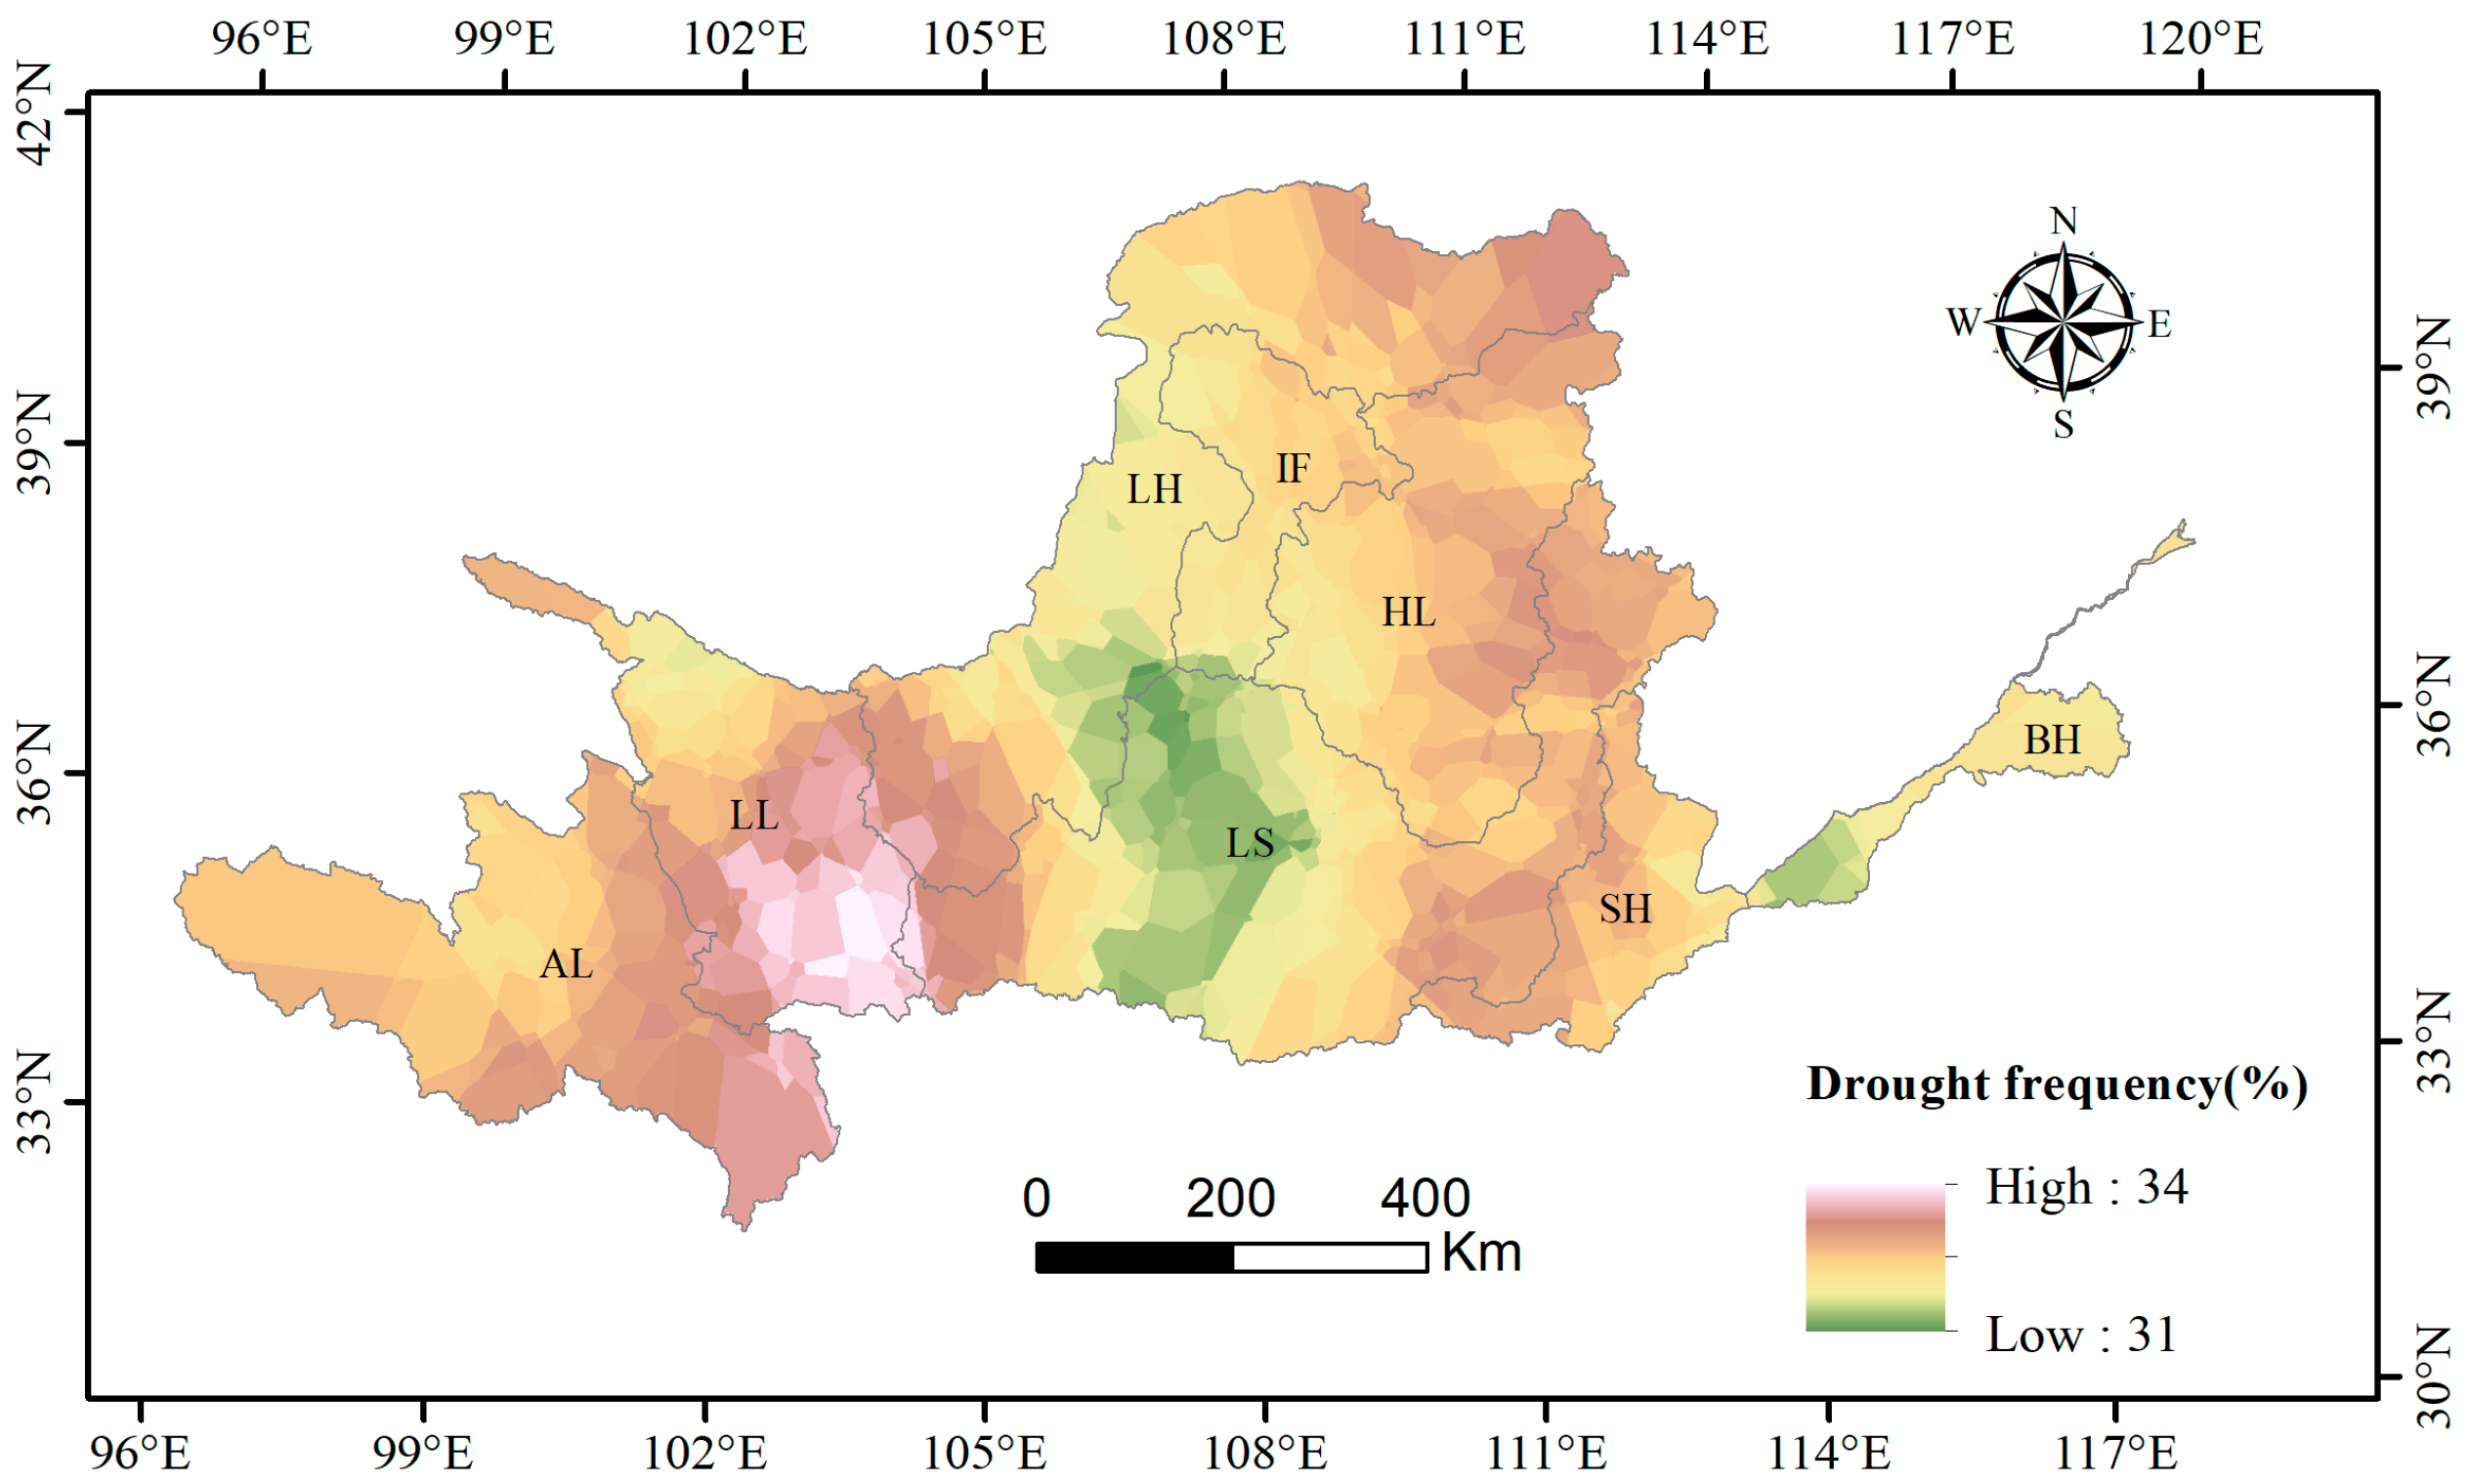
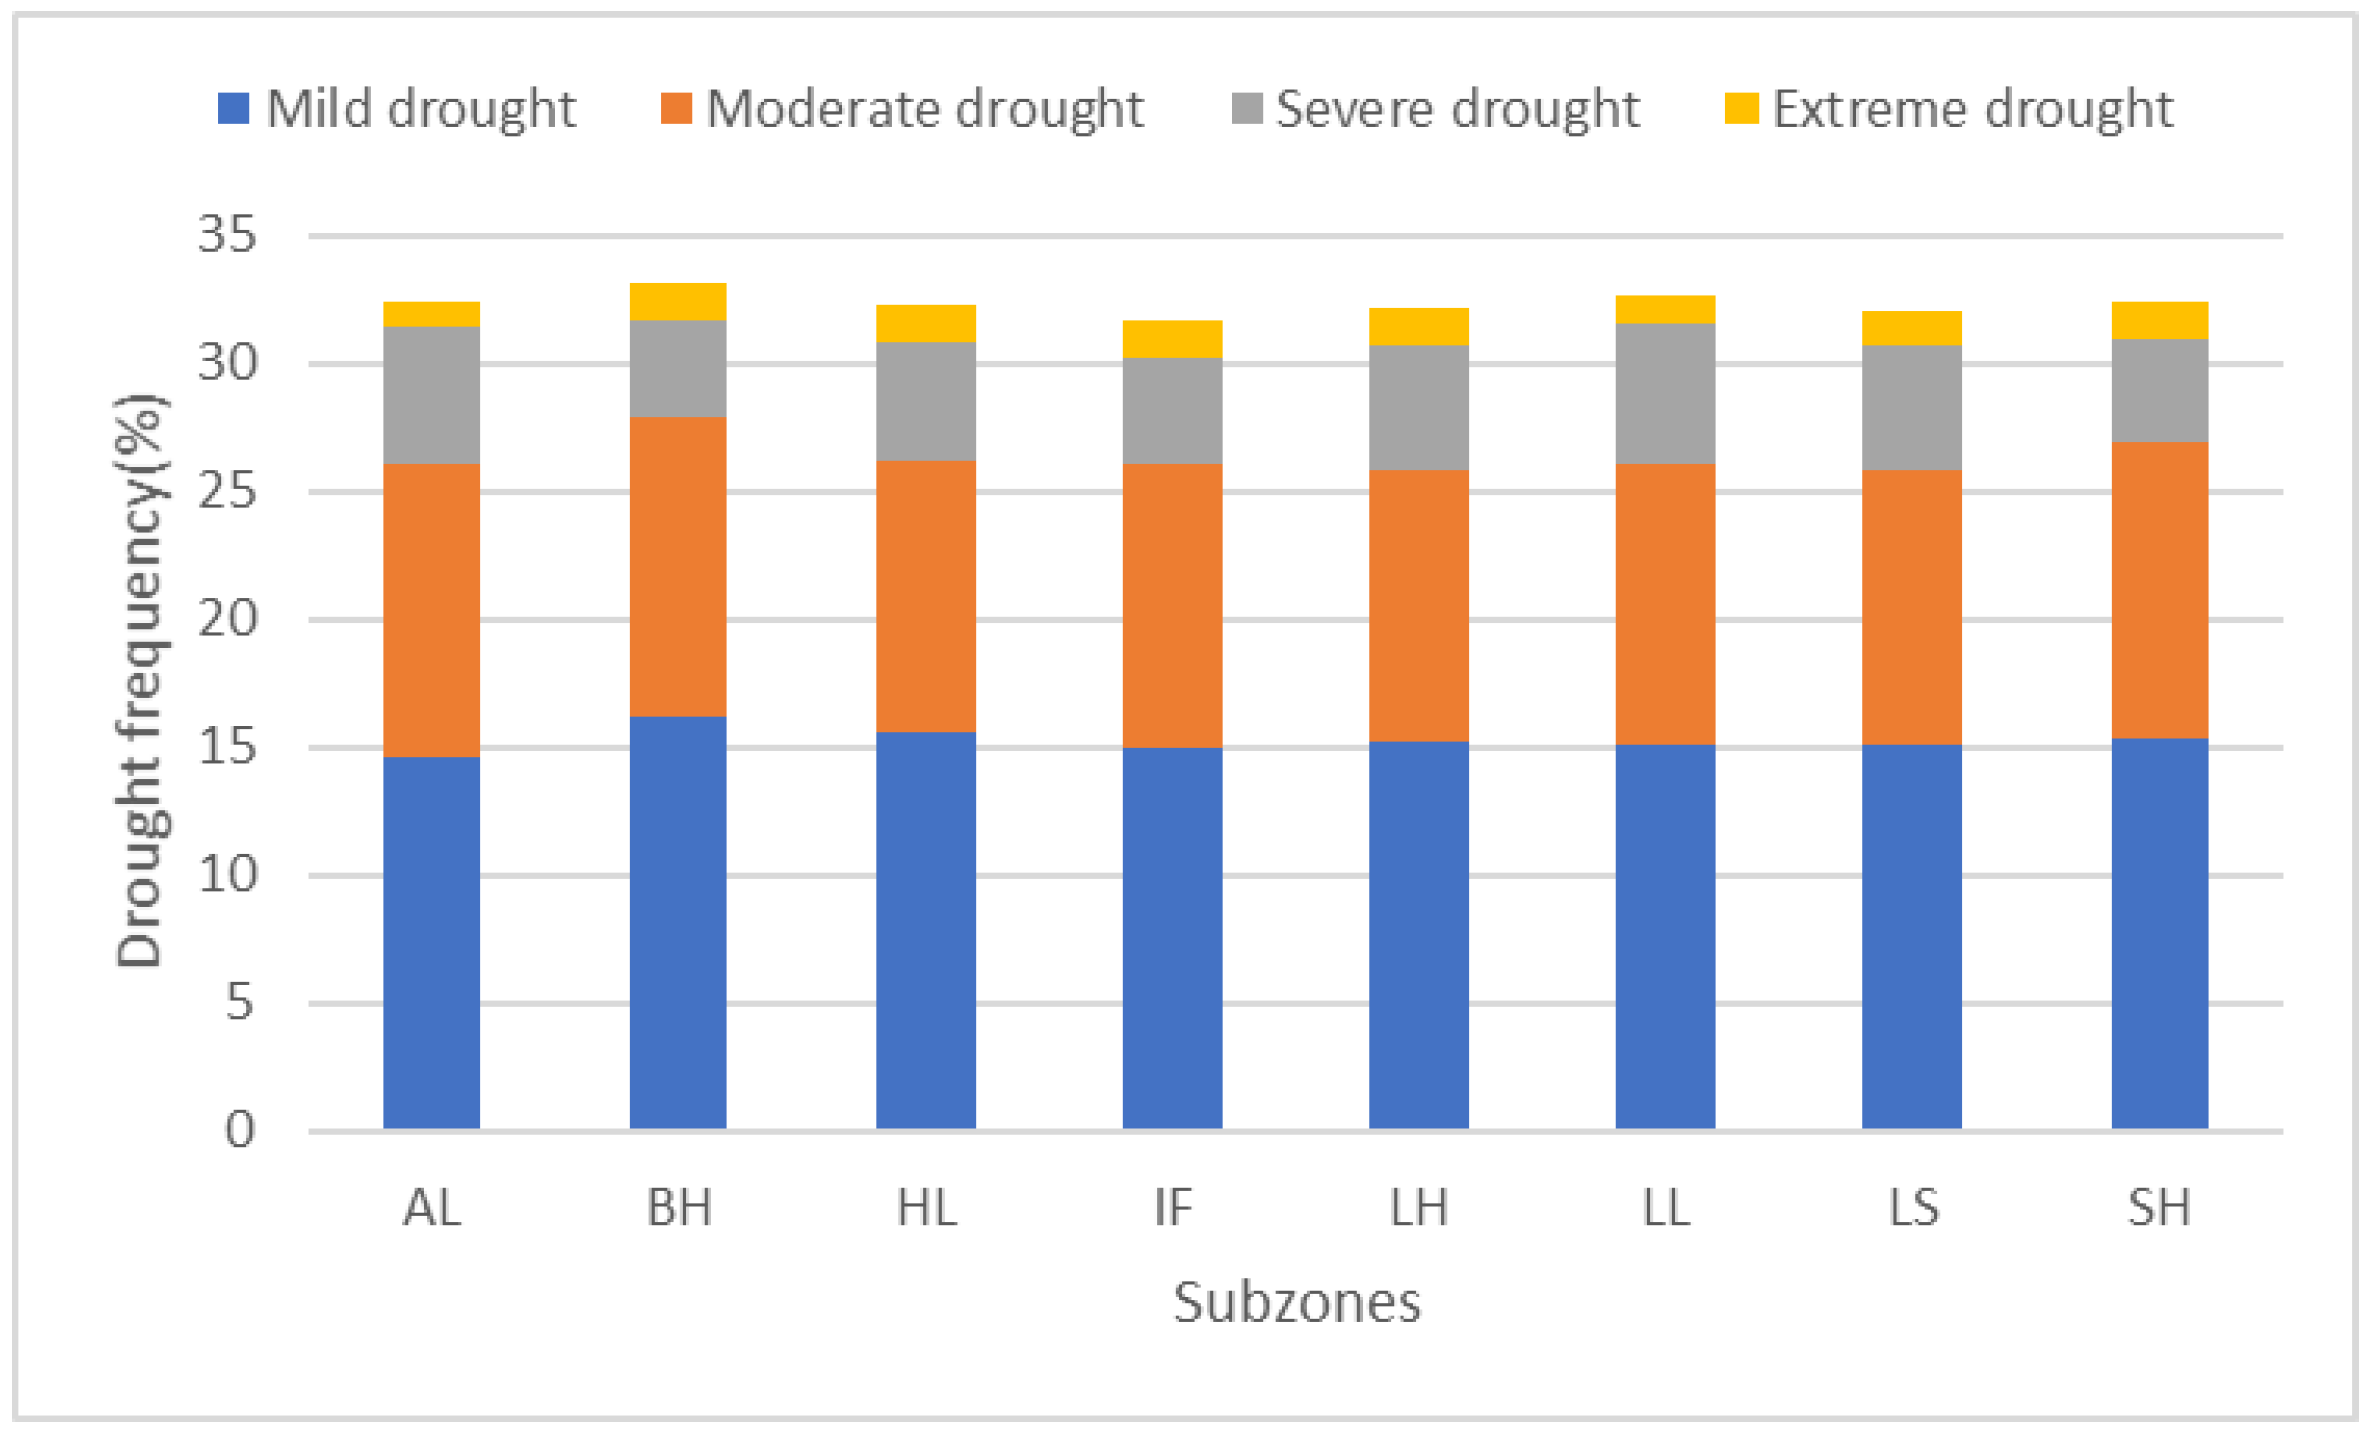
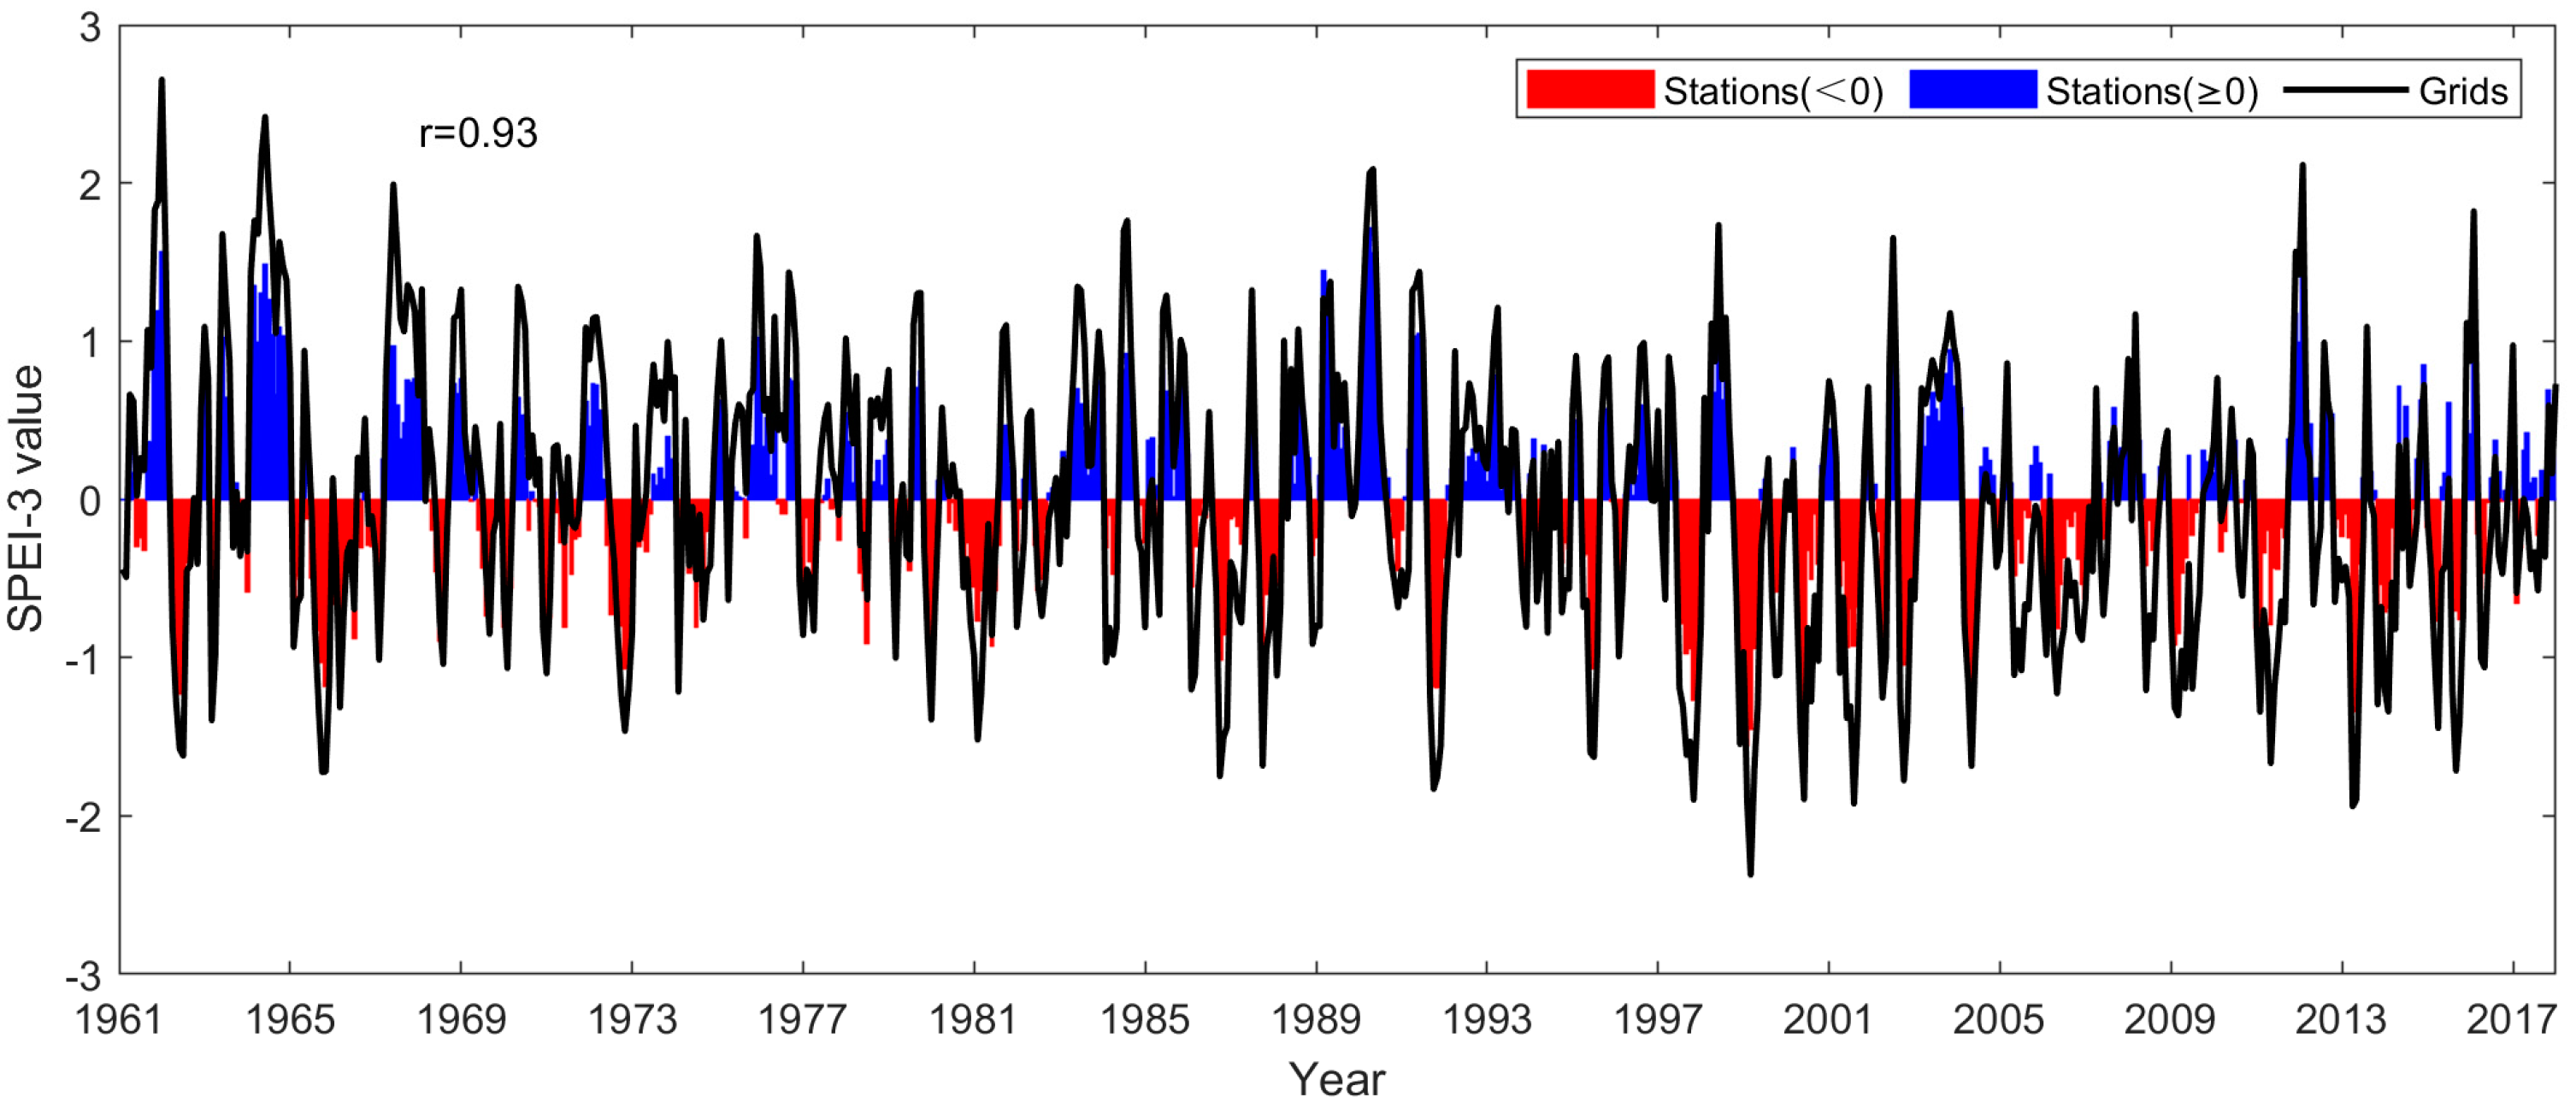
- The SPEI demonstrates distinct fluctuation patterns at varying temporal scales, with shorter scales exhibiting more pronounced amplitude variations. An analysis of drought occurrences through SPEI over these scales highlights several critical drought years in the YRB, specifically 1965, 1966, 1969, 1972, 1986, 1997, 1999, 2001, and 2006. Furthermore, when the SPEI is computed on a three-month time scale, it reveals that the frequency of drought events in the basin oscillates between 31% and 34%, underscoring the variability and intensity of drought conditions within this region.
- (2)
- In our study, the MMK trend test was applied to the scPDSI time series, revealing a concerning upward trend in the severity of drought conditions across the YRB. Furthermore, the regional scPDSI values were derived from the calculation of mean annual scPDSI values for each sub-region, yielding the following: LH: −1.06; HL: −0.87; IF: −0.94; LS: −0.96; LL: −1.35; BH: −0.71; SH: −1.44; AL: −1.06. These figures notably highlight the regions of SH and LL as experiencing markedly more severe drought conditions.
- (3)
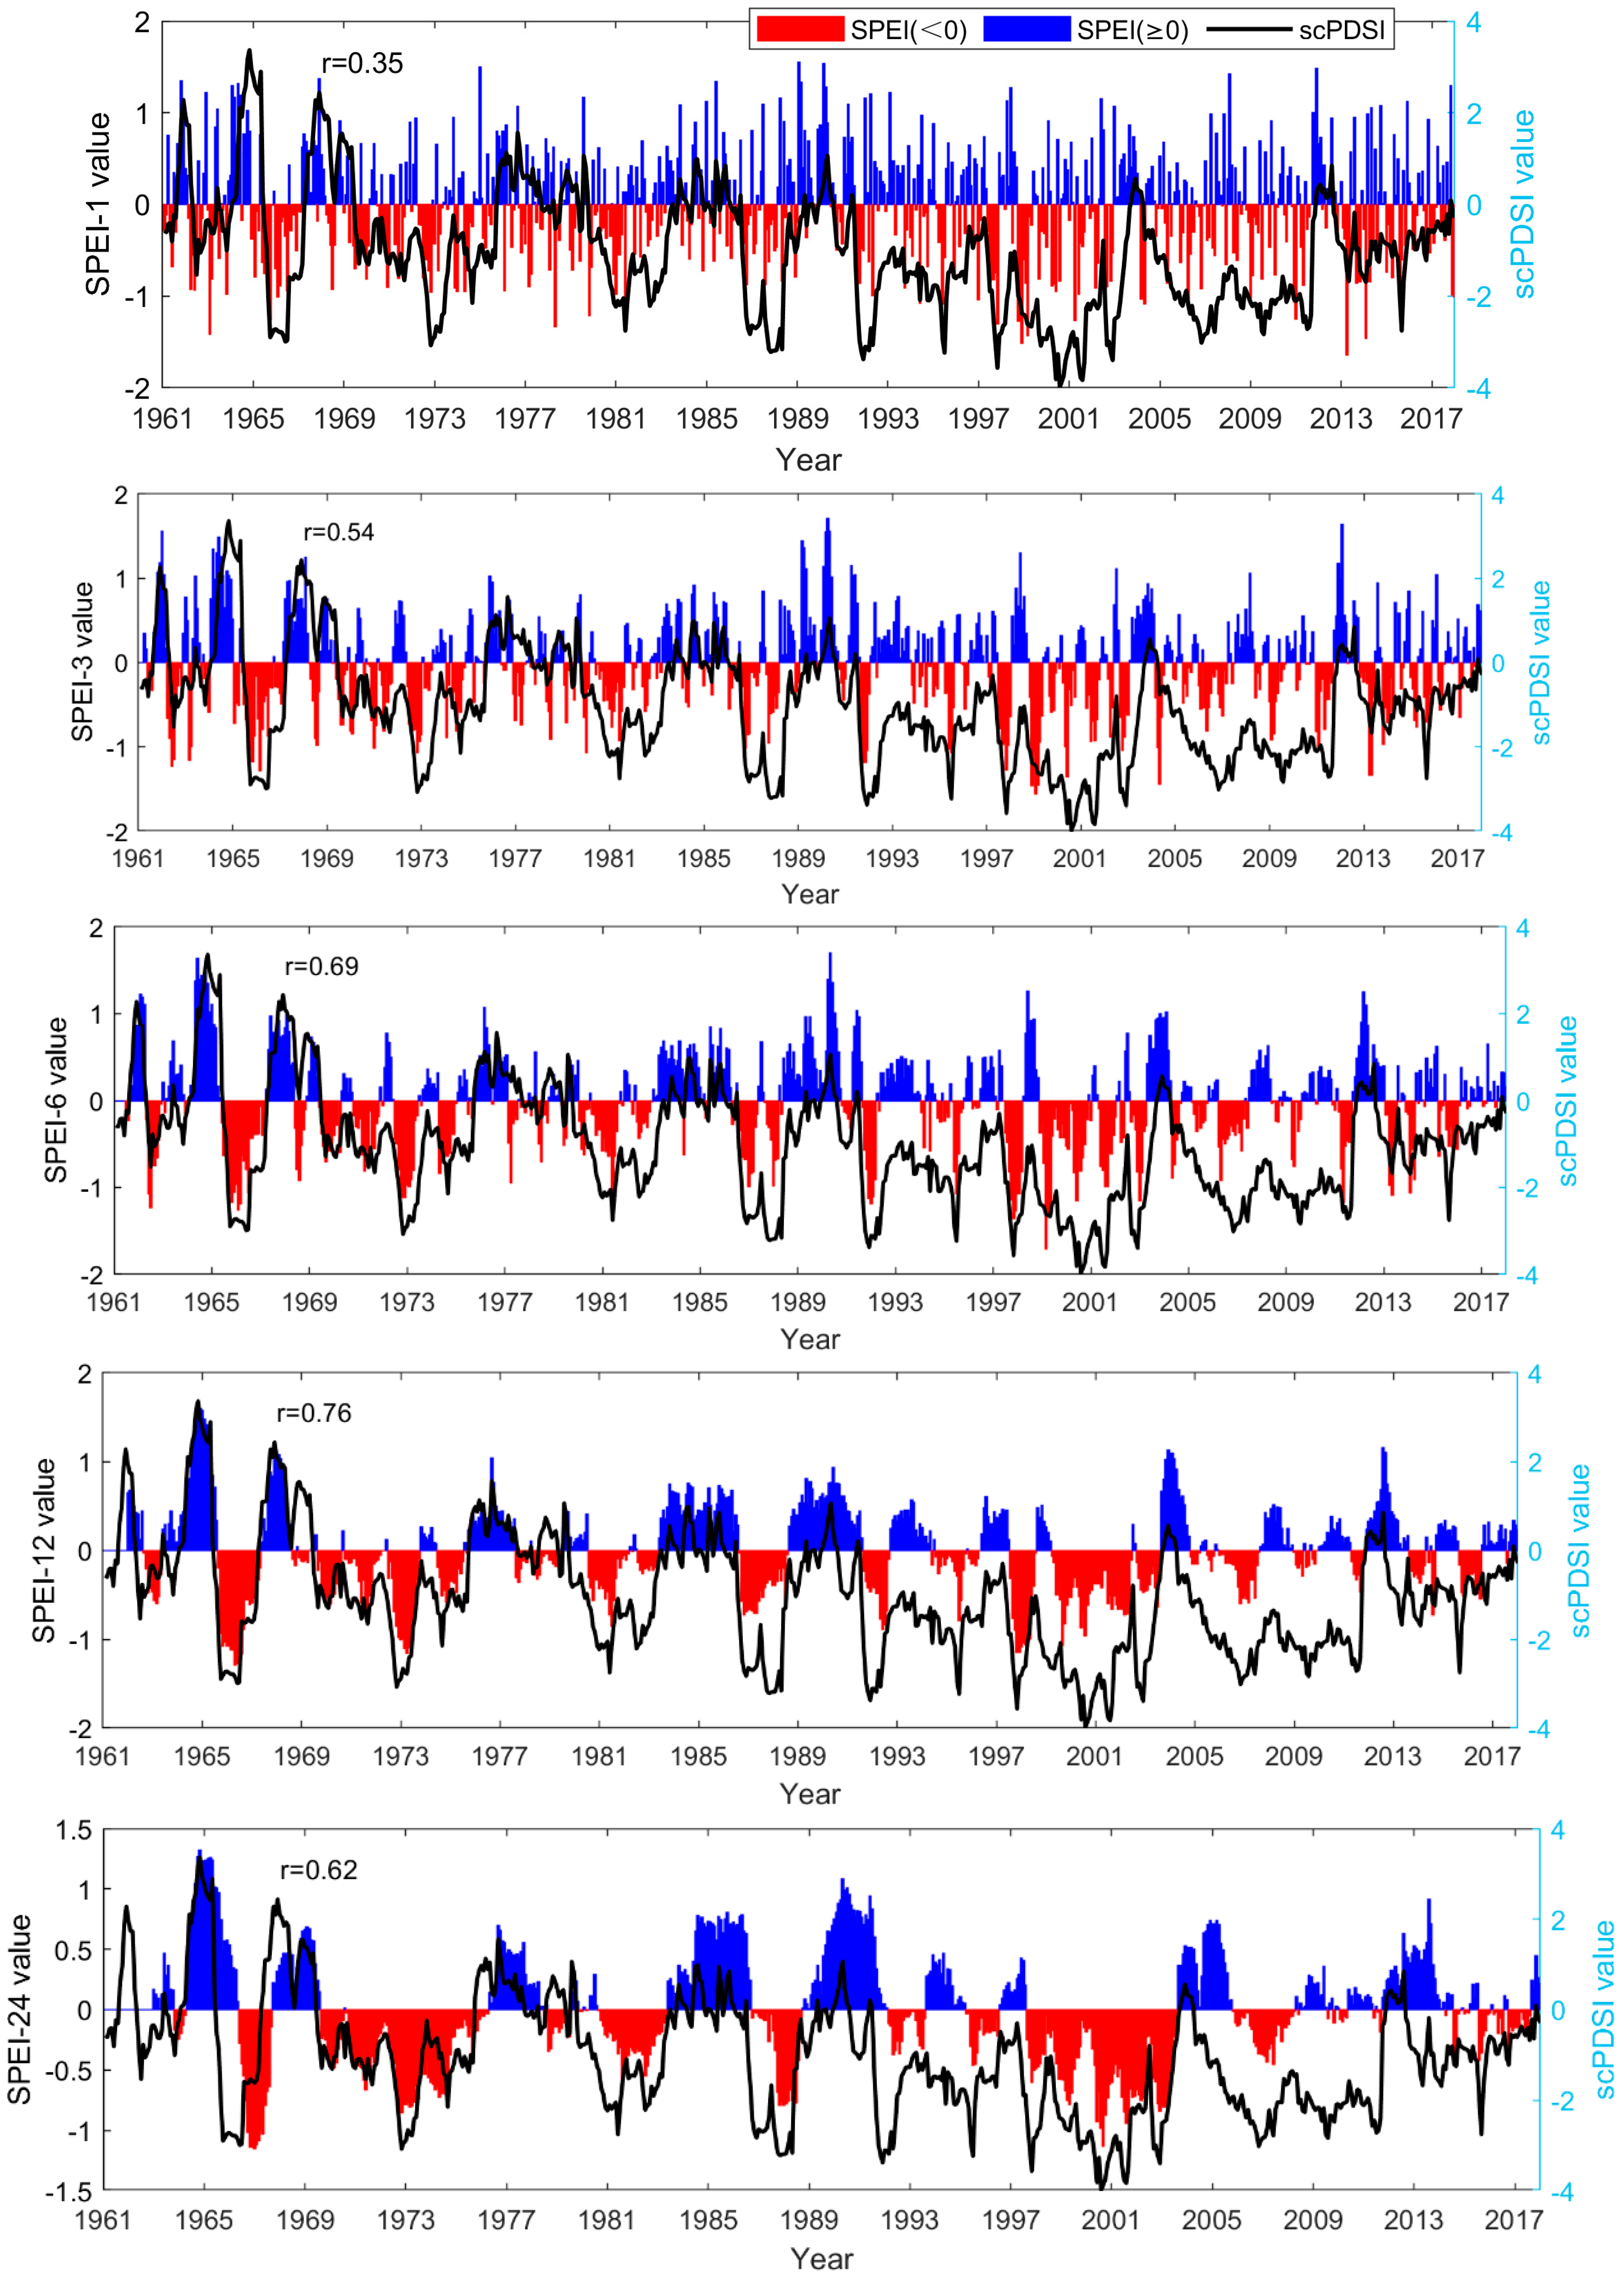
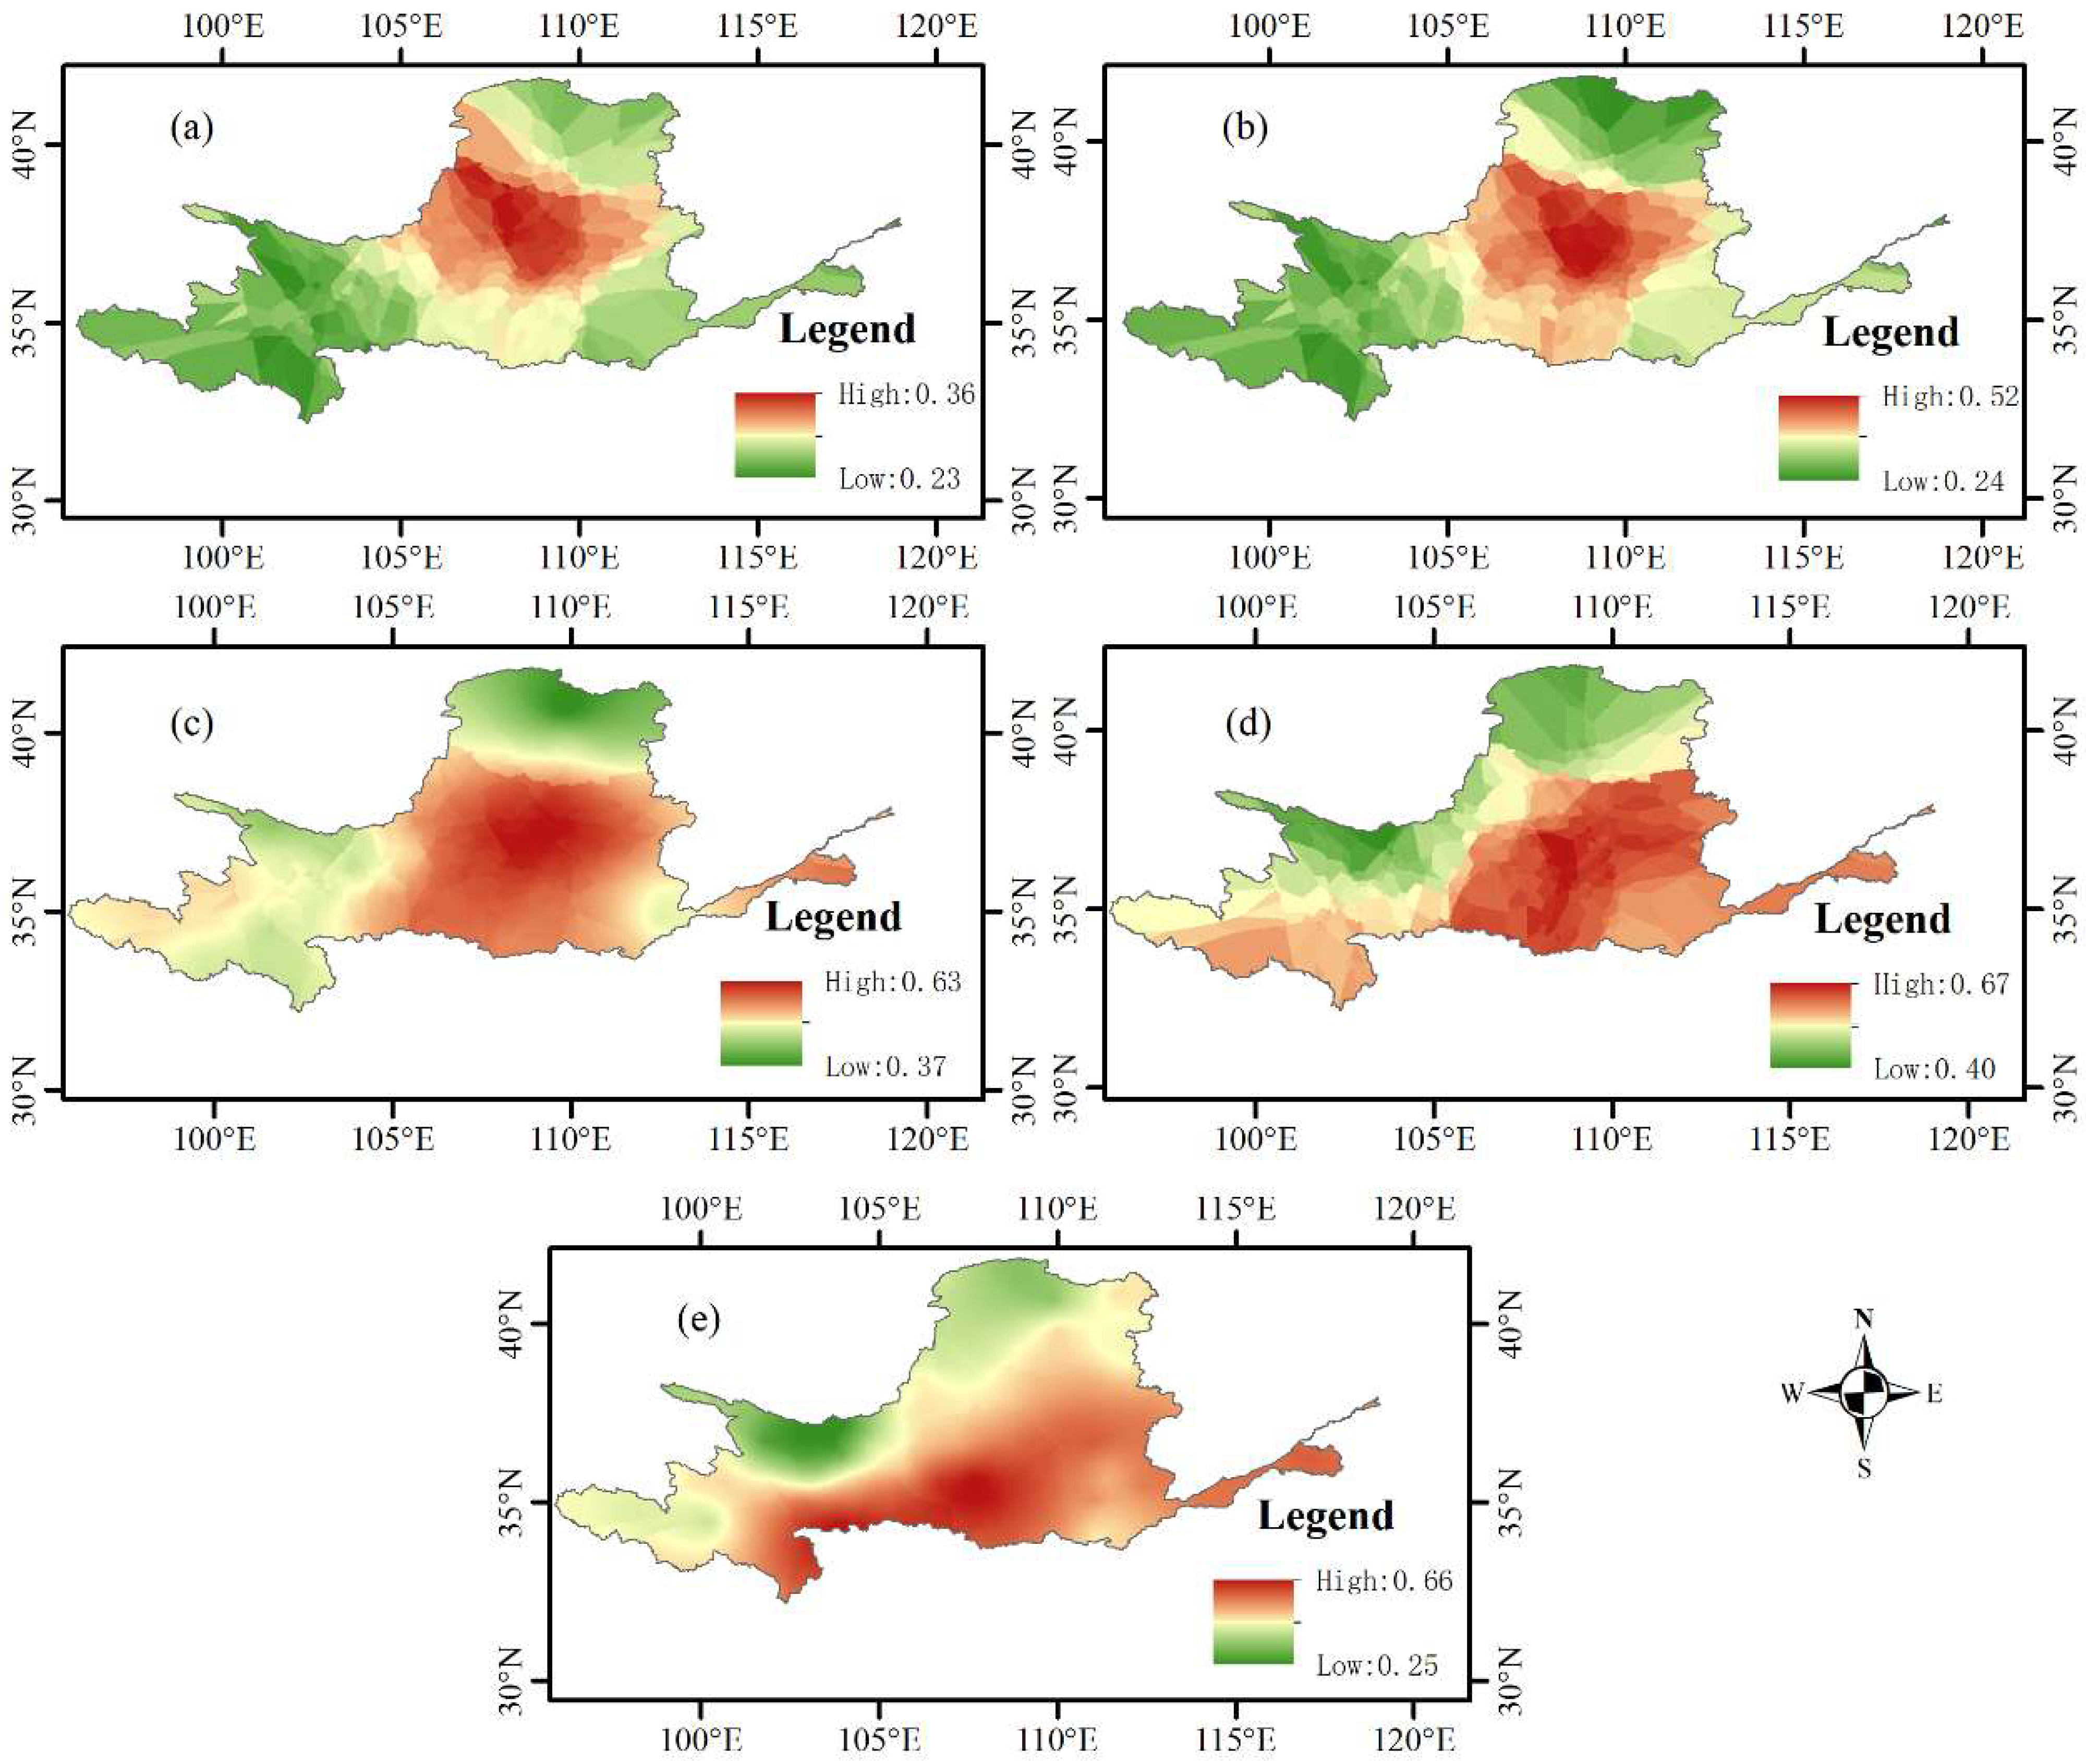
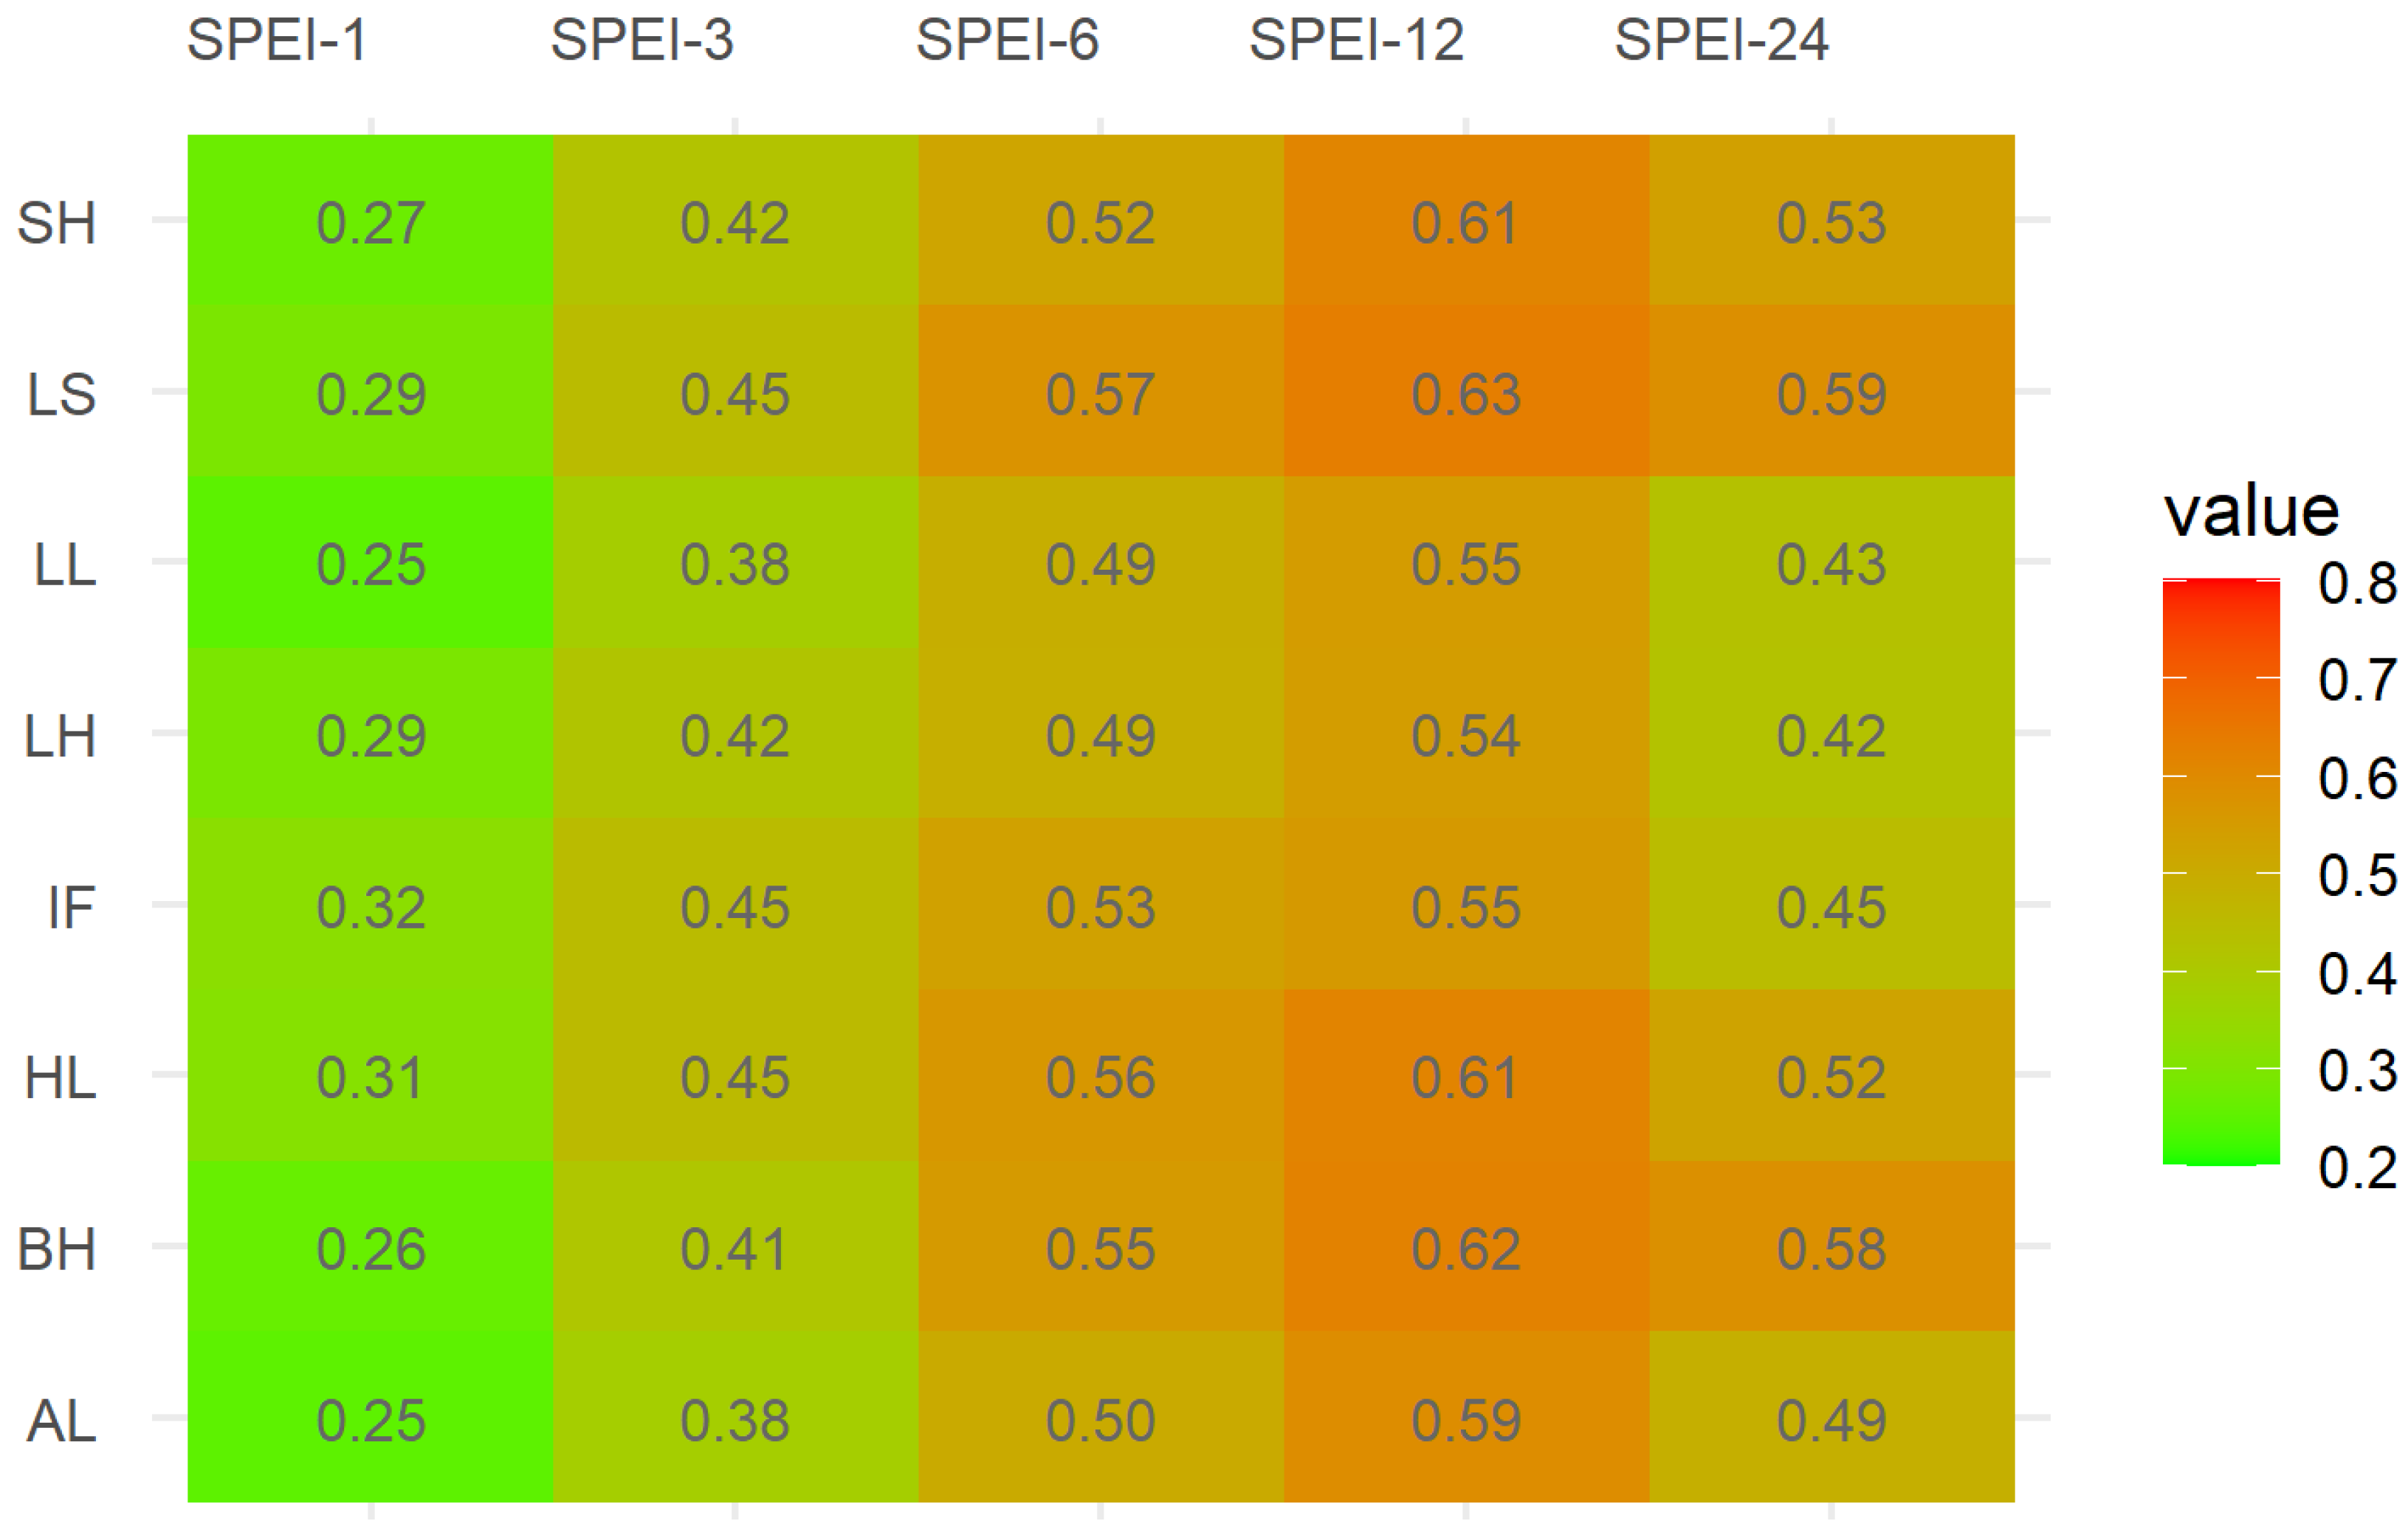
- A comprehensive correlation analysis was carried out between scPDSI and SPEI across multiple temporal scales, including 1 month, 3 months, 6 months, 12 months, and 24 months. This analysis yielded correlation coefficients (r) of 0.35, 0.54, 0.69, 0.76, and 0.62, respectively. These findings underscore a significant insight: the correlation between scPDSI and SPEI reaches its apex on an annual scale, whereas it is relatively minimal on a monthly scale. The correlation analysis of SPEI and scPDSI across different scales in spatial terms indicates that, within various temporal extents, the 12-month time scale exhibits the highest correlation, followed by 6 months and 24 months. This pattern underscores the suitability of scPDSI for monitoring medium- to long-term drought phenomena, a characteristic attributed to its inherent lag autocorrelation properties.
Author Contributions
Funding
Data Availability Statement
Acknowledgments
Conflicts of Interest
References
- Chen, Z.H.; Yang, G.F. Analysis of drought hazards in North China: Distribution and interpretation. Nat. Hazards 2013, 65, 279–294. [Google Scholar] [CrossRef]
- Zhao, Z.Y.; Hao, X.M.; Fan, X.; Zhang, J.J.; Zhang, S.; Li, X.W. Actual Evapotranspiration Dominates Drought in Central Asia. Remote Sens. 2023, 15, 4557. [Google Scholar] [CrossRef]
- Naidoo, S. Commentary on the contribution of Working Group III to the Sixth Assessment Report of the Intergovernmental Panel on Climate Change. S. Afr. J. Sci. 2022, 118, 1–4. [Google Scholar] [CrossRef] [PubMed]
- Zhang, J.W.; Wang, J.G.; Chen, S.B.; Wang, M.C.; Tang, S.Q.; Zhao, W.T. Integrated Risk Assessment of Agricultural Drought Disasters in the Major Grain-Producing Areas of Jilin Province, China. Land 2023, 12, 160. [Google Scholar] [CrossRef]
- Mukherjee, S.; Mishra, A.; Trenberth, K.E. Climate Change and Drought: A Perspective on Drought Indices. Curr. Clim. Chang. Rep. 2018, 4, 145–163. [Google Scholar] [CrossRef]
- Esfahanian, E.; Nejadhashemi, A.P.; Abouali, M.; Adhikari, U.; Zhang, Z.; Daneshvar, F.; Herman, M.R. Development and evaluation of a comprehensive drought index. J. Environ. Manag. 2017, 185, 31–43. [Google Scholar] [CrossRef]
- Sheffield, J.; Wood, E.F.; Roderick, M.L. Little change in global drought over the past 60 years. Nature 2012, 491, 435–438. [Google Scholar] [CrossRef]
- Spinoni, J.; Barbosa, P.; Bucchignani, E.; Cassano, J.; Cavazos, T.; Christensen, J.H.; Christensen, O.B.; Coppola, E.; Evans, J.; Geyer, B.; et al. Future Global Meteorological Drought Hot Spots: A Study Based on CORDEX Data. J. Clim. 2020, 33, 3635–3661. [Google Scholar] [CrossRef]
- Haile, G.G.; Tang, Q.; Li, W.; Liu, X.; Zhang, X. Drought: Progress in broadening its understanding. Wiley Interdiscip. Rev. Water 2020, 7, e1407. [Google Scholar] [CrossRef]
- Zhao, M.; Huang, S.; Huang, Q.; Wang, H.; Leng, G.; Xie, Y. Assessing socio-economic drought evolution characteristics and their possible meteorological driving force. Geomat. Nat. Hazards Risk 2019, 10, 1084–1101. [Google Scholar] [CrossRef]
- Bachmair, S.; Stahl, K.; Collins, K.; Hannaford, J.; Acreman, M.; Svoboda, M.; Knutson, C.; Smith, K.H.; Wall, N.; Fuchs, B. Drought indicators revisited: The need for a wider consideration of environment and society. Wiley Interdiscip. Rev. Water 2016, 3, 516–536. [Google Scholar] [CrossRef]
- Chen, S.; Muhammad, W.; Lee, J.-H.; Kim, T.-W. Assessment of Probabilistic Multi-Index Drought Using a Dynamic Naive Bayesian Classifier. Water Resour. Manag. 2018, 32, 4359–4374. [Google Scholar] [CrossRef]
- Sian, K.T.C.L.K.; Zhi, X.; Ayugi, B.O.; Onyutha, C.; Shilenje, Z.W.; Ongoma, V. Meteorological Drought Variability over Africa from Multisource Datasets. Atmosphere 2023, 14, 1052. [Google Scholar] [CrossRef]
- Xu, Z.; Wu, Z.; Shao, Q.; He, H.; Guo, X. From meteorological to agricultural drought: Propagation time and probabilistic linkages. J. Hydrol.-Reg. Stud. 2023, 46, 101329. [Google Scholar] [CrossRef]
- Ayantobo, O.O.; Li, Y.; Song, S.; Yao, N. Spatial comparability of drought characteristics and related return periods in mainland China over 1961–2013. J. Hydrol. 2017, 550, 549–567. [Google Scholar] [CrossRef]
- Khatiwada, K.R.; Pandey, V.P. Characterization of hydro-meteorological drought in Nepal Himalaya: A case of Karnali River Basin. Weather Clim. Extrem. 2019, 26, 100239. [Google Scholar] [CrossRef]
- Wable, P.S.; Jha, M.K.; Shekhar, A. Comparison of Drought Indices in a Semi-Arid River Basin of India. Water Resour. Manag. 2019, 33, 75–102. [Google Scholar] [CrossRef]
- Zhang, N.; Li, Z.; Quiring, S.M. Developing Impacts-Based Drought Thresholds for Ohio. J. Hydrometeorol. 2023, 24, 1225–1240. [Google Scholar] [CrossRef]
- Vicente-Serrano, S.M.; Beguería, S.; López-Moreno, J.I. A Multiscalar Drought Index Sensitive to Global Warming: The Standardized Precipitation Evapotranspiration Index. J. Clim. 2010, 23, 1696–1718. [Google Scholar] [CrossRef]
- Chen, J.; Zhang, B.; Zhou, J.; Guo, F. Temporal and Spatial Changes of Drought Characteristics in Temperate Steppes in China from 1960 to 2020. Sustainability 2023, 15, 12909. [Google Scholar] [CrossRef]
- Sun, H.; Sun, X.; Chen, J.; Deng, X.; Yang, Y.; Qin, H.; Chen, F.; Zhang, W. Different types of meteorological drought and their impact on agriculture in Central China. J. Hydrol. 2023, 627, 130423. [Google Scholar] [CrossRef]
- Xu, Y.; Zhu, X.; Cheng, X.; Gun, Z.; Lin, J.; Zhao, J.; Yao, L.; Zhou, C. Drought assessment of China in 2002–2017 based on a comprehensive drought index. Agric. For. Meteorol. 2022, 319, 108922. [Google Scholar] [CrossRef]
- Yu, H.; Zhang, Q.; Xu, C.-Y.; Du, J.; Sun, P.; Hu, P. Modified Palmer Drought Severity Index: Model improvement and application. Environ. Int. 2019, 130, 104951. [Google Scholar] [CrossRef]
- Ding, Y.; Xu, J.; Wang, X.; Peng, X.; Cai, H. Spatial and temporal effects of drought on Chinese vegetation under different coverage levels. Sci. Total Environ. 2020, 716, 137166. [Google Scholar] [CrossRef]
- Ryu, J.H.; Sohrabi, M.; Acharya, A. Toward Mapping Gridded Drought Indices to Evaluate Local Drought in a Rapidly Changing Global Environment. Water Resour. Manag. 2014, 28, 3859–3869. [Google Scholar] [CrossRef]
- Wu, B.; Ma, Z.; Yan, N. Agricultural drought mitigating indices derived from the changes in drought characteristics. Remote Sens. Environ. 2020, 244, 111813. [Google Scholar] [CrossRef]
- Bazrkar, M.H.; Zhang, J.; Chu, X. Hydroclimatic aggregate drought index (HADI): A new approach for identification and categorization of drought in cold climate regions. Stoch. Environ. Res. Risk Assess. 2020, 34, 1847–1870. [Google Scholar] [CrossRef]
- Yin, G.; Zhang, H. A new integrated index for drought stress monitoring based on decomposed vegetation response factors. J. Hydrol. 2023, 618, 129252. [Google Scholar] [CrossRef]
- Palmer, W.C. Meteorological Drought; US Department of Commerce, Weather Bureau: Silver Spring, MD, USA, 1965; Volume 30.
- Mi, Q.; Ren, C.; Wang, Y.; Gao, X.; Liu, L.; Li, Y. A robust ensemble drought index: Construction and assessment. Nat. Hazards 2023, 116, 1139–1159. [Google Scholar] [CrossRef]
- Svoboda, M.D.; Fuchs, B.A.; Poulsen, C.C.; Nothwehr, J.R. The drought risk atlas: Enhancing decision support for drought risk management in the United States. J. Hydrol. 2015, 526, 274–286. [Google Scholar] [CrossRef]
- Wang, H.; Vicente-serrano, S.M.; Tao, F.; Zhang, X.; Wang, P.; Zhang, C.; Chen, Y.; Zhu, D.; El Kenawy, A. Monitoring winter wheat drought threat in Northern China using multiple climate-based drought indices and soil moisture during 2000–2013. Agric. For. Meteorol. 2016, 228, 1–12. [Google Scholar] [CrossRef]
- Zhang, R.; Qu, Y.; Zhang, X.; Wu, X.; Zhou, X.; Ren, B.; Zeng, J.; Wang, Q. Spatiotemporal variability in annual drought severity, duration, and frequency from 1901 to 2020. Clim. Res. 2022, 87, 81–97. [Google Scholar] [CrossRef]
- Gobena, A.K.; Gan, T.Y. Assessment of Trends and Possible Climate Change Impacts on Summer Moisture Availability in Western Canada based on Metrics of the Palmer Drought Severity Index. J. Clim. 2013, 26, 4583–4595. [Google Scholar] [CrossRef]
- van der Schrier, G.; Barichivich, J.; Briffa, K.R.; Jones, P.D. A scPDSI-based global data set of dry and wet spells for 1901–2009. J. Geophys. Res.-Atmos. 2013, 118, 4025–4048. [Google Scholar] [CrossRef]
- Wells, N.; Goddard, S.; Hayes, M.J. A self-calibrating Palmer Drought Severity Index. J. Clim. 2004, 17, 2335–2351. [Google Scholar] [CrossRef]
- Zeng, J.; Zhang, R.; Qu, Y.; Bento, V.A.; Zhou, T.; Lin, Y.; Wu, X.; Qi, J.; Shui, W.; Wang, Q. Improving the drought monitoring capability of VHI at the global scale via ensemble indices for various vegetation types from 2001 to 2018. Weather Clim. Extrem. 2022, 35, 100412. [Google Scholar] [CrossRef]
- Dong, X.; Zhou, Y.; Liang, J.; Zou, D.; Wu, J.; Wang, J. Assessment of Spatiotemporal Patterns and the Effect of the Relationship between Meteorological Drought and Vegetation Dynamics in the Yangtze River Basin Based on Remotely Sensed Data. Remote Sens. 2023, 15, 3641. [Google Scholar] [CrossRef]
- Huang, S.; Huang, Q.; Chang, J.; Zhu, Y.; Leng, G.; Xing, L. Drought structure based on a nonparametric multivariate standardized drought index across the Yellow River basin, China. J. Hydrol. 2015, 530, 127–136. [Google Scholar] [CrossRef]
- Wang, F.; Wang, Z.; Yang, H.; Di, D.; Zhao, Y.; Liang, Q.; Hussain, Z. Comprehensive evaluation of hydrological drought and its relationships with meteorological drought in the Yellow River basin, China. J. Hydrol. 2020, 584, 124751. [Google Scholar] [CrossRef]
- Abedi-Koupai, J.; Dorafshan, M.-M.; Javadi, A.; Ostad-Ali-Askari, K. Estimating potential reference evapotranspiration using time series models (case study: Synoptic station of Tabriz in northwestern Iran). Appl. Water Sci. 2022, 12, 212. [Google Scholar] [CrossRef]
- Medeiros, P.V.; Noronha Marcuzzo, F.F.; Youlton, C.; Wendland, E. Error Autocorrelation and Linear Regression for Temperature-Based Evapotranspiration Estimates Improvement. J. Am. Water Resour. Assoc. 2012, 48, 297–305. [Google Scholar] [CrossRef]
- Ahmadi, S.H.; Fooladmand, H.R. Spatially distributed monthly reference evapotranspiration derived from the calibration of Thornthwaite equation: A case study, South of Iran. Irrig. Sci. 2008, 26, 303–312. [Google Scholar] [CrossRef]
- da Silva, V.J.; Carvalho, H.d.P.; da Silva, C.R.; de Camargo, R.; Franco Teodoro, R.E. Performance of Different Methods of Estimating the Daily Reference Evapotranspiration in Uberlandia, MG. Biosci. J. 2011, 27, 95–101. [Google Scholar]
- Gharehbaghi, A.; Kaya, B. Calibration and evaluation of six popular evapotranspiration formula based on the Penman-Monteith model for continental climate in Turkey. Phys. Chem. Earth 2022, 127, 103190. [Google Scholar] [CrossRef]
- Nguyen Dinh Giang, N.; Le Nhu, Y.; Lam Van, T.; Huynh Vuong Thu, M.; Kumar, P.; Nguyen Vo Chau, N. Evaluating Reference Crop Evapotranspiration of the Selected Field Crops Grown in Different Agricultural Regions in the Vietnamese Mekong Delta. J. Clim. Chang. 2022, 8, 1–12. [Google Scholar] [CrossRef]
- Trajkovic, S. Temperature-based approaches for estimating reference evapotranspiration. J. Irrig. Drain. Eng. 2005, 131, 316–323. [Google Scholar] [CrossRef]
- Trajkovic, S.; Gocic, M.; Pongracz, R.; Bartholy, J.; Milanovic, M. Assessment of Reference Evapotranspiration by Regionally Calibrated Temperature-Based Equations. Ksce J. Civ. Eng. 2020, 24, 1020–1027. [Google Scholar] [CrossRef]
- Zhang, L.; Zhao, X.; Ge, J.; Zhang, J.; Traore, S.; Fipps, G.; Luo, Y. Evaluation of Five Equations for Short-Term Reference Evapotranspiration Forecasting Using Public Temperature Forecasts for North China Plain. Water 2022, 14, 2888. [Google Scholar] [CrossRef]
- Yang, Q.; Li, M.; Zheng, Z.; Ma, Z. Regional applicability of seven meteorological drought indices in China. Sci. China Earth Sci. 2017, 60, 745–760. [Google Scholar] [CrossRef]
- Han, X.; Wu, J.; Zhou, H.; Liu, L.; Yang, J.; Shen, Q.; Wu, J. Intensification of historical drought over China based on a multi-model drought index. Int. J. Climatol. 2020, 40, 5407–5419. [Google Scholar] [CrossRef]
- Huang, S.; Chang, J.; Huang, Q.; Chen, Y. Spatio-temporal Changes and Frequency Analysis of Drought in the Wei River Basin, China. Water Resour. Manag. 2014, 28, 3095–3110. [Google Scholar] [CrossRef]
- Wang, F.; Yang, H.; Wang, Z.; Zhang, Z.; Li, Z. Drought Evaluation with CMORPH Satellite Precipitation Data in the Yellow River Basin by Using Gridded Standardized Precipitation Evapotranspiration Index. Remote Sens. 2019, 11, 485. [Google Scholar] [CrossRef]
- Huang, S.; Huang, Q.; Zhang, H.; Chen, Y.; Leng, G. Spatio-temporal changes in precipitation, temperature and their possibly changing relationship: A case study in the Wei River Basin, China. Int. J. Climatol. 2016, 36, 1160–1169. [Google Scholar] [CrossRef]
- Zhao, H.Y.; Gao, G.; An, W.; Zou, X.L.; Li, H.T.; Hou, M.T. Timescale differences between SC-PDSI and SPEI for drought monitoring in China. Phys. Chem. Earth 2017, 102, 48–58. [Google Scholar] [CrossRef]


| Subzones | |
|---|---|
| above Longyangxia (AL) | inward flowing (IF) |
| Longyangxia to Lanzhou (LL) | Longmen to Sanmenxia (LS) |
| Lanzhou to Hekou (LH) | Sanmenxia to Huayuankou (SH) |
| Hekou to Longmen (HL) | below Huayuankou (BH) |
| Drought Category | SPEI | scPDSI |
|---|---|---|
| No Drought | >−0.5 | >−1.0 |
| Mild Drought | (−1.0, −0.5] | (−2.0, −1.0] |
| Moderate Drought | (−1.5, −1.0] | (−3.0, −2.0] |
| Severe Drought | (−2.0, −1.5] | (−4.0, −3.0] |
| Extreme Drought | ≤−2.0 | ≤−4.0 |
Disclaimer/Publisher’s Note: The statements, opinions and data contained in all publications are solely those of the individual author(s) and contributor(s) and not of MDPI and/or the editor(s). MDPI and/or the editor(s) disclaim responsibility for any injury to people or property resulting from any ideas, methods, instructions or products referred to in the content. |
© 2024 by the authors. Licensee MDPI, Basel, Switzerland. This article is an open access article distributed under the terms and conditions of the Creative Commons Attribution (CC BY) license (https://creativecommons.org/licenses/by/4.0/).
Share and Cite
Jin, L.; Chen, S.; Liu, M. Multiscale Spatiotemporal Dynamics of Drought within the Yellow River Basin (YRB): An Examination of Regional Variability and Trends. Water 2024, 16, 791. https://doi.org/10.3390/w16050791
Jin L, Chen S, Liu M. Multiscale Spatiotemporal Dynamics of Drought within the Yellow River Basin (YRB): An Examination of Regional Variability and Trends. Water. 2024; 16(5):791. https://doi.org/10.3390/w16050791
Chicago/Turabian StyleJin, Lei, Shaodan Chen, and Mengfan Liu. 2024. "Multiscale Spatiotemporal Dynamics of Drought within the Yellow River Basin (YRB): An Examination of Regional Variability and Trends" Water 16, no. 5: 791. https://doi.org/10.3390/w16050791
APA StyleJin, L., Chen, S., & Liu, M. (2024). Multiscale Spatiotemporal Dynamics of Drought within the Yellow River Basin (YRB): An Examination of Regional Variability and Trends. Water, 16(5), 791. https://doi.org/10.3390/w16050791