
Selective Calcium Removal at Near-Ambient Temperature in a Multimineral Recovery Process from Seawater Reverse Osmosis Synthetic Brine and Ex Ante Life Cycle Assessment

 ,
,  ,
, 
 ,
, 
Abstract
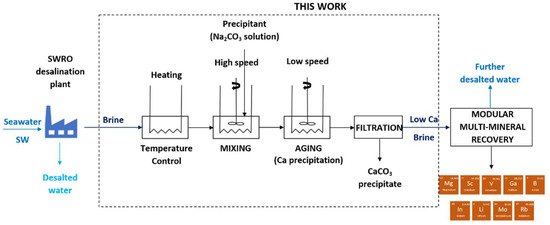
1. Introduction
2. Material and Methods
2.1. Reagents
2.2. Analytical Methods
2.3. Methodology of the Preliminary Precipitation Tests
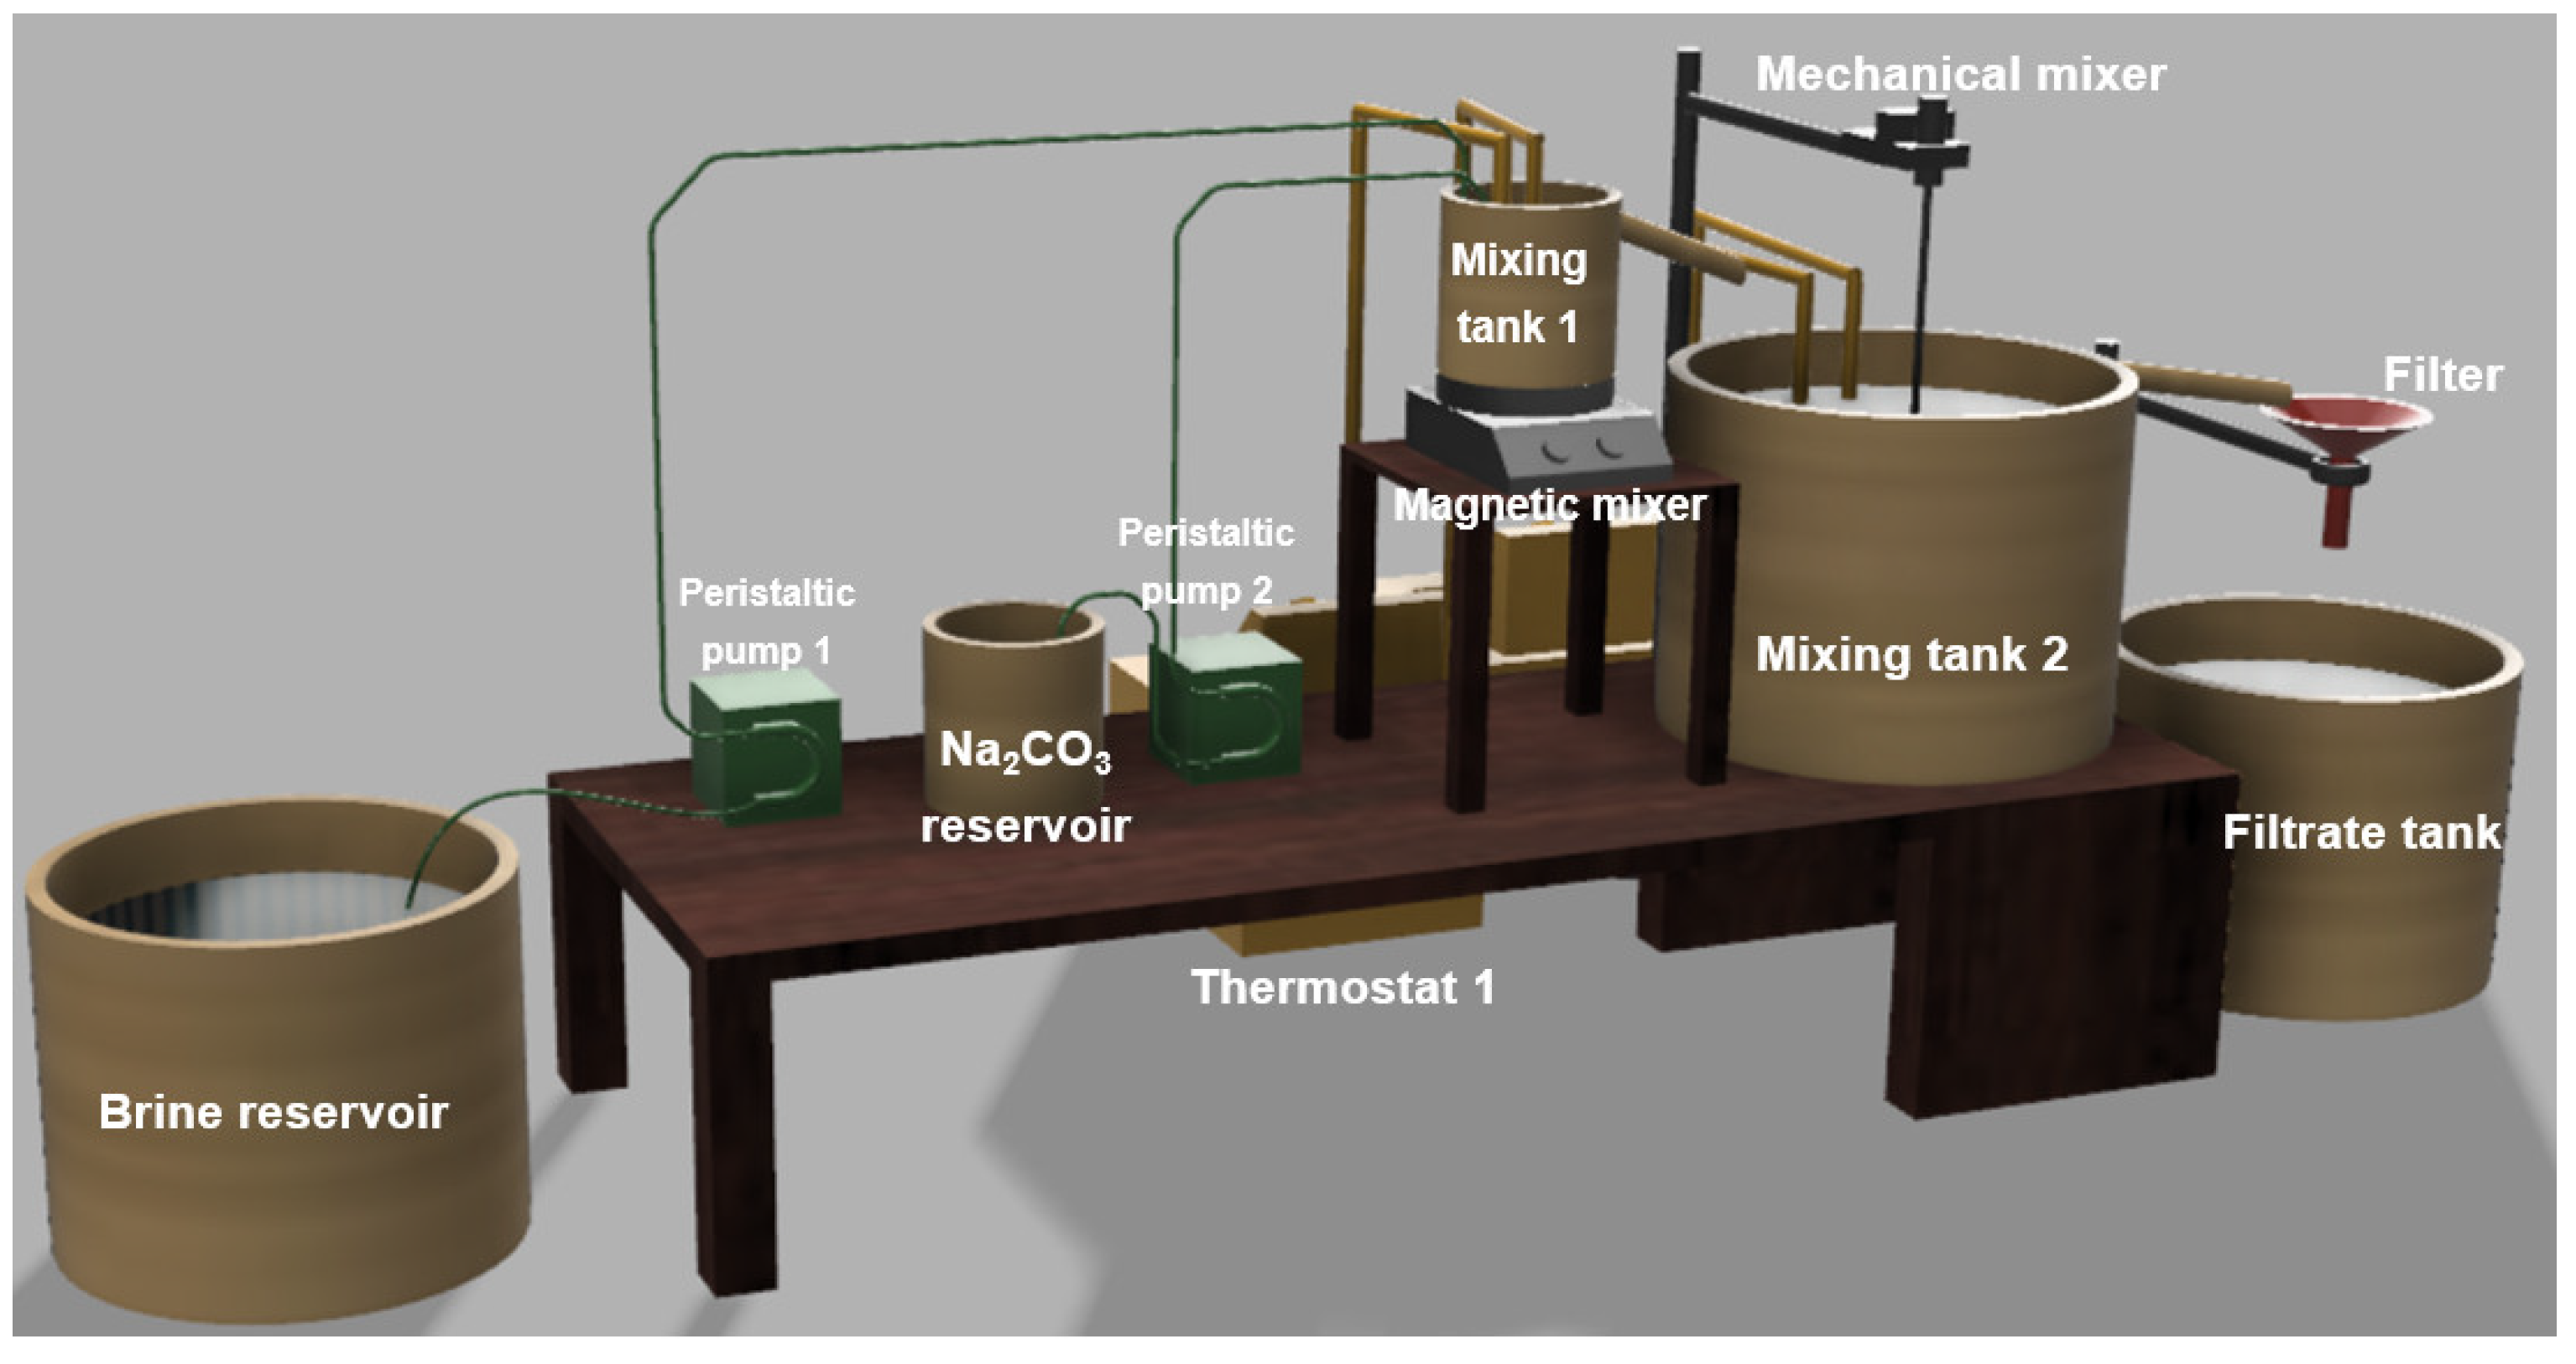
2.4. Laboratory-Scale Plant for Calcium Precipitation
2.5. Methodology of the Calcium Precipitation Tests for the Lab-Scale Plant
2.5.1. Precipitation Tests in Continuous Mode
2.5.2. Precipitation Tests in Batch Mode and Continuous Mode
2.6. Ex Ante Life Cycle Assessment
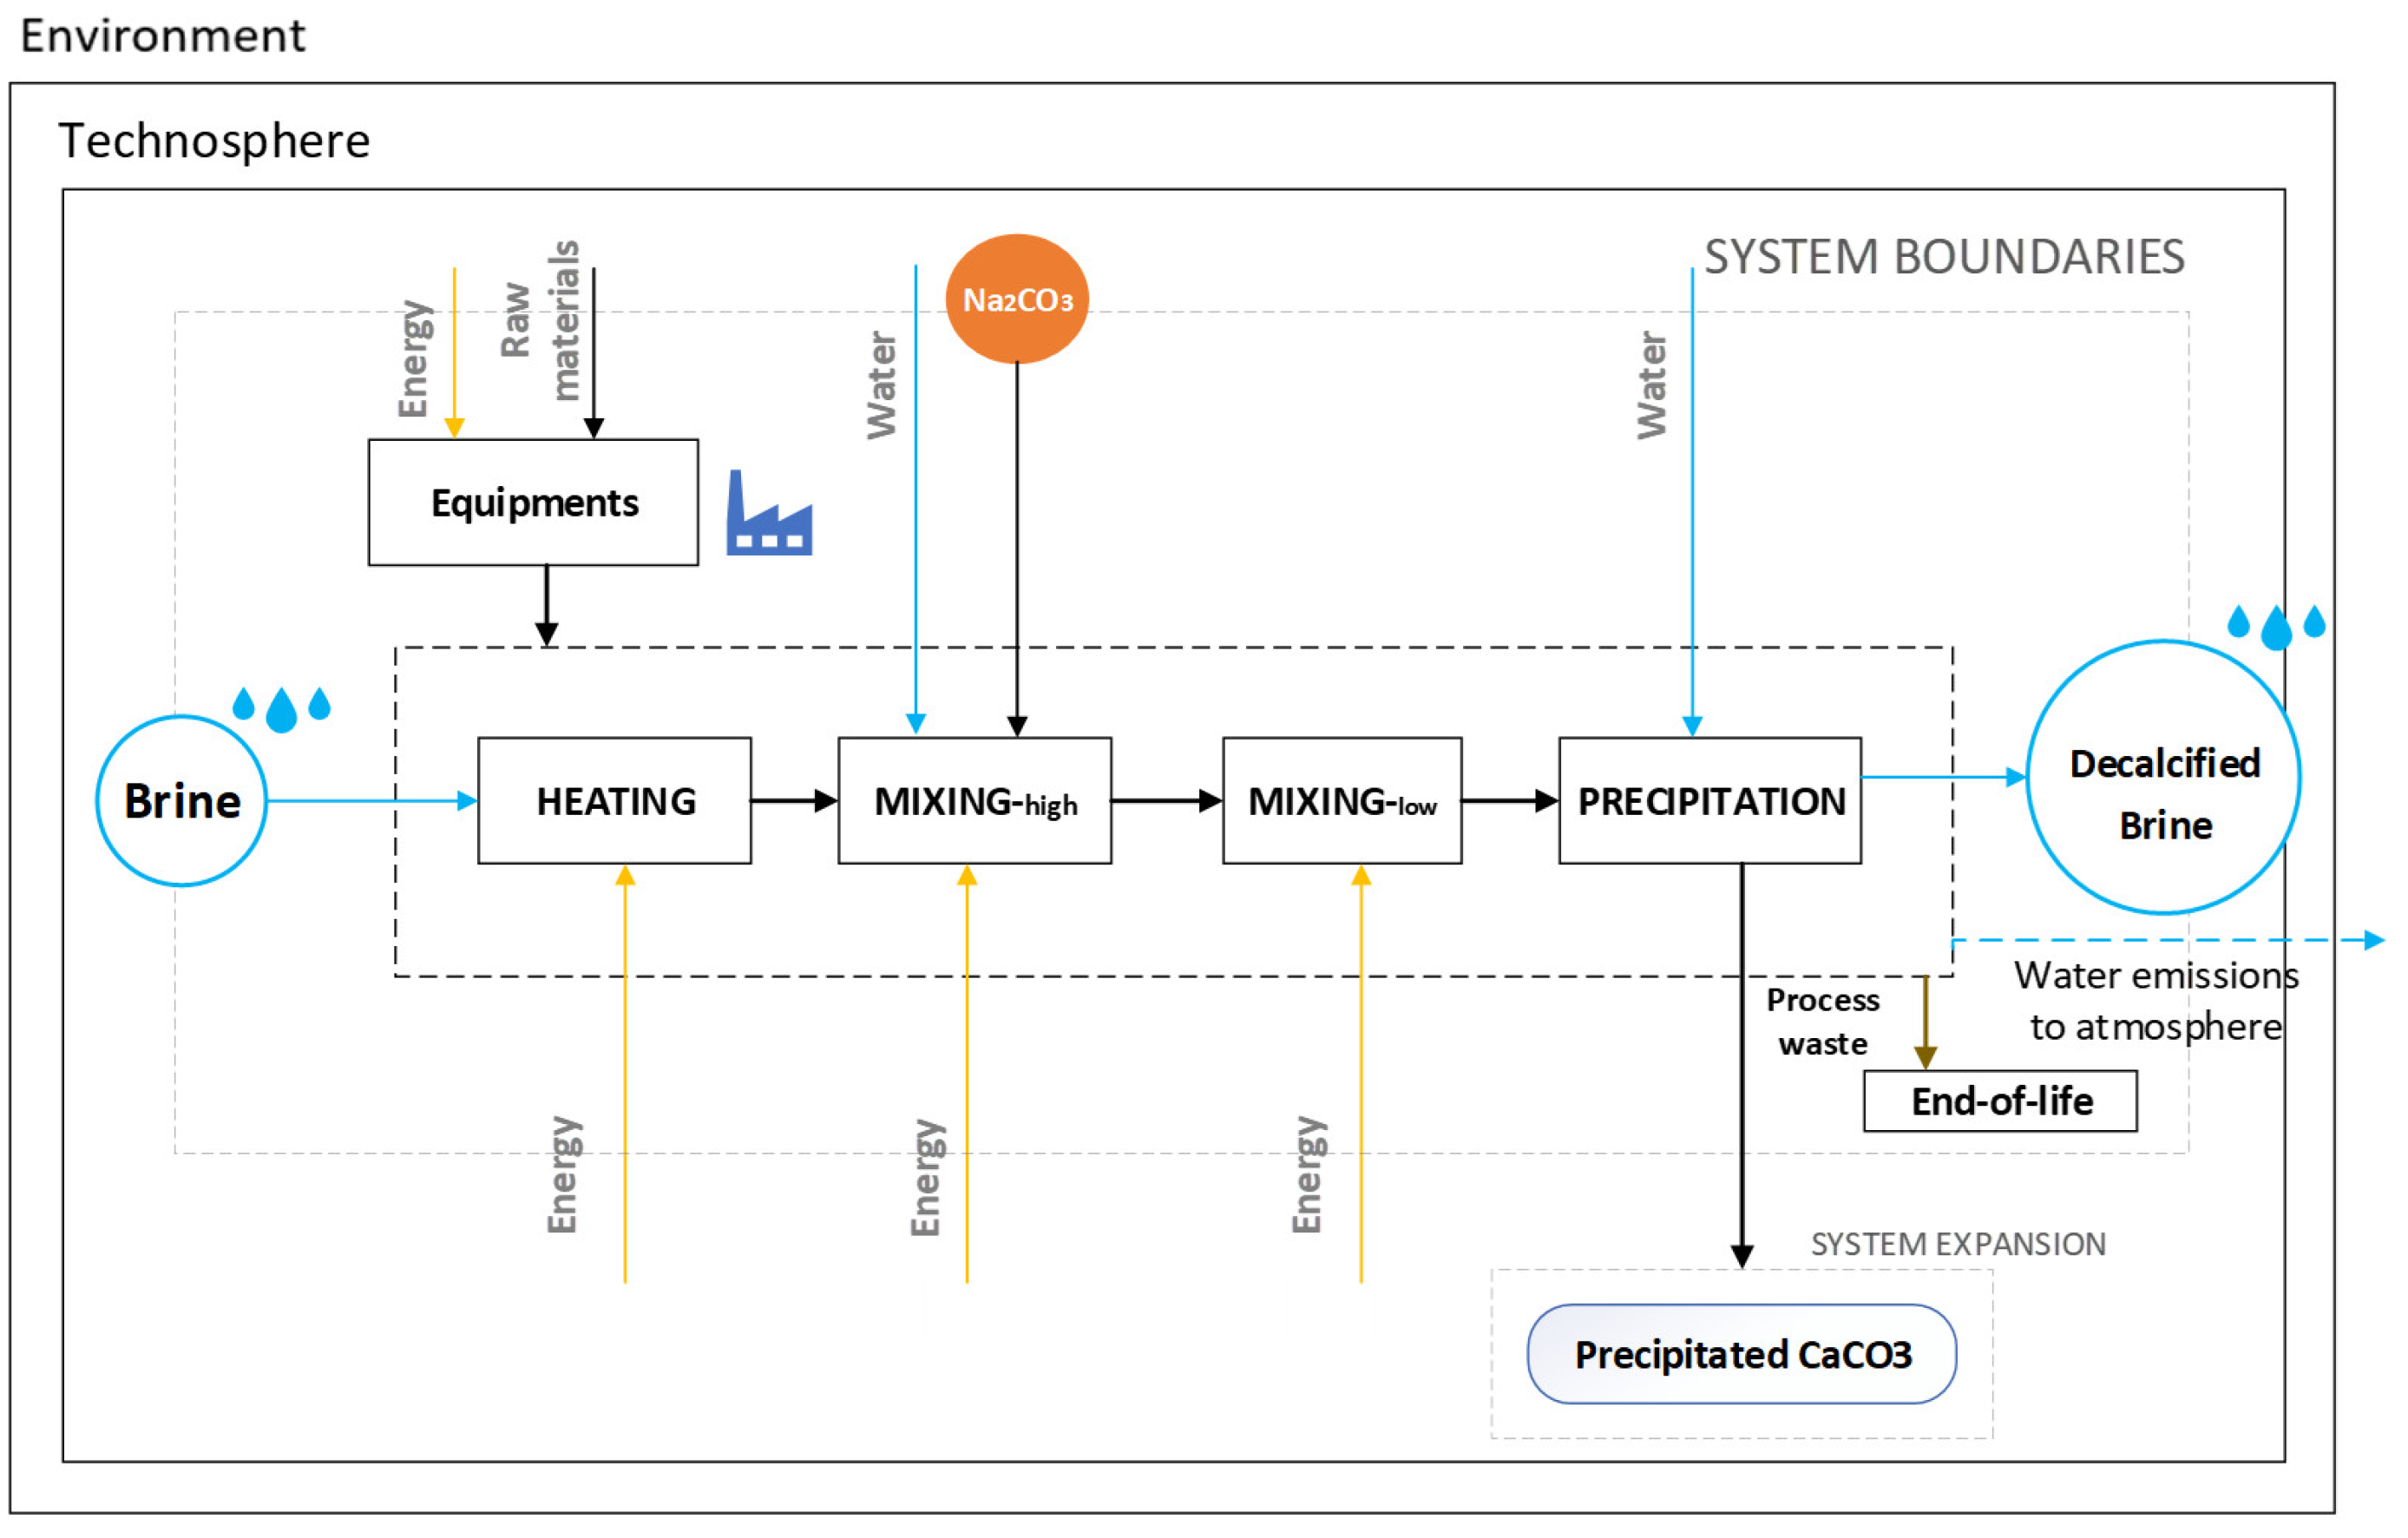
2.6.1. Goal, Scope, and System Boundaries
2.6.2. Environmental Indicators
2.6.3. Inventory
3. Theoretical Considerations for CaCO3 Precipitation
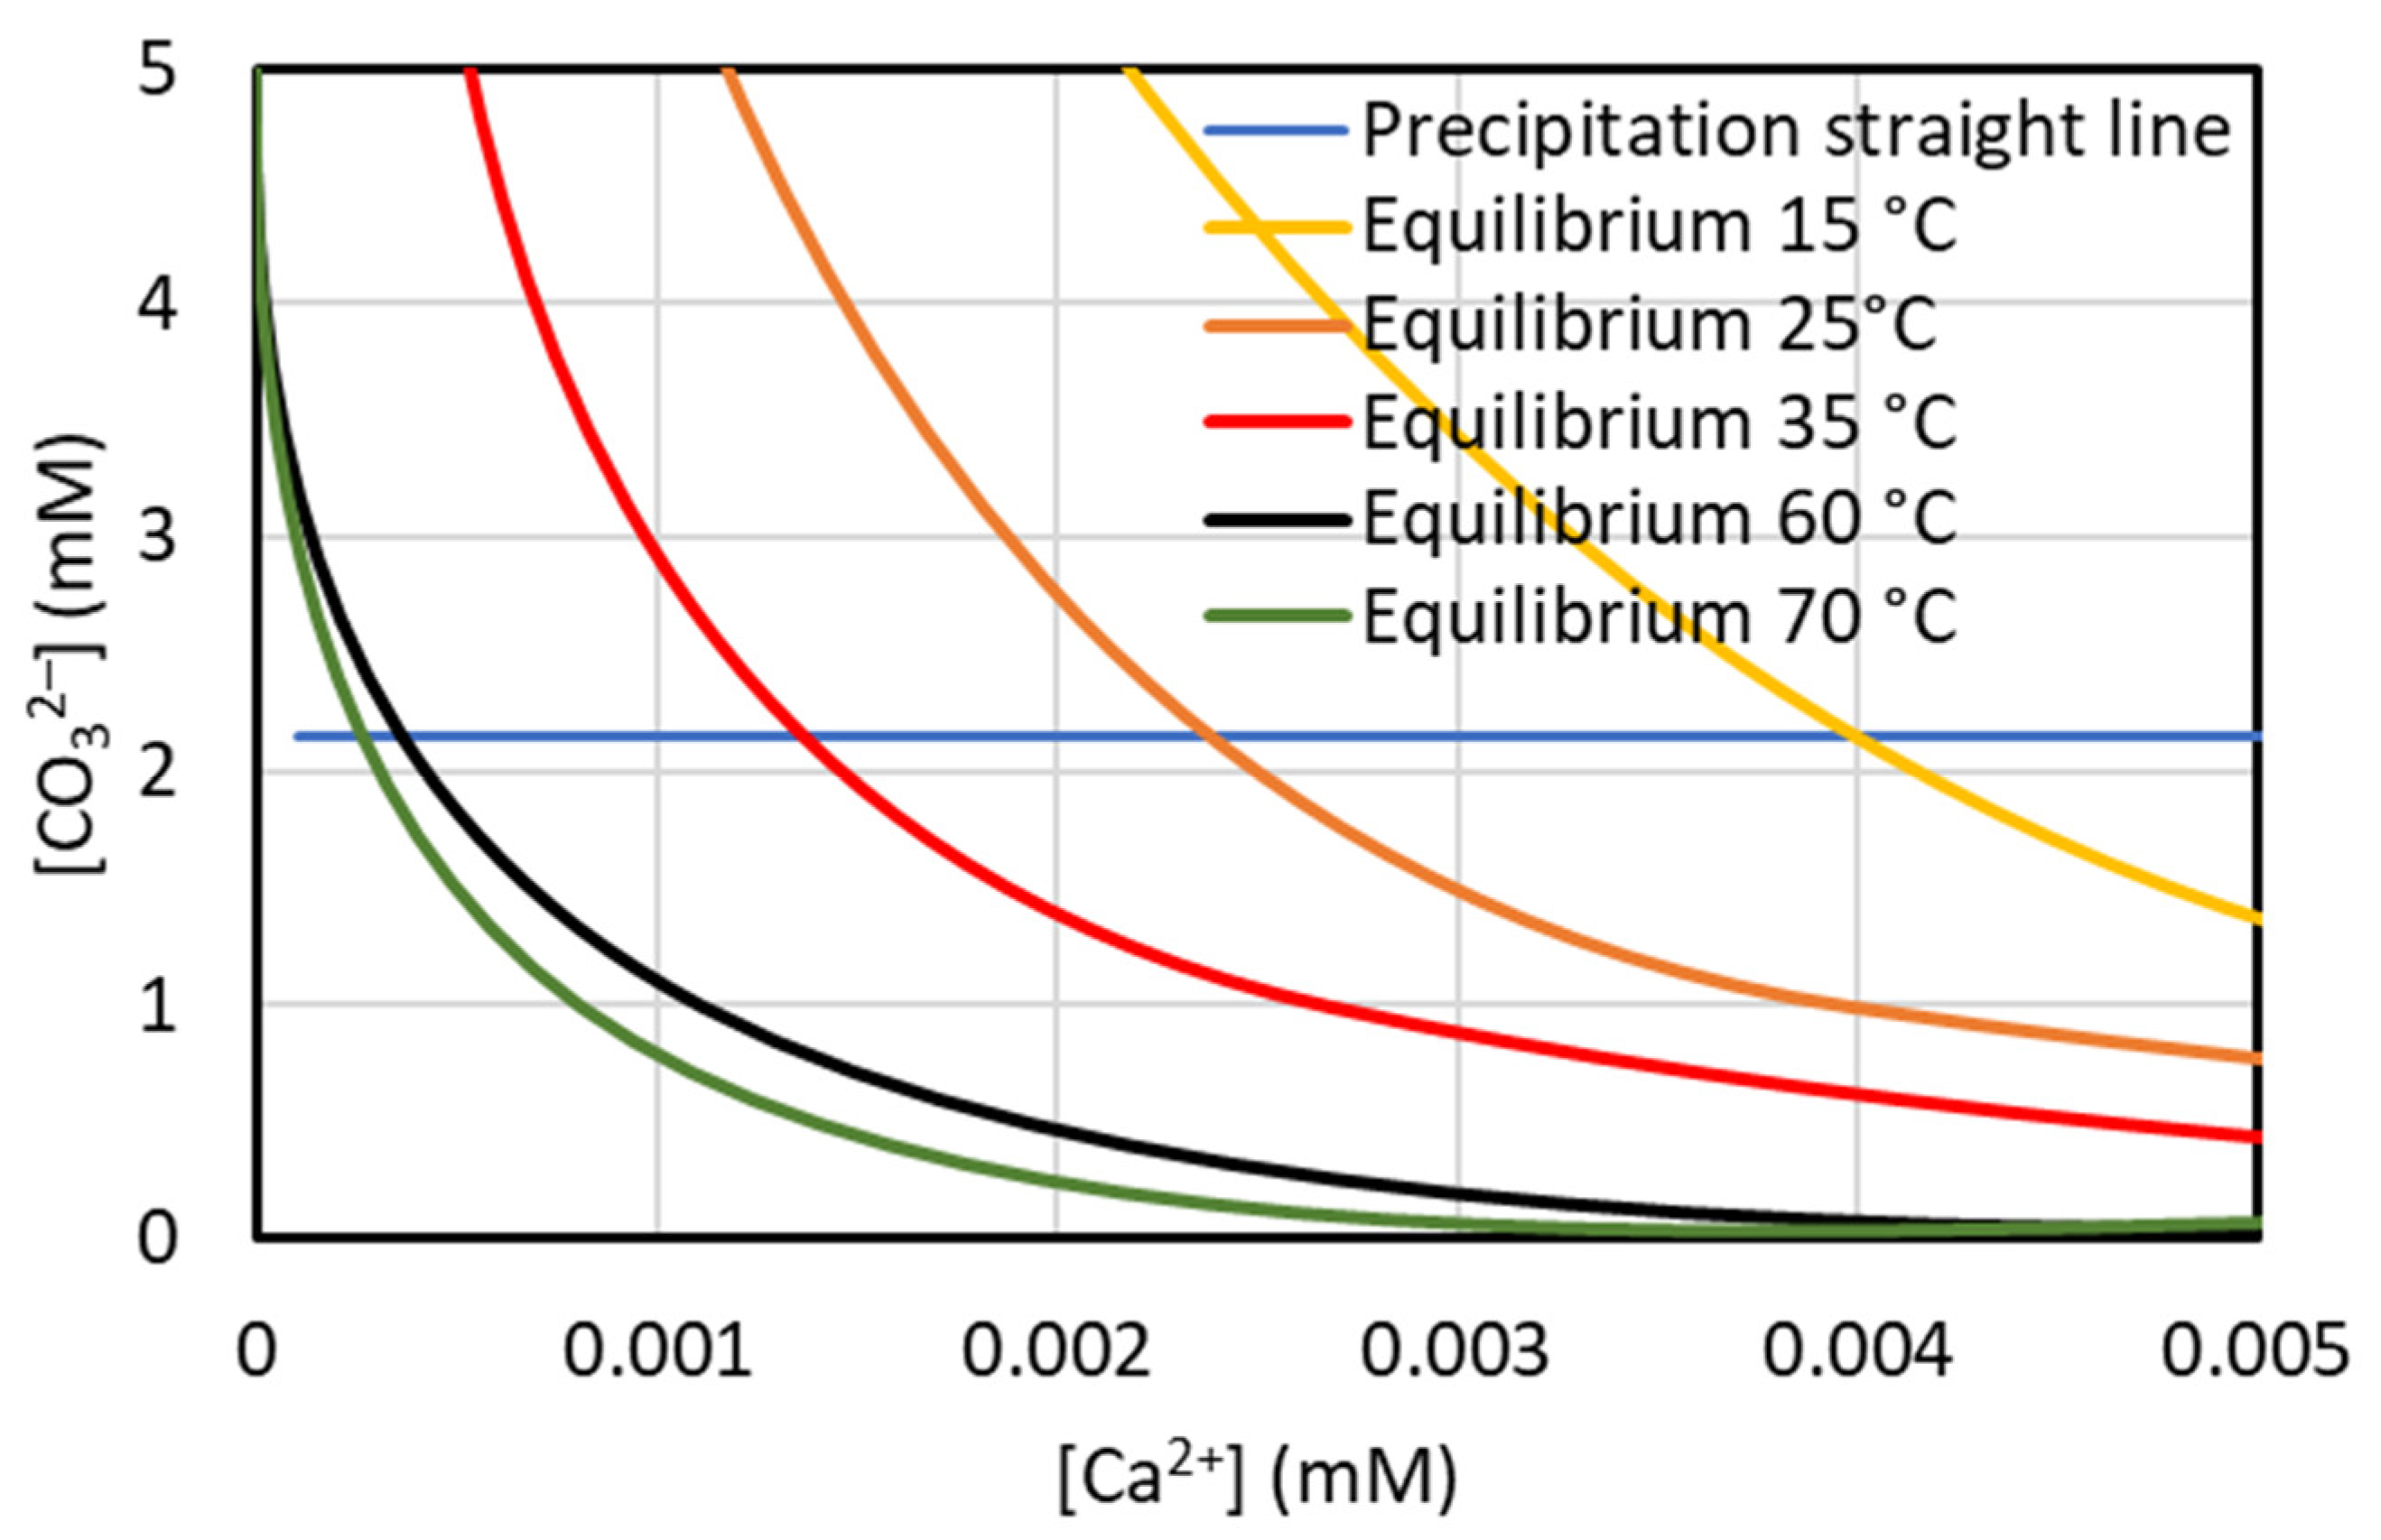
3.1. Sodium Carbonate Concentration to Minimize Magnesium Co-Precipitation
3.2. Thermodynamic and Kinetic Aspects of CaCO3 Precipitation
4. Results and Discussion
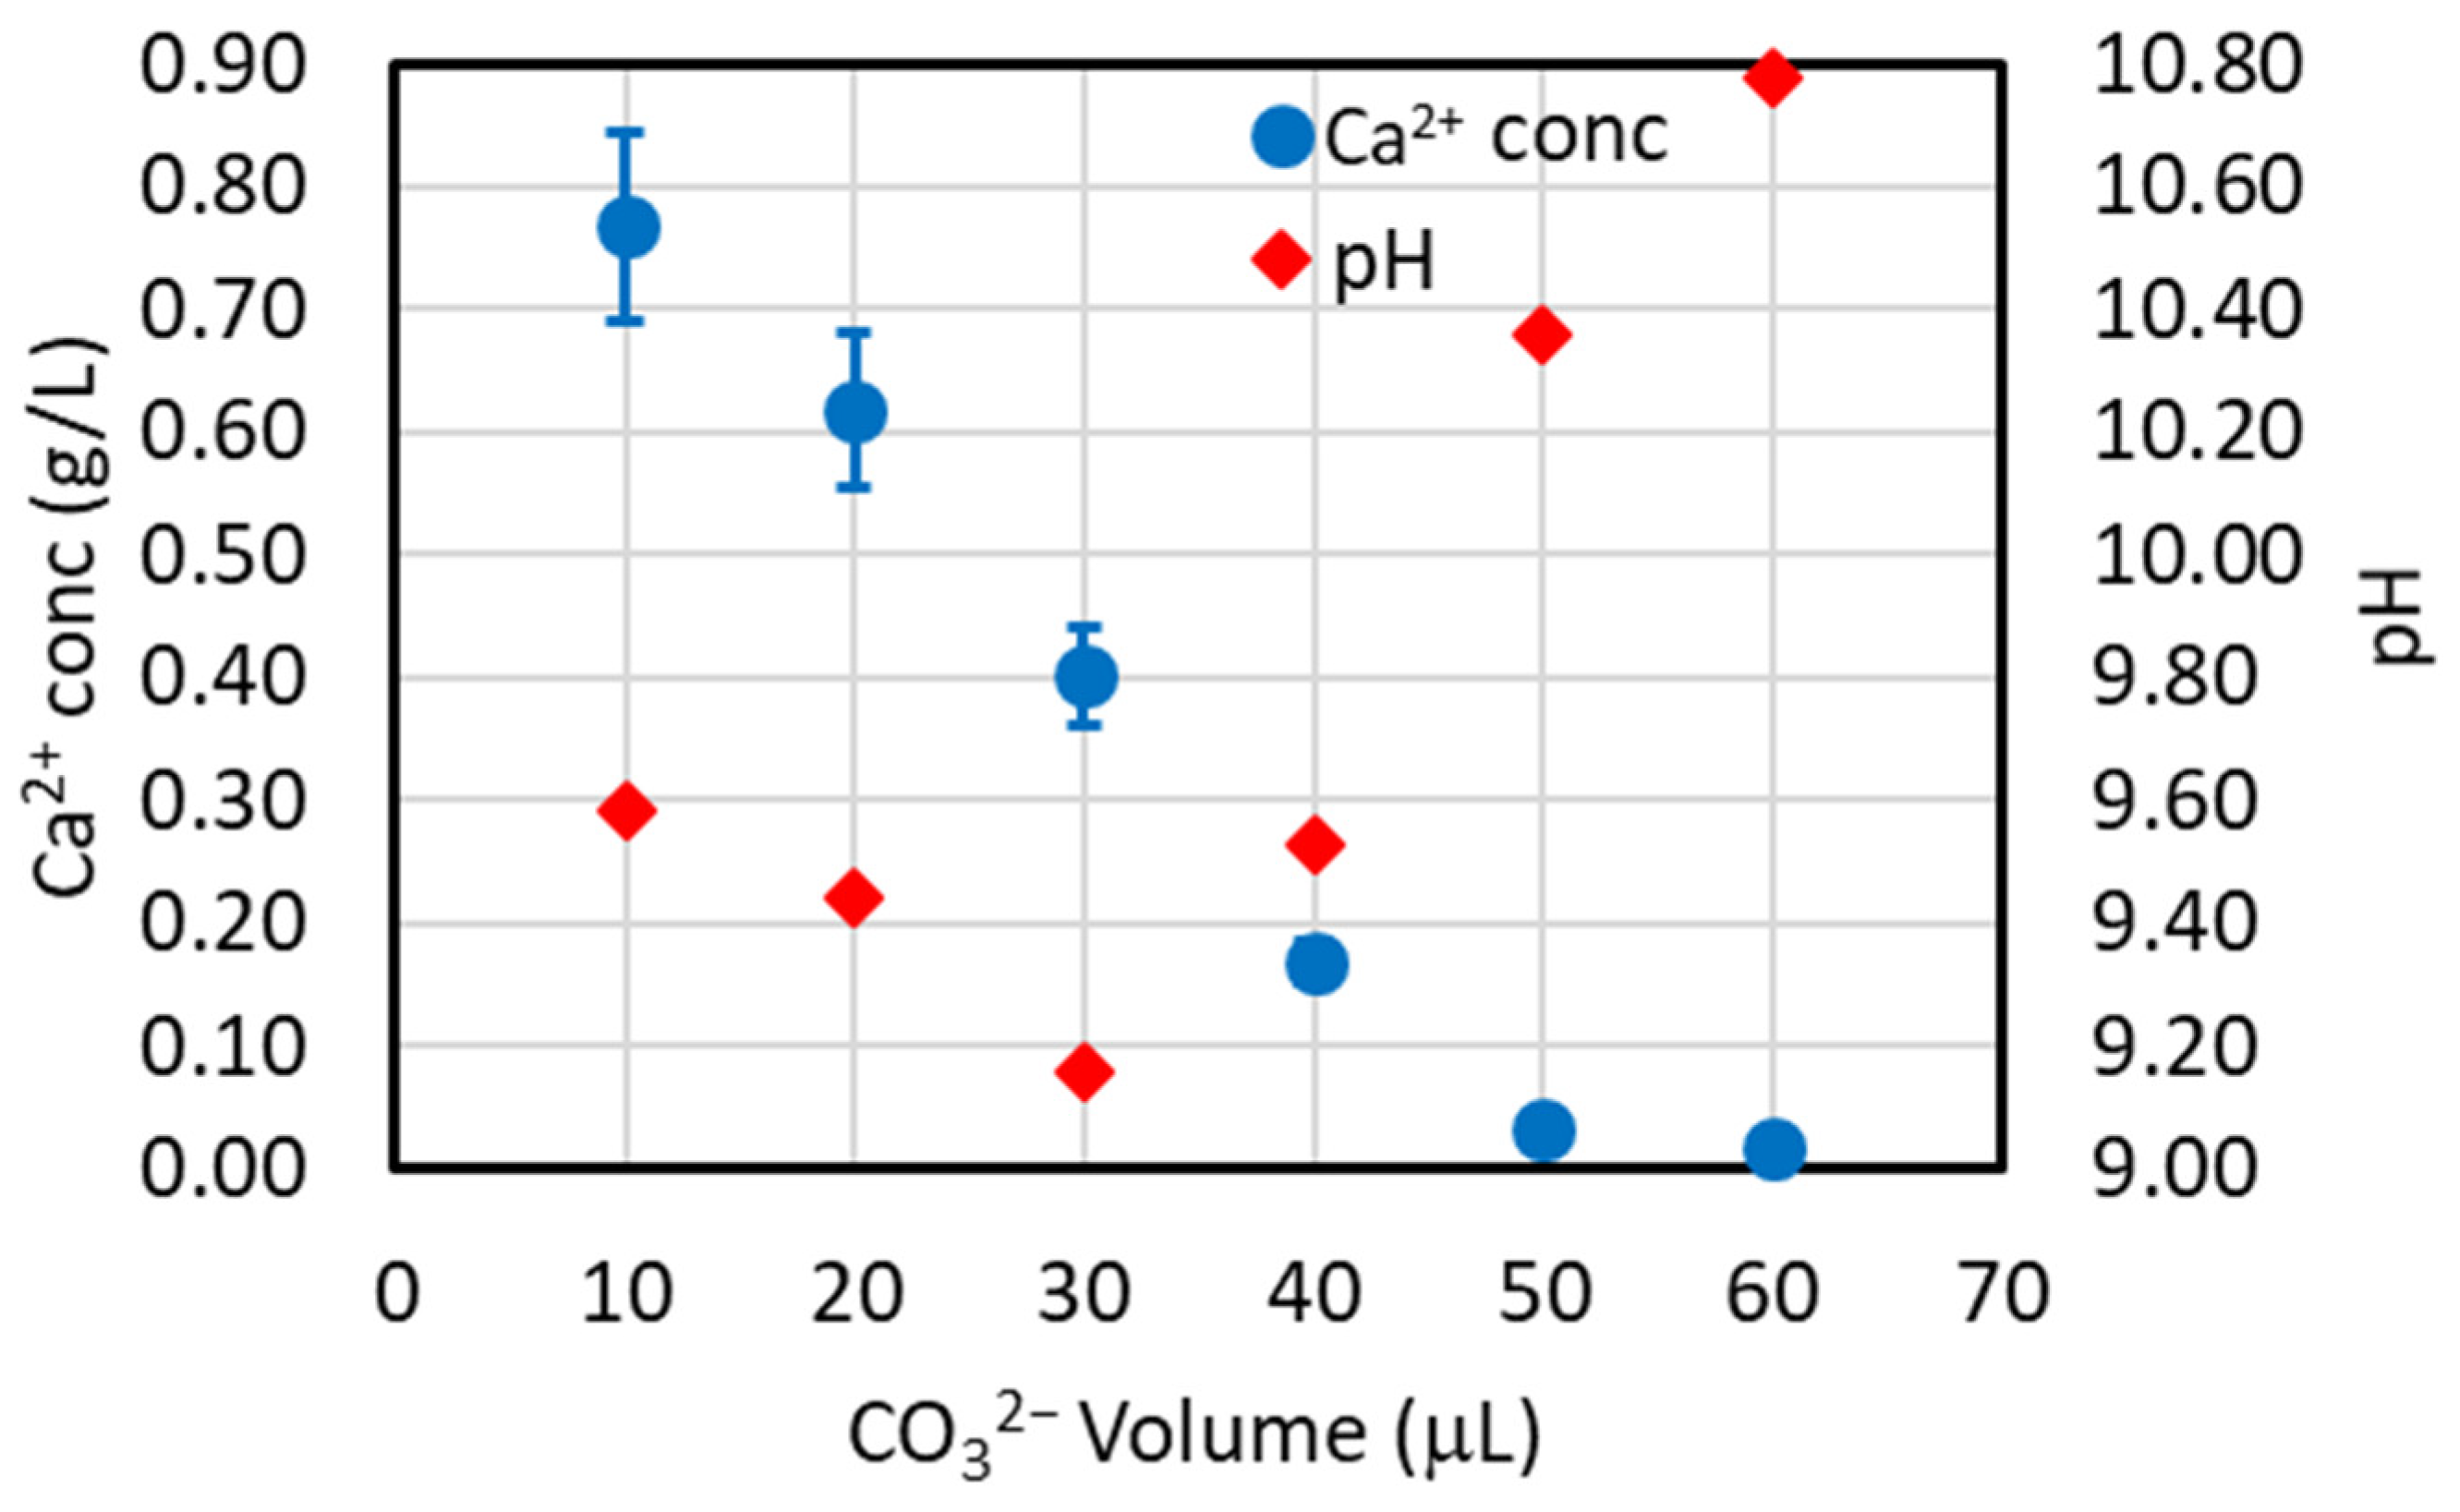
4.1. Choice of the CO32−/Ca2+ Molar Ratio and Addition Mode of Sodium Carbonate
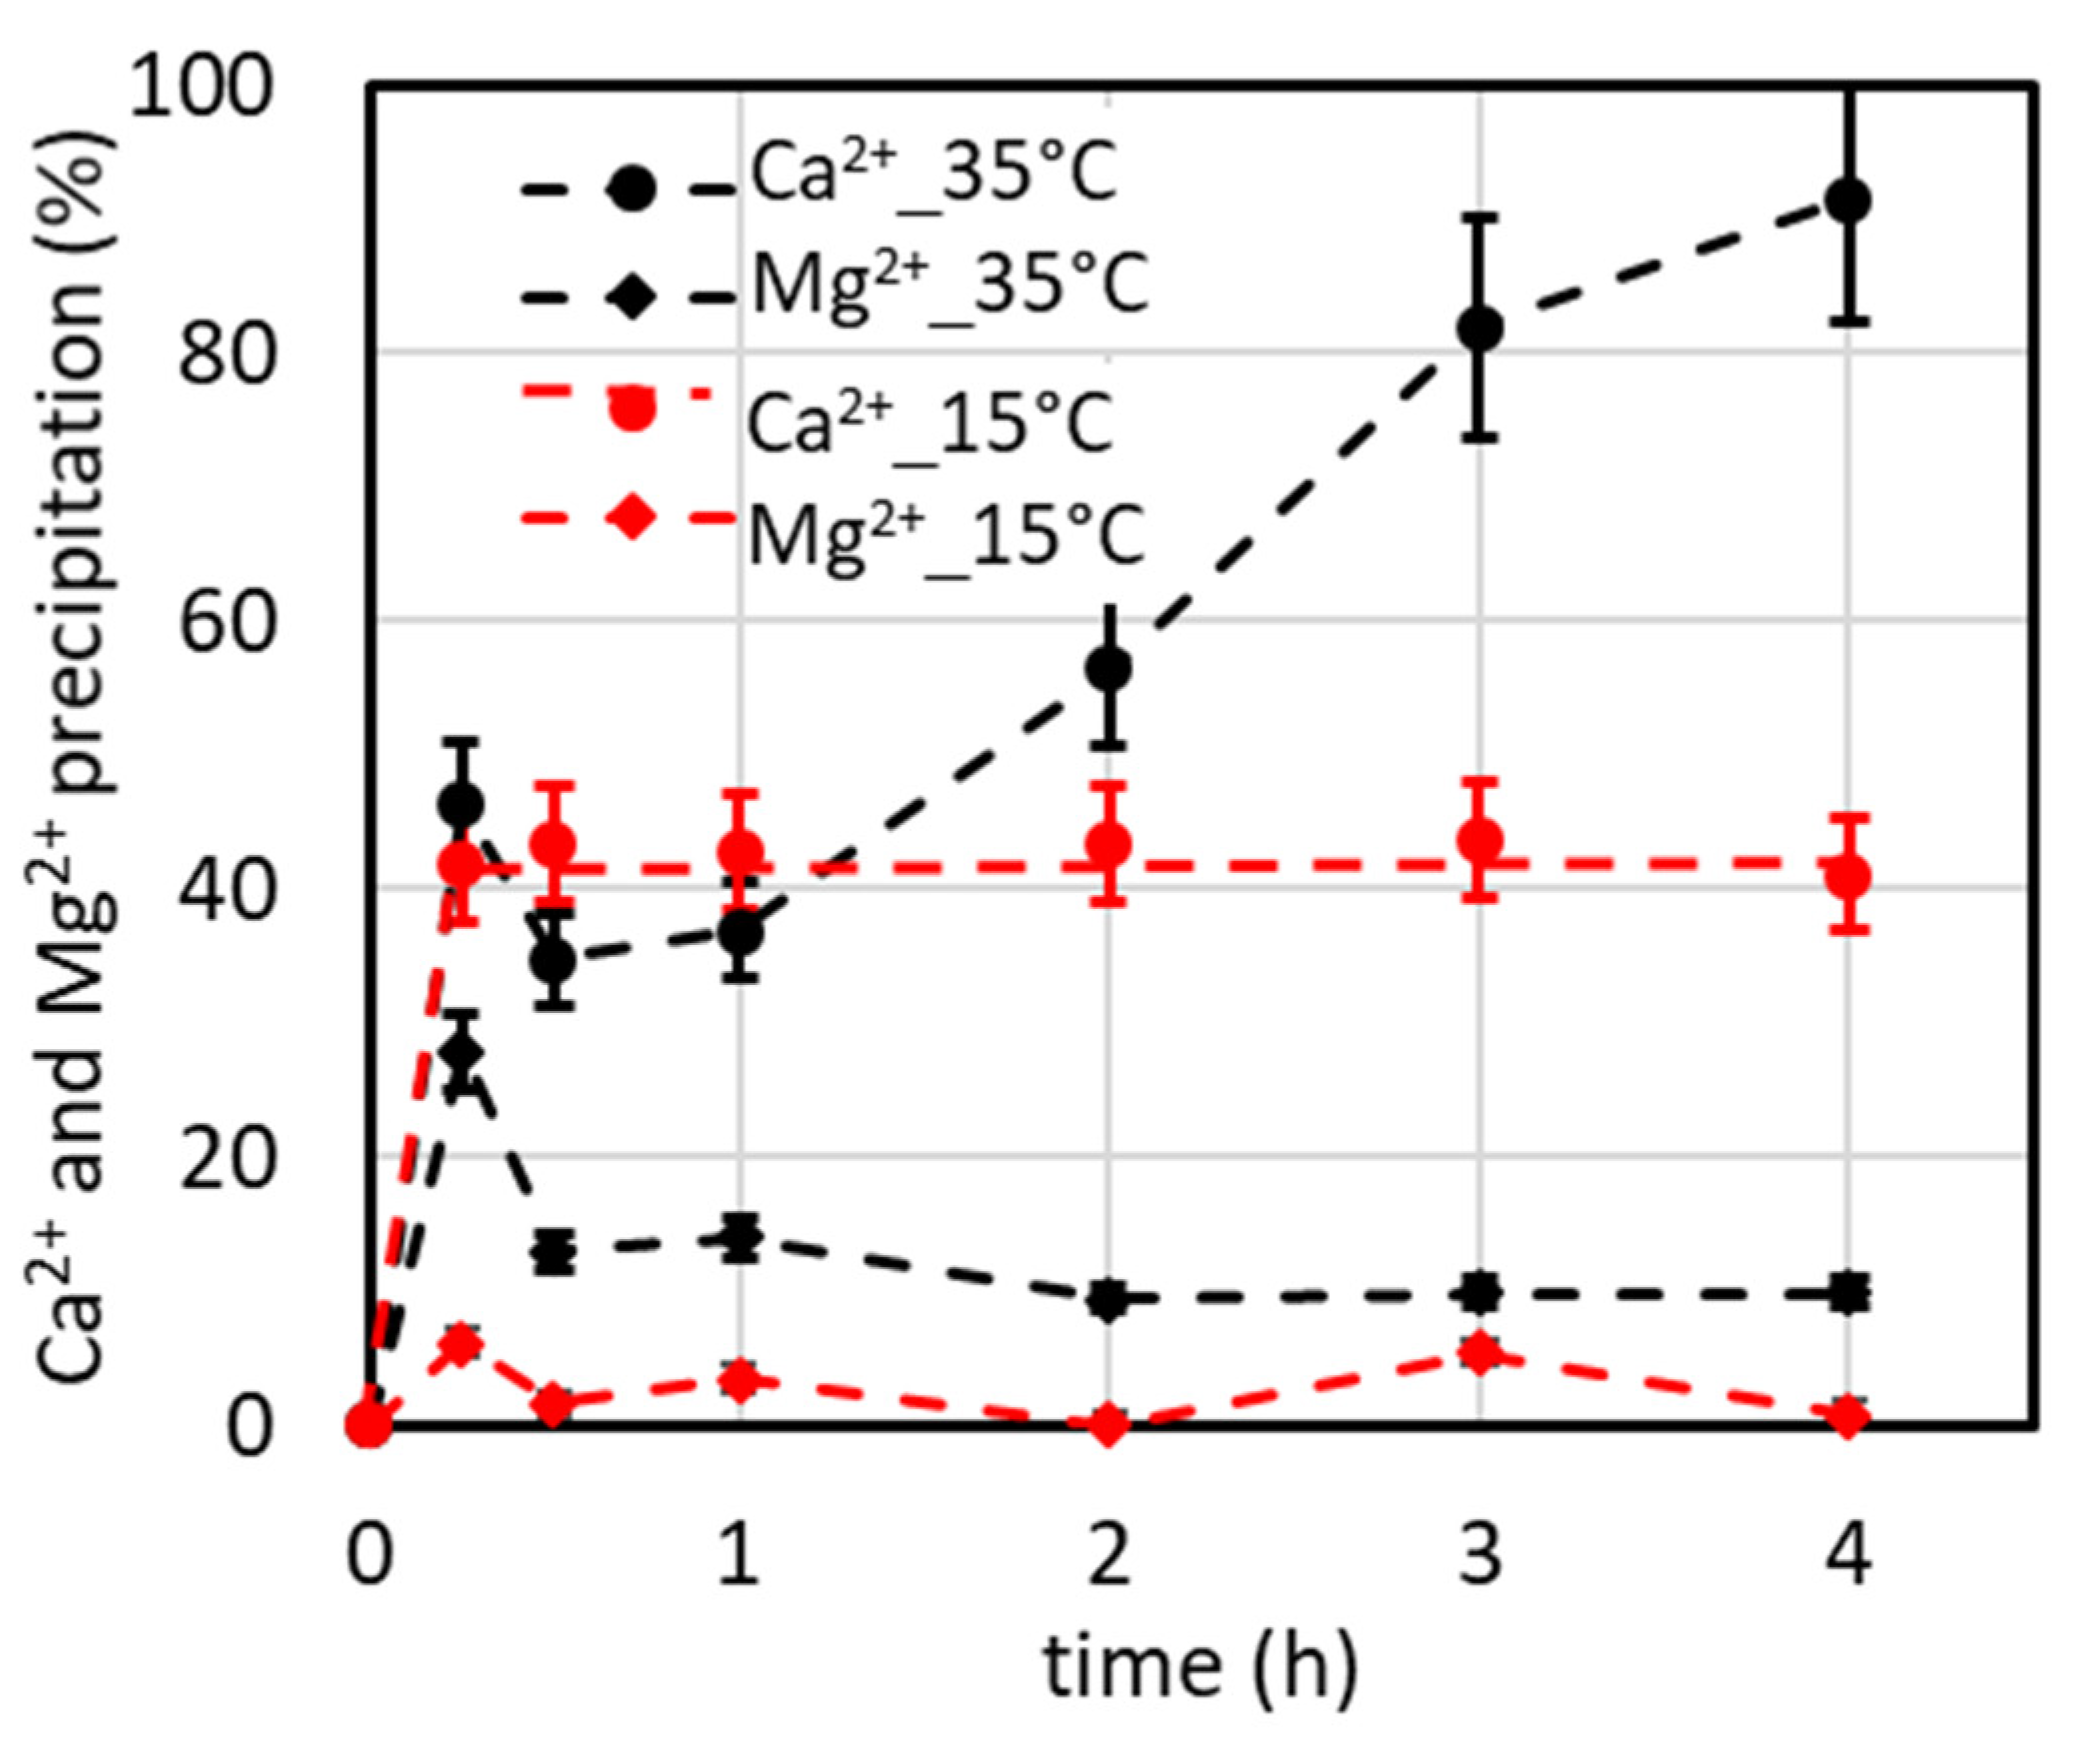
4.2. Temperature’s Effect on CaCO3 Precipitation
4.3. Antiscalant’s Effect on CaCO3 Precipitation
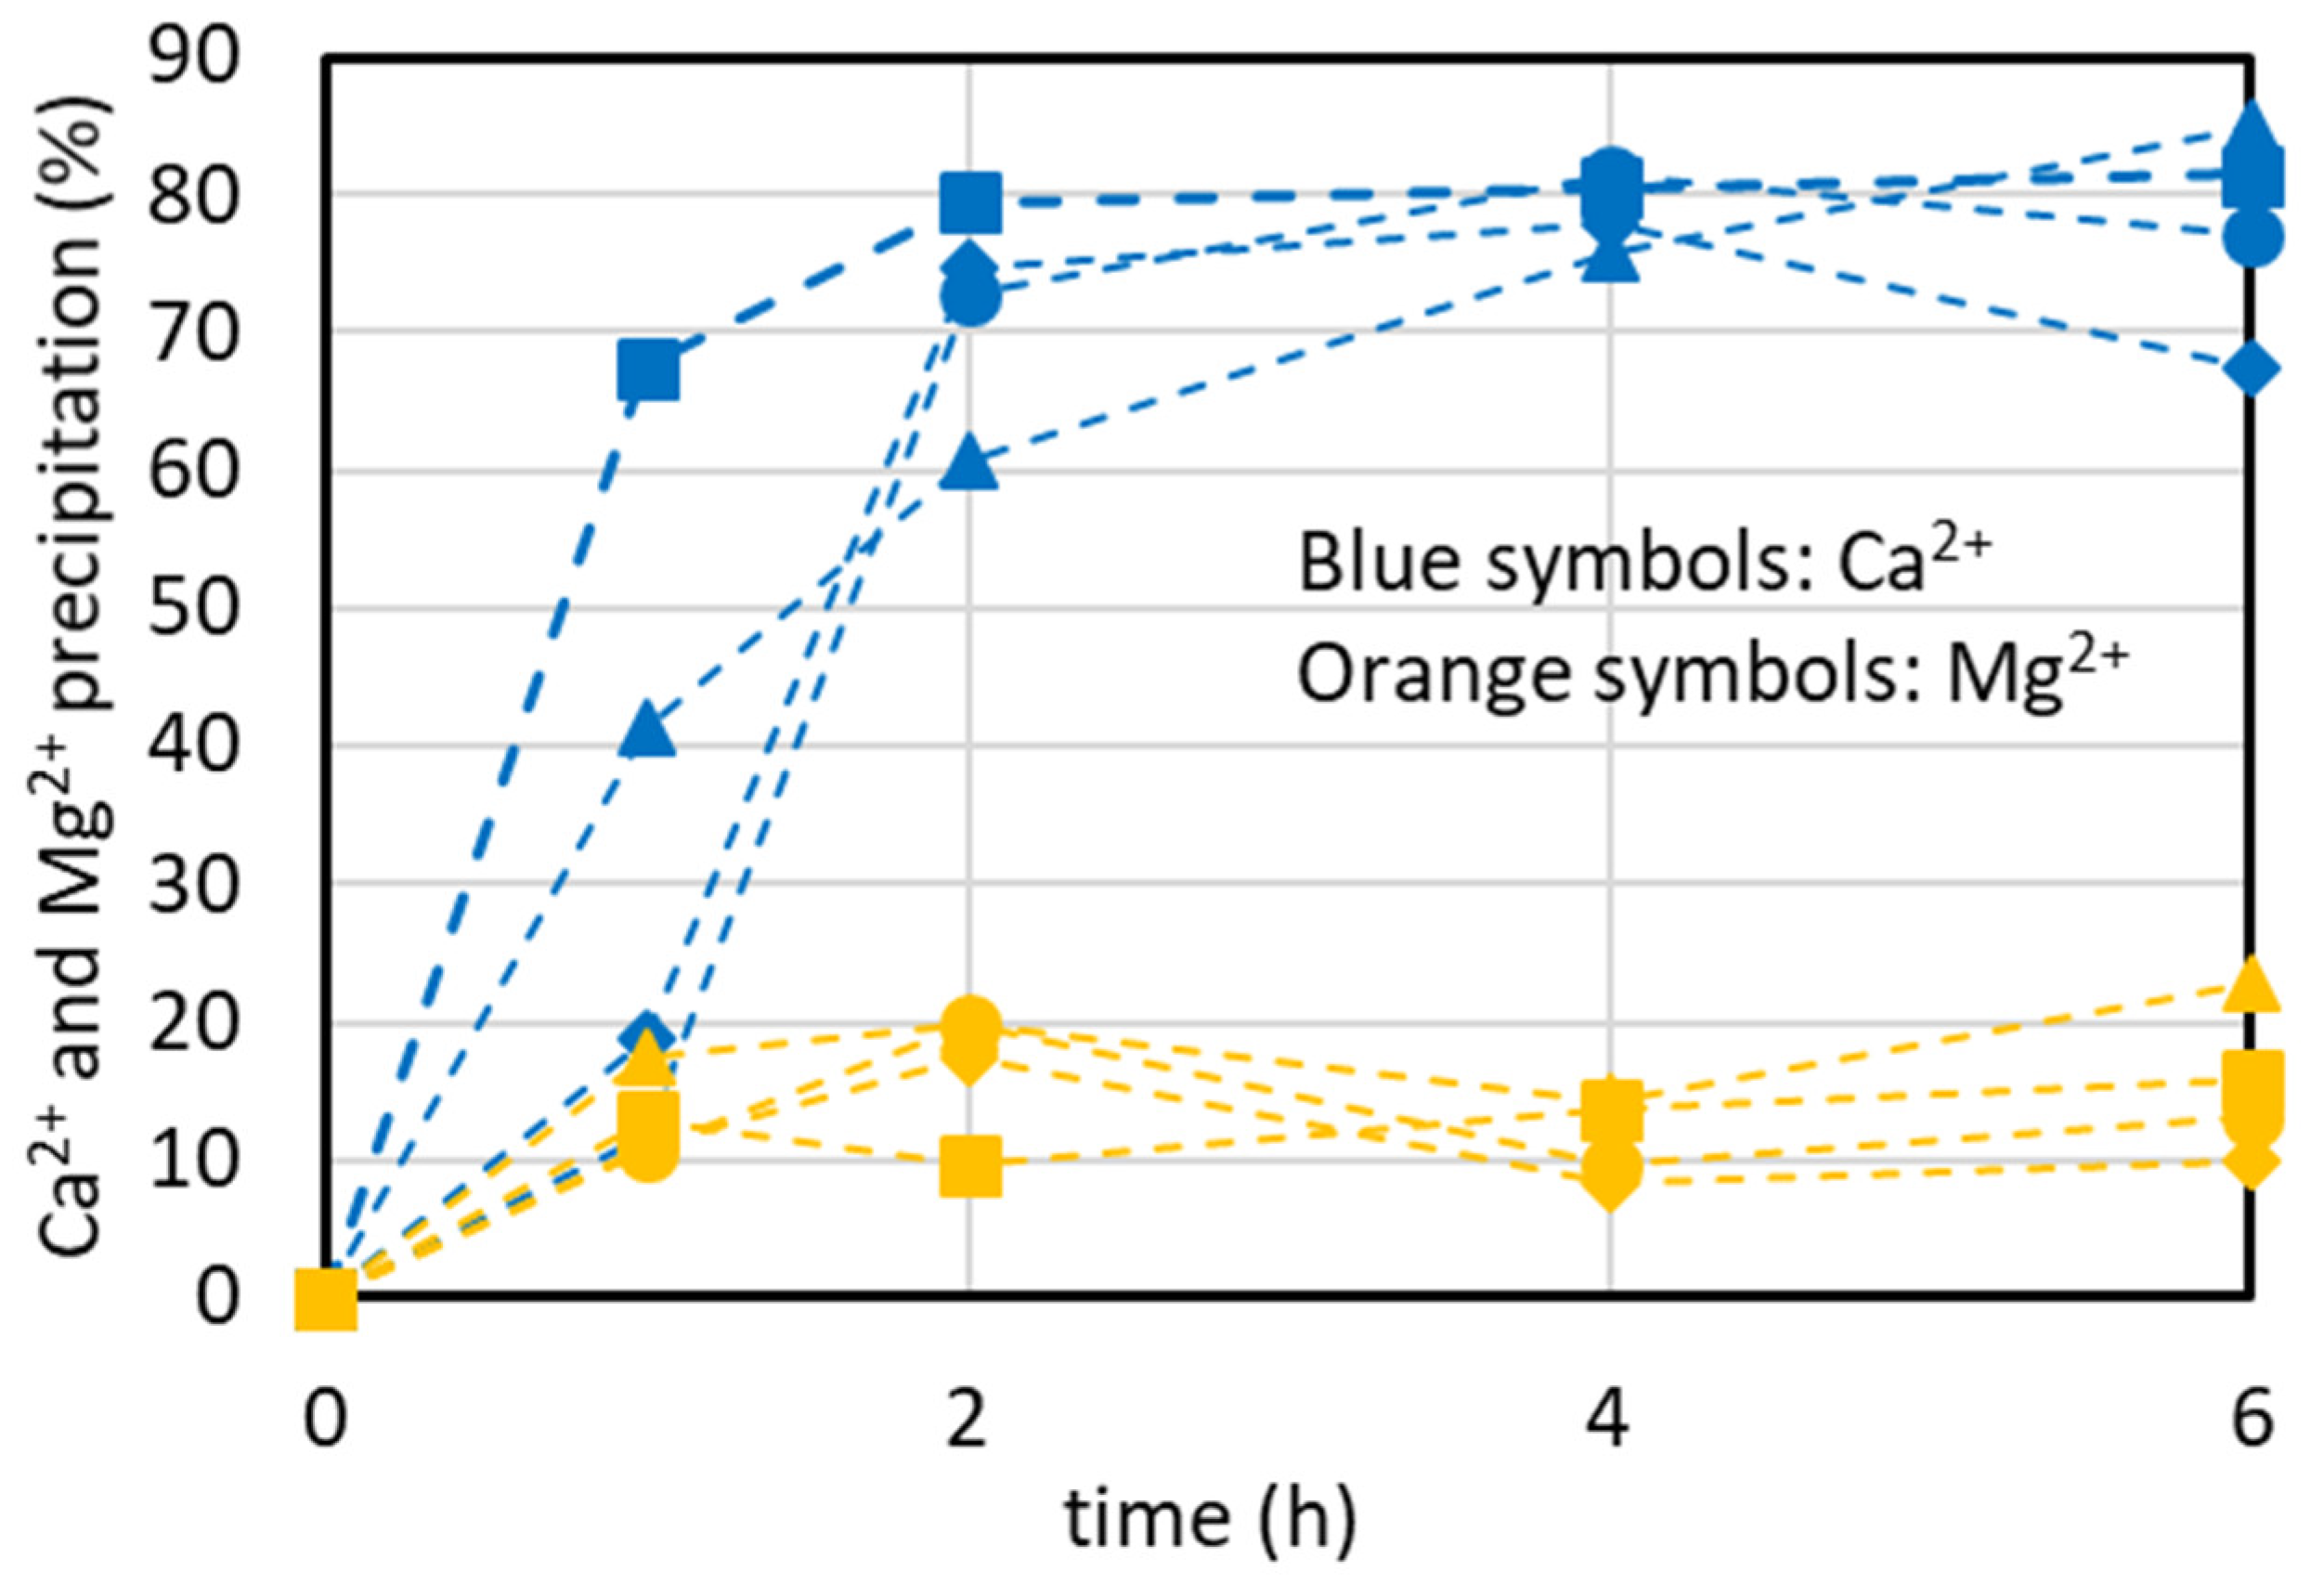
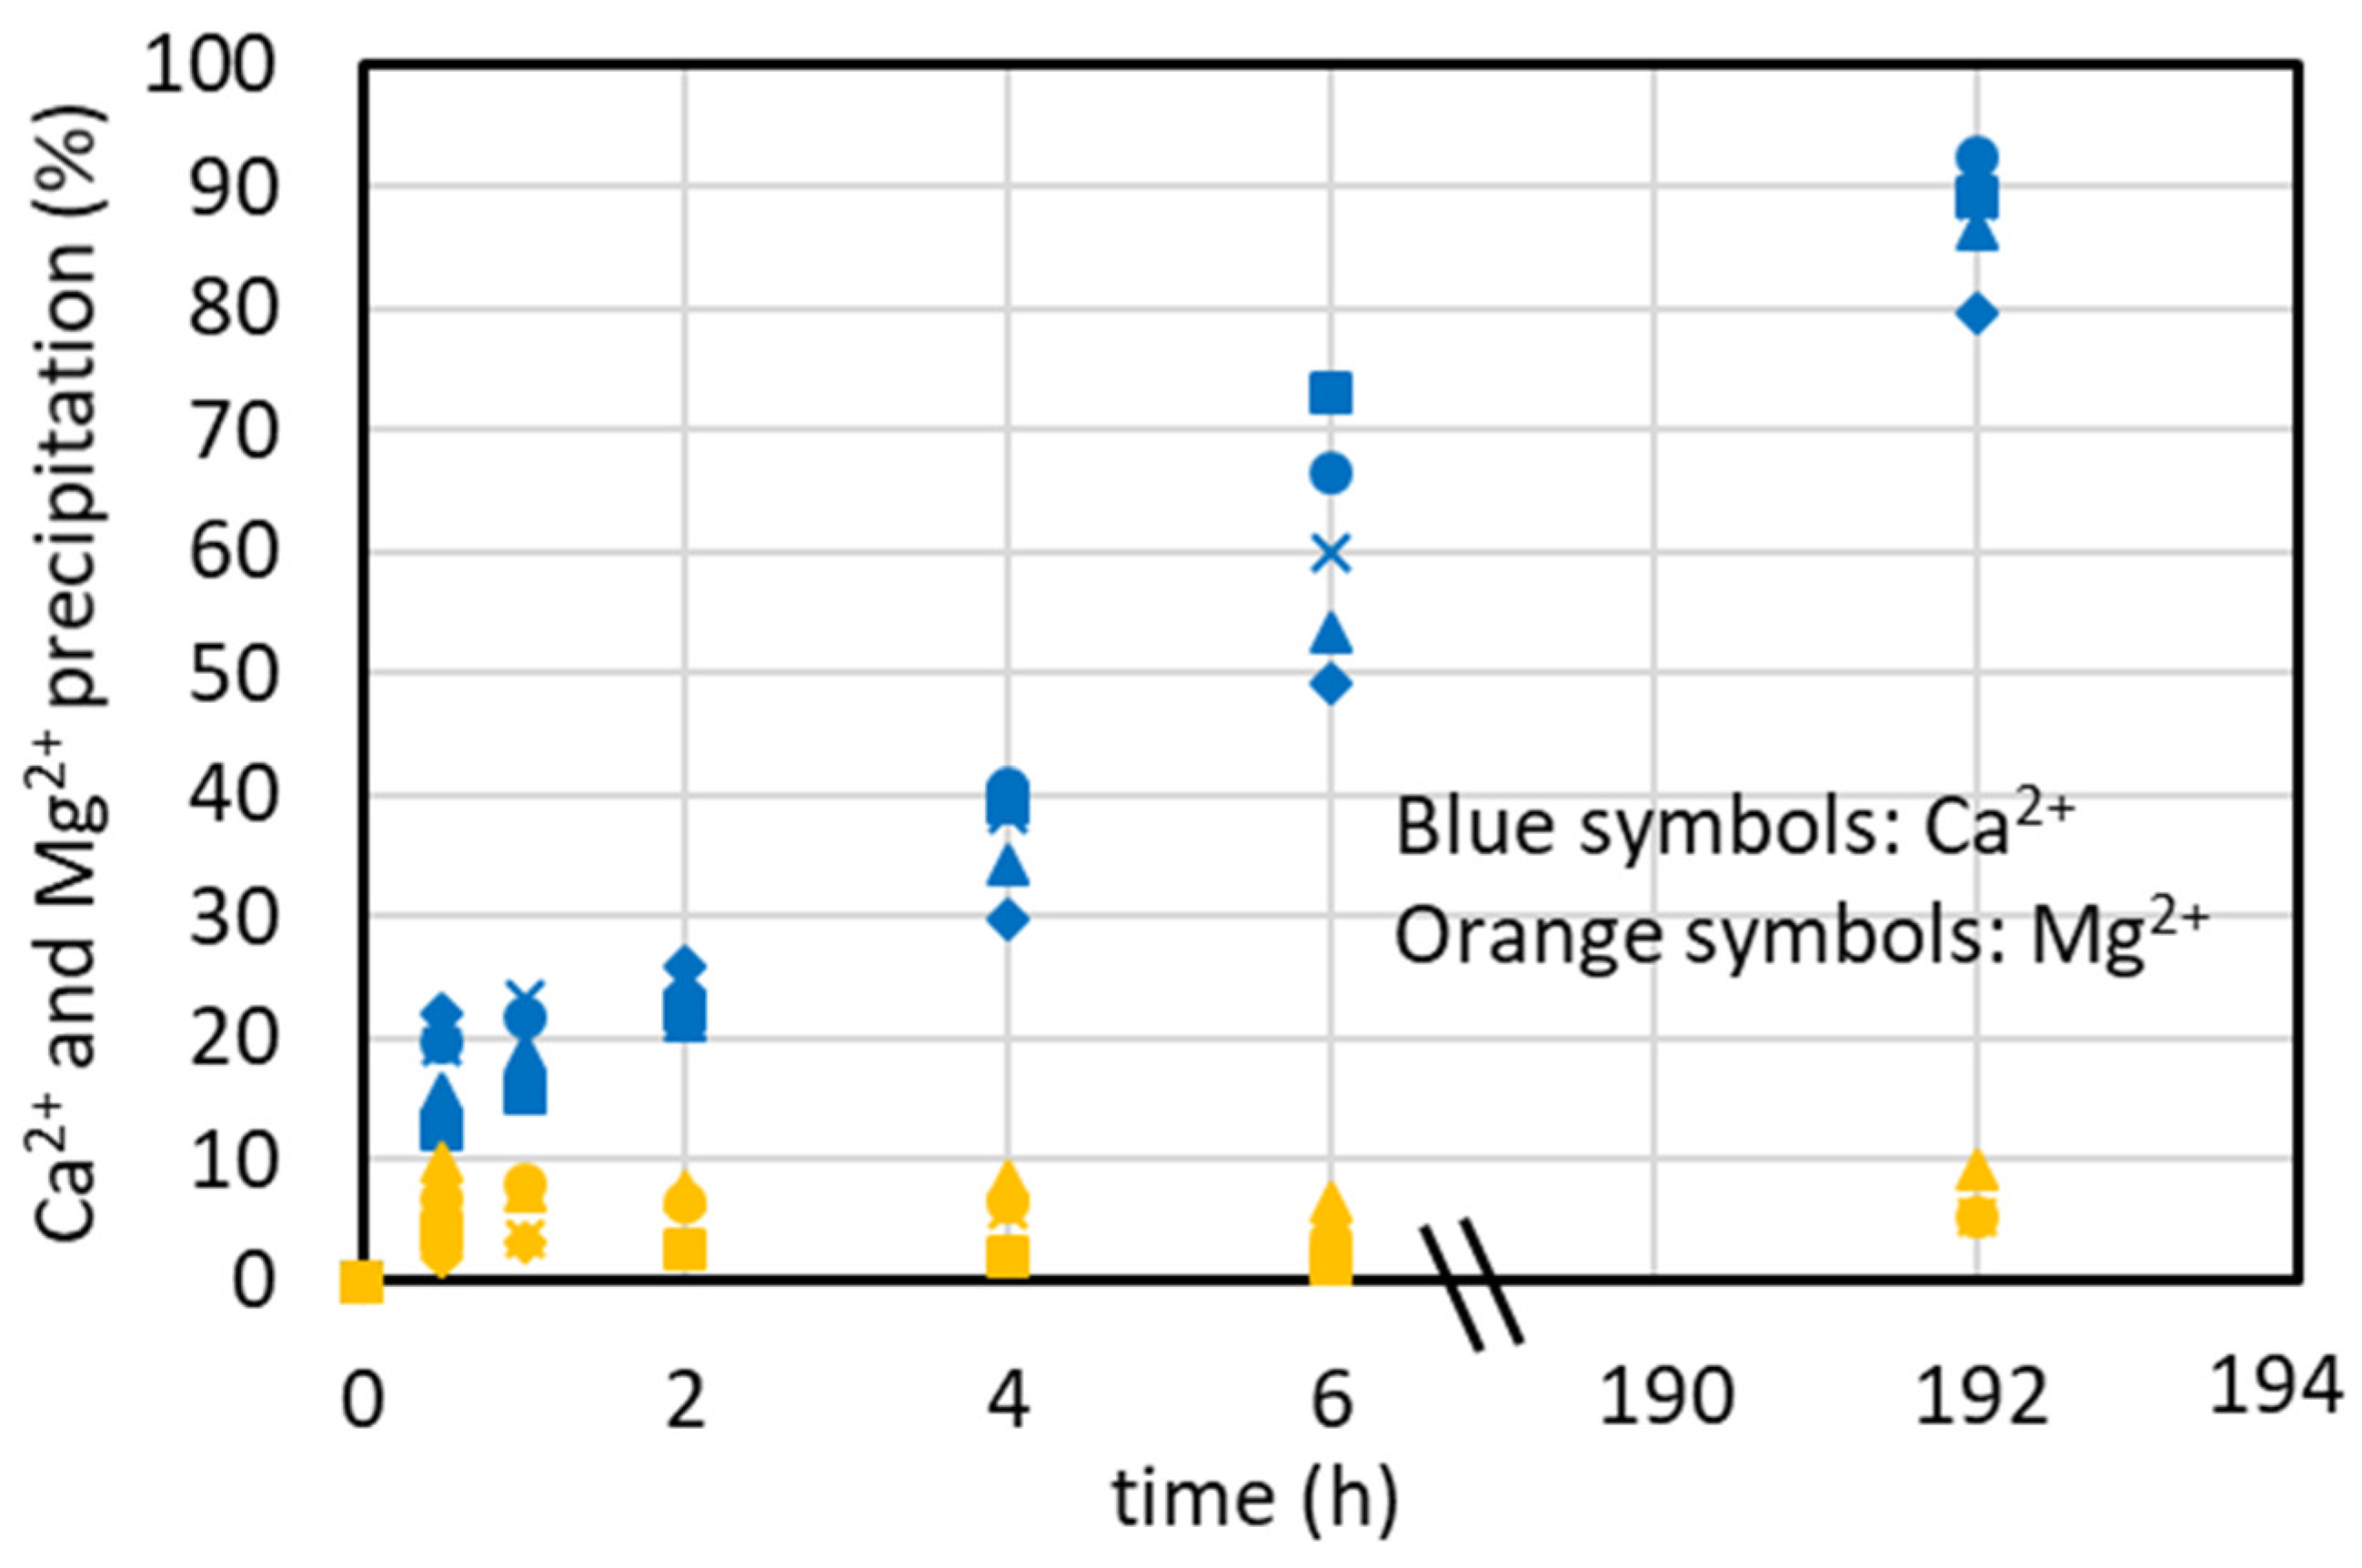
4.4. Effect of Initial Concentration of the Synthetic Brine on CaCO3 Precipitation Kinetics
4.5. CaCO3 Precipitation in Presence of Minor Ions
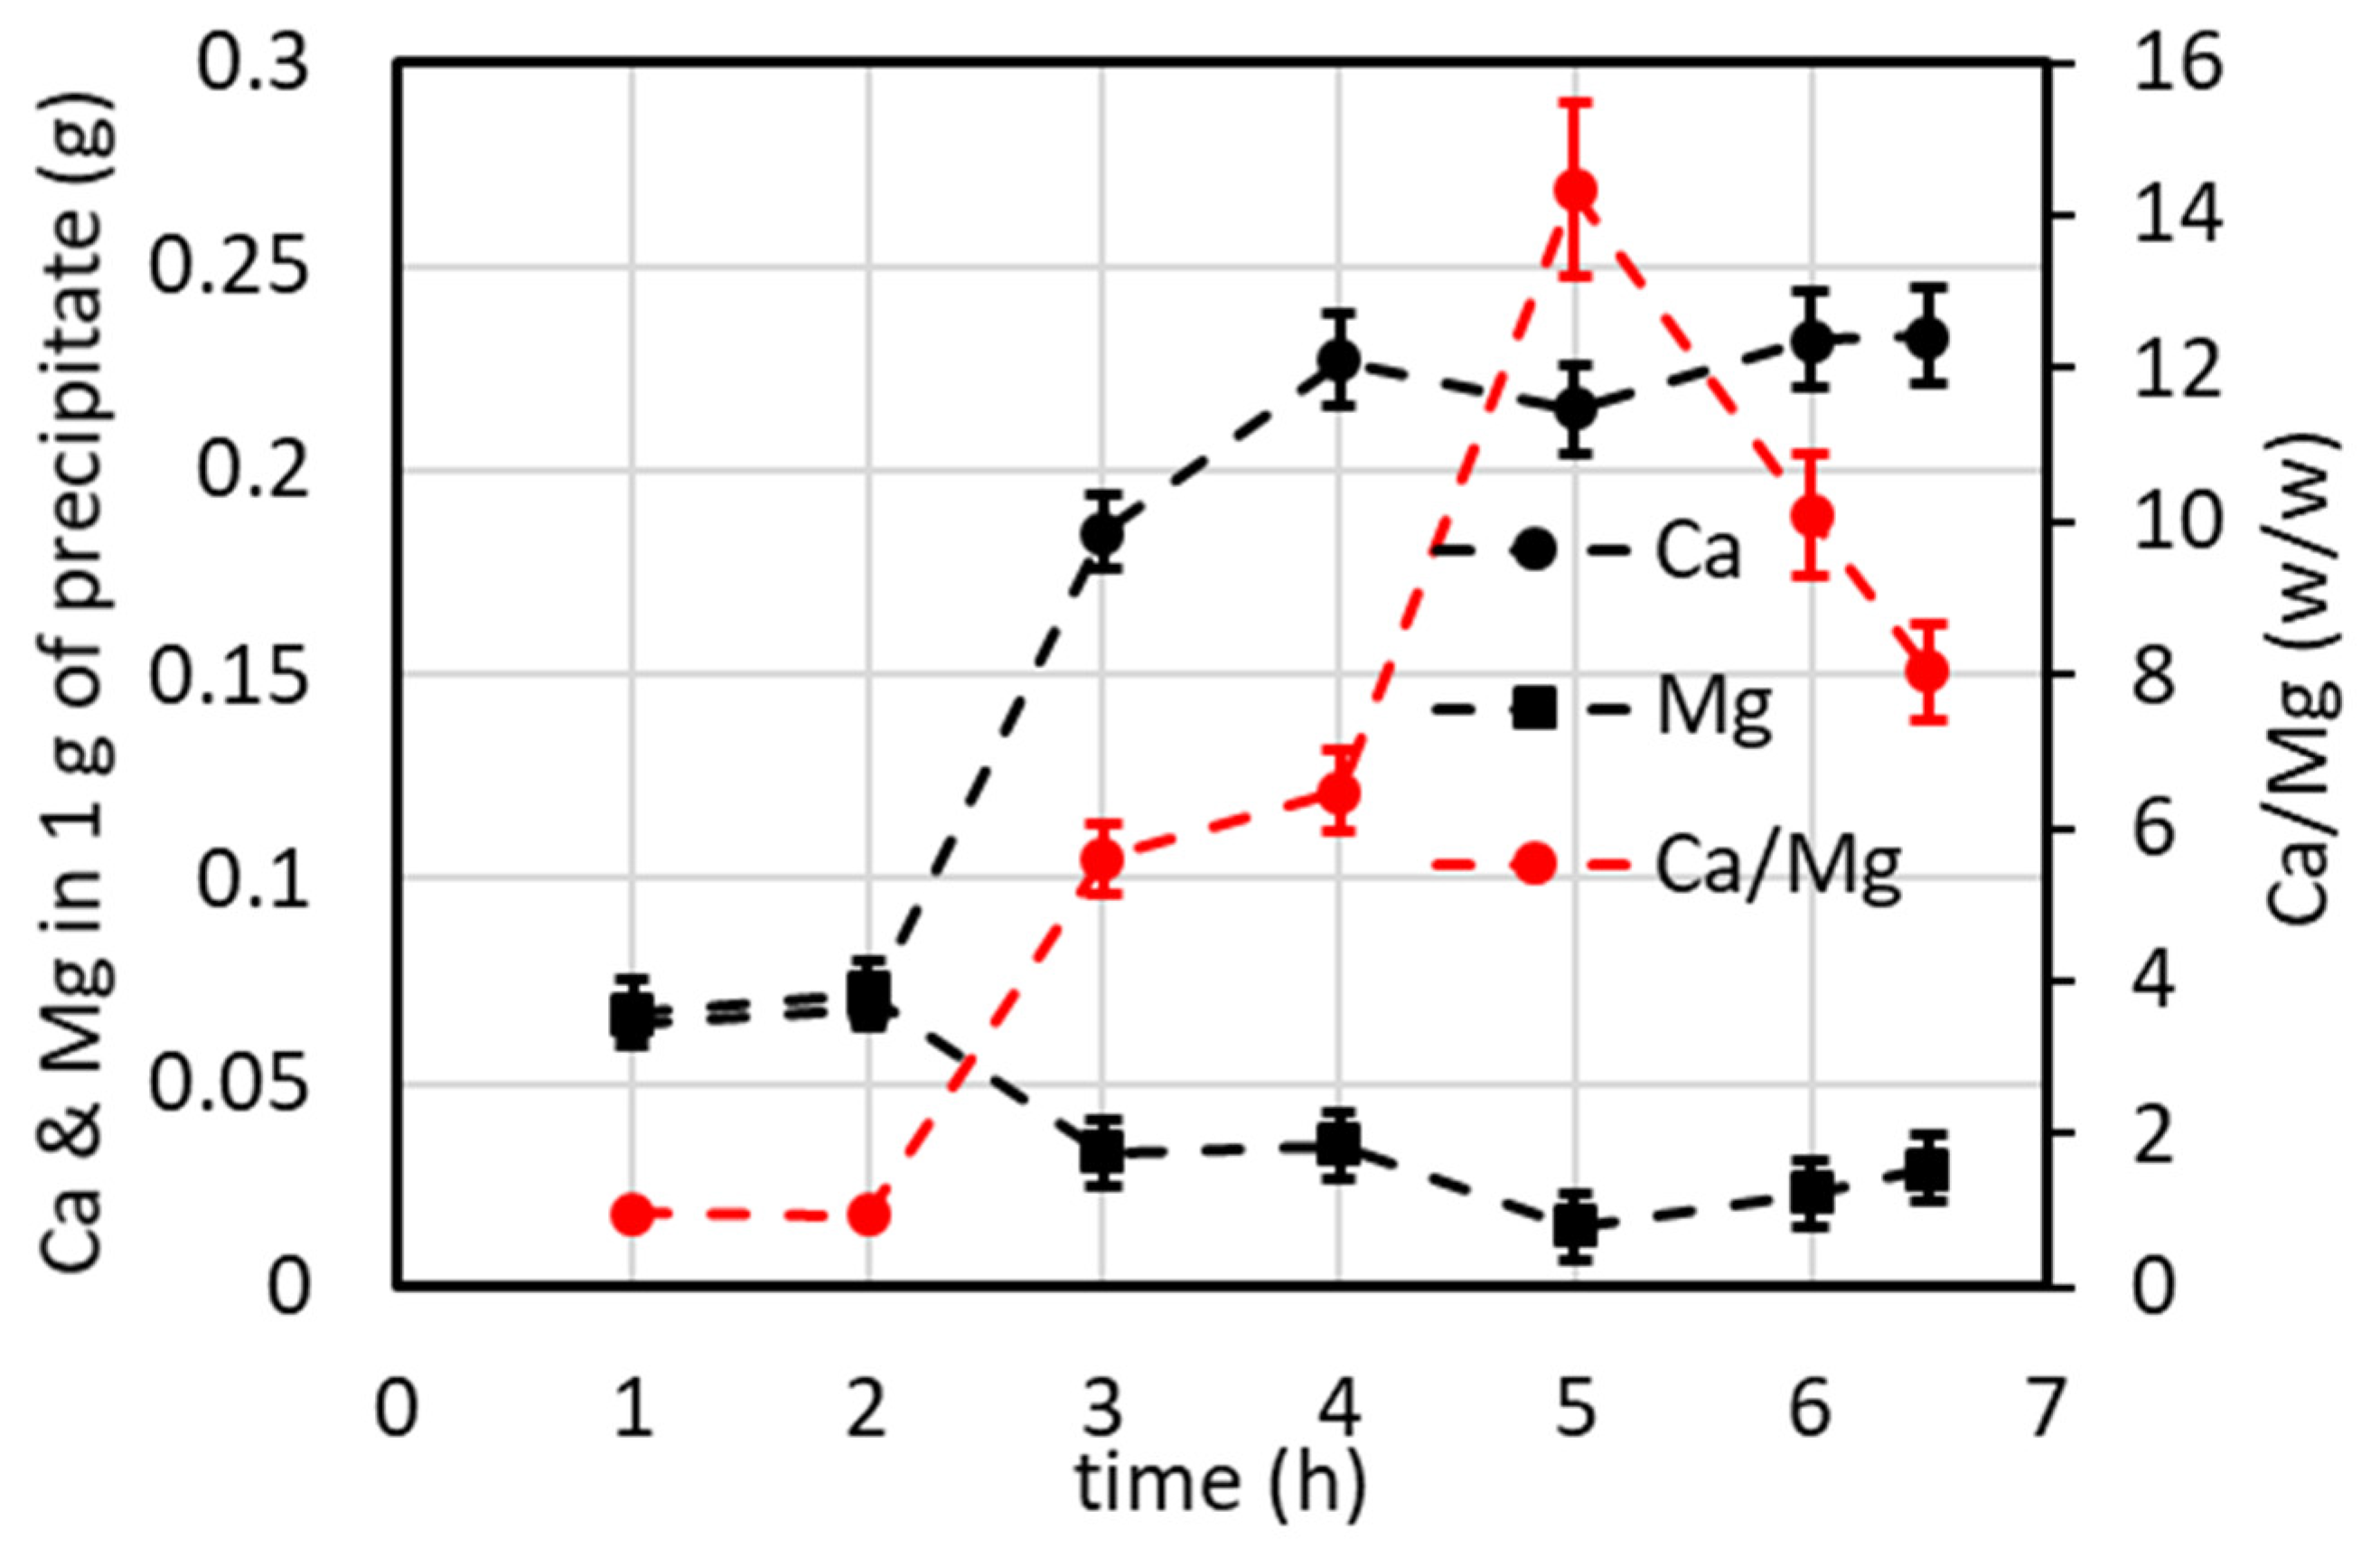
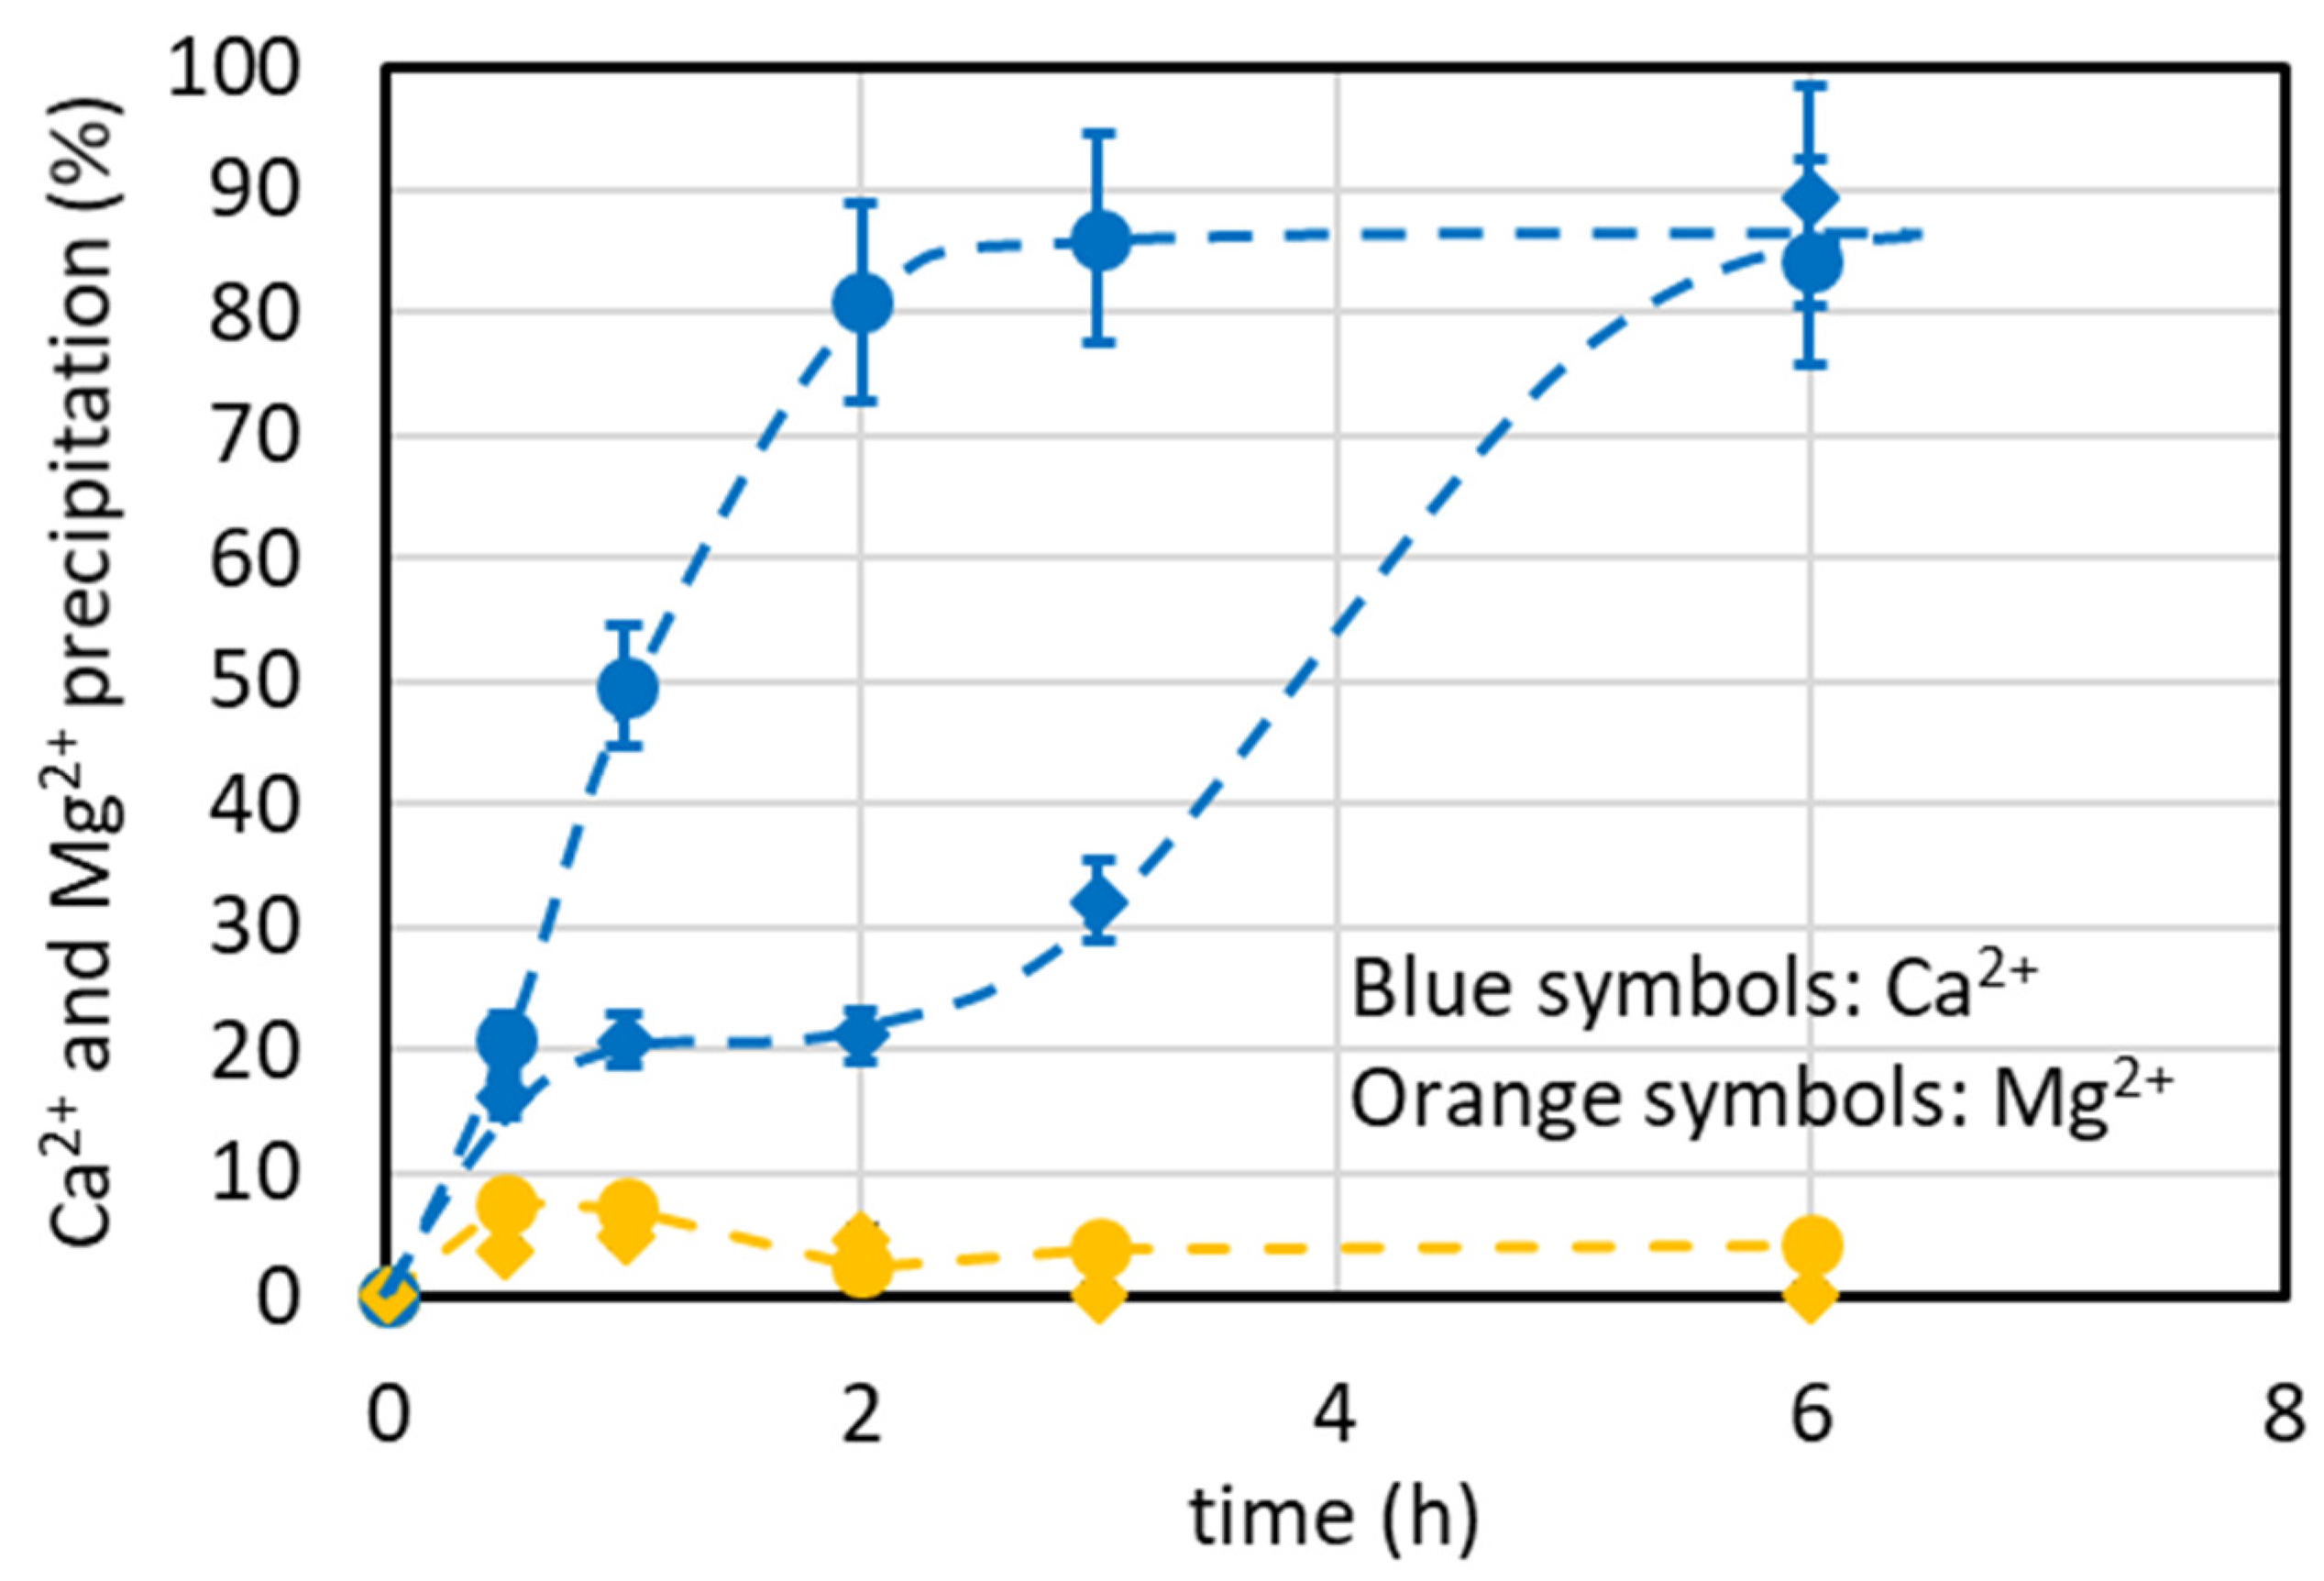
4.6. Ostwald Ripening’s Effect on CaCO3 Precipitation Selectivity
4.7. CaCO3 Precipitation Tests in the Lab-Scale Plant
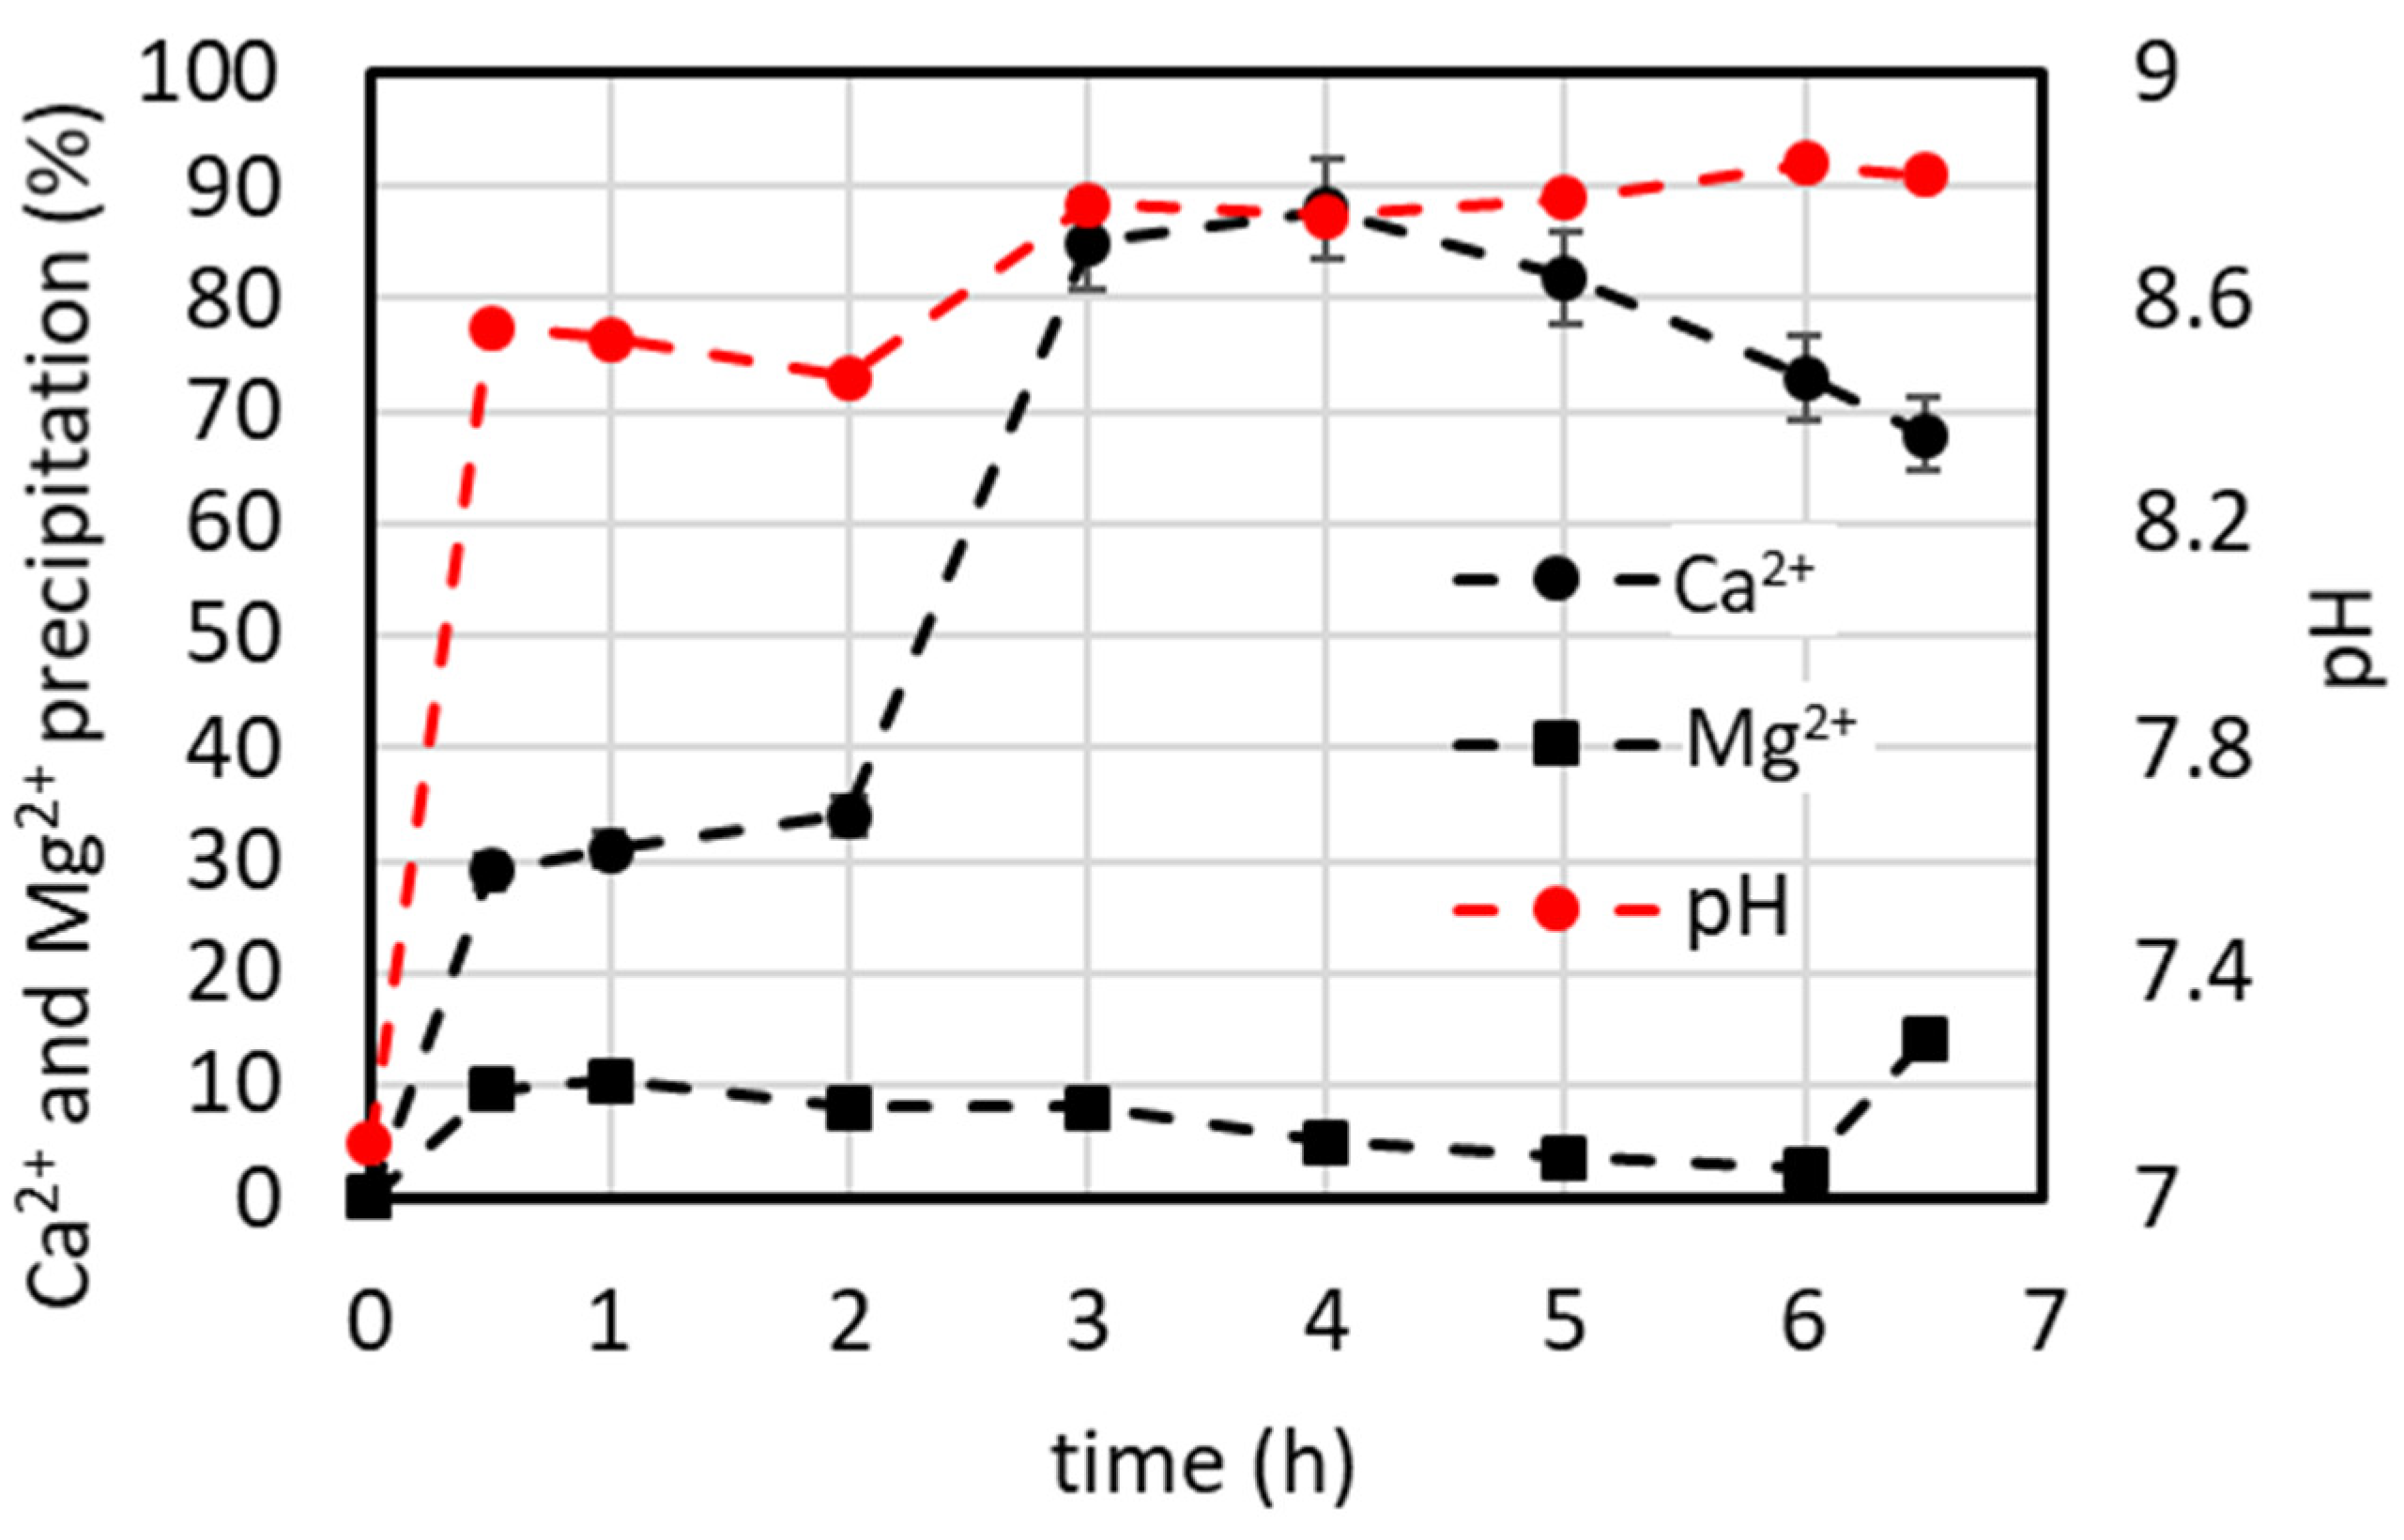
4.7.1. Lab-Scale Plant Operated in Continuous Mode (Including Minor Ions)
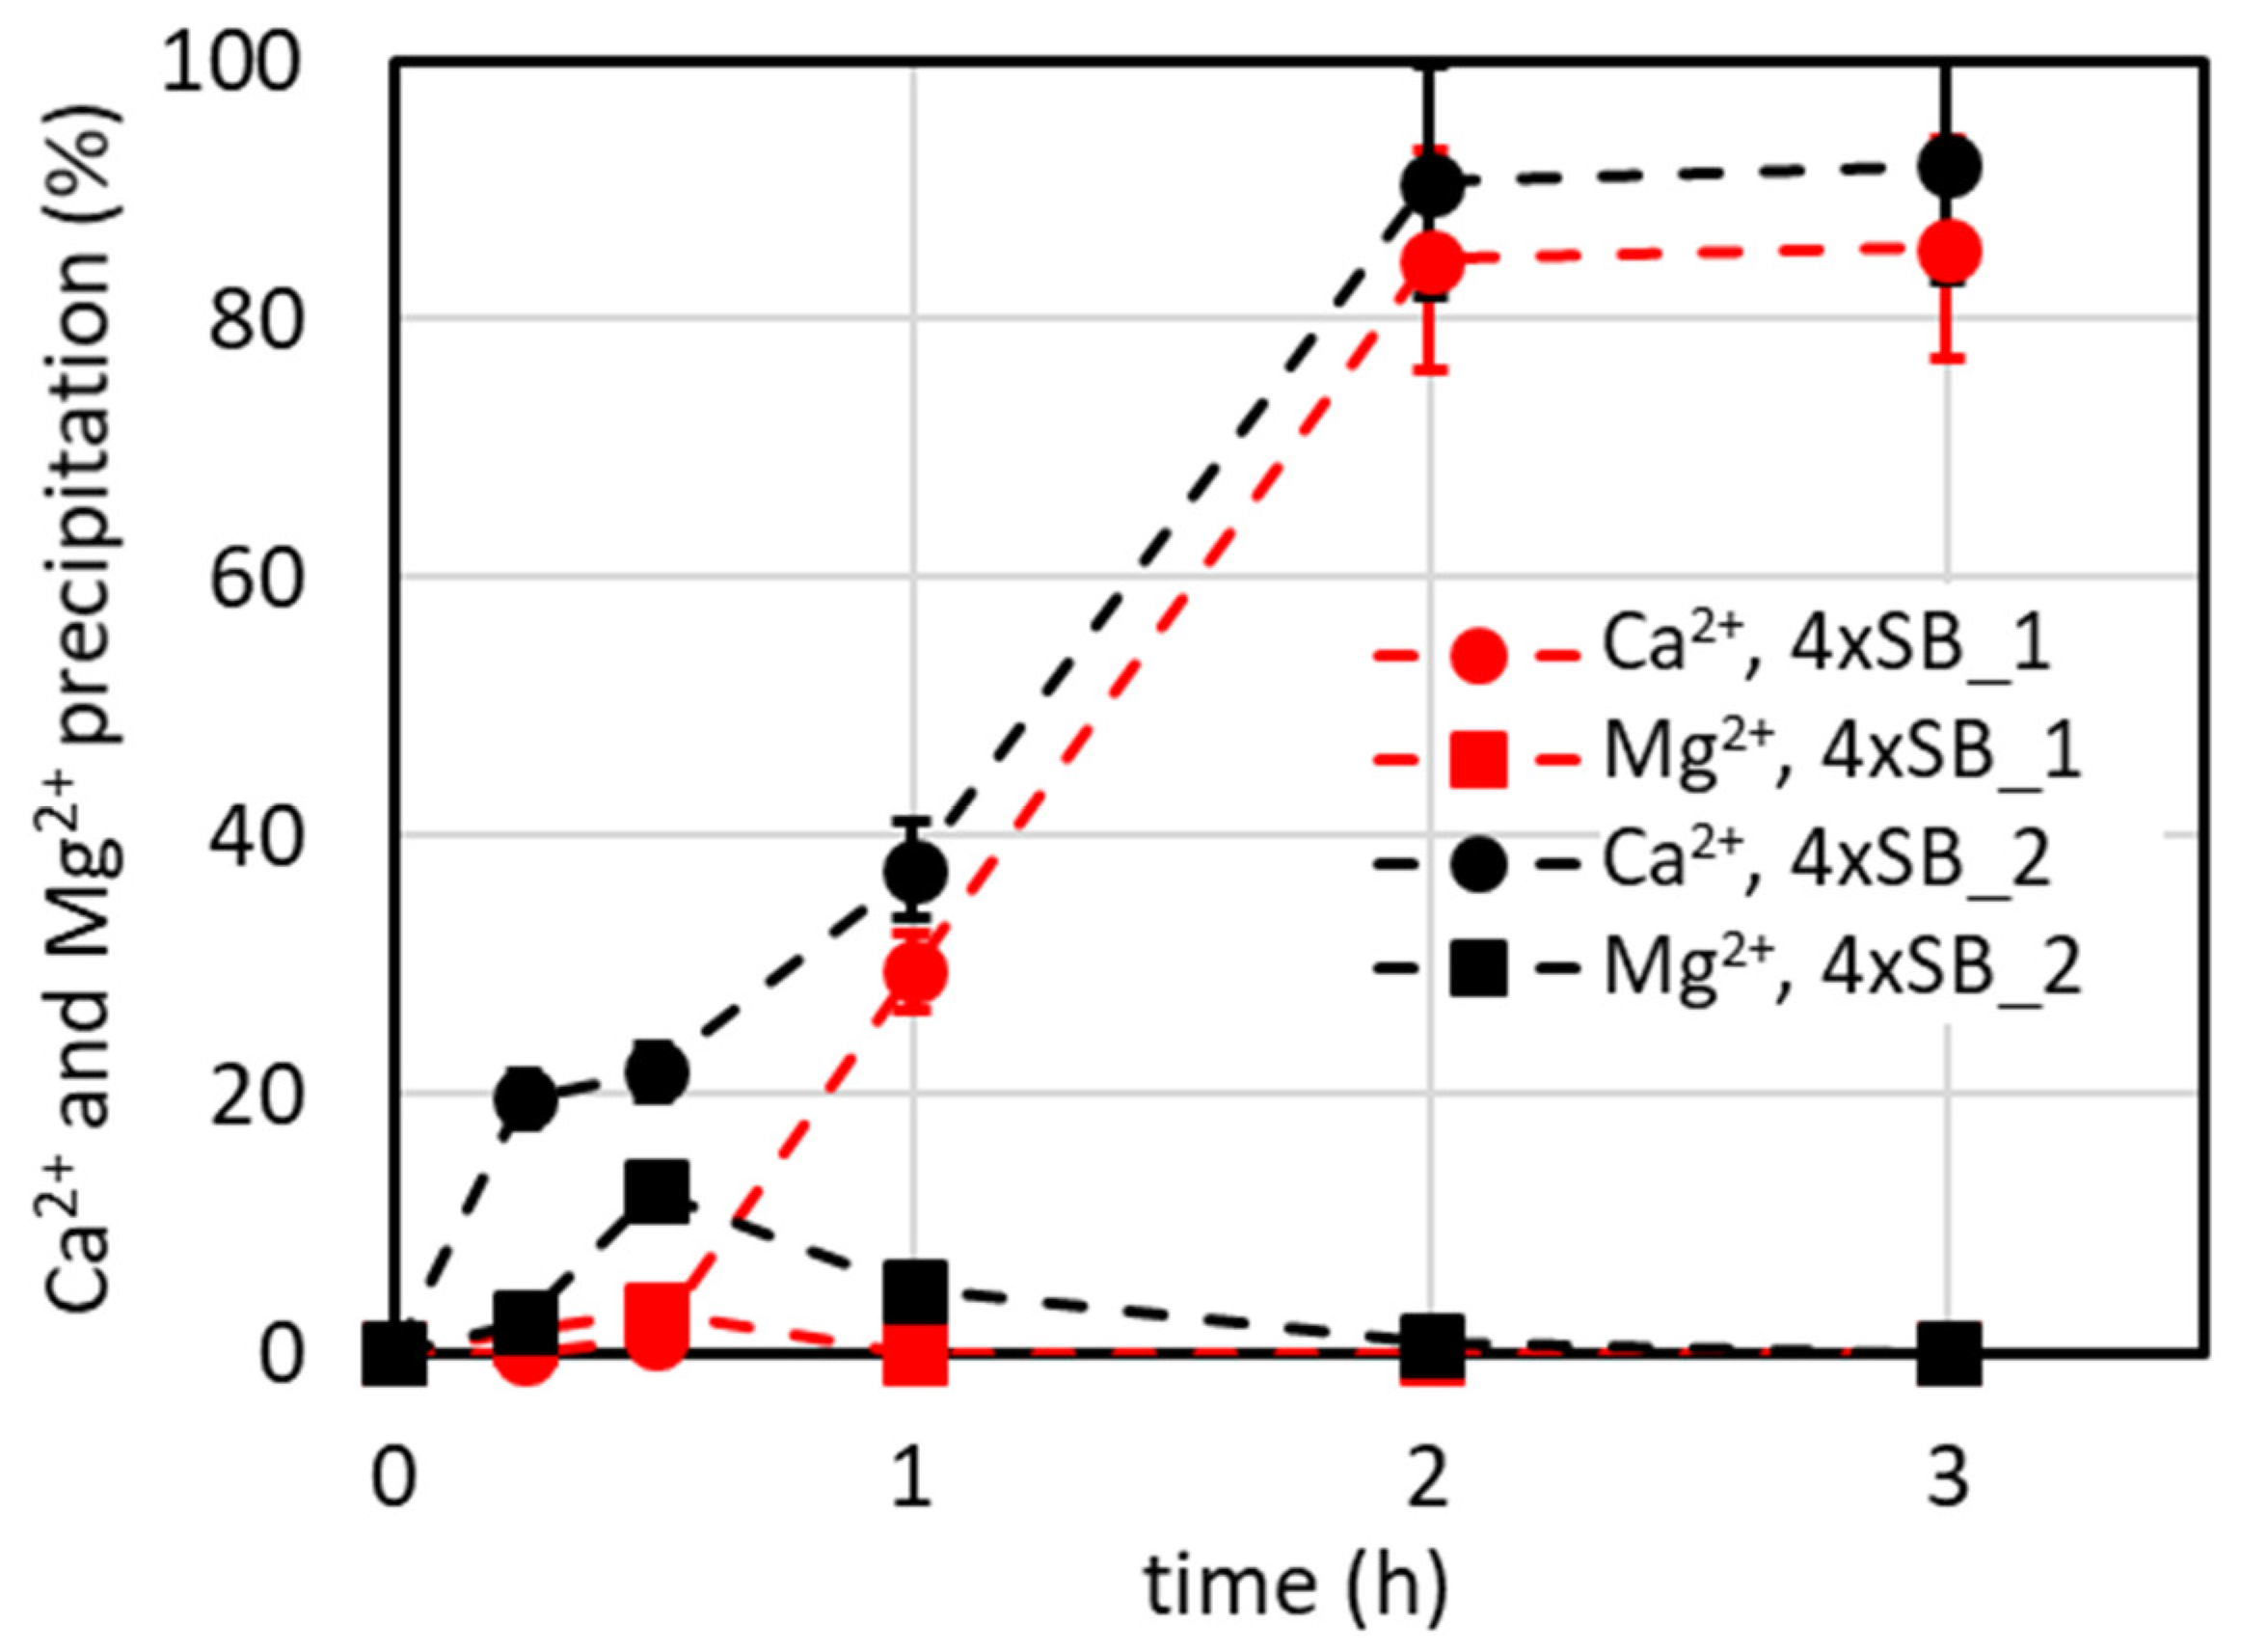
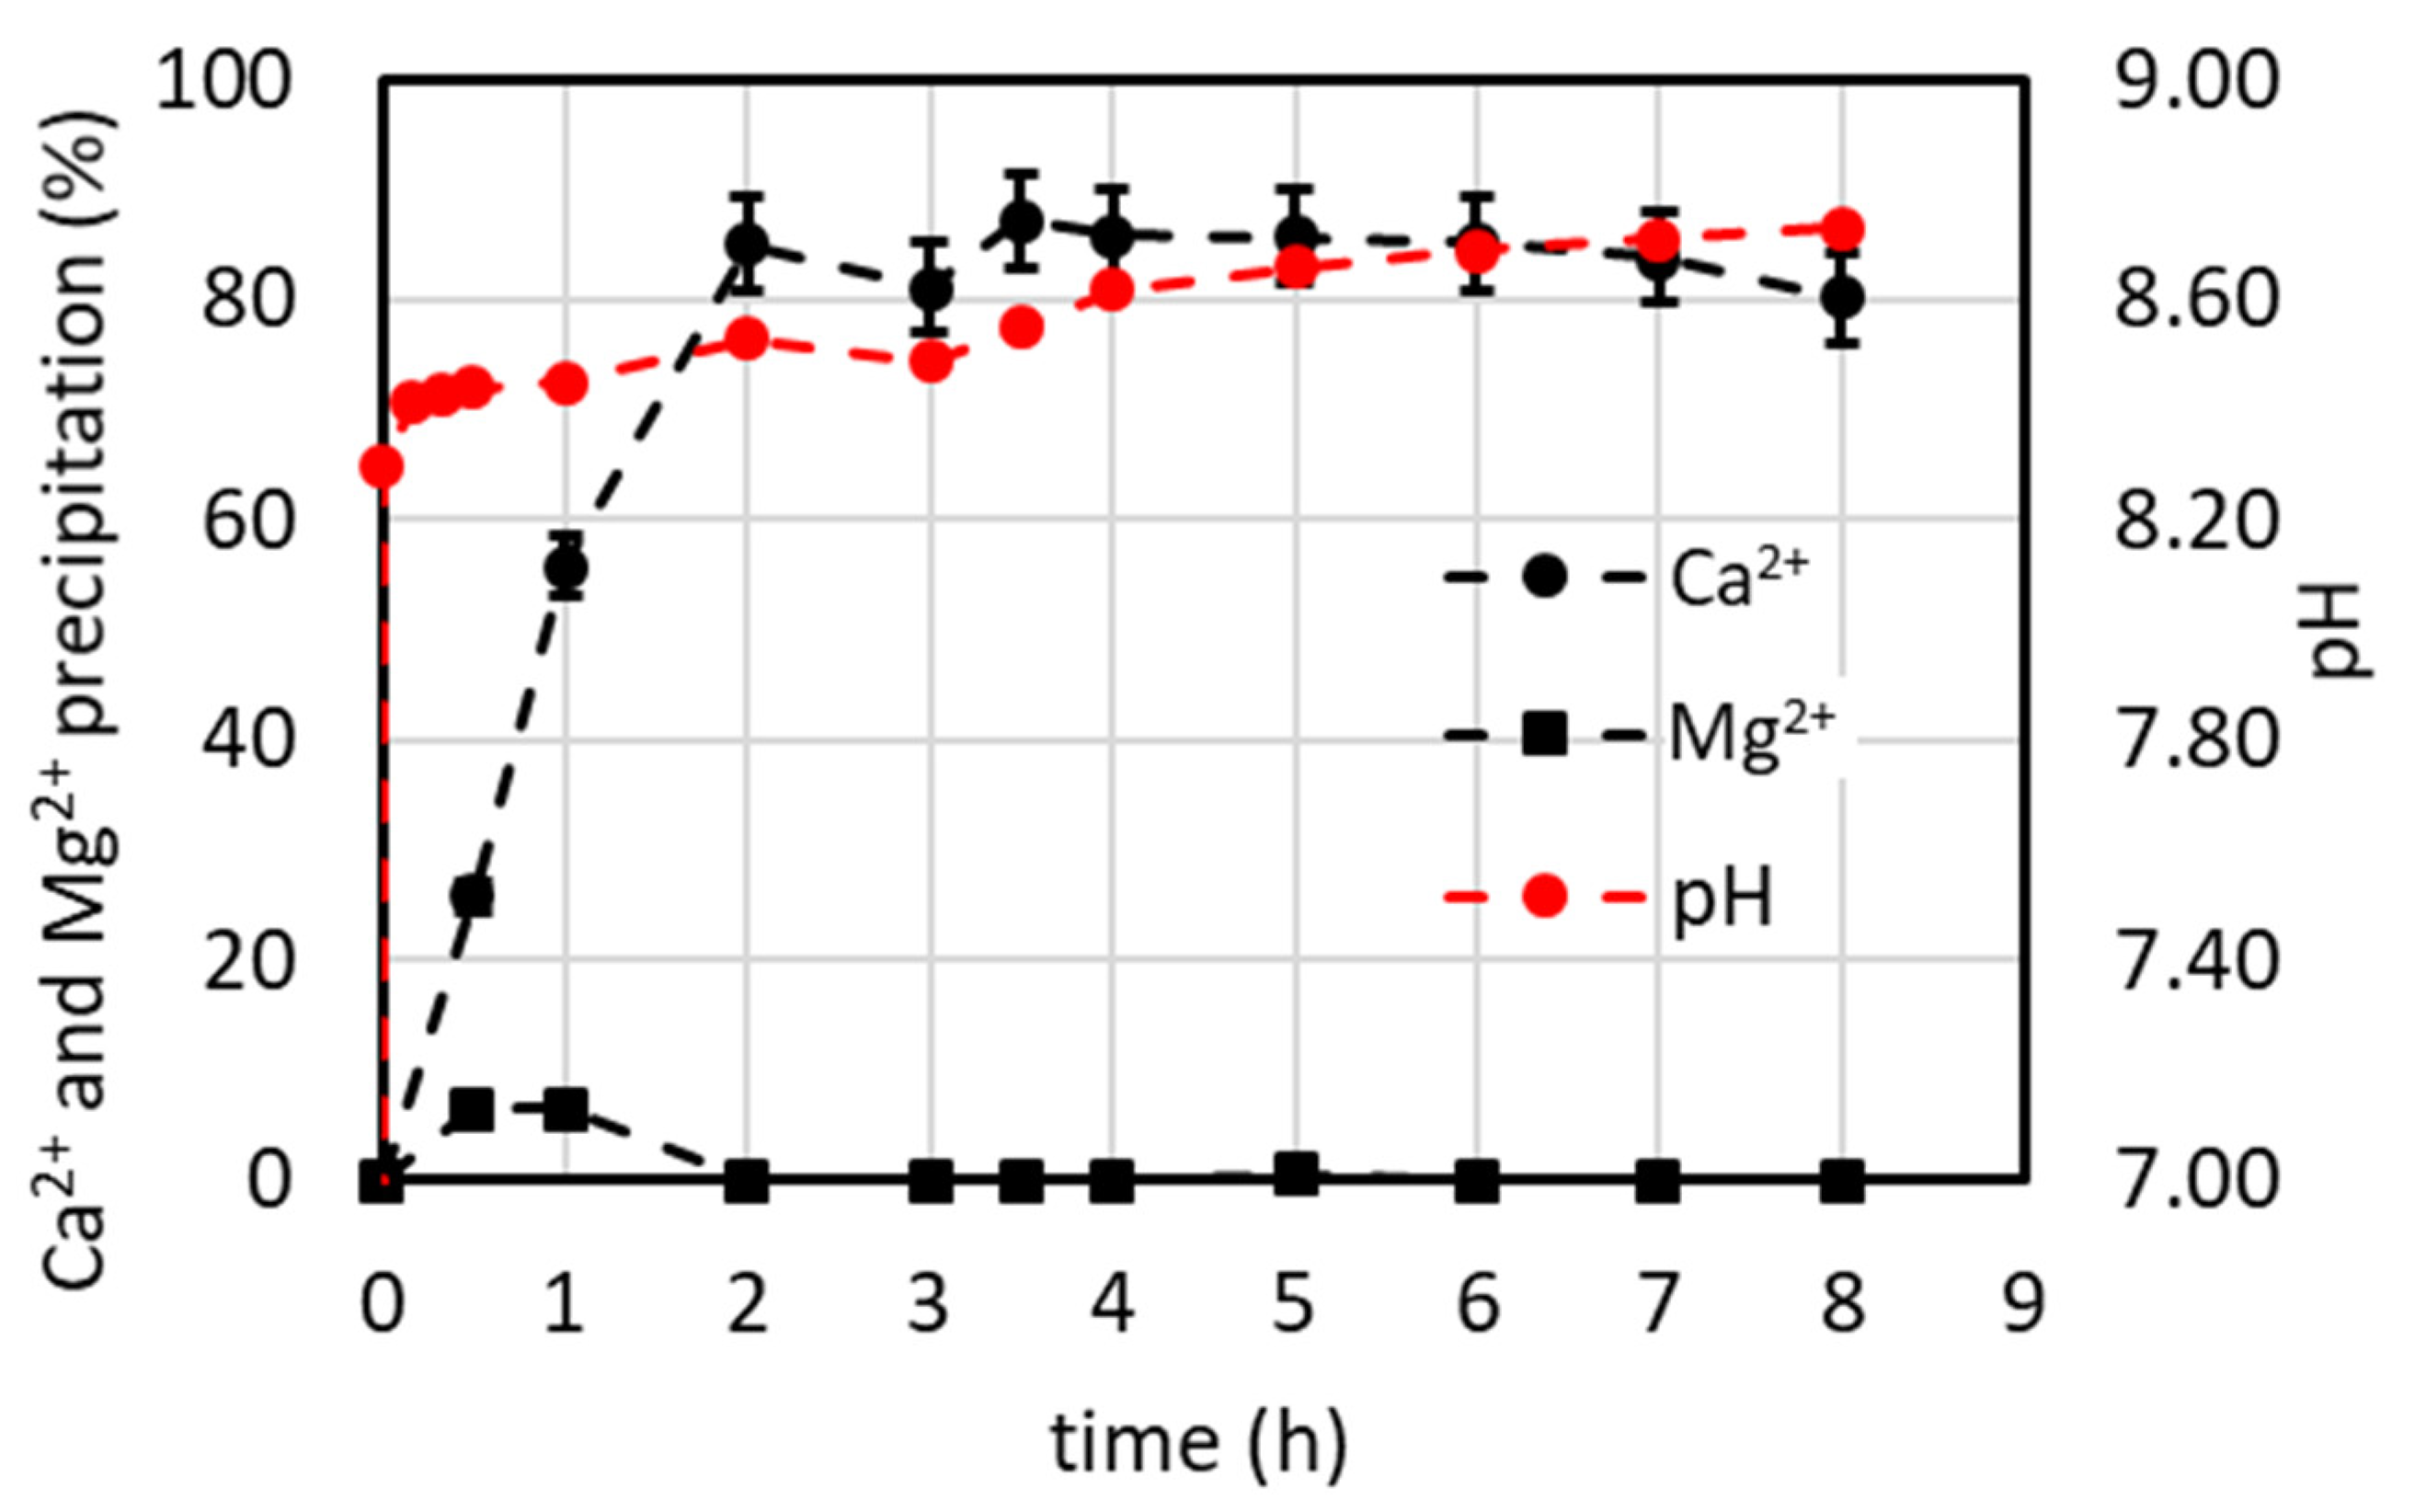
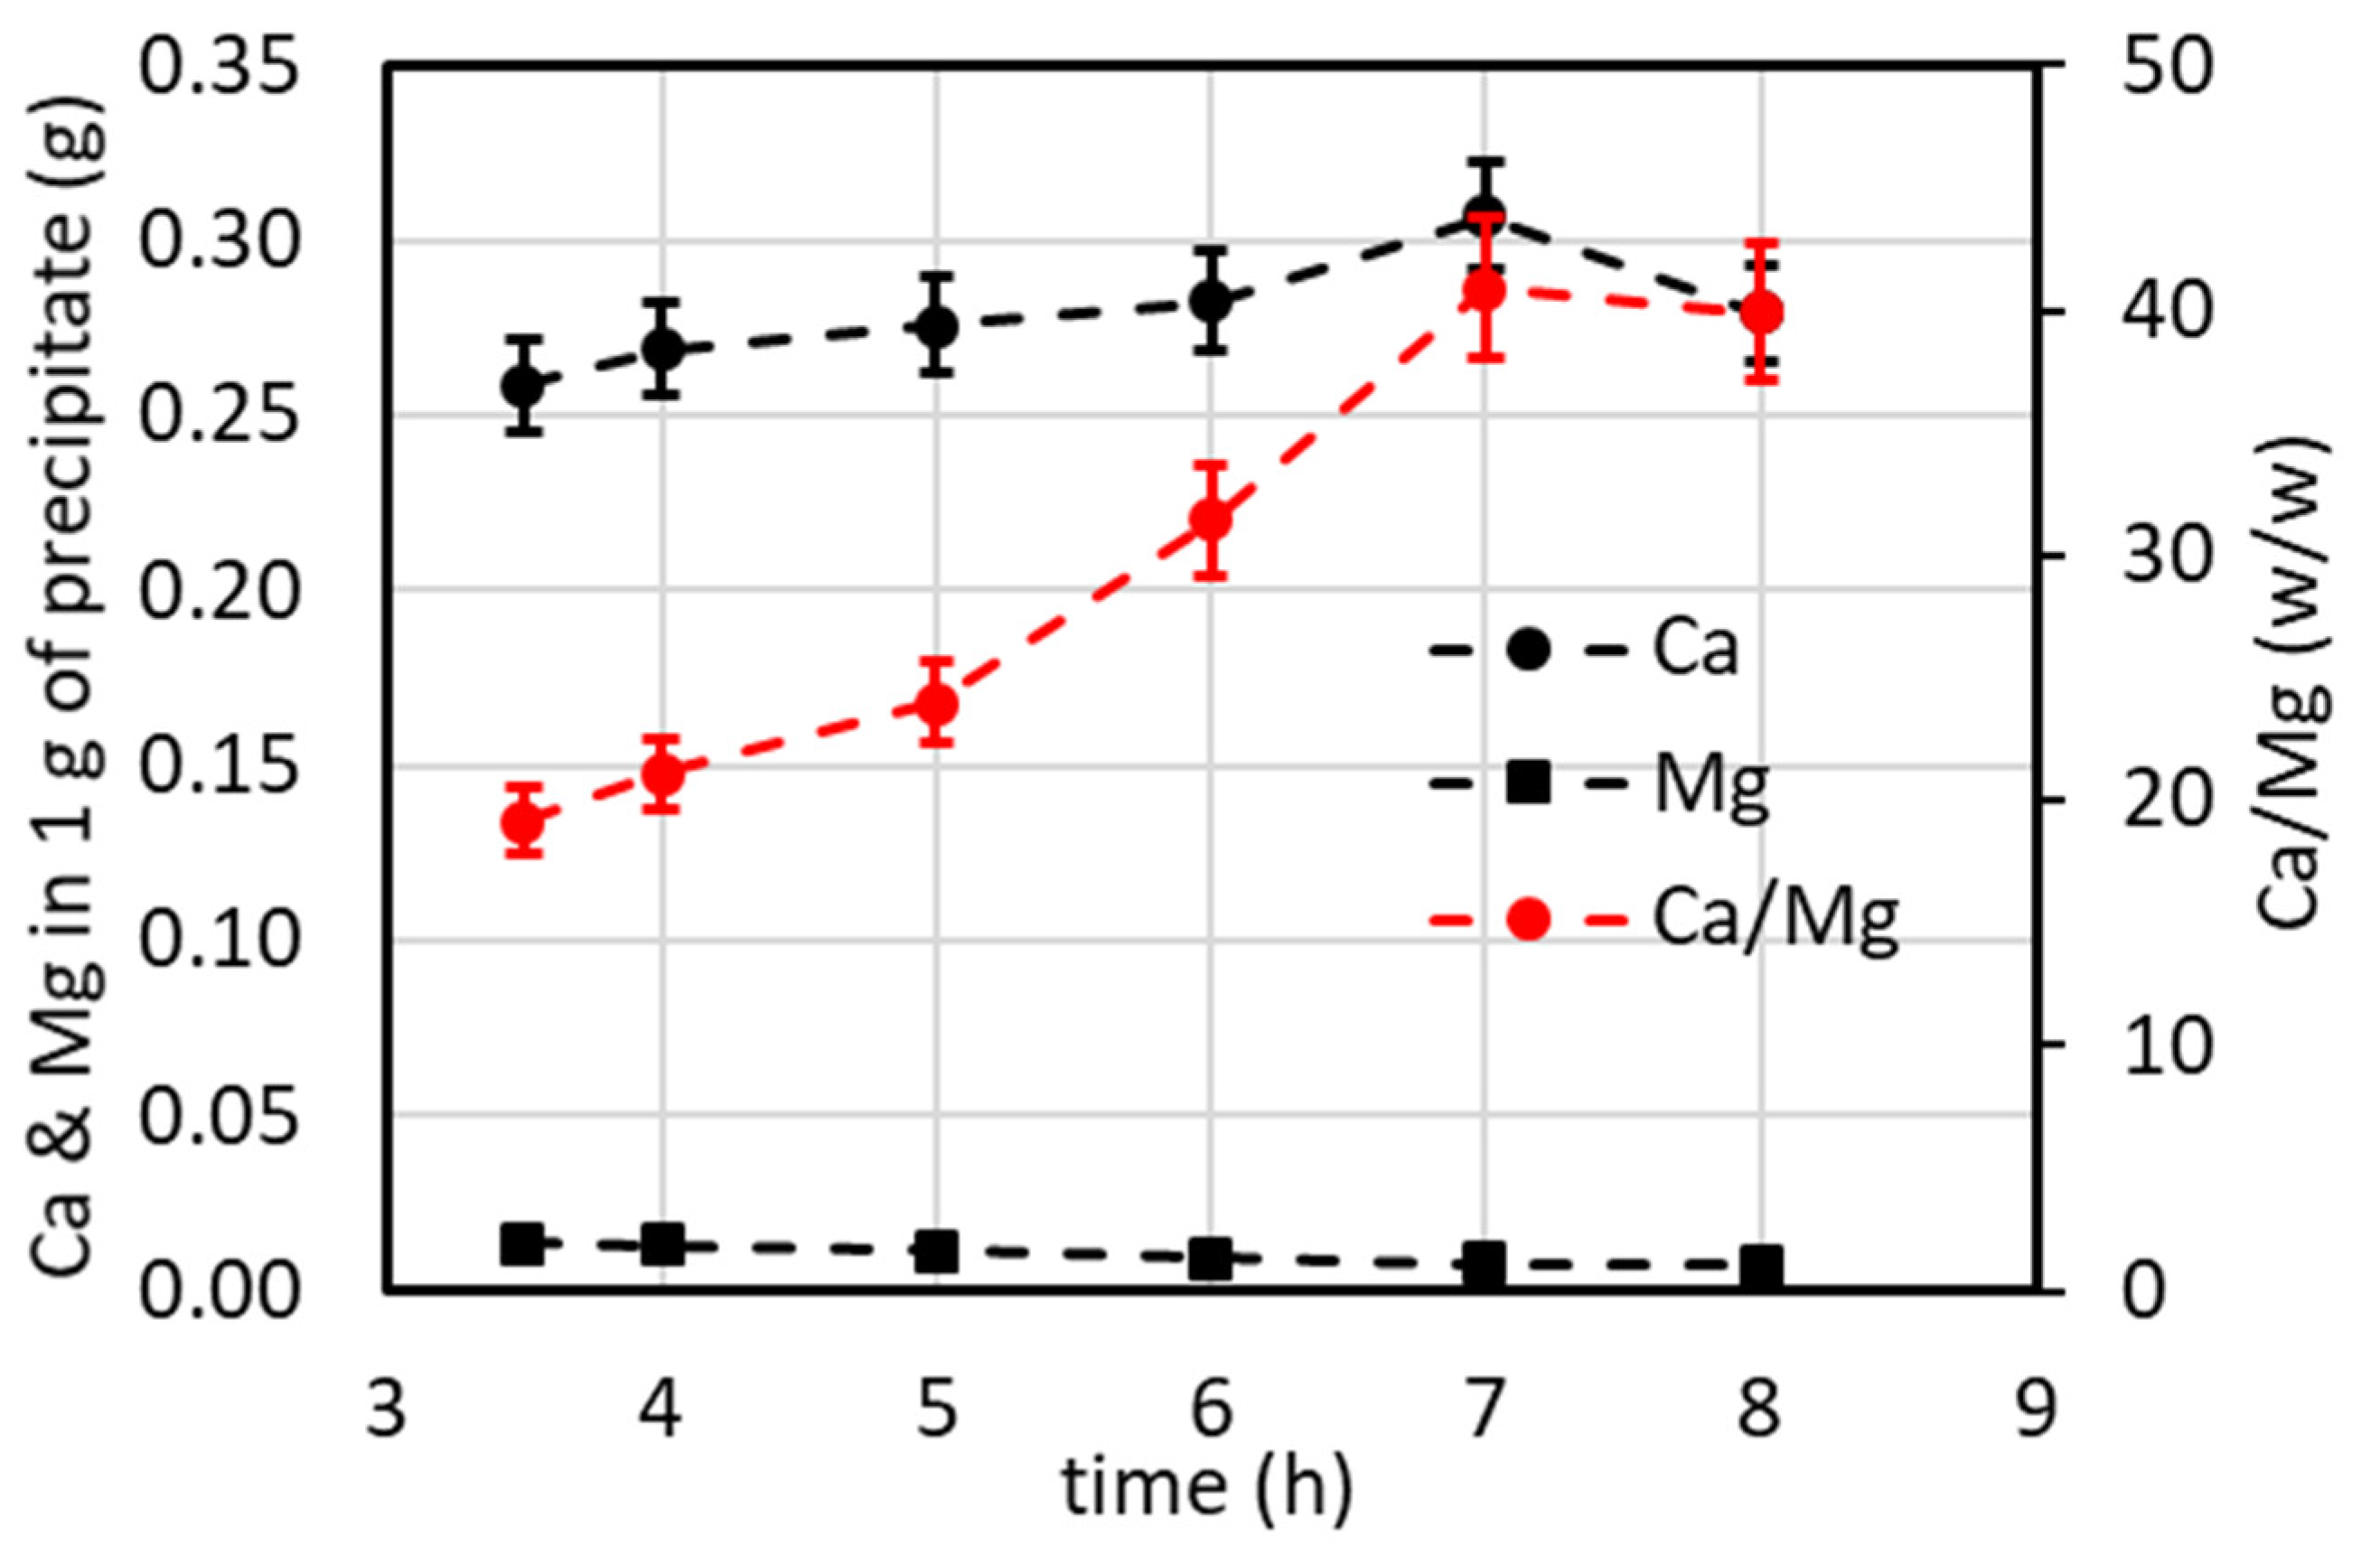
4.7.2. Lab-Scale Plant Operated in Batch and Continuous Modes (Excluding Minor Ions)
4.7.3. Conceptual Method of the Process of Selective Ca2+ Precipitation
4.8. Estimation of the Energy Saved in Ca Precipitation at Low vs. High Temperatures
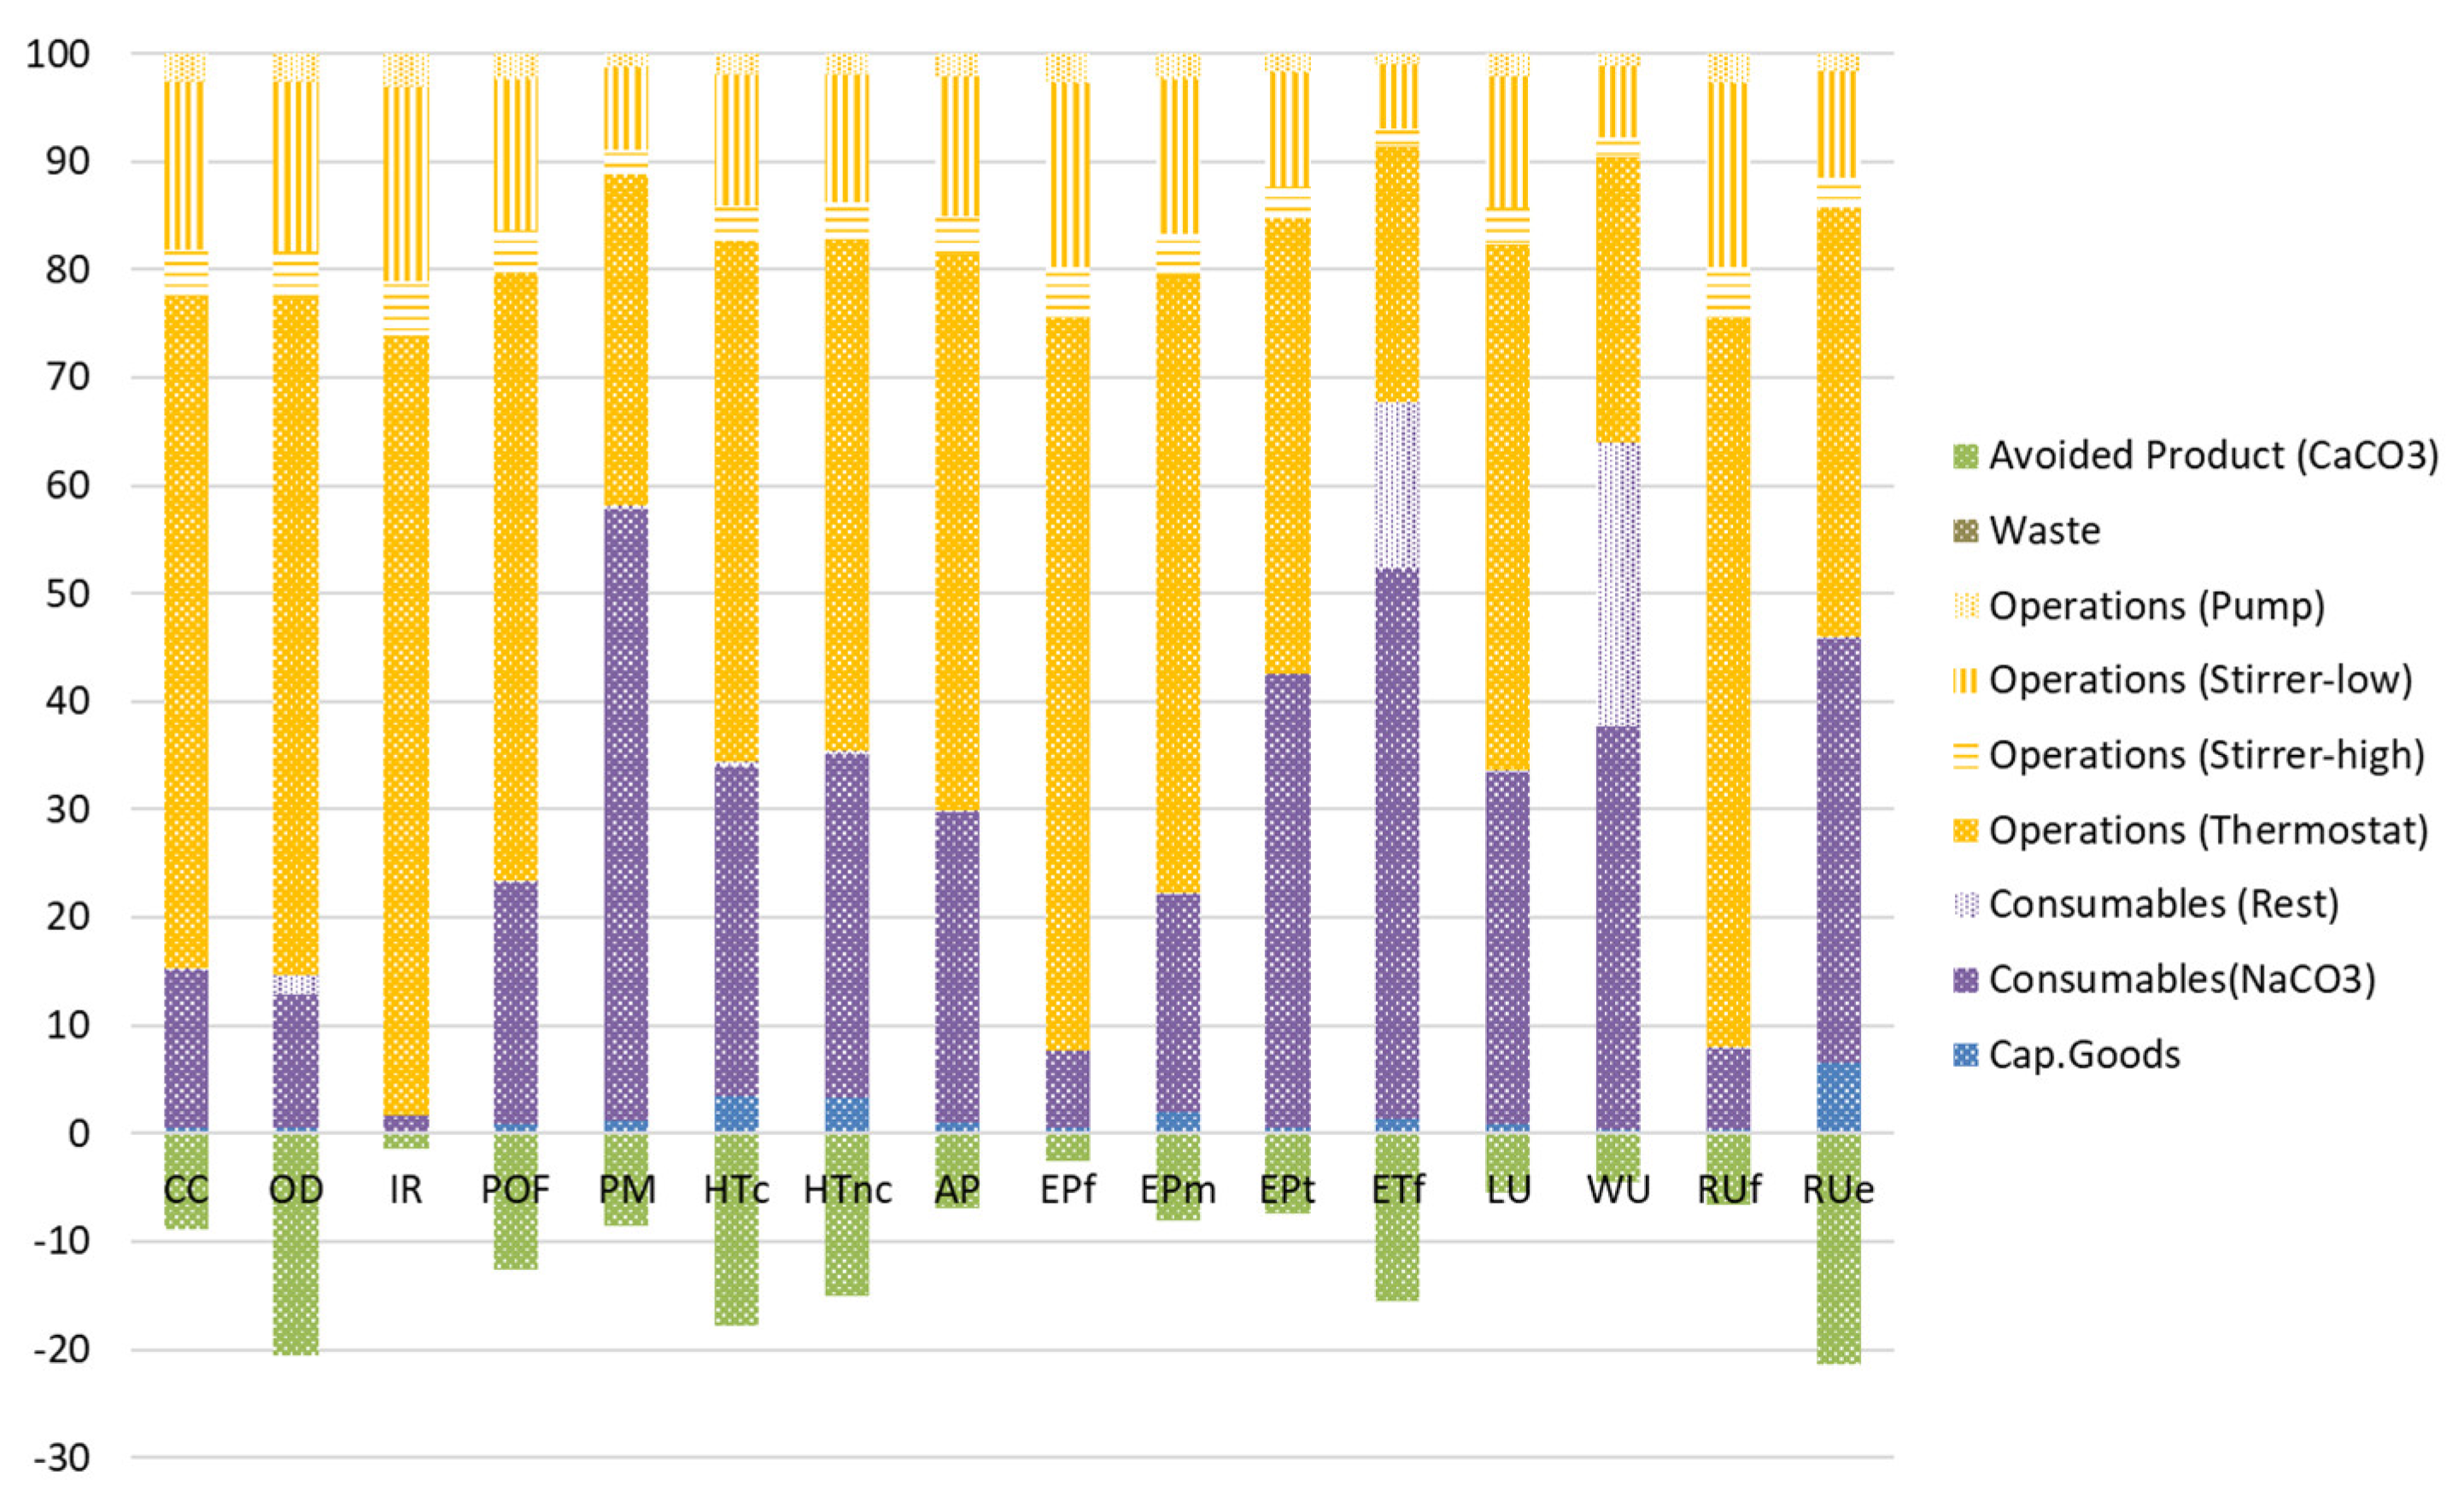
4.9. Life Cycle Impact Assessment
5. Conclusions
Supplementary Materials
Author Contributions
Funding
Data Availability Statement
Acknowledgments
Conflicts of Interest
References
- Sangeetha, A.; Shanmugan, S.; Alrubaie, A.J.; Jaber, M.M.; Panchal, H.; Attia, M.E.H.; Elsheikh, A.H.; Mevada, D.; Essa, F.A. A review on PCM and nanofluid for various productivity enhancement methods for double slope solar still: Future challenge and current water issues. Desalination 2023, 551, 116367. [Google Scholar] [CrossRef]
- Curto, D.; Franzitta, V.; Guercio, A. A review of the water desalination technologies. Appl. Sci. 2021, 11, 670. [Google Scholar] [CrossRef]
- Shah, K.M.; Billinge, I.H.; Chen, X.; Fan, H.; Huang, Y.; Winton, R.K.; Yip, N.Y. Drivers, challenges, and emerging technologies for desalination of high-salinity brines: A critical review. Desalination 2022, 538, 115827. [Google Scholar] [CrossRef]
- Mauter, M.S.; Fiske, P.S. Desalination for a circular water economy. Energy Environ. Sci. 2020, 13, 3180–3184. [Google Scholar] [CrossRef]
- Panagopoulos, A.; Haralambous, K.-J.; Loizidou, M. Desalination brine disposal methods and treatment technologies—A review. Sci. Total Environ. 2019, 693, 133545. [Google Scholar] [CrossRef] [PubMed]
- Elsheniti, M.B.; Ibrahim, A.; Elsamni, O.; Elewa, M. Experimental and economic investigation of sweeping gas membrane distillation/pervaporation modules using novel pilot scale device. Sep. Purif. Technol. 2023, 310, 123165. [Google Scholar] [CrossRef]
- Al-Obaidi, M.; Alsarayreh, A.; Al-Hroub, A.; Alsadaie, S.; Mujtaba, I. Performance analysis of a medium-sized industrial reverse osmosis brackish water desalination plant. Desalination 2018, 443, 272–284. [Google Scholar] [CrossRef]
- Panagopoulos, A.; Haralambous, K.-J. Minimal Liquid Discharge (MLD) and Zero Liquid Discharge (ZLD) strategies for wastewater management and resource recovery—Analysis, challenges and prospects. J. Environ. Chem. Eng. 2020, 8, 104418. [Google Scholar] [CrossRef]
- Mero, J.L. The mineral resources of the sea. Geol. Mag. 1965, 102, 565. [Google Scholar] [CrossRef]
- European Commission, Directorate-General for Internal Market, Industry, Entrepreneurship and SMEs; Blengini, G.; El Latunussa, C.; Eynard, U.; Torres De Matos, C.; Wittmer, D.; Georgitzikis, K.; Pavel, C.; Carrara, S.; Mancini, L.; et al. Study on the EU’s List of Critical Raw Materials (2020); final report; Publications Office of the European Union. 2020. Available online: https://data.europa.eu/doi/10.2873/11619 (accessed on 9 January 2024).
- Bhandari, M.; Kharkwal, S.; Prajapati, S.K. Recycling drinking water RO reject for microalgae-mediated resource recovery. Resour. Conserv. Recycl. 2023, 188, 106699. [Google Scholar] [CrossRef]
- Yoon, T.J.; Sharan, P.; Craddock, E.P.; Lewis, J.C.; Matteson, J.A.; Seong, J.G.; Singh, R.P.; Maerzke, K.A.; Currier, R.P.; Findikoglu, A.T. Selective recovery of critical materials in zero-liquid discharge supercritical water desalination. Desalination 2022, 537, 115849. [Google Scholar] [CrossRef]
- Figueira, M.; Rodríguez-Jiménez, D.; López, J.; Reig, M.; Cortina, J.L.; Valderrama, C. Experimental and economic evaluation of nanofiltration as a pre-treatment for added-value elements recovery from seawater desalination brines. Desalination 2023, 549, 116321. [Google Scholar] [CrossRef]
- Cucurachi, S.; van der Giesen, C.; Guinée, J. Ex-ante LCA of Emerging Technologies. Procedia CIRP 2018, 69, 463–468. [Google Scholar] [CrossRef]
- Giwa, A.; Dufour, V.; Al Marzooqi, F.; Al Kaabi, M.; Hasan, S.W. Brine management methods: Recent innovations and current status. Desalination 2017, 407, 1–23. [Google Scholar] [CrossRef]
- Pérez-González, A.; Ibáñez, R.; Gómez, P.; Urtiaga, A.M.; Ortiz, I.; Irabien, J.A. Recovery of desalination brines: Separation of calcium, magnesium and sulfate as a pre-treatment step. Desalination Water Treat. 2014, 56, 3617–3625. [Google Scholar] [CrossRef]
- Zhao, J.; Wang, M.; Lababidi, H.M.S.; Al-Adwani, H.; Gleason, K.K. A review of heterogeneous nucleation of calcium carbonate and control strategies for scale formation in multi-stage flash (MSF) desalination plants. Desalination 2018, 442, 75–88. [Google Scholar] [CrossRef]
- Antony, A.; Low, J.H.; Gray, S.; Childress, A.E.; Le-Clech, P.; Leslie, G. Scale formation and control in high pressure membrane water treatment systems: A review. J. Membr. Sci. 2011, 383, 1–16. [Google Scholar] [CrossRef]
- Cruz, C.; Herrera-León, S.; Calisaya-Azpilcueta, D.; Salazar, R.; Cisternas, L.A.; Kraslawski, A. Using Waste Brine from Desalination Plant as a Source of Industrial Water in Copper Mining Industry. Minerals 2022, 12, 1162. [Google Scholar] [CrossRef]
- Mahmud, N.; Alvarez, D.V.F.; Ibrahim, M.H.; El-Naas, M.H.; Esposito, D.V. Magnesium recovery from desalination reject brine as pretreatment for membraneless electrolysis. Desalination 2021, 525, 115489. [Google Scholar] [CrossRef]
- Mahmud, N.; Ibrahim, M.H.; Alvarez, D.V.F.; Esposito, D.V.; El-Naas, M.H. Evaluation of parameters controlling calcium recovery and CO2 uptake from desalination reject brine: An optimization approach. J. Clean. Prod. 2022, 369, 133405. [Google Scholar] [CrossRef]
- Casas, S.; Aladjem, C.; Larrotcha, E.; Gibert, O.; Valderrama, C.; Cortina, J.L. Valorisation of Ca and Mg by-products from mining and seawater desalination brines for water treatment applications. J. Chem. Technol. Biotechnol. 2014, 89, 872–883. [Google Scholar] [CrossRef]
- Wang, Y.; Qin, Y.; Wang, B.; Jin, J.; Wang, B.; Cui, D. Selective removal of calcium ions from seawater or desalination brine using a modified sodium carbonate method. Desalination Water Treat. 2020, 174, 123–135. [Google Scholar] [CrossRef]
- Molinari, R.; Avci, A.H.; Argurio, P.; Curcio, E.; Meca, S.; Plà-Castellana, M.; Cortina, J.L. Selective precipitation of calcium ion from seawater desalination reverse osmosis brine. J. Clean. Prod. 2021, 328, 129645. [Google Scholar] [CrossRef]
- Molinari, R.; Avci, A.H.; Argurio, P.; Curcio, E.; Meca, S.; Casas, S.; Plà-Castellana, M.; Arpke, H.; Cortina, J.L. Can Brine from Seawater Desalination Plants Be a Source of Critical Metals? ChemViews 2022. [Google Scholar] [CrossRef]
- Amann, A.; Zoboli, O.; Krampe, J.; Rechberger, H.; Zessner, M.; Egle, L. Environmental impacts of phosphorus recovery from municipal wastewater. Resour. Conserv. Recycl. 2018, 130, 127–139. [Google Scholar] [CrossRef]
- Arashiro, L.T.; Montero, N.; Ferrer, I.; Acién, F.G.; Gómez, C.; Garfí, M. Life cycle assessment of high rate algal ponds for wastewater treatment and resource recovery. Sci. Total Environ. 2018, 622–623, 1118–1130. [Google Scholar] [CrossRef] [PubMed]
- Blue, C.R.; Giuffre, A.; Mergelsberg, S.; Han, N.; De Yoreo, J.J.; Dove, P.M. Chemical and physical controls on the transformation of amorphous calcium carbonate into crystalline CaCO3 polymorphs. Geochim. Cosmochim. Acta 2017, 196, 179–196. [Google Scholar] [CrossRef]
- Barlow, D.A.; Baird, J.K.; Su, C.-H. Theory of the von Weimarn rules governing the average size of crystals precipitated from a supersaturated solution. J. Cryst. Growth 2004, 264, 417–423. [Google Scholar] [CrossRef]
- Wu, D.T. The time lag in nucleation theory. J. Chem. Phys. 1992, 97, 2644–2650. [Google Scholar] [CrossRef]
- Buyevich, Y.; Mansurov, V.V. Kinetics of the intermediate stage of phase transition in batch crystallization. J. Cryst. Growth 1990, 104, 861–867. [Google Scholar] [CrossRef]
- Lifshitz, I.; Slyozov, V.V. The kinetics of precipitation from supersaturated solid solutions. J. Phys. Chem. Solids 1961, 19, 35–50. [Google Scholar] [CrossRef]
- Marqusee, J.A.; Ross, J. Kinetics of phase transitions: Theory of Ostwald ripening. J. Chem. Phys. 1983, 79, 373–378. [Google Scholar] [CrossRef]
- Marqusee, J.A.; Ross, J. Theory of Ostwald ripening: Competitive growth and its dependence on volume fraction. J. Chem. Phys. 1984, 80, 536–543. [Google Scholar] [CrossRef]
- Pan, Y.; Li, Y.; Ma, Q.; He, H.; Wang, S.; Sun, Z.; Cai, W.-J.; Dong, B.; Di, Y.; Fu, W.; et al. The role of Mg2+ in inhibiting CaCO3 precipitation from seawater. Mar. Chem. 2021, 237, 104036. [Google Scholar] [CrossRef]
- Zhang, D.; Lin, Q.; Xue, N.; Zhu, P.; Wang, Z.; Wang, W.; Ji, Q.; Dong, L.; Yan, K.; Wu, J.; et al. The kinetics, thermodynamics and mineral crystallography of CaCO3 precipitation by dissolved organic matter and salinity. Sci. Total. Environ. 2019, 673, 546–552. [Google Scholar] [CrossRef]
- Morse, J.W.; Wang, Q.; Tsio, M.Y. Influences of temperature and Mg:Ca ratio on CaCO3 precipitates from seawater. Geology 1997, 25, 85–87. [Google Scholar] [CrossRef]
- Kawano, M.; Hwang, J. Roles of microbial acidic polysaccharides in precipitation rate and polymorph of calcium carbonate minerals. Appl. Clay Sci. 2011, 51, 484–490. [Google Scholar] [CrossRef]
- Zuddas, P.; Pachana, K.; Faivre, D. The influence of dissolved humic acids on the kinetics of calcite precipitation from seawater solutions. Chem. Geol. 2003, 201, 91–101. [Google Scholar] [CrossRef]
- Hu, Y.-B.; Wolf-Gladrow, D.A.; Dieckmann, G.S.; Völker, C.; Nehrke, G. A laboratory study of ikaite (CaCO3·6H2O) precipitation as a function of pH, salinity, temperature and phosphate concentration. Mar. Chem. 2014, 162, 10–18. [Google Scholar] [CrossRef]
- Tzotzi, C.; Pahiadaki, T.; Yiantsios, S.G.; Karabelas, A.J.; Andritsos, N. A study of CaCO3 scale formation and inhibition in RO and NF membrane processes. J. Membr. Sci. 2007, 296, 171–184. [Google Scholar] [CrossRef]
- Oh, H.-J.; Choung, Y.-K.; Lee, S.; Choi, J.-S.; Hwang, T.-M.; Kim, J.H. Scale formation in reverse osmosis desalination: Model development. Desalination 2009, 238, 333–346. [Google Scholar] [CrossRef]
- Jain, T.; Sanchez, E.; Owens-Bennett, E.; Trussell, R.; Walker, S.; Liu, H. Impacts of antiscalants on the formation of calcium solids: Implication on scaling potential of desalination concentrate. Environ. Sci. Water Res. Technol. 2019, 5, 1285–1294. [Google Scholar] [CrossRef]
- Istirokhatun, T.; Dewi, M.N.; Ilma, H.I.; Susanto, H. Separation of antiscalants from reverse osmosis concentrates using nanofiltration. Desalination 2018, 429, 105–110. [Google Scholar] [CrossRef]
- McCool, B.C.; Rahardianto, A.; Cohen, Y. Antiscalant removal in accelerated desupersaturation of RO concentrate via chemically-enhanced seeded precipitation (CESP). Water Res. 2012, 46, 4261–4271. [Google Scholar] [CrossRef] [PubMed]
- Kabalnov, A. Thermodynamic and theoretical aspects of emulsions and their stability. Curr. Opin. Colloid Interface Sci. 1998, 3, 270–275. [Google Scholar] [CrossRef]
- Sharqawy, M.H.; Lienhard, J.H.; Zubair, S.M. Thermophysical properties of seawater: A review of existing correlations and data. Desalination Water Treat. 2010, 16, 354–380. [Google Scholar] [CrossRef]
- Cambridge, M.L.; Zavala-Perez, A.; Cawthray, G.R.; Mondon, J.; Kendrick, G.A. Effects of high salinity from desalination brine on growth, photosynthesis, water relations and osmolyte concentrations of seagrass Posidonia australis. Mar. Pollut. Bull. 2017, 115, 252–260. [Google Scholar] [CrossRef]
- Missimer, T.M.; Maliva, R.G. Environmental issues in seawater reverse osmosis desalination: Intakes and outfalls. Desalination 2018, 434, 198–215. [Google Scholar] [CrossRef]


| Major Ions | Minor Ions | ||||
|---|---|---|---|---|---|
| Reagent | Concentration (g/L) | Concentration (mM) | Reagent | Concentration (g/L) | Concentration (mM) |
| NaCl | 96.30 | 1660 | Sr(II) | 48 × 10−3 | 0.55 |
| MgCl2 | 21.96 | 230 | B(III) | 17 × 10−3 | 1.57 |
| Na2SO4 | 16.76 | 118 | Rb(I) | 0.60 × 10⁻³ | 0.0070 |
| CaCl2 | 4.76 | 43 | Li(I) | 0.82 × 10⁻³ | 0.12 |
| KCl | 3.05 | 41 | In(III) | 0.125 × 10⁻³ | 0.0011 |
| NaHCO3 | 0.26 | 3.1 | Mo(VI) | 0.125 × 10⁻³ | 0.0013 |
| Na2CO3 | 0.085 | 0.8 | V(V) | 0.125 × 10⁻³ | 0.0024 |
| / | / | / | Sc(III) | 0.125 × 10⁻³ | 0.0028 |
| / | / | / | Ga(III) | 0.125 × 10⁻³ | 0.0018 |
| Type | Sub-Type | Component | Value | Unit |
|---|---|---|---|---|
| Input | Cap. Good | Thermostat | 9.259 × 10⁻⁶ | p/FU |
| Stirrer | 5.864 ×10⁻⁵ | p/FU | ||
| Peristaltic pump | 1.688 × 10⁻⁷ | p/FU | ||
| Tanks | 5.041 × 10⁻⁵ | p/FU | ||
| Operations | Thermostat | 1.200 | kWh/FU | |
| StirrerLOW | 3.000 × 10⁻¹ | kWh/FU | ||
| StirrerHIGH | 8.333 × 10⁻² | kWh/FU | ||
| Peristaltic pump | 4.971 × 10⁻² | kWh/FU | ||
| Consumables | RO brine | 1.000 × 10² | L/FU | |
| Na2CO3 salt | 2.500 × 10² | g/FU | ||
| Water for Na2CO3 solution | 2.500 | L/FU | ||
| Cleaning Water | 1.000 × 10⁻¹ | L/FU | ||
| Bag filter | 2.000 × 10⁻⁵ | Kg/FU | ||
| Output | Wastes | Cleaning Water | 1.000 × 10⁻¹ | L/FU |
| Bag filter | 2.000 × 10⁻⁵ | Kg/FU | ||
| By-product | Precipitated CaCO3 | 1.900 × 10² | g/FU | |
| Product | Decalcified brine | 1.025 × 10² | L/FU |
| Test | %Ca2+ | %Mg2+ | %Na+ | %Li+ | %B3+ | %Sr2+ | %Rb+ | %V5+ | %Sc3+ | %In3+ | %Mo6+ | %Ga3+ |
|---|---|---|---|---|---|---|---|---|---|---|---|---|
| CO3_38 | 82.6 | 5.1 | 0.0 | 5.6 | 7.3 | 51.4 | 3.4 | 0 | N.D. (*) | N.D. | 7.1 | N.D. |
| CO3_39 | 81.3 | 4.5 | 0.0 | 5.6 | 5.5 | 45.1 | 1.0 | 0 | N.D. | N.D. | 5.3 | N.D. |
Disclaimer/Publisher’s Note: The statements, opinions and data contained in all publications are solely those of the individual author(s) and contributor(s) and not of MDPI and/or the editor(s). MDPI and/or the editor(s) disclaim responsibility for any injury to people or property resulting from any ideas, methods, instructions or products referred to in the content. |
© 2024 by the authors. Licensee MDPI, Basel, Switzerland. This article is an open access article distributed under the terms and conditions of the Creative Commons Attribution (CC BY) license (https://creativecommons.org/licenses/by/4.0/).
Share and Cite
Molinari, R.; Avci, A.H.; Curcio, E.; Domene, D.S.; Villa González, C.; Gallart, J.J.E.; Argurio, P. Selective Calcium Removal at Near-Ambient Temperature in a Multimineral Recovery Process from Seawater Reverse Osmosis Synthetic Brine and Ex Ante Life Cycle Assessment. Water 2024, 16, 667. https://doi.org/10.3390/w16050667
Molinari R, Avci AH, Curcio E, Domene DS, Villa González C, Gallart JJE, Argurio P. Selective Calcium Removal at Near-Ambient Temperature in a Multimineral Recovery Process from Seawater Reverse Osmosis Synthetic Brine and Ex Ante Life Cycle Assessment. Water. 2024; 16(5):667. https://doi.org/10.3390/w16050667
Chicago/Turabian StyleMolinari, Raffaele, Ahmet Halil Avci, Efrem Curcio, David Sanchez Domene, Carolina Villa González, Jose Jorge Espi Gallart, and Pietro Argurio. 2024. "Selective Calcium Removal at Near-Ambient Temperature in a Multimineral Recovery Process from Seawater Reverse Osmosis Synthetic Brine and Ex Ante Life Cycle Assessment" Water 16, no. 5: 667. https://doi.org/10.3390/w16050667
APA StyleMolinari, R., Avci, A. H., Curcio, E., Domene, D. S., Villa González, C., Gallart, J. J. E., & Argurio, P. (2024). Selective Calcium Removal at Near-Ambient Temperature in a Multimineral Recovery Process from Seawater Reverse Osmosis Synthetic Brine and Ex Ante Life Cycle Assessment. Water, 16(5), 667. https://doi.org/10.3390/w16050667