Article

Delineation of Potential Groundwater Zones and Assessment of Their Vulnerability to Pollution from Cemeteries Using GIS and AHP Approaches Based on the DRASTIC Index and Specific DRASTIC

by
Vanessa Gonçalves
1,2,
Antonio Albuquerque
1,2,*,
Pedro Gabriel Almeida
1,2,
Luís Ferreira Gomes
1,2 and
Victor Cavaleiro
1,2
1
Department of Civil Engineering and Architecture, University of Beira Interior, Calcada Fonte do Lameiro 6, 6200-358 Covilha, Portugal
2
GeoBioTec, University of Beira Interior, Calcada Fonte do Lameiro 6, 6200-358 Covilha, Portugal
*
Author to whom correspondence should be addressed.
Water 2024, 16(4), 585; https://doi.org/10.3390/w16040585
Submission received: 16 January 2024 / Revised: 4 February 2024 / Accepted: 9 February 2024 / Published: 16 February 2024
(This article belongs to the Special Issue Water Governance Solutions towards Future Environmental Challenges)

Abstract

:
The risk of aquifer contamination is determined by the interaction between the pollutant load and the vulnerability of an aquifer. Owing to the decomposition of bodies and degradation of artefacts, cemeteries may have a negative impact on groundwater quality and suitability for use due to the leaching of organic compounds (e.g., biodegradable organics, pharmaceuticals, and formaldehyde), inorganic compounds (e.g., nitrate and heavy metals), pathogenic bacteria, and viruses. Factors such as burial and soil type, rainfall amount, and groundwater depth may increase aquifer vulnerability to pollutants generated in cemeteries. The potential for groundwater contamination was investigated in two cemeteries of the Soure region in Portugal (Samuel–UC9 and Vinha da Rainha–UC10), using the classic DRASTIC model, followed by some adjustments, depending on the particularities of the locations, resulting in a Final Classification considered as Specific DRASTIC. By combining Remote Sensing (RS), Geographic Information System (GIS), and Analytical Hierarchy Process (AHP), groundwater potential zones (GWPZs) were identified, and aquifer vulnerability was assessed, which included the elaboration of thematic maps using GIS operation tools. The maps allowed for the identification of areas with different susceptibilities to contamination: from “Low” to “Very high” for the DRASTIC index and from “Very Low” to “Very high” for the Specific DRASTIC index. Although the difference between the UC9 and UC10 cemeteries is negligible, UC10 is more vulnerable because of its proximity to the community and critically important mineral water resources (such as Bicanho Medical Spa). The Specific model seems better-suited for describing vulnerability to cemeteries. Although there is limited groundwater quality data for the area, the development of vulnerability maps can identify areas that can be sensitive spots for groundwater contamination and establish procedures for pollution prevention.

1. Introduction

Cemeteries are places where institutional funeral practices take place and have a special meaning for storing and transforming dead bodies and serving as a collective historical memory [1,2,3,4,5,6].
People and societies have long considered contaminated groundwater near established and unplanned cemeteries to be an urgent concern [7], because it is a slow, chronic, and asymptomatic process [8,9] and should be referred to as decomposition labs [10]. Human cadavers typically contain approximately 35% organic material, 15% bone, and 50% water [11]. According to the authors [11], when a person weighing about 70 kg decomposes, 30–40 L of necro leachate is released into the environment between 72 h and 3 years after death [12] and it takes between 15 and 25 years for the person to completely break down into a skeleton [11]. The decomposition process releases organic materials, inorganic materials, gases, and trace elements into the groundwater, which harms both the environment and humans [9,12,13]. The primary sources of pollution in cemeteries, according to Guttman et al. [1], are materials used to manufacture coffins and embalming fluids. Toxic metals (e.g., Fe, Cu, Ni, Pb, and Zn) are released into the soil by varnishes, sealants, metal handles, and decorations found on wooden coffins [11,14,15,16,17,18,19,20].
As the world population increases and because of urban land development, cemeteries that were previously located on the outskirts of communities are now located in their centre. Many regions of the world have reported graveyard soil contaminated with extreme physical, chemical, and biological elements [21,22,23]. Certain dangerous substances can linger in the atmosphere for extended periods as ultrafine or nanoparticle-sized particles [24,25,26]. In the soils of urban cemeteries in Passo Fundo, Brazil, the concentrations of toxic metals were higher than those naturally occurring in control samples [2,27]. Dent’s [28] research at the Australian Botanical Cemetery indicates that the electrical conductivity (or salinity) around recent burials has increased noticeably. High levels of Cl, NO3, NO2, NH₄⁺, PO43−, Fe, Na+, K+, and Mg2+ were found beneath the cemetery [28]. Additionally, previous research has shown that a variety of contaminants, including bacteria, viruses, phosphorus, and nitrogen, can contaminate groundwater and pose a health risk to the general public [1,2,5,10,29,30,31,32,33,34].
Groundwater contamination is significantly influenced by burial practices, including individual or collective graves, grave depth, proximity to water sources, size of cemeteries, and number of burials. Additional factors such as coffin material, soil characteristics (e.g., lithology, mineralogy, grain size distribution, structure, thickness, leaching potential, permeability, plasticity, chemical properties, and presence of porous/fissured zones), topography, land use (e.g., presence of vegetation, agricultural practices, and urbanised areas), climatic characteristics (e.g., precipitation, temperature, and actual evapotranspiration), geological and hydrogeological aspects (e.g., groundwater flow mechanisms), abstraction rates, extension of source protection zones, depth of the water table, and seasonal fluctuations also play a crucial role in groundwater quality [2,11,14,17,31,35,36,37,38]. In cases where a cemetery is situated on permeable and porous soil, such as gravel or sand, leachate from decomposing corpses and coffin seepage can rapidly move and blend with the groundwater below [2]. Optimal decomposition requires homogeneous soils with balanced proportions of sand, silt, and clay (roughly 30% of each). During periods of high precipitation, intense runoff, and infiltration, when the water table is close to the soil surface, chemicals and pathogens can swiftly migrate to the groundwater [14]. It is advisable to assess cemeteries for potential risks using a comprehensive framework that takes into account risk significance, consequences, magnitude, and hazard identification [35].
Groundwater vulnerability is the tendency or likelihood of contaminants to reach a specific position in the groundwater system after their introduction at a location above the uppermost aquifer. The term first appeared in the 1970s [39] and gained notoriety in the 1980s [40]. It involves intrinsic vulnerability, which refers to the characteristics that affect the migration of pollutants towards groundwater [41], and specific vulnerability, which depicts the susceptibility to a specific contaminant or group of contaminants, considering aspects such as biogeochemical attenuation processes [42]. Because groundwater vulnerability cannot be measured directly [43], several indicators have been proposed to assess current groundwater quality or predict future scenarios [44,45]. Taghavi et al. [46] classified these evaluation methods into four categories: (i) overlay- and index-based methods [40,42,43], (ii) process-based simulation models [43,47], (iii) statistical methods (including orthodox and Bayesian methods) [42,43,48,49], and (iv) hybrid methods [50,51]. Other techniques have been put forth to assess the vulnerability of groundwater resources. These include the model of intrinsic groundwater vulnerability and specific vulnerability to pesticide pollution [52,53], techniques for determining karst aquifer vulnerability [54], an approach that incorporates impact modelling, and an index-based approach to determine how vulnerable groundwater resources are to climate change [55].
The DRASTIC index proposed by Aller et al. [40] has already been used for groundwater vulnerability assessment in many studies [56,57,58], and it can be used to assess the risk of groundwater contamination associated with cemeteries. To reduce the subjectivity of the evaluation associated with the original model, modified or updated versions have been developed to identify appropriate ratings and determine weights for the DRASTIC parameters [58,59,60,61].
As cemeteries are sensitivity places with large spatial structures, they need to have a well-designed layout to allow funeral services [62,63,64,65,66]. Generating vulnerability DRASTIC maps involves handling substantial data, and GIS tools have been employed to manipulate hydrogeomorphological, hydrogeological, soil characteristics, and land-use data [67,68]. Map algebra calculations facilitate mathematical operations among thematic maps to generate composite spatial maps or charts, such as vulnerability or suitability maps [69]. GIS has been previously used to develop DRASTIC-based vulnerability maps, but mainly focused on contamination risks from wastewater facilities, garbage deposits, underground gas or fuel deposits, sanitary landfills, soils contaminated by industrial activities, and agricultural soils contaminated with an excess of fertilizers (specifically nitrate) or pesticides [45,51,57,70,71,72]. For example, Sinan and Razack [73] evaluated the vulnerability of Marrakech’s Haouz aquifer to various pollution sources, including Marrakech’s industrial park, industrial facilities, cemeteries, and waste deposits near Ourika and Tahanaout.
The main goal of this study was to develop a DRASTIC index-based vulnerability map for assessing the risk of aquifer contamination associated with two cemeteries in the Soure Region (Portugal) using GIS interpolation tools. Using the DRASTIC method [40], a geological analysis of the study area was conducted in two phases: the first phase considered the index independently of the pollutant load, and the second phase was developed based on the locations of particularities, resulting in a Final Classification that was considered the Specific DRASTIC [74]. The main innovation of this study is the use of this methodology to create maps that can be useful for defining measures to avoid groundwater pollution from cemeteries, both in existing spaces and new spaces. The DRASTIC approach was selected because it is the easiest to use and fits well with the GIS framework. Moreover, the approach is a computationally efficient model as it eliminates the need for intricate numerical analysis or multi-parameter simulation processes. What is more, though, is that it produces excellent results with little application cost. Due in part to the large number of input data points used, this methodology improves evaluation performance, thereby reducing the impact of errors on the final product.

Design of Cemeteries in Portugal

The construction of new public cemeteries was mandated by a decree dated 9 August 1834 [75]. As a result of the high number of deaths in the Portuguese Civil War (1832–1833) and during the cholera epidemic of 1833, the method of burying bodies in the ground was finally regulated [75]. The Decree of 21 September 1835 established that municipal authorities should allocate an area of land for the construction of cemeteries in all urban areas (villages, towns, and cities), but located at a safe distance to avoid contamination and health problems. With the new law, bodies had to be buried for 5 years in a pit made of individual soil at least 1.1 m deep and at least 0.33 m apart between graves. In 1962, Decree No. 44,220 appeared, defining the type of soil for burial: siliceous limestone, clayey limestone, or siliceous clayey, and the area must be designed for 50 years. The use of metal (zinc or lead) and solid wood coffins was prohibited to allow the bodies to degrade within five years, with the bones being able to be removed or buried deeper in the ground. Six years later (in 1968), the use of 20 L and 80 L of hydrated lime in wooden and metal coffins, respectively, was authorised to accelerate the decomposition of bodies. Graves and crypts that were unused or unmaintained for 10 years were transferred to the management of local authorities. In 1982, a new law was published (Decree-Law No. 274/82) with instructions on how to bury or cremate mortal remains.
The 1998 law (Decree-Law no. 411/98) authorises that only zinc coffins can be buried in a crypt and prohibits the burial of bodies in mass graves, unless the law is revoked for special cases. The ashes of incinerated bodies can be kept in a burial urn, ossuary, or crypt or kept in the care of a family member. The graves must remain closed for at least five years, and the period may be extended if the remains are not degraded. Completely decomposed human remains can be transferred to an ossuary or a family grave or even be cremated at the request of relatives. However, if the bodies are not decomposed at the time of exhumation, they should remain closed until the skeletonization process is complete [75].

2. Materials and Methods

2.1. Location of Cemeteries and the Study Area

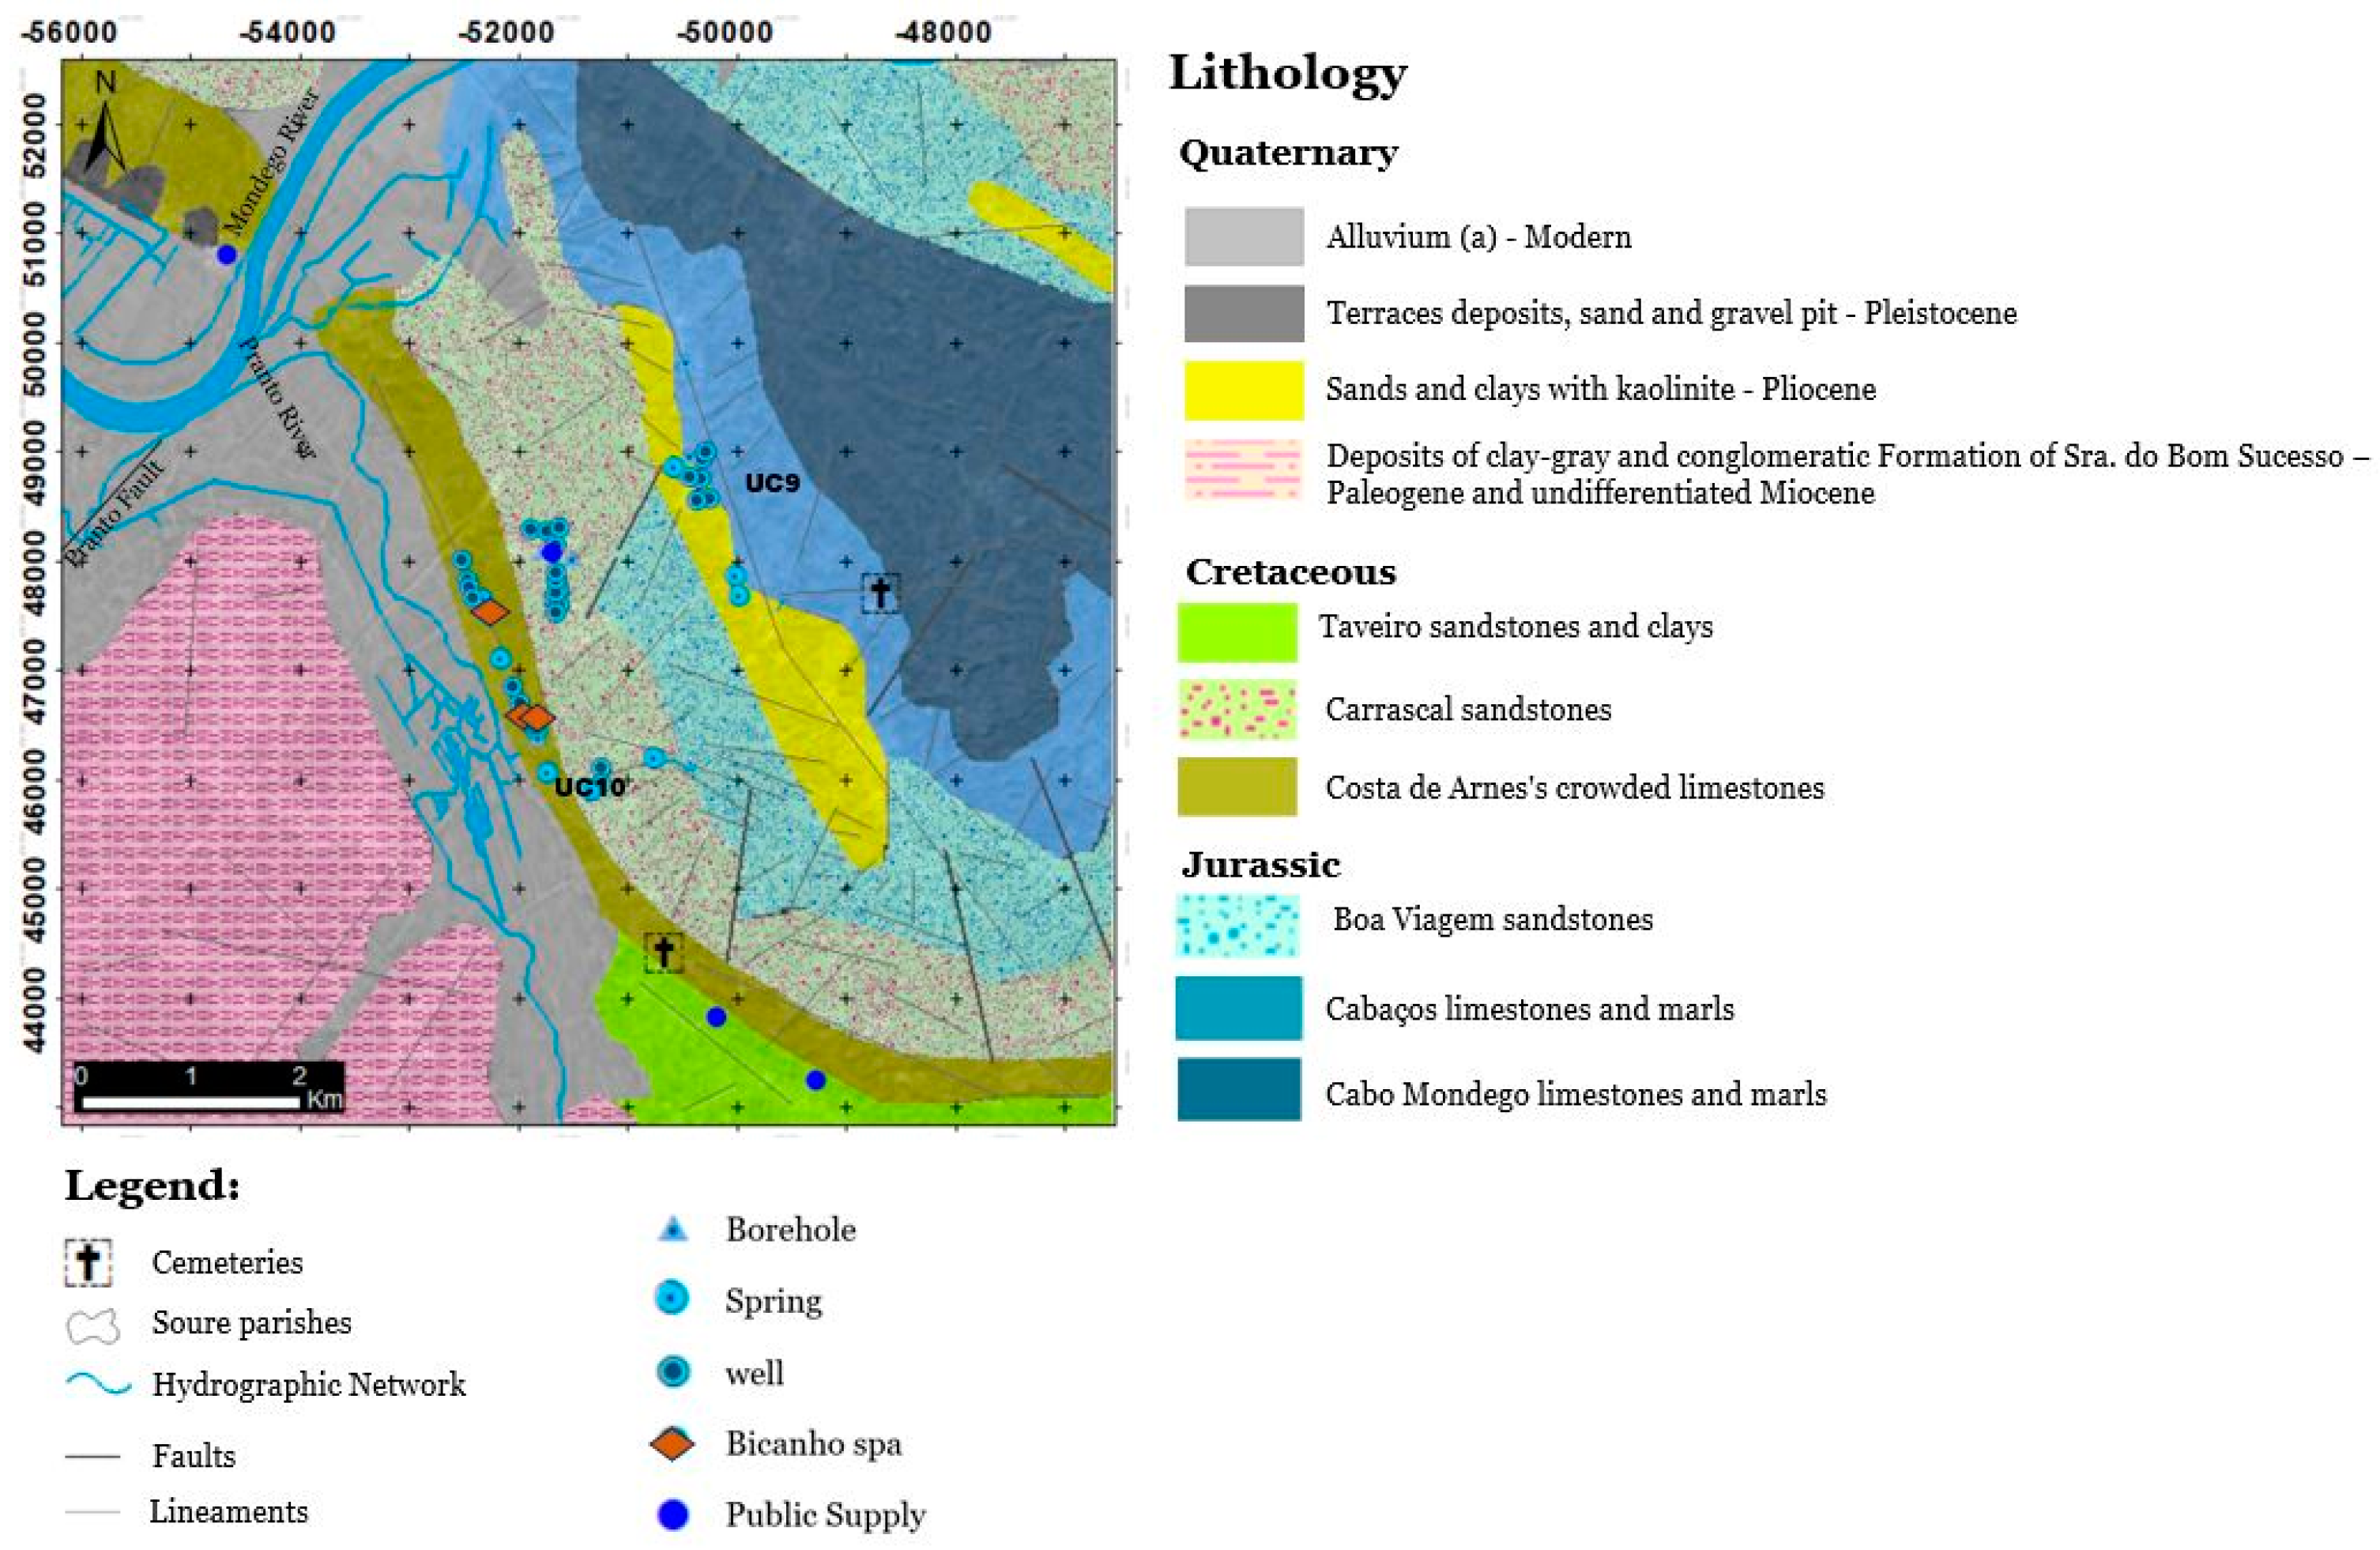
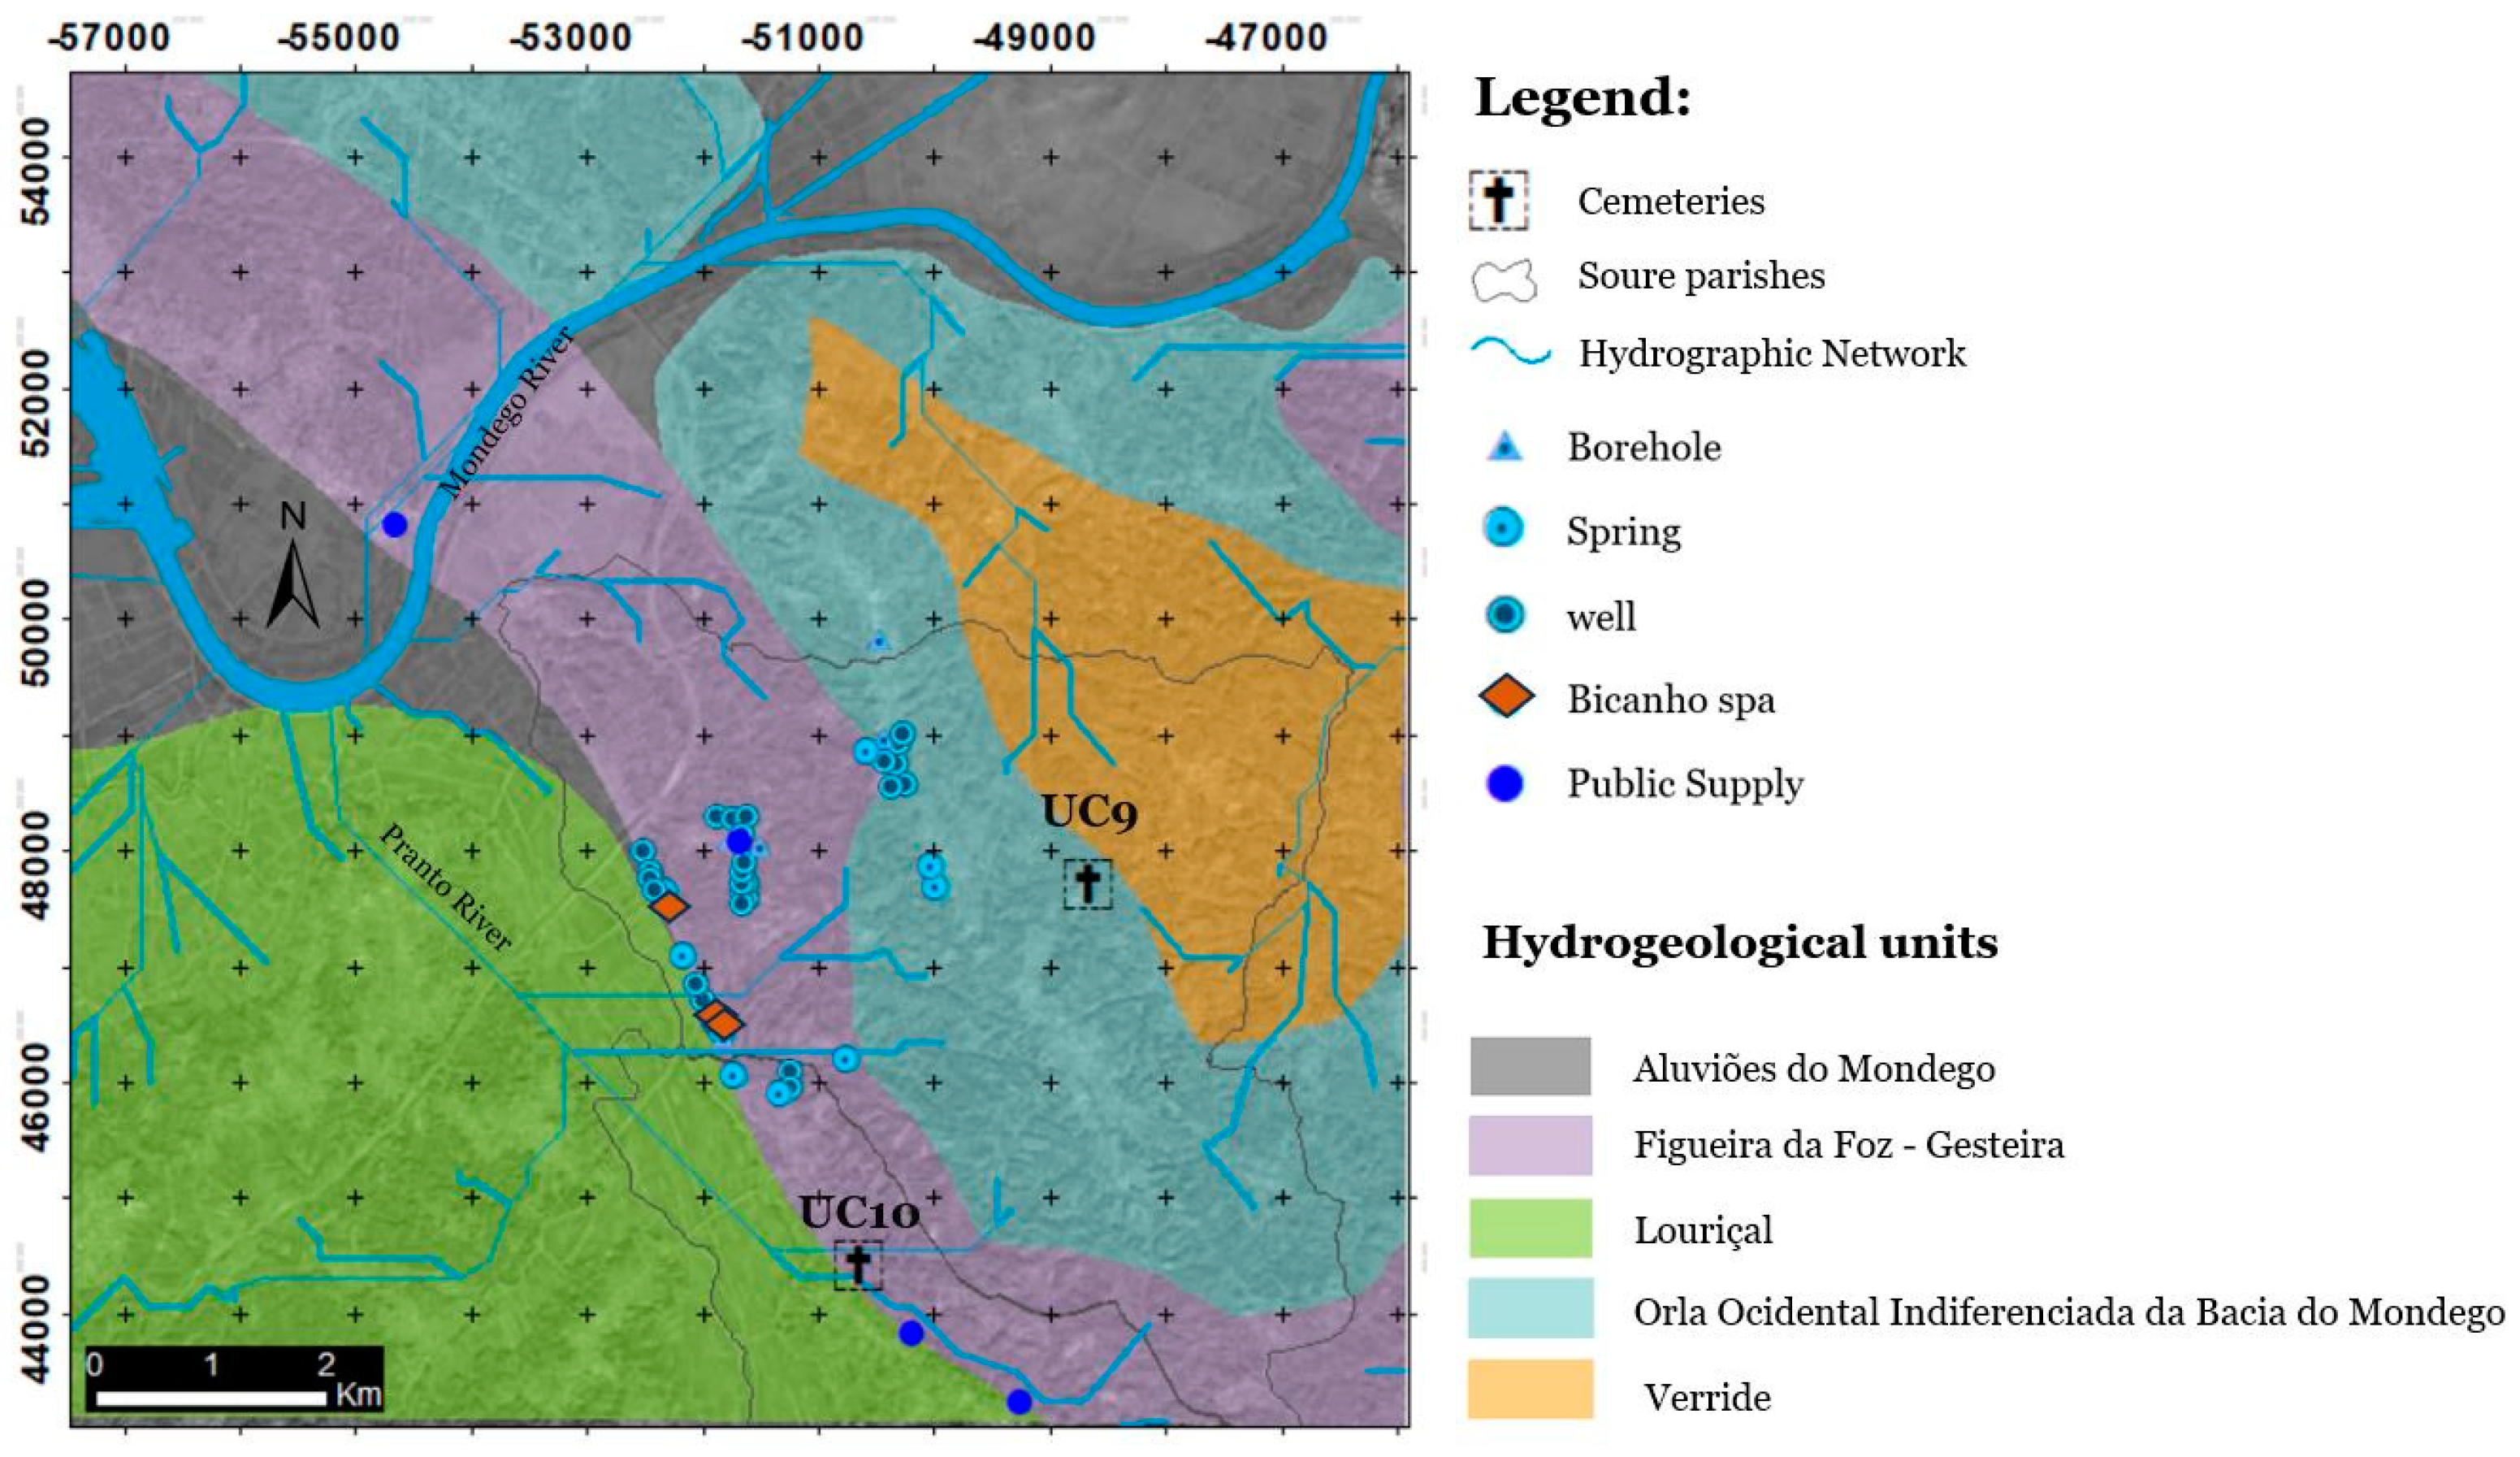
This work involved the study of two cemeteries (Samuel, with identification UC9; and Vinha da Rainha, with identification UC10), both in the municipality of Soure (central region of Portugal) (Figure 1). As no other important sources of anthropogenic pollution are known in the vicinity, these units represent the most serious threat to the quality of groundwater and public health from pollution. Whereas UC9 is situated higher up and farther away from the urban agglomeration, UC10 is situated almost flatly and nearer to urbanisations, where it may initially pose a greater risk of contamination. Despite their approximate linear distances of 2.5 Km (UC10) and 3.3 Km (UC9) from the hydromineral resource, Bicanho Spa, it may still be necessary to investigate the possibility of contamination.

2.2. Assessment of Groundwater Vulnerability

An assessment procedure consisting of three steps was devised to evaluate the possible effects of runoff from cemeteries to groundwater in the Soure area. The first step involved delineating the GWPZs. This research aims to evaluate the vulnerability of groundwater pollution using the DRASTIC index model and Specific DRASTIC technique, which was performed during the second and third phases, respectively.

2.2.1. Mapping of GWPZs

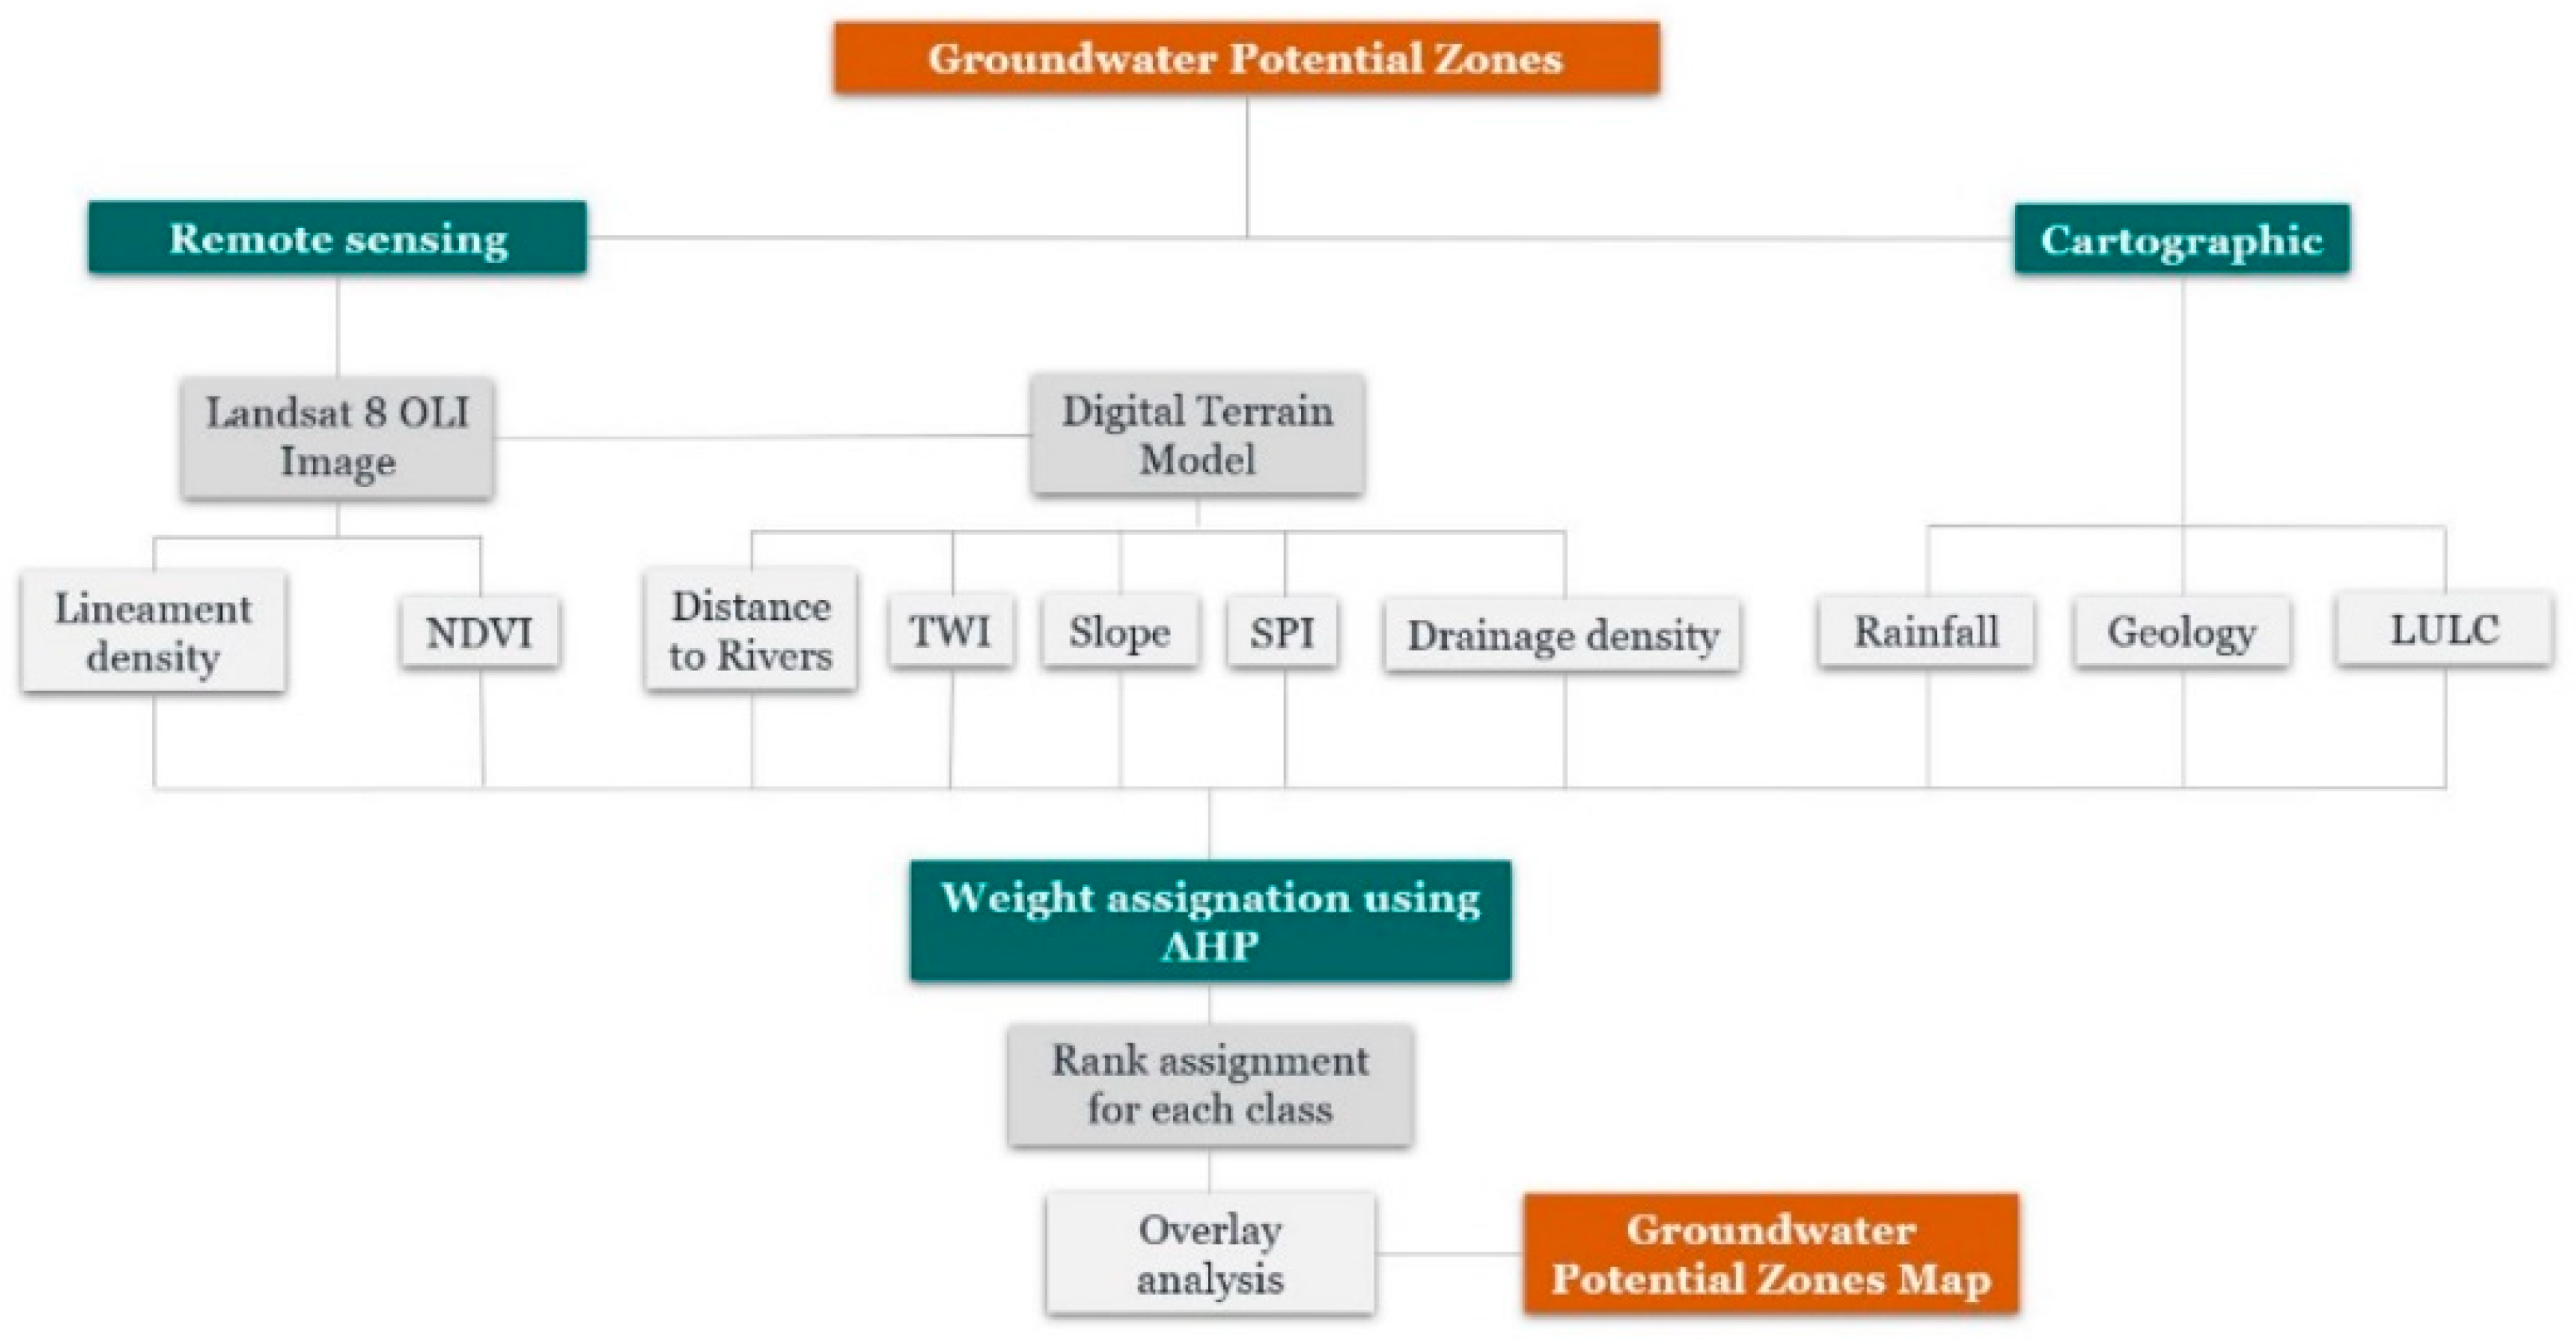
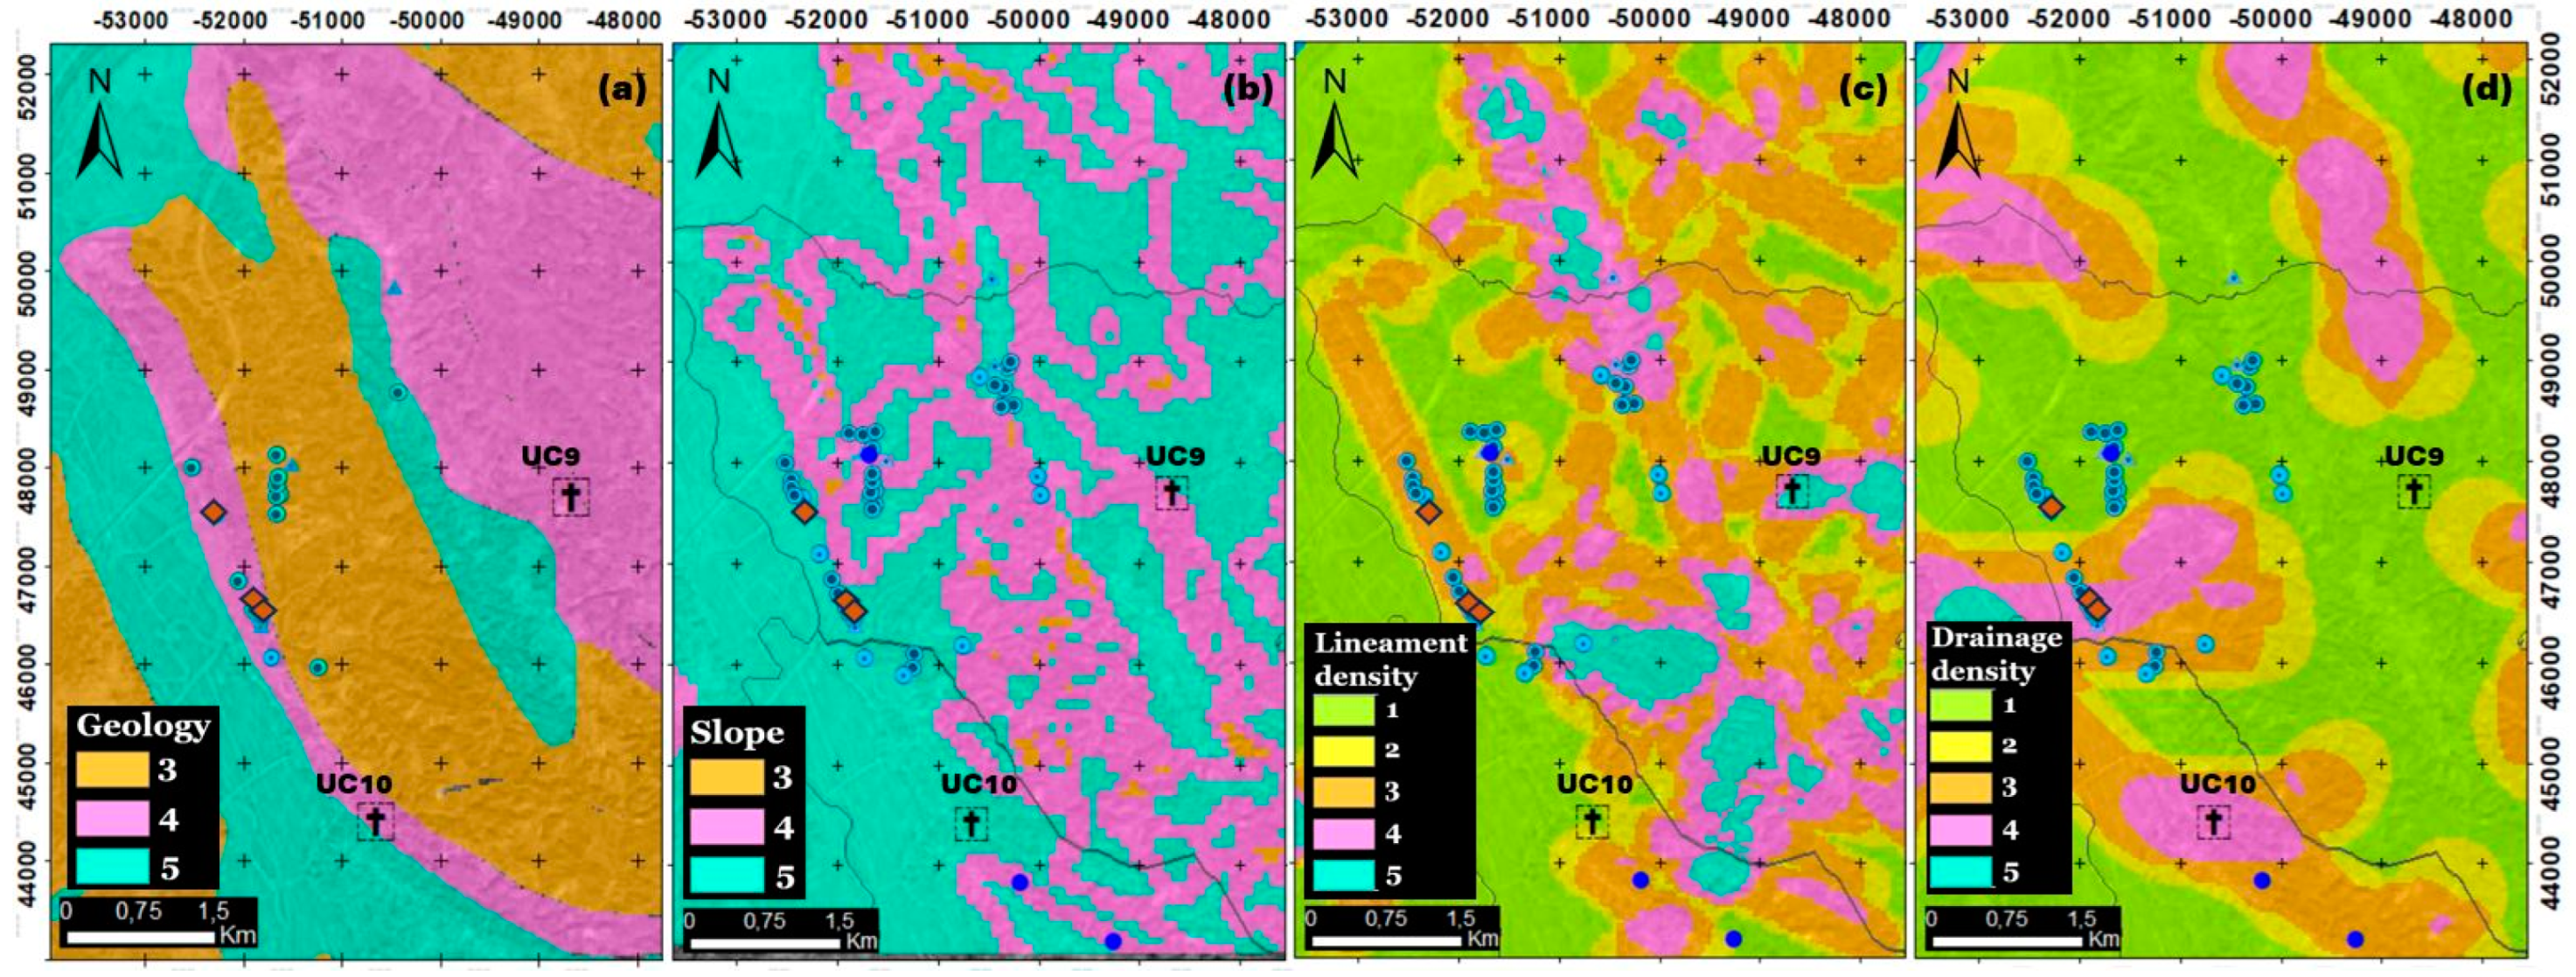
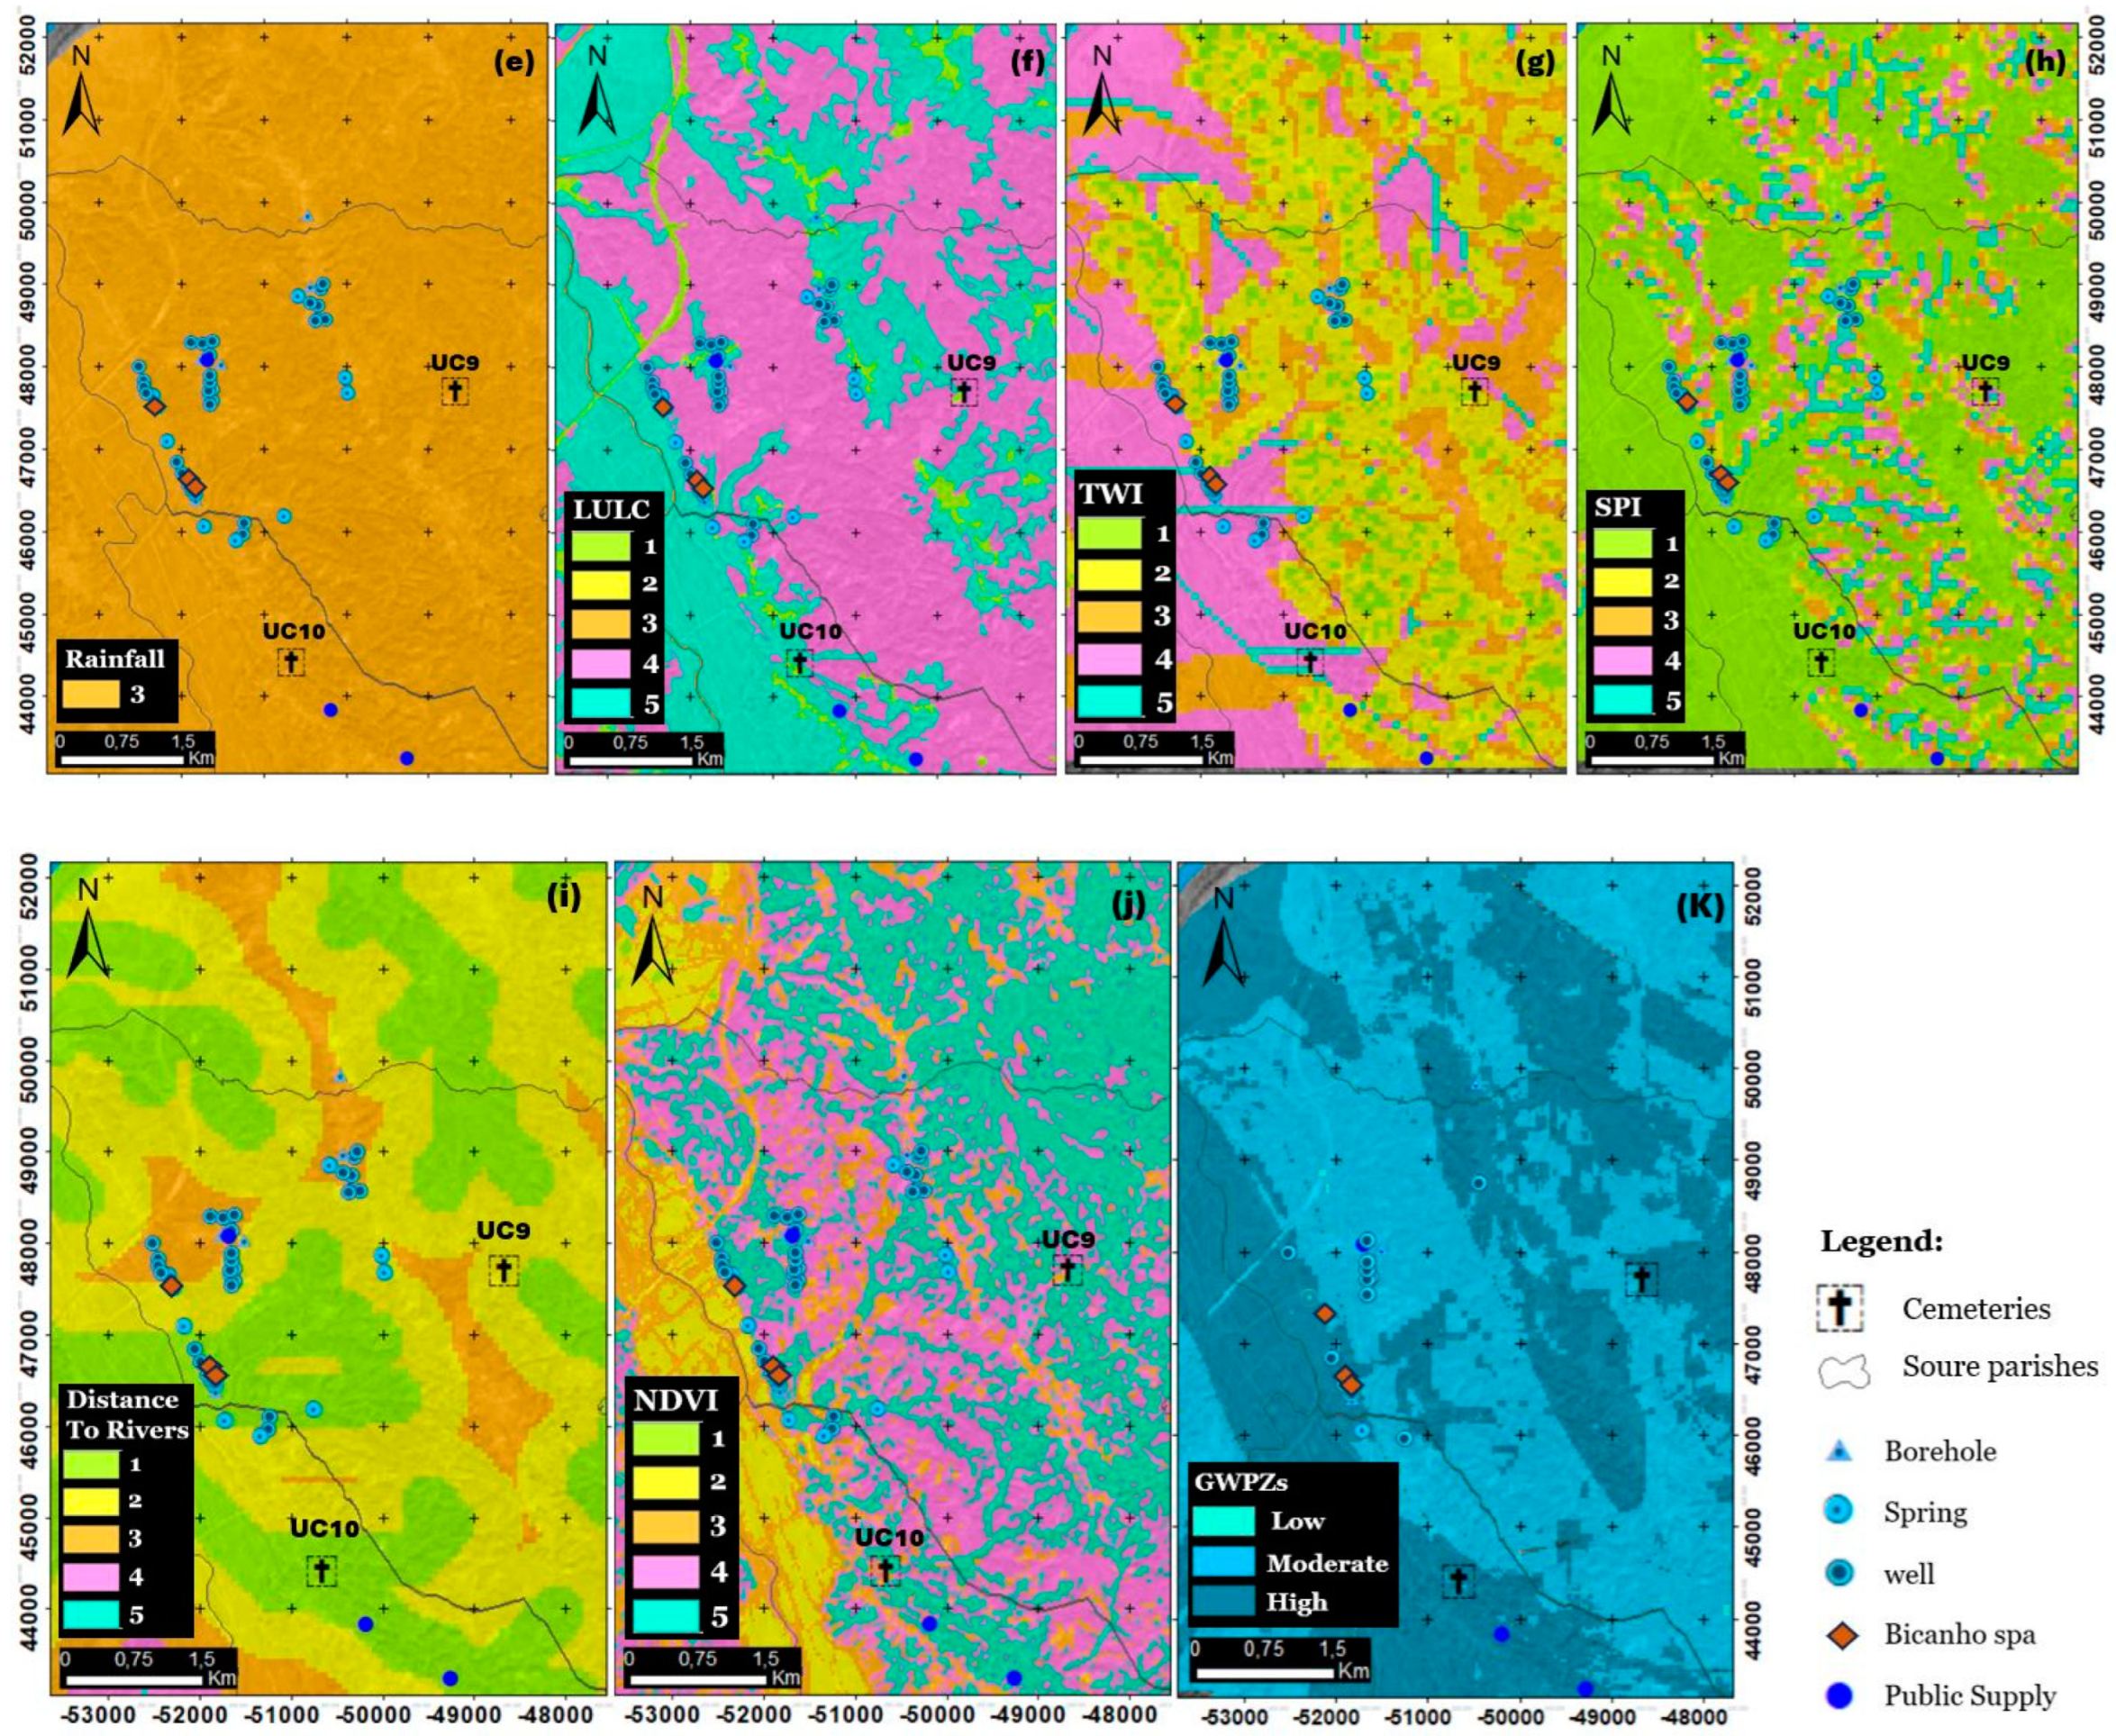
In this section of the study, GWPZs were defined based on a variety of geological, hydrogeological, and environmental factors using RS, GIS, and multi-criteria decision analysis (MCDA) [76,77,78,79]. Pairwise comparisons can be used to solve complex decision-making problems by applying the AHP [79]. Figure 2 shows a flowchart that creates GWPZs using GIS. Ten thematic maps were reclassified (Figure 3): Geology, Slope, Lineament density, Drainage density (Dd), Precipitation, Land-Use/Land-Cover (LULC), Topographic Wetness Index (TWI), Stream Power Index (SPI), Distance to rivers, and Normalised Difference Vegetation Index (NDVI).
The delineation of the GWPZ map is a complex process because different environmental, climatic, and topographical factors are not widely understood [80,81]. The development of RS and GIS technologies has facilitated the delineation of large-scale GWPZs [82,83].
The different datasets used in the study to compute the GWPZs are detailed in Table 1. Although the spatial resolution of the satellite images provided by ESA (European Space Agency)-Sentinel-2 is generally higher, this implies more clarity and detail but also more data and storage. The Landsat 8 satellite is distinguished by the presence of thermal bands as well as band-8 (panchromatic), which is useful for improving image spectral resolution, and data are distinguished by a high radiometric resolution (16 bits), allowing the measurement of subtle variations in surface conditions.
Each raster was normalised using the geometric mean criteria following the evaluation of weights using the AHP method. For every feature class, a rating value between 1 and 5 (meaning “very low”, “low”, “medium”, “high”, and “very high”) was assumed [84]. The rating values represented the suitability of the groundwater potential [84,85,86,87,88,89]. Table 2 displays each class’s normalised weight and normalised rank for each variable.
The geological characteristics play a crucial role in determining groundwater potential because the hydraulic properties of the rock regulate the infiltration and percolation of water [90]. The geological map of the study region was converted from vector to raster format, and three categories were created once weight and rank had been assigned (Table 2, Figure 3a): (3) Taveiro sandstones and clays, Boa Viagem sandstones, and Carrascal sandstones; (4) Cabaços limestones and marls, Cabo Mondego limestones and marls and Costa de Arnes’ crowded limestones; (5) Alluvium and sands and clays with kaolinite. Sedimentary rocks, such as limestones, possess substantial potential for storing groundwater.
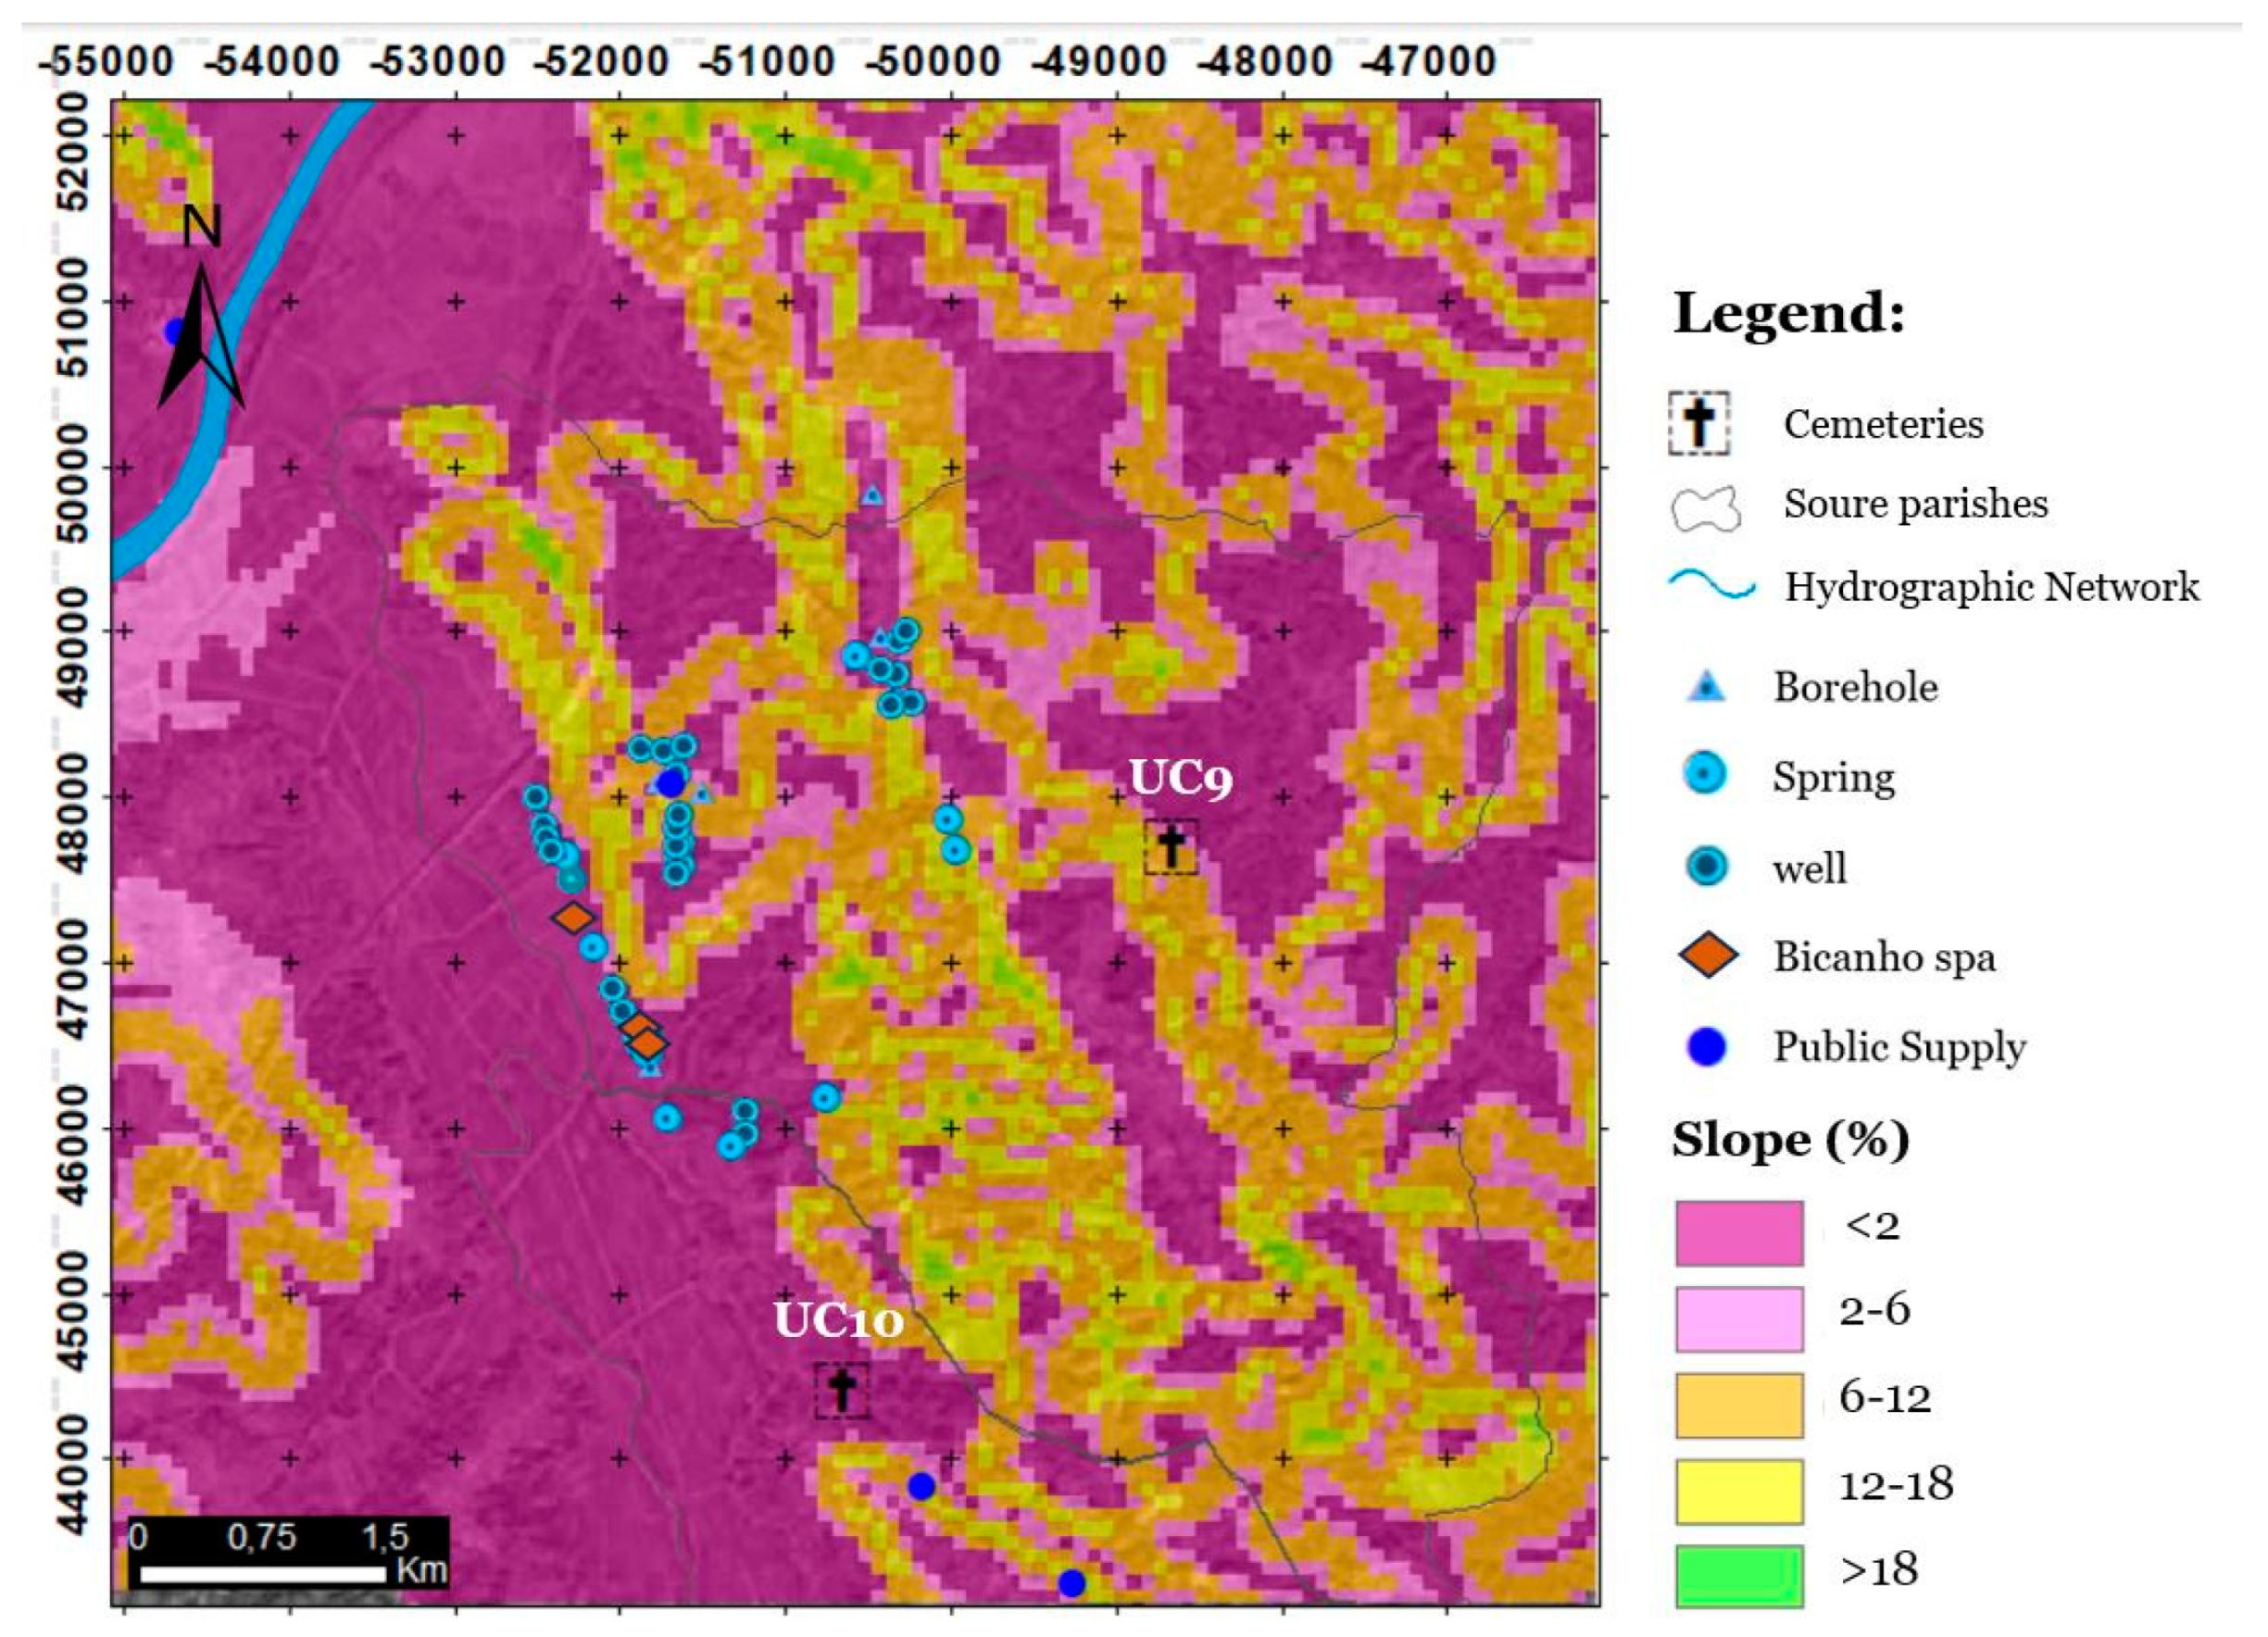
Slopes in each area directly affect the rate of infiltration and also surface runoff, which in turn affects the recharge of groundwater, which is impacted by topography and/or slope gradient [91,92]. Steep slopes decrease infiltration and groundwater recharge because they allow less water to remain on the surface for longer periods due to rapid runoff. At the same time, because of their high rates of infiltration and low runoff, flat areas are better suited for recharge [93]. The slope map (degrees) was produced by using the Digital Elevation Model (DEM) and ArcMap’s “Slope Tool”. The study area’s slope led to the creation of five categories: (1) >30, (2) 15–30, (3) 8–15, (4) 2–8, and (5) 0–2 (Table 2, Figure 3b).
Lineaments, characterised by their straight or nearly straight form, are prominent land features that are accentuated by the permeability of the soil and are widespread across the Earth’s surface [94,95]. Intrinsic permeability and porosity can be used to broadly characterize underlying fractures, faults, or joints [96,97]. The movement and storage of groundwater as well as the facilitation of water infiltration into the subsurface depend on the lineaments [98]. Following extraction, lineament discontinuities were examined using Landsat images on ArcGIS, and the “Line Density Tool” was used to create a lineament density map (Km/Km2). Based on natural breaks, the following five categories were established: (1) 0–0.49, (2) 0.49–1.34, (3) 1.34–2.18, (4) 2.18–3.23, and (5) >3.23 (Table 2, Figure 3c).
Drainage is a mechanism that has an important role in controlling the hydrogeological characteristics of soils [85], and drainage density is defined as the surface area of a drained basin divided by the total length of its watercourses [99]. The groundwater recharge volume is correlated with the overall length of the drainage densities [84], and a zone with a high drainage density contributes significantly to surface runoff while retaining relatively little groundwater [100]. However, the drainage system is affected by several variables, including topography, climate, slope gradient, rainfall, vegetation cover, subsurface features [96], and the type and structure of the bedrock [101]. This variable makes it easier to understand and assess data about groundwater infiltration, permeability, runoff potential, and relief by providing a suitable numerical measurement [94]. The drainage density (Km/Km2) was determined by using Equation (1) in conjunction with the Stream Network and the Line Density Tool [82].
D = i 1 n D i A
where ( A ) represents the basin area (Km2) and ( D i ) is the total length of all streams in stream order i (Km). The “Hydrology Tool” in ArcMap, along with the Fill DEM, Flow Direction, Flow Accumulation, Stream Order, and Stream to Feature procedures, was used to create the Stream Network. Based on natural breaks, five categories were established: (1) 0–0.25, (2) 0.25–1.02, (3) 1.02–1.79, (4) 1.79–2.56, and (5) >2.56 (Table 2, Figure 3d).
Rainfall is a hydrologic process that restores aquifers, and it is a major factor in determining groundwater potential [86]. Although more recent total precipitation data were calculated at the study site, data from 1931 to 1960 [102] were used in the GIS environment because they were available in polygon shapefile format and the most recent data were contained within the polygon. Based on natural breaks, the study area’s mean annual rainfall intensity was split into five zones: (1) 0–298, (2) 298–740, (3) 740–1100, (4) 1100–2070, and (5) >2070 (Table 2, Figure 3e).
LULC significantly influences how groundwater recharge occurs [103]. Plants and trees can store water in their leaves and stems and allow it to enter the earth through their roots and rhizomes, thus contributing to recharging groundwater. This circumstance leads to the demand for groundwater extraction on agricultural and plantation land. However, the increase in the use of concrete in urban areas leads to an increase in surface runoff and a decrease in recharge. The COS2018 chart [104] provided the LULC data, and five categories were created: (1) Urban Area, (2) Bare ground, (3) Water bodies, (4) Vegetation, and (5) Agricultural (Table 2, Figure 3f).
The TWI map was created by Beve and Kirkby [105] and is the most often used map in hydrological studies [102,106]. The TWI’s upslope area can be used to measure subsurface lateral transmissivity or as a local slope indicator [107,108]. Soil moisture content is one of the hydrological parameters that is significantly impacted by TWI in each area [109]. Because the zoning and extent of saturated areas affect the occurrence of springs [107], the higher the TWI, the greater the groundwater potential. TWI calculations [110] provide an overview of how foothill, hillslope, and topographic roughness affect lateral groundwater flow. Equation (2) [111] was used to calculate TWI, which measures a cell’s propensity to retain water. It also makes it easier to find favourable locations with slow runoff and concentration.
ln α tan b
Based on natural breaks, the following five categories were established: (1) 0–5.95, (2) 5.95–8.89, (3) 8.89–11.84, (4) 11.84–14.76, and (5) >14.76 (Table 2, Figure 3g).
The SPI measures the effects of landform, elevation, and slope on groundwater resources and is a useful metric for identifying areas where groundwater infiltration occurs. The runoff influence increased with the SPI value, which was determined using slope and flow accumulation parameters in ArcGIS [90]. Quantile breaks were used to create the following five categories: (1) 0–5.68, (2) 5.68–11.36, (3) 11.36–21.33, (4) 21.33–57.11, and (5) >57.11 (Table 2, Figure 3h).
Because local alluvial layers are typically found near river courses and because sites along rivers are best-suited for effective infiltration and subsequent recharge of groundwater, the distance from hydrographic networks is significant in hydrogeological research [112]. Rivers contribute to groundwater potential zones within watersheds, which in turn affects them. To begin the distance categories, the Euclidean distance tool from the ArcGIS spatial analyst tools was utilised. Based on natural breaks, the following five categories were established: (1) >858.37, (2) 567.63–858.37, (3) 332.27–567.63, (4) 138.45–33.27, and (5) 0–138.45 (Table 2, Figure 3i).
The NDVI layer quantifies vegetation by measuring the difference between near-infrared light, which vegetation strongly reflects, and red light, which vegetation absorbs. It was created using ArcMap and Landsat 8 images, with water being the most likely result given the negative values. Conversely, there is a strong likelihood that it has dense green leaves if the NDVI value is near +1. On the other hand, a region with an NDVI close to zero is probably urbanised and lacks vegetation. Based on natural breaks, the following five categories were established: (1) −1–(−0.02), (2) −0.02–0.09, (3) 0.09–0.22, (4) 0.22–0.31, and (5) >0.31 (Table 2, Figure 3j).
The AHP approach was used to determine the weight of various layers. The first step was to create a Pairwise Comparison Matrix (PCM) (Table 3) using Saaty’s (1–9) relative importance scale (Table 4) [113].
A PCM for variables was produced by comparing each layer based on its relative importance (Table 2). To minimise the related subjectivity, the normalised weights were computed in the second step of this procedure. Equation (3) [114] was also used to calculate the sum of the values in each column, which is shown in Table 5.
L i j = n = 1 n C i j
where ( C i j ) represents the variable used in the analysis and ( L i j ) represents the PCM’s total column value.
To create the Normalised Pairwise Comparison Matrix (NPCM), each column value was divided by the sum of the column values [87,114]. Each variable’s normalised weight (NWt) was calculated by averaging all the values in the associated row of the NPCM (Table 5) [83,93]. Each normalised weight multiplied by all is equal to 1.
Because the AHP method is dependent on subjective or individual judgements, its application may lead to some inconsistencies [96]. The Consistency Ratio (CR) was computed to assess the accuracy. First, each PCM column was multiplied by the variable weight. The weighted sum value was then obtained by adding the values of each row. A division between the variable’s weight and the weighted sum value was then performed, yielding a λ value [87]. Equation (4) [115] can be used to determine the maximum eigenvalue ( λ   m a x ):
λ   m a x = C 1 + C 2 + C 3 C n n  
The ( λ )   values are ( C 1 ) through ( C n ) , and the number of criteria is ( n ) . A ( λ   m a x ) value of 11.283 was found in this study.
The value of the Consistency Index (CI) was then calculated using Equation (5) [115]:
C I = λ   m a x n n 1
where ( λ   m a x ) is the judgement matrix’s maximum eigenvalue and ( n ) is the number of criteria. This study yielded a CI value of 0.143.
Finally, Equation (6) was used to calculate the CR [115]:
C R = C I R I
where, according to [115], ( R I ) denotes the Random Consistency Index and ( C I ) stands for CI (Table 6). A consistency ratio value of 1.51 was found in this investigation.
If the CR is less than 0.10, the inconsistency is acceptable; if the CR is greater than 0.10, the judgements must be updated. The value 0.094 was determined to be a valid CR value in this investigation.
The GWPZ map was created by Equation (7), which integrates all parameters in order of significance using the Groundwater Potential Index (GWPI) [87].
G W P I = W = 1 m j = 1 n ( W j × X i )
( W j ) is the normalised weight of the ( j t h ) variable, and ( X i ) is the normalised weight of the variable’s ( i t h ) class. The Raster Calculator Tool in ArcGIS was used to perform the corresponding integration.
Table 7 summarises the assigned normalised weights and ranks of thematic layers found for each cemetery.
The cartography created for the GWPZs will be used to map the areas where aquifer recharge is favoured, as well as to define the various indices in the R parameter used in the DRASTIC index.

2.2.2. Mapping of DRASTIC Index Vulnerability

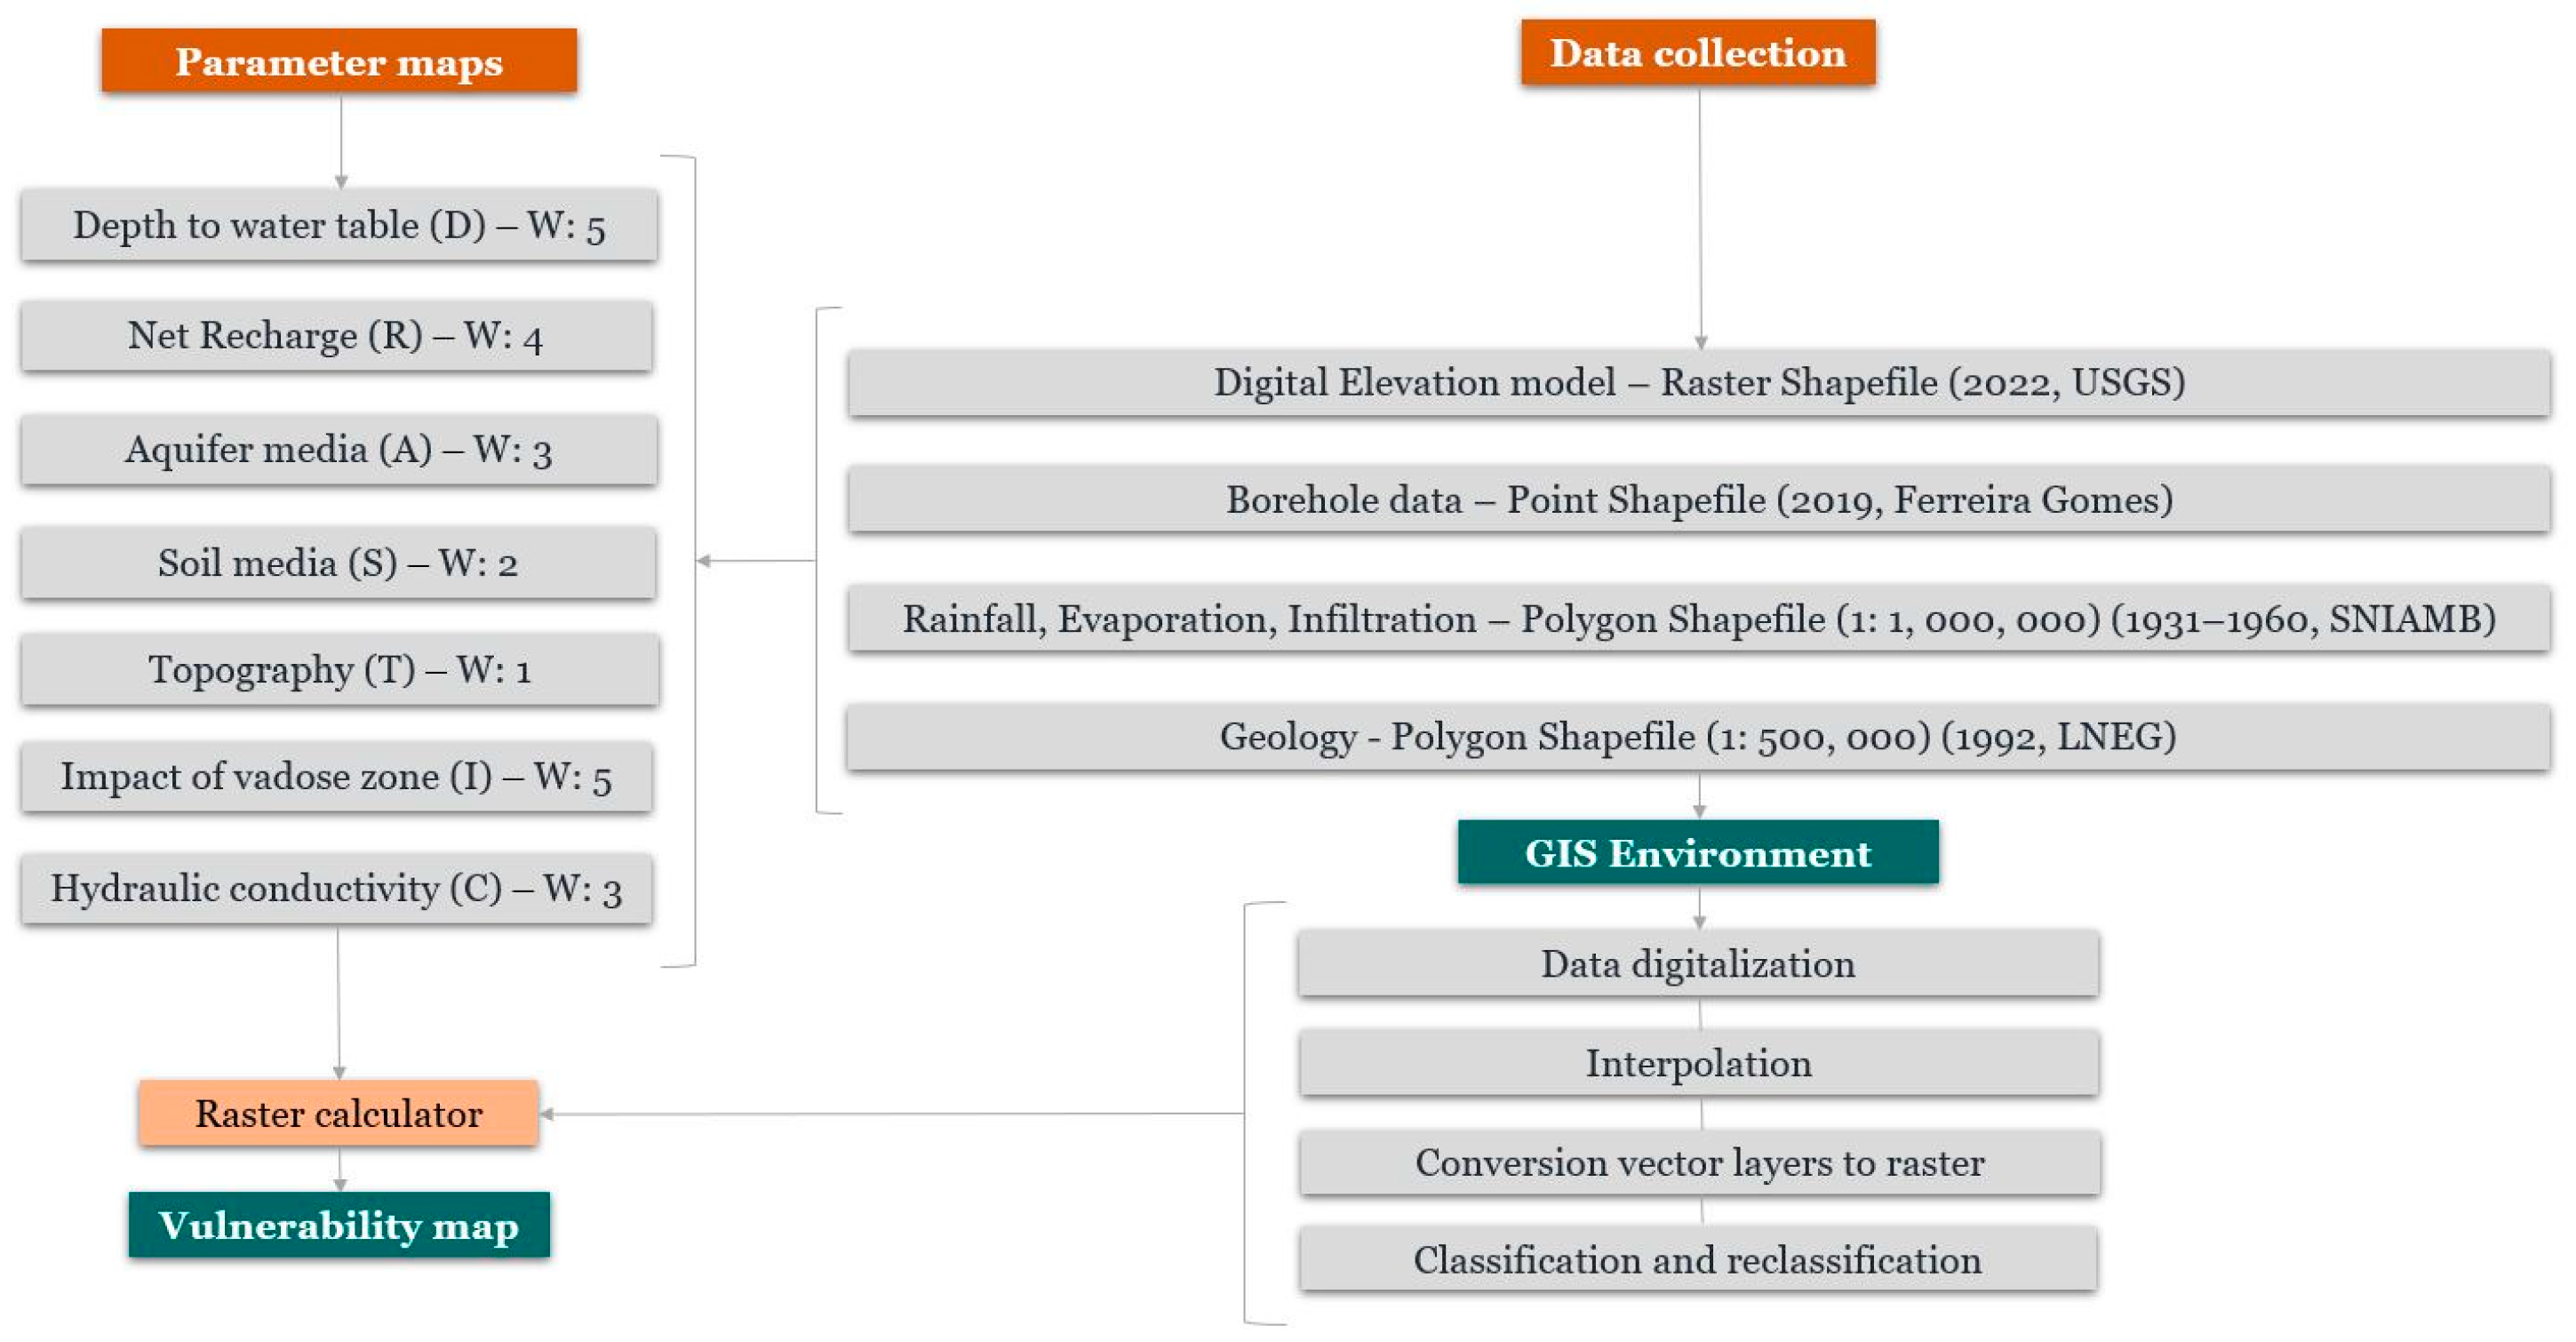
To map the DRASTIC index vulnerability, seven thematic maps were created: depth to groundwater (D), net recharge (R), aquifer material typology (A), soil type (S), topography (T), impact of the vadose zone (I), and hydraulic conductivity (C) [40]. Each parameter was further separated into representative classes, each of which was assigned an index (i), as presented in Table 7, to correlate with the local hydrogeological characteristics (Equation (8)).
D I = D i × D w + R i × R w + A i × A w + S i × S w + T i × T w + I i × I w + C i × C w
where D , R , A , S , T , I , ( C ) are the hydrogeological parameters, i   is the rating for the area being evaluated (1–10), and w is the weight of the factor (1–5) (Table 8) [40]. The weight w of each DRASTIC index parameter represents its relative importance to other attributes. The vulnerability of the aquifer to pollution increases with increasing DRASTIC index.
The procedures for creating the DRASTIC-based vulnerability map are presented in Figure 4. The adopted weights and indices were proposed by Aller et al. [40] and have already been successfully validated in other works [60,69,70,116,117,118,119,120,121,122].
The seven hydrogeological layers were overlayed to produce the DRASTIC vulnerability index map using the ArcGIS raster calculator. Table 9 displays the quantitative and qualitative classifications of aquifer pollution susceptibility, which are categories modified from the values presented in Hamza et al. [57] and LNEC. In Portuguese studies, this division is the most prevalent.
Equation (10) presents the computational procedure used to generate the DRASTIC-based vulnerability map. It was adapted from [68] and involved arithmetic operations of maps according to Equation (9) and the values in Table 8 to overlap the seven thematic maps. Equation (10) was used to generate the value of every cell in the vulnerability map by performing an arithmetic operation. Values were stored in every cell of each thematic map. To create the vulnerability map, Equation (8) was added to the raster calculator function.
M i j k m n × W = k = 1 t m M 11 k M 12 k M 21 k M 22 k M m 1 k M m 2 k M 1 n k M 2 n k M m n k × W k
where M i j k   is the vector of cell values from each thematic map in line i and row j , m and n are the dimensions of the thematic grid map, k is the thematic map, t m is the number of thematic maps, and W is the vector of values associated with each cell.
S i j m n = S 11 S 12 S 21 S 22 S m 1 S m 2 S 1 n S 2 n S m n
where S i j   is the vector of cell values for the suitability map in lines i and j and m and n are the dimensions of the suitability grid map.

2.2.3. Mapping of Specific DRASTIC Vulnerability

Changes were then introduced to the specific DRASTIC [124], considering the current groundwater abstractions in the territory, in two phases: (i) first, the lithological units were classified according to the classic DRASTIC index (DI), with the same values that define potential vulnerability, degree of vulnerability, and qualitative vulnerability class (Table 10); (ii) second, the various units were reclassified according to the location of water catchments and springs; factors considered: (a) presence of geological singularities (OGSs), such as lithological contacts, veins, faults, and fractures, with real or potential connection to water catchments and aquifers; (b) location of the geological unit (LGU) in relation to water catchments and springs. Depending on the circumstances listed below, detailed reclassification may result in a higher or lower degree of classification; the final classification was identified as Specific DRASTIC to differentiate it from the typical situation. Several scenarios were considered for the OGS Factor: (i) the unit maintains the vulnerability class under the general DRASTIC index (DI) if there were no discontinuities with an actual or potential connection to the water abstractions and aquifers; (ii) if there were discontinuities or springs connected to the aquifer, these locations were classified as “very high” to “extremely high” vulnerability (G = 7 to 8); (iii) if there were discontinuities or locations with the potential for springs, these areas were classified as “medium” to “high” vulnerability (G = 5 to 6, Table 10). The following scenarios were considered when it came to the LGU Factor: (i) if the unit was located upstream of areas that either currently or potentially discharge water (groundwater abstractions and springs), it must maintain its vulnerability class under the general DRASTIC index (DI); (ii) if the unit was located downstream of established or prospective areas of natural groundwater discharge, the unit’s class must be lower than the overall DRASTIC index (DI). In certain cases, the unit class may even go from high vulnerability to low vulnerability, depending on the details of each case. Units with a very high vulnerability index may not be accessible to other types of occupation and, as long as the quality of underground resources is maintained, it is often necessary to use the entire area.
When applying the methodology to the case study, the main objective was to maintain good water quality at the different extraction points around the cemeteries.

3. Results and Discussion

3.1. Development of Maps Depicting Site Characteristics

Parameter D affects the extent and degree of physical and chemical attenuation and degradation, as well as the degree of interaction between subsurface constituents and percolating pollutants. Parameter D was estimated using lithology and correlation with studies carried out in that area [124,125].
Parameter R signifies the volume of water that infiltrates through the ground surface and reaches the water table within a specified land area The expected recharge rate was computed by the Thornthwaite method [126] and, additionally, it will be connected to the GWPZ map.
Geotechnical properties are intricately connected to parameter A, which denotes the attenuation potential based on the lithology within the saturated zone. The geological map of Portugal, sourced from LNEG at a scale of 1:500,000 [127], supplied the necessary information for computing the partial indices A, I, and C. The importance of parameter I in determining vulnerability is due to its impact on the residence time of pollutants in the unsaturated zone, and consequently, the probability of attenuation. The capacity of the aquifer to transport water, as indicated by parameter C, affects both the hydraulic gradient and the groundwater flow. High conductivity readings indicate a high risk of contamination. Singhal and Gupta’s abacus [128] was used to calculate this parameter.
A geological map of the study area is shown in Figure 5. With a geological history spanning approximately 180 million years, the Figueira da Foz region is distinguished by both the more recent geodynamic setting of the Cenozoic deposits and the numerous Mesozoic evolutionary stages of the Lusitanian Basin [129]. Stratigraphic units within the study region are arranged in a substantial column extending from the Mesozoic (Upper Triassic) to the present, positioned discordantly over Precambrian and Paleozoic metasediments [129]. Cemetery UC9 is located within the Cabaços limestone and marl units, categorised within the middle to upper Oxfordian period. The brown or black fine-grained flint nodules are connected to the micro-sparitic and clayey micritic limestone decimetre scales deposited in freshwater limnic environments [130]. This unit has a thickness of about 250 m, attitudes of N20° W, 10–15° W; the limestone expresses itself more towards the base; this unit has poor aquifer suitability despite being quite fractured. Cemetery UC10 is in the Costa de Arnes crowded limestone unit, which consists of marly limestones, limestone sandstones, and marls with a lapped surface that is concreted or piled [130]. This unit has a thickness of 50 to 60 m, with a semi-parallel attitude to the previous unit; the base is composed of marls with detrital components, acquiring aquifer–aquitard characteristics. Clayish soils with a high specific surface area and cation-exchange capacity (CEC) are the most common because they maximise the retention of fluids and metals [131]. For a few reasons, limestone aquifers are especially susceptible to pollution namely due to the karst morphology that they are prone to develop. Sinkholes and sinking streams are excellent ways for pollutants to seep from the topsoil into an underlying aquifer.
The cemeteries are in the Mondego River Basin. One of the Mondego River’s tributaries on the left bank, the Pranto River, forms the western boundary of the municipality of Soure. It is distinguished by a low-lying area with elevations below 50 m until it joins the Mondego River at a height of roughly 2 m, known as the Vale do Pranto [124,132]. The river basin receives water from multiple streams and flows over alluvium that has been deposited on clays, marls, and limestones [124,129]. The extent of the fluctuations in water levels between the wet and dry seasons, along with the significant alterations in the flow of the springs through which they discharge, suggests that the self-regulating capacity of the karst aquifer systems is limited. There could be a 50–60% infiltration rate [132]. UC10 and the Bicanho Medical Spa are situated in the same lithological unit. Cemetery UC9 is in the ‘Orla Ocidental Indiferenciada da Bacia do Mondego’ (OOIBM) aquifer system (Figure 6). Cemetery UC10 is in the ‘Figueira da Foz-Gesteira’ aquifer system (Meso–Cenozoic) (Figure 7).
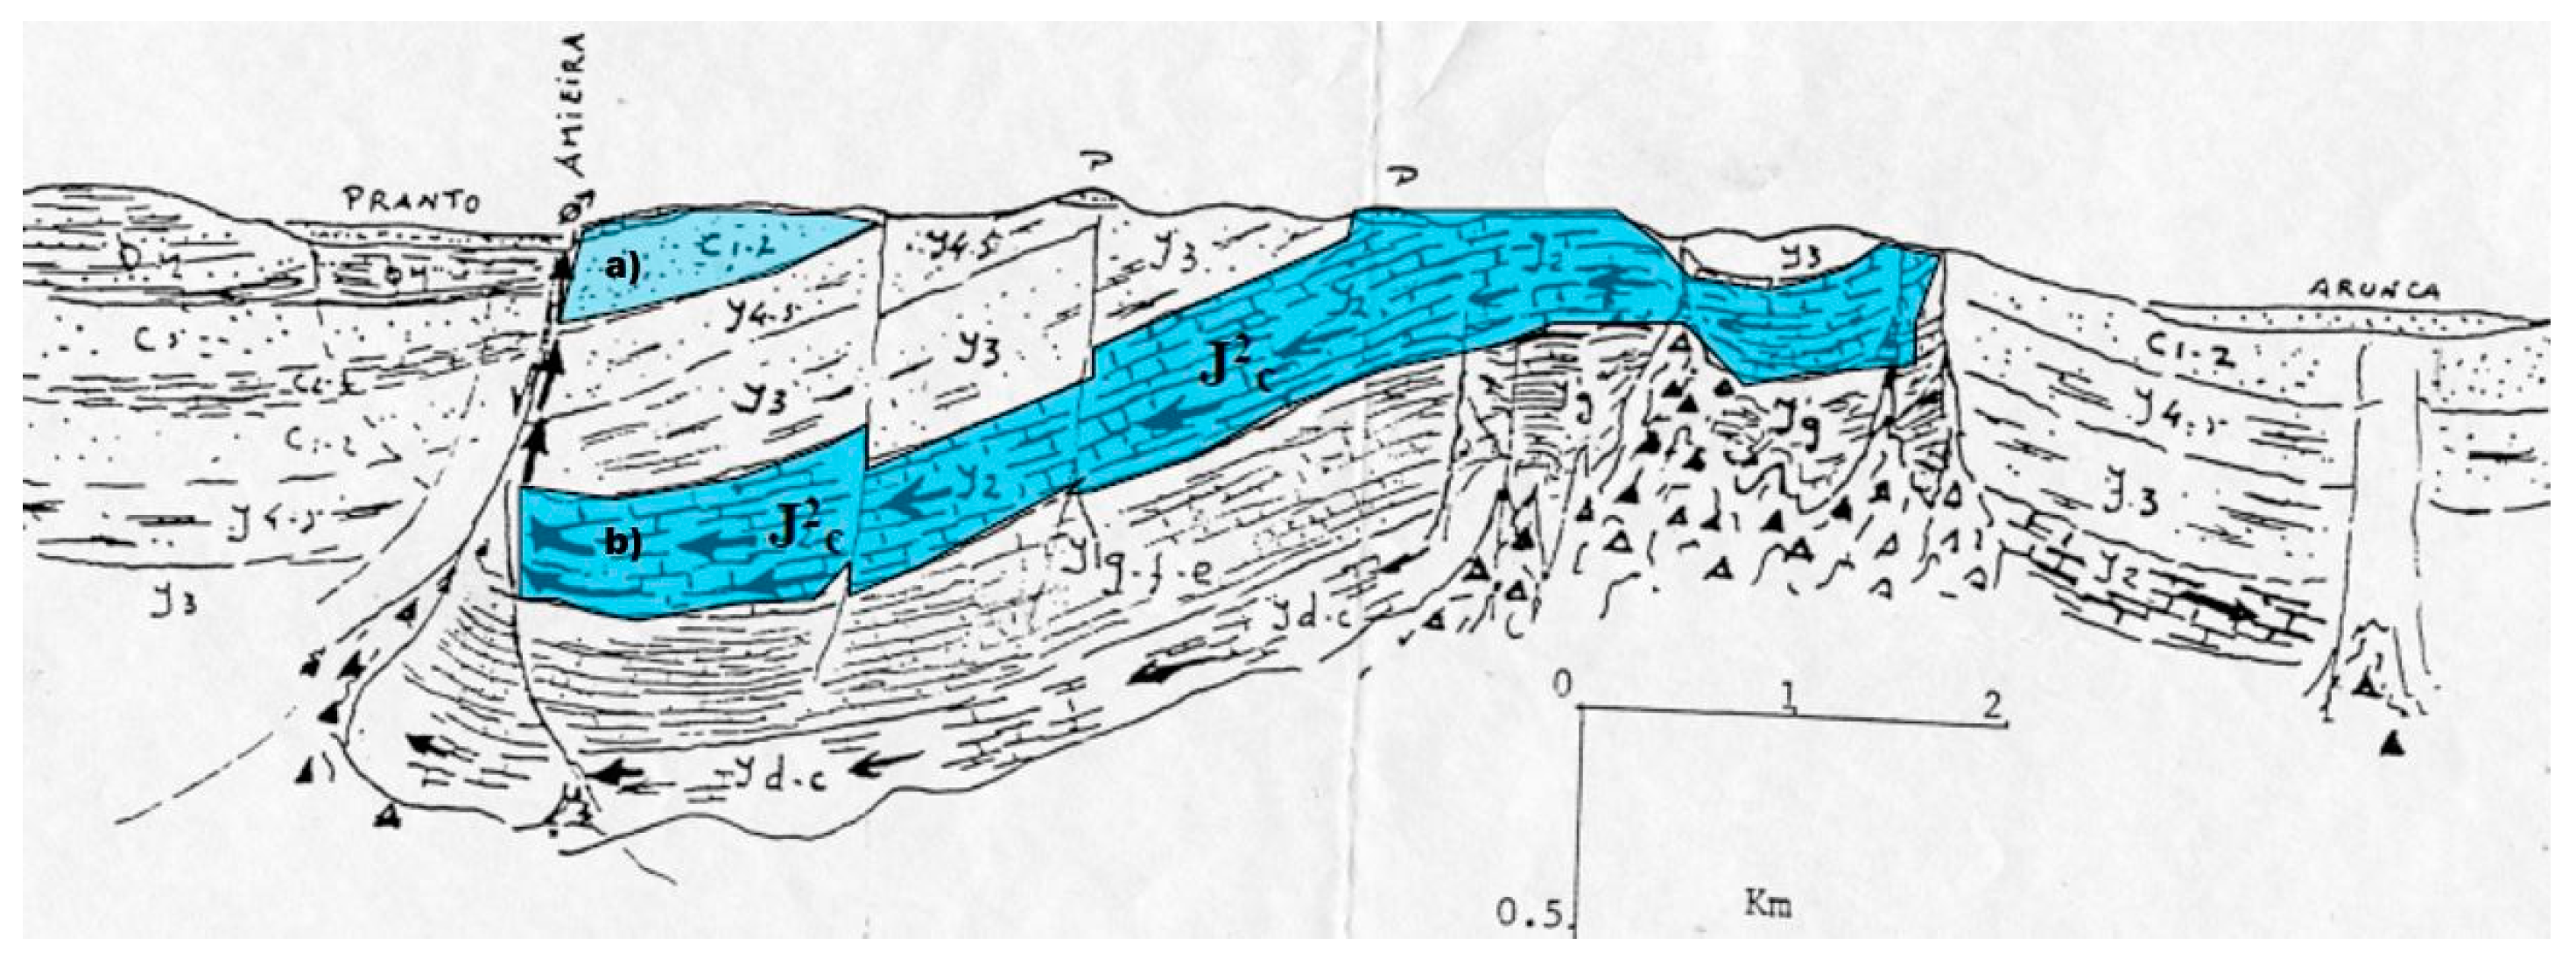
UC10 and the Bicanho Medical Spa are both located in the same aquifer system, as are UC9, numerous water wells, and some springs. The conceptual flow model of the ‘Figueira da Foz-Gesteira’ aquifer system (a) is essentially a geological volume composed primarily of porous detrital sediments that exhibit a diverse array of textures and lenticular structures. The system appears multi-layered because the clayey layers divide the multiple aquifer units. Owing to the wide range of granulometric compositions, hydraulic properties can vary significantly between sites. Karstification also affects the transmissive and storage capacities. These aquifers are especially susceptible to pollution owing to infiltration and rapid flow through karst structures. They also have a very low capacity for self-cleaning and the rapid spread of pathogens. A conceptual model (Figure 7) proposed by Portugal Ferreira [125] for the study area suggests that recharge occurs to the NE and at higher elevations, particularly in the Cabo Mondego limestone and marl units, and then evolves to the SW until the Pranto Fault.
The cemeteries are located near the Atlantic coast and nested within the climate region of the west coast. Their Köppen Geiger classification is Csb, meaning that their climate is mesothermal (humid temperate) with a long and hot dry season in July. This climate is typical of the Mediterranean region owing to the influence of the ocean [133]. The coastal climate of the Mondego Basin is classified as type C2 B’2 according to the Thornthwaite climate classification [126] and it becomes wetter as the height of the basin increases. Using information gathered from the Portuguese Climate website [133], the Thornthwaite method (Figure 8) was used to determine the region’s actual annual evapotranspiration. The air temperature in the study area ranges from 14.2 °C to 29.1 °C, with an average annual precipitation of 852.4 mm and actual evapotranspiration of 587.9 mm. The hydrological balance results led to the following conclusions: there is a dry period and a wet period. The first, known as the wet period, is represented by the water deficit (DH), which lasts from May/June to September, and the second, known as the water surplus (SH), extends from November to May. The water surplus is divided into two components: surface runoff (R) and underground runoff (G), resulting in SH = R + G = 264.5 L/m2, which is initially very modest due to the contribution from underground recharge.
Parameter S assesses soil characteristics in the upper weathered zone to minimize the risk of pollution. Despite the endogenous features of cadavers influencing decomposition (e.g., age at death, cause of death, and fat content), concerns about burial soil and its impact on human taphonomy remain significant. The soil comprises an aqueous phase with dissolved elements, a gas phase, as well as biological and solid components, encompassing both organic and inorganic materials. Ferreira Gomes [124] looked closely at the data regarding each unit’s soil type. The soil of both cemeteries is clay loam. This soil has a high potential for surface runoff when fully saturated. Permeability, or the ability of water to pass through soil, is either low or very low. Usually comprising less than 50% sand and more than 40% clay, they have a clayey texture. In some areas, they might also have a high potential for contraction and expansion. All soils that are less than 50 cm deep to a restrictive layer and all soils that have a groundwater table within the first 60 cm of depth were included in this group [132]. Soils with a range of intermediate characteristics, such as clayey sand and sandy clay [134,135,136], are best-suited for cemetery locations.
Changes in slope affect the T parameter as they influence drainage patterns. Flatter regions have become vulnerable to contaminant flows that can reach aquifers. Using topographic data from the USGS [137] and a previously prepared DTM, the slope map (Figure 9) was developed, which delineates zones suitable for aquifer recharge and prone to infiltration of pollutants. According to the slope map, cemetery UC9 has a higher slope (6–12%) than cemetery UC10 (<2%).

3.2. Development of the Thematic Maps and the DRASTIC-Based Vulnerability Map

Based on the data presented in Table 11, seven thematic maps (Figure 10) were created and reclassified for each DRASTIC parameter.
Parameter D assumes a rating of nine for both cemeteries because the unsaturated zone depth is between 1.5 and 4.6 m. The index is relatively high because possible pollutants can enter the aquifer due to the water table being relatively close to the surface (Table 11 and Figure 10a).
The hydrological balance computation and the GWPZ chart indicate that both cemeteries have an index of eight for parameter R. The two cemeteries were evaluated with a recharge rate of 178–254 mm/year because they are situated in lithological units of karst limestones, which are favoured for aquifer recharge (Table 11 and Figure 10b).
Pollutant dilution and dispersion were significantly impacted by saturation zone water content and net recharge. Parameter A is determined by the lithological material in the saturated zone; lithological unit III—Costa de Arnes crowded limestones (Upper Cretaceous, free aquifer), and lithological unit VI—Cabaços limestones and Marls (Upper Jurassic, free to confined/semi-confined aquifer), were assigned an index of 10, the maximum because they were classified as Karstified limestones, units that are extremely permeable and allow for much faster water flow within the saturated zone (Table 11 and Figure 10c). As a pollutant reservoir and filter, the soil solid phase’s capacity to retain and release hazardous chemical species and microbes is essential. Both cemeteries received an index of three due to their location on clay loam soil. Clay, which is composed of smaller particles, has a greater surface area and can retain more water (Table 10 and Figure 10d).
The UC9 cemetery is situated in a convex area with medium slopes (6–12%), earning a rating of five on the T parameter. In contrast, the UC10 cemetery is situated in a flat area with a 2% slope, earning a rating of 10. Contaminants in UC10 can linger long enough on the surface to penetrate (Table 11 and Figure 10e).
In terms of parameter I, both the UC9 and UC10 cemeteries are in lithological units with a lithological index of 10, the highest level, because they are Karstified limestones with a very short contact time with the pollutant (Table 11 and Figure 10f).
Lastly, an index of eight was given to the UC9 and UC10 cemeteries concerning parameter C. For the respective units where the cemeteries are located, a hydraulic conductivity of approximately 40.7 to 81.5 m/day was estimated (Table 11 and Figure 10g).
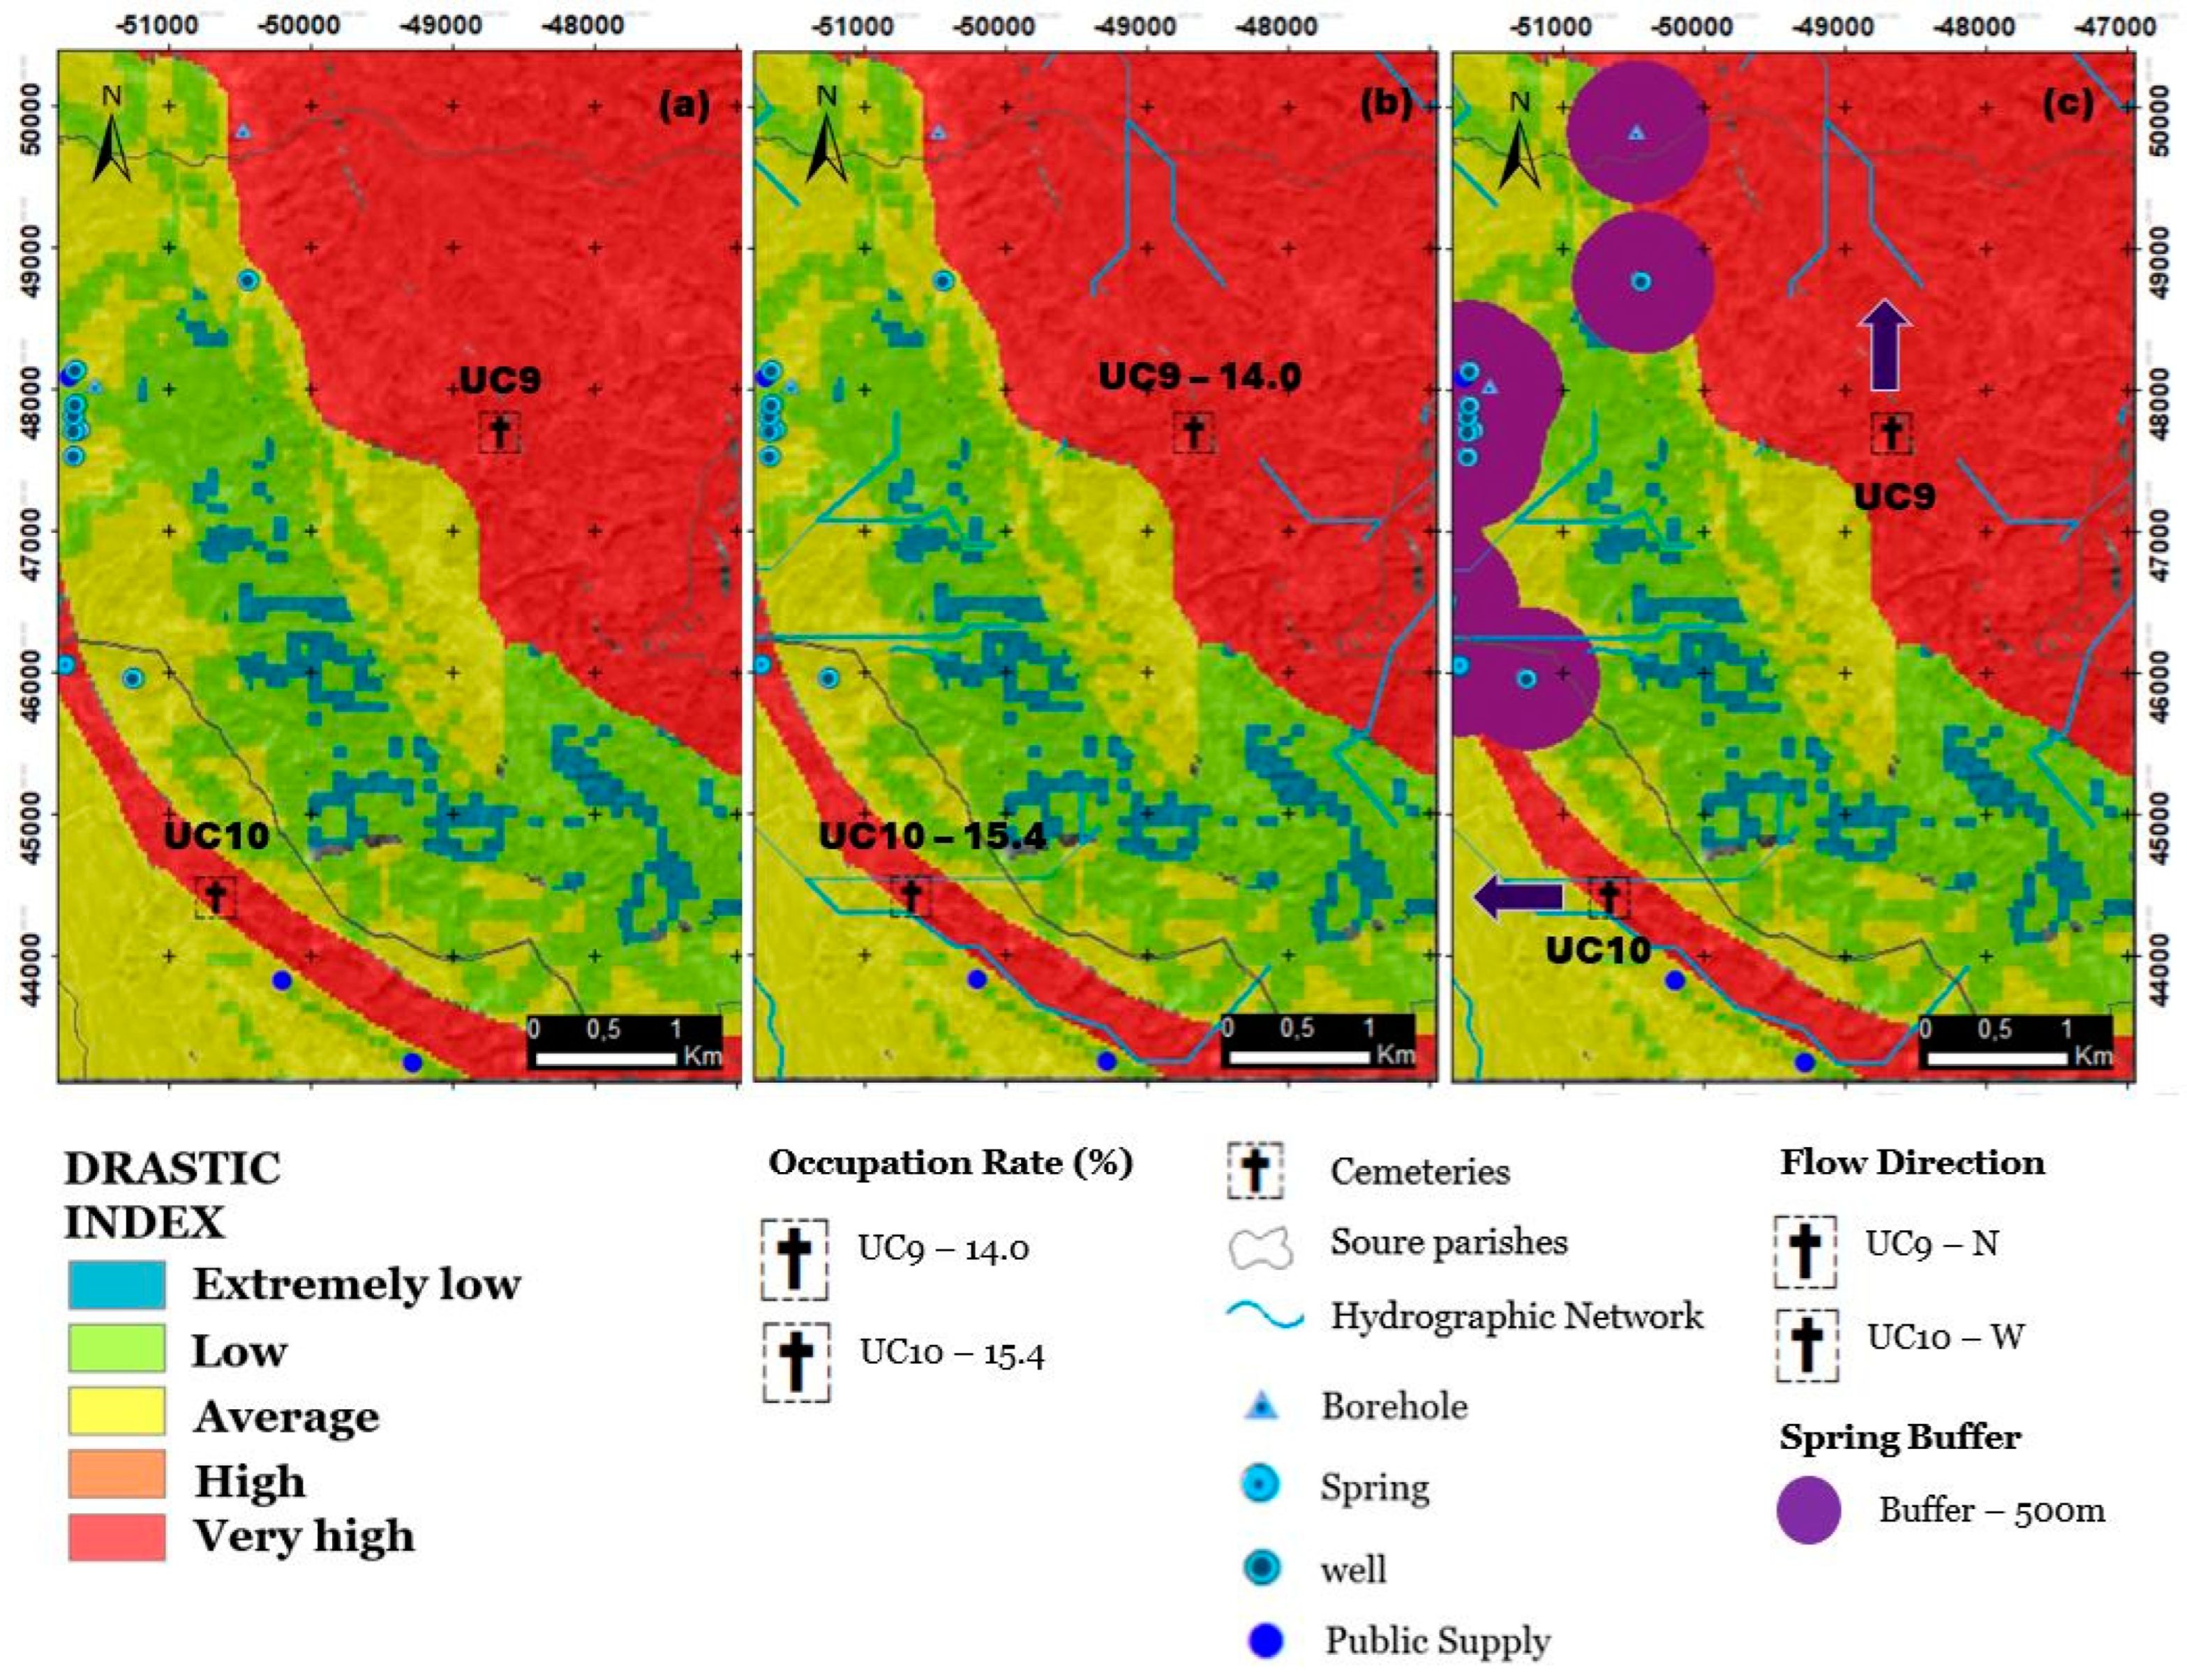
The vulnerability map (Figure 11) was then produced using the raster calculator function and Equation (8), weights from Figure 4, ratings from Table 8, and GIS matrix operations through Equations (9) and (10). The study area’s values ranged from 105 (extremely low vulnerability) to 197 (very high vulnerability). The cemeteries at UC9 and UC19 are in areas with values of 192 and 197, respectively, indicating extremely high vulnerability (Figure 11a). It is required that an environmental monitoring programme is implemented at cemetery UC10, akin to that described in Directive 1999/31/EC [138], for groundwater uses (e.g., wells, holes, springs, and hot springs). With less clay present, weaker, less purifying soils at the surface, and a location in a flat area where pollutants are more likely to seep into the aquifer, UC10 is more vulnerable than UC9. The following factors contributed to vulnerability: I > D > R > A > C > S > T.
The occupation rate map (Figure 11b) was constructed from the cemetery surface area (TSC), grave surface area (SAB) (typically 2.6 m × 1.5 m, length × width), and occupancy rate (SAB/TSC ratio) observed for 2014 in [139]. A flow direction map was also created to safeguard water quality (Figure 11c). Pedrosa et al. [139] note that UC9 (14.0%) has a marginally lower occupancy rate than UC10 (15.4%) for each cemetery (Figure 11b).
According to the flow direction tool, surface waters in UC9 flow to the north and in UC10 to the west (Figure 11c, blue arrows)Although the 500 m buffer applied to all georeferenced water points is still quite far from the cemeteries in question, it is important to remember that the shared aquifer units are quite close (Figure 11c). However, it is established that in this case, there is no reason for the cemeteries under study to be concerned about any water hole becoming contaminated. It is critical to remember that many homes have water extraction points that are not listed in any database.
Every lithological unit’s unique DRASTIC analysis is displayed in degrees in Table 12, and the representation is shown in Figure 12. Because Unit I have no OGS and does not affect the locations of cemeteries or georeferenced water sources, it will move from degree 5 to 4. Unit II behaves similarly to Unit I, but because UC10 has a superficial flow to the west that is draining in that direction, it will keep the degree at 4, not drop it to 3. Considering that Unit III is a part of the same aquifer system as the mineral water resource at Bicanho Medical Spa, there are numerous particularities to consider. The OGS reports that there are no discontinuities or faults near the UC10. Meanwhile, the LGU notes that although the cemetery is situated downstream of the georeferenced water points, the grade of 7 will be preserved because of the significance of these same resources. Georeferenced water points are present in Unit IV, but they are all upstream of Unit 10 itself. Even though there are a lot of discontinuities in the unit in question, none of them seem to be dangerous for moving potential contaminants from UC10. The grade of five will be upheld for security concerns. There are large discontinuities and some faults cross-unit V, but they do not affect where the cemeteries are located. Upstream, there is only one georeferenced water point, so the grade will drop from 4 to 3. Unit VI contains UC9 as well as a water point that provides a public supply upstream. The degree will persist because UC9 is in an area with northerly surface runoff. Because of how far away UC9 is from the water point, it has not been raised to a higher level. Unit VII features a georeferenced water point, discontinuity, and a few faults; however, because it is situated upstream of the cemeteries, the grade will drop from 7 to 6. Unit VIII is finally distinguished from the other units by a density of lineament and two clearly defined faults crossing it. Nevertheless, they do not affect the cemeteries’ susceptibility to pollution. If the grade was dropped from 4 to 3, georeferenced water points were also protected.

3.3. Final Considerations

Despite the large number of studies that have evaluated the quality of groundwater under the influence of cemeteries [140,141,142], relatively few have looked at soil and unsaturated zone characteristics in their evaluations. The only study that examined cemeteries was conducted by Razack and Sinan [73], who discovered that the observed DRASTIC indices ranged from 71 to 204. By applying the alternative GOD method to create vulnerability maps in four cemeteries in Santa Maria (Brazil), Kemerich et al. [143] determined that these cemeteries were the cause of bacterial contamination in the groundwater.
Owing to urban sprawl, a growing population, and ongoing conflicts between different land uses, the number of deaths is currently rising, while the amount of available land is decreasing. According to several sources [35,56,141], cemeteries should be located 250–500 m away from sources of potable groundwater and 30 m away from water courses or springs to reduce the risk of groundwater contamination; sands underlain by impermeable layers, for example, are not suitable as a burial substrate due to their high permeability; It is advantageous to have a thick aeration layer and a deep underground water table; the ground between graves and tombs must be made watertight; they must not be situated in sloped terrain or areas susceptible to landslides; there are no water-filled graves. According to previous studies, cemeteries have a high potential for pollution, especially if improperly built [144]. Cemeteries should have their surrounding groundwater and surface water quality investigated. In the absence of specific guidelines, monitoring should adhere to the Landfill Directive’s best practices for water monitoring near landfill sites (Directive 1999/31/EC) [53].
Human decomposition can contaminate groundwater in the vicinity of cemeteries, but not because of any specific toxicity, but rather because it raises naturally occurring organic and inorganic substance levels to a point where the groundwater becomes unsuitable for any use [145,146]. Cemetery and burial ground risk management has been researched [28,127,147,148,149,150,151,152]. Increased nutrient concentrations, particularly nitrate compounds [7,13], have been found, and groundwater has been identified as the primary cemetery pollutant receptor [28,144,153,154,155].
The impact of numerous anthropogenic sources of pollution is the driving force behind most studies on groundwater vulnerability assessment; however, because of the location of the equipment and the lack of other notable nearby sources of pollution, this study particularly focused on pollution from cemeteries. People who use contaminated groundwater as their household water supply are at risk of spreading regional epidemics. As a result, because it contains important information, management organisations for cemeteries as well as entities in charge of environmental vulnerability and public health vigilance should replicate this study. A risk-based decision-making framework proposed by Pollard et al. [155] has been widely adopted in the UK and other European countries.
Future societal challenges will encourage the construction of technologically advanced cemeteries with digital systems (humidity, temperature, pH, and physical–chemical parameters sensors) that will allow the state of degradation of bodies to be accurately assessed without the need to open the graves. Currently, “green funeral” practices are increasing, where a tree is planted next to the buried body, and there are already forest cemeteries, eco-cemeteries, and natural memorial reserves. In the future, new contaminants will emerge related to the development of medical, industrial, and agricultural practices (so-called emerging contaminants), which will generate concern in the management of municipal services, such as cemeteries, as they can affect the water cycle.

4. Conclusions

This investigation made it possible to identify areas at risk of groundwater contamination from surface runoff from two cemeteries in the Soure region (Portugal), through the construction of a vulnerability map based on the DRASTIC and DRASTIC-specific indices and applying GIS tools and operations. Cemeteries can be a significant source of water contamination, particularly in vulnerable areas where this practice is the main source of pollution. The vulnerability map allowed for the identification of areas with different susceptibilities to contamination (ranging from “Low” to “Very high” for the DRASTIC index and from “Very Low” to “Very high” for the Specific DRASTIC).
Both cemeteries are in an area of high vulnerability to aquifer contamination, though UC10 is slightly more vulnerable in quantitative terms. Its location in an area with a lower slope (2%), which promotes infiltration, along with a higher drainage density and more favourable soil occupation and use—along with a higher TWI—all contribute to this. UC9 is in an area that has higher line density, SPI value, distance to rivers, and NDVI, but the environment is not as favourable for aquifer recharge and infiltration as UC10. The two cemeteries are situated in nearly identical lithological units in terms of hydraulics, which justifies the same vulnerability in terms of quality. Because the UC10 cemetery is close to the mineral resource of the Bicanho Medical Spa, within the same aquifer unit, and is a highly unique and sensitive resource, it must be closely monitored.
Hydrogeological cartography and groundwater vulnerability maps are excellent resources for helping the description, analysis, modelling, and communication of groundwater resource management. The production of maps from hydrogeological models like the DRASTIC index is made possible by the high potential of GIS for processing and analysing complex geo-referenced data. Particularly now that space is an issue in densely populated areas, GIS has shown to be an effective cemetery management tool.

Author Contributions

Conceptualization, V.G., A.A., L.F.G. and V.C.; methodology, V.G., A.A. and L.F.G.; software, V.G. and P.G.A.; validation, A.A., P.G.A., L.F.G. and V.C.; formal analysis, V.G., A.A. and L.F.G.; investigation, V.G., A.A. and L.F.G.; resources, V.C.; data curation, V.G.; writing—original draft preparation, V.G.; writing—review and editing, A.A., P.G.A., L.F.G. and V.C.; visualization, V.G.; supervision, A.A., L.F.G. and V.C.; project administration, V.C.; All authors have read and agreed to the published version of the manuscript.

Funding

This research received no external funding.

Data Availability Statement

The data presented in the manuscript were produced by us, either by applying the ArcGIS 10.8.2 or by personalised calculation based on the mathematical expressions presented. These data have not been published.

Acknowledgments

The authors are very grateful for the support granted by the Research Unit GeoBioTec, through the project reference UIDB/04035/2020, funded by the Fundação para a Ciência e a Tecnologia, IP/MCTES through national funds (PIDDAC).

Conflicts of Interest

The authors declare no conflict of interest.

References

  1. Guttman, S.; Watson, J.; Miller, V. Till Death Do We Pollute, and Beyond: The Potential Pollution of Cemeteries and Crematoriums. Trent Univ. 2012. Available online: https://ia800209.us.archive.org/12/items/tilDeathDoWePolluteAndBeyondThePotentialPollutionOfCemeteriesAnd/TillDeathDoWePollute.pdf (accessed on 1 August 2023).
  2. Turajo, K.A.; Abubakar, B.S.U.I.; Dammo, M.N.; Sangodoyin, A.Y. Burial practice and its effect on groundwater pollution in Maiduguri, Nigeria. Environ. Sci. Pollut. Res. 2019, 26, 23372–23385. [Google Scholar] [CrossRef] [PubMed]
  3. Egbimhaulu, A.E.; Sophia, O.D.; Korede, A.S.; Adenike, O.E.; Adegboyega, A.O.; Omonigho, D.E.; Efeovbokhan, E.V. Contamination assessment of underground water around a cemetery: Case study of Ayobo cemetery in Lagos, Nigeria. Int. J. Eng. Technol. 2020, 13, 1283–1288. Available online: https://www.ripublication.com/irph/ijert20/ijertv13n6_28.pdf (accessed on 1 August 2023).
  4. Rugg, J. Defining the place of burial: What makes a cemetery a cemetery? Mortality 2020, 5, 259–275. [Google Scholar] [CrossRef]
  5. Dian, Z. Land for the Dead; Locating Urban Cemeteries. A Case Study of Guilin, China. Master’s Thesis, International Institute for Geo-Information Science and Earth Observation, Enschede, The Netherlands, 2004; pp. 1–86. Available online: http://www.itc.nl/library/papers_2004/msc/upla/zhang_dian.pdf (accessed on 1 August 2023).
  6. Larkin, M.T. An Analysis of Land Use Planning Policies for Cemeteries in Ontario. Doctoral Dissertation, Digital Commons Ryerson University, Toronto, Canada, 2011. Available online: https://digital.library.ryerson.ca/islandora/object/RULA%3A2200 (accessed on 1 August 2023).
  7. Nguyen, T.; Nguyen, L. Groundwater pollution by longstanding cemetery and solutions for urban cemetery planning in Ho Chi Minh City—From reality to solutions. MATEC Web Conf. 2018, 193, 02008. [Google Scholar] [CrossRef]
  8. Zychowski, J.; Bryndal, T. Impact of cemeteries on groundwater contamination by bacteria and viruses–A review. J. Water Health 2015, 13, 285–301. [Google Scholar] [CrossRef] [PubMed]
  9. Canning, L.; Szmigin, I. Death and disposal: The universal, environmental dilemma. J. Mark. Manag. 2010, 26, 1129–1142. [Google Scholar] [CrossRef]
  10. Neckel, A.; Costa, C.; Mario, D.; Sabadin, C.; Bodah, E. Environmental damage and public health threat caused by cemeteries: A proposal of ideal cemeteries for the growing urban sprawl. Urbe 2017, 9, 216–230. [Google Scholar] [CrossRef]
  11. Kandoli, S.J.; Alidadi, H.; Najafpoor, A.A.; Mehrabpour, M.; Hosseinzadeh, A.; Momeni, F. Assessment of cemetery effects on groundwater quality using GIS. Desalination Water Treat. 2019, 168, 235–242. [Google Scholar] [CrossRef]
  12. Trindade, F.R.; Neckel, A. Meio Ambiente e Cemitérios, 2nd ed.; Goellner: Passo Fundo, Brazil, 2014; Volume 1. (In Portuguese) [Google Scholar]
  13. Vaezihir, A.; Mohammadi, S. Groundwater contamination sourced from the main cemetery of Tabriz. Iran. Environ. Forensics 2016, 17, 172–182. [Google Scholar] [CrossRef]
  14. Jonker, C.; Olivier, J. Mineral contamination from cemetery soils: Case study of Zandfontein Cemetery, South Africa. Int. J. Environ. Res. Public Health 2012, 9, 511–520. [Google Scholar] [CrossRef]
  15. Idehen, O.; Ezenwa, I.M. Influence of third cemetery location on the quality of domestic and groundwater resources in Benin City, Nigeria. J. Appl. Sci. Environ. Manag. 2019, 23, 5–11. [Google Scholar] [CrossRef]
  16. Turner, B.; Haygarth, P. Phosphorus forms and concentrations in leachate under four grassland soil types. Soil Sci. Soc. Am. J. 2000, 64, 1090–1099. [Google Scholar] [CrossRef]
  17. Engelbrecht, J.F.P. Groundwater pollution from cemeteries. In Proceedings of the WISA Biennial Conference and Exhibition, Cape Town, Southern Africa, 29–30 March 1998. [Google Scholar]
  18. Wang, J.; Rao, C.Y.; Lu, L.; Zhang, S.L.; Muddassir, M.; Liu, J.Q. Efficient photocatalytic degradation of methyl violet using two new 3D MOFs directed by different carboxylate spacers. CrystEngComm 2021, 23, 741–747. [Google Scholar] [CrossRef]
  19. Pan, Y.; Rao, C.; Tan, X.; Ling, Y.; Singh, A.; Kumar, A.; Li, B.; Liu, J. Cobalt-seamed C-methylpyrogallol[4]arene nanocapsules-derived magnetic carbon cubes as advanced adsorbent toward drug contaminant removal. Chem. Eng. J. 2022, 433, 133857. [Google Scholar] [CrossRef]
  20. Zychowski, J. The impact of cemeteries in Krakow on the natural environment–selected aspects. Geogr. Pol. 2011, 84, 13–32. Available online: https://rcin.org.pl/igipz/publication/17987 (accessed on 3 August 2023). [CrossRef]
  21. Geleta, S.B.; Briand, C.H.; Folkoff, M.E.; Zaprowski, B.J. Cemeteries as Indicators of Post-Settlement Anthropogenic Soil Degradation on the Atlantic Coastal Plain. Hum. Ecol. 2014, 42, 625–635. [Google Scholar] [CrossRef]
  22. Całkosiński, I.; Płoneczka-Janeczko, K.; Ostapska, M.; Dudek, K.; Gamian, A.; Rypuła, K. Microbiological analysis of necrosols collected from urban cemeteries in Poland. BioMed Res. Int. 2015, 2015, 169573. [Google Scholar] [CrossRef]
  23. Killgrove, K.; Montgomery, J. All roads lead to rome: Exploring human migration to the eternal city through biochemistry of skeletons from two imperial-era cemeteries (1st-3rd c AD). PLoS ONE 2016, 11, e0147585. [Google Scholar] [CrossRef]
  24. Morillas, H.; Marcaida, I.; Maguregui, M.; Upasen, S.; Gallego-Cartagena, E.; Madariaga, J.M. Identification of metals and metalloids as hazardous elements in PM2.5 and PM10 collected in a coastal environment affected by diffuse contamination. J. Clean. Prod. 2019, 226, 369–378. [Google Scholar] [CrossRef]
  25. Silva, L.F.; Oliveira, M.L.; Neckel, A.; Maculan, L.S.; Milanes, C.B.; Bodah, B.W.; Cambrussi, L.P.; Dotto, G.L. Effects of atmospheric pollutants on human health and deterioration of medieval historical architecture (North Africa, Tunisia). Urban Climb 2022, 41, 101046. [Google Scholar] [CrossRef]
  26. Toscan, P.C.; Neckel, A.; Maculan, L.S.; Korcelski, C.; Oliveira, M.L.S.; Bodah, E.T.; Bodah, B.W.; Kujawa, H.A.; Gonçalves, A.C. Use of geospatial tools to predict the risk of contamination by SARS-CoV-2 in urban cemeteries. Geosci. Front. 2022, 13, 101310. [Google Scholar] [CrossRef] [PubMed]
  27. Neckel, A.; Toscan, P.C.; Kujawa, H.A.; Bodah, B.W.; Korcelski, C.; Maculan, L.S.; de Almeida Silva, C.C.O.; Junior, A.C.G.; Snak, A.; Moro, L.D.; et al. Hazardous elements in urban cemeteries and possible architectural design solutions for a more sustainable environment. Environ. Sci. Pollut. Res. Int. 2023, 30, 50675–50689. [Google Scholar] [CrossRef] [PubMed]
  28. Dent, B.B.; Knight, M.J. Cemeteries: A special kind of landfill. In Proceedings of the IAH Sustainable Solutions Conference, Melbourne, Australia, 8–13 February 1998; International Association of Hydrologists: Kenilworth, UK, 1998. [Google Scholar]
  29. Rodrigues, L.; Pacheco, A. Groundwater contamination from cemeteries cases of study. In Proceedings of the International Symposium: Environment 2010: Situation and Perspectives for the European Union, Porto, Portugal, 6–10 May 2003; Volume 6, pp. 1–6. [Google Scholar]
  30. Hirata, R.; Suhogusoff, A.V. A proteção dos recursos hídricos subterrâneos no Estado de São Paulo [The protection of groundwater resources in São Paulo]. In Proceedings of the XIII Congresso Brasileiro de Águas Subterrâneas [XIII Brazilian Congress on Groundwater], ABAS, Cuiabá, Brazil, 19–22 October 2004; pp. 1–15. (In Portuguese). [Google Scholar]
  31. Neckel, A.; Korcelski, C.; Silva, L.F.O.; Kujawa, H.A.; Bodah, B.W.; Figueiredo, A.M.R.; Maculan, L.S.; Gonçalves, A.C.; Bodah, E.T.; Moro, L.D. Metals in the soil of urban cemeteries in Carazinho (South Brazil) in view of the increase in deaths from COVID-19: Projects for cemeteries to mitigate environmental impacts. Environ. Dev. Sustain. 2021, 24, 10728–10751. [Google Scholar] [CrossRef]
  32. Scalenghe, R.; Pantani, O.L. Connecting existing cemeteries saving good soils (for livings). Sustainability 2020, 12, 93. [Google Scholar] [CrossRef]
  33. Lins, E.; Lins, M.; Baltar, S.; Lins, M.; Maria, C.; Silva, M. Negative environmental impacts generated by cemetery: Case study. Int. J. Adv. Sci. Res. 2019, 4, 16–19. [Google Scholar]
  34. Zume, J.T. Assessing the potential risks of burial practices on groundwater quality in rural north-central Nigeria. J Water Health 2011, 9, 609–616. [Google Scholar] [CrossRef]
  35. NGCC. Potential of Cemetery Developments Assessing the Groundwater Pollution; National Groundwater and Contaminated Land Center: Bristol, UK, 2002; 13p.
  36. Sale, T.; Parker, B.; Newell, C.; Devlin, J. Management of Contaminants Stored in Low Permeability Zones—A State-of-the-Science Review. SERDP Project ER-1740. Strategic Environmental Research and Development Program. 2013. 348p. Available online: https://archive.org/details/DTIC_ADA619819 (accessed on 16 August 2023).
  37. Fiedler, S.; Dame, T.; Graw, M. Do cemeteries emit drugs? A case study from southern Germany. Environ. Sci. Pollut. Res. 2018, 25, 5393–5400. [Google Scholar] [CrossRef]
  38. Paiqa, P.; Delerue-Matos, C. Determination of pharmaceuticals in groundwater collected in five cemeteries’ areas (Portugal). Sci. Total Environ. 2016, 569, 16–22. [Google Scholar] [CrossRef]
  39. Albinet, M.; Margat, J. Cartographie de la Vulnérabilité à la Pollution des Nappes D’eau Souterraine; Bureau de Recherches Géologiques et Minières: Paris, France, 1970; Volume 2, pp. 13–22. (In French)
  40. Aller, L.; Lehr, J.H.; Petty, R. DRASTIC: A Standardized System to Evaluate Groundwater Pollution Potential Using Hydrogeologic Settings; National Water Well Association: Westerville, OH, USA, 1987. [Google Scholar]
  41. Vrba, J.; Zaporozec, A. Guidebook on mapping groundwater vulnerability. In IAH International Contributions to Hydrogeology; FRG, Heise Verlag: Hannover, Germany, 1994; p. 16. [Google Scholar]
  42. Gogu, R.C.; Dassargues, A. Current trends and future challenges in groundwater vulnerability assessment using overlay and index methods. Environ. Geol. 2000, 39, 549–559. [Google Scholar] [CrossRef]
  43. Machiwal, D.; Jha, M.; Singh, V.; Mohan, C. Assessment and mapping of groundwater vulnerability to pollution: Current status and challenges. Earth Sci. Rev. 2018, 185, 901–927. [Google Scholar] [CrossRef]
  44. Wachniew, P.; Zurek, A.J.; Stumpp, C.; Gemitzi, A.; Gargini, A.; Filippini, M.; Rozanski, K.; Meeks, J.; Kvaerner, J.; Witczak, S. Toward operational methods for the assessment of intrinsic groundwater vulnerability: A review. Crit. Rev. Environ. Sci. Technol. 2016, 46, 827–884. [Google Scholar] [CrossRef]
  45. Shirazi, S.; Imran, H.; Shatirah, A. GIS-Based DRASTIC method for groundwater vulnerability assessment: A review. J. Risk Res. 2012, 15, 991–1011. [Google Scholar] [CrossRef]
  46. Taghavi, N.; Niven, R.; Paull, D.; Kramer, M. Groundwater vulnerability assessment: A review including new statistical and hybrid methods. Sci. Total Environ. 2022, 822, 153486. [Google Scholar] [CrossRef]
  47. Simunek, J.; Sejna, M.; Van Genuchten, M. The HYDRUS-2D Software Package. 1999. Available online: https://www.pc-progress.com/Downloads/Pgm_Hydrus2D/HYDRUS2D.PDF (accessed on 17 August 2023).
  48. Rodriguez-Galiano, V.; Mendes, M.P.; Garcia-Soldado, M.; Chica-Olmo, M.; Ribeiro, L. Predictive modeling of groundwater nitrate pollution using random forest and multisource variables related to intrinsic and specific vulnerability: A case study in an agricultural setting (Southern Spain). Sci. Total Environ. 2014, 477, 189–206. [Google Scholar] [CrossRef] [PubMed]
  49. Asadi, P.; Hosseini, S.; Ataie-Ashtiani, B.; Simmons, C. Fuzzy vulnerability mapping of urban groundwater systems to nitrate contamination. Environ. Model Softw. 2017, 96, 146–157. [Google Scholar] [CrossRef]
  50. Bordbar, M.; Neshat, A.; Javadi, S. A new hybrid framework for optimization and modification of groundwater vulnerability in coastal aquifer. Environ. Sci. Pollut. Res. 2019, 26, 21808–21827. [Google Scholar] [CrossRef] [PubMed]
  51. Antonakos, A.; Lambrakis, N. Development and testing of three hybrid methods for the assessment of aquifer vulnerability to nitrates, based on the DRASTIC model, an example from NE Korinthia, Greece. J. Hydrol. 2007, 333, 288–304. [Google Scholar] [CrossRef]
  52. Pavlis, M.; Cummins, E. Assessing the vulnerability of groundwater to pollution in Ireland based on the COST-620 Pan-European approach. J. Environ. Manag. 2014, 133, 162–173. [Google Scholar] [CrossRef]
  53. Sorichetta, A.; Ballabio, C.; Masetti, M.; Robinson, G.; Sterlacchini, S. A comparison of data-driven groundwater vulnerability assessment methods. Groundwater 2013, 51, 866–879. [Google Scholar] [CrossRef]
  54. Ivan, V.; Madl-Szonyi, J. State of the art of karst vulnerability assessment: Overview, evaluation and outlook. Environ. Earth Sci. 2017, 76, 25. [Google Scholar] [CrossRef]
  55. Aslam, R.; Shrestha, S.; Pandey, V. Groundwater vulnerability to climate change: A review of the assessment methodology. Sci. Total Environ. 2018, 612, 853–875. [Google Scholar] [CrossRef]
  56. Fisher, G.J. The selection of cemetery sites in South Africa. In Proceedings of the 4th Terrain Evaluation and Data Storage Symposium, Midrand, South Africa, 3–5 August 1994. [Google Scholar]
  57. Hamza, S.; Ahsan, A.; Imteaz, M.; Rahman, A.; Mohammad, T.; Ghazali, A. Accomplishment and subjectivity of GIS-based DRASTIC groundwater vulnerability assessment method: A review. Environ. Earth Sci. 2015, 73, 3063–3076. [Google Scholar] [CrossRef]
  58. Sahoo, S.; Dhar, A.; Kar, A.; Chakraborty, D. Index-based groundwater vulnerability mapping using quantitative parameters. Environ. Earth Sci. 2016, 75, 522. [Google Scholar] [CrossRef]
  59. Barzegar, R.; Moghaddam, A.; Norallahi, S.; Inam, A.; Adamowski, J.; Alizadeh, M.; Nassar, J. Modification of the DRASTIC framework for mapping groundwater vulnerability zones. Groundwater 2020, 58, 441–452. [Google Scholar] [CrossRef]
  60. Hu, X.; Ma, C.; Qi, H.; Guo, X. Groundwater vulnerability assessment using the GALDIT model and the improved DRASTIC model: A case in Weibei Plain, China. Environ. Sci. Pollut. Res. 2018, 25, 32524–32539. [Google Scholar] [CrossRef] [PubMed]
  61. Stempvoort, D.; Ewert, L.; Wassenaar, L. Aquifer vulnerability index: A gis–compatible method for groundwater vulnerability mapping. Can. Water Resour. J. 1993, 18, 25–37. [Google Scholar] [CrossRef]
  62. Sheppard-Simms, E.A. Designing the Integral Cemetery. A Landscape Response to Sydney’s Burial Crisis. Master Thesis, University of New South Wales, Sydney, Australia, 2012. Available online: http://unsworks.unsw.edu.au/fapi/datastream/unsworks:10579/SOURCE01?view=true (accessed on 19 August 2023).
  63. Black, H.; Dubyna, J.; Rapke, M. Policy Approaches to Planning for Cemeteries in Halton Region. Prepared for Halton Region Planning Services Department. 2016. Available online: http://www.waynecaldwell.ca/Students/Projects/Halton%20Region%20Cemetery_Planning_April16.pdf (accessed on 19 August 2023).
  64. Rocque, D. Guidelines for the Selection and Development of Green Cemeteries in Maine. 2017. Available online: https://static1.squarespace.com/static/52f117dae4b0c08037396a20/t/5b92be37758d4635bdea764e/1536343611131/Green+Cemetery+Guidelines+%282%29.pdf (accessed on 19 August 2023).
  65. Reza, M.A. Spatial Planning of Muslim Cemeteries: A Focus on Sustainable Design Practice. In Proceedings of the 4th International Conference on Rebuilding Place, Penang, Malaysia, 6–7 November 2019; Volume 2, pp. 144–159. [Google Scholar] [CrossRef]
  66. Teixeira, J.; Chaminé, H.; Carvalho, J.; Perez-Alberti, A.; Rocha, F. Hydrogeomorphological mapping as a tool in groundwater exploration. J. Maps 2013, 9, 263–273. [Google Scholar] [CrossRef]
  67. Teixeira, J.; Chaminé, H.; Espinha Marques, J.; Carvalho, J.; Pereira, A.; Carvalho, M.; Fonseca, P.; Perez-Alberti, A.; Rocha, F. A comprehensive analysis of groundwater resources using GIS and multicriteria tools (Caldas da Cavaca, Central Portugal): Environmental issues. Environ. Earth Sci. 2015, 73, 2699–2715. [Google Scholar] [CrossRef]
  68. Gonçalves, V.; Albuquerque, A.; Carvalho, P.; Almeida, P.; Cavaleiro, V. Groundwater Vulnerability Assessment to Cemeteries Pollution through GIS-Based DRASTIC Index. Water 2023, 15, 812. [Google Scholar] [CrossRef]
  69. Salem, Z.; Sefelnasr, A.; Hasan, S. Assessment of groundwater vulnerability for pollution using DRASTIC Index, young alluvial plain, Western Nile Delta, Egypt. Arab. J. Geosci. 2019, 12, 727. [Google Scholar] [CrossRef]
  70. Wang, J.; He, J.; Chen, H. Assessment of groundwater contamination risk using hazard quantification, a modified DRASTIC model, and groundwater value, Beijing Plain, China. Sci. Total Environ. 2012, 432, 216–226. [Google Scholar] [CrossRef]
  71. Goncalves, V.; Albuquerque, A.; Almeida, P.G.; Cavaleiro, V. DRASTIC Index GIS-Based Vulnerability Map for the Entre-os-Rios Thermal Aquifer. Water 2022, 14, 2448. [Google Scholar] [CrossRef]
  72. Jang, W.; Engel, B.; Harbor, J.; Theller, L. Aquifer Vulnerability Assessment for Sustainable Groundwater Management Using DRASTIC. Water 2017, 9, 792. [Google Scholar] [CrossRef]
  73. Sinan, M.; Razack, M. An extension to the DRASTIC model to assess groundwater vulnerability to pollution: Application to the Haouz aquifer of Marrakech (Morocco). Environ. Geol. 2009, 57, 349–363. [Google Scholar] [CrossRef]
  74. Ferreira Gomes, L.M.; Albuquerque, M.T.D.; Antunes, I.M.H.R. Expert based DRASTIC Adaptation to Mineralized Aquifer Vulnerability Assessment—Penamacor, Portugal. In Proceedings of the 2015 5th International Conference on Environment Science and Engineering, Istanbul, Turkey, 24–25 April 2015; Volume 83. [Google Scholar]
  75. Silva-Bessa, A.; Madureira-Carvalho, Á.; Dawson, L.; Ferreira, M.T.; Dinis-Oliveira, R.J.; Forbes, S.L. The Importance of Soil on Human Taphonomy and Management of Portuguese Public Cemeteries. Forensic Sci. 2022, 2, 635–649. [Google Scholar] [CrossRef]
  76. Abdelkareem, M.; Al-Arifi, N. The use of remotely sensed data to reveal geologic, structural, and hydrologic features and predict potential areas of water resources in arid regions. Arab. J. Geosci. 2021, 14, 704. [Google Scholar] [CrossRef]
  77. Chaminé, H.I.; Carvalho, J.M.; Afonso, M.J.; Teixeira, J.; Freitas, L. On a dialogue between hard-rock aquifer mapping and hydrogeological conceptual models: Insights into groundwater exploration. Eur. Geol. 2013, 35, 25. [Google Scholar]
  78. Mandel, S. Groundwater Resources: Investigation and Development; Elsevier: Amsterdam, The Netherlands, 2012. [Google Scholar]
  79. Abdelkareem, M.; Abdalla, F. Revealing potential areas of water resources using integrated remote-sensing data and GIS-based analytical hierarchy process. Geocarto Int. 2021, 37, 8672–8696. [Google Scholar] [CrossRef]
  80. Owolabi, S.T.; Madi, K.; Kalumba, A.M. Comparative evaluation of Spatio-temporal attributes of precipitation and streamflow in Buffalo and Tyume Catchments, Eastern Cape, South Africa. Environ. Dev. Sustain. 2020, 23, 4236–4251. [Google Scholar] [CrossRef]
  81. Abdelkareem, M.; El-Baz, F.; Askalany, M.; Akawy, A.; Ghoneim, E. Groundwater prospect map of Egypt’s Qena Valley using data fusion. Int. J. Image Data Fusion 2012, 3, 169–189. [Google Scholar] [CrossRef]
  82. Owolabi, S.T.; Madi, K.; Kalumba, A.M.; Alemaw, B.F. Assessment of recession flow variability and the surficial lithology impact: A case study of Buffalo River catchment, Eastern Cape, South Africa. Environ. Earth Sci. 2020, 79, 187. [Google Scholar] [CrossRef]
  83. Davoudi Moghaddam, D.; Rahmati, O.; Haghizadeh, A.; Kalantari, Z. A Modeling Comparison of Groundwater Potential Mapping in a Mountain Bedrock Aquifer: QUEST, GARP, and RF Models. Arab. J. Geosci. 2015, 8, 913. [Google Scholar] [CrossRef]
  84. Machiwal, D.; Jha, M.K.; Mal, B.C. Assessment of Groundwater Potential in a Semi-Arid Region of India Using Remote Sensing, GIS and MCDM Techniques. Water Resour. Manag. 2011, 25, 1359–1386. [Google Scholar] [CrossRef]
  85. Li, Y.; Abdelkareem, M.; Al-Arifi, N. Mapping Potential Water Resource Areas Using GIS-Based Frequency Ratio and Evidential Belief Function. Water 2023, 15, 480. [Google Scholar] [CrossRef]
  86. Ngenzebuhoro, P.C.; Dassargues, A.; Bahaj, T.; Orban, P.; Kacimi, I.; Nahimana, L. Groundwater flow modeling: A case study of the lower Rusizi Alluvial plain Aquifer, north-western Burundi. Water 2021, 13, 3376. [Google Scholar] [CrossRef]
  87. Chatterjee, S.; Dutta, S. Assessment of groundwater potential zone for sustainable water resource management in south-western part of Birbhum District, West Bengal. Appl. Water Sci. 2022, 12, 40. [Google Scholar] [CrossRef]
  88. Fitts, C.R. Hydrology and Geology. In Groundwater Science; Fitts, C.R., Ed.; Elsevier: Scarborough, ME, USA, 2013; pp. 123–186. ISBN 978-0-12-384705-8. [Google Scholar]
  89. Castillo, J.L.; Martínez Cruz, D.A.; Ramos Leal, J.A.; Tuxpan Vargas, J.; Rodríguez Tapia, S.A.; Marín Celestino, A.E. Delineation of Groundwater Potential Zones (GWPZs) in a Semi-Arid Basin through Remote Sensing, GIS, and AHP Approaches. Water 2022, 14, 2138. [Google Scholar] [CrossRef]
  90. Nampak, H.; Pradhan, B.; Manap, M.A. Application of GIS based data driven evidential belief function model to predict groundwater potential zonation. J. Hydrol. 2014, 513, 283–300. [Google Scholar] [CrossRef]
  91. Rahmati, O.; Pourghasemi, H.R.; Melesse, A.M. Application of GIS-based data driven random forest and maximum entropy models for groundwater potential mapping: A case study at Mehran Region, Iran. Catena 2016, 137, 360–372. [Google Scholar] [CrossRef]
  92. Lee, S.; Hong, S.-M.; Jung, H.-S. GIS-based groundwater potential mapping using artificial neural network and support vector machine models: The case of Boryeong city in Korea. Geocarto Int. 2017, 33, 847–861. [Google Scholar] [CrossRef]
  93. Zeng, Z.; Li, Y.; Lan, J.; Hamidi, A.R. Utilizing User-Generated Content and GIS for Flood Susceptibility Modeling in Mountainous Areas: A Case Study of Jian City in China. Sustainability 2021, 13, 6929. [Google Scholar] [CrossRef]
  94. Jaafarzadeh, M.S.; Tahmasebipour, N.; Haghizadeh, A.; Pourghasemi, H.R.; Rouhani, H. Groundwater recharge potential zonation using an ensemble of machine learning and bivariate statistical models. Sci. Rep. 2021, 11, 5587. [Google Scholar] [CrossRef] [PubMed]
  95. Razandi, Y.; Pourghasemi, H.R.; Neisani, N.S.; Rahmati, O. Application of analytical hierarchy process, frequency ratio, and certainty factor models for groundwater potential mapping using GIS. Earth Sci. Inform. 2015, 8, 867–883. [Google Scholar] [CrossRef]
  96. Neshat, A.; Pradhan, B. An integrated DRASTIC model using frequency ratio and two new hybrid methods for groundwater vulnerability assessment. Nat. Hazards 2015, 76, 543–563. [Google Scholar] [CrossRef]
  97. Sresto, M.A.; Siddika, S.; Haque, M.N.; Saroar, M. Application of fuzzy analytic hierarchy process and geospatial technology to identify groundwater potential zones in northwest region of Bangladesh. Environ. Chall. 2021, 5, 100214. [Google Scholar] [CrossRef]
  98. Das, S. Comparison among influencing factor, frequency ratio, and analytical hierarchy process techniques for groundwater potential zonation in Vaitarna basin, Maharashtra, India. Groundw. Sustain. Dev. 2019, 8, 617–629. [Google Scholar] [CrossRef]
  99. Park, I.; Kim, Y.; Lee, S. Groundwater Productivity Potential Mapping Using Evidential Belief Function. Groundwater 2014, 52, 201–207. [Google Scholar] [CrossRef]
  100. Arunbose, S.; Srinivas, Y.; Rajkumar, S.; Nair, N.C.; Kaliraj, S. Remote sensing, GIS and AHP techniques based investigation of groundwater potential zones in the Karumeniyar river basin, Tamil Nadu, southern India. Groundw. Sustain. Dev. 2021, 14, 100586. [Google Scholar] [CrossRef]
  101. Sørensen, R.; Zinko, U.; Seibert, J. On the calculation of the topographic wetness index: Evaluation of different methods based on field observations. Hydrol. Earth Syst. Sci. 2006, 10, 101–112. [Google Scholar] [CrossRef]
  102. SNIAMB. Carta de Precipitação Quantidade Total. Available online: https://sniambgeoviewer.apambiente.pt/GeoDocs/shpzips/AtAmb_1042111_Precipitacao_QuantTotal_Cont.zip (accessed on 2 August 2023).
  103. Sander, P. Lineaments in groundwater exploration: A review of applications and limitations. Hydrogeol. J. 2007, 15, 71–74. [Google Scholar] [CrossRef]
  104. SNIG. Carta de Uso e Ocupação do Solo (COS) para 2018 da Direção-Geral do Território (DGT). Available online: https://dados.gov.pt/pt/datasets/carta-de-uso-e-ocupacao-do-solo-cos-2018-rdf-projeto-cross-forest-land-use-land-cover-map-cos-2018-rdf-cross-forest-project/ (accessed on 3 August 2023).
  105. Beven, K.J.; Kirkby, M.J. A physically based, variable contributing area model of basin hydrology. Hydrol. Sci. Bull. 1979, 24, 43–69. [Google Scholar] [CrossRef]
  106. Grimm, K.; Nasab, M.T.; Chu, X. TWI computations and topographic analysis of depression-dominated surfaces. Water 2018, 10, 663. [Google Scholar] [CrossRef]
  107. Navarro-Hernández, M.I.; Tomás, R.; Lopez-Sanchez, J.M.; Cárdenas-Tristán, A.; Mallorquí, J.J. Spatial analysis of land subsidence in the San Luis potosi valley induced by aquifer overexploitation using the coherent pixels technique (CPT) and sentinel-1 insar observation. Remote Sens. 2020, 12, 3822. [Google Scholar] [CrossRef]
  108. Almanza-Tovar, O.G.; Ramos-Leal, J.A.; Tuxpan-Vargas, J.; Hernández García, G.J.; De Lara-Bashulto, J. Contrast of aquifer vulnerability and water quality indices between a unconfined aquifer and a deep aquifer in arid zones. Bull. Eng. Geol. Environ. 2020, 79, 4579–4593. [Google Scholar] [CrossRef]
  109. Rahmati, O.; Nazari Samani, A.; Mahdavi, M.; Pourghasemi, H.R.; Zeinivand, H. Groundwater potential mapping at Kurdistan region of Iran using analytic hierarchy process and GIS. Arab. J. Geosci. 2015, 8, 7059–7071. [Google Scholar] [CrossRef]
  110. Pathak, D.; Maharjan, R.; Maharjan, N.; Shrestha, S.R.; Timilsina, P. Evaluation of parameter sensitivity for groundwater potential mapping in the mountainous region of Nepal Himalaya. Groundw. Sustain. Dev. 2021, 13, 2–14. [Google Scholar] [CrossRef]
  111. Abdelouhed, F.; Ahmed, A.; Abdellah, A.; Yassine, B.; Mohammed, I. Using GIS and remote sensing for the mapping of potential groundwater zones in fractured environments in the CHAOUIA-Morocco area. Remote Sens. Appl. Soc. Environ. 2021, 23, 100571. [Google Scholar] [CrossRef]
  112. Allafta, H.; Opp, C.; Patra, S. Identification of groundwater potential zones using remote sensing and GIS techniques: A case study of the shatt Al-Arab Basin. Remote Sens. 2021, 13, 112. [Google Scholar] [CrossRef]
  113. Saaty, R.W. The analytic hierarchy process-what it is and how it is used. Math. Model. 1987, 9, 161–176. [Google Scholar] [CrossRef]
  114. Kumar, M.; Singh, S.K.; Kundu, A.; Tyagi, K.; Menon, J.; Frederick, A.; Raj, A.; Lal, D. GIS-based multi-criteria approach to delineate groundwater prospect zone and its sensitivity analysis. Appl. Water Sci. 2022, 12, 71. [Google Scholar] [CrossRef]
  115. Saaty, T.L. The Analytic Hierarchy Process: Planning, Priority Setting, Resources Allocation; McGraw: New York, NY, USA, 1980; ISBN 978-0070543713. [Google Scholar]
  116. Herlinger, R., Jr.; Viero, A. Groundwater vulnerability assessment in coastal plain of Rio Grande do Sul State, Brazil, using drastic and adsorption capacity of soils. Envion. Geol. 2007, 52, 819–829. [Google Scholar] [CrossRef]
  117. Kabera, T.; Zhaohui, L. A GIS Based DRASTIC model for assessing groundwater in shallow aquifer in Yuncheng Basin, Shanxi. China Res. J. Appl. Sci. 2008, 3, 195–205. Available online: https://medwelljournals.com/abstract/?doi=rjasci.2008.195.205 (accessed on 20 August 2023).
  118. Hasiniaina, F.; Zhou, J.; Guoyi, L. Regional assessment of groundwater vulnerability in Tamtsag basin, Mongolia using drastic model. J. Am. Sci. 2010, 6, 65–78. Available online: http://www.jofamericanscience.org/journals/am-sci/am0611/09_3069am0611_65_78.pdf (accessed on 20 August 2023).
  119. Saidi, S.; Bouri, S.; Ben Dhia, H.; Anselme, B. Assessment of groundwater risk using intrinsic vulnerability and hazard mapping: Application to Souassi aquifer. Tunis. Sahel Agric. Water Manag. 2011, 98, 1671–1682. [Google Scholar] [CrossRef]
  120. Hallaq, A.; Elaish, B. Assessment of aquifer vulnerability to contamination in Khanyounis Governorate, Gaza Strip-Palestine, using the DRASTIC model within GIS environment. Arab. J. Geosci. 2012, 5, 833–847. [Google Scholar] [CrossRef]
  121. Shah, S.; Yan, J.; Ullah, I.; Aslam, B.; Tariq, A.; Zhang, L.; Mumtaz, F. Classification of aquifer vulnerability by using the DRASTIC index and geo-electrical techniques. Water 2021, 13, 2144. [Google Scholar] [CrossRef]
  122. Hamed, M.; Dara, R.; Kirlas, M. Groundwater vulnerability assessment using a GIS-based DRASTIC method in Erbil Dumpsite area (Kani Qirzhala), Central Erbil Basin, North Iraq. Res. Sq. 2022, 12, 40. [Google Scholar] [CrossRef]
  123. LNEC. Cartografia da Vulnerabilidade à Poluição das Águas Subterrâneas do Concelho de Montemor-o-Novo Utilizando o Método DRASTIC. Proc. 607/1/14252, Laboratório Nacional de Engenharia Civil, Departamento de Hidráulica, Grupo de Investigação de Águas Subterrâneas, Lisboa. 2002. Available online: www.lnec.pt/en/research/publications/1-4-665/?pg_1529=8 (accessed on 5 August 2023).
  124. Ferreira Gomes. Legalização do Furo SL4—Termas do Bicanho; GDTP-Grupo Desenvolvimento das Termas de Portugal, & Sociedade de Exploração Hidromineral, S.A., Palacedouro, Desenvolvimento Turístico e Imobiliário, S. A.: Porto, Portugal, 2018; 46p, 5 anexos. (In Portuguese) [Google Scholar]
  125. Portugal Ferreira, M. Estudo Hidrogeológico das Termas da Amieira; Relatório Final; A Cavaco. C. Municipal de Soure: Coimbra, Portuga, 1991; 16p. (In Portuguese)
  126. Lencastre, A.; Franco, F.M. Lições de Hidrologia; Universidade Nova de Lisboa: Lisbon, Portugal, 1984; 451p. (In Portuguese) [Google Scholar]
  127. LNEG. Carta Geológica de Portugal Continental, Escala 1:500000, Laboratório Nacional de Engenharia Geológica. 1992. Available online: https://geoportal.lneg.pt/pt/dados_abertos/cartografia_geologica/ (accessed on 3 August 2023).
  128. Singhal, B.; Gupta, R. Applied Hydrogeology of Fractured Rocks, 2nd ed.; Springer: Dordrecht, The Netherlands, 2010. [Google Scholar] [CrossRef]
  129. Trincão, P.; Lopes, E.; Carvalho, J.; Ataíde, S.; Perrolas, M. Beyond Time and Space-The Aspiring Jurassic. Geosciences 2018, 8, 190. [Google Scholar] [CrossRef]
  130. Manuppella, G. Carta Geológica de Portugal na Escala 1/50 000. Notícia Explicativa da Folha 19-C, Figueira da Foz, IGM—Instituto Geológico e Mineiro, Lisboa. 2000. Available online: https://geoportal.lneg.pt/pt/dados_abertos/cartografia_geologica/cgp50k/19-C (accessed on 4 August 2023).
  131. Üçisik, A.S.; Rushbrook, P. The Impact of Cemeteries on the Environment and Public Health. World Health Organization Regional Office for Europe. 1998. Available online: http://apps.who.int/iris/bitstream/10665/108132/1/EURICPEHNA010401(A).pdf (accessed on 5 August 2023).
  132. Almeida, C.; Mendonça, J.; Jesus, M.; Gomes, A. Sistemas Aquíferos de Portugal Continental; Centro de Geologia da Universidade de Lisboa and Instituto Nacional da Água: Lisbon, Portugal, 2000; (In Portuguese). [Google Scholar] [CrossRef]
  133. Portuguese Climate Database. Available online: http://portaldoclima.pt/pt/ (accessed on 12 January 2023).
  134. US Department of Agriculture and Natural Resource Conservation Service (NRCS). Part 630 Hydrology National Engineering Handbook. Chapter 7, Hydrologic Soil Groups. 2009. Available online: http://directives.sc.egov.usda.gov/OpenNonWebContent.aspx?content=22526.wba (accessed on 15 August 2023).
  135. Dippenaar, M.A.; Olivier, J.; Lorentz, S.; Ubomba-Jaswa, E.; Abia, A.L.K.; Diamond, R.E. Environmental Risk Assessment, Monitoring and Management of Cemeteries. Water Research Commission. 2018. Available online: https://www.saieg.co.za/event/environmental-risk-assessment-monitoring-management-cemeteries-2/ (accessed on 15 August 2023).
  136. Fisher, G.J. Selection Criteria for the Placing of Cemetery Sites; Geological Survey of South Africa: Pretoria, South Africa, 1992. [Google Scholar]
  137. USGS, Earth Explorer. Available online: https://earthexplorer.usgs.gov/ (accessed on 3 August 2023).
  138. CEE. Council Directive 1999/31/EC on the Landfill of Waste. In Council of the European Union, Official Journal of the European Communities; Council of the European Union: Brussels, Belgium, 1999; 19p. [Google Scholar]
  139. Pedrosa, A.; Figueiredo, F.P.O.; Azevedo, J.M.M.; Tavares, A.O. Geologia ambiental associada a cemitérios: Estudo de caso na região centro de Portugal. Comun. Geológicas 2010, 101, 1037–1041. Available online: http://www.lneg.pt/iedt/unidades/16/paginas/26/30/185 (accessed on 1 May 2022). (In Portuguese).
  140. da Costa Silva, R.W.; Malagutti Filho, W. Cemitérios como áreas potencialmente contaminadas. Braz. J. Environ. Sci. 2008, 9, 26–35. Available online: http://rbciamb.com.br/index.php/Publicacoes_RBCIAMB/article/view/423 (accessed on 18 January 2023).
  141. Zychowski, J. Impact of cemeteries on groundwater chemistry: A review. CATENA 2012, 93, 29–37. [Google Scholar] [CrossRef]
  142. Baum, C.A.; Becegato, V.A.; Vilela, P.B.; Lavnitcki, L.; Becegato, V.R.; Paulino, A.T. Contamination of groundwater by necro-leachate and the influence of the intervening factors in cemeteries of the municipality of Lages—Brazil. Engenharia Sanit. Ambient. 2022, 27, 683–692. [Google Scholar] [CrossRef]
  143. Kemerich, P.; Filho, L.; Ucker, F.; Correio, C. Influência dos cemitérios na contaminação da água subterrânea em Santa Maria–RS. Águas Subterr. 2010, 24, 129–141. (In Portuguese) [Google Scholar]
  144. Keneil We, B.T. Geochemical Survey of Underground Water Pollution at Ditengteng Northern Cemetery within City of Tshwane Municipality; Faculty of Science, University of Johannesburg: Johannesburg, South Africa, 2007. [Google Scholar]
  145. Pereira, F.; Hara, R.; Gonçalves, L.; Franco, L.; Curtolo, R.; Alves, G.; Severi-Aguiar, G.; Marin-Morales, M. Genotoxic effects of diamine putrescine assessed by comet assay in Wistar rats. Toxicol. Lett. 2014, 229, S114. [Google Scholar] [CrossRef]
  146. WHO. The Impact of Cemeteries on the Environment and Public Health—An Introduction Briefing; EUR/ICP/EHNA 01 04 01 (A); Regional Office for Europe: Copenhagen, Denmark, 1998; pp. 1–11. [Google Scholar]
  147. Hall, B.H.; Hanbury, R. Some geotechnical considerations in the selection of cemetery sites. IMIESA March 1990, 2125. [Google Scholar]
  148. Pacheco, A.; Mendes, J.M.B.; Martins, T.; Hassuda, S.; Kimmelmann, A.A. Cemeteries—A potential risk to groundwater. Water Sci. Technol. 1991, 24, 97–104. [Google Scholar] [CrossRef]
  149. Young, C.P.; Blackmore, K.M.; Reynolds, P.J.; Leavans, A. Pollution Potential of Cemeteries. Water Research Center R&D. Project Record P2/024/1 for the Environment Agency. 1999. Available online: https://assets.publishing.service.gov.uk/media/5a801d98e5274a2e8ab4e45e/str-p223-e-e.pdf (accessed on 5 August 2023).
  150. Spongberg, A.; Becks, P. Inorganic soil contamination from cemetery leachate. Water Air Soil Pollut. 2000, 117, 313–327. [Google Scholar] [CrossRef]
  151. Hart, A.J. Ammonia shadow of my former self: A review of potential groundwater chemical pollution from cemeteries. Land Contam. Reclam. 2005, 13, 239–245. [Google Scholar] [CrossRef]
  152. Dippenaar, M.A. Towards a multi-faceted vadose zone assessment protocol: Cemetery guidelines and application to a burial site located near a seasonal wetland (Pretoria, South Africa). Bull. Eng. Geol. Environ. 2014, 73, 1105–1115. [Google Scholar] [CrossRef]
  153. Buss, S.; Herbert, A.; Morgan, P.; Thornton, S. Review of ammonium attenuation in soil and groundwater. Q. J. Eng. Geol. Hydrogeol. 2003, 37, 347–359. [Google Scholar] [CrossRef]
  154. Dent, B.B. Vulnerability and the unsaturated zone—The case for cemeteries. In Proceedings of the “Where Waters Meet”, Joint Conference of the New Zealand Hydrological Society, International Association of Hydrogeologists Australian Chapter and New Zealand Soil Science Society, Auckland, New Zealand, 30 November–2 December 2005. [Google Scholar]
  155. Pollard, S.J.T.; Hickman, G.A.W.; Irving, P.; Hough, R.L.; Gauntlett, D.M.; Howson, S.; Hart, A.; Gayford, P.; Gent, N. Exposure assessment of carcass disposal options in the event of a notifiable exotic animal disease—Methodology and application to avian influenza virus. Environ. Sci. Technol. 2008, 42, 3145–3154. [Google Scholar] [CrossRef] [PubMed]
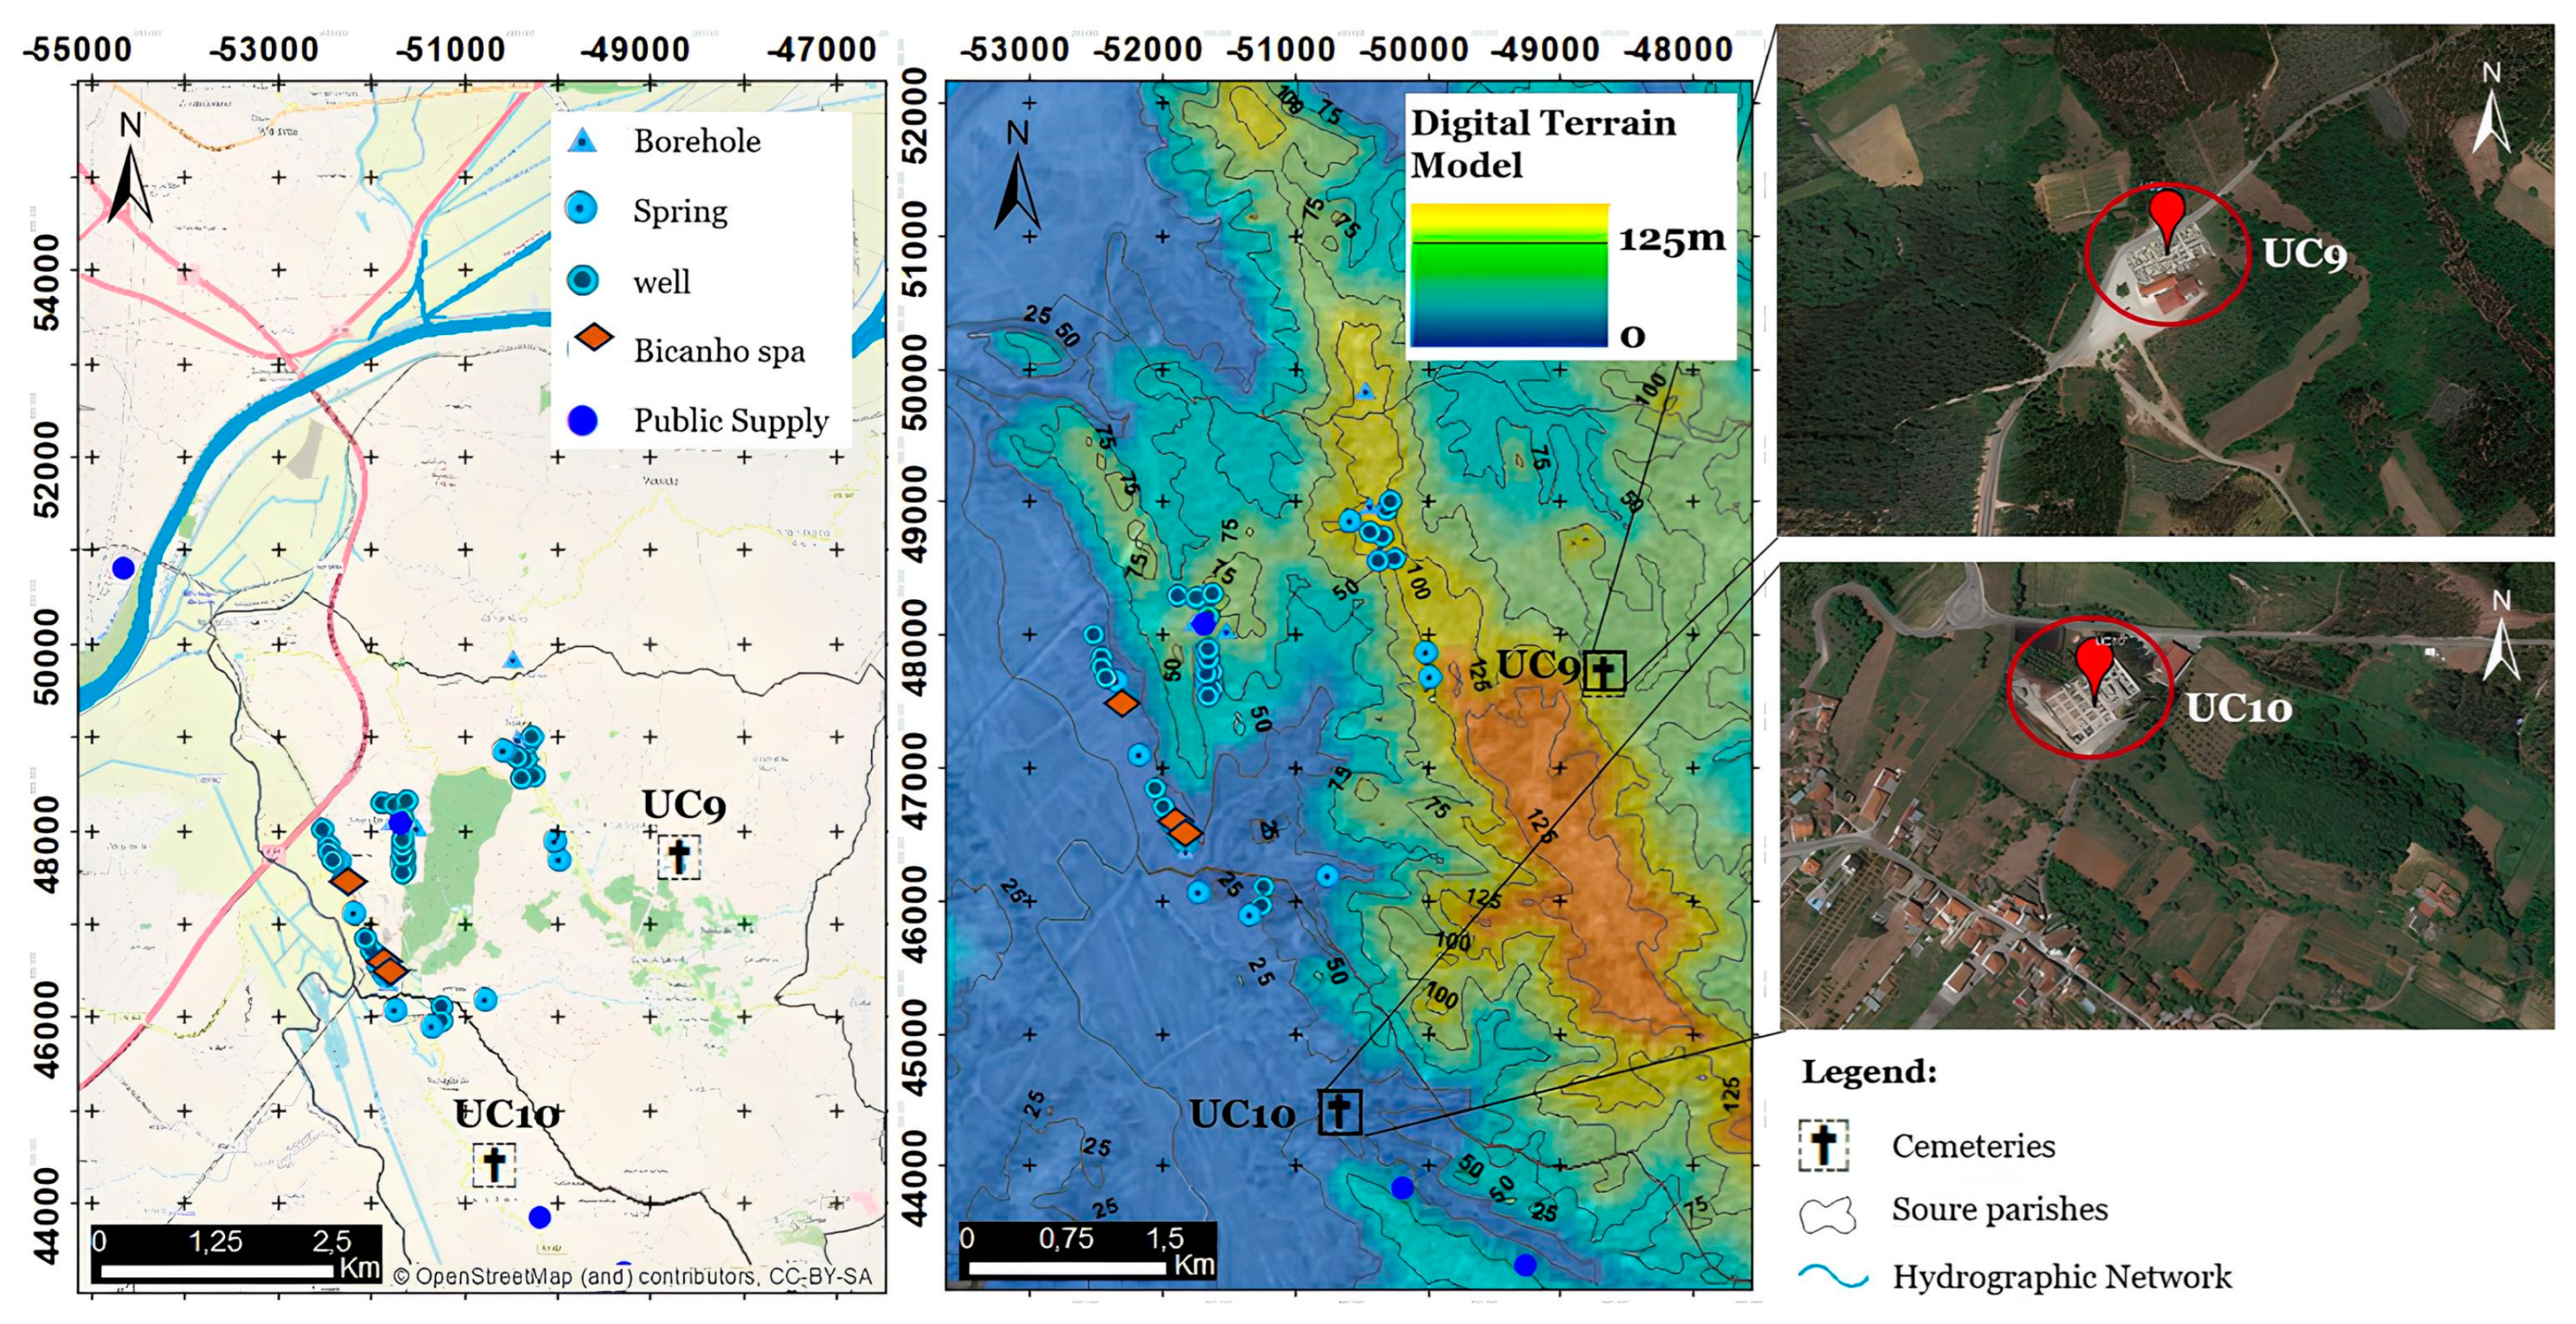
Figure 1. Geographic locations of two cemeteries in the Soure region.
Water 16 00585 g001
Figure 2. Flowchart that uses GIS to create a GWPZ map.
Water 16 00585 g002
Figure 3. (a) Geological reclassification map; (b) Slope reclassification map; (c) Lineament density reclassification map; (d) Dd reclassification map; (e) Rainfall reclassification map; (f) LULC reclassification map; (g) TWI reclassification map; (h) SPI reclassification map; (i) Distance to rivers reclassification map; (j) NDVI reclassification map; (k) GWPZ map.
Water 16 00585 g003aWater 16 00585 g003b
Figure 4. Flowchart that uses the GIS DRASTIC index to create a groundwater vulnerability map.
Water 16 00585 g004
Figure 5. Geological map of the study area (adapted from [132]).
Water 16 00585 g005
Figure 6. Hydrogeological map of the study area.
Water 16 00585 g006
Figure 7. Structures representing the aquifer systems in the Bicanho-Amieira region: (a) Figueira da Foz-Gesteira aquifer system C1–2; (b) Verride aquifer system—J2c [124,125].
Water 16 00585 g007
Figure 8. Monthly hydrological balance in the study area.
Water 16 00585 g008
Figure 9. Slope map (%) of the study area.
Water 16 00585 g009
Figure 10. (a) Parameter D map; (b) Parameter R map; (c) Parameter A map; (d) Parameter S map; (e) Parameter T map; (f) Parameter I map; (g) Parameter C map of the studied area for the DRASTIC model.
Water 16 00585 g010
Figure 11. (a) Vulnerability map to pollution—Drastic index; (b) Occupation rate map; (c) Flow direction and buffer zones to water abstraction points of the studied area.
Water 16 00585 g011
Figure 12. (a) Vulnerability map to pollution—General Drastic index in degrees; (b) Vulnerability map to pollution—Specific Drastic index in degrees.
Water 16 00585 g012
Table 1. Data used for creating GWPZ input data.
Data TypeSourceFormatCell SizeDateUsed to Produce
DEMUSGSRaster30 × 30 m2022Lineament density, NDVI, DTM—Distance to Rivers, TWI, Slope, SPI, Drainage density
RainfallSNIAMBShapefile polygon (1:1,000,000) converted to raster1931–1960Annual precipitation—Recharge
GeologyLNEGShapefile polygon (1:500,000) converted to raster1992Geology
LULCDGTShapefile polygon (1:25,000) converted to raster2018LULC
Note: DEM—Digital Elevation Model; USGS—United States Geological Survey; DTM—Digital Terrain Model; SNIAMB—‘Sistema Nacional de Informação de Ambiente’; LNEG—‘Laboratório Nacional de Energia e Geologia’; LULC—Land use/Land cover; DGT—Direção Geral do Território.
Table 2. Values taken for normalised weights and thematic layer classifications.
VariableUnitsNLW%ClassesClass RankNCR
Geology-0.29629.6Alluvium50.17
Sands and clays with kaolinite50.14
Taveiro sandstones and clays30.10
Carrascal sandstones30.14
Costa de Arnes’ crowded limestones40.14
Boa Viagem sandstones30.10
Cabaços limestones and marls40.10
Cabo Mondego limestones and marls40.10
Slopedegree0.21821.80–250.33
2–840.27
8–1530.20
15–3020.13
>3010.07
Lineament densityKm/Km20.13113.10–0.4910.07
0.49–1.3420.13
1.34–2.1830.20
2.18–3.2340.27
>3.2350.33
Drainage density (Dd)Km/Km20.10810.80–0.3110.07
0.31–0.8820.13
0.88–1.5330.20
1.53–2.4040.27
>2.4050.33
Rainfallmm/year0.0909.00–29810.07
298–74020.13
740–110030.20
1100–207040.27
>207050.33
Land-use/Land-cover (LULC)-0.0464.6Urban Area10.07
Bare Ground20.13
Water30.20
Vegetation40.27
Agricultural50.33
Topographic Wetness Index (TWI)(%)0.0282.80–5.9510.07
5.95–8.8920.13
8.89–11.8430.20
11.84–14.7640.27
>14.7650.33
Stream Power Index (SPI)(%)0.0282.80–5.6810.07
5.68–11.3620.13
11.38–21.3330.20
21.33–57.1140.27
>57.1150.33
Distance to Rivers(m)0.0313.10–138.4550.33
138.45–332.2740.27
332.27–567.6330.20
567.63–858.3720.13
<858.3710.07
NDVI-0.0242.4−1–0.0210.07
−0.02–0.0920.13
0.09–0.2230.20
0.22–0.3140.27
>0.3150.33
Note: NLW—Normalised Layer Weight; NCR—Normalised Class Rank.
Table 3. Matrix for pairwise comparison of variables in the AHP method.
Seven-Variable Pairwise Comparison Matrix for the AHP Method
VariableGeologySlopeLineament DensityDdRainfallLULCTWISPIDistance to RiversNDVI
Geology1234788877
Slope0.500132558877
Lineament Density0.3330.33312534445
Drainage Density0.2500.5000.5001334445
Rainfall0.1430.2000.2000.333145537
LULC0.1250.2000.3330.3330.25013321
TWI0.1250.1250.2500.2500.2000.3331112
SPI0.1250.1250.2500.2500.2000.3331.000112
Distance to Rivers0.1430.1430.2500.2500.3330.5001.0001.00013
NDVI0.1430.1430.2000.2000.1431.0000.5000.5000.5001
SUM2.8874.7698.98310.61722.12626.16735.50035.50030.50040.000
Table 4. Saaty’s scale of relative importance.
ScaleDefinitionExplanation
1Equal significanceEach of the two activities contributes equally to the goal
3moderate significance over the otherOne activity is strongly preferred over another by experience and judgment
5Essential or strong significanceOne activity is favoured over another by experience and judgement
7Very strong significanceAn activity is highly preferred, and its practical dominance is evidenced
9Extreme significanceThe strongest possible order of affirmation is present in the evidence supporting one activity over another
2, 4, 6, 8Values in the middle of the two close decisionsWhen a compromise is required
Table 5. Normalised matrix for pairwise comparison of variables in the AHP method.
Normalised Pairwise Comparison Matrix
VariableGeologySlopeLineament DensityDdRainfallLULCTWISPIDistance to RiversNDVITotalNWT
Geology0.3470.4190.3340.3770.3170.3060.2250.2250.2290.1792.9580.296
Slope0.1730.2100.3340.1890.2260.1910.2250.2250.2290.1792.1810.218
Lineament Density0.1150.0700.1110.1890.2260.1150.1130.1130.1310.1281.3110.131
Drainage Density0.0870.1050.0560.0940.1360.1150.1130.1130.1310.1281.0780.108
Rainfall0.0490.0420.0220.0310.0450.1530.1410.1410.0980.1790.9010.090
LULC0.0430.0420.0370.0310.0110.0380.0840.0840.0650.0260.4610.046
TWI0.0430.0260.0280.0230.0090.0130.0280.0280.0330.0510.2820.028
SPI0.0430.0260.0280.0230.0090.0130.0280.0280.0330.0510.2820.028
Distance to Rivers0.0490.0300.0280.0230.0150.0190.0280.0280.0330.0510.3040.031
NDVI0.0490.0300.0220.0190.0060.0380.0140.0140.0160.0260.2340.024
Table 6. Random Consistency Index (RI) values for n variables.
N123456789101112131415
RI0.000.000.580.901.121.241.321.411.451.511.521.541.561.581.59
Table 7. Assigned normalised weights of thematic layers.
CemeteryGeologySlopeLine DensityDdRainfallLULCTWISPIDistance to RiversNDVIGWPZ
UC94451342425Moderate
UC104514354113Good
Table 8. Partial indices (Ip) used for calculating the DRASTIC index (DI) according to the various parameters and classes.
ParameterPartial Indices (PIs) Function of the Various Parameters and Their Classes
DDepth (m)<1.501.50–4.604.60–9.109.10–15.2015.20–22.9022.90–30.50>30.50
Ip10975321
RRecharge (mm/year)<5151–102102–178178–254>254
Ip13689
AAquifer materialclayey schist, clay-stonemetamorphic/
igneous rock
metamorphic/
igneous-altered rock
glacial depositssandstone, limestone, and claystone, stratifiedsandstonelimestonesand and gravelbasaltcarsified
limestone
Ip1–32–53–54–65–94–94–94–92–109–10
Ip Typical23456668910
SSoil Typethin or absentgravelsandpeatconsistent clay and/or expansiblesandyloamsiltyclayeymuddynon-expan. Clay
Ip1010987654321
TSlope (%)<22–66–1212–18>18
Ip109531
IUnsaturated zoneconfining layerclay/
silt
clayey schist, claystonelimestonesandstonesandstone, limestone, and claystone, stratifiedsand and gravel with many finesmetamorphic/
igneous rock
sand and gravelbasaltcarsified limestone
Ip12–62–52–74–84–84–82–86–92–108–10
Ip Typical133666648910
CK (m/day)<4.14.1–12.212.2–28.528.5–40.740.7–81.5>81.5
Ip1246810
Table 9. Classes of vulnerability defined for DRASTIC [123].
DRASTIC Index
Quantitative ClassesQualitative Vulnerability
23–79Insignificant
80–99Extremely low
100–119Very low
120–139Low
140–159Average
160–179High
180–199Very high
200–226Extremely high
Table 10. Drastic index and associated vulnerabilities [124].
Normal DRASTIC Index [40]Potential Vulnerability (%)DegreeQualitative Vulnerability
<80<301Nonexistent
80–9930–392Very very low
100–11940–493Very low
120–13950–594Low
140–15960–695Moderate
160–17970–796High
180–19980–897Very high
>199>908Extremely high
Table 11. Characteristics of lithological units for the development of thematic DRASTIC maps.
UnitParameterClassIndexWeightPartial IndexDRASTICVulnerability
I—Recent alluvium (free aquifer)D<1.5 m10550148Pollution is usually moderate but can occasionally be very high; it spreads quickly in flooded areas and along gravel lenticles.
R102–178 mm/year6424
ASand and gravel with many fines8324
SMuddy224
T<2%10110
ISand and gravel with many fines6530
C4.1–12.2 m/day236
II—Taveiro sands and clays (Upper Cretaceous, free aquifer)D1.5–4.6 m9545136In general, low, because clay minerals allow heavy-metal adsorption.
R102–178 mm/year6424
ASand and gravel with clay7321
SClay loam326
T2–6%919
ISand and gravel with clay5525
C4.1–12.2 m/day236
III—Costa de Arnes crowded limestones (Upper Cretaceous, free aquifer)D1.5–4.6 m9545197The presence of karst limestones makes the lithological unit that contains UC10 very vulnerable.
R178–254 mm/year8432
AKarsified limestone10330
SClay loam326
T<2%10110
IKarsified limestone10550
C40.7–81.5 m/day8324
IV—Carrascal Sandstones (Middle Cretaceous, free to confined/semi-confined aquifer)D1.5–4.6 m9545159In general, average
R178–254 mm/year8432
ASand and gravel8324
SSilty loam4216
T2–6%919
ISand and gravel with many fines6530
C<4.1 m/day133
V—Sands and clays with kaolinite (Pliocene, free aquifer)D1.5–4.6 m9545136In general, low, because clay minerals allow heavy-metal adsorption.
R102–178 mm/year6424
ASand and gravel with kaolinite7321
SClay loam326
T2–6%919
ISand and gravel with kaolinite5525
C4.1–12.2 m/day236
VI—Cabaços Limestones and Marls (Upper Jurassic, free to confined/semi-confined aquifer)D1.5–4.6 m9545192The presence of karst limestones makes the lithological unit that contains UC9 very vulnerable.
R178–254 mm/year8432
AKarsified limestone10330
SClay loam326
T6–12%515
IKarsified limestone10550
C40.7–81.5 m/day8324
VII—Cabo Mondego Limestones and Marls (Middle Jurassic, free to confined/semi-confined aquifer)D1.5–4.6 m9545189The presence of karst limestones makes the lithological unit very vulnerable.
R102–178 mm/year6424
AKarsified limestone10330
SClay loam326
T<2%10110
IKarsified limestone10550
C40.7–81.5 m/day8324
VIII—Boa Viagem Sandstones (Upper Jurassic, free to confined/semi-confined aquifer)D4.6–9.17535131In general, low
R102–178 mm/year6424
ASandstone, limestone, and claystone, stratified6318
SClay loam3212
T2–6%919
ISandstone, limestone, and claystone, stratified6530
C<4.1 m/day133
Table 12. Drastic index and Specific Drastic index in degrees.
UnitDRASTIC IndexPotential Vulnerability (%)DegreeQualitative VulnerabilitySpecific
Vulnerability Degree
Qualitative Vulnerability
I—Recent alluvium (free aquifer)14860–695Moderate4Low
II—Taveiro sands and clays (Upper Cretaceous, free aquifer)13650–594Low4Low
III—Costa de Arnes crowded limestones (Upper Cretaceous, free aquifer)19780–897Very high7Very high
IV—Carrascal Sandstones (Middle Cretaceous, free to confined/semi-confined aquifer)15960–695Moderate5Moderate
V—Sands and clays with kaolinite (Pliocene, free aquifer)13650–594Low3Very Low
VI—Cabaços Limestones and Marls (Upper Jurassic, free to confined/semi-confined aquifer)19280–897Very high7Very high
VII—Cabo Mondego Limestones and Marls (Middle Jurassic, free to confined/semi-confined aquifer)18980–897Very high6High
VIII—Boa Viagem Sandstones (Upper Jurassic, free to confined/semi-confined aquifer)13150–594Low3Very Low
Disclaimer/Publisher’s Note: The statements, opinions and data contained in all publications are solely those of the individual author(s) and contributor(s) and not of MDPI and/or the editor(s). MDPI and/or the editor(s) disclaim responsibility for any injury to people or property resulting from any ideas, methods, instructions or products referred to in the content.