Article

Seasonal and Monthly Climate Variability in South Korea’s River Basins: Insights from a Multi-Model Ensemble Approach

Department of Civil and Environmental Engineering, Dongguk University, Seoul 04620, Republic of Korea
*
Author to whom correspondence should be addressed.
Water 2024, 16(4), 555; https://doi.org/10.3390/w16040555
Submission received: 5 January 2024 / Revised: 30 January 2024 / Accepted: 6 February 2024 / Published: 12 February 2024

Abstract

:
This study conducts a comprehensive analysis of the impacts of climate change on South Korea’s climate and hydrology, utilizing a Multi-Model Ensemble (MME) approach with thirteen Climate Model Intercomparison Project Phase 5 (CMIP5) models under two Representative Concentration Pathways, RCP4.5 and RCP8.5. We observed an average temperature increase of up to 3.5 °C under RCP8.5 and around 2.0 °C under RCP4.5. Precipitation patterns showed an overall increase, particularly during the summer months, with increases up to 20% under RCP8.5 and 15% under RCP4.5, characterized by more intense and frequent rainfall events. Evapotranspiration rates are projected to rise by approximately 5–10% under RCP8.5 and 3–7% under RCP4.5. Runoff is expected to increase significantly, particularly in the summer and autumn months, with increases up to 25% under RCP8.5 and 18% under RCP4.5. This research focuses on employing the Precipitation Runoff Modeling System (PRMS) to project future streamflow across South Korea, with an emphasis on both monthly and seasonal scales to understand the varying impacts of climate change on different river basins. These climatic changes have profound implications for agriculture, urban water management, and ecosystem sustainability, stressing the need for dynamic and region-specific adaptation measures. This study emphasizes the critical role of localized factors, such as topography, land use, and basin-specific characteristics, in influencing the hydrological cycle under changing climatic conditions.

1. Introduction

Climate models, which operate as mathematical representations of the climate system executed through computer code on high-performance computing systems, derive their primary credibility from adherence to established physical laws [1]. Global Climate Models (GCMs) play a fundamental role in generating climate change scenarios and forming the basis for hydroclimate predictions [2]. However, due to structural differences and simplifications in hypotheses, each GCM exhibits unique characteristics, leading to significant disparities, especially on a local scale. Consequently, the selection and assessment of GCMs profoundly influence future water projections, emphasizing the need for exploration of reliability and credibility [3]. Criteria for model selection include considerations of availability, resolution, and initial applicability assessments [4].
Recent studies, including that by Adelodun et al. [5], have emphasized the importance of evaluating GCMs and their multi-model ensembles (MMEs) for accurate climate projections, particularly in regions with complex climates like South Korea. The inherent variability among GCMs, arising from dynamics, sample sizes, and parametrization processes [6], necessitates a rigorous approach to quantify uncertainties. A recent study by Adib et al., 2023, further highlights the importance of addressing these variabilities and uncertainties in climate modeling, particularly in the context of hydrological impact assessments [7]. This study focuses on using MMEs to address inter-model variability and quantify uncertainties in climate projections, with a specific emphasis on South Korea’s climate and hydrological variables. Our approach is novel in its detailed investigation of seasonal uncertainties within GCMs, a critical aspect in regions like South Korea, where climate impacts vary significantly across seasons. Building on the advancements in GCMs, such as those in the CMIP5 phase, which offer improved physical parameterizations and higher resolution [8], this study integrates the latest understanding of anthropogenic influences on climate [9,10]. These advancements are crucial in refining climate projections and informing adaptation strategies, particularly given the considerable variability in climate scenarios across different GCMs [9,11].
The approach of utilizing multi-model ensembles is supported by studies such as Veerabhadrannavar and Venkatesh [12], Wang et al. [13], and Olmo et al. [14], which further underscore the importance of multi-model ensembles in understanding regional climate variability and enhancing the reliability of climate projections. Moreover, the studies by Zhuan et al. [15], Lane and Kay [16], Nigatu et al. [17], Wen et al. [18], and Jain and Singh [19] provide critical perspectives on the timing and magnitude of human-induced climate change, the hydrological impact of climate change on various global regions, and the comprehensive evaluation of hydrological models for climate change impact assessment. These studies collectively highlight the evolving sophistication in climate modeling and its critical role in informing regional climate change adaptation and mitigation strategies.
In overcoming the constraints of earlier studies, which often relied on a limited number of GCM scenarios due to computational limitations [10], this study expands the scope by incorporating data from 13 CMIP5 scenarios. These scenarios encompass a broad range of temperature and precipitation projections under two distinct emission scenarios: RCP4.5 and RCP8.5. The incorporation of a wide array of scenarios allows for a more comprehensive understanding of potential climate futures. Crucially, we utilize the PRMS to project future streamflow across South Korea, with a particular emphasis on monthly and seasonal analysis. This approach is pivotal in capturing the nuanced variations and inherent uncertainties associated with both RCPs and GCMs, especially given South Korea’s distinct seasonal climate patterns. By conducting a detailed seasonal analysis, our research is poised to unravel the complexities in hydrological responses under varied climate scenarios, thereby enhancing the robustness of our projections.
This comprehensive and detailed methodology is designed to yield more reliable insights into the impacts of climate change on South Korea’s diverse ecosystems and socio-economic frameworks. By providing a more thorough understanding of these impacts, our research supports the development of robust decision-making and adaptation strategies that are tailored to the specific challenges and opportunities presented by climate change in South Korea. This approach marks a significant advancement from previous studies, offering a more detailed and region-specific understanding of climate change implications.

2. Materials and Methods

2.1. Study Area

South Korea, located between latitudes 34° N and 38° N and longitudes 126° E and 130° E, lies in close proximity to the West Pacific Ocean. The country’s weather is markedly seasonal, a characteristic shaped by atmospheric circulation and topographical influences [20]. The East-Asian monsoon brings hot, wet summers, while the Siberian air mass leads to cold, dry winters. Geographically, South Korea is organized into five primary river basins: the Han, Nakdong, Geum, Sumjin, and Yeongsan (Figure 1). The climate of the country is further defined by its distinct seasons: spring (March to May), summer (June to August), autumn (September to November), and winter (December to February). These seasons are each characterized by unique climate conditions, influenced by a combination of continental and oceanic factors. Summers, affected by Pacific high pressure, maintain temperatures of 22–25 °C, while winters, dependent on elevation, see temperatures ranging from −5 °C to −3 °C. Precipitation, averaging 1500 mm in central Korea, rises gradually from north to south. About 70% of the annual rainfall occurs in summer, constituting the rainy season, whereas winter, the driest season, contributes less than 10% of the total annual precipitation.

2.2. Climate and Hydrological Data

For runoff analyses, obtaining long-term natural streamflow data, unaffected by human activity and dam operations, is crucial for calibrating hydrological models. In Korea, access to natural streamflow data is available for 6 multi-purpose dams, which are Guesan, Andong, Imha, Hapcheon, Sumjin, and Yongdam. To calibrate model parameters, daily climate data from 1966 to 2016 was utilized. This observed climate data, extracted from the Ministry of Land, Infrastructure and Transport (MOLIT, www.molit.go.kr) and the Korea Meteorological Administration (KMA, www.kma.go.kr), served as foundational information. Furthermore, daily dam inflow data during the historical period from 1966 to 2016 was obtained from the Korean Water Management Information System (WAMIS, www.wamis.go.kr) for the 6 gauged dam basins.

2.3. Hydrological Model: PRMS

In this study, the hydrological modeling system employed was the precipitation-streamflow modeling system (PRMS), a versatile, modular, and physically based semi-distributed model [21,22]. PRMS operates by simulating both water and energy balances within hydrologic response units (HRUs), which are delineated based on various physiographic characteristics such as slope, elevation, land use, and geology [23]. Daily precipitation, maximum temperature, and minimum temperature are the primary inputs required for the PRMS model [21,22]. Within the PRMS model, the water-balance components encompass precipitation, evapotranspiration, soil moisture, groundwater, and streamflow. Precipitation for each HRU is adjusted monthly using correlation factors, while potential evapotranspiration is computed through the Hamon method, reliant on daily mean temperature and total sunshine hours [24].
PRMS’s modular structure allows for the selection of specific modules tailored to the study area and research objectives, enhancing its adaptability and precision. The model’s spatially distributed approach, through the division of the watershed into HRUs, enables it to capture the spatial variability of hydrological processes. This approach is crucial for accurately simulating the hydrological behavior of complex watersheds. PRMS has been extensively applied in various hydrological studies, including water resource management, climate change impact assessments, and flood forecasting, demonstrating its robustness and reliability in diverse applications.
Parameter estimation for the PRMS model involved utilizing geophysical parameters obtained from geographic information systems (GIS) like area, elevation, aspect, slope, and soil type through maps of land cover, land use, DEM, and soil layers. Eight model parameters underwent optimization using observed flow data from six dam catchments, encompassing equations for surface, subsurface, and groundwater flow. The Rosenbrock scheme, an automatic optimization approach, facilitated parameter calibration [25]. However, acquiring natural streamflow data for ungauged catchments, unaltered by human influence or dam operations, remains a challenge [26]. Although data for natural streamflow is available for 6 multi-purpose dams in Korea, establishing parameters for ungauged catchments requires access to uncontrolled streamflow data.

2.4. Data Downscaled from Global Climate Models (GCMs)

In this study, 13 CMIP5 GCMs were utilized for climate change scenarios under RCP4.5, and RCP8.5 spanning the period 1976–2099. These 13 GCMs with varying resolutions provided daily meteorological data for two RCPs (RCP4.5 and RCP8.5). However, due to their coarse resolution, which necessitated localized assessment, downscaling techniques were applied to adjust the global signals to a regional scale. Three bias-correction techniques, including spatial disaggregation quantile mapping (SDQM), spatial disaggregation detrended quantile mapping (SDDQM), and SDQDM, were used to downscale these scenarios at over 60 South Korean stations. The performance of these downscaled GCMs was evaluated based on their ability to project extreme indices for temperature and precipitation recommended by the World Meteorological Organization ETCCDI [8]. Among the methods, SDQDM consistently exhibited superior performance across various future periods, leading to its selection for downscaled GCMs projections in South Korea. The list of the 13 GCMs is presented in Table 1.

2.5. Projecting Future Climate and Hydrological Data

In this study, the PRMS model served as the primary tool for projecting hydrologic data. Calibration and verification of PRMS parameters for all 109 sub-basins were conducted at six gauging stations using long-term observed streamflow statistics. Utilizing daily downscaled data of maximum temperature, minimum temperature, and precipitation spanning the period from 1976 to 2099, the PRMS model was employed to obtain hydrologic data for each sub-basin. The model generated daily time-series data encompassing precipitation (P), actual evapotranspiration (AET), soil moisture (SM), groundwater (GW), and streamflow (R) for the same duration and across all 13 GCMs. A multi-model ensemble (MME) approach was then applied using the 13 GCMs for subsequent analysis. This study focused on the historical period from 1976 to 2005, which served as a reference period for understanding baseline climate and hydrological conditions. Additionally, three future periods were analyzed: the 2025s (2011–2040), the 2055s (2041–2079), and the 2085s (2071–2099). The historical period is crucial for establishing a benchmark against which changes in climate and hydrological variables in the future periods are compared.
For temperature comparisons, absolute changes were computed by subtracting the mean temperature of the future period from the historic period, while relative changes were expressed as percentages representing the future period’s variation relative to the historical benchmark. Negative changes indicated decreases, while positive changes indicated increases in the future period relative to the historical one. To project future runoff, the PRMS model was driven by daily climate data from the 13 CMIP5 GCMs under two RCPs spanning 1976 to 2099 (Figure 2). The projected time series were segmented into three 30-year periods: the 2025s (2011–2040), 2055s (2041–2079), and 2085s (2071–2099). Comparative analyses against the reference period (1976–2005) involved computing relative changes (%) for precipitation and streamflow, along with absolute changes for temperature in future periods relative to the reference span.

3. Results

3.1. Mean Seasonal Changes in Climate and Hydrological Variables across South Korea

3.1.1. Projected Precipitation and Temperature Changes

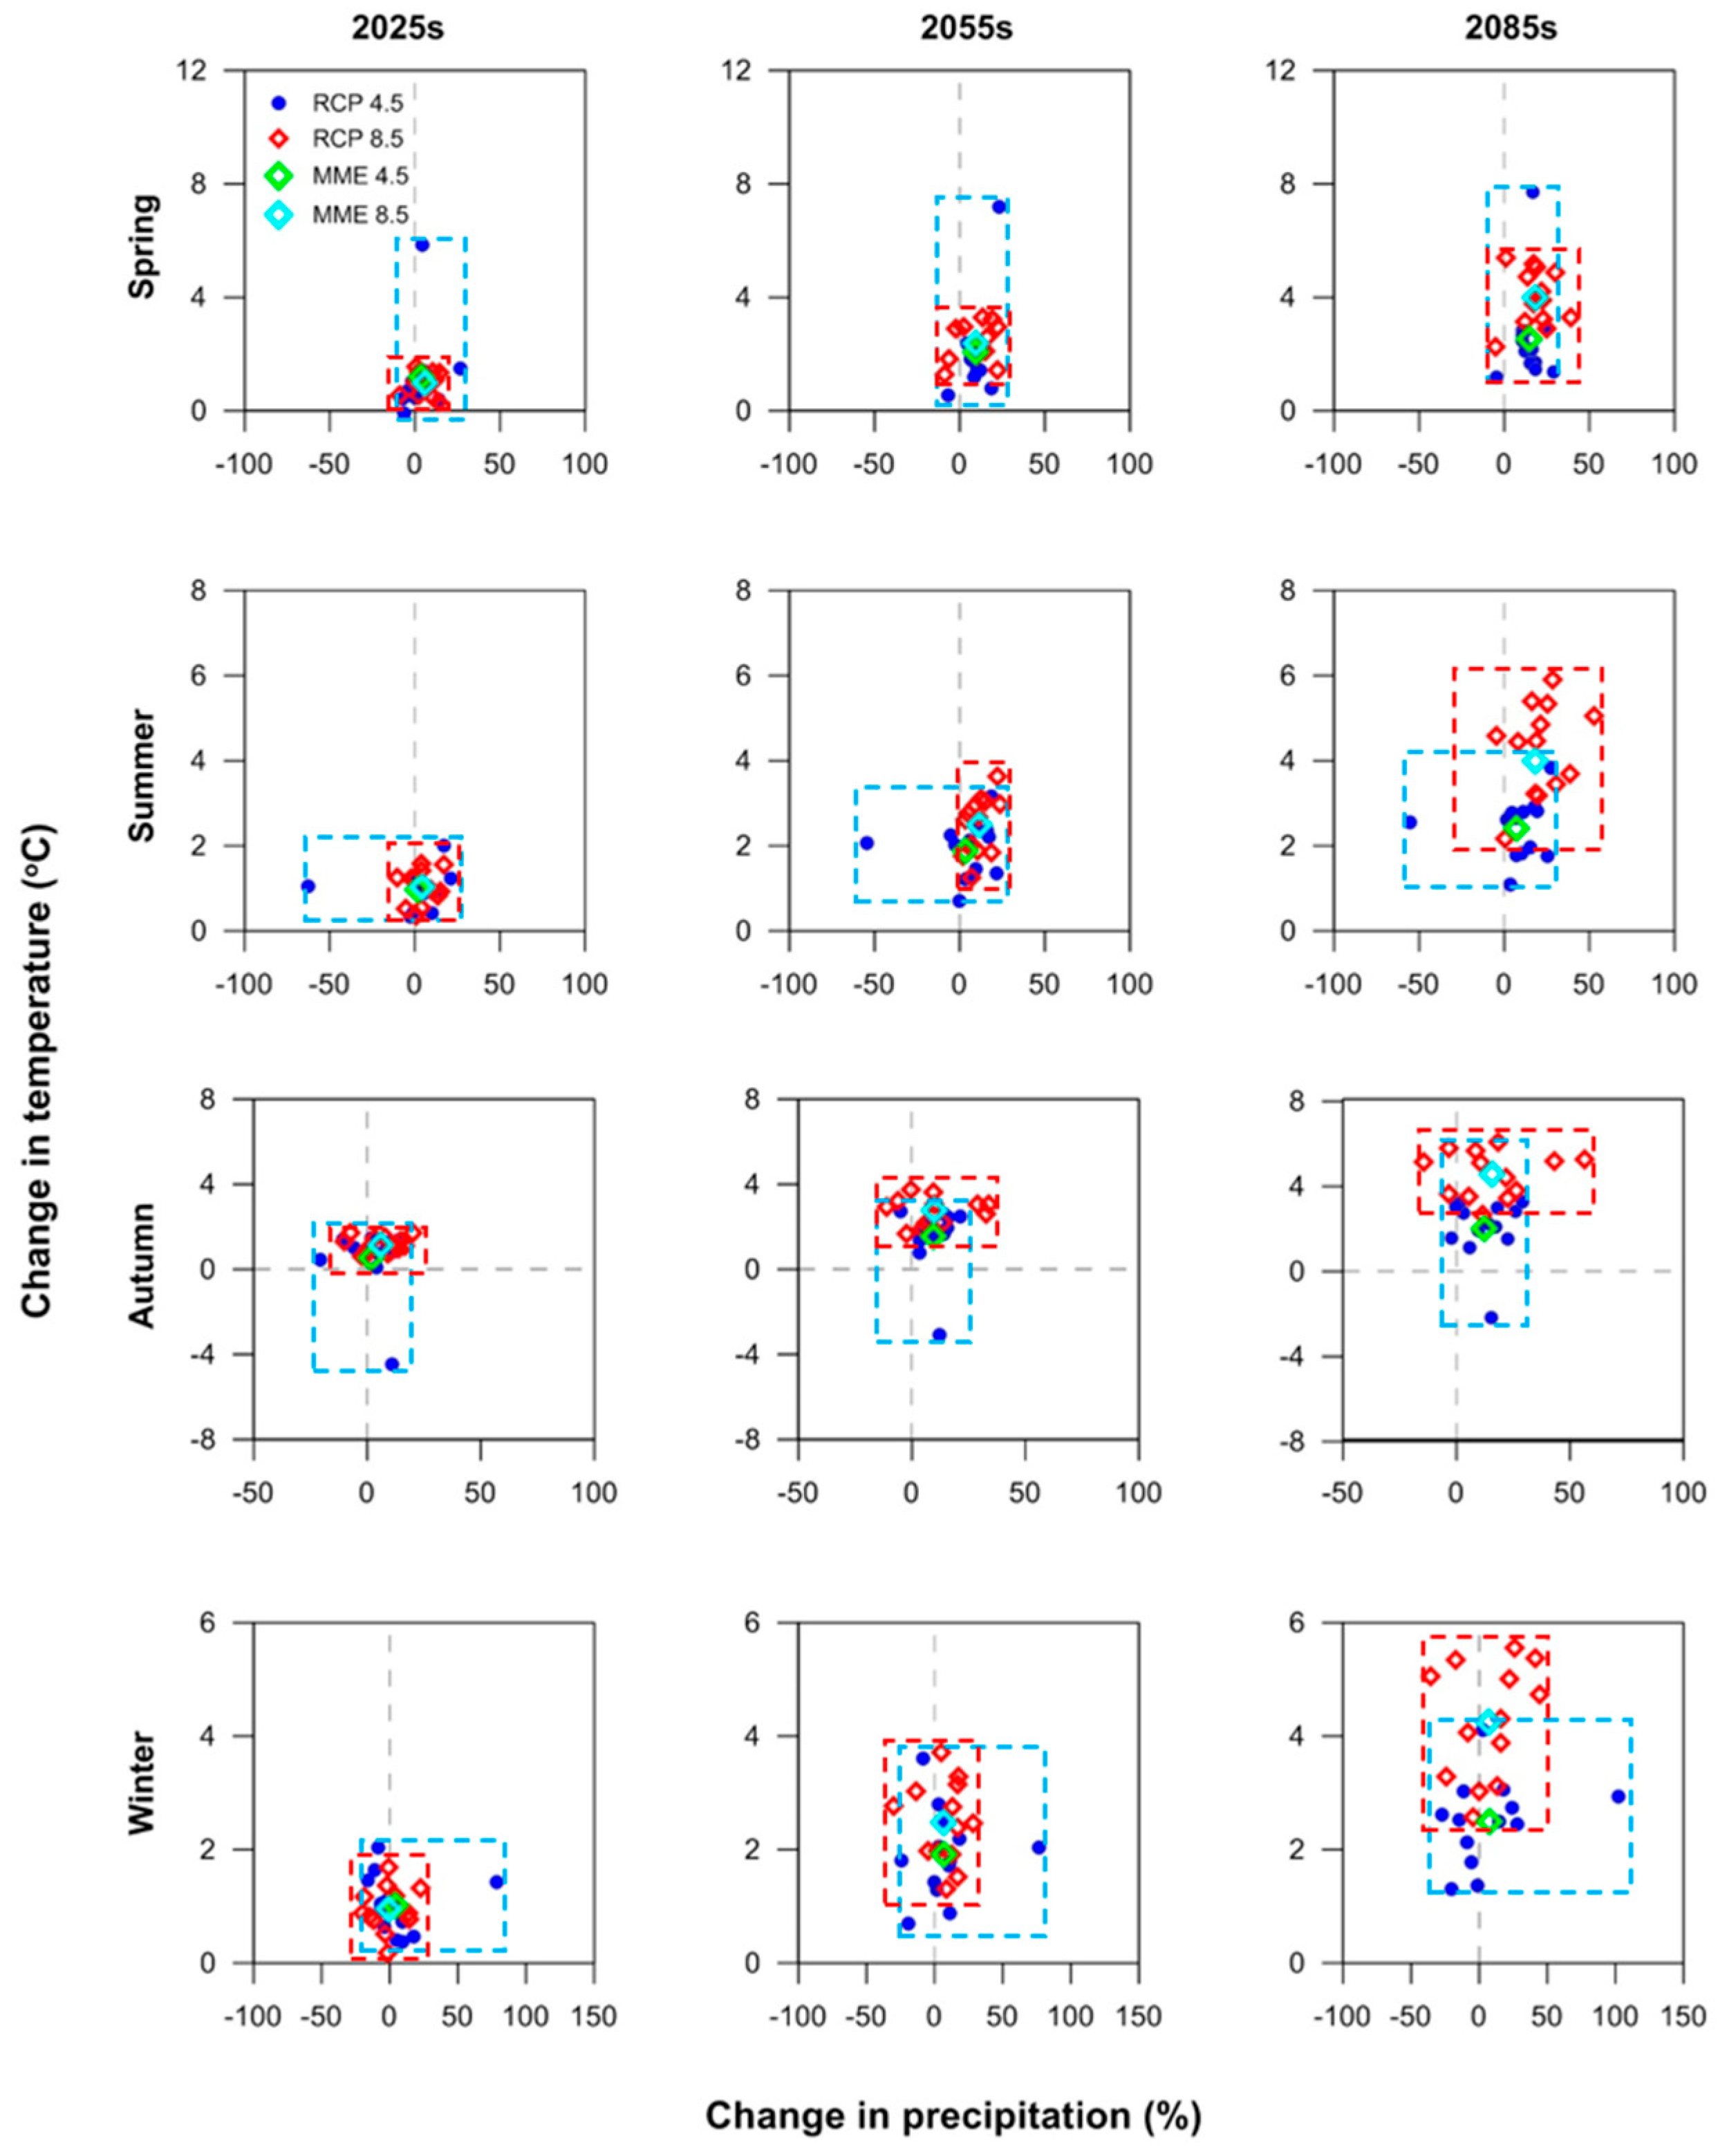
Figure 3 depicts the projected seasonal mean temperature and precipitation changes, based on downscaled data from an ensemble of 13 GCMs under two emission scenarios, RCP4.5 and RCP8.5, for the future periods of the 2025s, 2055s, and 2085s. The blue and red dashed boxes illustrate the spread of projections for the RCP4.5 and RCP8.5 scenarios, respectively, indicating the range within which most GCM projections are expected to fall. Each side of these dashed rectangles is intentionally parallel to the axis of the variable it represents, thus the horizontal sides quantify the uncertainty in precipitation changes, while the vertical sides represent the uncertainty in temperature changes. Furthermore, Figure 3 features a green rectangle to denote the mean value of the Multi-Model Ensemble (MME) for RCP4.5, and a light-blue rectangle to denote the mean value for RCP8.5, providing a visual representation of the central tendencies within the scope of their associated uncertainties. Overall, the projections show an almost consistent increase in temperatures across all seasons and both RCP scenarios, except for one GCM under RCP4.5 (HADGEM-ES). For precipitation, there is a noticeable upward trend during spring and summer, while autumn and winter exhibit variable trends. The uncertainties become more pronounced by the 2085s, with winter displaying the most significant range in temperature and precipitation projections.

3.1.2. Projected Precipitation and Runoff Changes

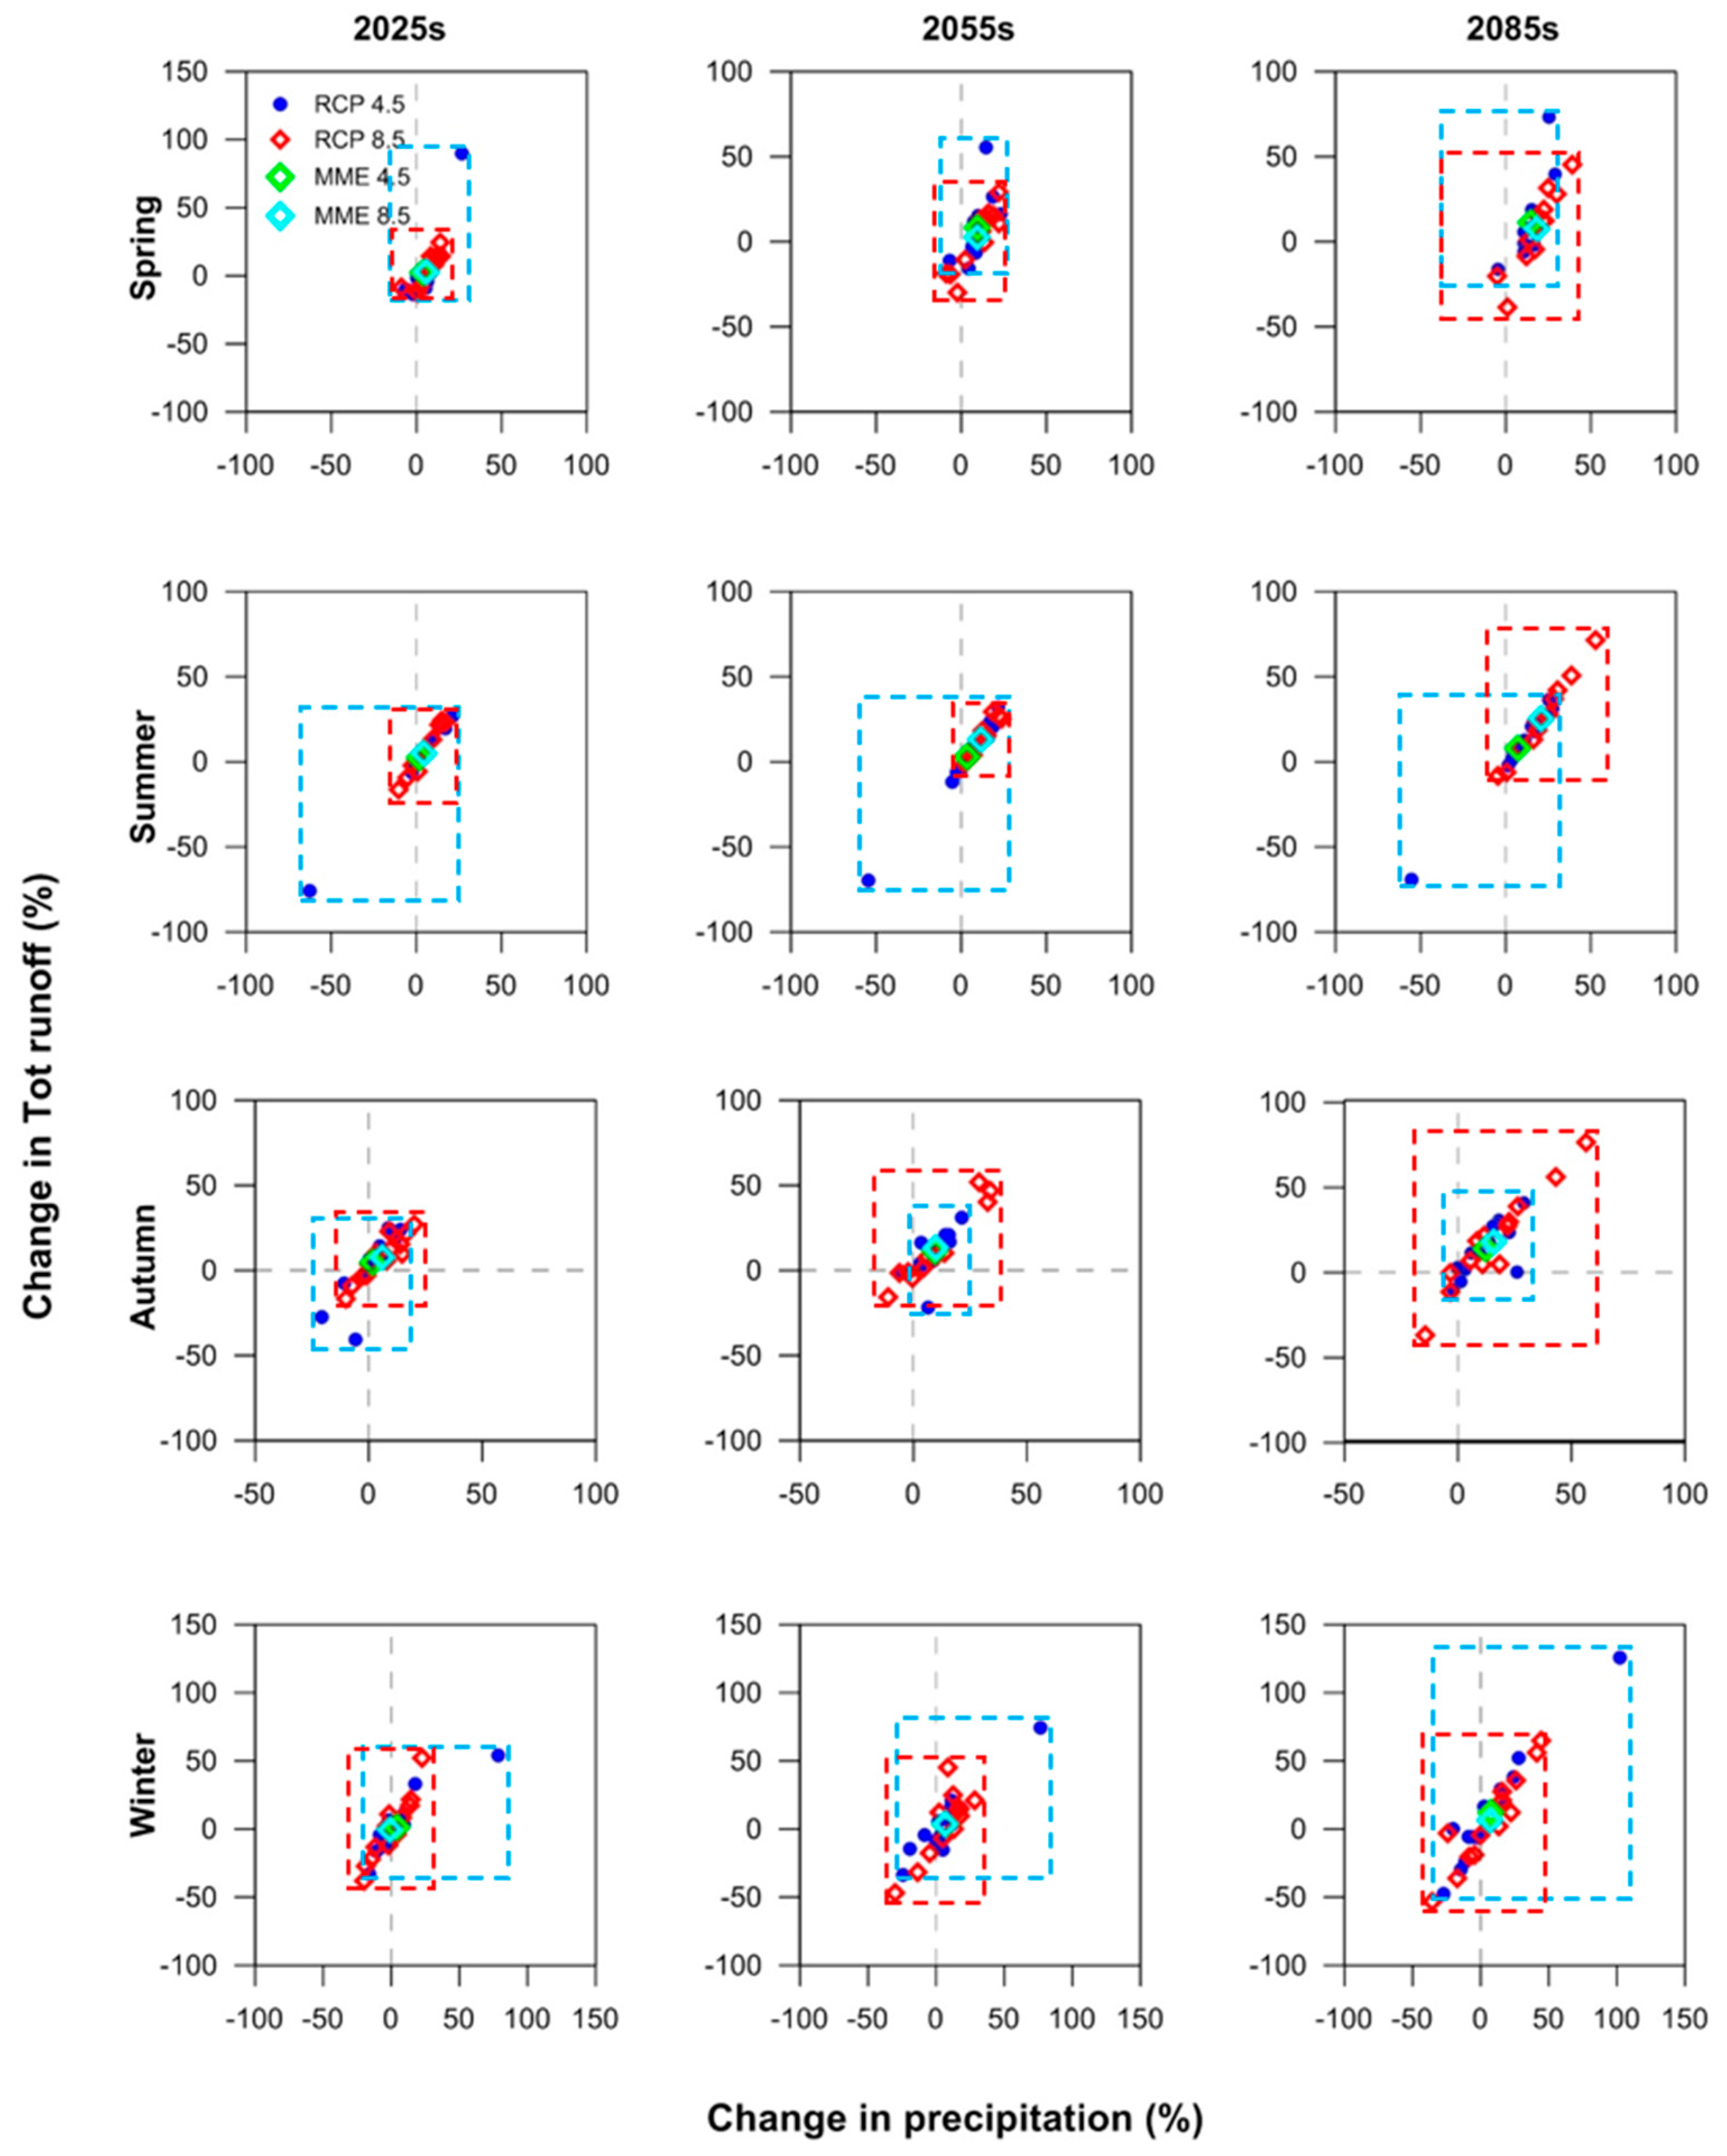
Figure 4 illustrates the projected changes in seasonal mean runoff and precipitation derived from downscaled data of 13 GCMs under two emission scenarios (RCP4.5 and RCP8.5) across three future periods (2025s, 2055s, and 2085s). The blue dashed box represents the spread of projections for the RCP4.5 scenario, while the red dashed box illustrates the spread for the RCP8.5 scenario.
Across both RCPs and different periods, the majority of models forecast an increase in precipitation and runoff during spring, summer, and autumn. However, during winter, there is a lack of consensus among the models, with approximately half predicting an increase while others indicate a decrease in precipitation and runoff compared to the reference period. This inconsistency in projecting winter precipitation and runoff contributes to heightened uncertainty regarding future winter conditions.

3.1.3. Projected Temperature and Runoff Changes

Figure 5 presents the projected changes in future seasonal mean temperature and runoff, derived from downscaled data across three future periods (2025s, 2055s, and 2085s) and two emission scenarios (RCP4.5 and RCP8.5), utilizing information from 13 GCMs. The spread of projections for the RCP4.5 scenario is depicted by the blue dashed box, whereas the red dashed box represents the spread for the RCP8.5 scenario.
With the exception of one GCM in RCP4.5 (HADGEM-ES), all seasons exhibit a coherent increase in temperature across various periods and RCPs. Additionally, the projected runoff demonstrates higher uncertainty, particularly evident during the 2085s period compared to other timeframes.

3.1.4. Projected Runoff and Actual Evapotranspiration Changes

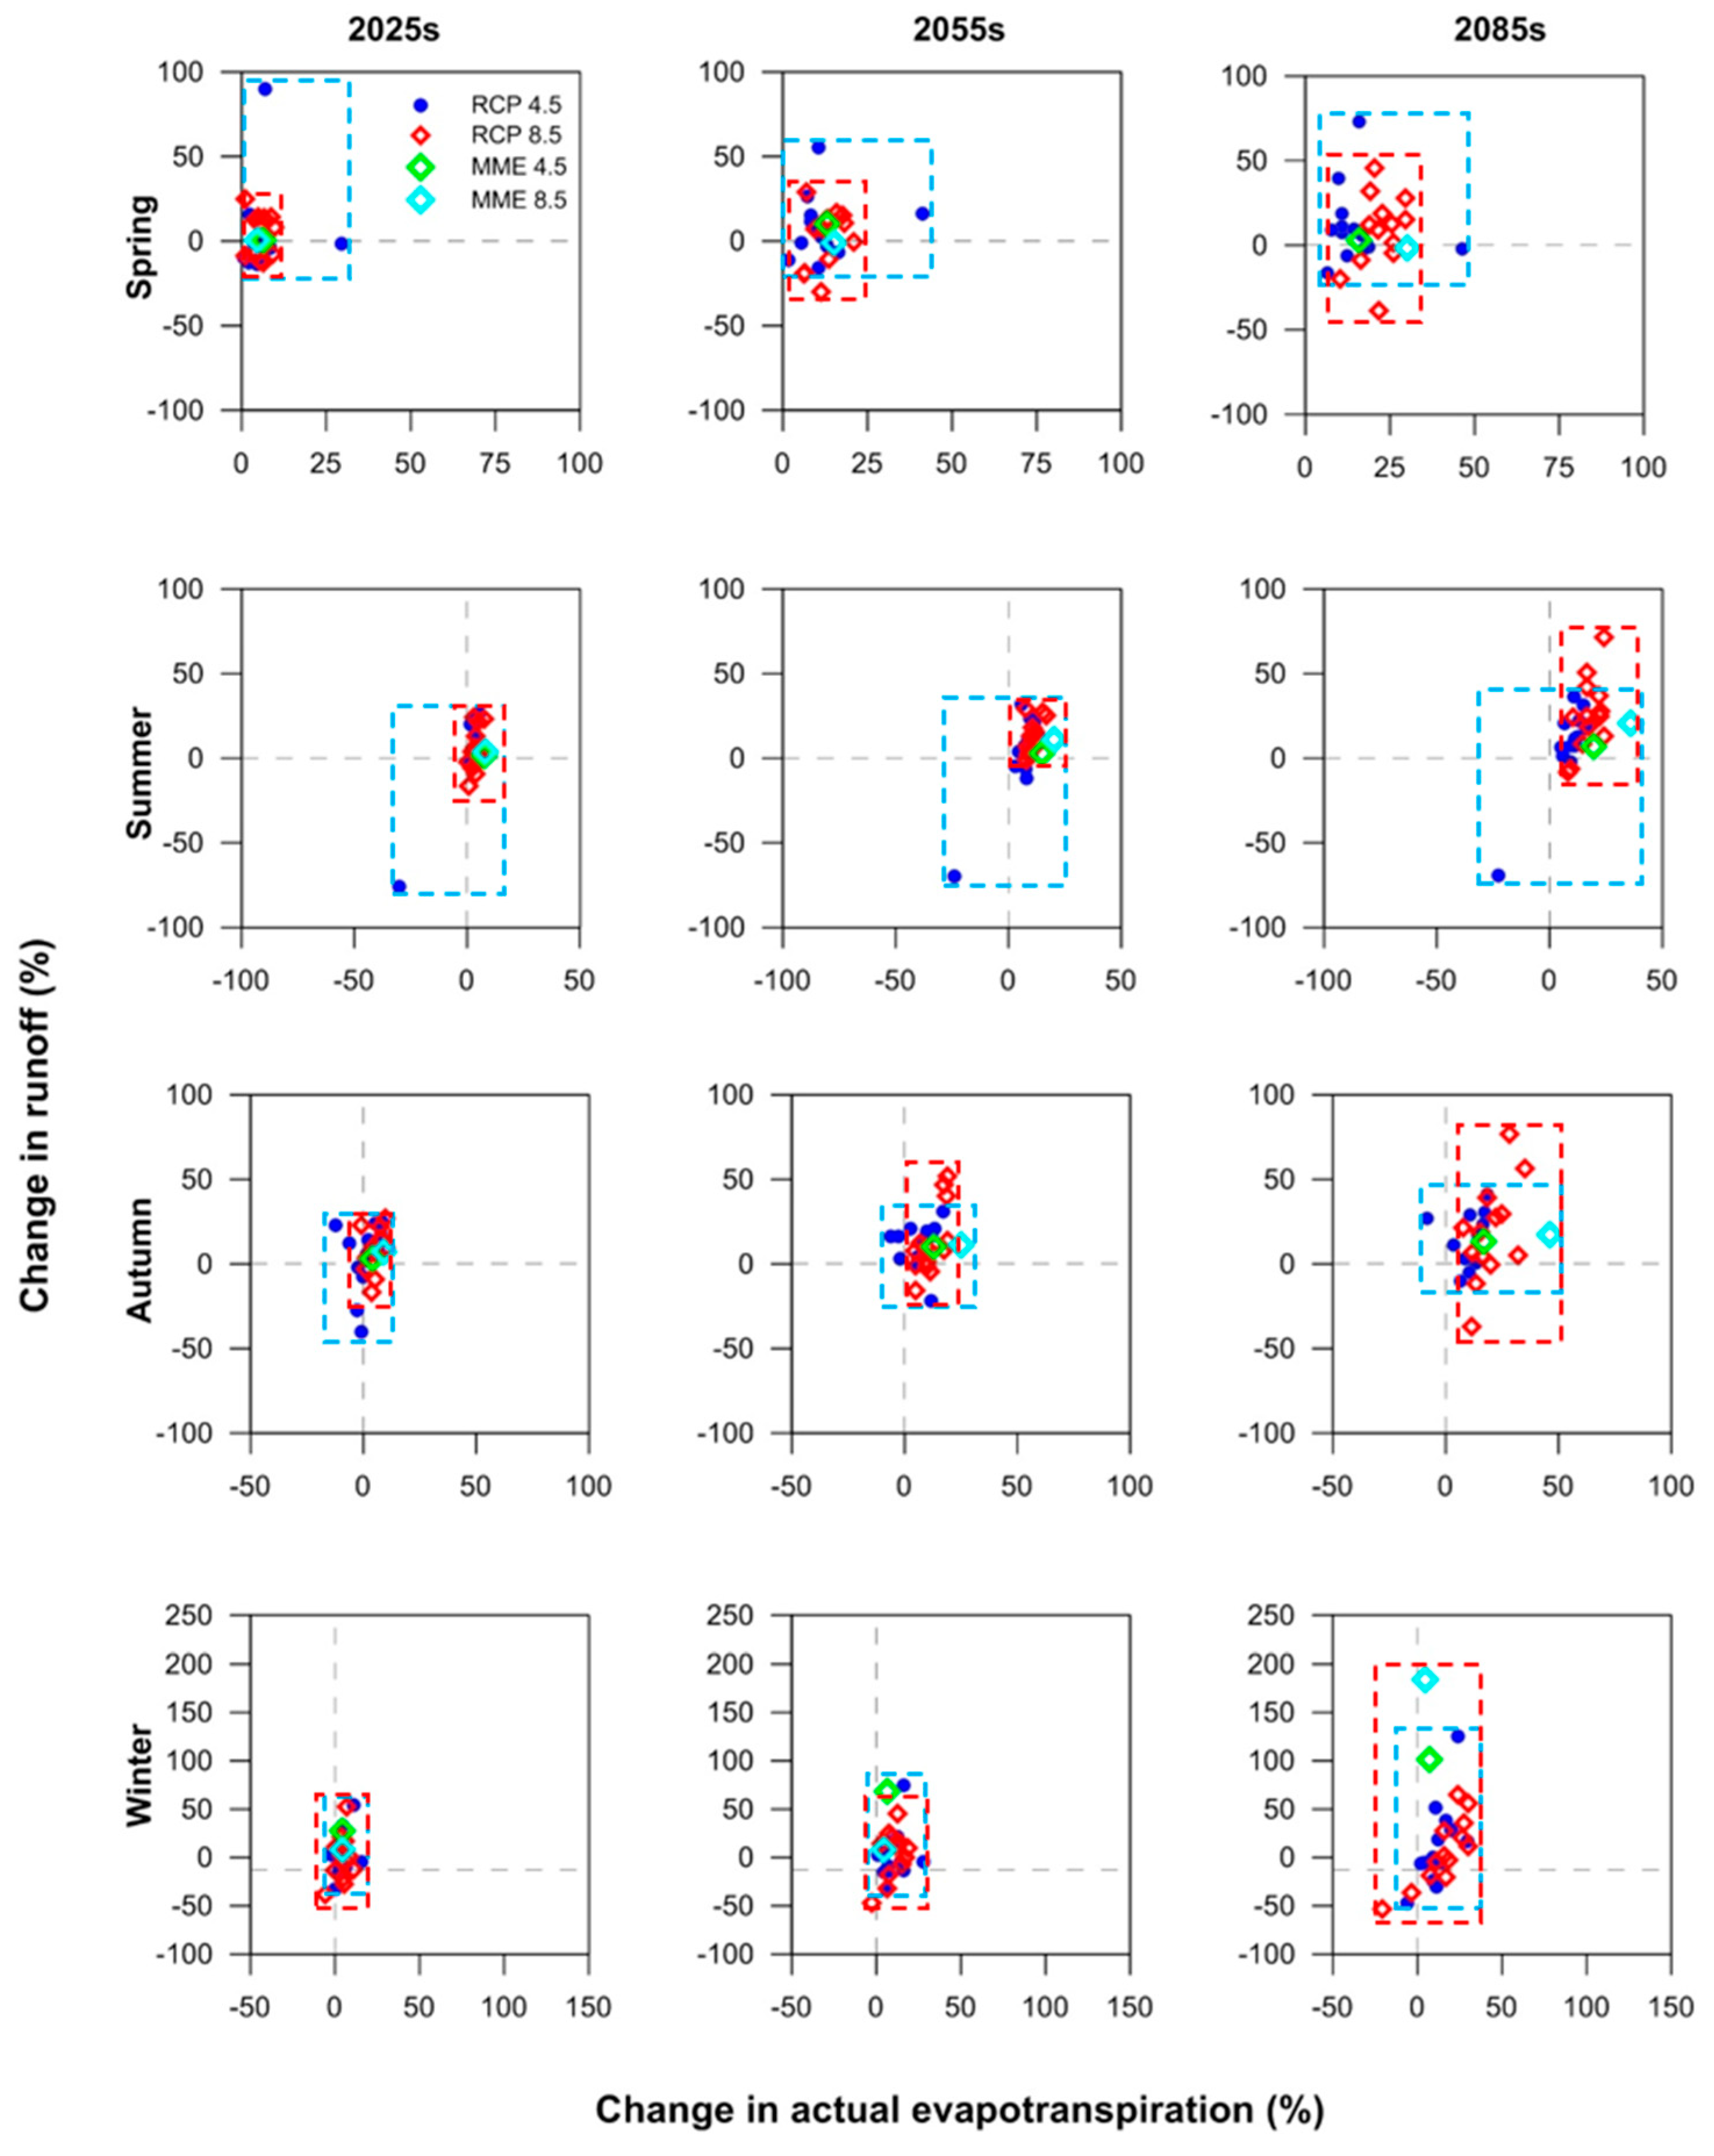
Figure 6 illustrates the anticipated changes in future seasonal mean actual evapotranspiration and runoff, projected from data downscaled from 13 GCMs across two emission scenarios (RCP4.5 and RCP8.5) and three future periods (2025s, 2055s, and 2085s). The blue dashed boxes depict the projected spread for the RCP4.5 scenario, while the red dashed boxes represent the spread for the RCP8.5 scenario.
Notably, there is heightened uncertainty in projecting future actual evapotranspiration during the 2085s period compared to other timeframes. This uncertainty predominantly arises from the increased variability in temperature forecasts during the 2085s period.

3.2. Monthly Mean Changes in Climate and Hydrological Variables across South Korea

3.2.1. Projected Monthly Mean Temperature Changes in South Korea under Two Emission Scenarios: RCP4.5 and RCP8.5

Figure 7 illustrates the comparative analysis of future temperature alterations for three different scenarios (S1, S2, S3) throughout the year, from January to December. The left graph represents the RCP4.5 pathway, indicating a moderate increase in temperatures with the smallest change in S1 and the largest in S3. The right graph displays the RCP8.5 pathway, showing a more significant temperature rise, with S3 experiencing the highest increase, especially in the middle of the year, suggesting a pronounced seasonal effect. Each scenario is marked by unique symbols: blue squares for S1, black triangles for S2, and red diamonds for S3, mapping the anticipated shifts in mean temperatures across the months.

3.2.2. Projected Monthly Mean Precipitation Changes in South Korea under Two Emission Scenarios: RCP4.5 and RCP8.5

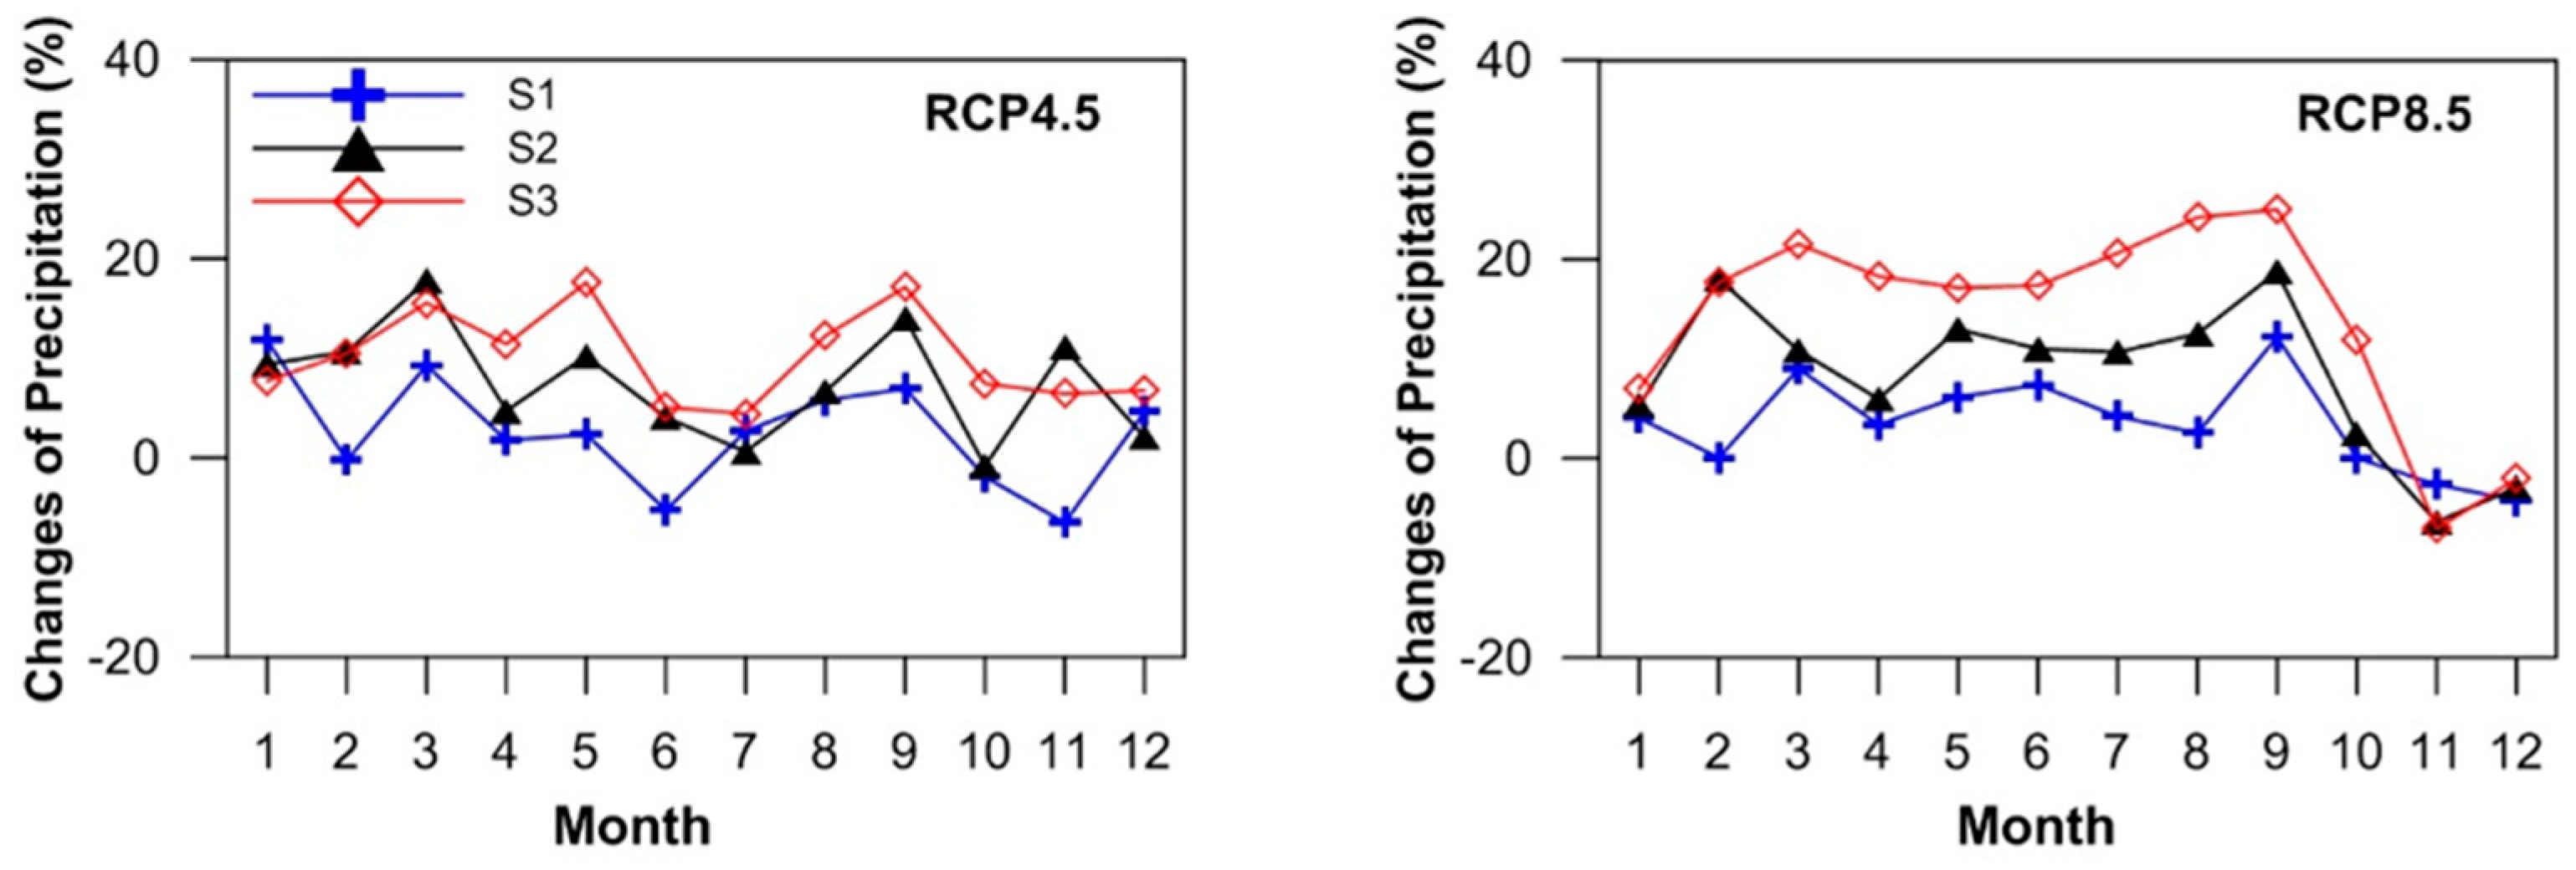
The comparative analysis presented in Figure 8 elucidates the relative changes in mean monthly precipitation as projected by a Multi-Model Ensemble (MME) under two distinct greenhouse gas emission scenarios, RCP4.5 and RCP8.5, considering three separate models (S1, S2, and S3). The RCP4.5 scenario indicates moderate fluctuations with noticeable mid-year peaks, suggesting a seasonal influence on precipitation changes. In contrast, the RCP8.5 scenario reveals more pronounced fluctuations, implying that elevated emission trajectories may contribute to increased variability in precipitation. Notably, models S2 and S3 show a marked convergence in the RCP8.5 scenario, which could signify a more substantial response to increased greenhouse-gas concentrations as compared to the RCP4.5 pathway.
The contrast in the range and intensity of precipitation shifts under these scenarios sheds light on the potential responsiveness of regional precipitation to varying emission levels. The accentuated changes observed in the RCP8.5 projections underscore the possibility of significant alterations to precipitation patterns, which could have far-reaching consequences for water management, agriculture, and flood risk mitigation.

3.2.3. Projected Monthly Mean Actual Evapotranspiration Changes in South Korea under Two Emission Scenarios: RCP4.5 and RCP8.5

Figure 9 depicts relative changes in mean monthly actual evapotranspiration (AE) under RCP4.5 and RCP8.5 scenarios, as predicted by a Multi-Model Ensemble (MME) for three different models (S1, S2, and S3). In the RCP4.5 scenario, all models exhibit moderate fluctuations with a general increasing trend in AE, particularly in the middle of the year. The RCP8.5 scenario, however, shows more pronounced variability and higher peaks of AE, especially noticeable in models S2 and S3 during the mid-year months, which suggests a significant increase in evapotranspiration corresponding to higher greenhouse-gas concentrations. The consistency between S2 and S3 across both scenarios, and especially their convergence under the more severe RCP8.5 scenario, suggests a robust projection of greater sensitivity to increased emissions. This analysis underscores the potential impacts of emission trajectories on AE, with implications for water resource management and agricultural planning, and highlights the importance of MME in enhancing the reliability of climate projections.

3.2.4. Projected Monthly Mean Total Runoff Changes in South Korea under Two Emission Scenarios: RCP4.5 and RCP8.5

The line graphs presented in Figure 10 offer a side-by-side comparative analysis of the predicted relative changes in mean monthly total runoff, according to a Multi-Model Ensemble (MME) for three different climate models (S1, S2, and S3) under two emission scenarios: RCP4.5 and RCP8.5. The blue line shows the monthly changes for the 2025 period or S1, the black line represents S2 or the 2055 period, and the red line illustrates the monthly changes for S3 or the 2085 period. The data under RCP4.5 exhibits moderate variability, characterized by recognizable seasonal patterns, whereas the projections under RCP8.5 are marked by more significant fluctuations, reflecting a greater sensitivity to the more severe emissions scenario. Both scenarios indicate that total runoff undergoes seasonal changes, with mid-year peaks likely representing increased precipitation or snowmelt events. There is a notable consistency in the projections of models S2 and S3 for both scenarios, suggesting a shared outlook on the climatic impact on runoff.
The analysis underscores the potential for intensified hydrological responses under the RCP8.5 scenario, which could have considerable consequences for water resource management. Understanding variability in water availability and its effects on ecosystems, agriculture, and urban planning is crucial, particularly in light of different climate-change scenarios. The correlation observed between models S2 and S3 hints at a more uniform understanding of the response of runoff to these changes, emphasizing the importance of these projections for informed decision-making in adaptation and strategy formulation. Figure 9 indicates that significant seasonal variability in total runoff is to be expected, with a more pronounced reaction likely under the higher emissions trajectory of RCP8.5, as evidenced by the steeper peaks and troughs in the model projections. This agreement enhances the credibility of these predictions, which is vital for future planning and the development of adaptive measures.

3.3. Seasonal Mean Temperature Variability in the Five Major River Basins of Korea

3.3.1. Seasonal Mean Temperature Variability

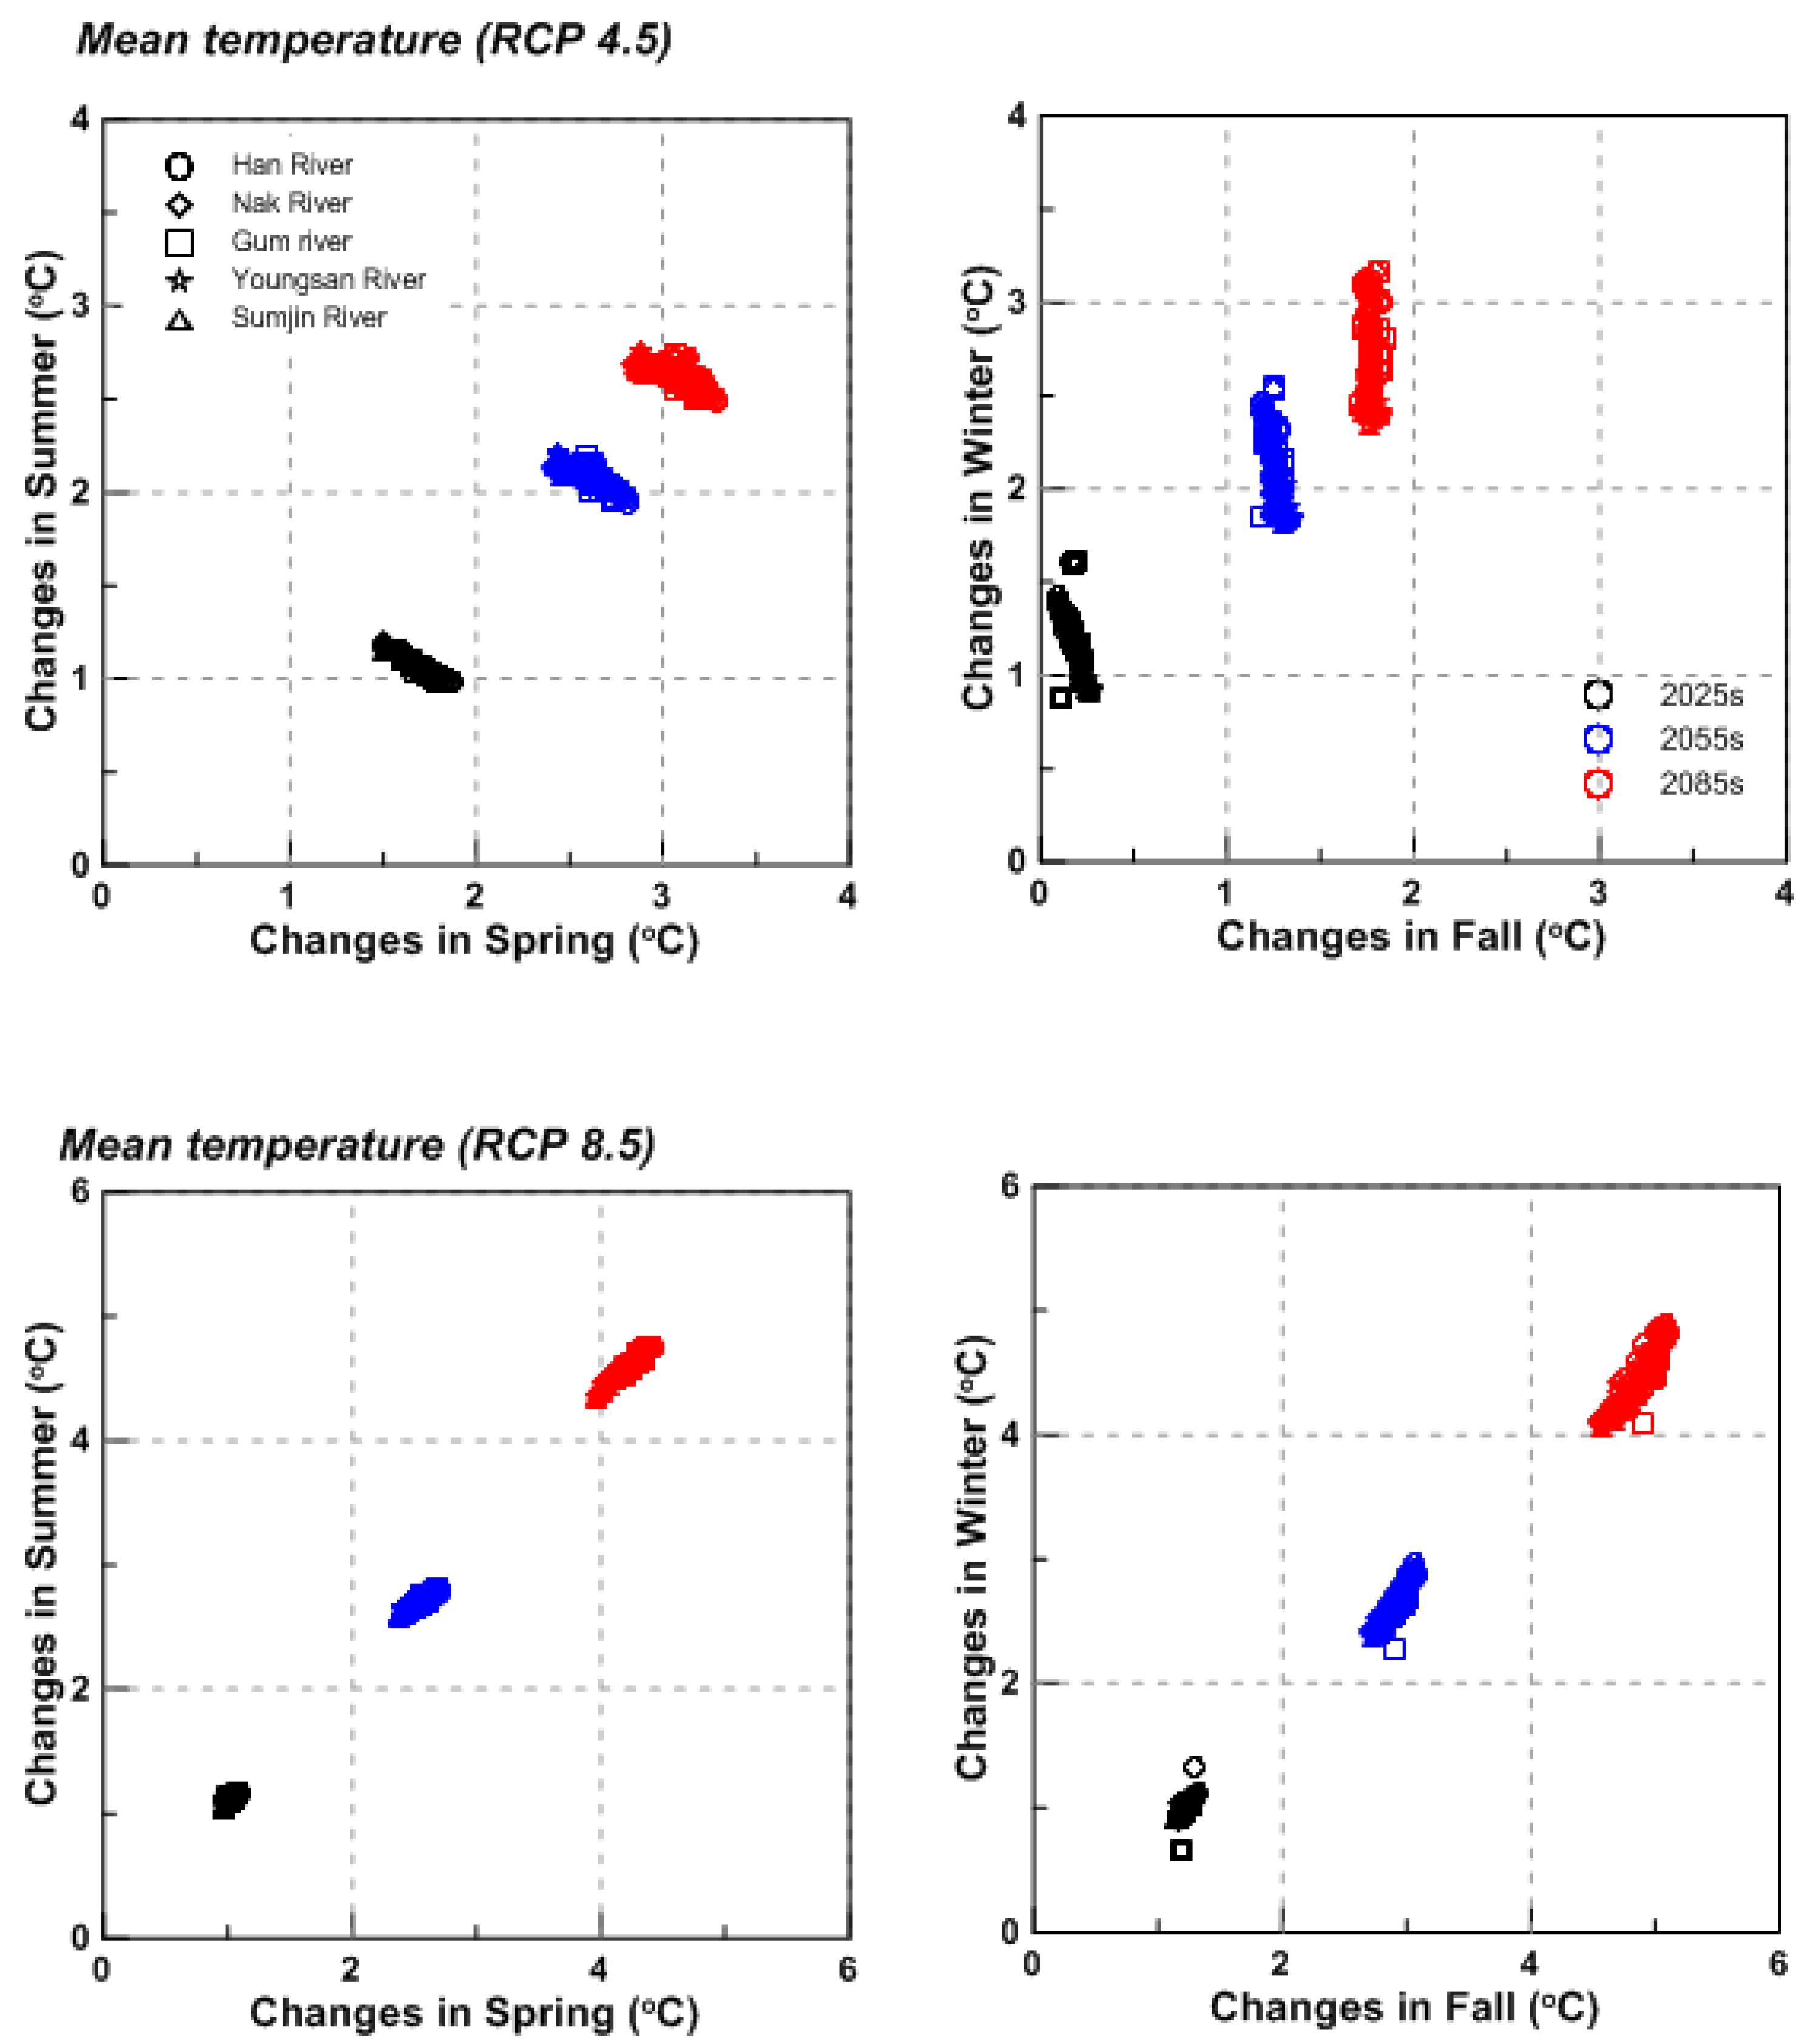
Figure 11 illustrates the projected changes in seasonal mean temperature across the five major river basins in Korea, as inferred from the Multi-Model Ensemble (MME) data for future periods: the 2025s, 2055s, and 2085s, under two Representative Concentration Pathways, RCP4.5 and RCP8.5. A distinctive feature of the RCP4.5 projections is a solitary anticipated decrease in spring temperatures for the 2025s. Contrastingly, an ascending trend in temperature relative to the reference period is observed for all other seasons and future periods under both RCPs, with all basins manifesting an increasing rate of change.
The analysis reveals that temperature increments under RCP8.5 are more substantial compared to RCP4.5, which is consistent with the higher greenhouse-gas concentrations associated with RCP8.5. Notably, the increases are more pronounced during the winter and fall seasons, suggesting that these periods are more susceptible to warming. This pattern is indicative of a non-uniform sensitivity of the basins’ temperatures to climate change, with potential implications for ecological and hydrological processes.
The bi-seasonal plots in Figure 11, segregated by RCPs, display a clear seasonal differentiation in temperature responses. Under RCP4.5, the temperature changes are relatively moderate, with winter and fall showing a more significant deviation from spring changes. In contrast, under RCP8.5, all seasons exhibit heightened temperature changes, with winter and fall demonstrating the most considerable increases. This trend is consistent across the Han, Geum, Nakdong, Yeongsan, and Sumjin River basins, albeit with some inter-basin variability that suggests a complex interplay between regional climate dynamics and the projected warming patterns.
The scatter of points representing the individual basins and time slices underscores the heterogeneity of the temperature response, with some basins showing a more pronounced temperature increase, particularly in the later decades under the higher-emission scenario. This heterogeneity may reflect localized climatic feedbacks, land-use patterns, and basin-specific characteristics that modulate the regional climate system’s response to global warming.

3.3.2. Seasonal Precipitation Variations

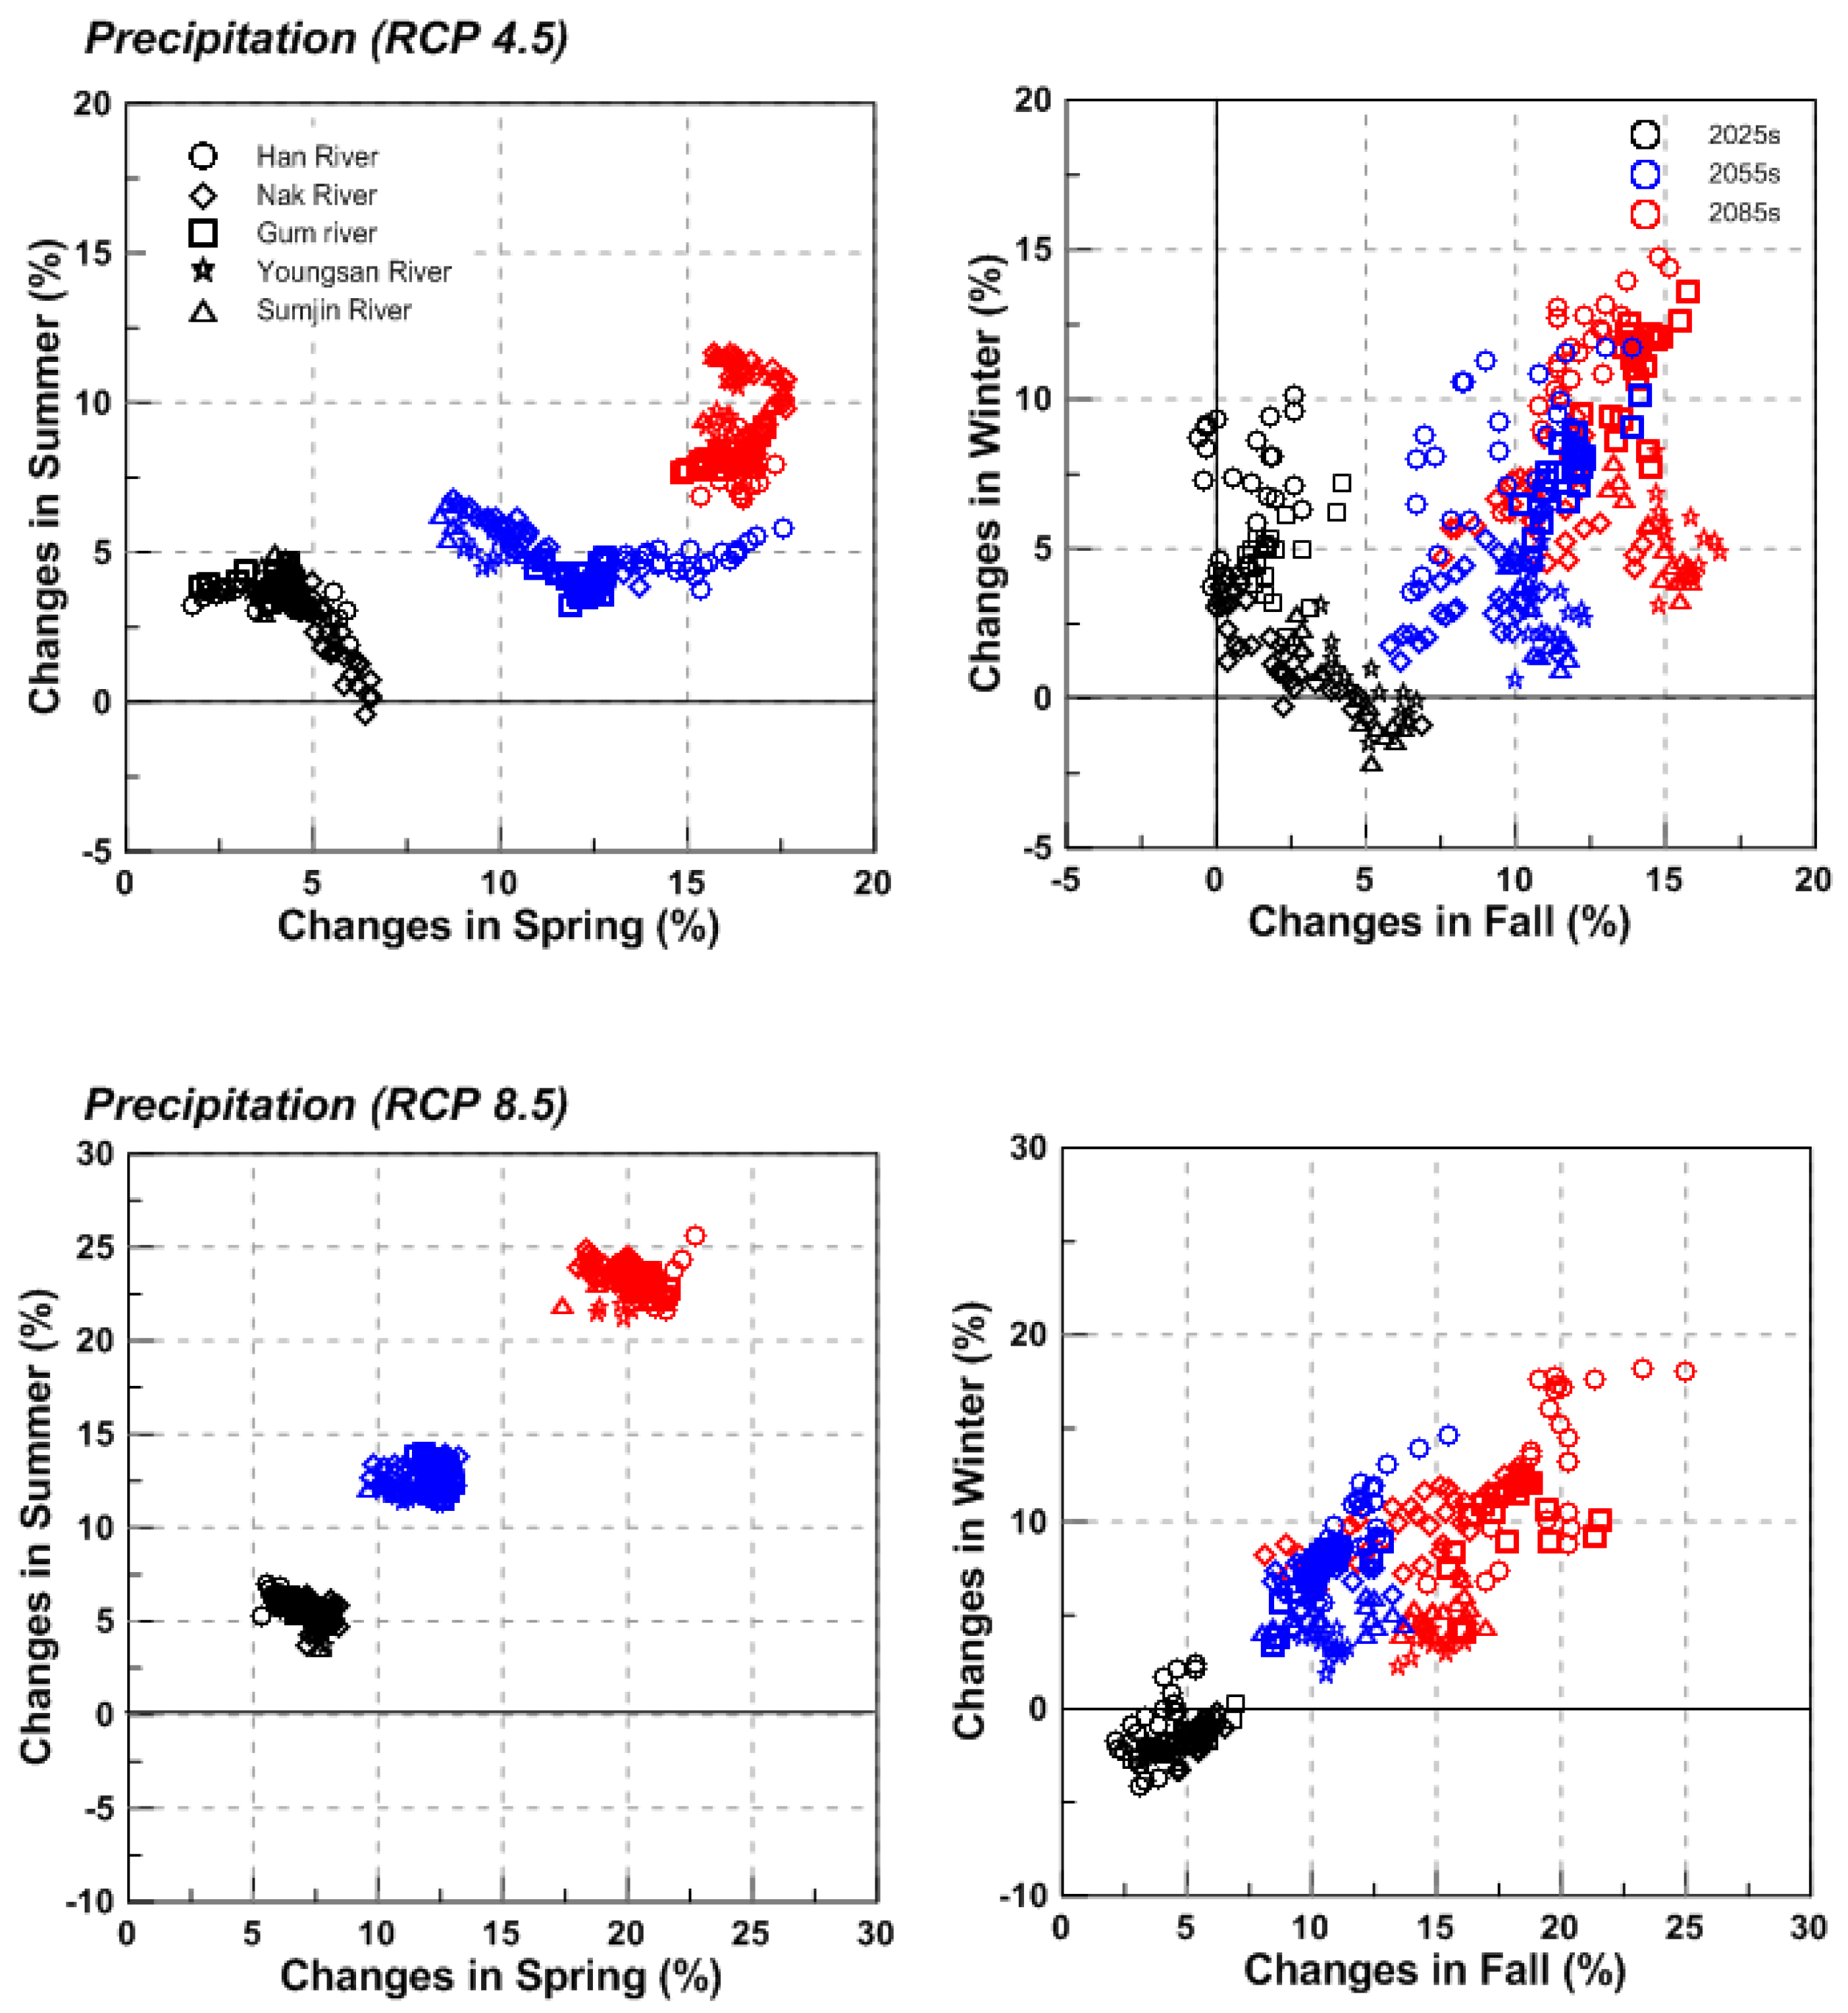
Figure 12 presents an analysis of seasonal mean precipitation changes within the five major river basins of Korea, utilizing projections from a Multi-Model Ensemble (MME) for two Representative Concentration Pathways, RCP4.5 and RCP8.5, across three future time periods: the 2025s, 2055s, and 2085s.
The data indicates an overall trend of increasing spring precipitation across all basins and time periods for both RCP scenarios. An exception to this trend is noted in the summer projections for the Nakdong River basin under RCP4.5, where some decrease in precipitation is anticipated. Conversely, for the remaining basins, an increase in summer precipitation is projected under both RCP4.5 and RCP8.5. The autumnal precipitation is expected to follow a similar increasing pattern, with the exception of the Han River basin and certain basins of the Nakdong River during the 2025s. Beyond this period, an increase in fall precipitation is projected for the remaining time slices under both RCP scenarios.
The winter precipitation projections diverge notably from this pattern, with expected decreases in some basins of the Yeongsan and Sumjin Rivers under RCP4.5. This decreasing trend in winter precipitation appears to become more pervasive under RCP8.5, impacting nearly all basins.
A quadrant scatter plot analysis for each season under both RCPs reveals a complex interplay of changes, with a noticeable distribution of data points across the projected time periods. The plots illustrate the spatial and temporal heterogeneity of precipitation responses, with some basins exhibiting larger shifts in precipitation patterns than others. This variability suggests differential impacts of climate change on hydrological cycles within each basin, influenced by a myriad of factors including topography, prevailing weather systems, and changing atmospheric patterns associated with global warming.
Furthermore, the contrast between the RCP scenarios in Figure 11 signifies the sensitivity of hydrological responses to the severity of climate-change projections. RCP8.5, associated with higher greenhouse-gas concentrations, shows a more substantial deviation from current precipitation patterns, especially in the winter season, indicating that these basins may experience more pronounced changes in hydrological regimes under a high-emission future.

3.3.3. Seasonal Actual Evapotranspiration Variations

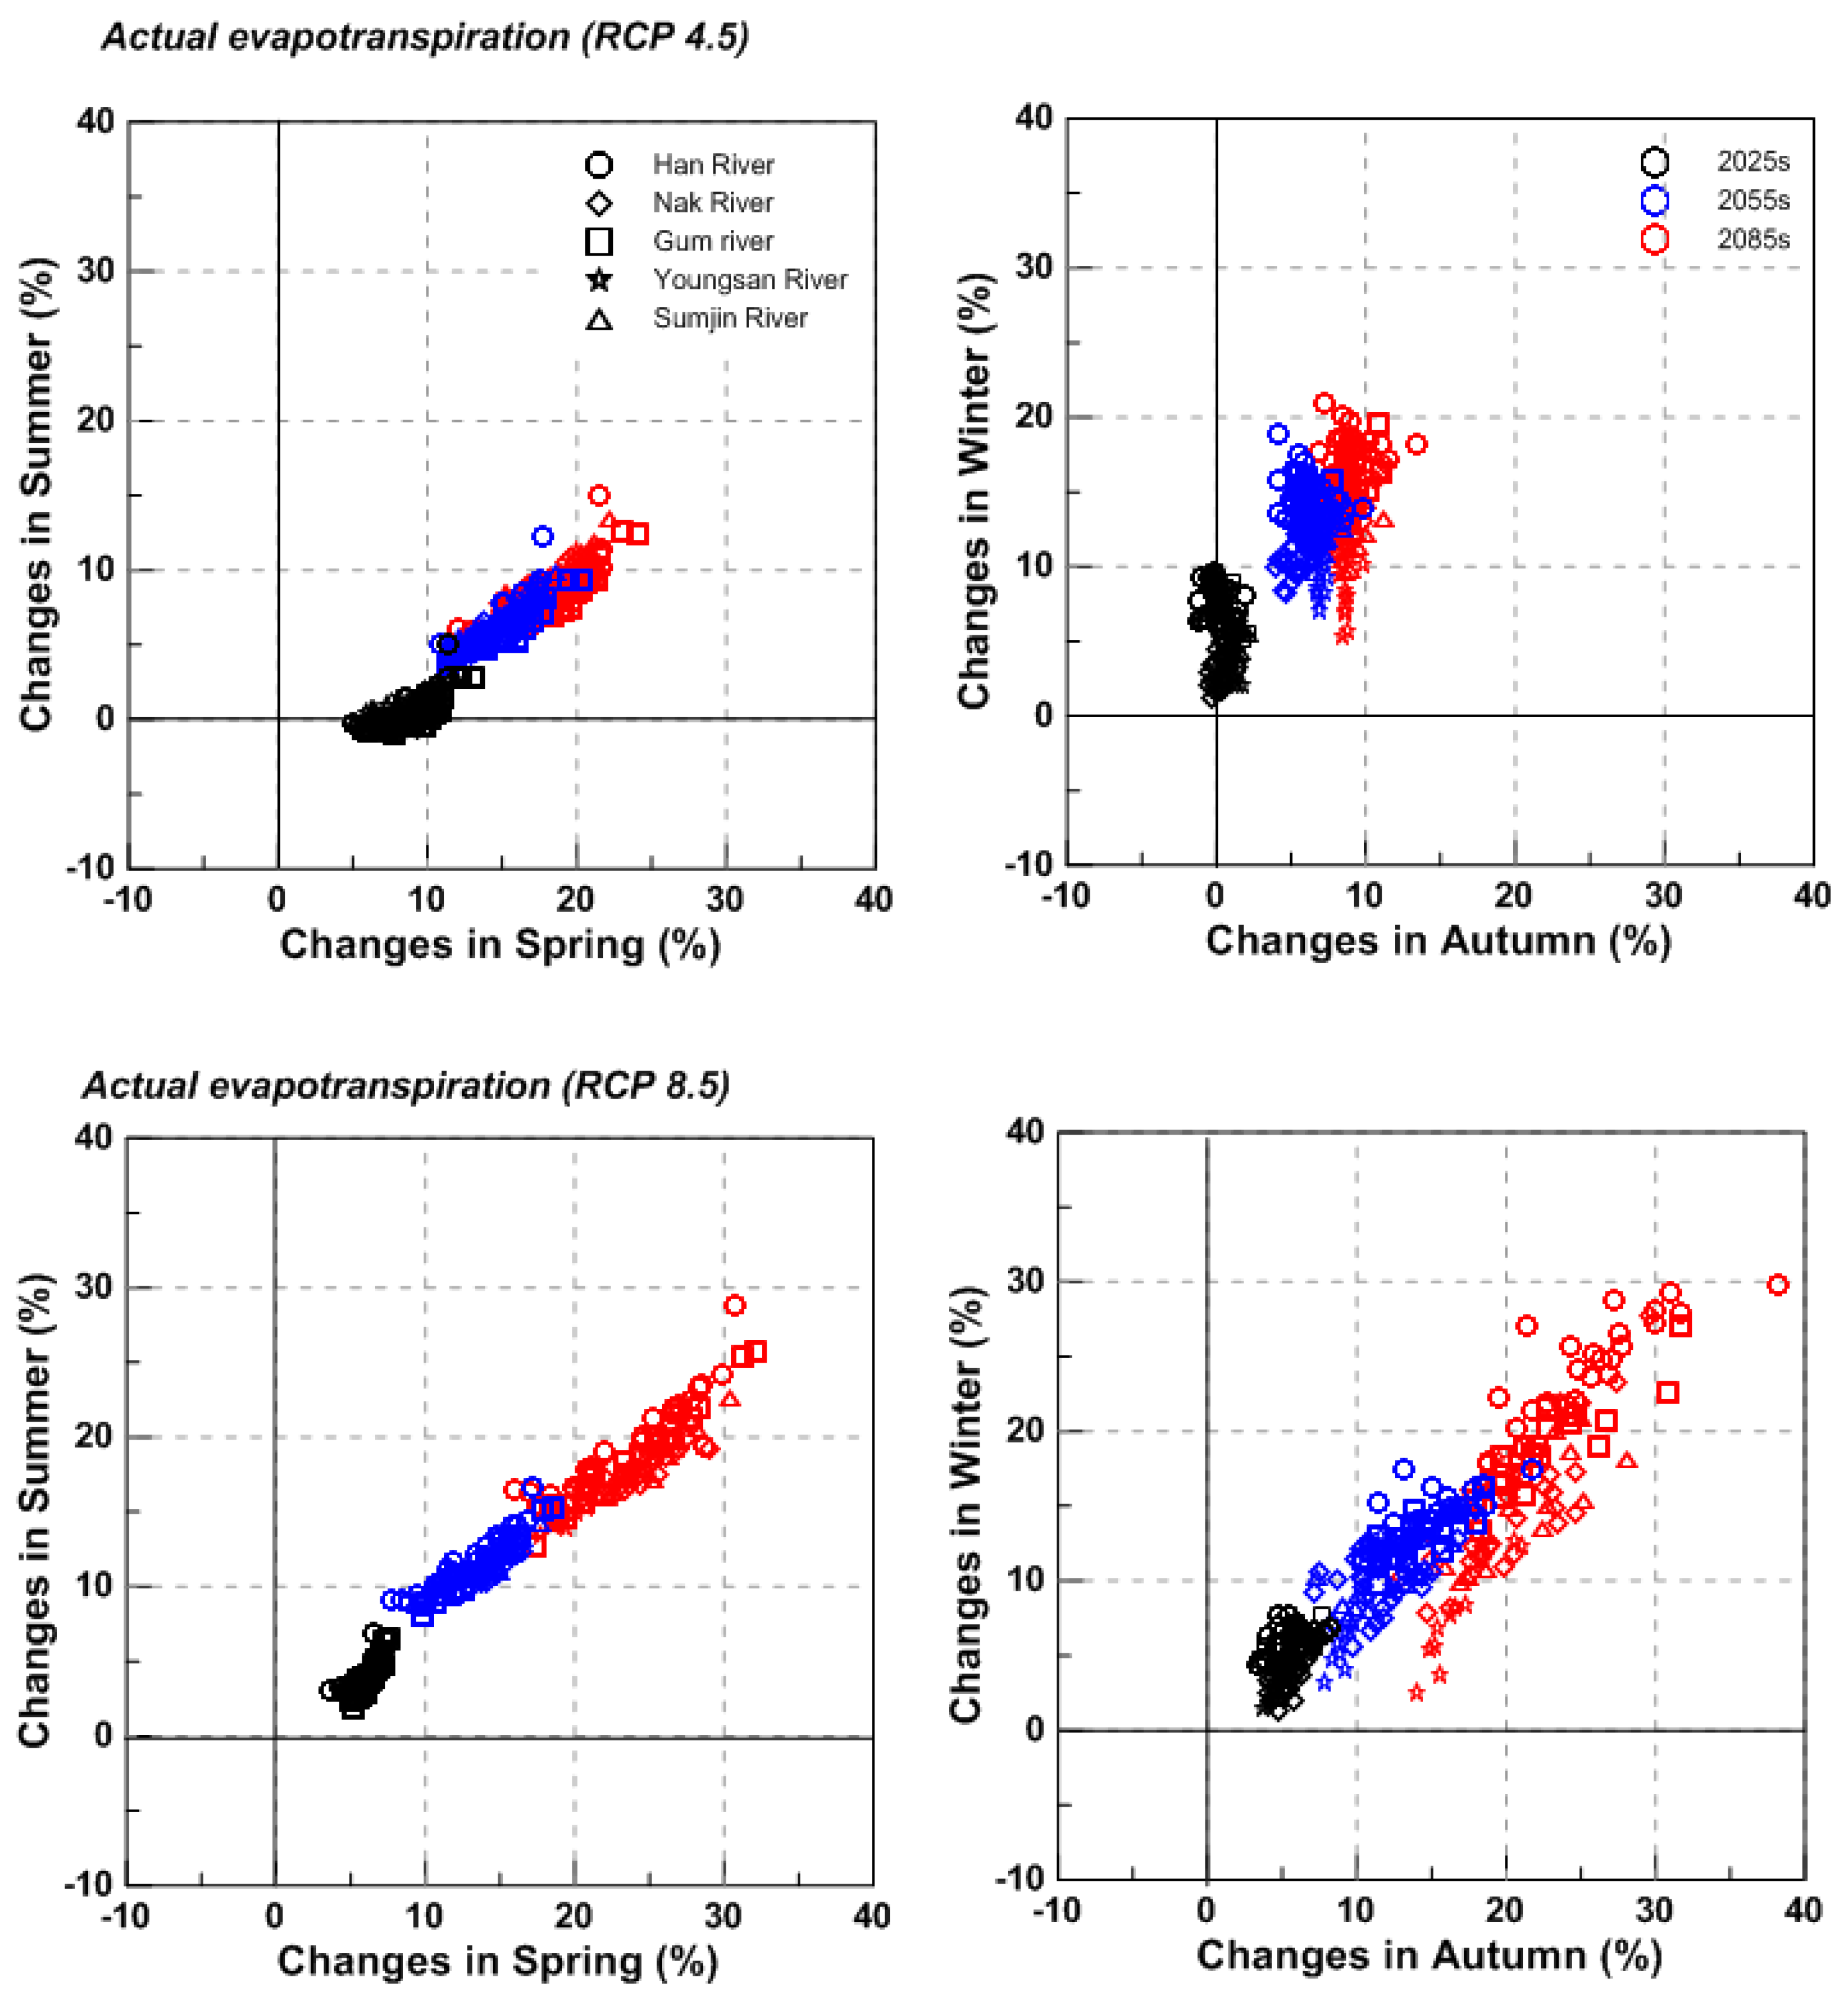
In Figure 13, the analysis of projected actual evapotranspiration (AET) changes for Korea’s five major river basins offers insights into the seasonal hydrological responses to climate change. These projections, derived from a Multi-Model Ensemble (MME), provide forecasts for three distinct future periods: the 2025s, 2055s, and 2085s.
The relative changes in seasonal AET show an upward trend for all seasons across the various time frames, except for the winter season, where projections indicate both increases and decreases. This dual tendency in winter suggests a complex response to climatic drivers, potentially influenced by factors such as temperature variability, changes in snow cover, and seasonal precipitation patterns. The autumn season, however, consistently displays a tendency for greater increases in AET relative to other seasons.
A more granular examination of the data reveals that the extent of AET variability within and across basins is nuanced, suggesting that localized factors, including vegetation cover, soil moisture, and basin morphology, may be influencing the AET response. Additionally, the disparate AET trends under different RCP scenarios may reflect the sensitivity of evapotranspiration processes to varying degrees of temperature and precipitation changes projected for these basins.
The projections under RCP8.5, which assumes higher greenhouse-gas concentrations, typically show larger deviations in AET from the historical baseline, signaling that AET responses could intensify under more severe warming conditions. This has profound implications for water budgeting, agricultural sustainability, and ecosystem resilience, particularly during the autumn months when the highest increases in AET are anticipated.
Figure 13 underscores the importance of incorporating AET projections into integrated water resource management and climate adaptation strategies for South Korea’s river basins. These strategies must be attuned to seasonal fluctuations and future climate conditions to mitigate potential impacts on water availability and to sustain basin-wide hydrological functions.

3.3.4. Seasonal Runoff Variations

Figure 14 provides a comprehensive assessment of the projected changes in seasonal mean runoff within the five major river basins of South Korea, a crucial factor in understanding the regional impacts of climate change on water resources. This study synthesizes runoff variations under two Representative Concentration Pathways, RCP4.5 and RCP8.5, incorporating analyses for the 2025s, 2055s, and 2085s relative to a historical reference period.
The analysis delineates notable trends in runoff variation across all seasons. Spring exhibits both increases and decreases in runoff relative to the reference period, signifying a complex interplay of climatic factors during this transitional season. This variability in spring runoff is critical, as it is closely associated with the occurrence of droughts and floods, which have profound implications for water security and disaster management in the region.
In contrast, the summer and fall seasons are characterized by an overall increase in runoff across the basins, with summer runoff rising by up to 10% in RCP4.5 projections. The fall season shows an even more substantial increase, suggesting up to a 20% rise, while winter projections indicate an extreme range of change, from no alteration up to a 200% increase in runoff under RCP4.5. Such significant winter runoff changes, particularly the upper extremes, could be indicative of intensified precipitation events and altered snowmelt patterns due to warming temperatures.
Under the higher emission scenario of RCP8.5, spring runoff changes exhibit a wide range, from a 20% decrease to a 20% increase. Summer runoff presents an increase in the range of 3% to 25%, illustrating the potential for more frequent and intense hydrological events during this season. The projected increases in fall runoff remain consistent with those observed in the RCP4.5 scenario, while winter runoff variability is markedly enhanced, with projections reaching up to a 350% increase relative to the reference period.
These findings highlight the differential impacts of climate change on seasonal runoff dynamics within the river basins, with a clear trend towards increased runoff for most seasons under both RCP scenarios. The pronounced variability, especially in winter projections, underscores the necessity for adaptive water management strategies that can accommodate the anticipated extremes in hydrological responses.
Figure 14 captures the essential variability in seasonal runoff projected by a Multi-Model Ensemble for South Korea’s primary river basins, emphasizing the need for robust, flexible water resource planning that can respond to the challenges posed by climate change.

3.4. Mean Monthly Climatic and Hydrological Variability in South Korea’s Five Major Basins

3.4.1. Variability in Mean Monthly Temperature

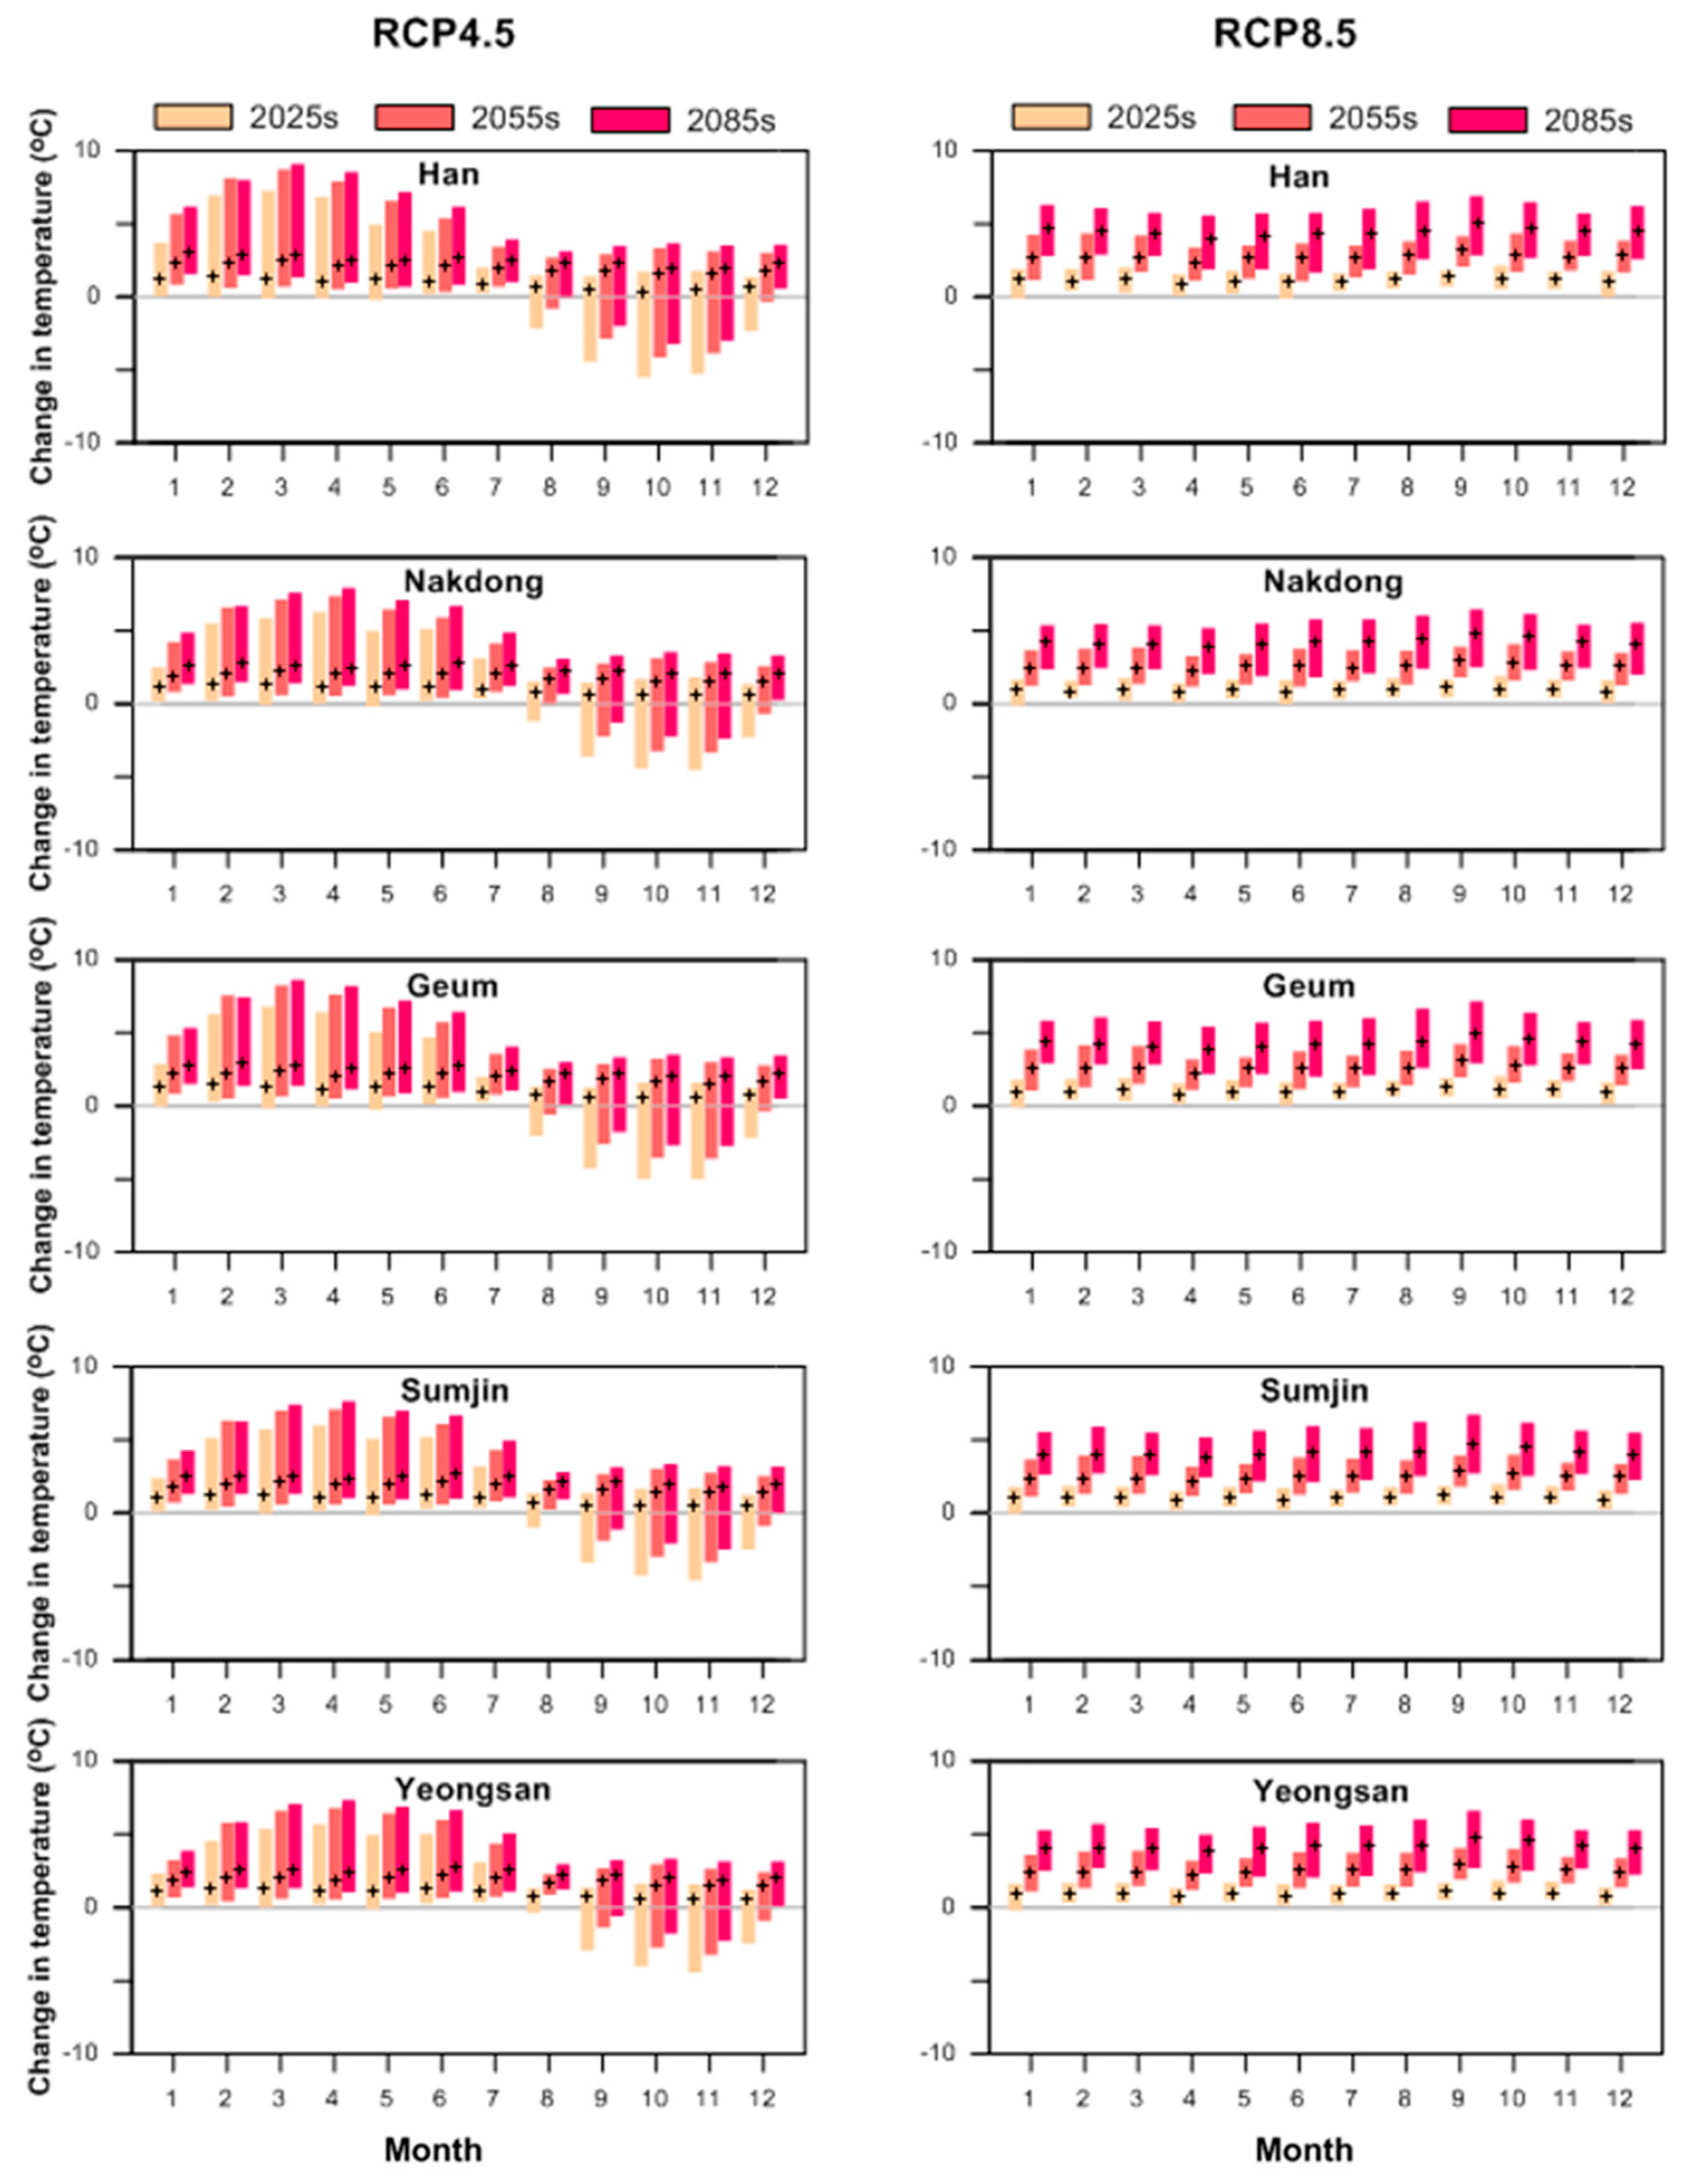
Figure 15 illustrates the absolute differences in mean monthly temperatures across the five principal river basins of South Korea, as predicted by an ensemble of 13 General Circulation Models (GCMs) under the RCP4.5 and RCP8.5 scenarios, using a historical period as a reference. The figure marks the ensemble mean values (MME) with a “(+)” symbol, while the bars’ height represents the variability range, reflecting the uncertainty inherent in the GCM projections. It is observed that the ensemble mean for monthly precipitation shows diverse trends in comparison to the baseline period. The uncertainty or variability range under the RCP8.5 scenario appears more constrained, indicating more consistent projections despite the anticipation of a higher average change. The projections under RCP4.5 and RCP8.5 exhibit broadly similar temperature trajectories across the basins. However, a closer comparison between the two scenarios reveals that RCP4.5 demonstrates more pronounced variability in temperature projections than RCP8.5. Notably, for RCP4.5, temperature increases are consistently forecasted across all models for the first seven months of the year, from January to July. Conversely, the period from August to December exhibits a mix of temperature increases and decreases. Additionally, the ensemble mean value for monthly temperatures indicates a steady upward trend from the 2025s through to the 2085s relative to the reference period.
For the Han River basin, the lowest projected temperature deviation occurs in October of the 2025s, with a decrease of 5.49 °C, while the highest increase is projected for March of the 2085s at 9.04 °C. The Nakdong River basin’s projections range from a minimum decrease of 4.60 °C in November of the 2025s to a maximum increase of 7.83 °C in April of the 2085s. Similar patterns are observed for the Geum River basin, with the lowest temperature in October and November of the 2025s (−4.91 °C) and the highest in March of the 2085s (+8.61 °C). The Sumjin and Yeongsan River basins are anticipated to experience their minimum temperatures in November of the 2025s, with respective decreases of 4.62 °C and 4.46 °C, and their maximum temperature increases in April of the 2085s, at 7.66 °C and 7.35 °C, respectively.
Under the higher-emissions RCP8.5 scenario, the GCMs display greater consistency, with the Han River basin’s minimum temperature decrease occurring in June of the 2025s (−0.11 °C). The other basins are predicted to reach their minimum temperatures in January of the 2025s, with variations from −0.14 °C to −0.06 °C. The maximum temperature increases for September of the 2085s are forecasted to range from 6.52 °C in the Nakdong River basin to 7.09 °C in the Geum River basin.
Figure 15 underscores the dynamic nature of projected temperature changes on a monthly basis, highlighting the need for adaptable and nuanced strategies in regional climate adaptation planning. The visualized data conveys the critical importance of addressing temporal variability in temperature projections for informed policy- and decision-making.

3.4.2. Variability in Mean Monthly Precipitation

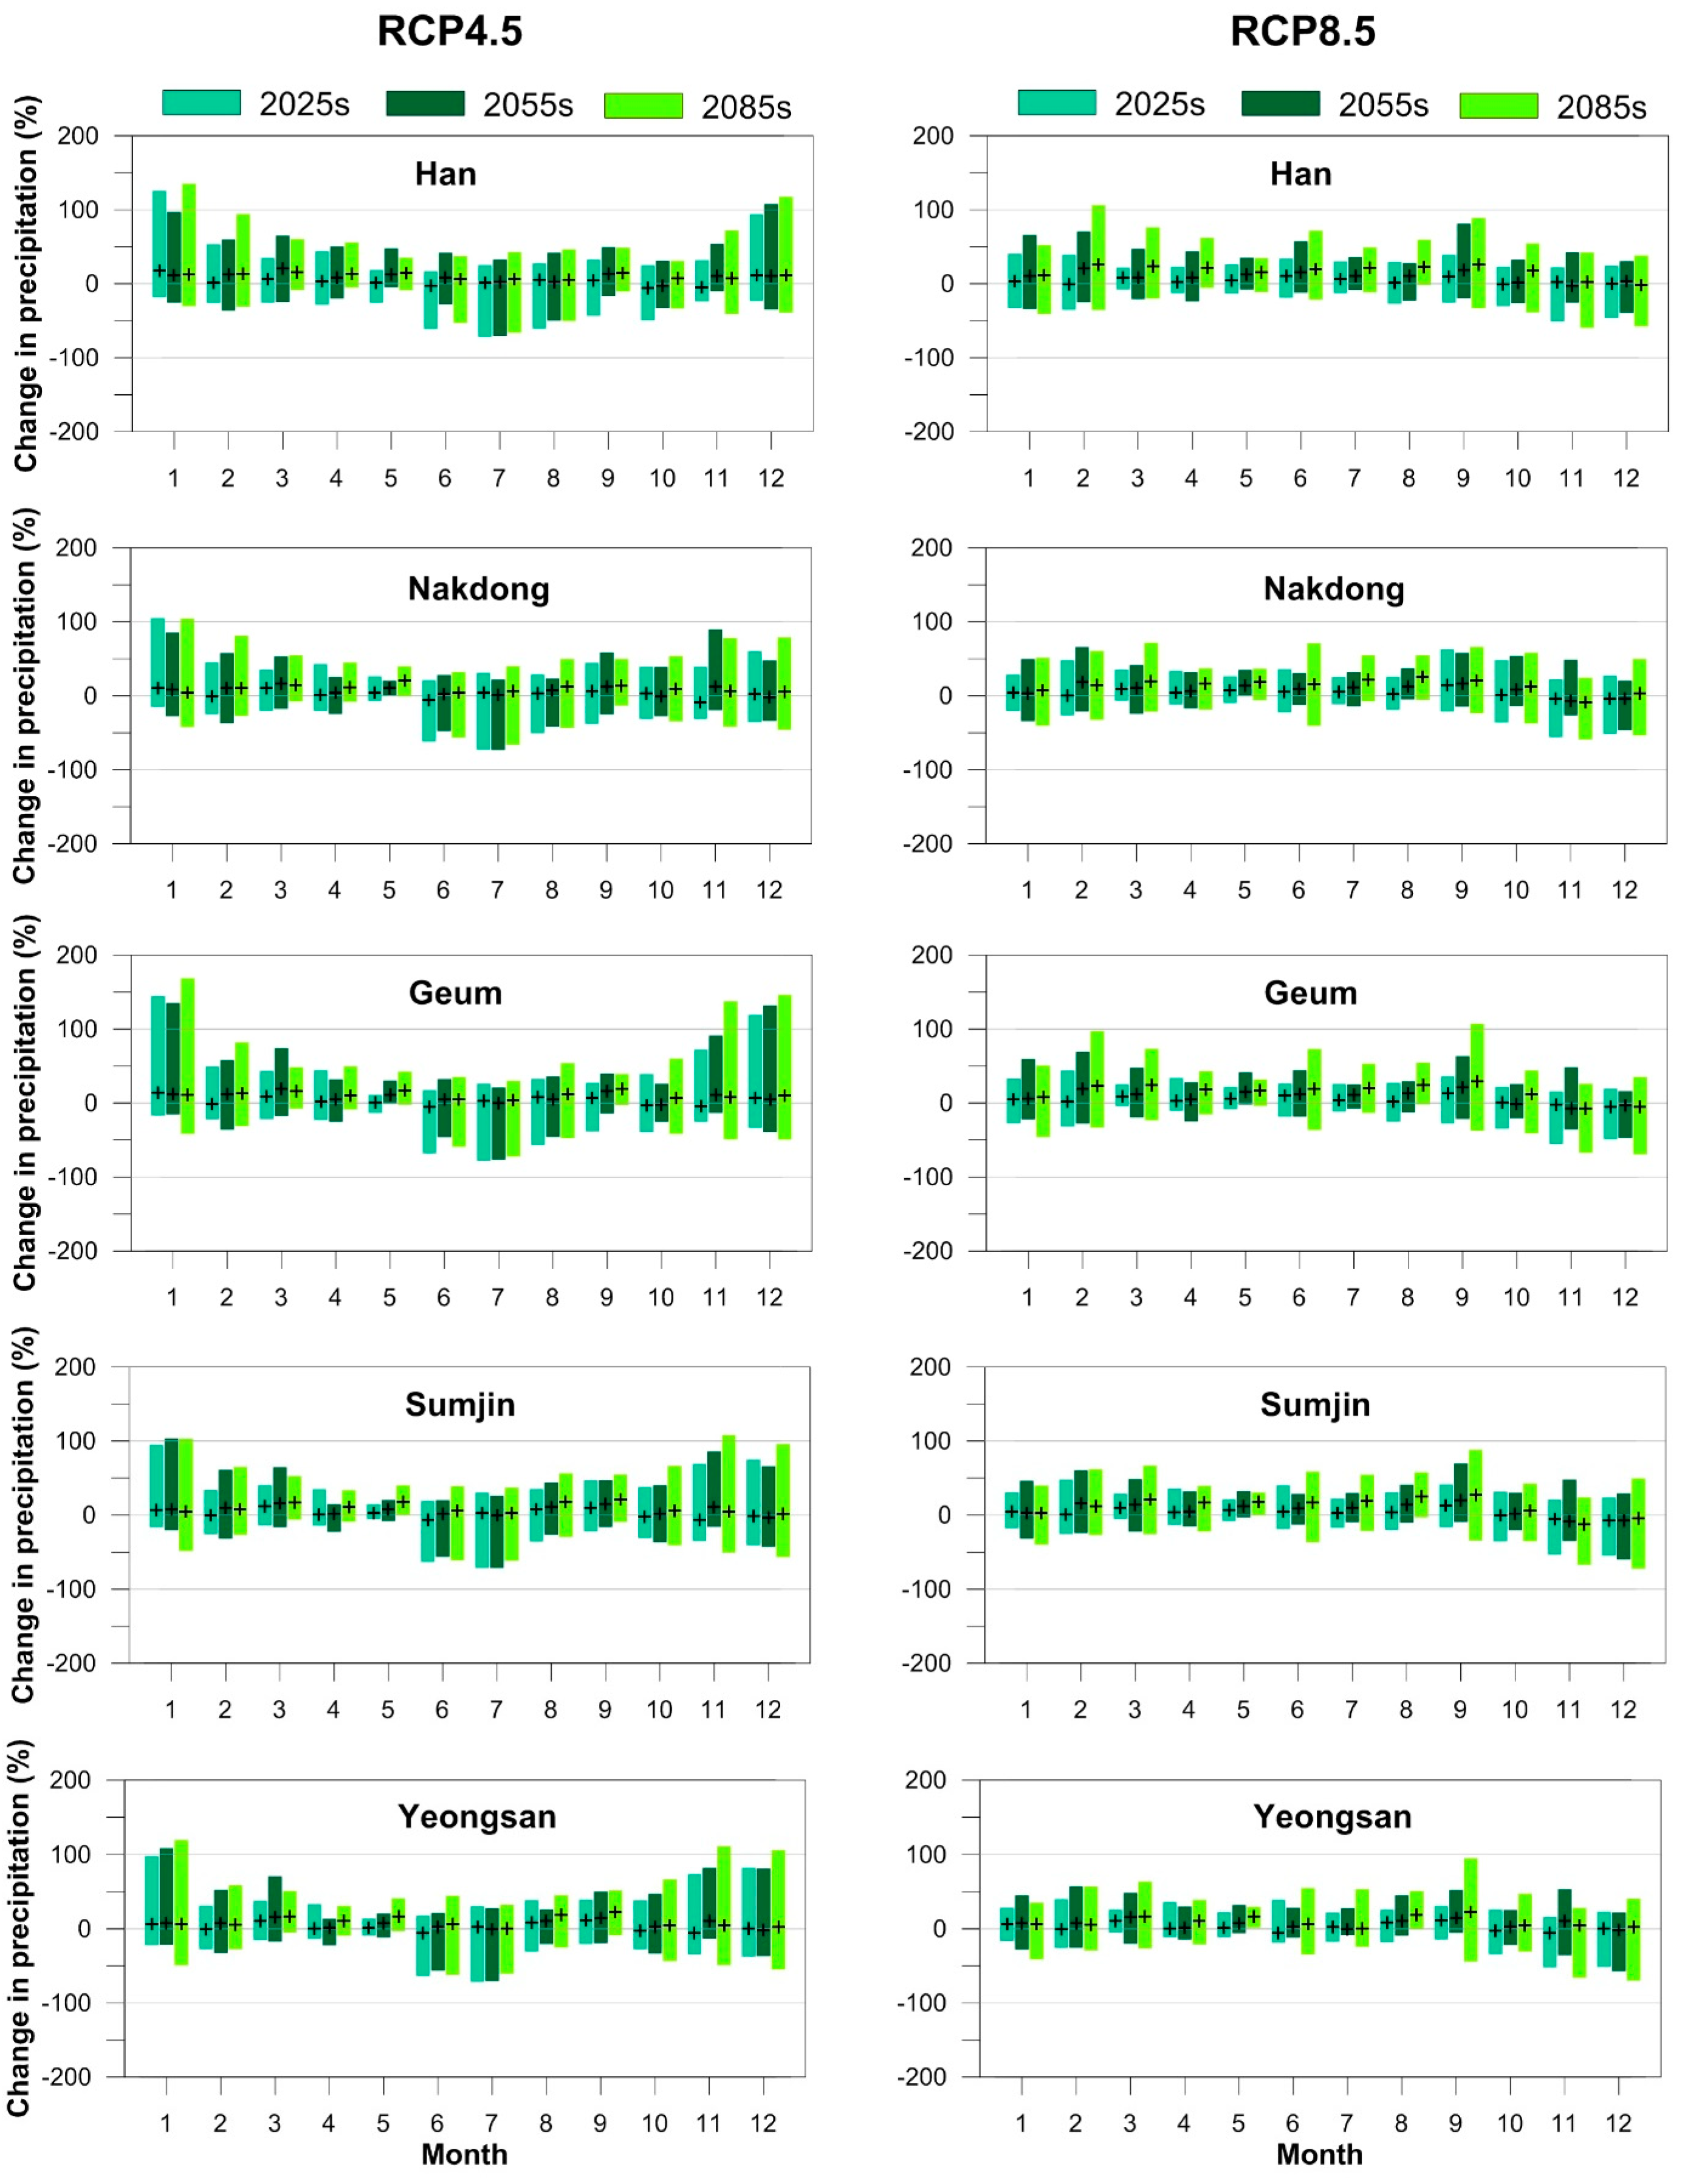
Figure 16 delineates the changes in mean monthly precipitation within the five major river basins of South Korea, according to projections from a Multi-Model Ensemble (MME) under RCP4.5 and RCP8.5 scenarios, relative to a historical baseline period. This figure illustrates the ensemble mean values, denoted by (+), and the variability range as indicated by the extent of the boxes, which capture the uncertainty of GCM projections. Notably, the ensemble mean of monthly precipitation exhibits varying tendencies by month when contrasted with the reference period. The extent of uncertainty, or variability range, appears to be more constrained under RCP8.5 compared to RCP4.5, suggesting a more precise projection despite a higher average change. Moreover, RCP4.5 shows greater uncertainty, particularly during the pronounced wet and dry seasons. While watershed-specific differences are not significant, the average change and variability range for the Geum and Han River basins are larger than those for the Nakdong, Yeongsan, and Sumjin River basins. The model outcomes indicate that precipitation changes are month-dependent.
The lowest projected precipitation under RCP4.5 is expected in July for all basins during the 2025s, with the exception of the Sumjin River basin, where the most significant decrease occurs in the 2055s. The magnitude of these decreases in mean monthly precipitation is considerable, with reductions of 72.05% for the Han, 73.18% for the Nakdong, 77.81% for the Geum, 71.41% for the Sumjin, and 71.71% for the Yeongsan River basins. Conversely, the maximum precipitation changes are anticipated in January of the 2085s, with increases of 135.29% for the Han, 168.61% for the Geum, and 119.16% for the Yeongsan River basins, and in January of the 2025s for the Nakdong River basin (104.98%). The Sumjin River basin is projected to experience the largest increase, 107.94%, in November of the 2085s.
Under the RCP8.5 scenario, both the maximum and minimum precipitation changes are foreseen in the 2085s. For the Han River basin, the minimum is projected for November (−59.57%), with the maximum in February (106.075%). The Nakdong River basin is expected to see its minimum in March (71.66%) and its maximum in November (−58.88%). The Geum, Sumjin, and Yeongsan River basins are projected to encounter their minimums in December, and their maximums in September, with Geum at −69.18% and 106.93%, Sumjin at −72.46% and 88.14%, and Yeongsan at −69.72% and 95.11% for the minimum and maximum, respectively.

3.4.3. Variability in Mean Monthly Actual Evapotranspiration

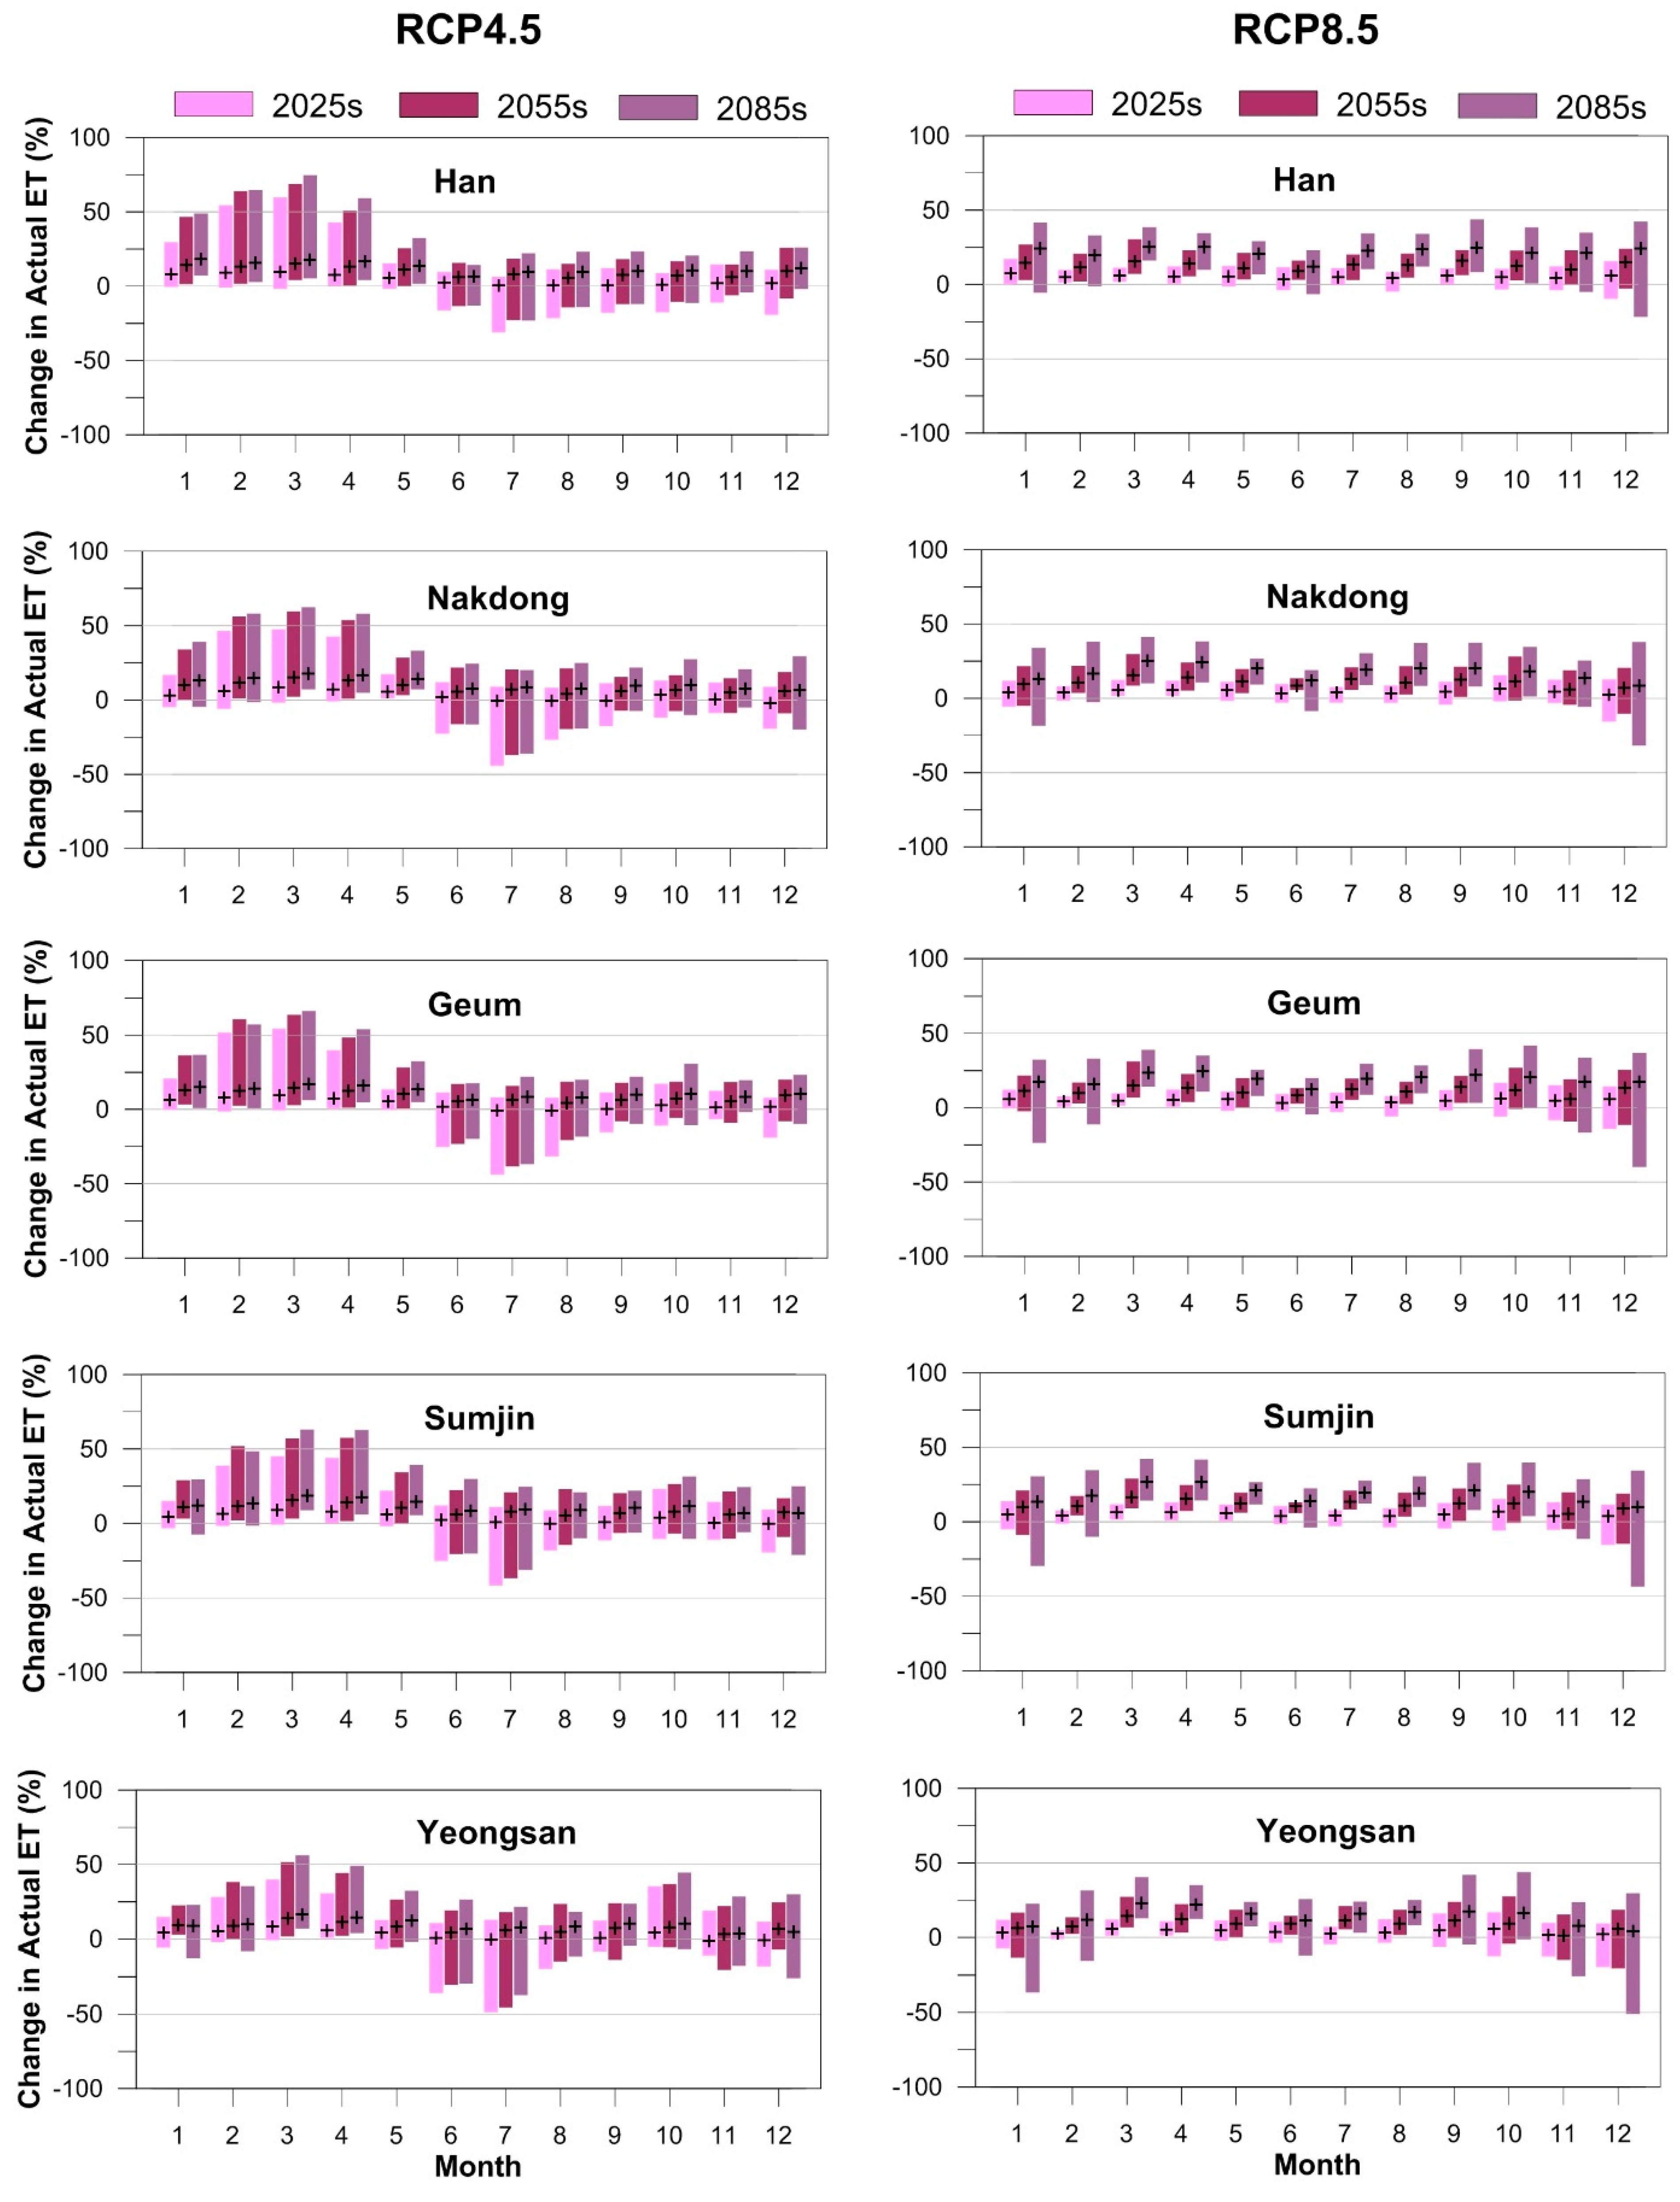
Figure 17 offers a detailed analysis of mean monthly actual evapotranspiration (AET) changes within the five major river basins of South Korea, against the backdrop of the historical baseline period for both RCP4.5 and RCP8.5 scenarios. The figure portrays the ensemble mean values, marked by (+), and the spread of projections from the General Circulation Models (GCMs) as expressed by the heights of the bars. These variations indicate a month-to-month variability in the projected changes of AET relative to the baseline, with a notable difference in the range of uncertainty between the two RCPs. Specifically, RCP4.5 displays a wider range of uncertainty, particularly during the wet and dry seasons, as opposed to the narrower variability range under RCP8.5, despite the latter’s higher average change rate.
The variability in AET does not exhibit significant watershed-specific differences. However, the uncertainty range is pronounced during the dry season for the Han, Nakdong, and Geum River basins, whereas for the Sumjin and Yeongsan River basins, it is more marked during the wet season. This suggests that seasonal factors significantly influence AET projections, with model outcomes diverging based on the month.
For RCP4.5, the minimum and maximum projected changes in AET are anticipated in July of the 2025s and March of the 2085s, respectively. The respective values for these extremes are as follows: a decrease of 31.08% and an increase of 74.62% for the Han River basin; a decrease of 44.34% and an increase of 62.51% for the Nakdong River basin; a decrease of 43.93% and an increase of 66.26% for the Geum River basin; a decrease of 41.63% and an increase of 63.00% for the Sumjin River basin; and a decrease of 48.74% and an increase of 56.24% for the Yeongsan River basin. Under RCP8.5, the smallest change in AET is projected for December of the 2085s across all basins, with decreases ranging from 21.91% to 51.09%. Conversely, the largest increases in AET are forecasted for differing months of the 2085s: September for the Han River basin (43.82%), March for the Nakdong (41.25%) and Sumjin (42.18%) River basins, and October for the Geum (41.69%) and Yeongsan (43.86%) River basins.
Figure 17 highlights the critical importance of accounting for temporal variability in AET when assessing the impacts of climate change on hydrological cycles within river basins. The projections underscore the need for dynamic water management strategies that can adapt to the changing conditions anticipated under different greenhouse-gas emission trajectories.

3.4.4. Variability in Mean Monthly Runoff

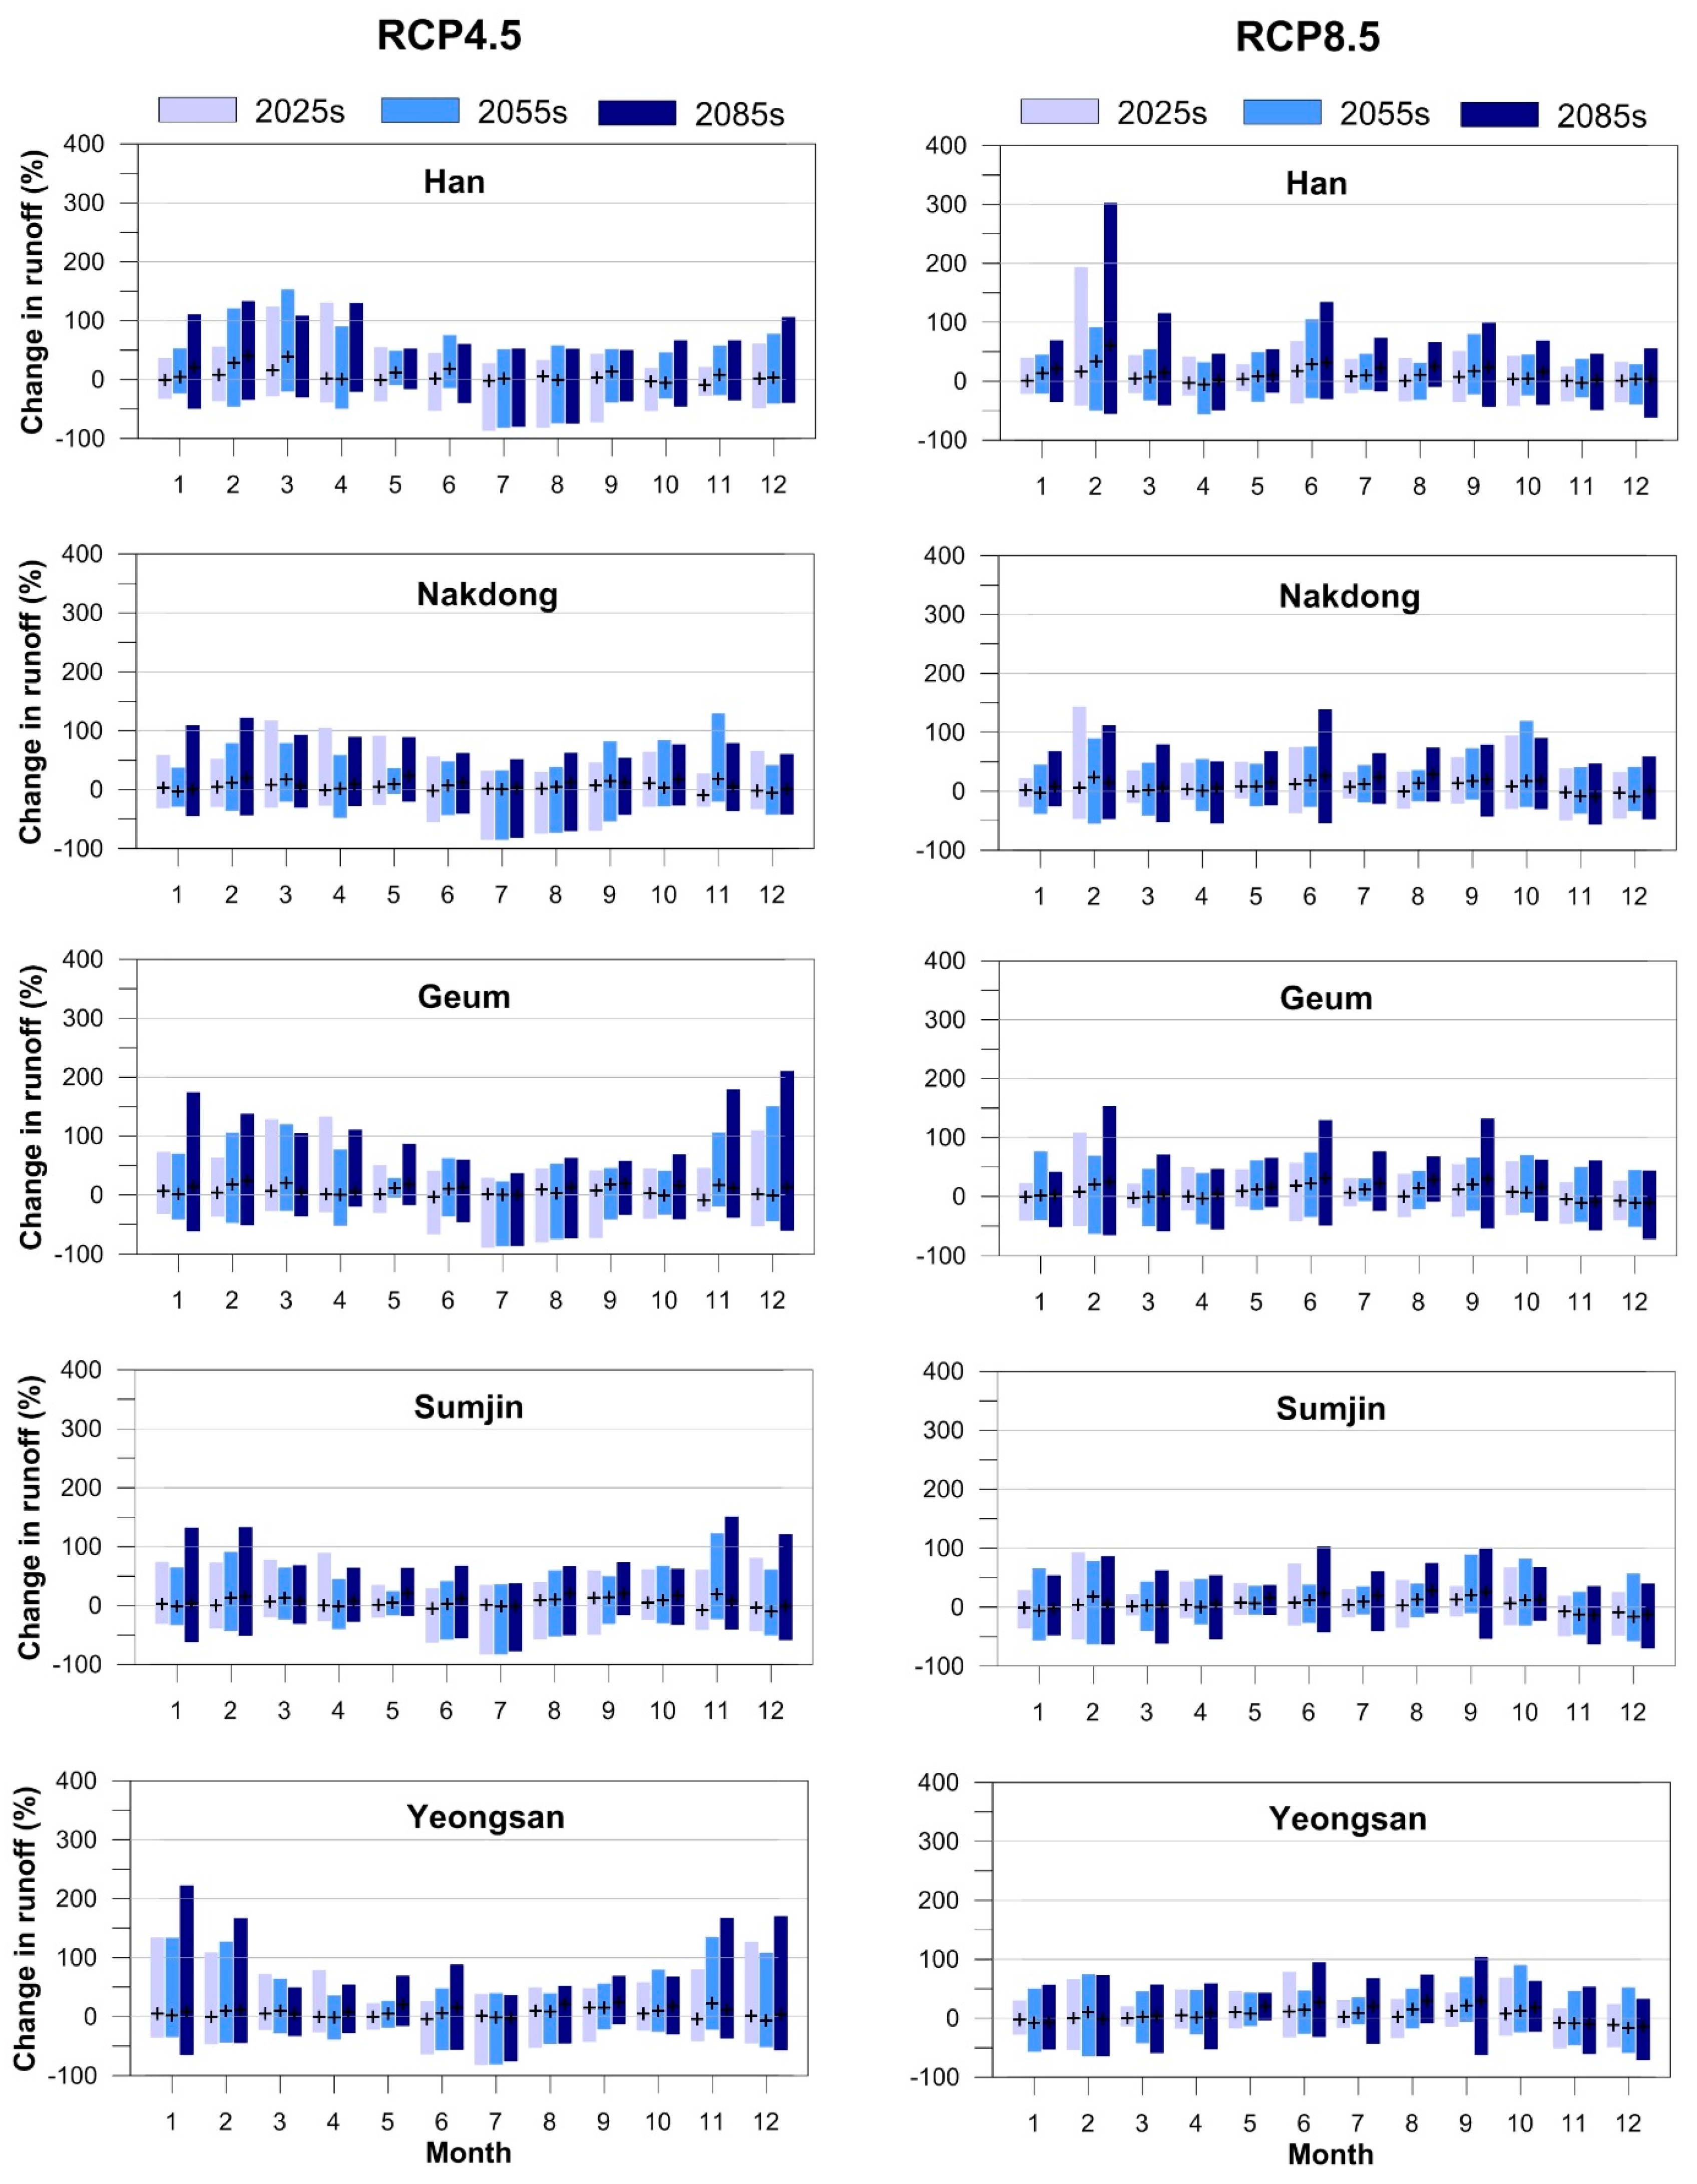
Figure 18 illustrates the variability in mean monthly runoff for the five major river basins in South Korea under the RCP4.5 and RCP8.5 scenarios, as compared to a baseline period. The figure displays the ensemble mean values indicated by (+) and the range of variations as determined by the height of the bars, representing the spread of projections from the General Circulation Models (GCMs). The ensemble mean values exhibit varied monthly trends relative to the baseline period, with a generally narrower range of uncertainty for RCP8.5 as opposed to RCP4.5, suggesting more consistency in the projections under the higher greenhouse-gas concentration scenario of RCP8.5. Notably, the uncertainty range for RCP4.5 is more pronounced, especially during the dry season.
While watershed-specific differences in the variability of runoff are not substantial, the Geum and Han River basins show a broader range of variability compared to the Nakdong, Yeongsan, and Sumjin River basins. Additionally, the GCM projections reveal that runoff changes vary significantly by month. Under RCP4.5, the most considerable reductions in mean monthly runoff are projected to occur in July for the 2025s across all basins except for the Nakdong River basin, where the largest decrease is expected in the 2055s. These reductions are quite substantial, with a decrease of 87.10% for the Han, 85.53% for the Nakdong, 88.84% for the Geum, 83.09% for the Sumjin, and 82.55% for the Yeongsan River basin. Conversely, the maximum increases in runoff for RCP4.5 are forecasted for different months and years, with the Han River basin peaking in March 2055 (152.78%), the Nakdong in November 2055 (129.39%), the Geum in December 2085 (210.44%), the Sumjin in November 2085 (150.78%), and the Yeongsan in January 2085 (22.50%).
For RCP8.5, the minimum changes in projected runoff using the GCM models are anticipated to occur in December 2085 for all basins, except for the Nakdong River basin, where the minimum is expected in November 2085. The decreases are considerable, with −61.73% for the Han, −56.75% for the Nakdong, −72.07% for the Geum, −69.83% for the Sumjin, and −70.58% for the Yeongsan River basin. The maximum increases under RCP8.5 are predicted to happen in February 2085 for the Han (303.11%) and Geum (153.60%), February 2025 for the Nakdong (143.65%), June 2085 for the Sumjin (102.67%), and September 2085 for the Yeongsan (103.84%) River basin.
Figure 18 conveys the extensive variability in runoff projections, emphasizing the significant month-to-month and scenario-specific differences in the potential hydrological responses to climate change. This variability underscores the importance of considering a broad range of projections for water resource planning and management strategies across South Korea’s river basins.

4. Discussion

This study, employing an advanced Multi-Model Ensemble (MME) approach with Global Climate Models (GCMs), has made a substantial contribution to understanding future climatic and hydrological scenarios in South Korea. We observed significant variability in winter precipitation and runoff, highlighting the complex dynamics of climate change at a local scale. This variability, compared to studies like those of Zhuan et al. [15] and Lane and Kay [16], underscores the challenges in accurately predicting regional impacts of climate change. Our findings resonate with these studies but also offer unique insights, particularly in the context of South Korea’s distinct climate dynamics.
The emphasis of our study on seasonal patterns in temperature and precipitation changes calls for a nuanced interpretation of climate impacts. This aligns with the observations made by Nigatu et al. [17], who noted increased lake storage due to climatic changes, suggesting similar shifts in hydrological patterns. Our comparative analysis with these studies enriches both regional and global understanding of climate change impacts. Moreover, our research contributes significantly to the body of evidence on regional impacts of global climate change. By focusing on South Korea’s river basins, we provide valuable insights into the effects of climate change in mid-latitude regions. The study draws parallels with other regions experiencing comparable climatic challenges, such as the Upper Yangtze River basin in China and the River Ganges in India, underscoring the need for region-specific and flexible adaptation strategies. This research not only contributes to the regional knowledge of climate change impacts, but also plays a pivotal role in the global discourse on climate change, emphasizing the importance of detailed, season-specific strategies in response to these changes.

5. Conclusions

Our comprehensive study, utilizing a Multi-Model Ensemble (MME) approach with 13 CMIP5 Global Climate Models (GCMs) under RCP4.5 and RCP8.5 scenarios, has significantly advanced our understanding of climate change’s hydrological and climatic impacts in South Korea. The study reveals a consistent temperature rise across all seasons, more pronounced under RCP8.5, signaling a strong response to increased greenhouse-gas emissions. This temperature increase coincides with an overall rise in precipitation and runoff in spring, summer, and autumn, contrasted with notable winter variability. This winter variability is key in understanding the complex responses of hydrological systems to climate change, underlining the necessity for adaptive strategies that are sensitive to seasonal and regional specificities. The observed increase in actual evapotranspiration, particularly during autumn, presents potential challenges for water management and agricultural planning. The findings underscore the need for dynamic, regionally tailored adaptation strategies, integrating both local and global climate trends. This research provides crucial insights for effective water resource management, agricultural planning, and ecosystem sustainability, highlighting the urgent need for integrated, forward-thinking approaches to climate adaptation. Our study serves as a vital assessment of projected climate change impacts in South Korea, emphasizing the importance of region-specific strategies in response to these changes.

Author Contributions

Conceptualization, M.G.-A.; Data curation, M.G.-A.; Formal analysis, M.G.-A.; Funding acquisition, S.-I.L.; Methodology, M.G.-A.; Project administration, S.-I.L.; Supervision, S.-I.L.; Visualization, M.G.-A.; Writing—original draft, M.G.-A.; Writing—review and editing, M.G.-A. and S.-I.L. All authors have read and agreed to the published version of the manuscript.

Funding

This work was supported by the National Research Foundation of Korea (NRF) grant by the Korea government (2021R1A2C2011193).

Data Availability Statement

This study analyzed publicly available datasets. The data can be accessed at the following sources: MOLIT (www.molit.go.kr), KMA (www.kma.go.kr), and WAMIS (www.wamis.go.kr).

Acknowledgments

This work was supported by the National Research Foundation of Korea (NRF) grant by the Korea government (2021R1A2C2011193). The authors acknowledge the National Research Foundation of Korea (NRF) grant from the Korean government.

Conflicts of Interest

The authors declare no conflicts of interest.

References

  1. Randall, D.A.; Wood, R.A.; Bony, S.; Colman, R.; Fichefet, T.; Fyfe, J.; Kattsov, V.; Pitman, A.; Shukla, J.; Srinivasan, J.; et al. Cilmate Models and Their Evaluation. In Climate Change 2007: The Physical Science Basis. Contribution of Working Group I to the Fourth Assessment Report of the Intergovernmental Panel on Climate Change; Cambridge University Press: Cambridge, UK; New York, NY, USA, 2007. [Google Scholar]
  2. Zhao, T.; Chen, H.; Xu, W.; Cai, H.; Yan, D.; Chen, X. Spatial Association of Anomaly Correlation for GCM Seasonal Forecasts of Global Precipitation. Clim. Dyn. 2020, 55, 2273–2286. [Google Scholar] [CrossRef]
  3. Guan, T.; Liu, Y.; Sun, Z.; Zhang, J.; Chen, H.; Wang, G.; Jin, J.; Bao, Z.; Qi, W. A Framework to Identify the Uncertainty and Credibility of GCMs for Projected Future Precipitation: A Case Study in the Yellow River Basin, China. Front. Environ. Sci. 2022, 10, 863575. [Google Scholar] [CrossRef]
  4. Knutti, R.; Sedlacek, J. Robustness and Uncertainties in the New CMIP5 Climate Model Projections. Nat. Clim. Chang. 2013, 3, 369–373. [Google Scholar] [CrossRef]
  5. Adelodun, B.; Ahmad, M.J.; Odey, G.; Adeyi, Q.; Choi, K.S. Performance-Based Evaluation of CMIP5 and CMIP6 Global Climate Models and Their Multi-Model Ensembles to Simulate and Project Seasonal and Annual Climate Variables in the Chungcheong Region of South Korea. Atmosphere 2023, 14, 1569. [Google Scholar] [CrossRef]
  6. IPCC. 2001: Climate Change 2001: The Scientific Basis. Contribution of Working Group I to the Third Assessment Report of the Intergovernmental Panel on Climate Change; Houghton, J.T., Ding, Y., Griggs, D.J., Noguer, M., van der Linden, P.J., Dai, X., Maskell, K., Johnson, C.A., Eds.; Cambridge University Press: Cambridge, UK; New York, NY, USA, 2001; 881p. [Google Scholar]
  7. Adib, A.; Haidari, B.; Lotfirad, M.; Sasani, H. Evaluating climatic change effects on EC and runoff in the near future (2020–2059) and far future (2060–2099) in arid and semi-arid watersheds. Appl. Water Sci. 2023, 13, 122. [Google Scholar] [CrossRef]
  8. Eum, H.I.; Cannon, A.J. Intercomparison of projected changes in climate extremes for South Korea: Application of trend preserving statistical downscaling methods to the CMIP5 ensemble. Int. J. Climatol. 2017, 4, 3381–3397. [Google Scholar] [CrossRef]
  9. Yan, D.; Werners, S.E.; Ludwig, F.; Huang, H.Q. Hydrological response to climate change: The Pearl River, China under different RCP scenarios. J. Hydrol. Reg. Stud. 2015, 4, 228–245. [Google Scholar] [CrossRef]
  10. Sa’adi, Z.; Shahid, S.; Chung, E.S.; Ismail, T. Projection of spatial and temporal changes of rainfall in Sarawak of Borneo Island using statistical downscaling of CMIP5 models. Atmos. Res. 2017, 197, 446–460. [Google Scholar] [CrossRef]
  11. Cannon, A.J. Selecting GCM Scenarios that Span the Range of Changes in a Multimodel Ensemble: Application to CMIP5 Climate Extremes Indices. J. Clim. 2015, 28, 1260–1267. [Google Scholar] [CrossRef]
  12. Veerabhadrannavar, S.A.; Venkatesh, B. Future Predictions of Precipitation and Discharge Using CMIP5 Models in the Western Ghats Region. India. NEPT J. 2022, 21, 2201–2209. [Google Scholar] [CrossRef]
  13. Wang, X.; Hou, X.; Piao, Y.; Feng, A.; Li, Y. Climate Change Projections of Temperature Over the Coastal Area of China Using SimCLIM. Front. Environ. Sci. 2021, 9, 548. [Google Scholar] [CrossRef]
  14. Olmo, M.; Balmaceda-Huarte, R.; Bettolli, M. Multi-model ensemble of statistically downscaled GCMs over southeastern South America: Historical evaluation and future projections of daily precipitation with focus on extremes. Clim. Dyn. 2021, 59, 3051–3068. [Google Scholar]
  15. Zhuan, M.-J.; Chen, J.; Shen, M.-X.; Xu, C.-Y.; Chen, H.; Xiong, L.-H. Timing of human-induced climate change emergence from internal climate variability for hydrological impact studies. Hydrol. Res. 2018, 49, 421–437. [Google Scholar] [CrossRef]
  16. Lane, R.A.; Kay, A.L. Climate Change Impact on the Magnitude and Timing of Hydrological Extremes Across Great Britain. Front. Water 2021, 3, 684982. [Google Scholar] [CrossRef]
  17. Nigatu, Z.M.; Rientjes, T.; Haile, A. Hydrological impact assessment of climate change on Lake Tana’s water balance, Ethiopia. Am. J. Clim. Chang. 2016, 5, 27–37. [Google Scholar] [CrossRef]
  18. Wen, S.; Su, B.; Wang, Y.; Zhai, J.; Sun, H.; Chen, Z.; Huang, J.; Wang, A.; Jiang, T. Comprehensive evaluation of hydrological models for climate change impact assessment in the Upper Yangtze River Basin, China. Clim. Chang. 2020, 163, 1207–1226. [Google Scholar] [CrossRef]
  19. Jain, C.K.; Singh, S. Impact of climate change on the hydrological dynamics of River Ganga, India. J. Water Clim. Chang. 2020, 11, 274–290. [Google Scholar] [CrossRef]
  20. Hwang, J.H.; Van, S.P.; Choi, B.-J.; Chang, Y.S.; Kim, Y.H. The physical processes in the Yellow Sea. Ocean Coast. Manag. 2014, 102, 449–457. [Google Scholar] [CrossRef]
  21. Leavesley, G.H.; Markstrom, S.L.; Restrepo, P.J.; Viger, R.J. A modular approach to addressing model design, scale, and parameter estimation issues in distributed hydrological modelling. Hydrol. Process 2002, 16, 173–187. [Google Scholar] [CrossRef]
  22. Leavesley, G.H.; Lichty, R.W.; Troutman, B.M.; Saindon, L.G. Precipitation-Runoff Modeling System-User’s Manual: U.S. Geological Survey Water-Resources Investigations Report; US Department of the Interior: Washington, DC, USA, 1983; Volume 83, pp. 1–207.
  23. Chang, H.; Jung, I.W. Spatial and temporal changes in runoff caused by climate change in a complex large river basin in Oregon. J. Hydrol. 2010, 388, 186–207. [Google Scholar] [CrossRef]
  24. Hamon, W.R. Estimating potential evapotranspiration. Proceedings of the American Society of Civil Engineers. J. Hydraul. Div. 1961, 87, 107–120. [Google Scholar] [CrossRef]
  25. Rosenbrock, H.H. An automatic method of finding the greatest or least value of a function. Comput. J. 1960, 3, 175–184. [Google Scholar] [CrossRef]
  26. Jung, I.W.; Bae, D.H.; Lee, B.J. Possible change in Korean streamflow seasonality based on multi-model climate projections. Hydrol. Process 2013, 27, 1033–1045. [Google Scholar] [CrossRef]
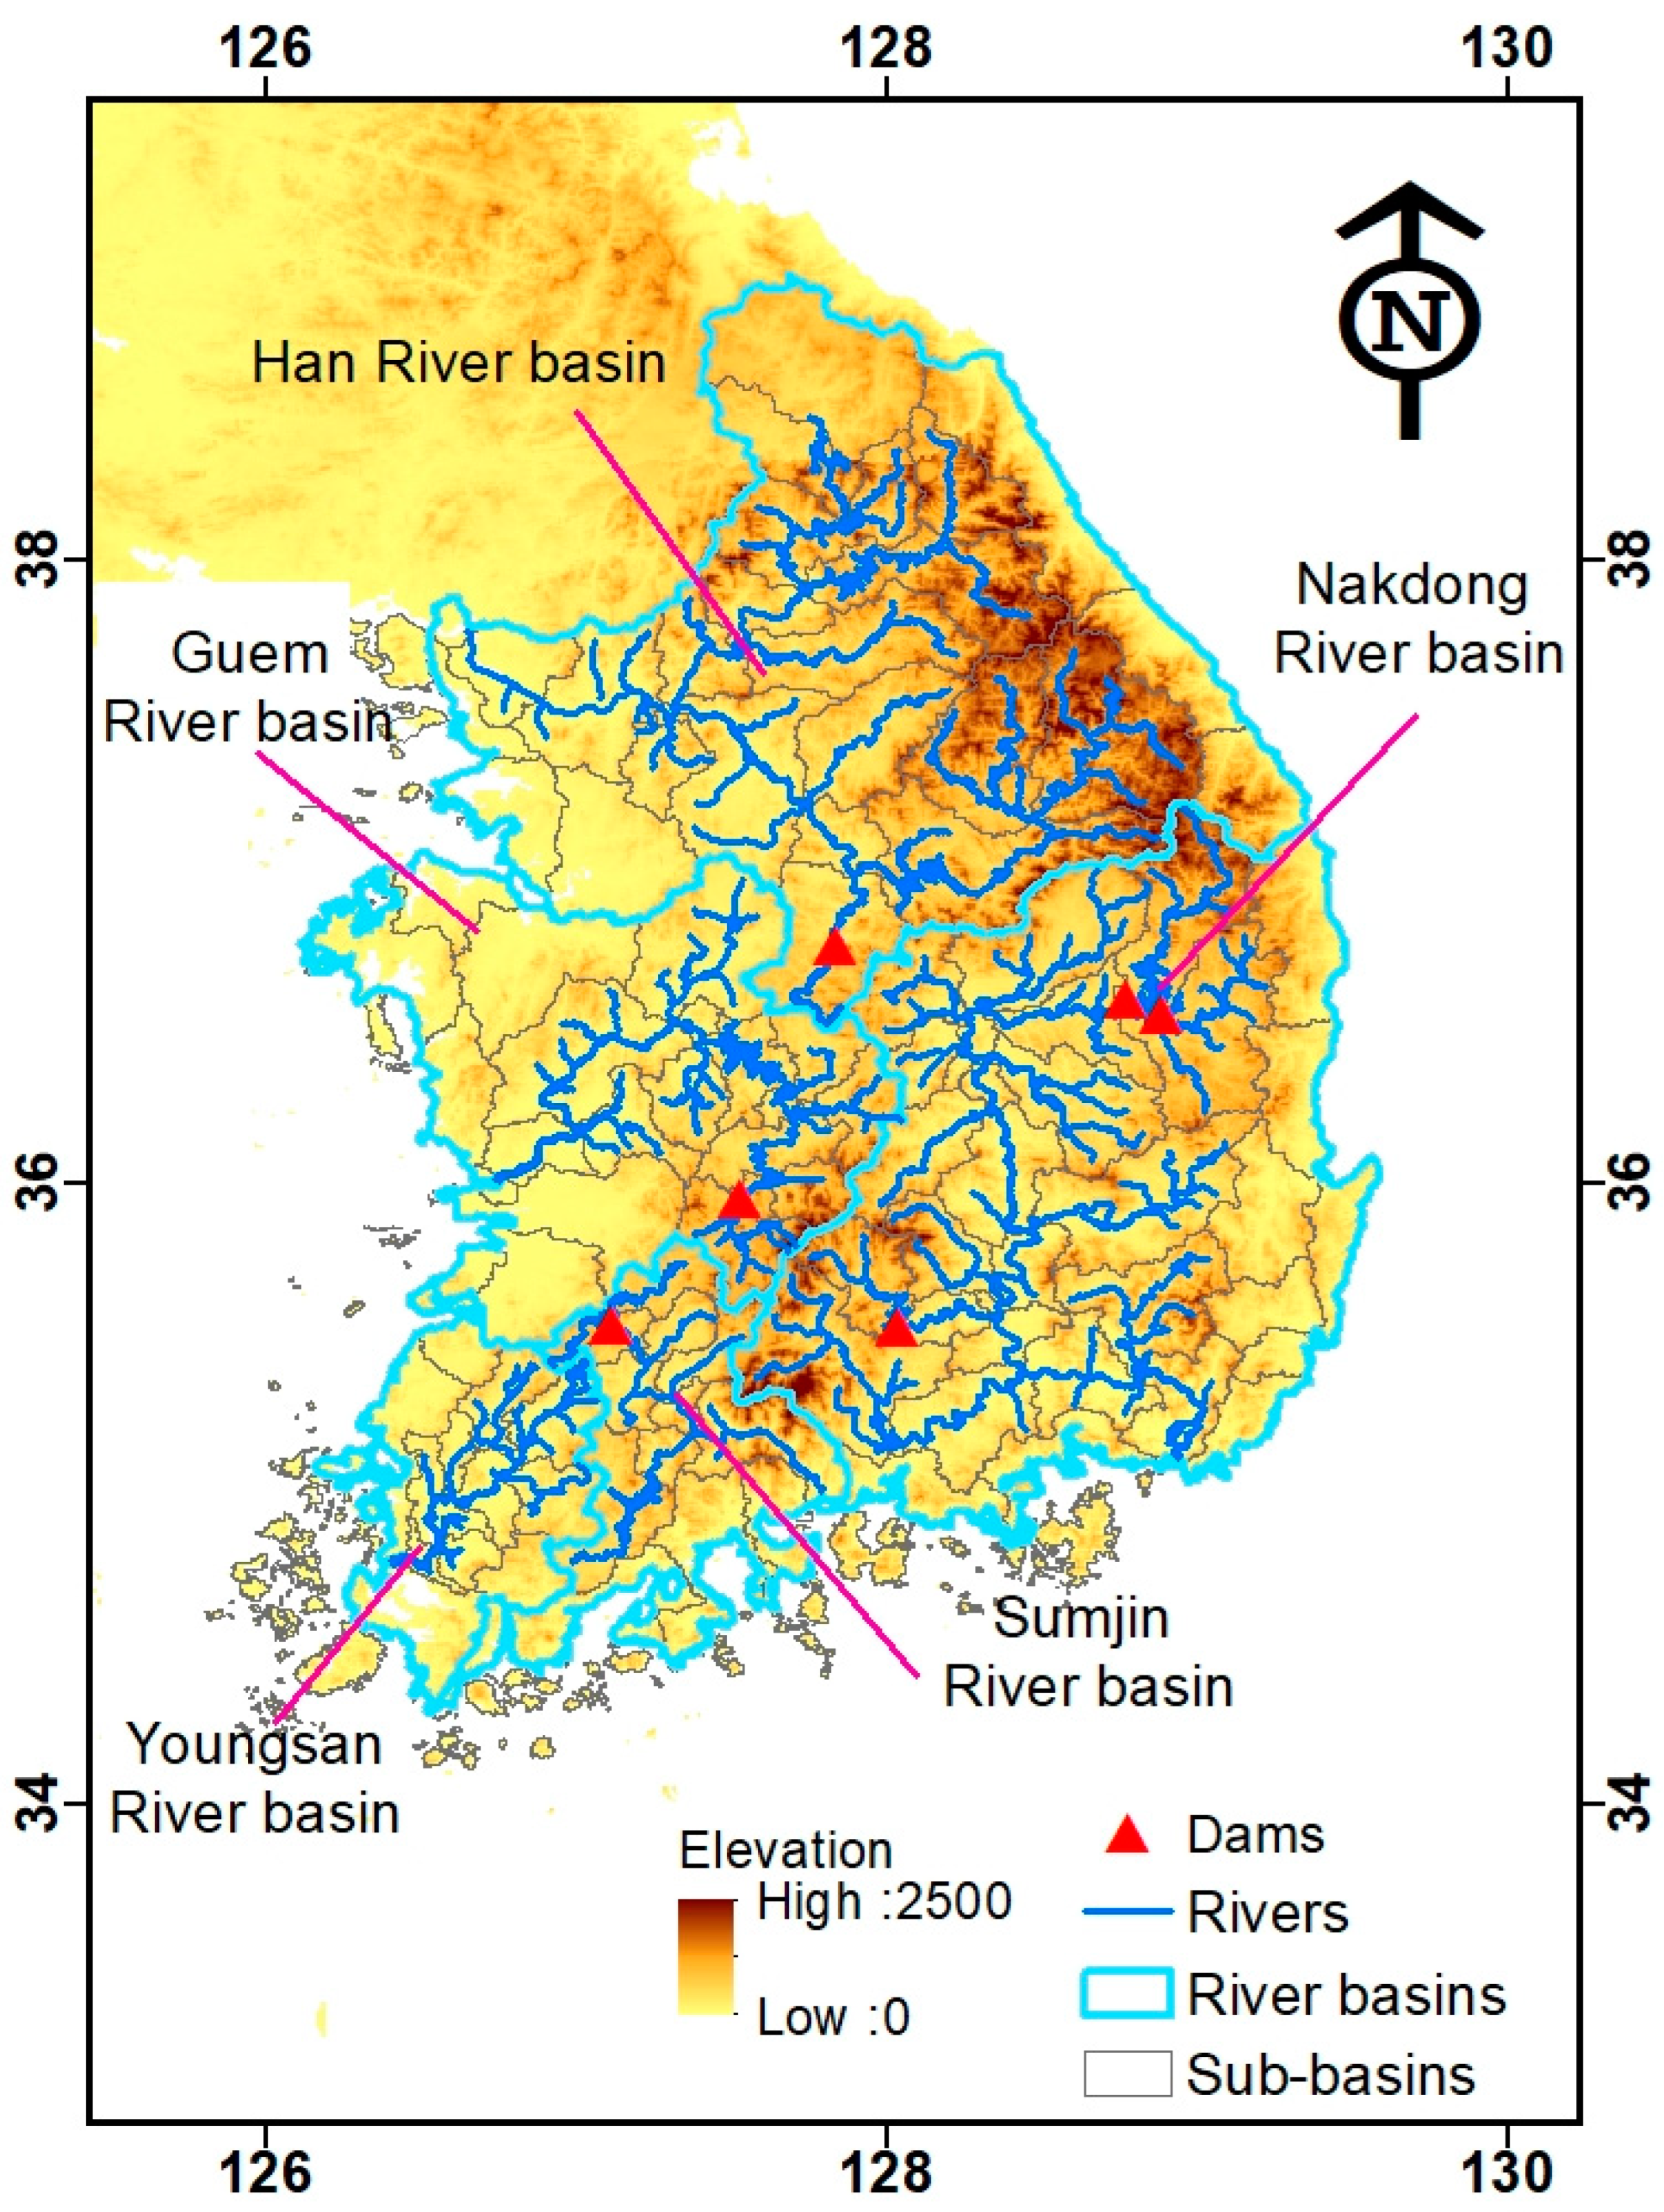
Figure 1. Five large river basins and the locations of six major dams.
Water 16 00555 g001
Figure 2. Timeline delineation for climate projection analysis, dividing a span from 1976 to 2099 into a historical baseline period (1976–2005) and future 30-year segments: the 2025s (2011–2040), the 2055s (2041–2070), and the 2085s (2071–2099).
Water 16 00555 g002
Figure 3. Seasonal temperature and precipitation changes among the 13-GCM ensemble for RCP4.5 in 2025s (2011–2040), 2055s (2041–2070), and 2085s (2071–2099) compared to the reference period (1976–2005).
Water 16 00555 g003
Figure 4. Seasonal runoff and precipitation changes across the ensemble of 13 GCMs for RCP4.5 in 2025s (2011–2040), 2055s (2041–2070), and 2085s (2071–2099) compared to the reference period (1976–2005).
Water 16 00555 g004
Figure 5. Seasonal runoff and temperature changes among the ensemble of 13 GCMs for RCP4.5 in 2025s (2011–2040), 2055s (2041–2070), and 2085s (2071–2099) compared to the reference period (1976–2005).
Water 16 00555 g005
Figure 6. Seasonal runoff and actual evapotranspiration changes among the ensemble of 13 GCMs for RCP4.5 in 2025s (2011–2040), 2055s (2041–2070), and 2085s (2071–2099) compared to the reference period (1976–2005).
Water 16 00555 g006
Figure 7. Comparative analysis of Multi-Model Ensemble for projected monthly temperature increases in South Korea under RCP4.5 and RCP8.5 emission scenarios.
Water 16 00555 g007
Figure 8. Relative changes in mean monthly Multi-Model Ensemble for precipitation.
Water 16 00555 g008
Figure 9. Relative changes in mean monthly Multi-Model Ensemble for actual evapotranspiration.
Water 16 00555 g009
Figure 10. Relative changes in mean monthly Multi-Model Ensemble for total runoff.
Water 16 00555 g010
Figure 11. Projected absolute changes in mean seasonal temperatures for the 2025s, 2055s, and 2085s compared to the reference period, as simulated by a Multi-Model Ensemble for the five major river basins in Korea.
Water 16 00555 g011
Figure 12. Projected relative changes in mean seasonal precipitation for the 2025s, 2055s, and 2085s, compared to the reference period, across the five major river basins in Korea, as simulated by a Multi-Model Ensemble.
Water 16 00555 g012
Figure 13. Projected relative changes in mean seasonal actual evapotranspiration for the 2025s, 2055s, and 2085s, compared to the reference period, for Korea’s five major river basins as predicted by a Multi-Model Ensemble.
Water 16 00555 g013
Figure 14. Projected relative changes in mean seasonal total runoff for the 2025s, 2055s, and 2085s, compared to the reference period, across South Korea’s five major river basins, as predicted by a Multi-Model Ensemble.
Water 16 00555 g014
Figure 15. Projected absolute variations in mean monthly temperatures for the 2025s, 2055s, and 2085s compared to the reference period (1976–2005) for South Korea’s five principal river basins, as per 13 GCM scenarios. The MME value is indicated by the “(+)” symbol.
Water 16 00555 g015
Figure 16. Relative changes in mean monthly precipitation as projected by a Multi-Model Ensemble for the 2025s, 2055s, and 2085s compared to the historical baseline period (1976–2005) across the five major river basins of South Korea. The MME value is indicated by the “(+)” symbol.
Water 16 00555 g016
Figure 17. Relative changes in mean monthly actual evapotranspiration as projected by a Multi-Model Ensemble for the 2025s, 2055s, and 2085s, relative to the reference period (1976–2005) across the five major river basins of South Korea. The MME value is indicated by the “(+)” symbol.
Water 16 00555 g017
Figure 18. Relative changes in mean monthly total runoff for the 2025s, 2055s, and 2085s compared to the baseline period, as projected by a Multi-Model Ensemble across the five major river basins of South Korea. The MME value is indicated by the “(+)” symbol.
Water 16 00555 g018
Table 1. List of global climate models employed in this study.
No.GCMsInstitutionResolution (Degree)
1CMCC-CMCentro Euro-Mediterraneo per I Cambiamenti Climatici0.750 × 0.748
2CESM1-BGCNational Center for Atmospheric Research1.250 × 0.942
3MRI-CGCM3Meteorological Research Institute1.125 × 1.122
4CNRM-CM5Centre National de Recherches Météorologiques1.406 × 1.401
5HadGEM2-AOMet Office Hadley Centre1.875 × 1.250
6HadGEM2-ESMet Office Hadley Centre1.875 × 1.250
7INM-CM4Institute for Numerical Mathematics2.000 × 1.500
8IPSL-CM5A-MRInstitute Pierre-Simon Laplace1.875 × 1.865
9CMCC-CMSCentro Euro-Mediterraneo per I Cambiamenti Climatici1.875 × 1.865
10NorESM1-MNorwegian Climate Centre2.500 × 1.895
11GFDL-ESM2GGeophysical Fluid Dynamics Laboratory2.500 × 2.023
12IPSL-CM5A-LRInstitute Pierre-Simon Laplace3.750 × 1.895
13CanESM2Canadian Centre for Climate Modelling and Analysis2.813 × 2.791
Disclaimer/Publisher’s Note: The statements, opinions and data contained in all publications are solely those of the individual author(s) and contributor(s) and not of MDPI and/or the editor(s). MDPI and/or the editor(s) disclaim responsibility for any injury to people or property resulting from any ideas, methods, instructions or products referred to in the content.