Article

Evaluating Effective Particle Size Distributions of Cohesive Sediment under Varying Shear Stress and Bed Configurations in a Rotating Annular Flume

by
Rafaela Maltauro
1,*,
Micheal Stone
1,
Adrian L. Collins
2 and
Bommanna G. Krishnappan
3
1
Department of Geography & Environmental Management, University of Waterloo, Waterloo, ON N2L 3G1, Canada
2
Net Zero and Resilient Farming, Rothamsted Research, Okehampton EX20 2SB, UK
3
Environment Canada, Burlington, ON L7R 4A6, Canada
*
Author to whom correspondence should be addressed.
Water 2024, 16(4), 546; https://doi.org/10.3390/w16040546
Submission received: 17 January 2024 / Revised: 6 February 2024 / Accepted: 7 February 2024 / Published: 9 February 2024
(This article belongs to the Special Issue Cohesive Sediment Transport Processes)

Abstract

:
Despite the environmental significance and ecological importance of cohesive sediment (<63 μm), improved knowledge of how effective particle size distributions (EPSDs) change due to flocculation under different conditions of shear stress and bed configuration is required to better understand in situ transport and storage properties and refine existing sediment transport models. Here, a rotating annular flume was used to (i) evaluate EPSDs under different shear stress and bed types (plane-impermeable and -porous gravel bed) for deposition and erosion experiments; (ii) assess flocculation processes with EPSDs; and (iii) compare flume and field EPSDs observations with respect to measured shear stress. While deposition experiments over the impermeable bed led to an EPSD equilibrium in all shear conditions (constant EPSD percentiles), the ingress experiment over the gravel bed resulted in varying EPSDs, and no equilibrium was observed. During the erosion experiment, deposited flocs became coarser due to bed consolidation, and no particle breakage was observed once particles were resuspended. The ingress experiment showed high efficiency in entrapping suspended particles (~95% of initial suspended sediment), and no exfiltration or resuspension was recorded. Flocculation ratios calculated using EPSDs showed negative correlations with shear stress, indicating that increasing flow energy promoted flocculation for flume and field observations. Our results showed that both suspended and bed sediments can flocculate into coarser flocs that, in turn, are preferentially ingressed and stored in the substrate when in suspension. These findings have important implications regarding legacy impacts, as substrate-stored particles can potentially extend the effects of upstream landscape disturbances.

1. Introduction

Cohesive sediments (organic and inorganic particles < 63 μm) are important vectors for the transport of many nutrients and contaminants in aquatic systems [1,2]. Accordingly, excess amounts of fine sediment and associated pollutants can alter the chemical, physical, and biological processes in rivers [3,4,5,6]. Primary particles of cohesive sediment flocculate with other mineral particles and a range of organic compounds and bacteria, forming flocs due to collision mechanisms in the flow field [7,8,9]. Relative to primary particles, flocculation alters effective (flocculated) particle size distributions (EPSDs), particle shape, density, porosity, and settling velocities of flocs [8,9,10,11,12]. Compared to dispersed primary particles, flocculation can increase the settling velocities of flocs by one to two orders of magnitude [13,14,15]. Given that most transport parameters (e.g., density, settling velocity) of flocculated particles change as a function of floc size [16], and given available laser diffraction methodologies to measure in situ EPSDs reliably, understanding the dynamics of EPSDs under varying environments and flow conditions is crucial for progressing the understanding of cohesive sediment transport. Despite the existing literature on flocculation, this process has not been sufficiently quantified for a range of particulate matter types, water chemistry, and flow fields [14,15,17].
Flocculation processes have been greatly overlooked in riverine environments [13], especially in high-energy gravel-bed rivers, where flow fields are invariably turbulent. However, high-energy gravel-bed rivers draining forested mountainous landscapes are critical to downstream water supply [18] and regional ecological integrity [19], and catastrophic landscape events such as wildfires, which have been increasing in intensity and frequency due to ongoing climate change [20], pose a great threat to these high-quality river systems by altering the dynamics of fine sediment transport and fate [21]. Recent work has demonstrated the important role of flocculation [9,11,22,23,24,25] on the transport properties of cohesive materials, even within turbulent flow fields [15,17,26,27]. Moreover, studies have reported on the interactions between cohesive suspended sediment and gravel-bed channels through ingress mechanisms, which have important consequences for interstitial storage and deleterious ecological impacts caused by excess deposition and colmation (the process of interstitial clogging) [3,5,6,28], and the timing for downstream propagation of fine sediment and associated contaminants [22,29,30]. Yet, much less is currently known about the effects of the gravel bed on flocculation processes and to what extent flocculation affects the interactions between cohesive sediment and gravel substrates.
Despite the turbulent flows characteristic of mountainous gravel-bed rivers, gravitational deposition due to particle settling can still occur in areas of flow separation, reverse circulation, or reaches with reduced slopes, especially during periods of low flows [6,31,32]. Due to the intrinsic nature of cohesive particles, surface deposition leads deposited sediment to undergo stabilization and consolidation processes that have been observed to increase the critical flow energy required to resuspend deposited materials [33]. In riverine systems, the entrainment of deposited cohesive sediments, in terms of sediment concentration, has been observed through laboratory assessments to be affected by the following: the nature of cohesive particles, as stabilization can be enhanced by biochemical sediment interactions [34]; the concentration of the suspension at the time of deposition [35]; the antecedent conditions leading to the deposition, as particles deposited under higher flow energy are known to withstand even higher energy prior to resuspension [33]; the consolidation period before resuspension [36]; and the rate in which flow energy is increased to promote bed erosion [37]. However, while some studies have reported on particle size changes of resuspended cohesive sediment [35,36], it is still not clear how flocculation and particle breakage processes affect EPSDs once deposited particles are resuspended into the turbulent flow field.
Understanding how EPSDs change as cohesive particles are transported in the flow field is critical for elucidating the transport and fate of these particles [38,39]. Further, given the environmental importance of gravel-bed rivers [19], understanding cohesive sediment transport properties in these systems is of great importance for their improved management and conservation, especially given the limitation of flocculation studies in high-energy flow fields. Accordingly, the objectives of this study were to (i) evaluate EPSDs under different conditions of shear stress and bed type (plane-impermeable and plane-porous gravel bed) during erosion and deposition experiments in a rotating annular flume; (ii) examine flocculation processes through the measured EPSDs; and (iii) compare results obtained from the laboratory flume experiments with in situ measurements in the Crowsnest River.

2. Methods

2.1. Rotating Annular Flume

The rotating annular flume located in the Canada Centre for Inland Waters (CCIW—Burlington, ON, Canada) was used in this study, and the flume has been previously described in detail along with its pictures and schematic representation [14]. The flume (30 × 30 cm cross-section) has an annular diameter of 5 m and a channel circumference of 15.7 m. The channel is covered with a lid of adjustable height that is configured to remain in contact with the water surface throughout experiments. Counter-rotation between the channel and the lid generates a nearly two-dimensional flow field with nearly uniform shear stress distribution. Such conditions enable the flume to replicate an infinite river, making it a globally unique piece of equipment for the study of flocculation and cohesive sediment transport processes [22,29,40].

2.2. Flume Experiments and Sampling Procedure

Deposited fine matric sediment and framework gravel were collected from the Crowsnest River (Figure 1) and shipped to the flume location. Fine sediment (sieved to <63 μm) was collected from an area of reverse circulation using the method of Lambert and Walling [41]. Gravel bed framework (sieve-washed > 2 mm) was collected in equal proportions from four sites of the river (Figure 1). The gravel (in the field: D10 = 15 mm, D50 = 47 mm, D90 = 140 mm; and truncated at 40 mm in the flume: D10 = 10 mm, D50 = 24 mm, D90 = 35 mm) was used in the ingress experiments to form a coarse bed with depth of 3.2 ± 0.6 cm and average porosity of 36.2 ± 3.8%.
A total of eight experiments were conducted in the flume (Table 1). The deposition experiments were conducted with no addition of bed gravel (impermeable flume bed). For the first deposition experiment (D1), the flume was filled with water up to a depth of 12 cm, and a fine sediment slurry was added to generate a total suspended solids (TSS) concentration of ~300 mg/L. More slurry was added to the flume for the remaining deposition and erosion experiments to generate a TSS concentration of ~500 mg/L. For all deposition experiments, the flume was operated at maximum speed during the initial 20 min to keep particles in suspension. After 20 min, the rotation speed was decreased in each run to promote varying applied shear stresses (Table 1). For erosion experiment E7, sediment in the flume was fully resuspended and then allowed to settle for 24 h. After the 24 h consolidation period, shear stress was applied as a stepwise function to promote particle resuspension.
Table 1. Summary of the experimental procedure.
IDExperimentInitial TSS (mg/L)Applied Shear StressBed TypePSD Sampling Time (min)
0 to 20 min20 to 300 min
D1Deposition273.090.46 Pa0.12 PaFlume20, 60, 100, 200, 300
D2Deposition480.410.46 Pa0.00 PaFlume
D3Deposition483.760.46 Pa0.06 PaFlume20, 300
D4Deposition476.740.46 Pa0.12 PaFlume20, 60, 100, 200, 300
D5Deposition464.870.46 Pa0.21 PaFlume
D6Deposition473.820.46 Pa0.32 PaFlume
I8Ingress171.300.46 Pa0.32 PaGravel10, 20, 40, 70, 100, 130, 160, 190, 220, 250, 280, 300
E7Erosion3.470 to 580 minDeposited sediment over the flat flume bed0, 10, 50, 70, 110, 130, 170, 190, 230, 250, 290, 320, 390, 410, 480, 500, 570
Stepwise increase—see Figure 2
Figure 2. Measured and normalized TSS (TSSn/TSS0 for deposition and ingress, and TSSn/TSS0Dep for erosion experiments) for all flume tests. * corresponds to the measurements taken in experiment D1, when initial concentration was ~300 mg/L.
Water 16 00546 g002
For the ingress experiment (I8), gravel was added into the flume and manually “packed” to create a plane-porous gravel bed [29,30]. The flume was then filled with water to a depth of 16 cm, and sediment–water slurry was added to the flume through the same procedure as in the deposition experiments. In the ingress experiment, similarly to the deposition experiments, the flume was operated at the highest speed for 20 min. Then, the rotation speed was decreased to generate a shear stress of 0.32 Pa (Table 1).
Samples for TSS and EPSD were collected through a tube and valve installed in the wall of the flume. The inflow end of the tube faced the flow, and it sampled at a height of 6 cm from the bottom of the flume channel. Before sample collection, the valve was opened to flush still water from within the tube, and the flushed water was re-inserted into the flume to maintain constant water levels. TSS was measured following the Standard Methods Procedure [42]. EPSDs were measured immediately after sampling with an LISST-200x (Sequoia Scientific, Bellevue, WA, USA). In all experiments, TSS was measured every 5 min for the initial 60 min and every 10 min until the end of the experiment. The timing of EPSD measurements is shown in Table 1. The EPSDs, measured as volume concentrations (VCs) of particles in 36 size classes, were also assessed in terms of relative EPSDs, by normalizing each size class in relation to the total VC.

2.3. Particle Size and Statistical Analysis

TSS measurements were normalized relative to the initial TSS for each flume run to assess particle cohesiveness. For the deposition and ingress assessments, normalized sediment concentrations were calculated as TSSn/TSS0, where TSSn corresponds to the TSS measurement taken at time n, and TSS0 is the measurement taken at time 0. For the erosion run, normalized concentrations were calculated as TSSn/TSS0Dep, where TSS0Dep corresponded to the average of initial concentrations in experiments D2 to D6 (~500 mg/L).
Rather than assessing flocculation through comparisons between absolute (dispersed) and effective median particle sizes [39,43], flocculation was evaluated through the assessment of bimodality observed in EPSDs in all experiments. Bimodal EPSDs have been characteristically observed in suspended cohesive sediments due to the mixing of multiple particle and floc size fractions caused by shear-dependent flocculation [17,44,45,46]. The bimodal evaluation was conducted by calculating the ratio (flocculation ratio) between the volume concentration of smaller (mostly constituted of primary particles and flocculi that are the building blocks of coarser flocs) and larger flocs. In all EPSDs, a minimal point between modal peaks seemed to occur at particle sizes around 9 μm, a size that was defined as a threshold for the calculation of the flocculation ratio:
F l o c c u l a t i o n   r a t i o = V C < 9 μ m V C > 9 μ m
where VC<9µm represents the cumulative volume of flocs below 9 µm and VC>9µm represents the cumulative volume of flocs greater than 9 µm. Flocculation ratios were also calculated for EPSDs measured in situ in two field campaigns in the Crowsnest River. EPSDs were measured in situ at four sites on the Crowsnest River (Figure 1) with an LISST 200-x every ~4 days during the summer months of 2019 and 2021. At the same intervals, discharge values were measured at the same sites and were used in the flow model MOBED [14] to calculate bed shear stress values.
Flocculation ratios were linearly regressed against shear stress for all flume and field measurements. All statistical analyses and graphing were performed in R Statistical Software version 4.3.2 [47] through the RStudio Integrated Development Environment [48]. Pairwise comparisons were performed using the Mann–Whitney U test (MWU) and Benjamini–Hochberg (BH) false discovery rate correction for multiple comparisons with the “rstatix” package [49]. All graphs were plotted using “ggplot2” [50], and linear regressions were plotted using “ggpubr” [51].

3. Results and Discussion

Commonly used catchment sediment budget models often disregard flocculation mechanisms in their parameterization due to the complex transport nature of cohesive particles. Cohesive sediments, however, manifest altered density and settling properties, ultimately affecting particle transport and fate [13,14,15]. Here, such cohesive characteristics have been observed through flume experiments.

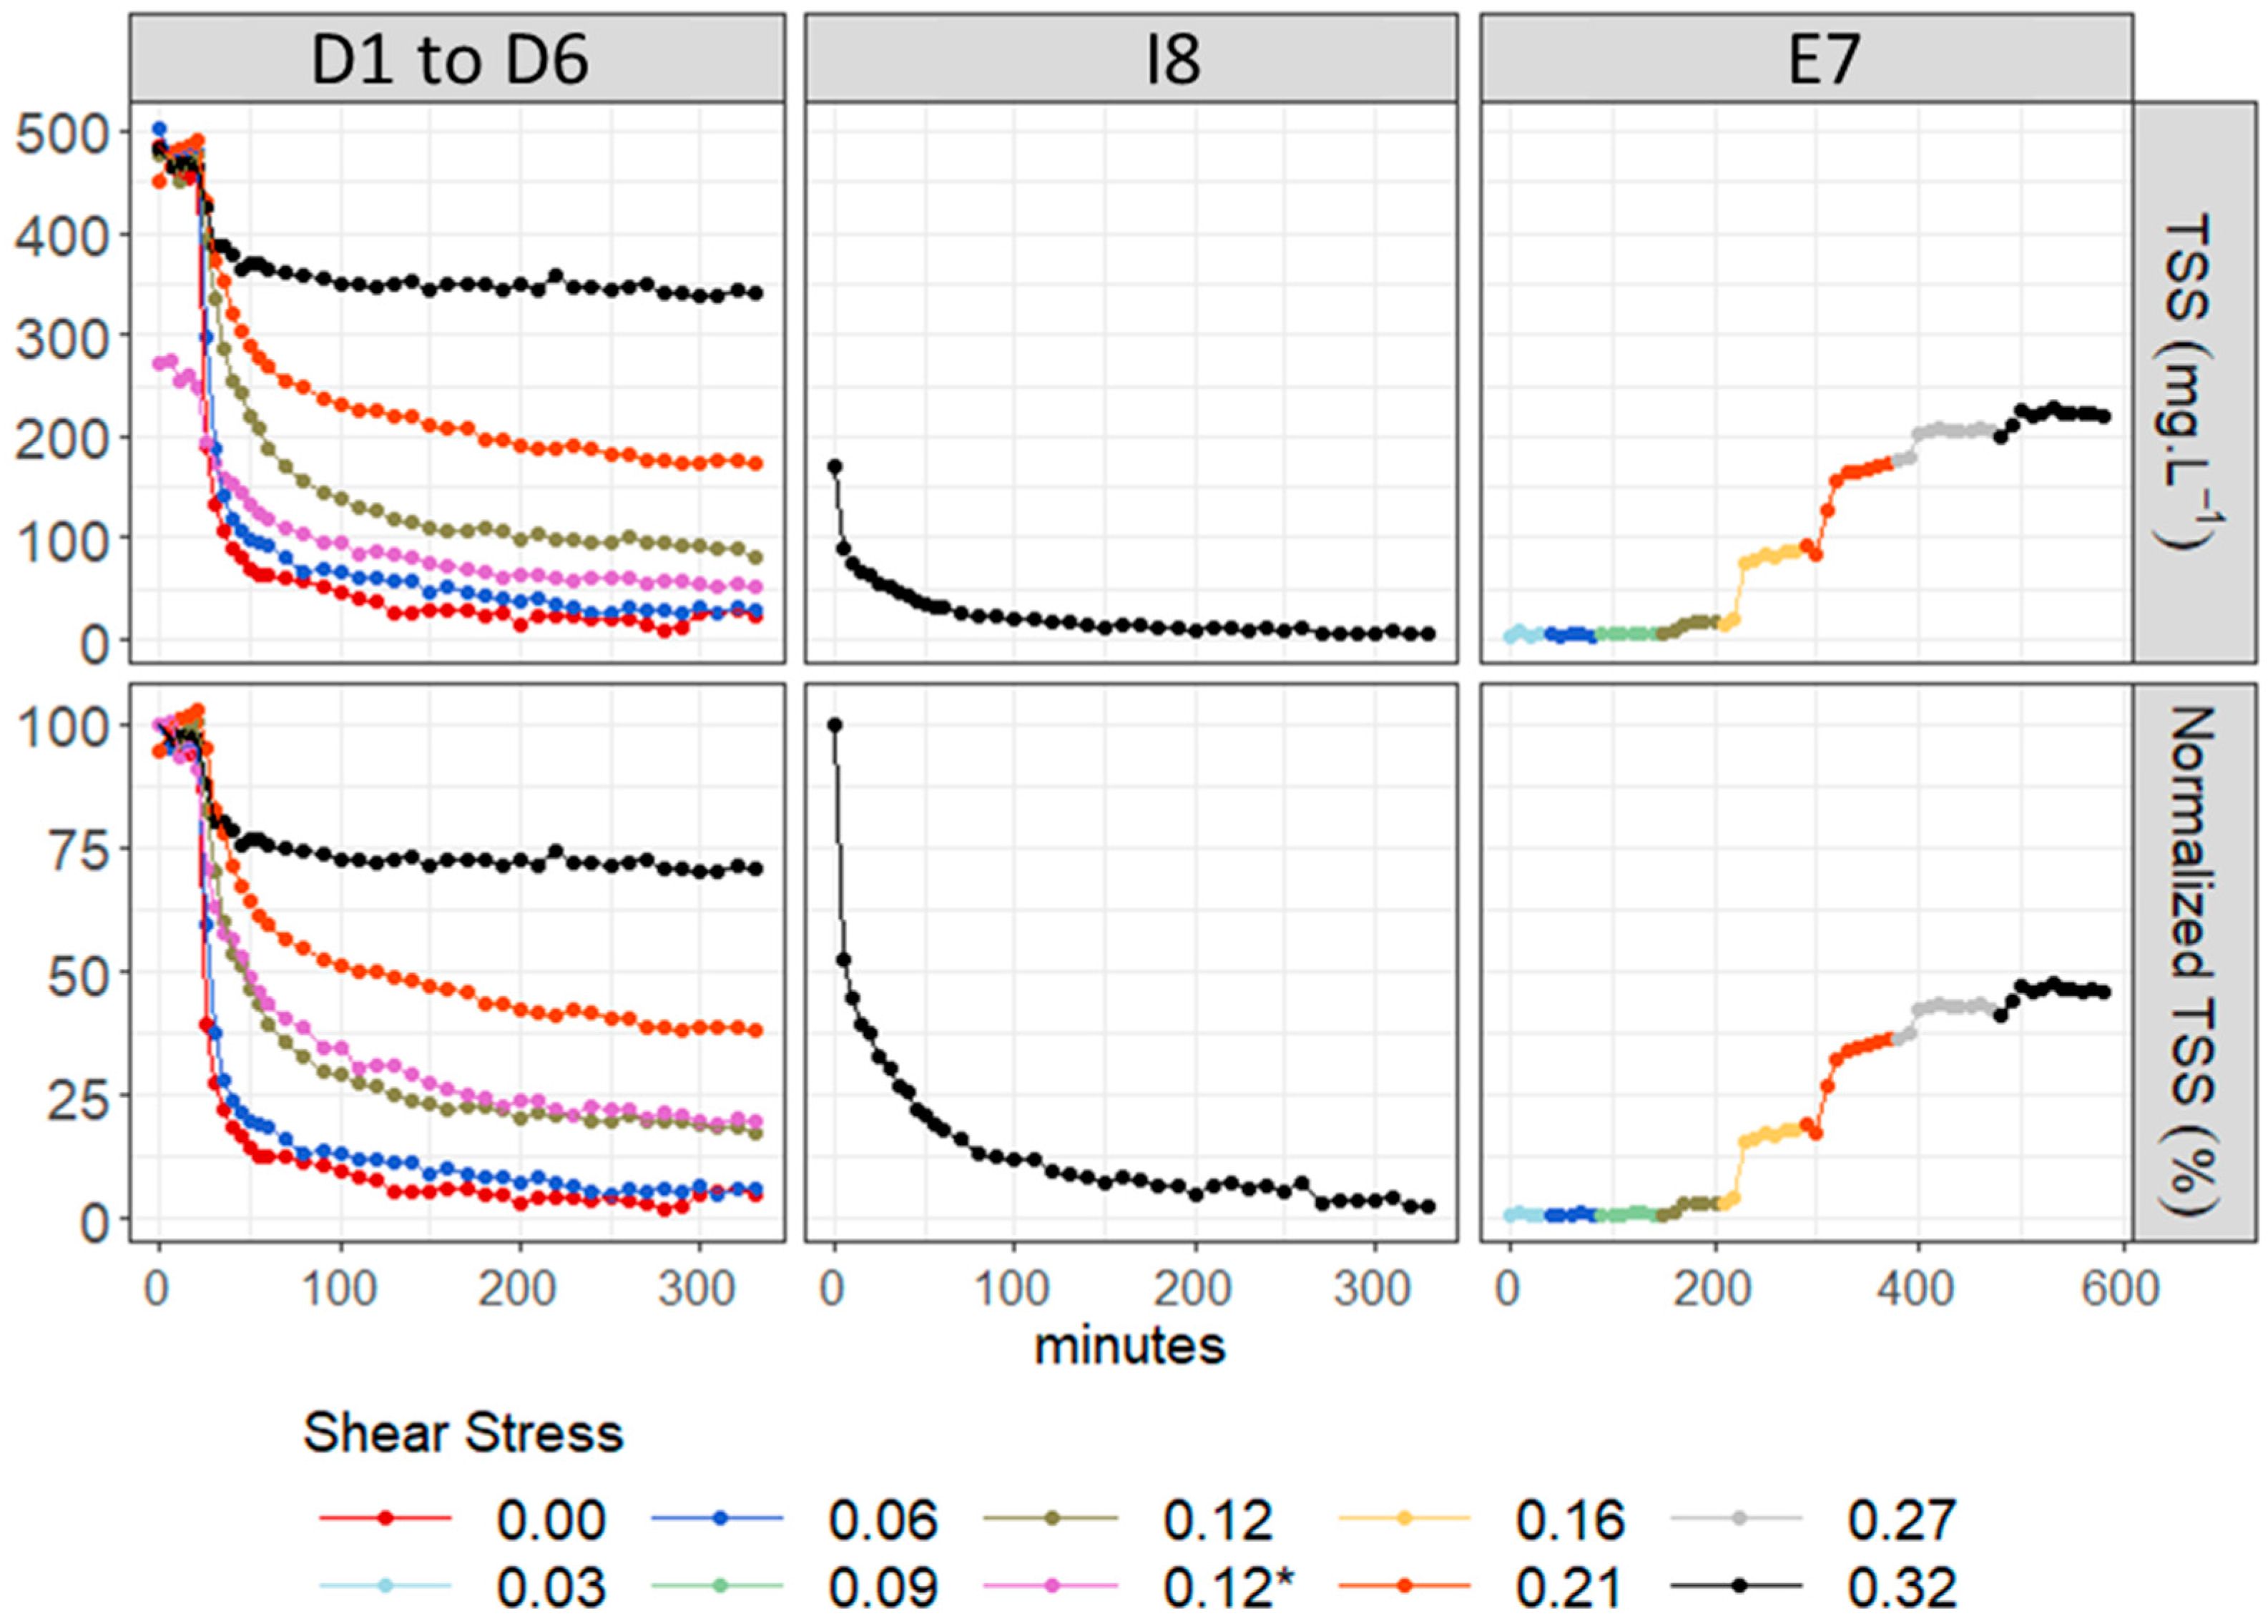
3.1. Influence of Suspended Sediment Concentration on Fine Sediment Deposition

In contrast to non-cohesive fine sediments, initial suspended sediment concentrations are an important factor controlling the deposition of cohesive particles [14,52]. Here, suspended sediment concentrations reached the steady state in all deposition and ingress experiments (Figure 2). The smallest TSS values in the steady state were observed for the deposition experiments at 0.00 Pa (D2) and 0.06 Pa (D3), and in the ingress experiment at 0.32 Pa (I8, Figure 2). The effects of initial suspended sediment concentration on deposition were confirmed between experiments D1 and D4, where for the same applied shear stress, a higher TSS0 in D4 resulted in a higher steady state concentration for this experiment (D1 and D4, Figure 2). According to Partheniades and Kennedy [52] and Krishnappan [14], this occurs because when larger (loosely bound) settling flocs reach the near-bed, higher shear stress region, only flocs that are sufficiently strong to withstand that shear will deposit, while flocs that are less strong will break up and return to suspension as smaller flocs. This critical floc size and strength to undergo deposition are intrinsic to the nature of the studied sediment and the applied shear stress. As such, for cohesive particles, a higher TSS0 will not change the critical particle size for deposition, but it will increase the relative fractions of solids in each size class remaining in suspension at the steady state. Accordingly, when TSS curves are normalized as a function of TSS0, the deposition process becomes dependent only on the applied shear stress, thus causing normalized curves to overlap (D1 and D4, Figure 3B) and confirming the cohesive properties of the fine sediment investigated experimentally. The relationships described have also been observed by others [30,53], and demonstrate that, while the steady state concentration depends on TSS0, the normalized TSS concentrations are only a function of shear stress. In turn, as stated by Krishnappan [14], the analysis of cohesive sediment transport might benefit from the utilization of normalized concentrations since they become only dependent on applied shear stress.

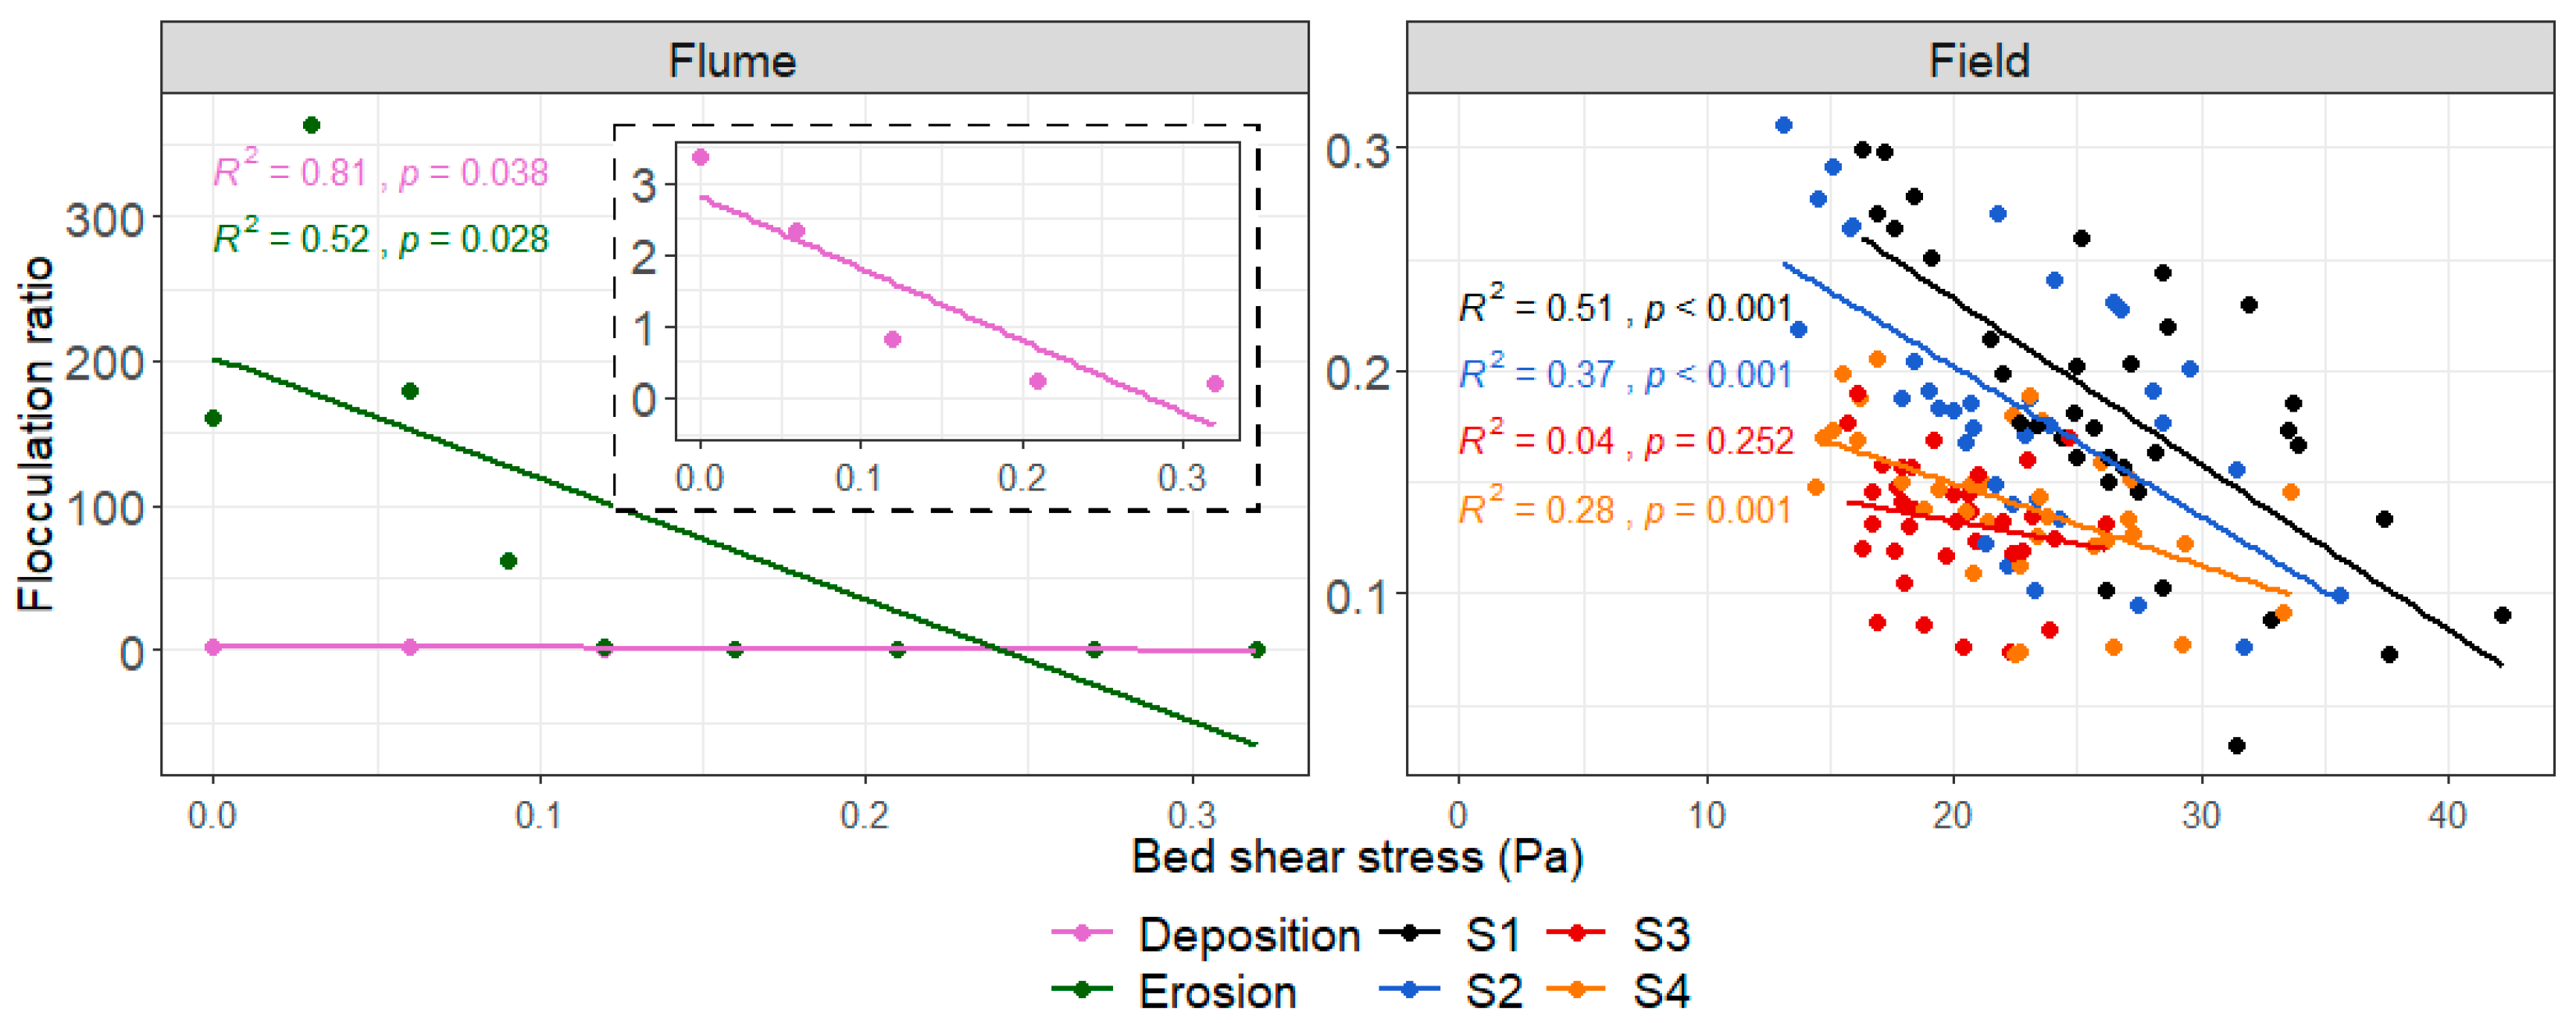
3.2. Shear-Dependent Flocculation

Flocculation was consistently observed and further confirmed through photomicrographs taken during each experiment (Figure 4). Increasing the applied shear stress in deposition and erosion experiments (except for experiment I8—discussed below) consistently increased D50 and D90 values (Figure 5). The positive relationship between shear stress and particle size, within the ranges of applied shear stress of this study, has also been observed elsewhere in similar flume experiments studying cohesive sediments from different sources [14,40]. As widely observed in flocculation studies, increasing particle size with shear stress is a response of increased particle interaction followed by flocculation [16,54]. Beyond a certain threshold of flow energy that is inherent to the sediment characteristics (i.e., its primary particles, organic and inorganic solids, and strength of binding mechanisms), increasing flow energy causes excessive particle collision and/or turbulent effects, leading to floc breakage [15,16,35,40]. However, varying the shear stress affects flocculation responses differently according to floc size fractions, given the different aggregation strengths associated with each floc size class [17,45,46,55]. Accordingly, larger flocs (micro- and macro-flocs, with no commonly agreed size threshold, but reportedly >20 μm, and >100 μm, respectively) have important bonding mechanisms due to biological agents (e.g., protruding filamentous bacteria, and extracellular polymeric substances), which can result in a weaker floc strength relative to more strongly bound flocculi (floc sizes < 20 μm, approximately), which are predominantly bonded by cohesion (electrostatic and van der Waals forces) [45,56,57].
It has been widely observed that increased turbulent effects limit flocculation and decrease median particle sizes, as discussed above. Here, the linear regressions performed with EPSDs measured in the flume experiments and in situ in previous years (2019 and 2021) showed a negative relationship between flocculation ratios and shear stress (Figure 6). All linear regressions were statistically significant (p < 0.05) except for site 3, but variance in the erosion and field models was only moderately explained, as indicated by the R2 values (Figure 6). The decrease in flocculation ratios is caused by a relative reduction in the VC of primary particles and flocs < 9 μm compared to larger flocs (9–500 μm) with increasing shear. Since suspended particles (<500 μm) were observed to be predominantly transported in flocculated form in the flume and in the field [17], the observed relationships between shear and ratios indicate that increasing the flow energy consistently aggregated smaller particles (primary particles and flocculi) into larger flocs in the process of shear-dependent flocculation. However, we stress that this does not indicate an indiscriminate growth in floc size with flow energy, since coarse and more loosely attached flocs undergo breakage under high shear [17,46]. Rather, the observed low flocculation ratios demonstrate that the breakage of flocs under high shear resulted in disaggregated flocs > 9 μm, thus indicating the strength of aggregation once primary particles become flocculated. Further, since flocs formed under higher shear stresses can be more resilient to breakage [58], our observations indicate that flocs in the Crowsnest River are transported in suspension in fairly stable form.

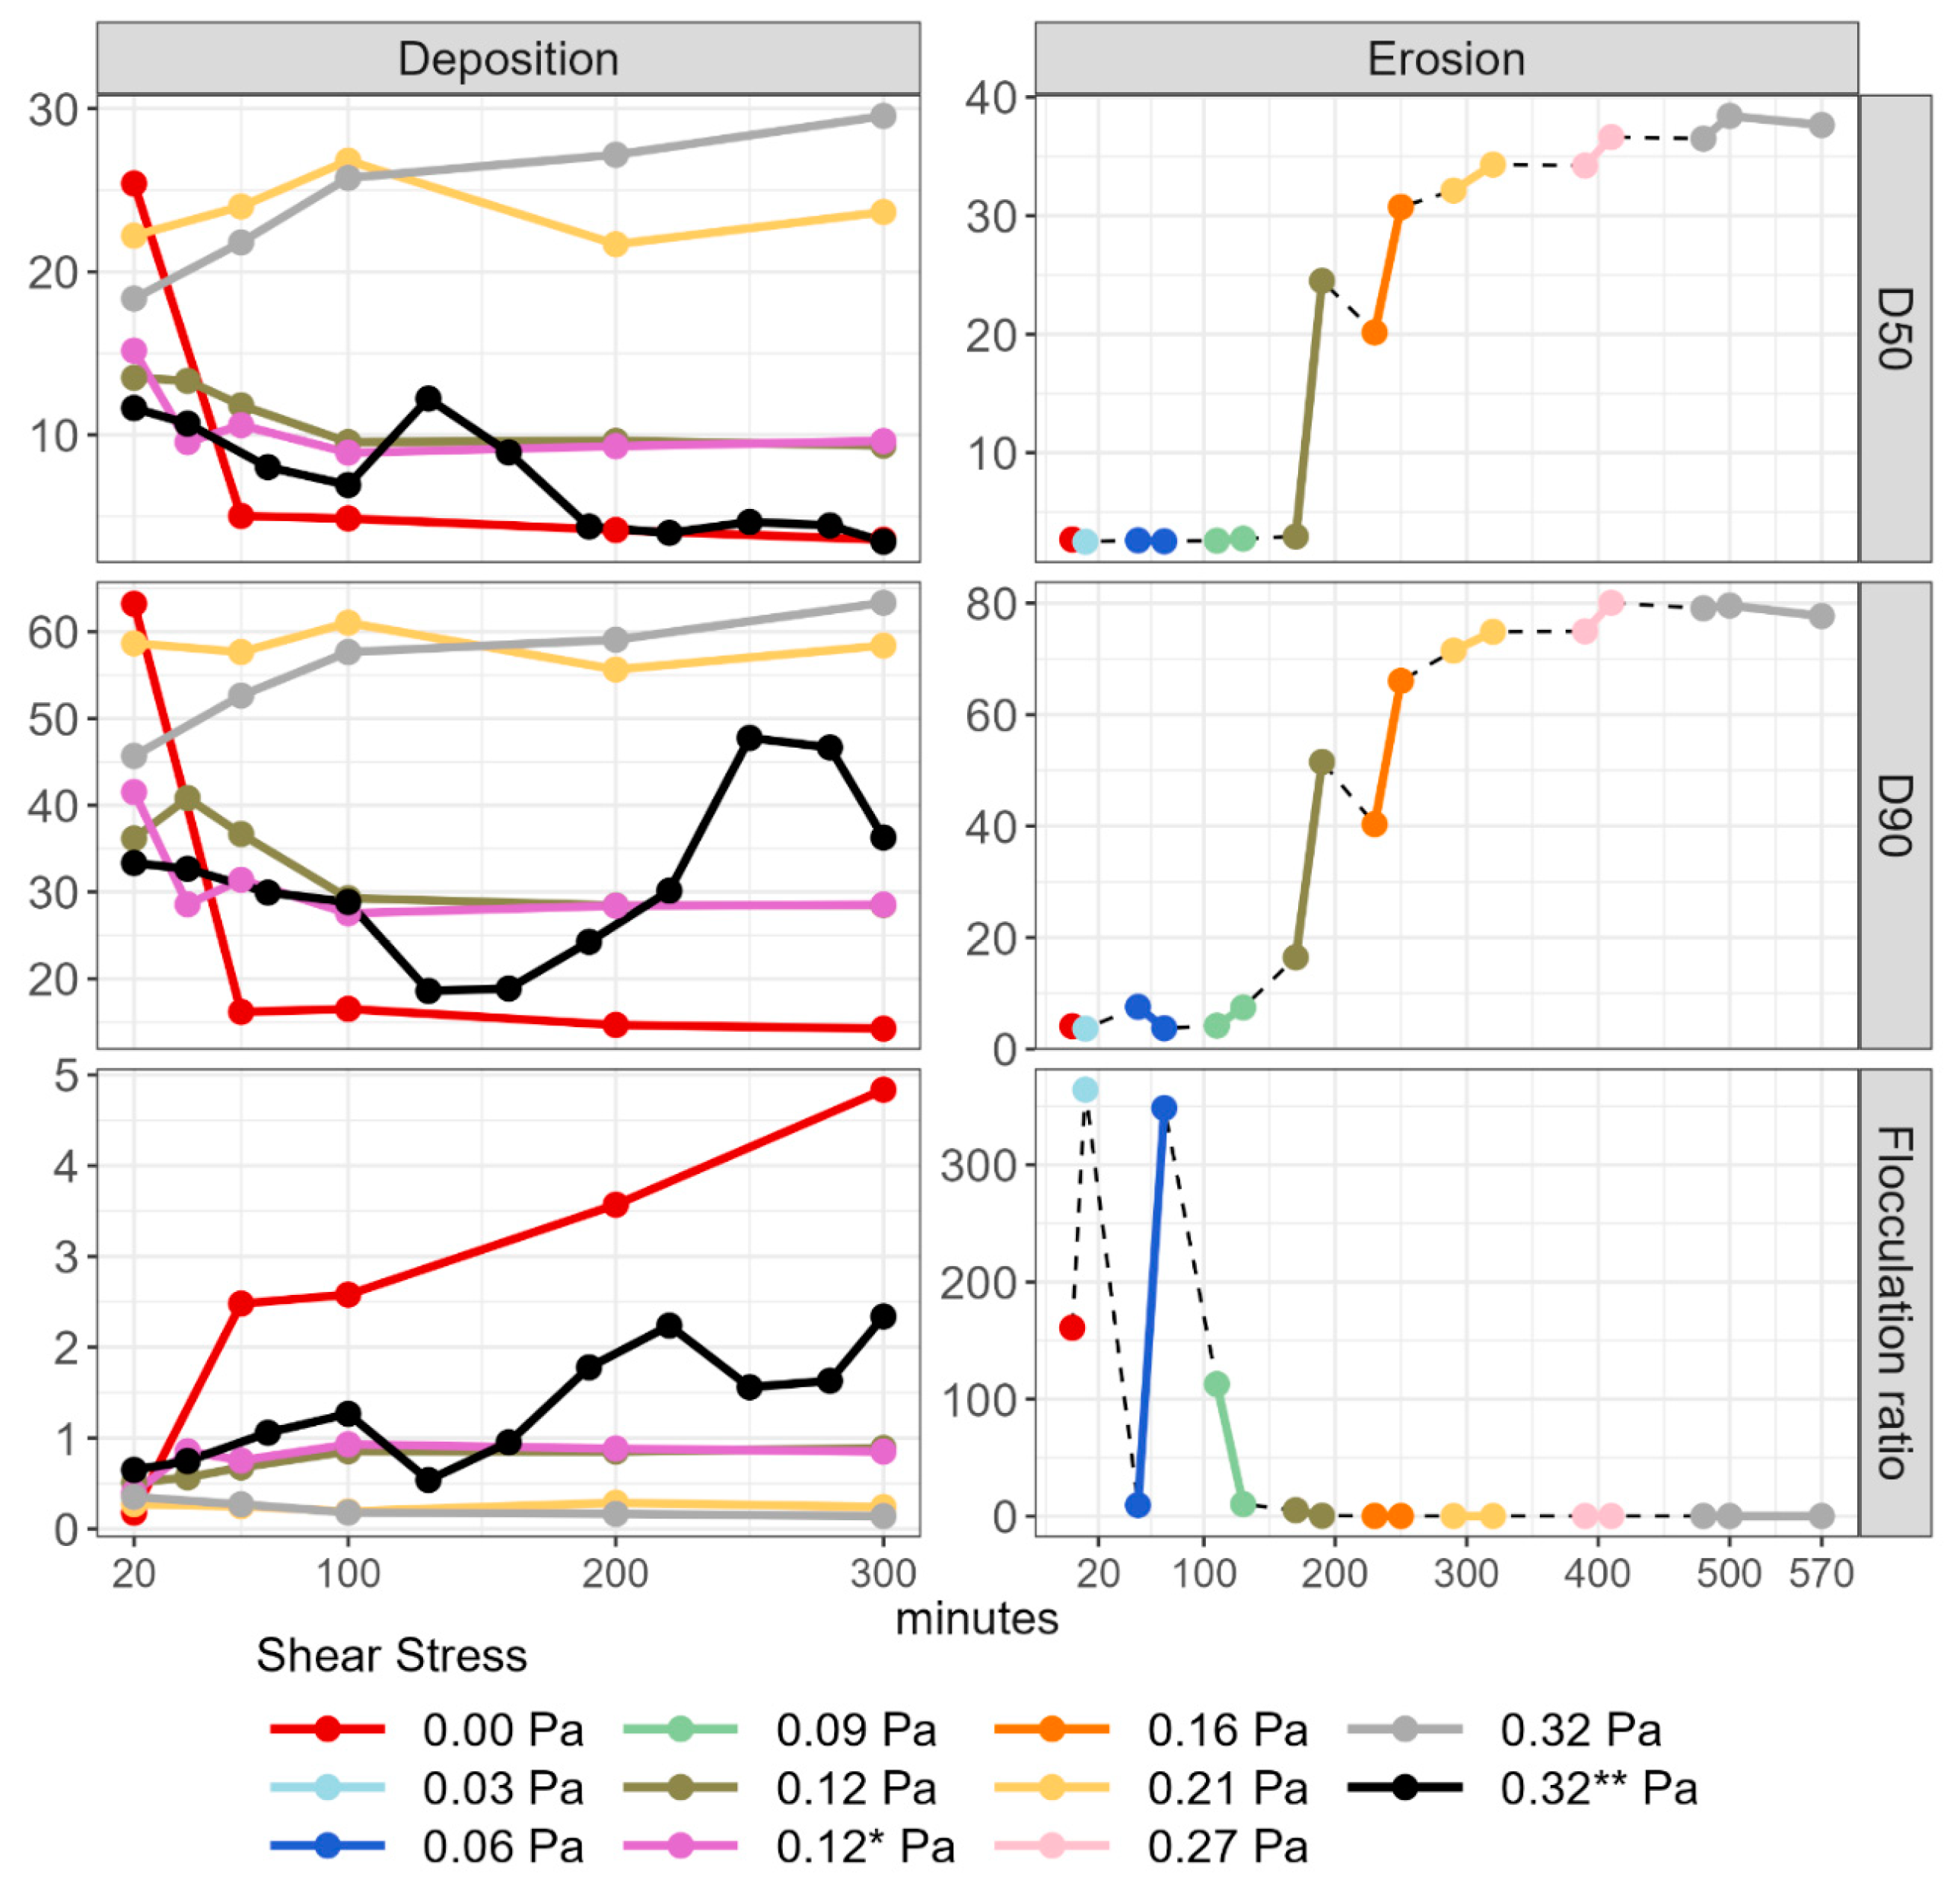
3.3. EPSDs in Deposition Experiments

Most deposition and ingress of suspended fine sediment occurred during experiments D2, D3, and I8 (Figure 2), and particles remaining in suspension in these experiments were predominantly ~3 μm (Figure 3A). The EPSD observations in I8 indicate that the ingress of cohesive particles was size-selective, which is in accordance with the observations of others [59]. However, in contrast to experiments D2 and D3, in which coarser flocs had deposited after 60 min from the beginning of the experiment (Figure 3A), some coarser flocs remained in suspension in experiment I8 (D90 ~45 μm, Figure 5), and D90s in I8 were statistically comparable to deposition experiments D4 and D1 (Figure 7).
After 60 min of the experiment in all deposition runs (D1 to D6), we observed that particle size distributions approached a quasi-equilibrium state, as no systematic variation between the EPSDs under these experimental conditions was observed (Figure 3A), and flocculation ratios were nearly constant in experiments D1, D4, D5, and D6 (Figure 5). This particle size steady state has been previously observed in flocculation assessments of pure mineral clay mixtures and synthetic polymers [60,61,62] and for riverine cohesive sediments [14,40], demonstrating an intrinsic nature of cohesive particles under steady shear stress applications. For run D2, however, which had no applied shear stress (0.00 Pa), flocculation ratios increased with time (Figure 5), demonstrating the continuous settling of coarser flocs relative to the smaller particles (~3 μm) retained in suspension (Figure 3A).
The steady state of particle sizes observed in the deposition experiments has important implications from the perspectives of engineered environments and water and wastewater treatment facilities [63]. However, the experiments over the gravel bed did not lead to a particle size steady state. Contrary to the deposition experiments, and despite the same applied shear stress between experiments D6 and I8, several modal changes in EPSDs were observed during experiment I8 (Figure 3A), which was further reflected in significant differences between median particle sizes (Figure 7). In experiment I8, measurements taken at 130 and 160 min during the experiment showed a strong and well-defined bimodality, with first and second peaks at ~3 and ~20 μm, respectively (Figure 3A). Measurements >160 min in I8 showed a decrease in the second modal peak (~20 μm) of relative EPSDs in relation to measurements <160 min (Figure 3A), but a flocculation steady state, such as the ones observed in the deposition experiments, was not observed, as D90s and flocculation ratios varied with time (Figure 5). Such peculiar behavior in EPSDs in the ingress experiment was further demonstrated by flocculation ratios, which presented varying values during experiment I8 (Figure 5).
To the authors’ knowledge, the observed EPSDs from experiment I8 have not been reported elsewhere. In a similar flume experiment, Mooneyham and Strom [30] have reported one example of a measured EPSD from an ingress experiment, but they did not observe varying EPSDs like the ones reported herein. The non-steady particle size observations from I8 could be attributed to particle collision and flocculation processes of particles that were exfiltrating from the gravel framework, resuspending from the fine sediment deposited on top of the gravel bed, or due to particles remaining in suspension. However, in the deposition experiment (D6) with the same applied shear stress of 0.32 Pa as in I8, only 25% of the available suspended sediment had deposited onto the bed, suggesting that even less surficial deposition would have occurred in I8 due to the likely increased near-bed shear stress caused by the gravel presence. Further, TSS measurements from experiment I8 showed that the gravel channel was very effective in ingressing suspended particles and that no significant exfiltration or resuspension occurred in this flume run (Figure 2), which is in accordance with other studies assessing cohesive sediment ingress over gravel-bed channels [29,30]. Further, it has been observed that interstitial fine sediment exfiltration, without framework mobilization, is likely limited to the upper layers of the bed [64,65,66]. Therefore, we believe that if any exfiltration or resuspension had occurred in I8, it would have quickly been re-ingressed into interstitial storage, and, as the experiment progressed, interstitial fine sediment would have continued to ingress deeper in the bed, becoming increasingly less available for exfiltration [67]. Hence, it is likely that the observed transient particle size characteristics at 130 and 160 min were caused by the interaction of particles that were remaining in suspension, which consisted of ~12% and ~5% of the initially available suspended sediment (Figure 2), respectively, for those measurement times. Further, we believe that the coarser D90s observed in I8 >160 min were also caused by the interaction of the particles remaining in suspension, which represented less than ~5% of the initially suspended sediment (Figure 2), but were likely interacting due to the turbulent shear. Our observations of EPSDs in I8, although limited to the single experiment conducted for the gravel bed, reflect the complexities that are added to flocculation mechanisms by the coarse channel, and demonstrate the need for future investigation of such processes.

3.4. EPSDs in Erosion Experiments

In the erosion experiment, similar to experiments D2, D3, and I8, particles in the ~3 μm size range were predominantly in suspension at the beginning of the experiment (E7, Figure 3B). In E7, applied shear stresses of 0.03, 0.06, and 0.09 Pa led to no surficial resuspension (Figure 2), and no flocculation was observed (Figure 3B). For applied shear stress ≥0.12 Pa, however, resuspension of the bed particles started to occur (Figure 2), also influencing suspended sediment EPSDs (Figure 3B). Through the stepwise increases in shear stress, at 0.12 and 0.16 Pa, we observed that EPSD measurements taken following the incremental increase in flow energy (measurements a, Figure 3B) were generally finer than measurements taken once shear stress had stabilized (measurements b, Figure 3B), demonstrating that resuspended particles were undergoing flocculation when in suspension. Such differences between initial and final (a and b) measurements decreased when shear stresses were ≥0.21 Pa (Figure 3B), demonstrating that EPSDs were reaching an equilibrium in flocculation processes despite the increasing TSS due to bed erosion (Figure 2).
Changes in TSS concentrations from the erosion experiment (E7) showed that even under the highest applied shear stress of 0.32 Pa, only ~50% of the deposited sediment was resuspended, thus demonstrating the importance of consolidation on the fate of cohesive sediment (Figure 2). Our observations in E7 lead us to believe that, while flocculation was an important process for suspended floc size growth, especially at 0.12 and 0.16 Pa, the resuspension of coarser bed particles likely influenced the measured EPSDs at the end measurement of each shear stress increment (measurements b, Figure 3B). When comparing D50s and D90s of the erosion and deposition tests under the same applied shear stress (i.e., E7 at 0.12 Pa, 0.21 Pa, and 0.32 Pa with D4, D5, and D6, respectively), we observed that particles were consistently coarser in the erosion experiment. As such, it is believed that bed material that had undergone stabilization and consolidation [33,37] resuspended as coarser flocs. In cohesive sediment deposits, consolidation (self-weighted consolidation) and biostabilization (due to microbial extracellular polymeric substances) have been observed to increase bed aggregation and stability [33,34]. Consequently, floc size has been observed to be positively correlated with bed consolidation periods and biostabilization processes [36].
Here, coarser resuspended flocs were able to maintain their enlarged size, even during the highest applied shear stress (Figure 3B), which is contrary to the observations of Tran and Strom [35] and Garcia-Aragon et al. [36], who observed that particles would increase in size when deposited, but quickly breakdown to their “equilibrium” size according to the applied shear stress in the suspension. These observations have implications on the size selectivity of ingress processes observed here and by others [59] and are of particular concern for the legacy effects of landscape disturbances. Our observations demonstrate that flocs deposited in areas of lower flow energy can grow in size due to consolidation effects, and once they are resuspended during higher energy flows, they can maintain coarser sizes while in suspension, which, in turn, might facilitate their re-ingress in the gravel-bed channel. In scenarios of upstream landscape disturbances, these observations suggest a tendency for the postponement of sediment flushing, driving legacy impacts [68].

4. Conclusions

Flocculation processes depend on the sediment and water’s physical, chemical, and biological properties and the flow conditions serving as media for suspended particles. Due to its complexity, riverine flocculation is largely disregarded in sediment budget models despite its importance in the transport and fate of fine sediment and sediment-associated nutrients and contaminants. In gravel-bed rivers, generated turbulent flows increase the complexity of flocculation and cohesive sediment transport, and very little research has been reported on such interactions. Here, we were able to identify the importance of ingress on the entrapment of cohesive sediment, and the effects that roughness-induced turbulence can impose on flocculation processes, although more assessments are required to confirm and mechanistically explain our observations regarding EPSDs in ingress experiments. Our measurements from flume and field assessments demonstrated the role of flow energy on flocculation in the Crowsnest River. Further, we observed that bed consolidation not only increased the EPSDs of resuspended particles, but that larger flocs were able to withstand the flow field without undergoing breakage. These observations demonstrate that the studied sediment is predominantly transported in flocculated form, and that, once ingressed, these particles are likely entrapped until bed mobilization. Although colmation is not a great concern in the studied gravel-bed river, given the high-energy and non-saturated channel, the observations from this study can have important consequences for the potential legacy effects that can arise from upstream landscape disturbances. Given the complexity of flocculation processes over gravel-bed channels, we strongly believe that more testing under different scenarios (different framework compositions, applied shear stresses, fine sediment sources, and sediment supply rates) is required in order to better understand such processes. Although fine sediment exfiltration was not detected in the ingress experiment, we recommend that future research explore the potential of exfiltration processes and their influence on suspended sediment EPSDs through ingress experiments using higher fine sediment feed and feed rates.

Author Contributions

Conceptualization, R.M. and M.S.; methodology, R.M., M.S. and B.G.K.; formal analysis, R.M.; investigation, R.M.; data curation, R.M.; writing—original draft preparation, R.M.; writing—review and editing, R.M., M.S., A.L.C. and B.G.K.; resources, M.S. and B.G.K.; funding acquisition, M.S. and A.L.C.; supervision, M.S., A.L.C. and B.G.K. All authors have read and agreed to the published version of the manuscript.

Funding

This work was supported by NSERC Discovery Grant [481 RGPIN-2020-06963]; the forWater NSERC Network for Forested Drinking Water Source Protection Technologies [NETGP-494312-16]; and the UKRI-BBSRC (UK Research and Innovation-Biotechnology and Biological Sciences Research Council) [BB/X010961/1 (Resilient Farming Futures—specifically work package 2—BBS/E/RH/230004B)].

Data Availability Statement

The data presented in this study are available on request from the corresponding author. The data are not publicly available due to the corresponding author continuing the use of the data for completion of her doctoral studies.

Acknowledgments

The authors gratefully acknowledge Robert Stephens for his valuable assistance with the flume experiments, and Robert Fines for his logistical assistance in preparing the experiments.

Conflicts of Interest

The authors declare no conflicts of interest.

References

  1. Chapman, P.M.; Wang, F.; Caeiro, S.S. Assessing and Managing Sediment Contamination in Transitional Waters. Environ. Int. 2013, 55, 71–91. [Google Scholar] [CrossRef] [PubMed]
  2. Horowitz, A.J.; Elrick, K.A. The Relation of Stream Sediment Surface Area, Grain Size and Composition to Trace Element Chemistry. Appl. Geochem. 1987, 2, 437–451. [Google Scholar] [CrossRef]
  3. Bilotta, G.S.; Brazier, R.E. Understanding the Influence of Suspended Solids on Water Quality and Aquatic Biota. Water Res. 2008, 42, 2849–2861. [Google Scholar] [CrossRef] [PubMed]
  4. Chapman, J.M.; Proulx, C.L.; Veilleux, M.A.N.; Levert, C.; Bliss, S.; André, M.È.; Lapointe, N.W.R.; Cooke, S.J. Clear as Mud: A Meta-Analysis on the Effects of Sedimentation on Freshwater Fish and the Effectiveness of Sediment-Control Measures. Water Res. 2014, 56, 190–202. [Google Scholar] [CrossRef]
  5. Wilkes, M.A.; Gittins, J.R.; Mathers, K.L.; Mason, R.; Casas-Mulet, R.; Vanzo, D.; Mckenzie, M.; Murray-Bligh, J.; England, J.; Gurnell, A.; et al. Physical and Biological Controls on Fine Sediment Transport and Storage in Rivers. WIREs Water 2019, 6, e1331. [Google Scholar] [CrossRef]
  6. Wood, P.J.; Armitage, P.D. Biological Effects of Fine Sediment in the Lotic Environment. Environ. Manag. 1997, 21, 203–217. [Google Scholar] [CrossRef]
  7. Droppo, I.G.; Leppard, G.G.; Flannigan, D.T.; Liss, S.N. The Freshwater Floc: A Functional Relationship of Water and Organic and Inorganic Floc Constituents Affecting Suspended Sediment Properties. Water Air Soil Pollut. 1997, 99, 43–53. [Google Scholar] [CrossRef]
  8. Droppo, I.G.; Ongley, E.D. The State of Suspended Sediment in the Freshwater Fluvial Environment: A Method of Analysis. Water Res. 1992, 26, 65–72. [Google Scholar] [CrossRef]
  9. Lick, W.; Lick, J.; Ziegler, C.K. Flocculation and Its Effect on the Vertical Transport of Fine-Grained Sediments. Hydrobiologia 1992, 235–236, 1–16. [Google Scholar] [CrossRef]
  10. Droppo, I.G. Rethinking What Constitutes Suspended Sediment. Hydrol. Process. 2001, 15, 1551–1564. [Google Scholar] [CrossRef]
  11. Williams, N.D.; Walling, D.E.; Leeks, G.J.L. An Analysis of the Factors Contributing to the Settling Potential of Fine Fluvial Sediment. Hydrol. Process. 2008, 22, 4153–4162. [Google Scholar] [CrossRef]
  12. Petticrew, E.L.; Biickert, S.L. Characterization of Sediment Transport and Storage in the Upstream Portion of the Fraser River (British Columbia, Canada). IAHS-AISH Publ. 1998, 249, 383–391. [Google Scholar]
  13. Lamb, M.P.; de Leeuw, J.; Fischer, W.W.; Moodie, A.J.; Venditti, J.G.; Nittrouer, J.A.; Haught, D.; Parker, G. Mud in Rivers Transported as Flocculated and Suspended Bed Material. Nat. Geosci. 2020, 13, 566–570. [Google Scholar] [CrossRef]
  14. Krishnappan, B.G. Review of a Semi-Empirical Modelling Approach for Cohesive Sediment Transport in River Systems. Water 2022, 14, 256. [Google Scholar] [CrossRef]
  15. Livsey, D.N.; Crosswell, J.R.; Turner, R.D.R.; Steven, A.D.L.; Grace, P.R. Flocculation of Riverine Sediment Draining to the Great Barrier Reef, Implications for Monitoring and Modeling of Sediment Dispersal Across Continental Shelves. J. Geophys. Res. Ocean. 2022, 127, e2021JC017988. [Google Scholar] [CrossRef]
  16. Winterwerp, J.C. A Simple Model for Turbulence Induced Flocculation of Cohesive Sediment. J. Hydraul. Res. 1998, 36, 309–326. [Google Scholar] [CrossRef]
  17. Maltauro, R.; Stone, M.; Collins, A.L.; Krishnappan, B.G.; Silins, U. The Effect of Shear-Dependent Flocculation on the Multimodality of Effective Particle Size Distributions in a Gravel-Bed River during High Flows. J. Soils Sediments 2023, 23, 3589–3601. [Google Scholar] [CrossRef]
  18. Emelko, M.B.; Silins, U.; Bladon, K.D.; Stone, M. Implications of Land Disturbance on Drinking Water Treatability in a Changing Climate: Demonstrating the Need for “Source Water Supply and Protection” Strategies. Water Res. 2011, 45, 461–472. [Google Scholar] [CrossRef]
  19. Hauer, F.R.; Locke, H.; Dreitz, V.J.; Hebblewhite, M.; Lowe, W.H.; Muhlfeld, C.C.; Nelson, C.R.; Proctor, M.F.; Rood, S.B. Gravel-Bed River Floodplains Are the Ecological Nexus of Glaciated Mountain Landscapes. Sci. Adv. 2016, 2, e1600026. [Google Scholar] [CrossRef]
  20. Westerling, A.L.; Hidalgo, H.G.; Cayan, D.R.; Swetnam, T.W. Warming and Earlier Spring Increase Western U.S. Forest Wildfire Activity. Science 2006, 313, 940–943. [Google Scholar] [CrossRef]
  21. Stone, M.; Krishnappan, B.G.; Silins, U.; Emelko, M.B.; Williams, C.H.S.; Collins, A.L.; Spencer, S.A. A New Framework for Modelling Fine Sediment Transport in Rivers Includes Flocculation to Inform Reservoir Management in Wildfire Impacted Watersheds. Water 2021, 13, 2319. [Google Scholar] [CrossRef]
  22. Droppo, I.G.; Krishnappan, B.G. Modeling of Hydrophobic Cohesive Sediment Transport in the Ells River Alberta, Canada. J. Soils Sediments 2016, 16, 2753–2765. [Google Scholar] [CrossRef]
  23. Lai, H.; Fang, H.; Huang, L.; He, G.; Reible, D. A Review on Sediment Bioflocculation: Dynamics, Influencing Factors and Modeling. Sci. Total Environ. 2018, 642, 1184–1200. [Google Scholar] [CrossRef]
  24. Lick, W. Entrainment, Deposition, and Transport of Fine-Grained Sediments in Lakes. Hydrobiologia 1982, 91–92, 31–40. [Google Scholar] [CrossRef]
  25. Ongley, E.D.; Bynoe, M.C. Physical and Geochemical Characteristics of Suspended Solids, Wilton Creek, Ontario. Hydrobiologia 1982, 91–92, 41–57. [Google Scholar] [CrossRef]
  26. Izquierdo–Ayala, K.; Garcia–Aragon, J.A.; Castillo–Uzcanga, M.M.; Salinas-Tapia, H. Freshwater Flocculation Dependence on Turbulence Properties in the Usumacinta River. J. Hydraul. Eng. 2021, 147, 05021009. [Google Scholar] [CrossRef]
  27. Sahin, C.; Ari Guner, H.A.; Ozturk, M.; Sheremet, A. Floc Size Variability under Strong Turbulence: Observations and Artificial Neural Network Modeling. Appl. Ocean Res. 2017, 68, 130–141. [Google Scholar] [CrossRef]
  28. Wharton, G.; Mohajeri, S.H.; Righetti, M. The Pernicious Problem of Streambed Colmation: A Multi-Disciplinary Reflection on the Mechanisms, Causes, Impacts, and Management Challenges. Wiley Interdiscip. Rev. Water 2017, 4, e1231. [Google Scholar] [CrossRef]
  29. Krishnappan, B.G.; Engel, P. Entrapment of Fines in Coarse Sediment Beds. In River Flow 2006; Taylor & Francis: Abingdon, UK, 2006; pp. 817–824. ISBN 0-415-40815-6. [Google Scholar]
  30. Mooneyham, C.; Strom, K. Deposition of Suspended Clay to Open and Sand-Filled Framework Gravel Beds in a Laboratory Flume. Water Resour. Res. 2018, 54, 323–344. [Google Scholar] [CrossRef]
  31. Legout, C.; Droppo, I.G.; Coutaz, J.; Bel, C.; Jodeau, M. Assessment of Erosion and Settling Properties of Fine Sediments Stored in Cobble Bed Rivers: The Arc and Isère Alpine Rivers before and after Reservoir Flushing. Earth Surf. Process. Landf. 2018, 43, 1295–1309. [Google Scholar] [CrossRef]
  32. Rathburn, S.; Wohl, E. Predicting Fine Sediment Dynamics along a Pool-Riffle Mountain Channel. Geomorphology 2003, 55, 111–124. [Google Scholar] [CrossRef]
  33. Lau, Y.L.; Droppo, I.G. Influence of Antecedent Conditions on Critical Shear Stress of Bed Sediments. Water Res. 2000, 34, 663–667. [Google Scholar] [CrossRef]
  34. Gerbersdorf, S.U.; Jancke, T.; Westrich, B.; Paterson, D.M. Microbial Stabilization of Riverine Sediments by Extracellular Polymeric Substances. Geobiology 2008, 6, 57–69. [Google Scholar] [CrossRef]
  35. Tran, D.; Strom, K. Floc Sizes and Resuspension Rates from Fresh Deposits: Influences of Suspended Sediment Concentration, Turbulence, and Deposition Time. Estuar. Coast. Shelf Sci. 2019, 229, 106397. [Google Scholar] [CrossRef]
  36. Garcia-Aragon, J.; Droppo, I.G.; Krishnappan, B.G.; Trapp, B.; Jaskot, C. Erosion Characteristics and Floc Strength of Athabasca River Cohesive Sediments: Towards Managing Sediment-Related Issues. J. Soils Sediments 2011, 11, 679–689. [Google Scholar] [CrossRef]
  37. Krishnappan, B.G. Erosion Behaviour of Fine Sediment Deposits. Can. J. Civ. Eng. 2004, 31, 759–766. [Google Scholar] [CrossRef]
  38. Upadhayay, H.R.; Granger, S.J.; Collins, A.L. Dynamics of Fluvial Hydro-Sedimentological, Nutrient, Particulate Organic Matter and Effective Particle Size Responses during the U.K. Extreme Wet Winter of 2019–2020. Sci. Total Environ. 2021, 774, 145722. [Google Scholar] [CrossRef]
  39. Williams, N.D.; Walling, D.E.; Leeks, G.J.L. High Temporal Resolution in Situ Measurement of the Effective Particle Size Characteristics of Fluvial Suspended Sediment. Water Res. 2007, 41, 1081–1093. [Google Scholar] [CrossRef]
  40. Stone, M.; Krishnappan, B.G. Floc Morphology and Size Distributions of Cohesive Sediment in Steady-State Flow. Water Res. 2003, 37, 2739–2747. [Google Scholar] [CrossRef] [PubMed]
  41. Lambert, C.P.; Walling, D.E. Measurement of Channel Storage of Suspended Sediment in a Gravel-Bed River. Catena 1988, 15, 65–80. [Google Scholar] [CrossRef]
  42. American Public Health Association (APHA). Standard Methods for the Examination of Water and Wastewater, 19th ed.; APHA: Washington, DC, USA, 1995; ISBN 0-87553-223-3. [Google Scholar]
  43. Phillips, J.M.; Walling, D.E. Intra-Storm and Seasonal Variations in the Effective Particle Size Characteristics and Effective Particle Density of Fluvial Suspended Sediment in the Exe Basin, Devon, U.K. In Flocculation in Natural and Engineered Environmental Systems; CRC: Boca Raton, FL, USA, 2005. [Google Scholar]
  44. Droppo, I.G.; Jeffries, D.; Jaskot, C.; Backus, S. The Prevalence of Freshwater Flocculation in Cold Regions: A Case Study from the Mackenzie River Delta, Northwest Territories, Canada. Arctic 1998, 51, 155–164. [Google Scholar] [CrossRef]
  45. Lee, B.J.; Fettweis, M.; Toorman, E.; Molz, F.J. Multimodality of a Particle Size Distribution of Cohesive Suspended Particulate Matters in a Coastal Zone. J. Geophys. Res. Ocean 2012, 117, 117. [Google Scholar] [CrossRef]
  46. Mikkelsen, O.A.; Hill, P.S.; Milligan, T.G. Single-Grain, Microfloc and Macrofloc Volume Variations Observed with a LISST-100 and a Digital Floc Camera. J. Sea Res. 2006, 55, 87–102. [Google Scholar] [CrossRef]
  47. R Core Team, R. A Language and Environment for Statistical Computing 2023; R Core Team: Vienna, Austria, 2023. Available online: https://www.R-project.org/ (accessed on 10 November 2023).
  48. RStudio Team RStudio. Integrated Development Environment for R 2023; RStudio, PBC: Boston, MA, USA, 2023. Available online: http://www.rstudio.com/ (accessed on 10 November 2023).
  49. Kassambara, A. Rstatix: Pipe-Friendly Framework for Basic Statistical Tests. Available online: https://rpkgs.datanovia.com/rstatix/ (accessed on 15 November 2023).
  50. Wickham, H. Ggplot2: Elegant Graphics for Data Analysis; Springer: New York, NY, USA, 2016; ISBN 978-3-319-24277-4. [Google Scholar]
  51. Kassambara, A. Ggpubr: “ggplot2” Based Publication Ready Plots. Available online: https://rpkgs.datanovia.com/ggpubr/ (accessed on 15 November 2023).
  52. Partheniades, E.; Kennedy, J.F. Depositional Behavior of Fine Sediment in a Turbulent Fluid Motion. In Proceedings of the Coastal Engineering 1966, London, UK, 1–5 September 1966; pp. 707–729. [Google Scholar]
  53. Mehta, A.J.; Partheniades, E. An Investigation of the Depositional Properties of Flocculated Fine Sediments. J. Hydraul. Res. 1975, 13, 361–381. [Google Scholar] [CrossRef]
  54. Casson, L.W.; Lawler, D.F. Flocculation in Turbulent Flow: Measurement and Modeling of Particle Size Distributions. J. AWWA 1990, 82, 54–68. [Google Scholar] [CrossRef]
  55. Eisma, D. Flocculation and De-Flocculation of Suspended Matter in Estuaries. Neth. J. Sea Res. 1986, 20, 183–199. [Google Scholar] [CrossRef]
  56. Spencer, K.L.; Wheatland, J.A.T.; Bushby, A.J.; Carr, S.J.; Droppo, I.G.; Manning, A.J. A Structure–Function Based Approach to Floc Hierarchy and Evidence for the Non-Fractal Nature of Natural Sediment Flocs. Sci. Rep. 2021, 11, 14012. [Google Scholar] [CrossRef]
  57. Ho, Q.N.; Fettweis, M.; Spencer, K.L.; Lee, B.J. Flocculation with Heterogeneous Composition in Water Environments: A Review. Water Res. 2022, 213, 118147. [Google Scholar] [CrossRef]
  58. Guo, C.; Manning, A.J.; Bass, S.; Guo, L.; He, Q. A Quantitative Lab Examination of Floc Fractal Property Considering Influences of Turbulence, Salinity and Sediment Concentration. J. Hydrol. 2021, 601, 126574. [Google Scholar] [CrossRef]
  59. Koiter, A.J.; Owens, P.N.; Petticrew, E.L.; Lobb, D.A. The Role of Gravel Channel Beds on the Particle Size and Organic Matter Selectivity of Transported Fine-Grained Sediment: Implications for Sediment Fingerprinting and Biogeochemical Flux Research. J. Soils Sediments 2015, 15, 2174–2188. [Google Scholar] [CrossRef]
  60. Spicer, P.T.; Pratsinis, S.E.; Raper, J.; Amal, R.; Bushell, G.; Meesters, G. Effect of Shear Schedule on Particle Size, Density, and Structure during Flocculation in Stirred Tanks. Powder Technol. 1998, 97, 26–34. [Google Scholar] [CrossRef]
  61. Strom, K.; Keyvani, A. Flocculation in a Decaying Shear Field and Its Implications for Mud Removal in Near-field River Mouth Discharges. J. Geophys. Res. Ocean 2016, 121, 2142–2162. [Google Scholar] [CrossRef]
  62. Spicer, P.T.; Pratsinis, S.E. Shear-Induced Flocculation: The Evolution of Floc Structure and the Shape of the Size Distribution at Steady State. Water Res. 1996, 30, 1049–1056. [Google Scholar] [CrossRef]
  63. Jarvis, P.; Jefferson, B.; Gregory, J.; Parsons, S.A. A Review of Floc Strength and Breakage. Water Res. 2005, 39, 3121–3137. [Google Scholar] [CrossRef]
  64. Detert, M.; Parker, G. Estimation of the Washout Depth of Fine Sediments from a Granular Bed. J. Hydraul. Eng. 2010, 136, 790–793. [Google Scholar] [CrossRef]
  65. Kuhnle, R.A.; Wren, D.G.; Langendoen, E.J. Erosion of Sand from a Gravel Bed. J. Hydraul. Eng. 2016, 142, 04015052. [Google Scholar] [CrossRef]
  66. Schälchli, U. The Clogging of Coarse Gravel River Beds by Fine Sediment. Hydrobiologia 1992, 235–236, 189–197. [Google Scholar] [CrossRef]
  67. Gibson, S.; Abraham, D.; Heath, R.; Schoellhamer, D. Vertical Gradational Variability of Fines Deposited in a Gravel Framework. Sedimentology 2009, 56, 661–676. [Google Scholar] [CrossRef]
  68. Wohl, E. Legacy Effects on Sediments in River Corridors. Earth-Sci. Rev. 2015, 147, 30–53. [Google Scholar] [CrossRef]
Figure 1. (A) Study sites, and (B) location of the fine sediment collection site.
Water 16 00546 g001
Figure 3. Particle size distributions by relative volumetric concentration (%) from (A) deposition and ingress, and (B) erosion experiments. In (A), D1 = 0.12 * Pa, D2 = 0.00 Pa, D3 = 0.06 Pa, D4 = 0.12 Pa, D5 = 0.21 Pa, D6 = 0.32 Pa, I8 = 0.32 ** Pa. In (B), letters a and b, respectively, represent measurements taken at 0 and 10 min at 0.03 Pa, 50 and 70 min at 0.06 Pa, 110 and 130 min at 0.09 Pa, 170 and 190 min at 0.12 Pa, 230 and 250 min at 0.16 Pa, 290 and 320 min at 0.21 Pa, 390 and 410 min at 0.27 Pa, 480 and 570 min at 0.32 Pa. * corresponds to the measurements taken, when initial concentration was ~300 mg/L, ** corresponds to the ingress experiment.
Water 16 00546 g003
Figure 4. Photomicrographs of flocs from the flume experiments. All samples collected at ~300 min from the beginning of the experiment. All images are on the same scale.
Water 16 00546 g004
Figure 5. D50, D90 (μm), and flocculation ratio (VC<9μm/VC>9μm) change over time. Deposition and ingress experiments have constant shear stress applied to flow. The erosion experiment has a stepwise increase in shear stress. * indicates experiment D1, and ** indicates experiment I8. Dashed line in the erosion experiment is shown to emphasize the observed trend between data points.
Water 16 00546 g005
Figure 6. Linear regression between flocculation ratios and bed shear stress from flume and field experiments. Flume values of flocculation ratio correspond to the mean of measurements taken for the same applied shear stress at each experiment (deposition or erosion).
Water 16 00546 g006
Figure 7. Mann–Whitney U test pairwise comparison for size (μm) measurements taken >20 min. Experiments correspond to D1 = 0.12 * Pa, D2 = 0.00 Pa, D4 = 0.12 Pa, D5 = 0.21 Pa, D6 = 0.32 Pa, I8 = 0.32 ** Pa, where n = 4 in 0.00 Pa, 0.21 Pa, and 0.32 Pa; n = 5 in 0.12 Pa and 0.12 * Pa; and n = 12 in 0.32 ** Pa. p-values: * p < 0.05. Median, upper, and lower quartiles; whiskers indicate the range spanning 1.5 times the interquartile range.
Water 16 00546 g007
Disclaimer/Publisher’s Note: The statements, opinions and data contained in all publications are solely those of the individual author(s) and contributor(s) and not of MDPI and/or the editor(s). MDPI and/or the editor(s) disclaim responsibility for any injury to people or property resulting from any ideas, methods, instructions or products referred to in the content.

