Article

Simulation of Abnormal Evolution and Source Identification of Groundwater Chemistry in Coal-Bearing Aquifers at Gaohe Coal Mine, China

1
School of Resources and Geosciences, China University of Mining and Technology, Xuzhou 221116, China
2
Shanxi Gaohe Energy Co., Ltd., Changzhi 046000, China
*
Author to whom correspondence should be addressed.
Water 2024, 16(17), 2506; https://doi.org/10.3390/w16172506
Submission received: 24 July 2024 / Revised: 27 August 2024 / Accepted: 29 August 2024 / Published: 4 September 2024
(This article belongs to the Section Hydrogeology)

Abstract

:
Numerous scholars worldwide have conducted extensive research on the identification of water sources for mine water inflows, among which the utilization of groundwater’s chemical properties for water source discrimination is characterized by its rapidity, effectiveness, and economy. In the Gaohe Coal Mine of Shanxi Province, anomalous water discharge has been observed from boreholes in some coal-bearing aquifers. The water quality differs from both coal-bearing aquifer water and Ordovician limestone aquifer water. Analysis of K+, Na+, and SO42- suggests that the water does not belong to coal-bearing aquifer water, while the analysis of Ca2+ indicates it is not Ordovician limestone aquifer water. Particularly, in the 8# Coal-Bearing Aquifer Observation Borehole, the concentration of Ca2+ is extremely low, consistent with coal-bearing aquifer water, yet the concentration of SO42- is extremely high, resembling Ordovician limestone water. This is speculated to be due to Ordovician limestone water replenishing the aquifer where the observation borehole is located, triggering a series of chemical reactions. Using the PHREEQC (Version 2) hydrochemical simulation software, hydrochemical simulation experiments were conducted to model the process of different proportions of Ordovician limestone water entering the coal-bearing aquifer. This study explored the reaction mechanisms between Ordovician limestone water, coal-bearing aquifer water, and coal measure aquifer rock samples, validated the hydrochemical and water–rock interactions occurring during this process, and estimated the proportion of water sources in the anomalous borehole water discharge based on the ion concentration profiles of the simulated mixed water. These findings can be applied to the prevention and control of Ordovician limestone water hazards, especially those caused by water-conducting pathways.

1. Introduction

China is rich in coal resources, which dominate the country’s primary energy structure. However, China’s geological conditions are extremely complex, making it one of the countries that is most severely affected by mine water hazards in the world [1]. Severe and frequent mine water disasters have constrained the development of China’s coal industry.
The severity of mine water hazards varies depending on the source of the discharge. For instance, in the North China coalfields, the Ordovician aquifer acts as a vast “underground reservoir”. If the discharge point’s water source is Ordovician limestone water, it can potentially develop into a major disaster. Therefore, identifying the water source is a crucial prerequisite for water hazard management in coal mines [2]. Many researchers have investigated methods for identifying the sources of mine water discharge, including changes in groundwater levels [3], groundwater temperature [4], and groundwater chemical properties [5]. Using the chemical properties of groundwater for source identification is characterized by its speed, effectiveness, and cost-efficiency. Currently, many scholars have established identification models using the hydrochemical properties of mine water to determine the sources of water inrush, such as statistical analysis [6], fuzzy comprehensive evaluation [7], BP neural networks [8], Fisher discriminant analysis [9], Bayesian discrimination [10], and dynamic weight and set pair analysis [11]. These methods have their respective advantages and have been widely used in source identification, but they also have certain limitations. For example, statistical analysis cannot handle the complex interactions of influencing factors, fuzzy evaluation results have uncertainties and require substantial data and computational support, BP neural networks face issues of overfitting and high computational demands, Bayesian discrimination is suitable for situations with distinct principal components [12], and Fisher discriminant analysis is apt for cases with unknown sample distributions but may reduce accuracy in multi-class classification problems [13,14].
Moreover, the foundation of the above methods is the different hydrochemical properties of the water sources, without considering the interactions between the water sources and the surrounding rocks. Different aquifers may have distinct chemical properties, and when the water of an aquifer enters other aquifers and mixes with the water of that aquifer, a chemical reaction may occur. Additionally, the surrounding rock may react with ions in the water [15], such as cation exchange reactions [16] and calcite and dolomite precipitation [17], altering the ion concentrations in the water. These water–water and water–rock reactions increase the difficulty of identifying water sources and determining their composition ratios. For the phenomenon of water sources infiltrating aquifers and reacting chemically with the aquifer water and surrounding rocks, dynamic simulations of the infiltration process are required. By analyzing the changes in water quality and rock composition during this process, we can identify the water source and its composition ratio.
This paper takes the Gaohe Coal Mine in Shanxi as a case study, using PHREEQC (Version 2) to conduct water quality evolutionary simulation experiments. From the perspective of ion concentration changes and rock sample composition changes, we analyze and identify the water source, explain the reasons for water quality anomalies, explore the differences between water–rock interactions and mixing effects, analyze the mechanisms of water source recharge, and develop methods for identifying water sources and analyzing their composition ratios under this mechanism. The collapse pillars in Gaohe Coal Mine are relatively developed, and the Ordovician limestone water conducted through these pillars into the mine poses a significant threat to the safe production of the coal mine. By utilizing this research method to identify the water sources at water outlets with abnormal ion concentrations in the mining area, it is possible to effectively determine the proportion of water sources and the scale of water conductivity channels. This approach facilitates the investigation and treatment of potential water conductivity channels and water inrush sources, thereby effectively preventing the occurrence of water inrush accidents. Additionally, this research method can also be applied to identify water sources in other similar mines, demonstrating its wide applicability.

2. Geological Background

2.1. Overview of the Study Area

The Gaohe coalfield is located in the Lu’an mining area of Changzhi City in the south of Shanxi Province, with its geographical location shown in Figure 1.
The Gaohe coalfield is situated in the central-western part of Sub-region III of the Xinan Spring domain. Except for sporadic outcrops of the Upper Permian Shihezi Formation in the southern valleys, the Gaohe coalfield is predominantly covered by Quaternary loess. Based on borehole data, the stratigraphic sequence within the coalfield, from oldest to youngest, includes the Middle Ordovician Majiagou Formation (O2s), the Middle Ordovician Fengfeng Formation (O2f), the Middle Carboniferous Benxi Formation (C2b), the Upper Carboniferous Taiyuan Formation (C2t), the Lower Permian Shanxi Formation (P1s), the Lower Permian Lower Shihezi Formation (P1x), the Upper Permian Upper Shihezi Formation (P2s), the Neogene Pliocene Series (N2), and the Quaternary System (Q). The A-B profile is shown in Figure 1. The main mining coal seam of the Gaohe Coal Mine is the No. 3 coal seam of the Lower Permian Shanxi Formation. The floor of the No. 3 coal seam contains a coal-bearing sandstone aquifer, coal-bearing limestone aquifer of the Taiyuan Formation, and Ordovician limestone aquifer, among which the Ordovician limestone aquifer is highly water bearing.
It is worth noting that the collapse pillars within the Gaohe coalfield are relatively well developed, with a total of 88 collapse columns throughout the minefield. Among which 20 have been exposed underground, and 9 of them are water conductive. Karst collapse pillars are a geological phenomenon with significant regional characteristics, widely developed in the North China coalfields [18]; they are formed as a result of the continuous development of karst within the limestone layers beneath coal seams, leading to the creation of caves. These caves are then filled by the collapse of overlying rock strata under the influence of gravity, thereby forming collapse pillars [19]. As a result, collapse pillars can traverse multiple geological strata and frequently function as potent water-conducting channels. Based on the current exposure situation underground, it is speculated that other unexposed collapse pillars in the Gaohe Coal Mine may also exhibit water conductivity. If the karst collapse pillars connect the Ordovician limestone water and allow it to enter the mine, it will lead to major water disasters [20].
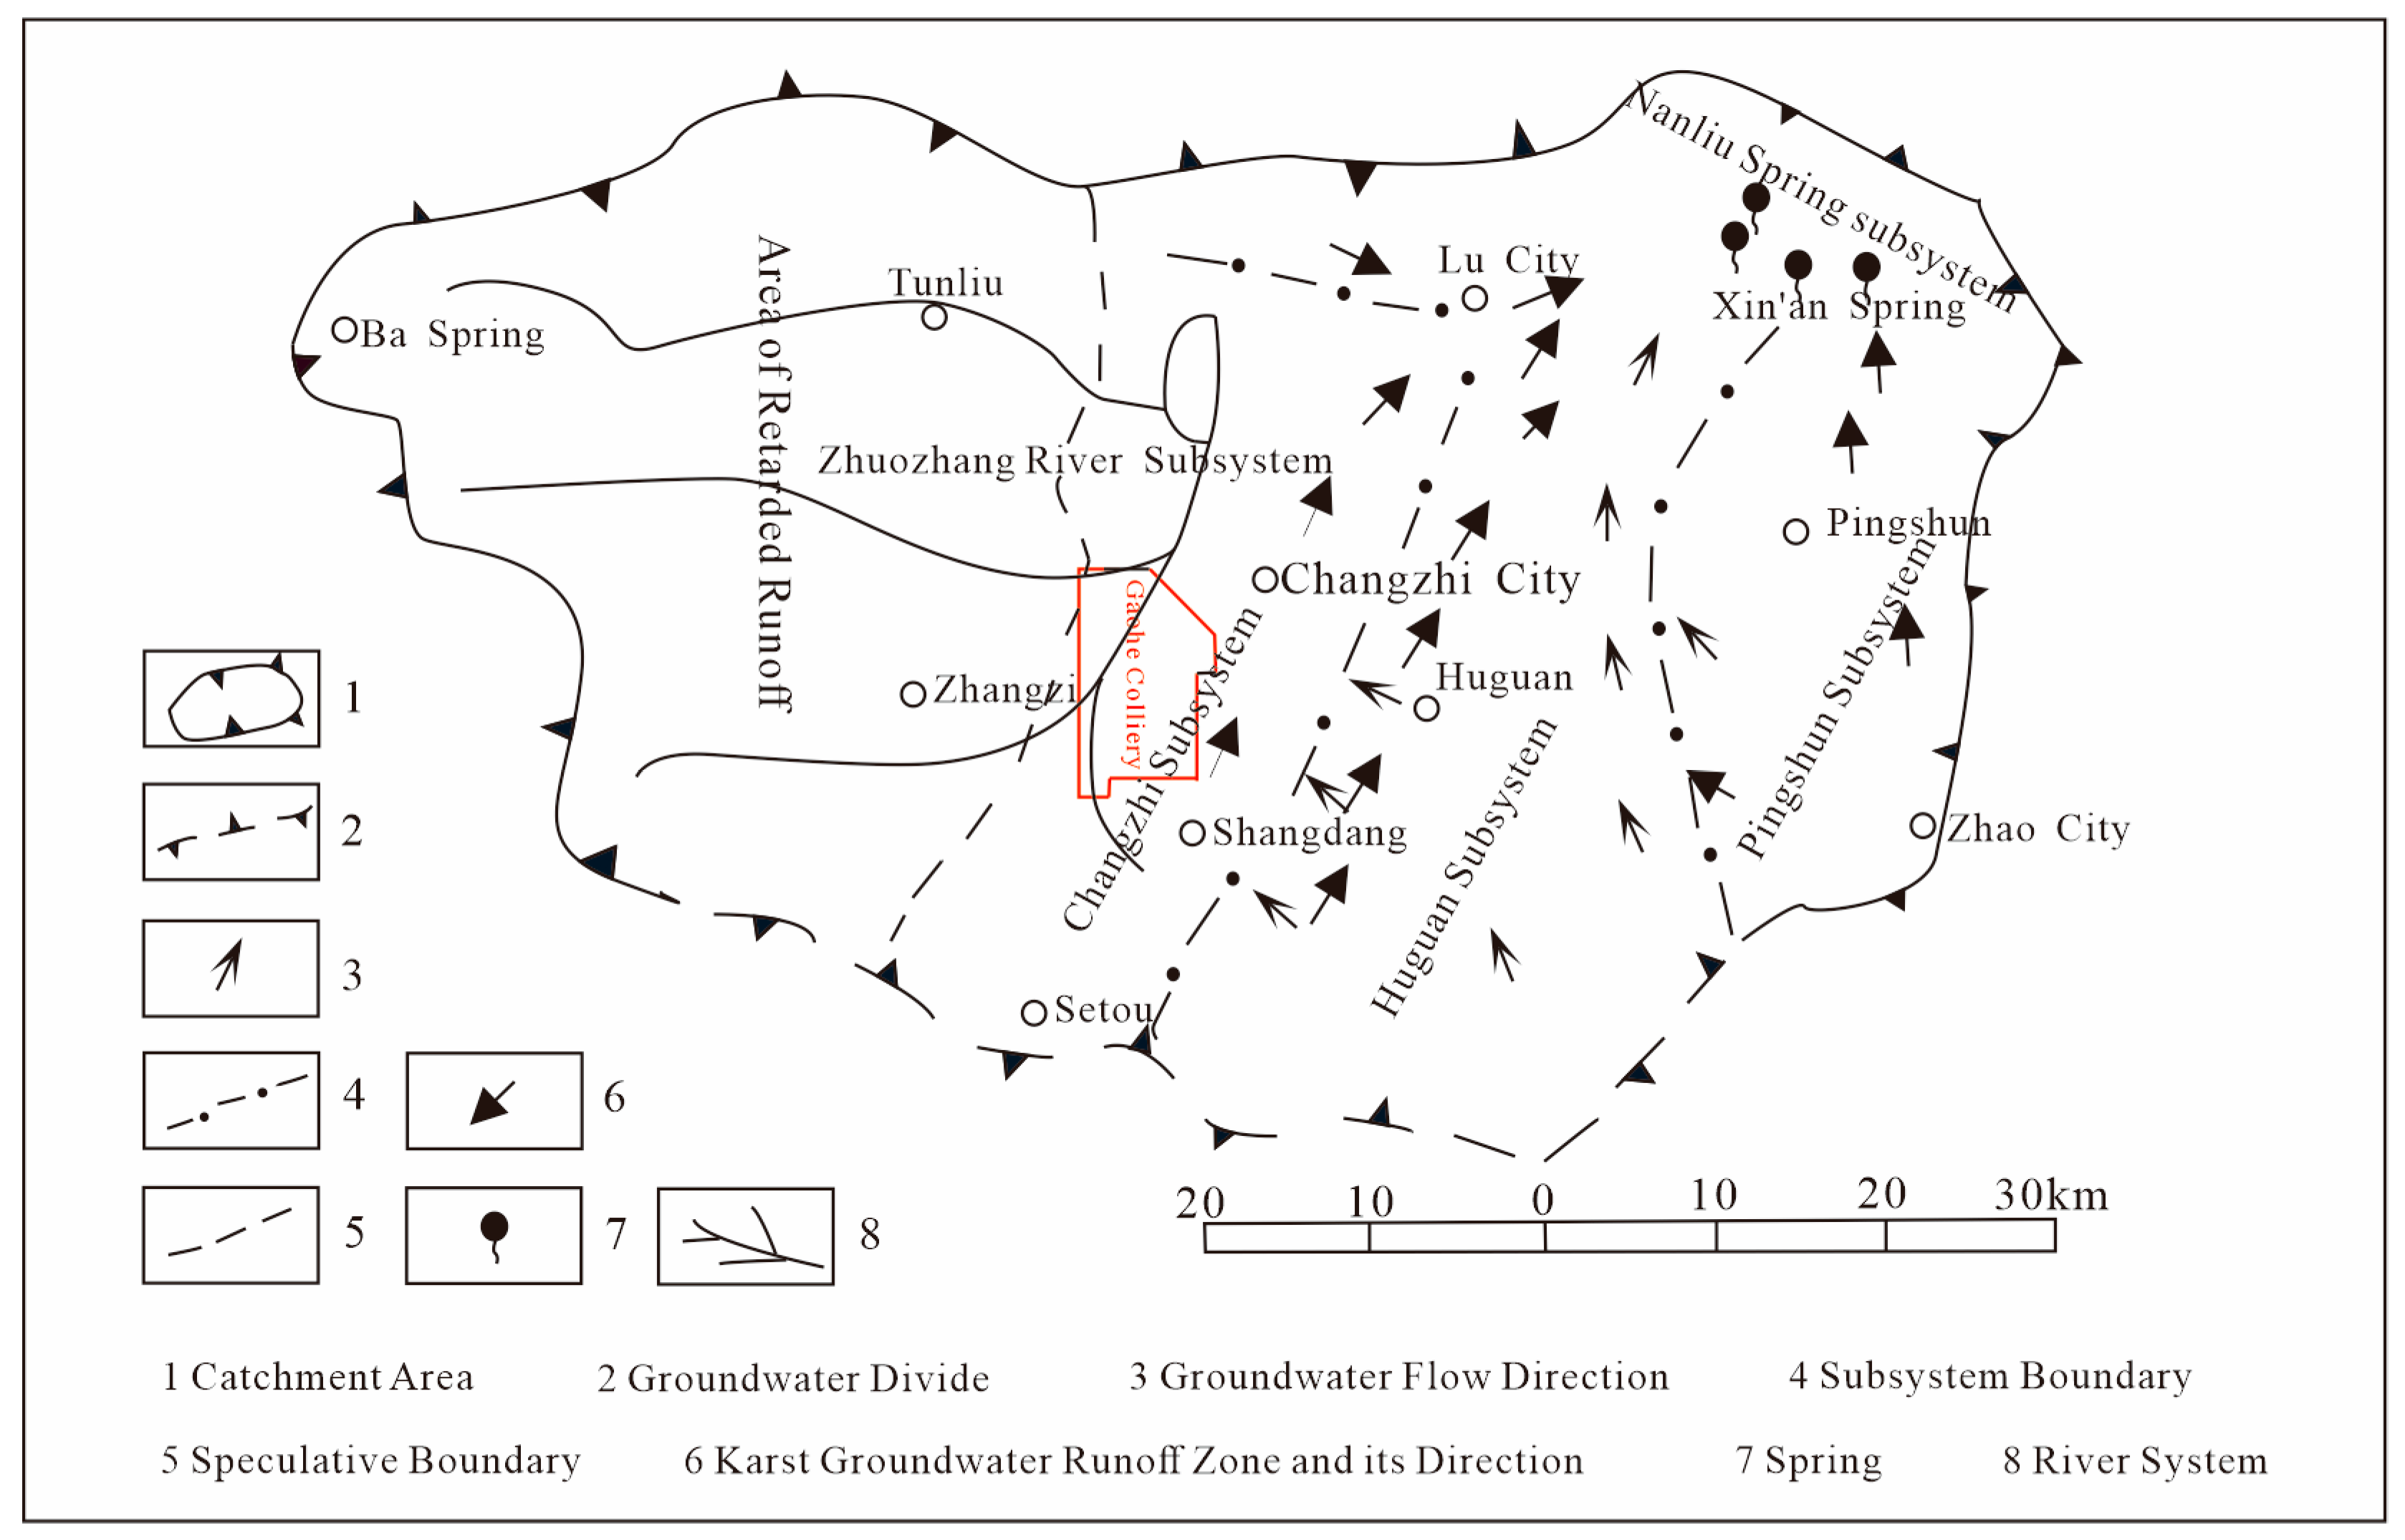
As shown in Figure 2, the surface water in Lu’an Mining Area belongs to the Zhuozhang River subsystem of the Haihe River system. The groundwater belongs to the Nanliuquan subsystem of the Xin’an Spring Group, mainly composed of Ordovician limestone aquifer water. The Gaohe Coal Mine is located on the west side of the karst groundwater runoff zone, where the groundwater flows from southwest to northeast. The karst development in the mining area is good, with strong water richness, strong runoff conditions, and fast seepage velocity.

2.2. Hydrogeological Characteristics of the Mining Area

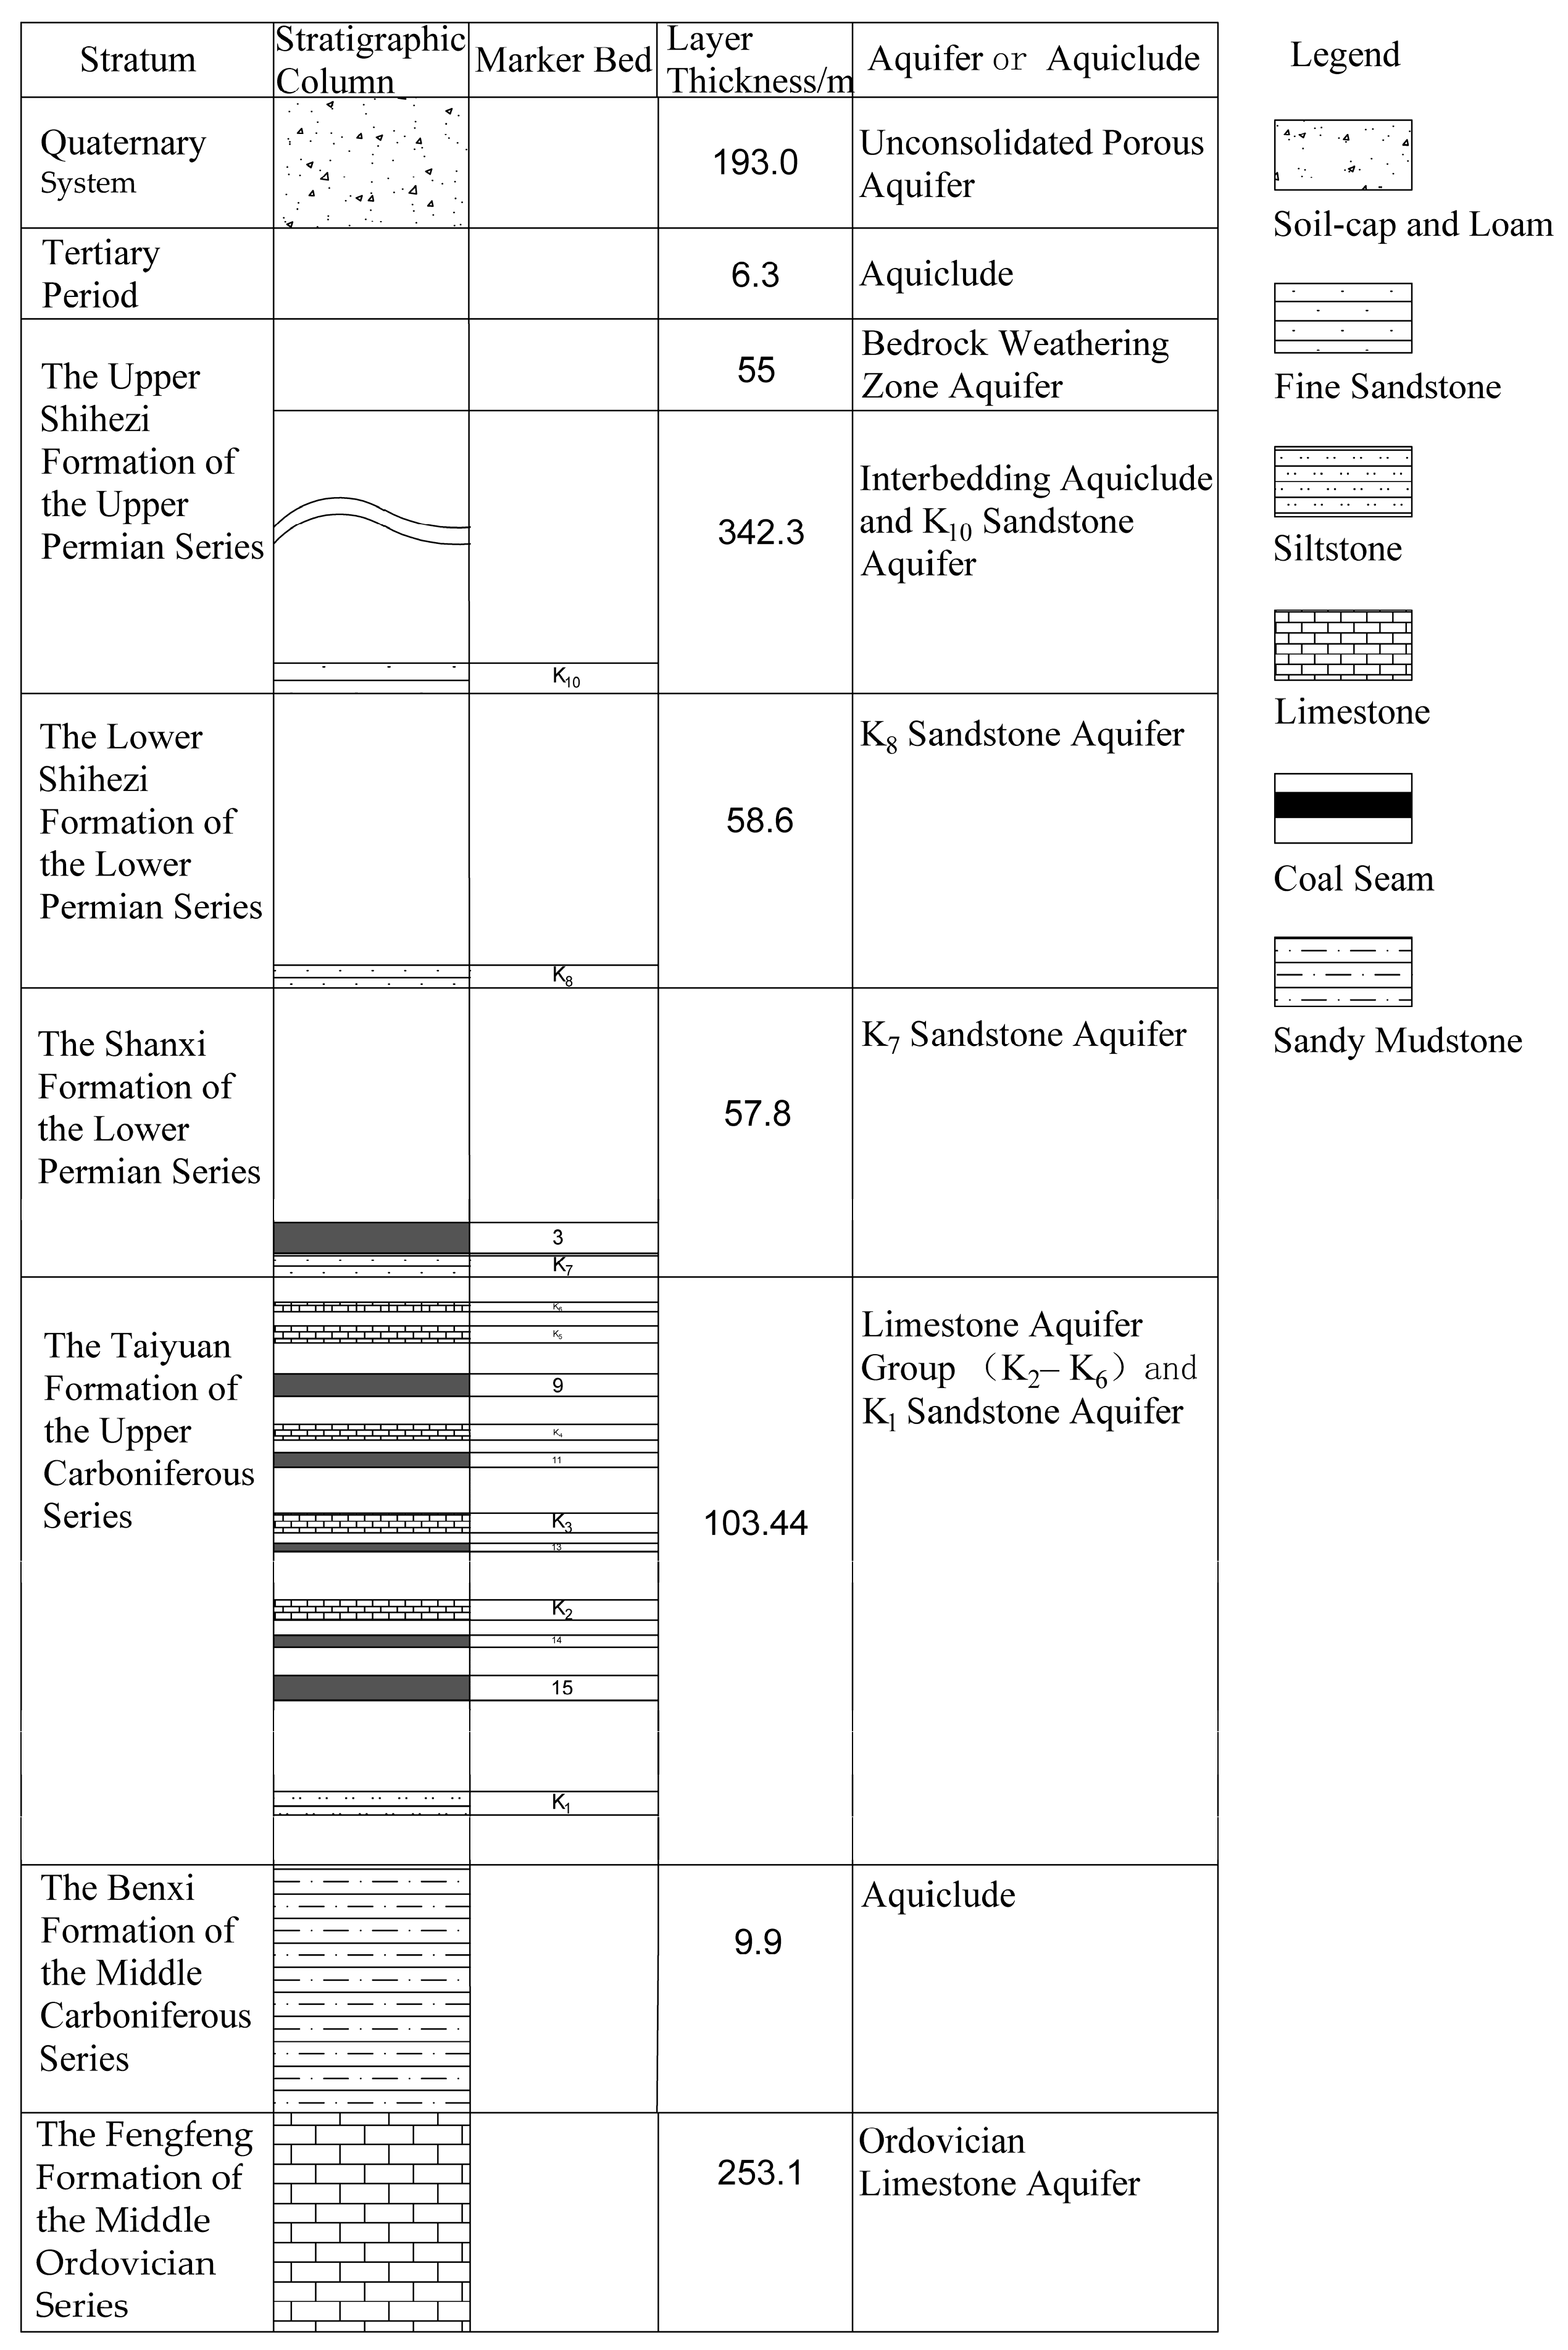
The major aquifers and aquitards in the Gaohe coalfield are illustrated in Figure 3, and the characteristics of the main aquifers are presented in Table 1. The Quaternary System primarily comprises an unconsolidated porous aquifer, characterized by relatively high specific yield and hydraulic conductivity. The bottom of the Quaternary in some areas of the northern part of the coalfield is composed of clay or sandy clay, with relatively weaker water yield property, whereas the central region exhibits stronger water yield property. The Upper Shihezi Formation of the Upper Permian Series primarily encompasses the bedrock weathering zone aquifer, interbedding aquiclude, and the K10 sandstone aquifer. In the central region of the coalfield, the sand layers within the aquifer of the bedrock weathering zone are relatively well developed, and there exists a certain hydraulic connection between this aquifer and the overlying aquifer, enhancing its water yield property. The Lower Shihezi Formation of the Lower Permian Series primarily includes the K8 fractured aquifer, with extremely low specific yield and hydraulic conductivity. The lithology is dominated by medium-grained sandstones and fine-grained sandstones, resulting in extremely weak water yield properties. The Shanxi Formation of the Lower Permian Series primarily encompasses the K7 sandstone aquifer and the 3# coal seam. Both the specific yield and hydraulic conductivity are extremely low for this formation. The 3# coal seam is the primary mining target in the Gaohe Coal Mine, and the K7 sandstone aquifer serves as the direct water-bearing aquifer for this coal seam, although its water yield property is extremely weak, exerting minimal influence on coal mining. The Taiyuan Formation of the Upper Carboniferous Series primarily comprises limestone fractured aquifers such as K2, K3, K4, and K5. These aquifers constitute the water-filling sources for the various coal seams within the Taiyuan Formation, but their water yield property is extremely weak, with specific yield and hydraulic conductivity having minimal impact on coal mining. The Fengfeng Formation of the Middle Ordovician Series primarily comprises limestone karst fractured aquifers, which are the main aquifers in the coalfield. The middle and lower parts of this aquifer feature well-developed karst, with high specific yield and hydraulic conductivity, a strong water yield property, and relatively strong runoff. Furthermore, the water yield property of the Ordovician limestone aquifer in the northern part of the coalfield is significantly stronger than that in the southern part.
The coal-bearing aquifers in this mining area are divided into the sandstone aquifer of the Lower Permian Shanxi Formation and the limestone aquifer of the Upper Carboniferous Taiyuan Formation. Both aquifers have an extremely weak water yield property and share the same hydrogeochemical types. Moreover, some areas have hydraulic connections, so they can be considered as the same aquifer for research purposes.

3. Methods

3.1. Acquisition of Hydrogeochemical Characteristics of Aquifers and Rock Sample Information

Some observation holes in the coal-bearing aquifers in the mining area are not replenished by other water sources. The average concentrations of various ions in the water quality information from these observation holes are used as the concentrations of various ions for the coal-bearing aquifers in the simulation experiments. Similarly, the average concentrations of various ions in the water quality information from some Ordovician limestone aquifer observation holes in the mining area are used as the concentrations of various ions for the Ordovician limestone aquifer in the simulation experiments. The composition and average composition mass proportions of the components from multiple groups of coal-bearing aquifer rock samples, which are located at different positions in the mining area and are not replenished by water sources, are adopted as the composition and composition mass proportion of the coal-bearing aquifer rock samples in the simulation experiment.
The water quality information from conventional coal-bearing aquifers, Ordovician limestone aquifers, and coal-bearing aquifers with abnormal ion concentrations are all derived from the water quality inspection reports collected from the mining company, which are marked with water sample collection points and water sample analysis dates. The rock sample information, on the other hand, is obtained from the laboratory test and analysis results of the collected coal-bearing aquifer rock samples.
As shown in Table 2, there are 11 groups of water samples from coal-bearing aquifers. Coal-Bearing Aquifer Observation Boreholes numbered from 1# to 7# represent sampling points for conventional coal-bearing aquifers, while Coal-Bearing Aquifer Observation Boreholes numbered from 8# to 11# are sampling points for coal-bearing aquifers with abnormal ion concentrations. Additionally, there are 5 groups of water samples from Ordovician limestone aquifers, including Ordovician Limestone Observation Boreholes numbered from 1# to 5#.
As shown in the Table 3, a total of three groups of coal-bearing samples without a water supply were obtained from different locations in the mining area, with two samples in each group. One of them was ground into fine powder with a particle size larger than 325 mesh for X-ray diffraction analysis, and the other was sliced into thin sections for observation under a polarizing microscope. Initially, the phase analysis of rock samples was carried out using the D8 ADVANCE X-ray diffractometer at the Advanced Analysis and Computation Center of China University of Mining and Technology, and the test spectra were read using MDI Jade diffraction analysis software. However, X-ray spectrogram analysis exhibits significant errors in identifying secondary components of the rock samples, and quantitative analysis is prone to larger errors due to various influencing factors. Therefore, to obtain the composition and volume fractions of the rock samples, observations were made using a Leica DM4P polarizing microscope in the School of Resources and Geosciences of China University of Mining and Technology.
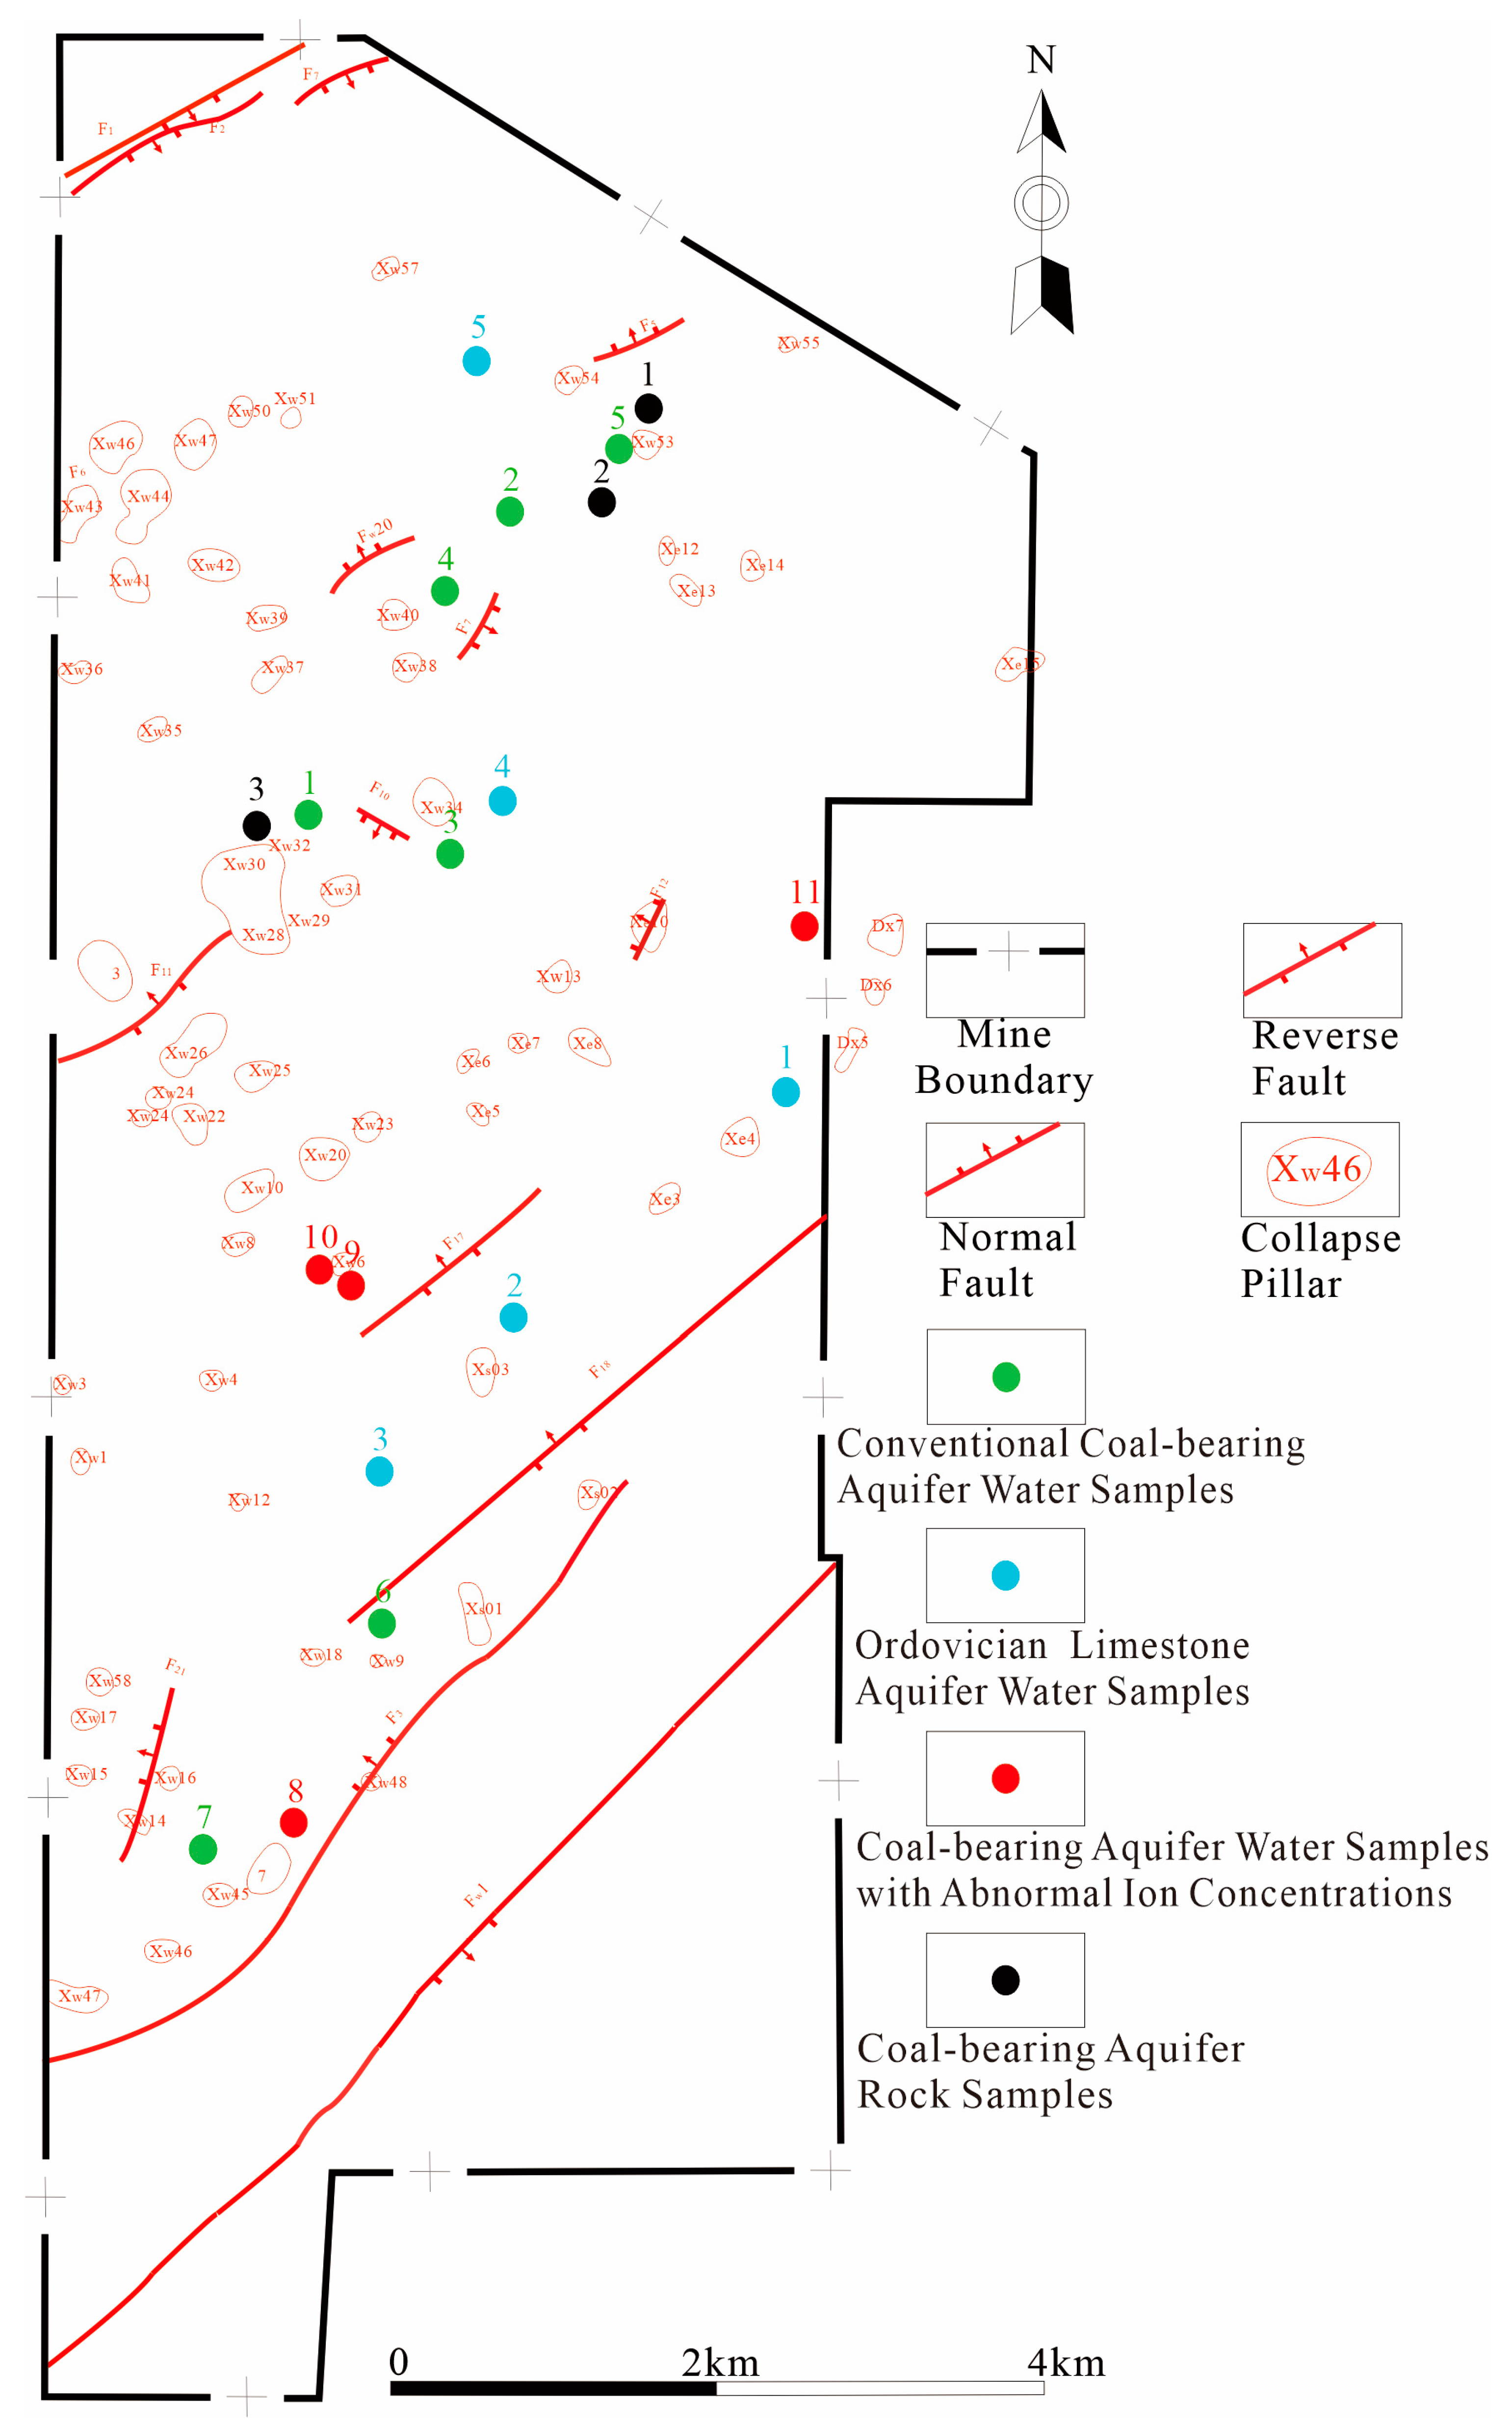
As shown in Figure 4, the overview of the mining area, water sampling points, and rock sampling points are presented. The conventional coal-bearing aquifer water sampling points are marked with green coordinates, the Ordovician limestone aquifer water sampling points are marked with blue coordinates, the coal-bearing aquifer water sampling points with abnormal ion concentrations are marked with red coordinates, and the rock sampling points are marked with black coordinates. Each coordinate number corresponds to the observation point number.

3.2. Preliminary Analysis of Water Quality Anomalies

The water from the 8# Coal-Bearing Aquifer Observation Borehole, 9# Coal-Bearing Aquifer Observation Borehole, 10# Coal-Bearing Aquifer Observation Borehole, and 11# Coal-Bearing Aquifer Observation Borehole all originate from the coal-bearing sandstone aquifer. Analysis of the hydrochemical properties of these four sources reveals high concentrations of SO42−. The source of SO42− could be attributed to the bedrock weathering zone fractured aquifer and the Middle series of Ordovician Fengfeng Formation limestone karst fractured aquifer. The bedrock weathering zone fractured aquifer is located above the coal-bearing sandstone aquifer, separated from it by multiple aquitards such as the Upper Shihezi Formation of the Upper Permian Series. Additionally, proactive exploration has been conducted by the Gaohe Mine on the aquifers above the coal-bearing aquifer, and any potential upper aquifers have been grouted and reinforced, hence excluding the upper aquifers as potential sources of sudden water influx. Thus, the high concentration of SO42− in the four water sources can be attributed to the limestone aquifers of the Middle series of the Ordovician Fengfeng Formation.
The Ordovician limestone aquifer is a confined aquifer, which means it has significant water pressure. Additionally, due to its strong water-bearing characteristics, Ordovician limestone water is highly prone to infiltrating into the coal measure aquifer through water-conducting channels such as poorly closed boreholes and collapse columns.
Based on the statistical analysis of previous hydrogeological data from the mining area and the advanced exploration conducted by the Gaohe Coal Mine, it is determined that there is no goaf water or bed separation water near the water inrush point. Therefore, goaf water and bed separation water are not considered as potential sources of water inrush.
Based on the preliminary analysis above, Ordovician limestone water entered the coal-bearing aquifer through water-conducting channels and mixed with coal-bearing aquifer water, causing a series of chemical reactions and changing the concentration of various ions in the water.

3.3. Water Quality Evolutionary Simulation Experiment

The water quality evolutionary simulation experiment explores the mechanism of water quality evolution during the recharge process of the coal-bearing aquifer by adjusting the volume of recharge water. In PHREEQC, the ion concentrations of the water in the coal-bearing aquifer and the composition of the rock samples from the coal-bearing aquifer are input. Subsequently, by inputting gradually increasing volumes of water from the Ordovician limestone aquifer, the water quality evolution under different mixing ratios of water from the Ordovician limestone aquifer and the coal-bearing aquifer is simulated. This is then compared with water samples from the coal-bearing aquifer exhibiting abnormal ion concentrations to validate the hypothesized causes and analyze the source and composition of the water sample.
PHREEQC is a hydrogeochemical simulation software developed by the United States Geological Survey (USGS) [21]. This software can simulate various geochemical processes [22], including chemical reactions in aqueous solutions, equilibria between water and mineral rock samples, and equilibria between solid solutions and gases. It is used to predict the outcomes of interactions between groundwater and surrounding rocks, as well as the trends in the chemical composition of groundwater.
PHREEQC utilizes Equation (1) to determine whether a phase is in equilibrium, dissolution, or precipitation [23], where Kp represents the thermodynamic equilibrium constant for phase p, γi is the activity coefficient of ion i, ci is the concentration of ion i (mol/L), and ni,p is the stoichiometric coefficient of ion i in phase p.
K p = i ( γ i c i ) n i , p
At a given temperature T (in Kelvin), the thermodynamic equilibrium constant Kp can be expressed with Equation (2), where R is the universal gas constant (8.31451 J/(mol K)), and ΔrGT0 is the standard reaction Gibbs energy at temperature T.
K p = e x p ( r G T 0 R T )
The standard reaction Gibbs energy can be further expressed with Equation (3) [24], where ΔrGT0 denotes the Gibbs free energy of formation for a given substance at the specified temperature.
r G T 0 = r G T ,       p r o d u c t s 0 r G T ,       r e a c t a n t s 0
PHREEQC incorporates an extensive thermodynamic database that encompasses a vast array of thermodynamic parameters and reaction kinetic data for minerals, gases, and dissolved species. These databases serve as the fundamental data support for PHREEQC’s simulations. Typically, users do not need to input kinetic equations or parameters; instead, they can select the appropriate built-in database according to their needs. For this experiment, the default built-in databases phreeqc.dat and wateq4f.dat were chosen. The phreeqc.dat database contains thermodynamic data for aqueous, gas, and solid phases, along with data for various elements and compounds, thermodynamic data for cation exchange reactions, and thermodynamic data for acid–base reactions. The wateq4f.dat database is largely similar to phreeqc.dat, but it incorporates additional data for other elements [25] and thermodynamic data for some complexation reactions.
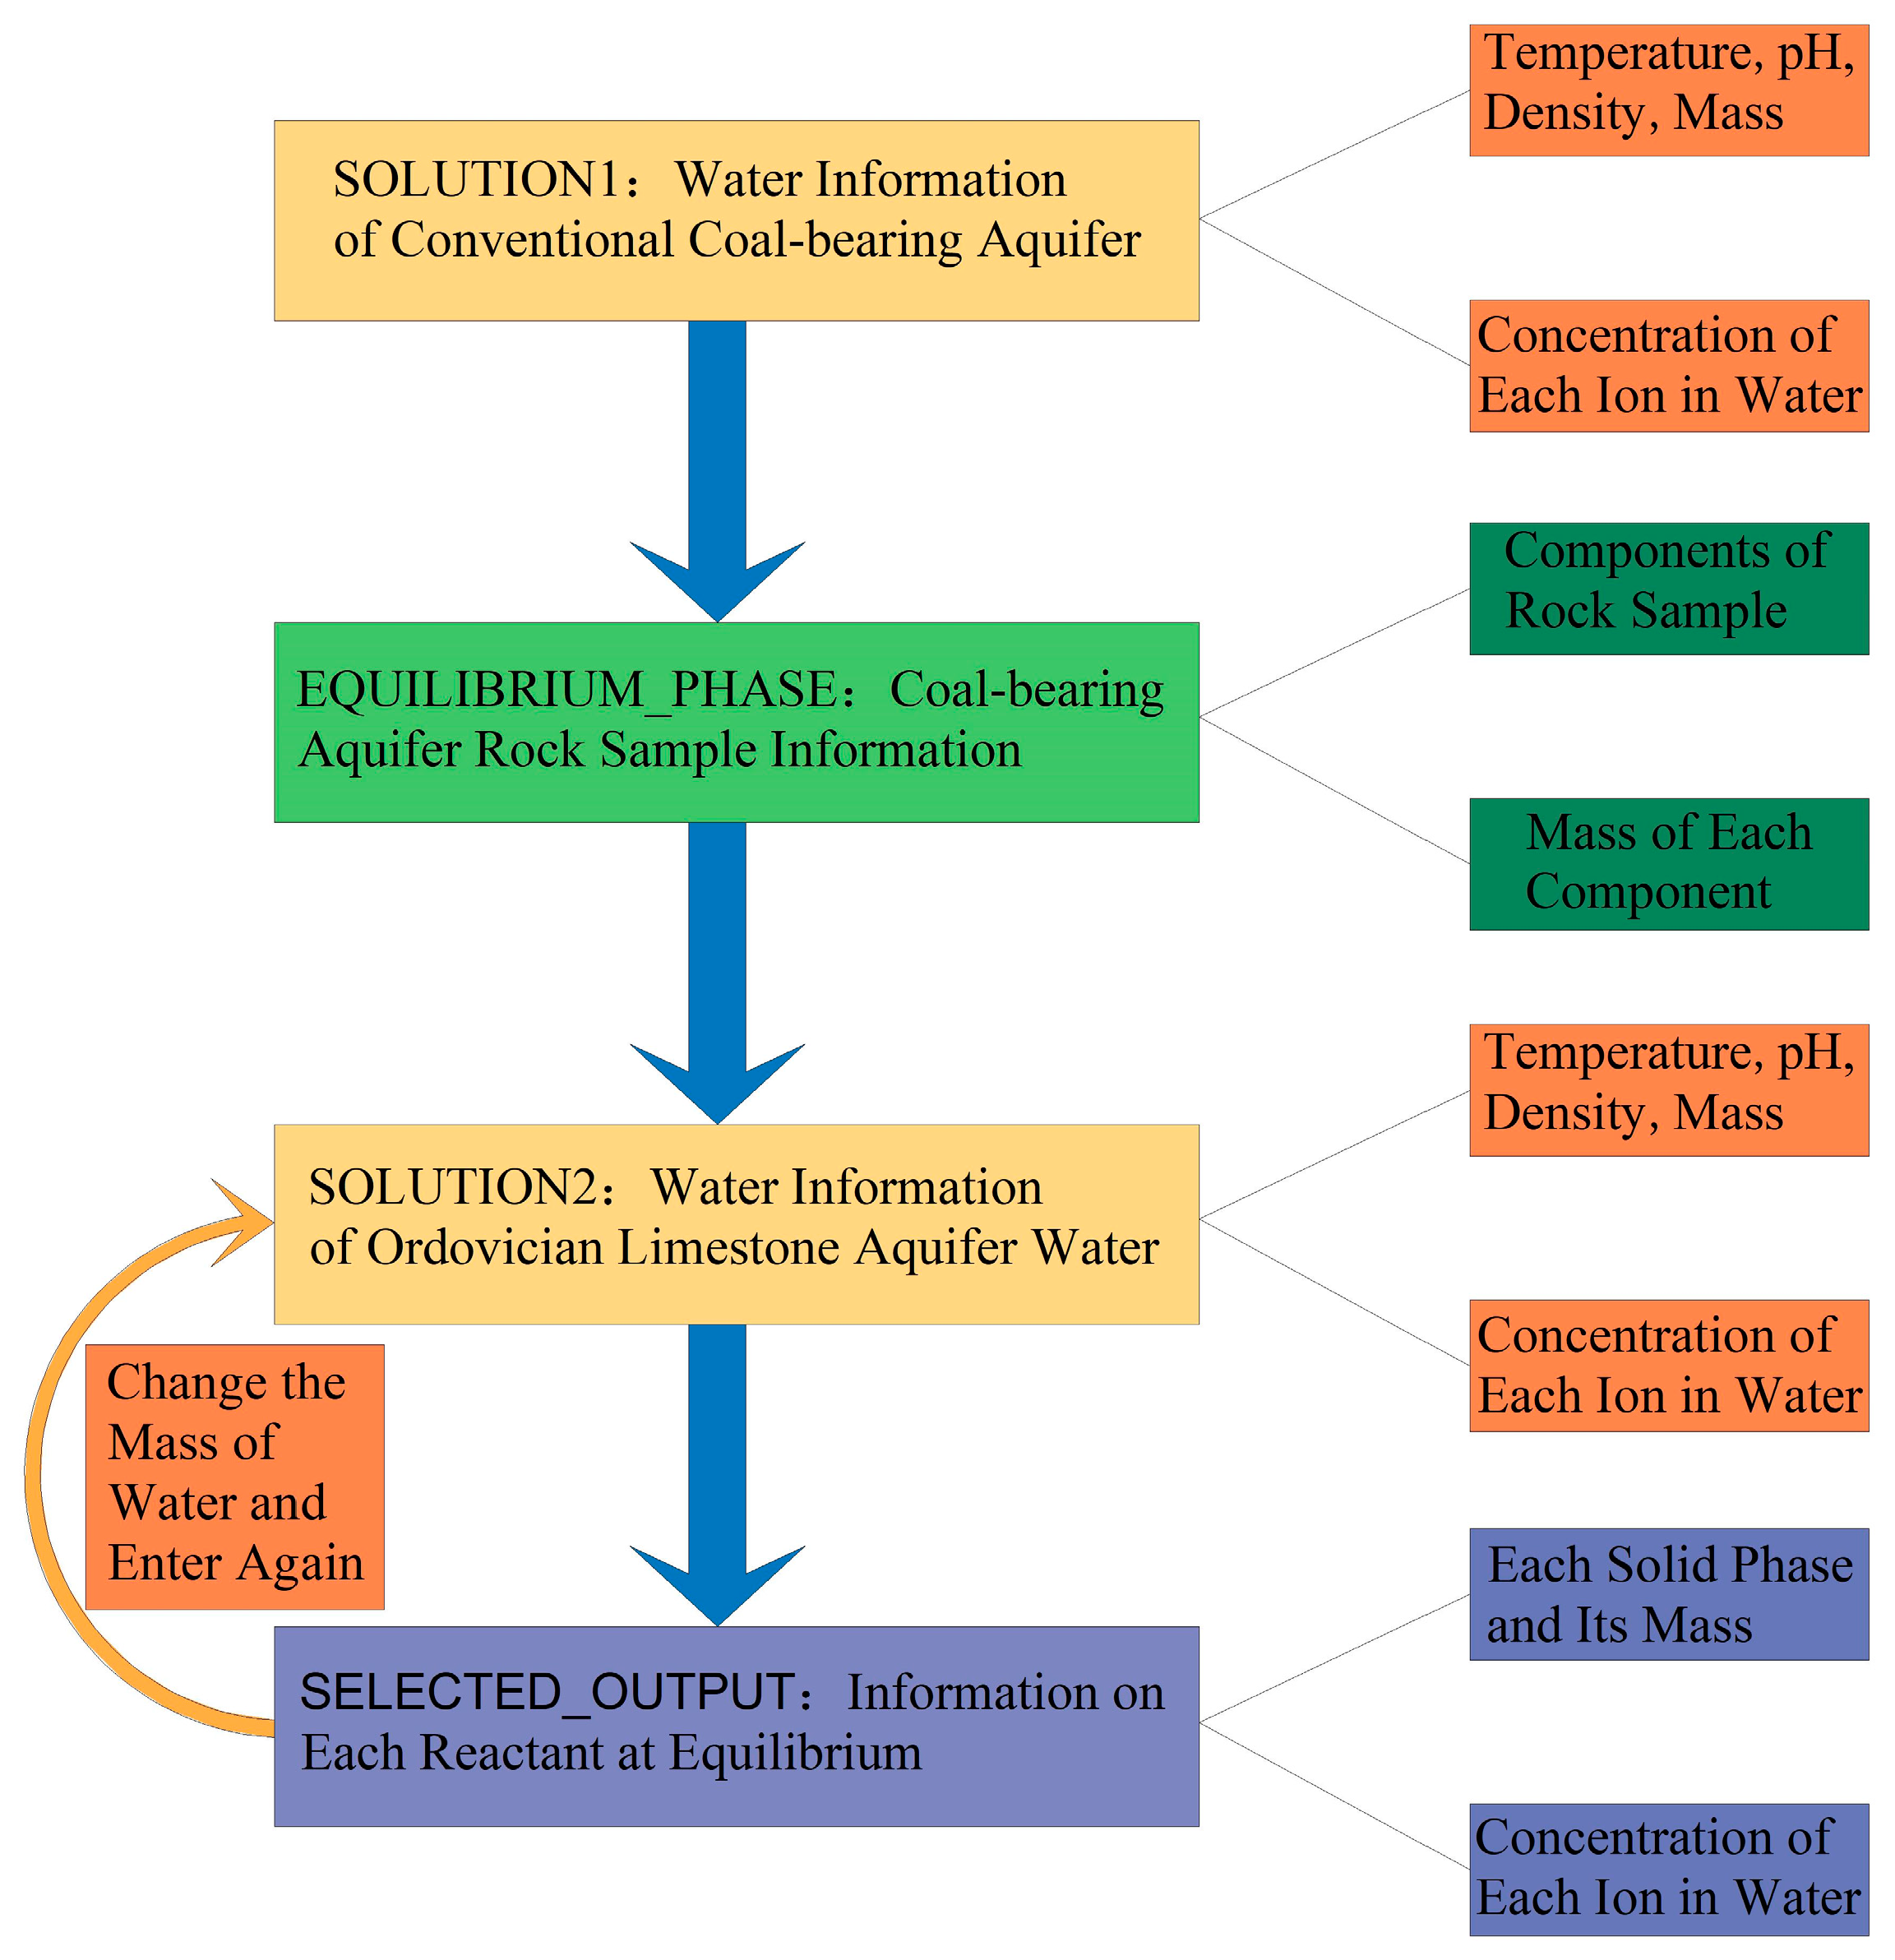
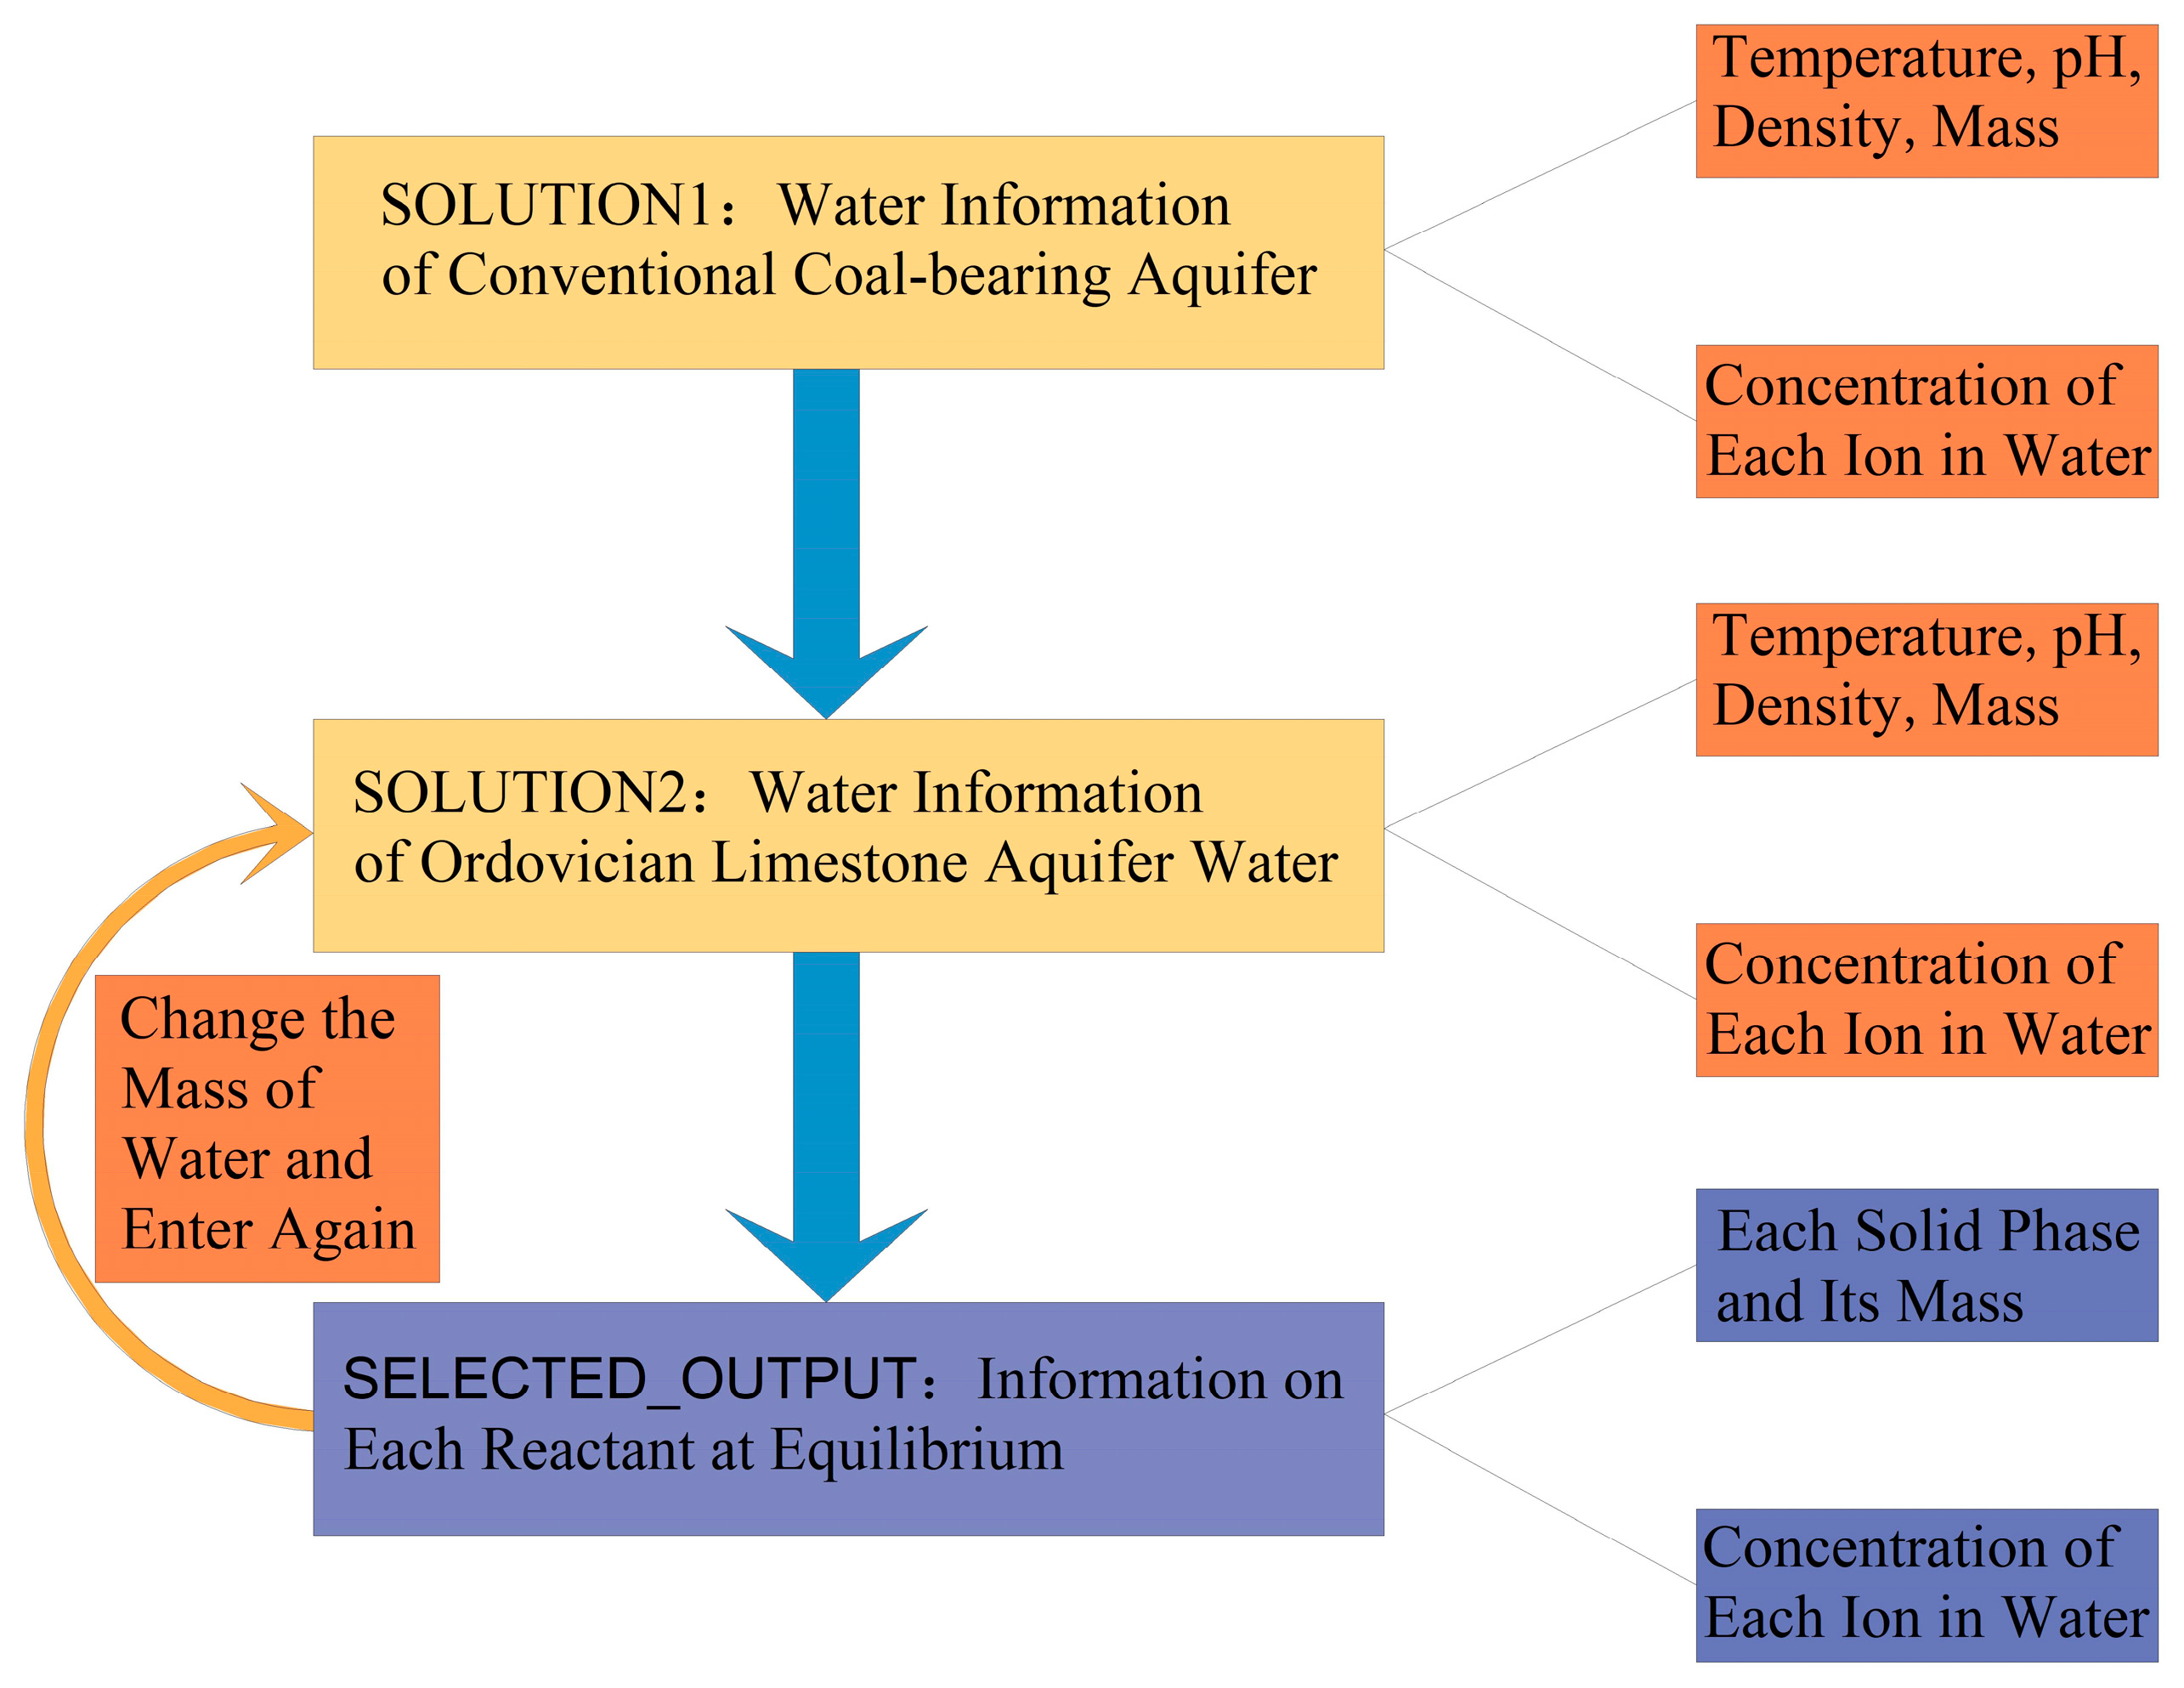
As depicted in Figure 5, in PHREEQC, water samples are added via the SOLUTION option, where the water information of the coal-bearing aquifer in this experiment is input. The individual components and their corresponding masses of rock samples from coal-bearing aquifers are added via the EQUILIBRIUM_PHASE option. With the water volume of the coal-bearing aquifer and the mass of each component of the coal-bearing aquifer rock sample remaining constant, the water information from the Ordovician limestone aquifer in the experiment is input through the SOLUTION option, and its water volume is gradually increased for multiple sets of experiments to obtain results. In Phreeqc, the SELECTED_OUTPUT option is utilized to add output items, which subsequently allows for the extraction of the concentrations of various ions and the masses of individual components in the rock sample after the evolution simulation experiments.

3.4. Water Quality Mixing Simulation Experiment

To further confirm that water–rock interaction indeed occurred, rather than solely chemical interactions between Ordovician limestone water and coal-bearing aquifer water, the rock samples were removed from the reactions. Only the mixing experiments of the two water qualities were conducted, serving as a control comparison to the water quality evolutionary simulation experiment.
As shown in the Figure 6, in PHREEQC, the EQUILIBRIUM_PHASE option was removed, effectively eliminating the rock samples from the reactions. The volume of coal-bearing aquifer water remained constant, consistent with the water quality evolutionary simulation experiment. Subsequently, the volume of replenishment water was incrementally increased, conducting multiple sets of experiments (each increment of Ordovician limestone water volume is the same as that in the water quality evolutionary simulation experiment), and the results were obtained.

4. Result

4.1. Water Quality Information

The water quality information from the conventional coal-bearing water, Ordovician limestone aquifer water, and coal-bearing aquifer water with abnormal ion concentrations is presented in Table 4.
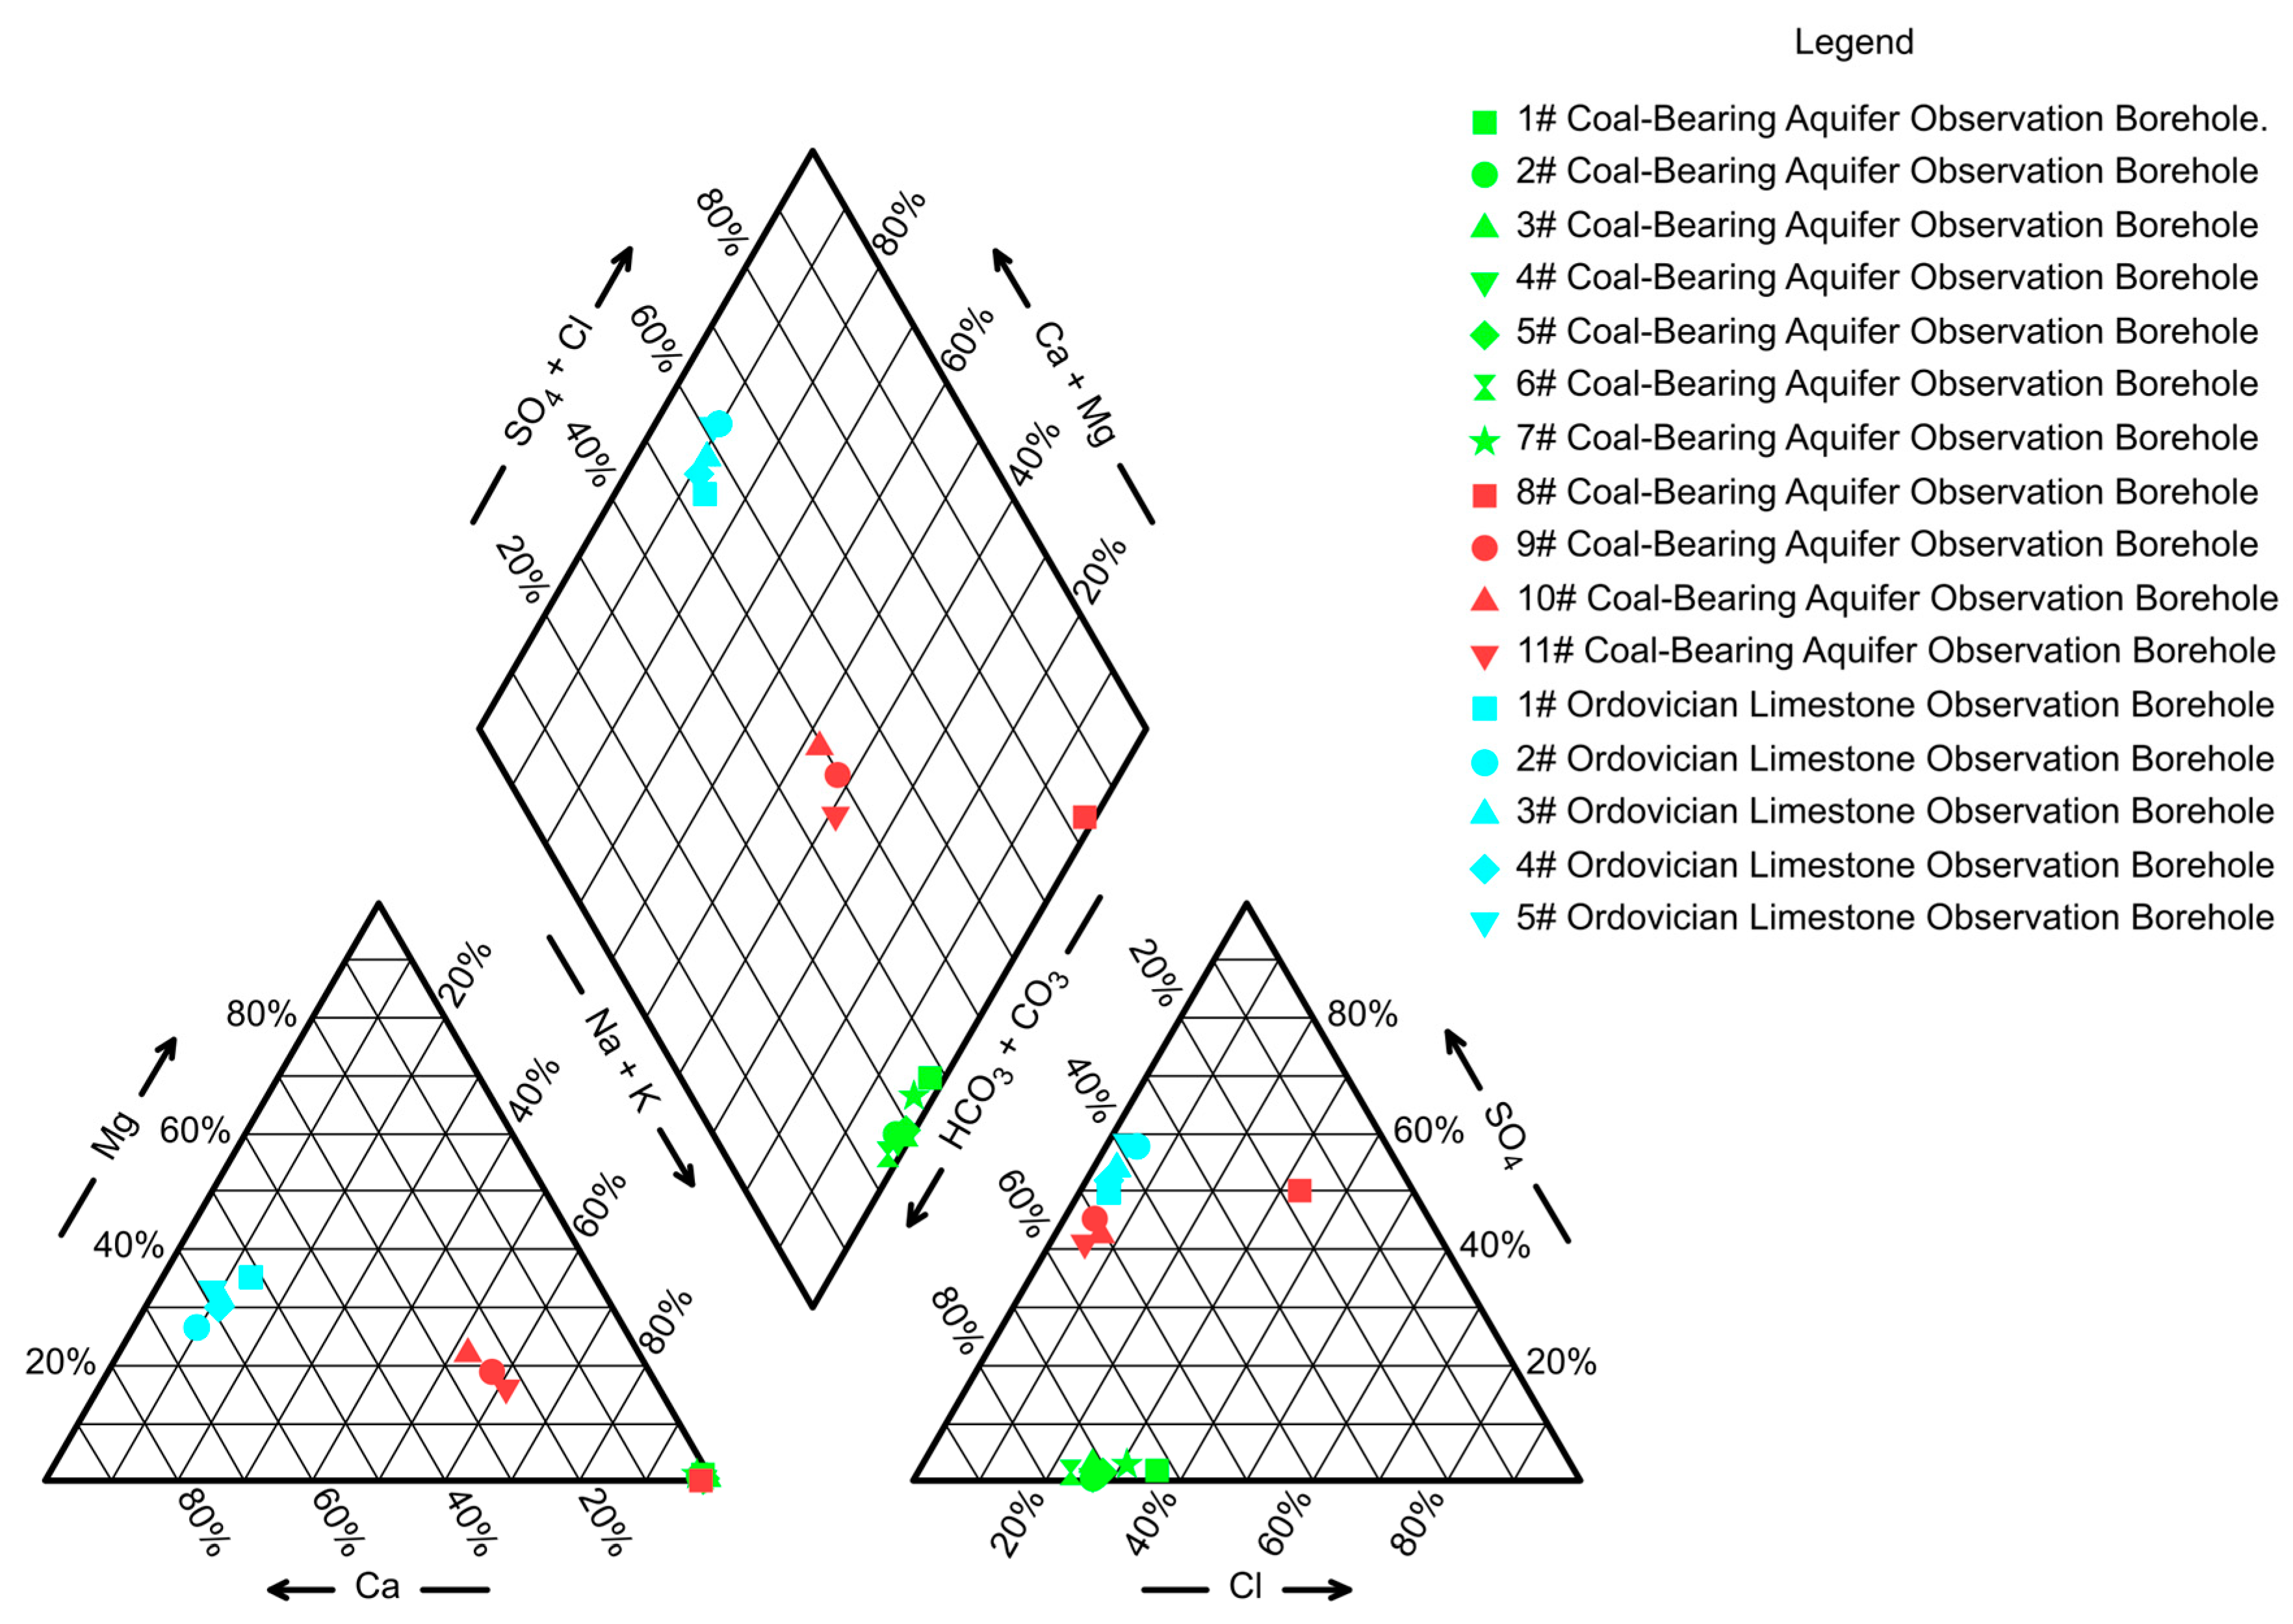
A comparative analysis of the ion concentrations in the three types of water samples is presented in the Piper diagram shown in Figure 7. The results reveal that in the coal-bearing aquifers, the concentrations of K+ and Na+, as well as Cl, are relatively high, whereas the concentrations of Ca2+, Mg2+, and SO42− are relatively low. Conversely, the Ordovician limestone aquifers exhibit notably higher concentrations of Ca2+, Mg2+, and SO42, leading to increased water hardness. The hydrogeochemical type of the coal-bearing aquifers with abnormal ion concentrations falls between these two categories.

4.2. Coal-Bearing Aquifer Rock Sample Information

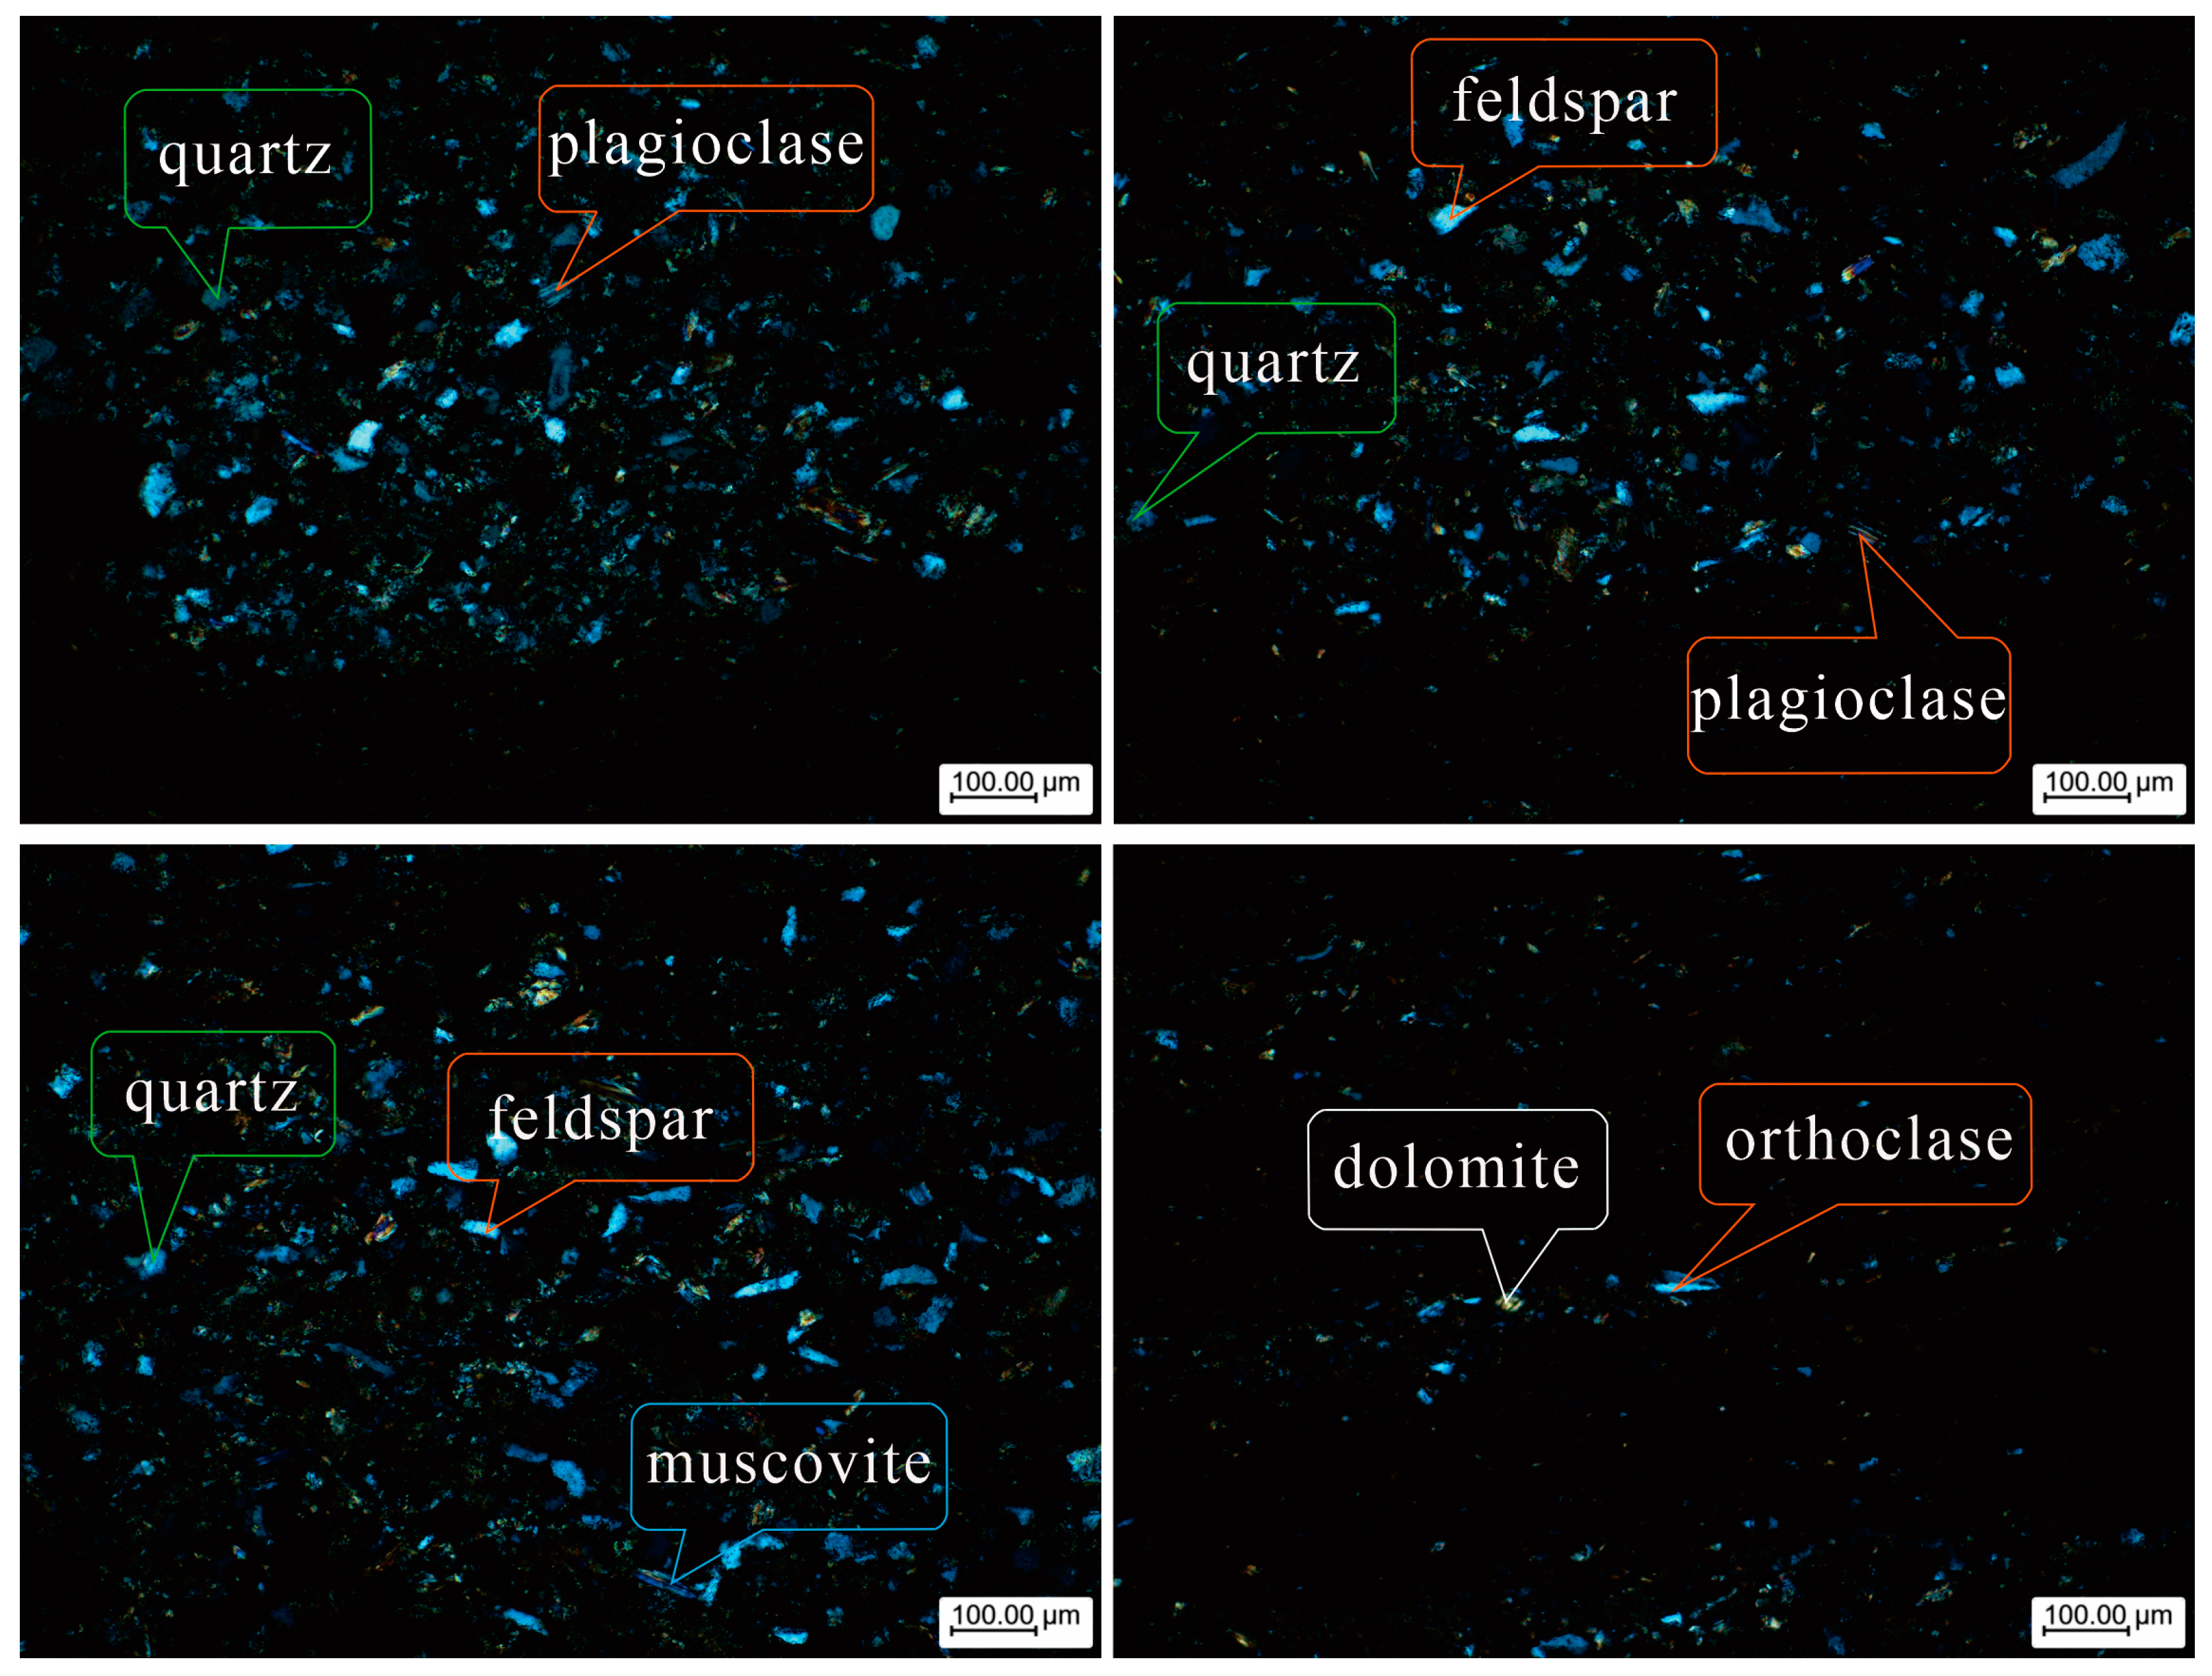
The X-ray diffraction patterns show that the majority of the rock samples are composed of quartz. Representative micrographs of the rock samples observed under the polarizing microscope are shown in Figure 8.
After observation, the composition of the rock samples is as follows: argillaceous siltstone, mainly composed of quartz with a cryptocrystalline-powder crystalline structure, followed by feldspar, muscovite, calcite, and dolomite. The feldspar includes orthoclase (potassium feldspar), characterized by tabular crystals with Carlsbad twinning, and plagioclase (albite), which exhibits polysynthetic twinning with relatively wide crystal lamellae. Analysis suggests that calcite and dolomite are products of recrystallization. Estimating the volume fractions of the rock sample components, it is found that mudstone comprises approximately 30%, quartz approximately 50%, potassium feldspar approximately 10%, muscovite approximately 5%, albite approximately 4%, and calcite and dolomite approximately 0.5% each. After converting to mass ratios with density unit conversion, the composition of the coal-bearing aquifer rock samples used in the simulation experiments is shown in Table 5.

4.3. The Data from Water Quality Evolutionary Simulation Experiment and Mixing Simulation Experiment

The data on coal-bearing aquifer water input through the SOLUTION option in PHREEQC represent the average of eight conventional coal-bearing aquifer water samples, with a water mass set at 0.5 kg. The rock sample compositions input via the EQUILIBRIUM_PHASE option comprise quartz (70 g), potassium feldspar (13.22 g), albite (5.39 g), and muscovite (7.26 g). Given the assumption that the coal-bearing aquifer has never received recharge from Ordovician limestone water, calcite and dolomite are excluded from the input of simulated rock samples but are considered as potential outputs of the experiment. The data on Ordovician limestone aquifer water input through the SOLUTION option are the average of five Ordovician limestone aquifer water samples, with the water mass incrementally increasing from 0.1 kg.
In PHREEQC, the output items added via the SELECTED_OUTPUT option include K+ and Na+ concentrations, Ca2+ concentration, Mg2+ concentration, Cl- concentration, SO42 concentration, HCO3- and CO32- concentrations, quartz mass, potassium feldspar and albite masses, calcite mass, and dolomite mass.
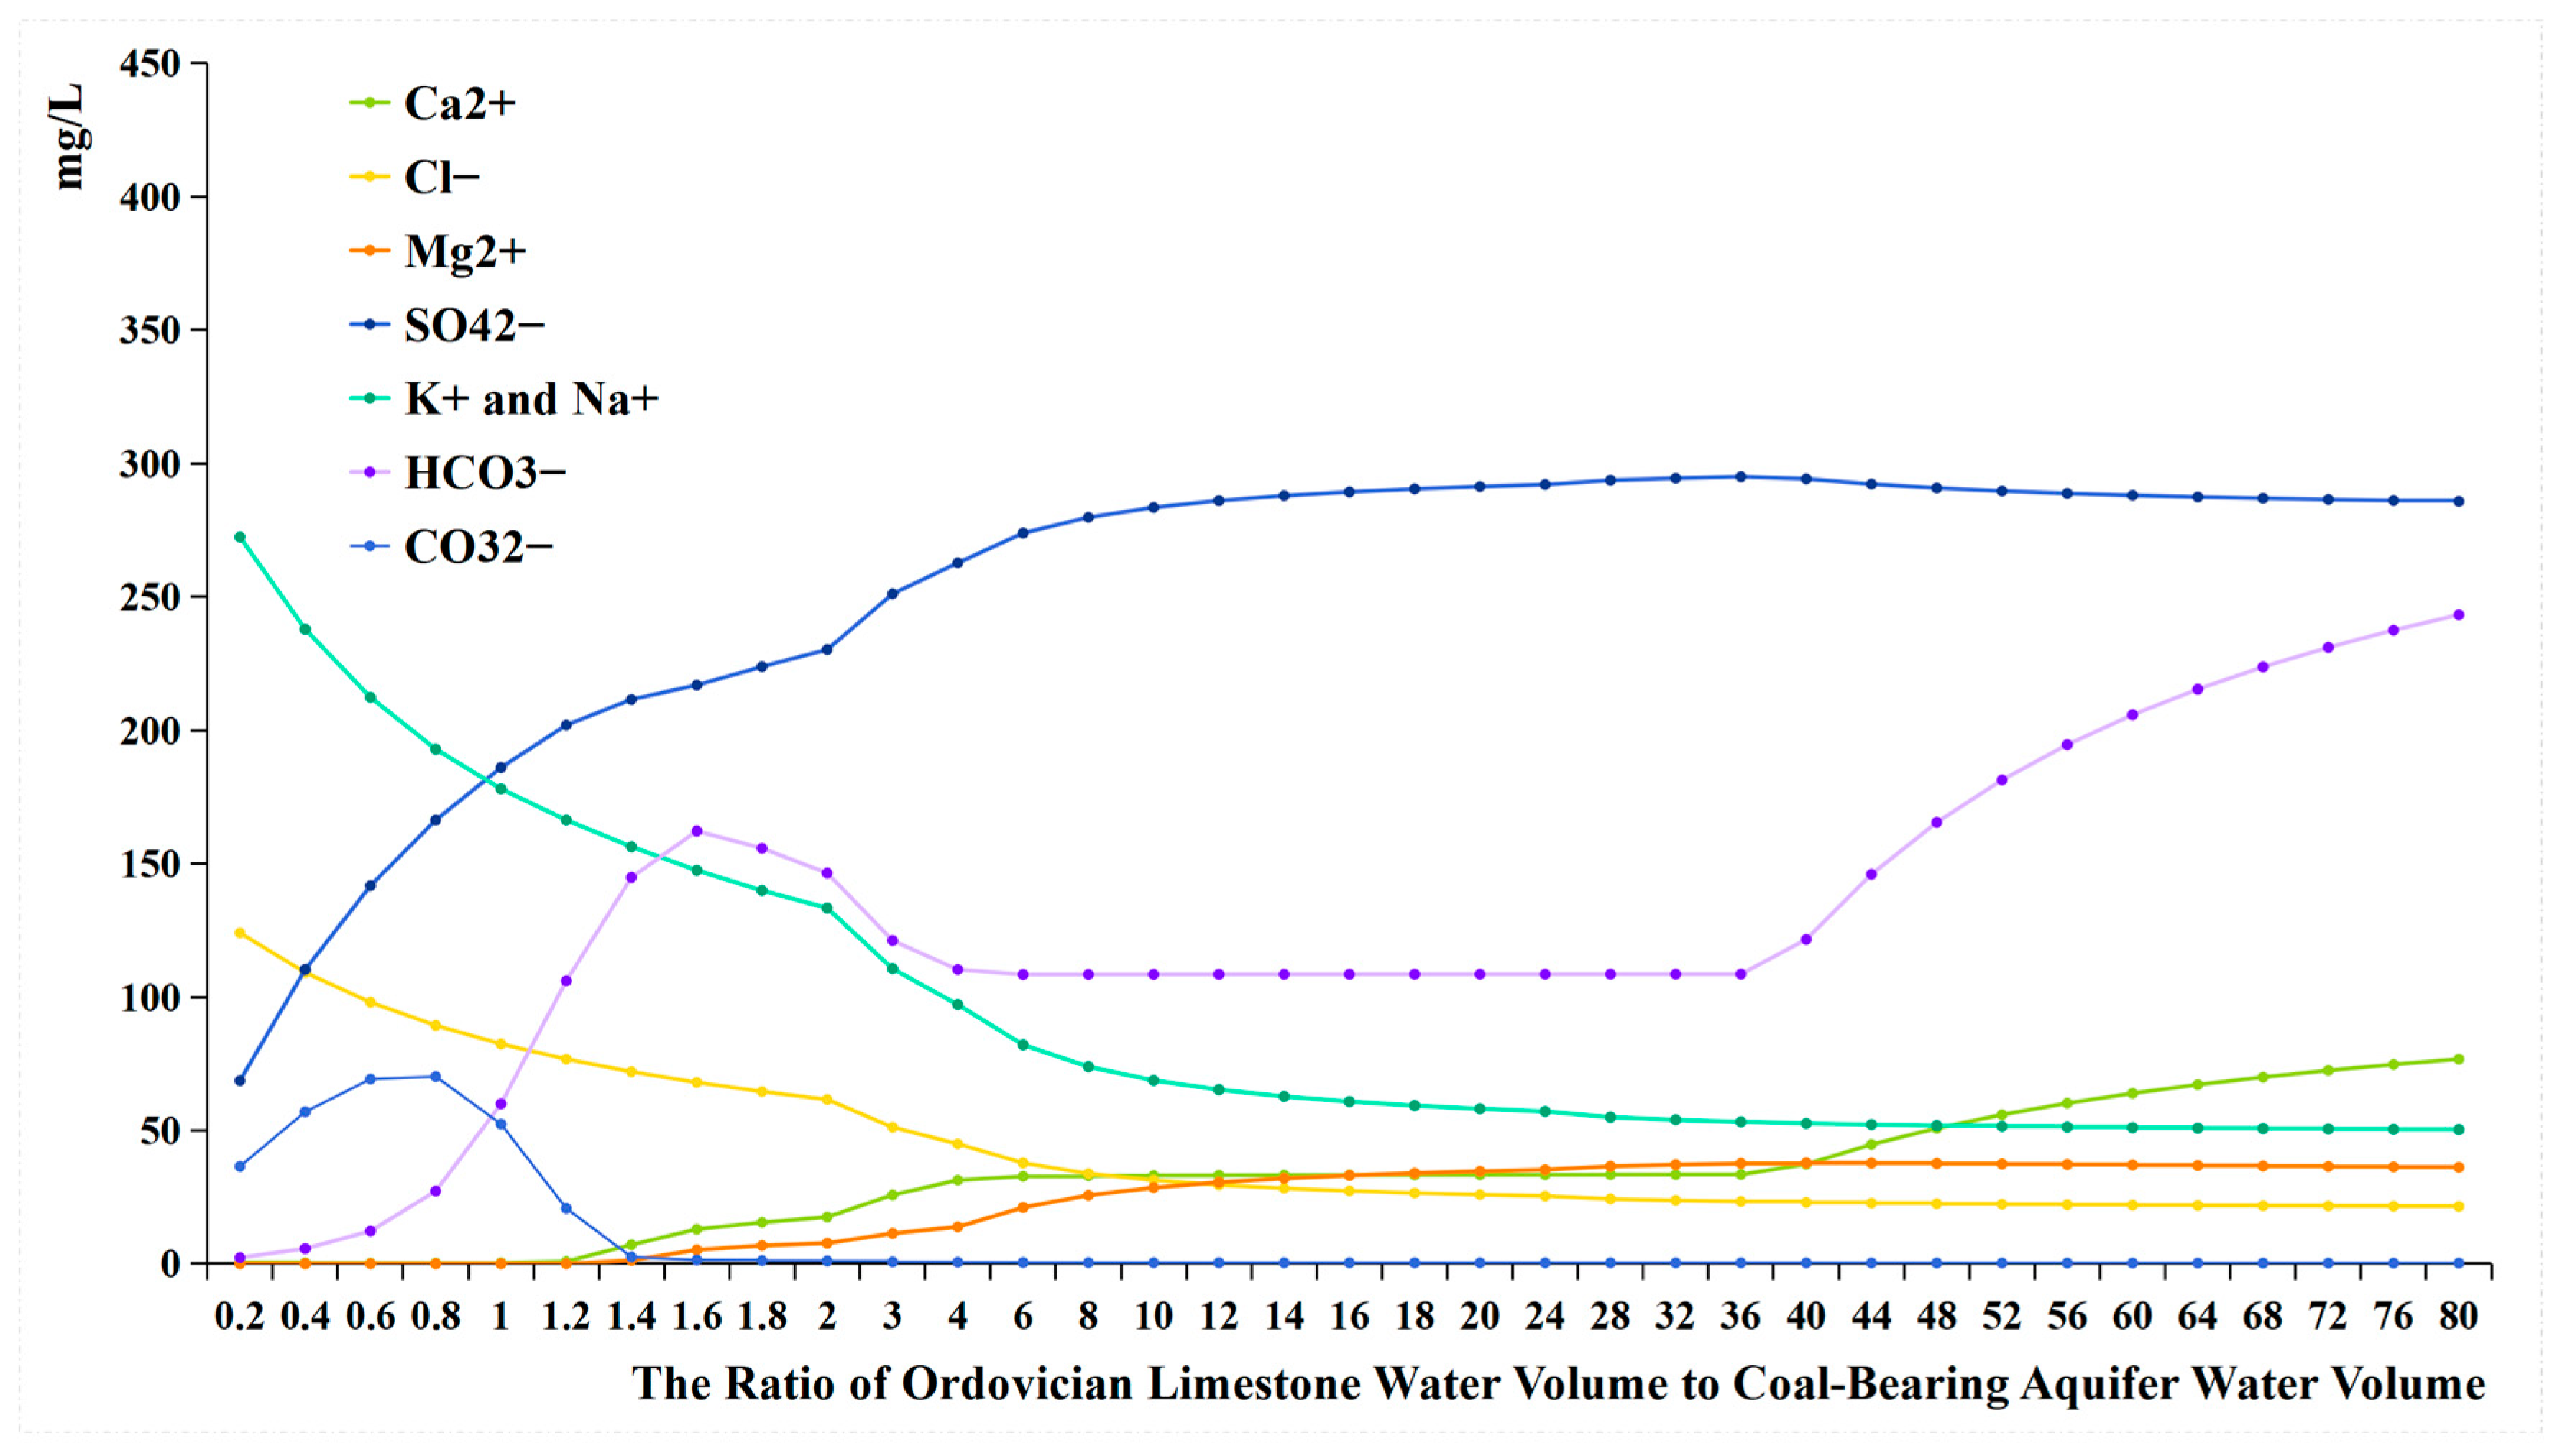
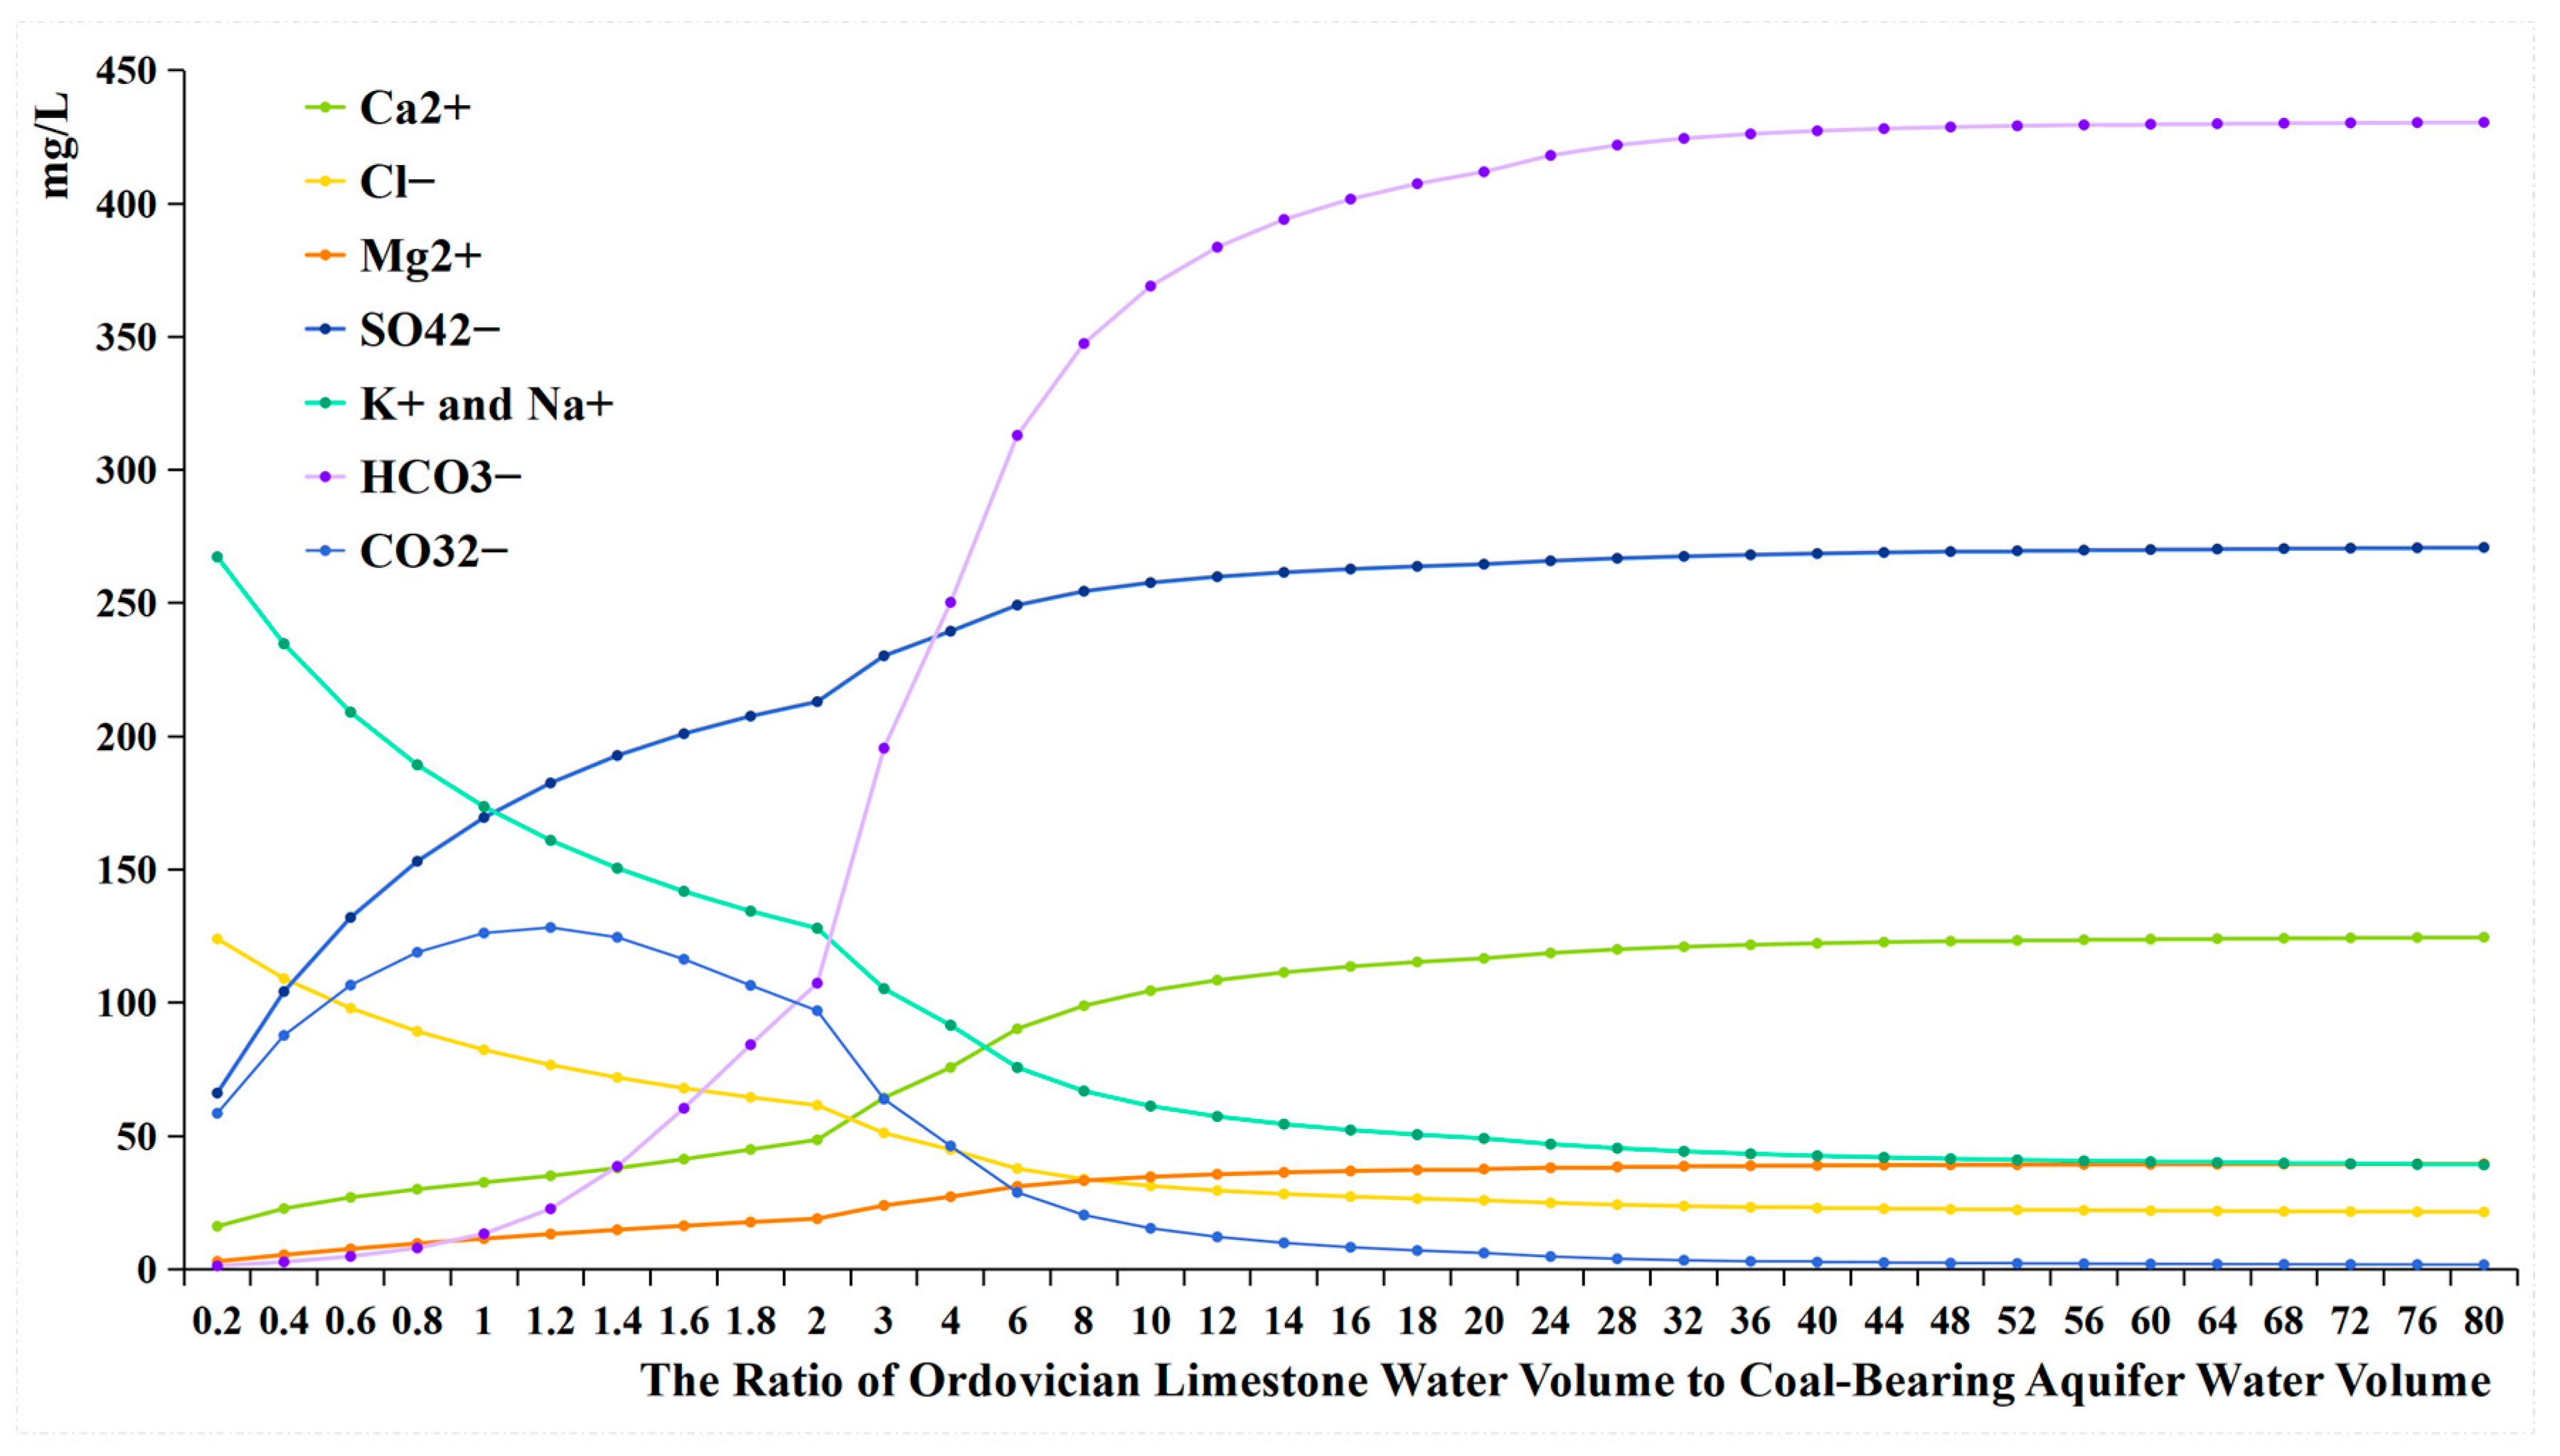
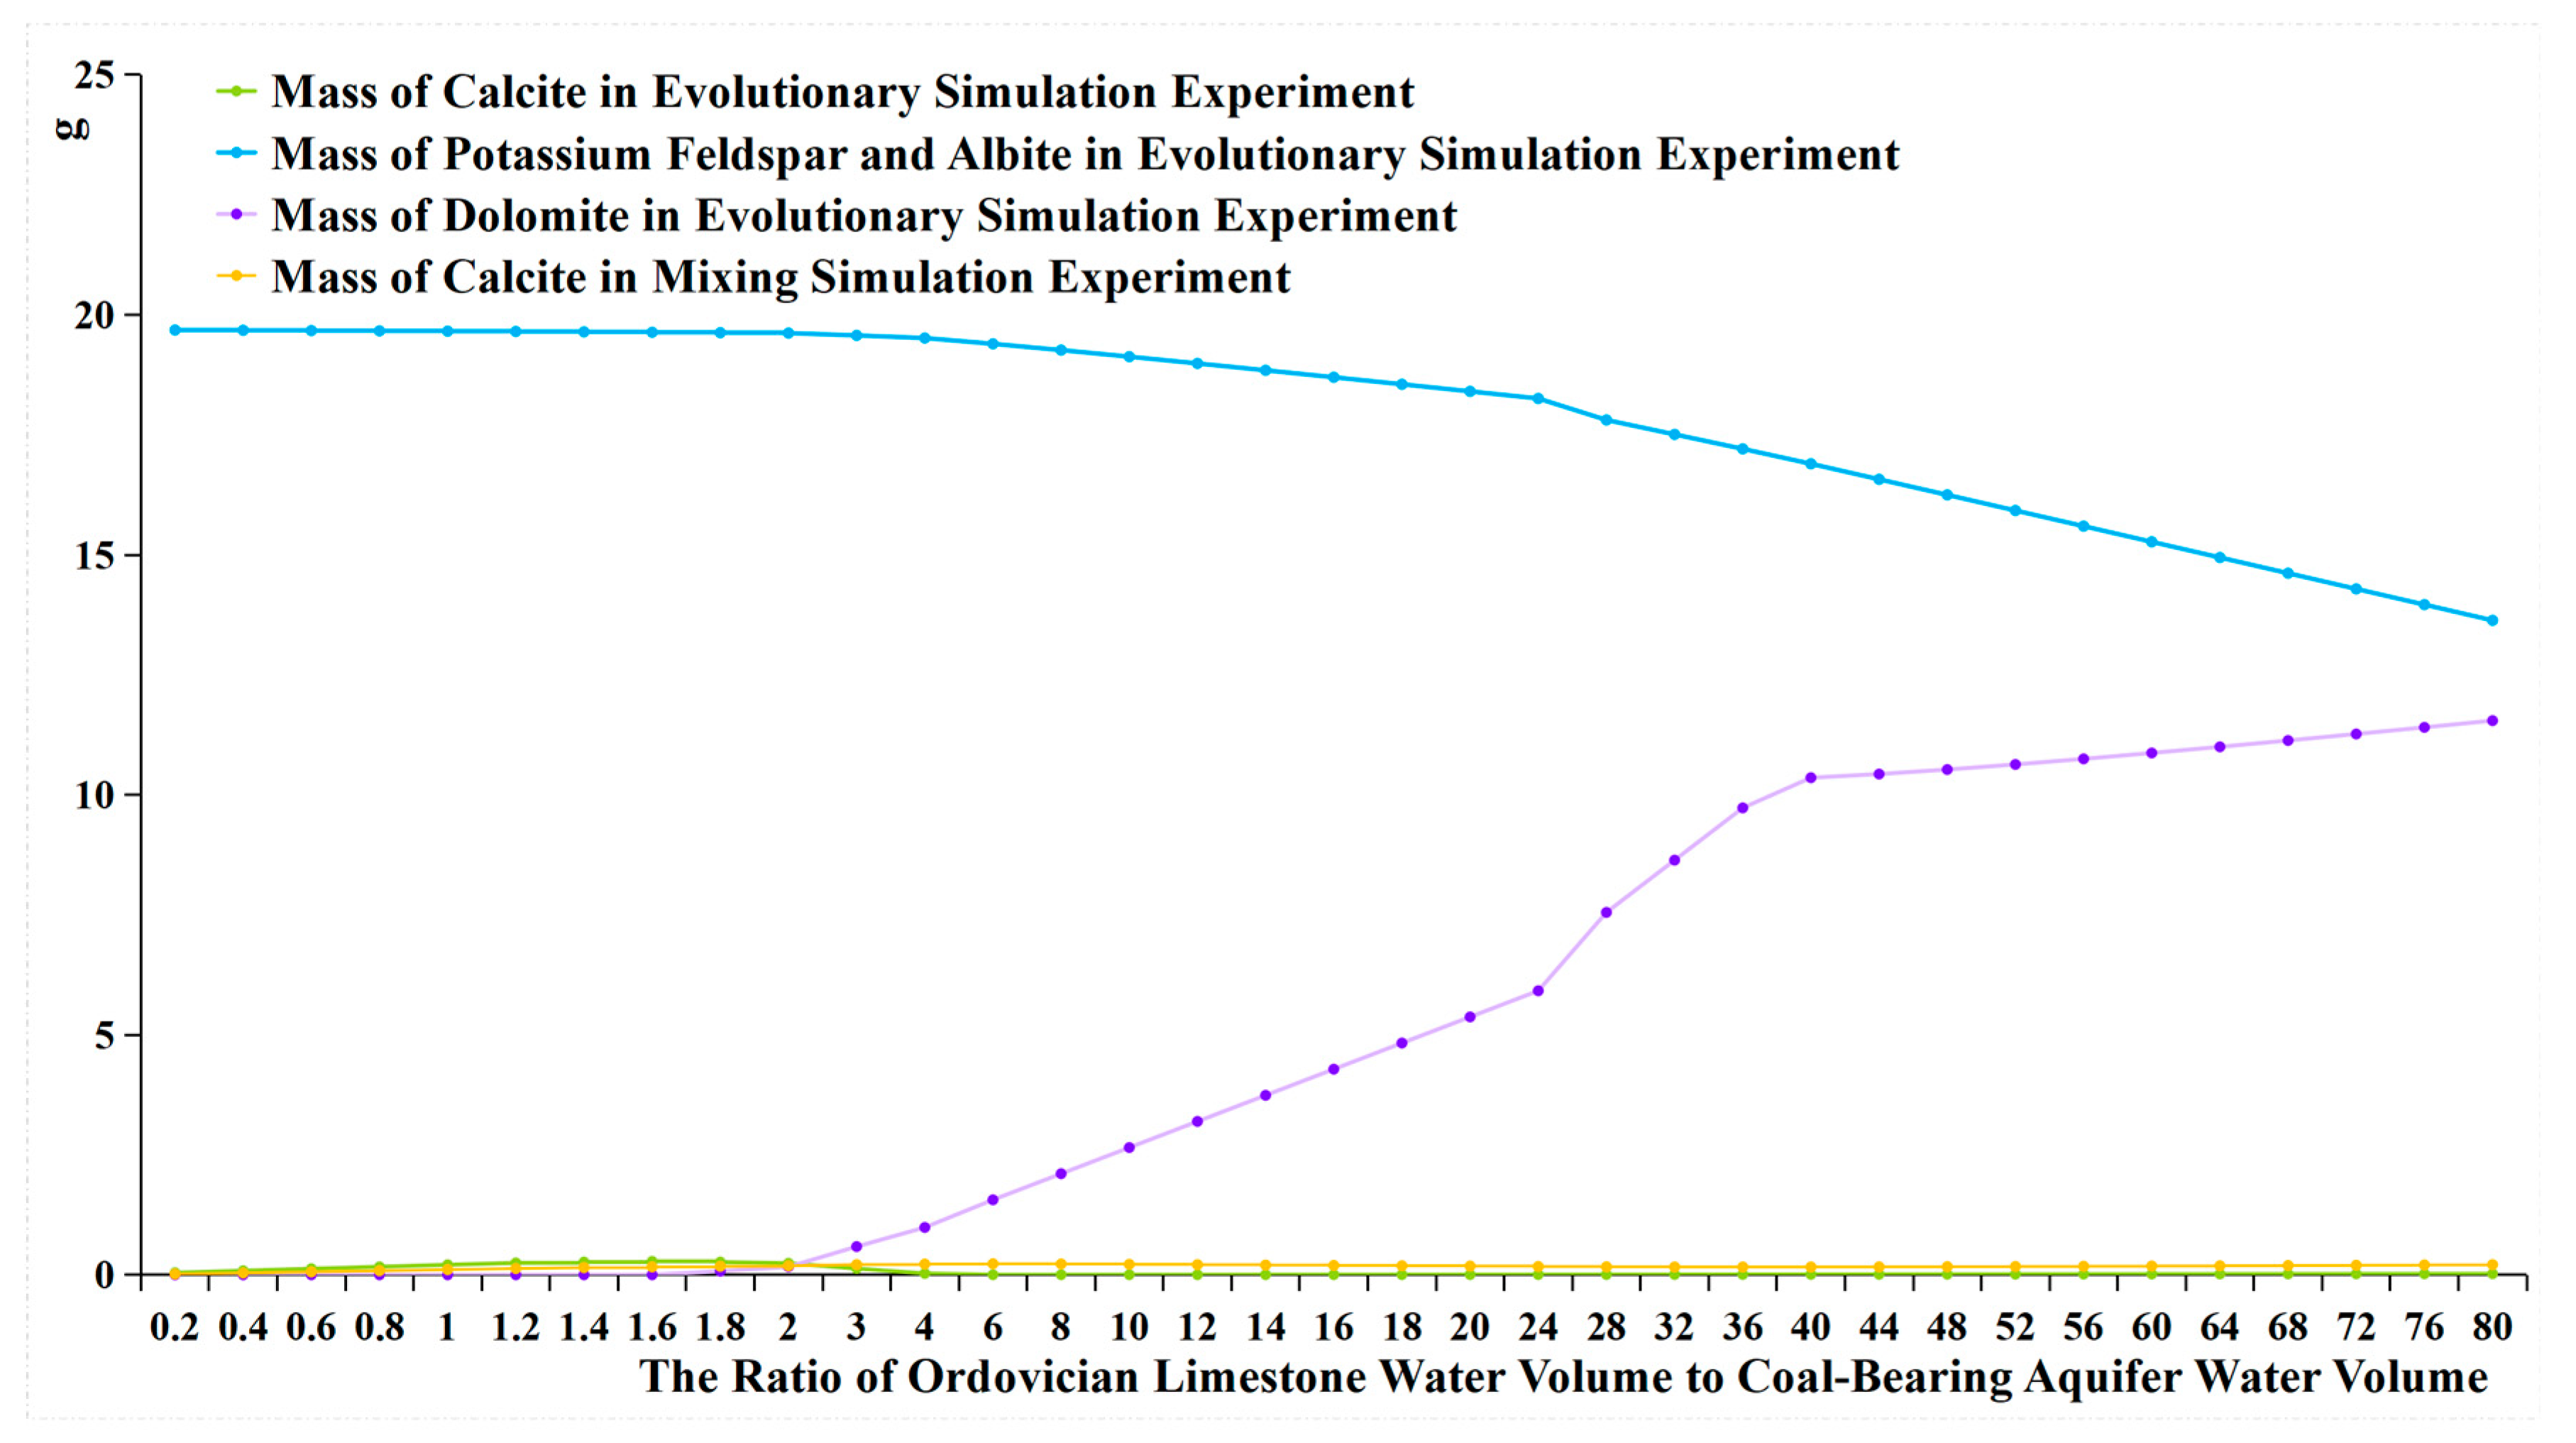
The concentrations of each ion in the water quality evolutionary simulation experiment are shown in Figure 9, while the concentrations of each ion in the water quality mixing simulation experiment are shown in Figure 10. The mass of each component of the rock samples in the two sets of experiments is illustrated in Figure 11. Two types of simulations were performed with 41 sets of experiments, respectively, corresponding to different ratios of water volumes between the Ordovician limestone aquifer and coal-bearing aquifer. Therefore, the horizontal axes in the three figures are identical. The vertical axes in Figure 9 and Figure 10 are identical, representing the ion concentrations in water during the two types of simulation experiments, with units of mg/L. The vertical axis in Figure 11 represents the mass of solid phases output from the two simulation experiments, with units of g.
(1)
The similarities between the two sets of experiments:
In both sets of simulation experiments, as the volume of Ordovician limestone water increases, the overall concentrations of Ca2+ and Mg2+ increase, while the concentrations of K+ and Na+ decrease. Additionally, the concentration of Cl decreases, while the concentration of SO42− increases. The water quality becomes increasingly similar to that of Ordovician limestone water.
In both sets of experiments, the concentration of CO32− initially increases and then decreases. Initially, when a small amount of Ordovician limestone water is introduced, the concentration of HCO3- is higher, while the concentration of CO32− and Ca2+ is lower.
Under the same proportion of Ordovician limestone water to coal-bearing aquifer water, the concentrations of Cl and SO42− are essentially the same in both sets of experiments.
(2)
The differences between the two sets of experiments:
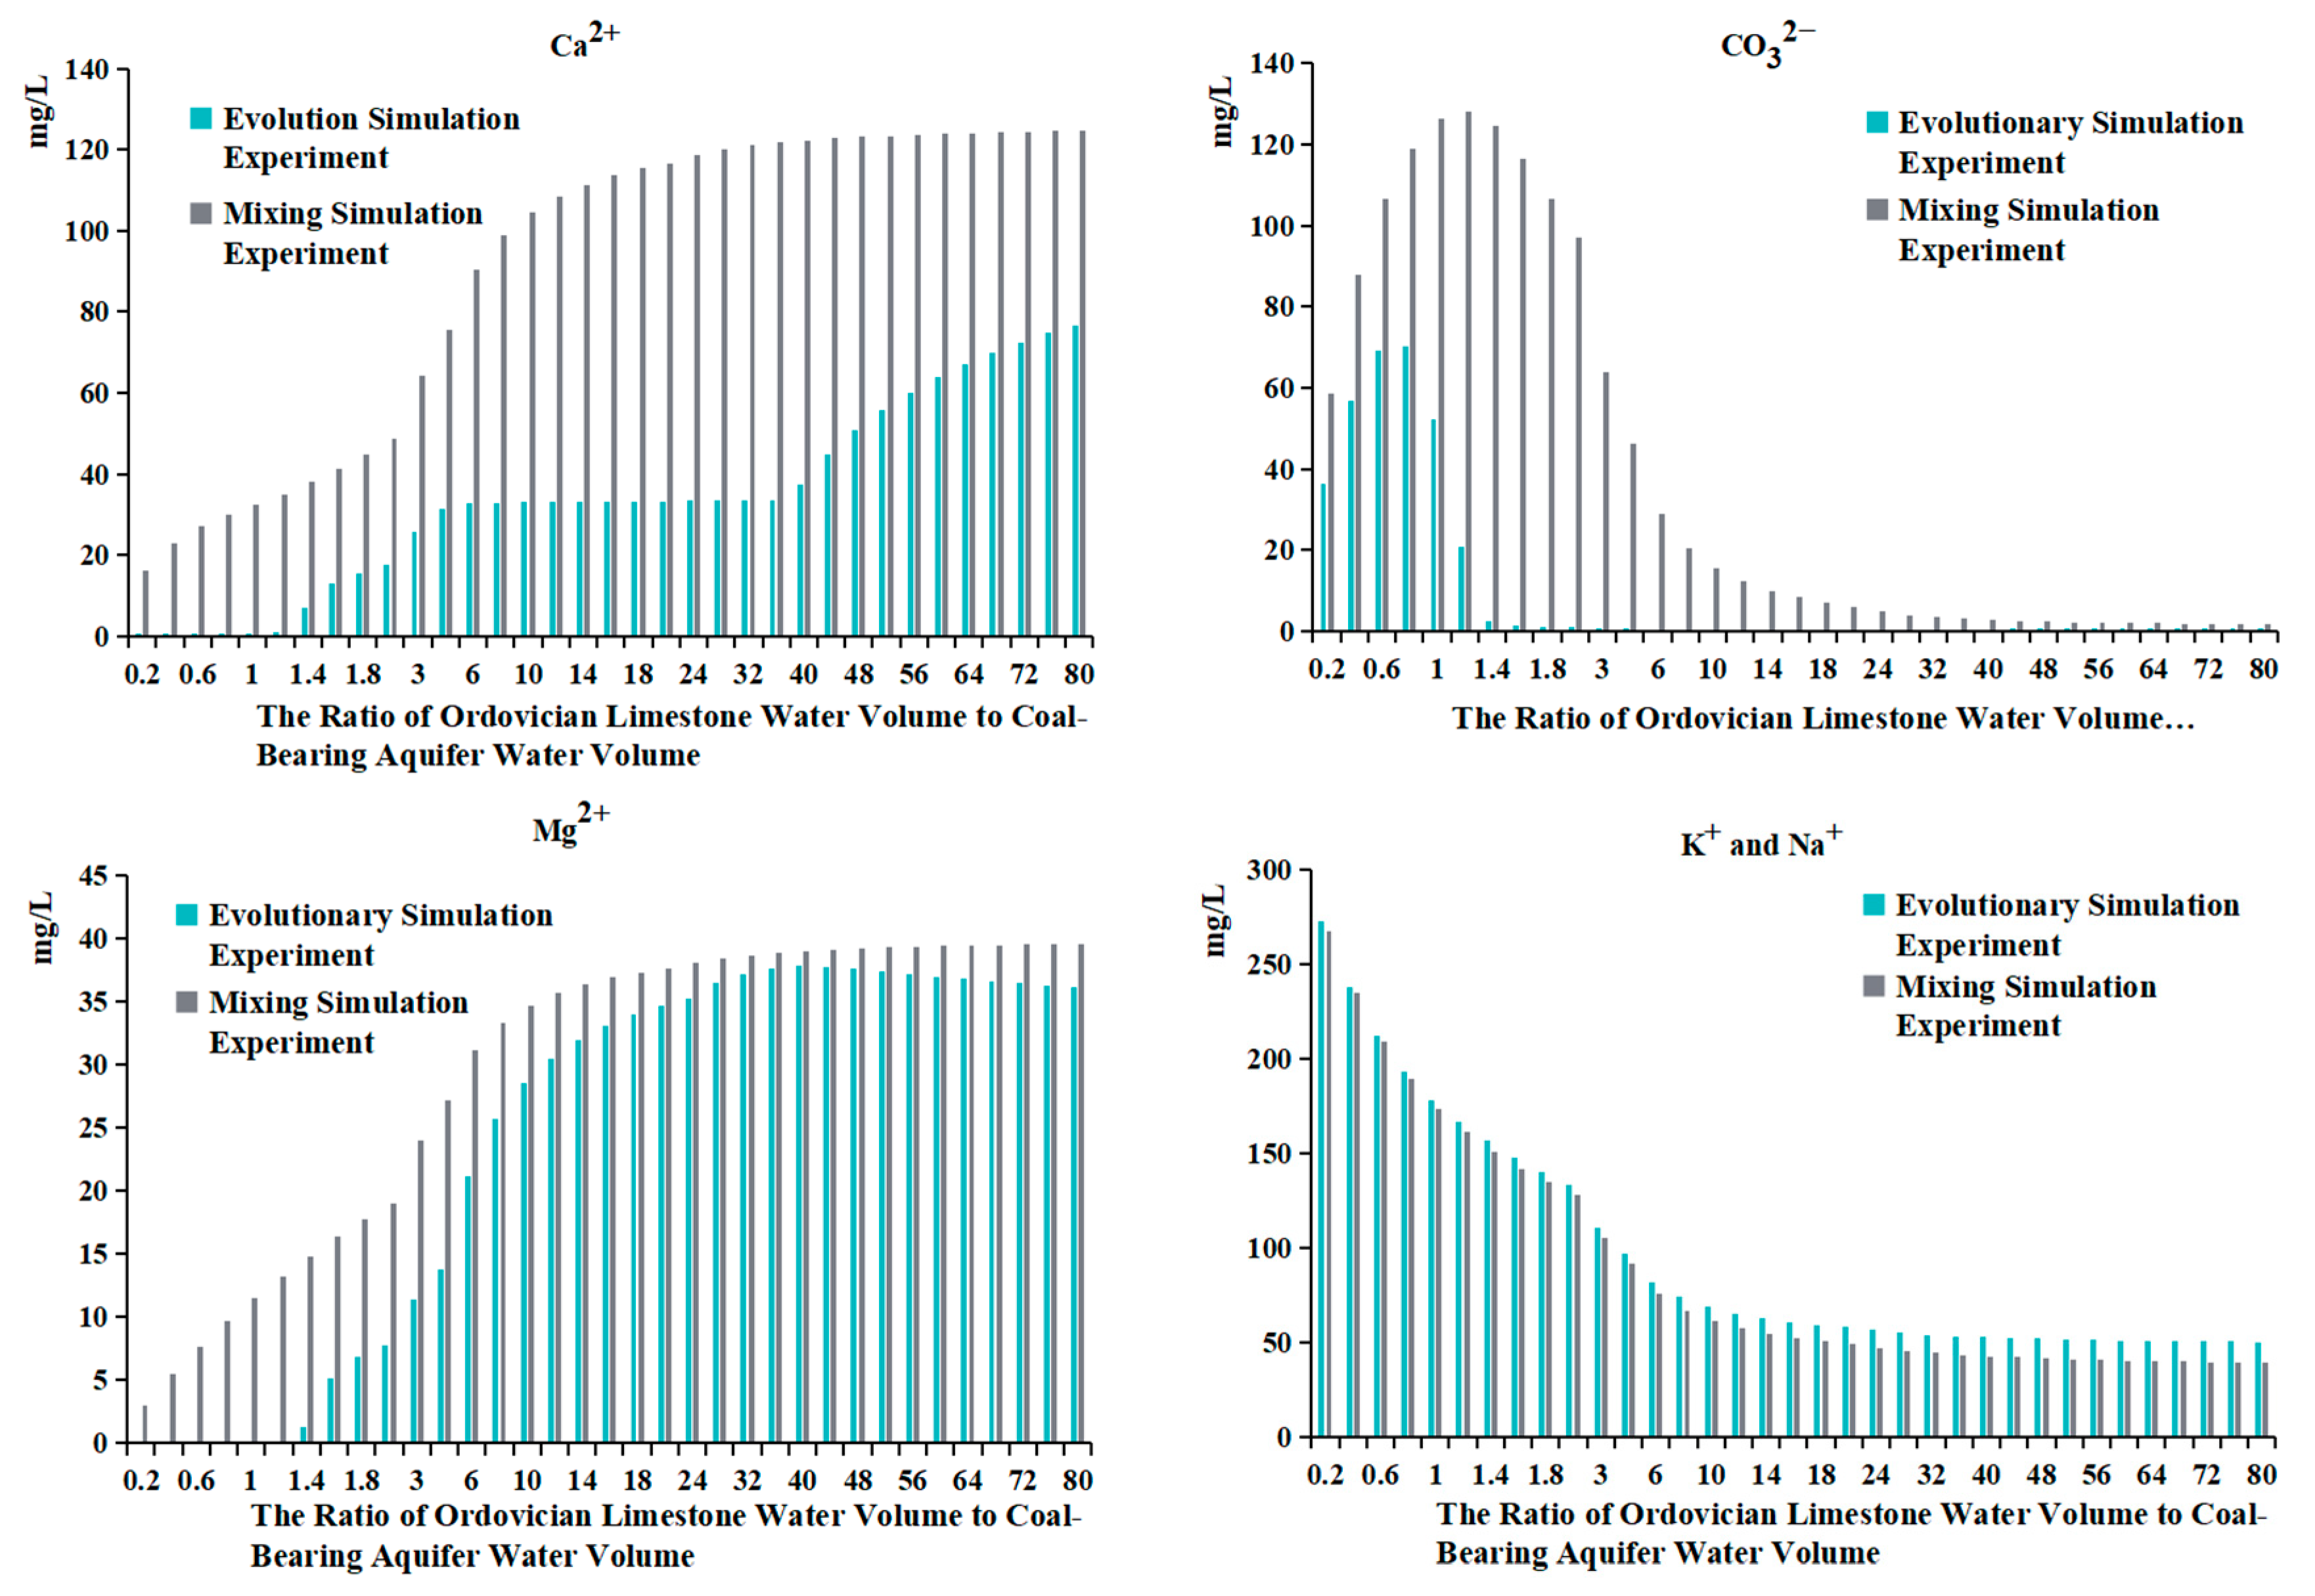
As shown in Figure 12, under the same proportion of Ordovician limestone water to coal-bearing aquifer water, the mixing simulation experiment exhibits higher concentrations of Ca2+, Mg2+, and CO32− and lower concentrations of K+ and Na+.
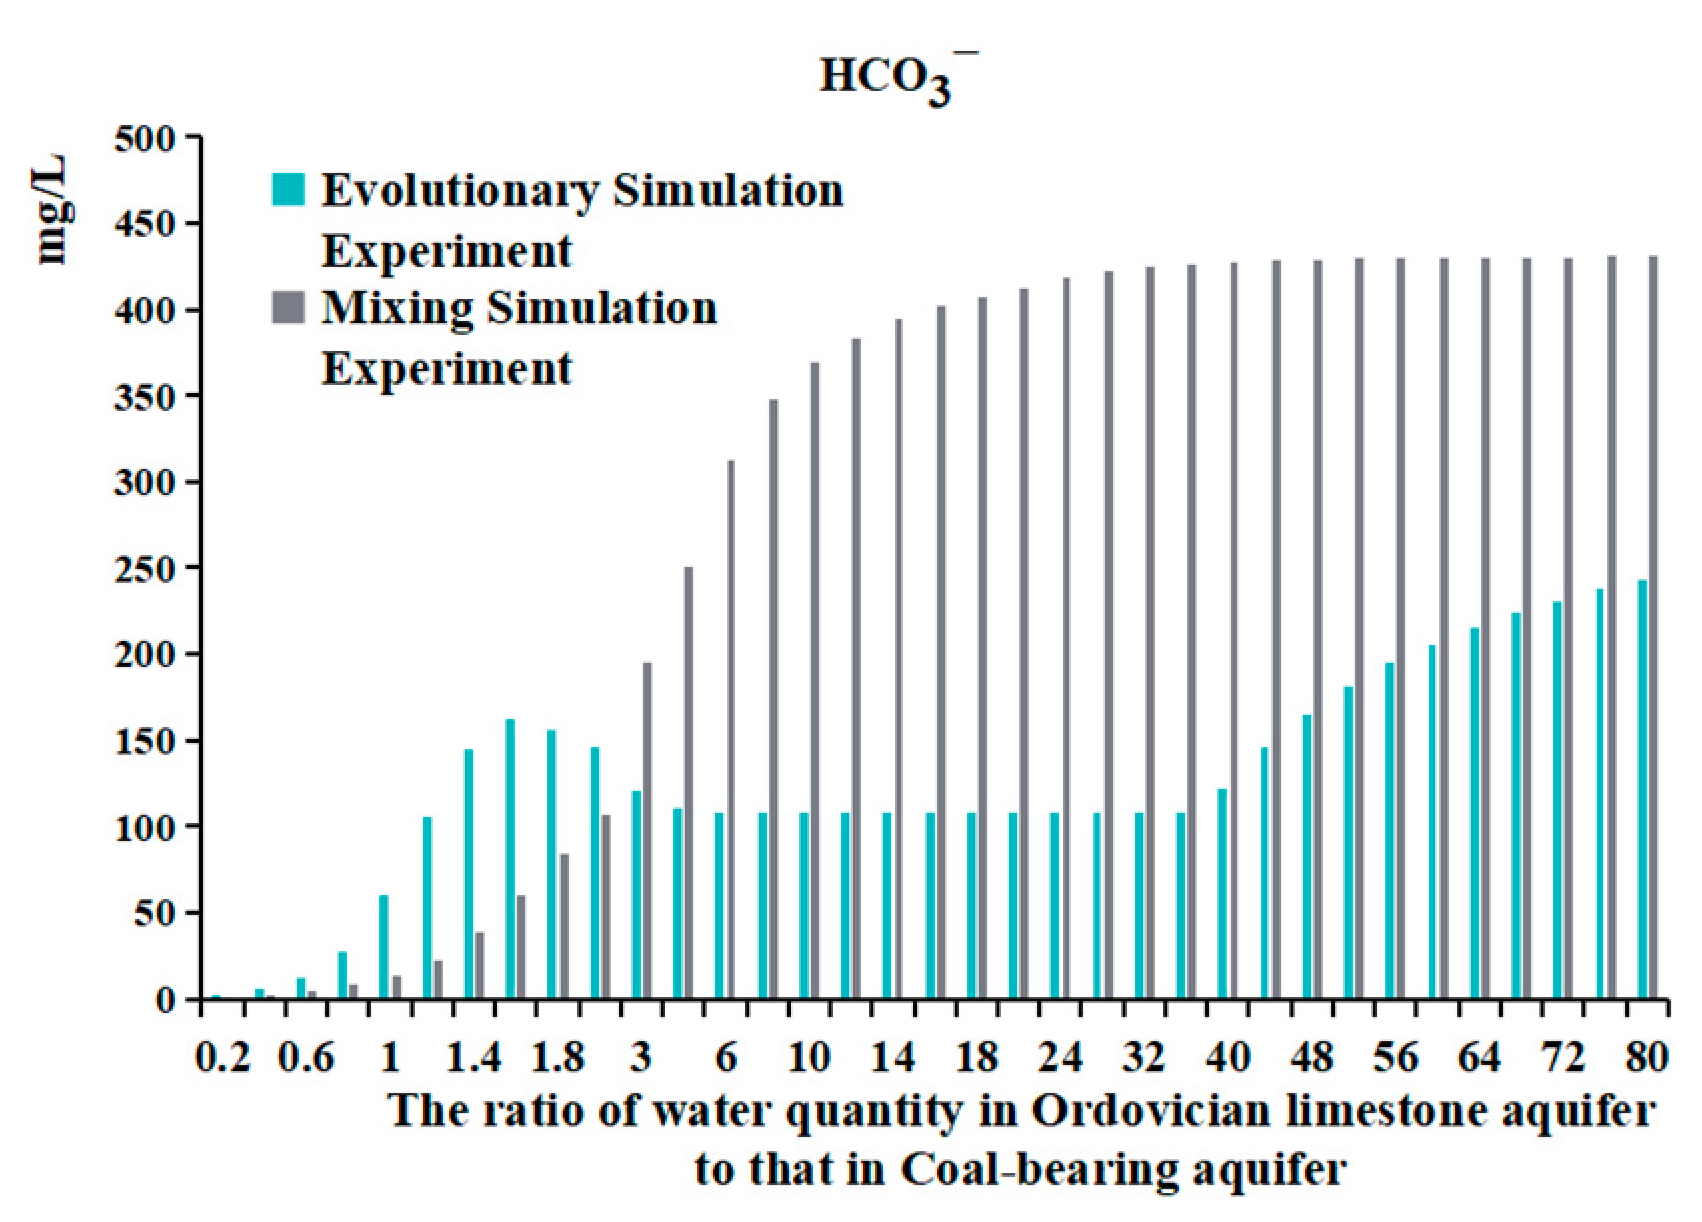
As shown in Figure 13, with the volume of Ordovician limestone water increases, in the evolutionary simulation experiment, the concentration of HCO3 initially increases then decreases, followed by a period of stability, and finally it increases again. In the mixing simulation, the concentration of HCO3 gradually increases.
As the volume of Ordovician limestone water increases, in the evolutionary simulation experiments, the mass of potassium feldspar and albite decreases, while the mass of calcite initially increases and then decreases. The mass of dolomite begins to increase when the ratio of Ordovician limestone water to coal-bearing aquifer water is 1.6 and continues to increase with increasing volume of Ordovician limestone water. In the mixing simulation experiment, only calcite is generated, with no other rock sample components being produced.

5. Discussion

Based on the results of the two different experiments, combined with the actual situation of the mine, the following questions are discussed:

5.1. The Differences in Hydrochemical Reactions between the Evolutionary Simulation Experiment and the Mixing Simulation Experiment

From the previous results, it can be observed that there are significant differences in the ions and precipitates present in the water between the mixing simulation experiment and the evolutionary simulation experiment. This suggests that the chemical reactions occurring in the two experiments are also different.
In the evolutionary simulation experiment, as the volume of mixed water increases, the concentrations of various ions are influenced by both chemical reactions and the volume of water. This can be observed through changes in the mass of potassium feldspar and albite, dolomite, and calcite, or by comparing the results with those of the mixing simulation experiment to explore hydrochemical reactions.
(1)
Comparing the ion concentration graphs of the evolutionary simulation experiment and the mixing simulation experiment reveals that, initially, when Ordovician limestone water is introduced, the pH-neutral Ordovician limestone water supplements the alkaline coal-bearing aquifer water. As a result of pH influence, the concentration of HCO3 is initially low, with a large amount of HCO3 converting to CO32−, leading to the precipitation of oversaturated CO32− with Ca2+ to form calcite. Therefore, in both graphs, the early introduction of Ordovician limestone water is characterized by high CO32− concentration and low concentrations of HCO3 and Ca2+ (Table 6);
(2)
When the water source ratio is between 0.2 and 0.8, the amount of calcite generated in the two sets of experiments is basically similar. However, in the evolutionary simulation experiment, the concentrations of Ca2+ and Mg2+ are lower compared to those in the mixing simulation experiment (Table 7). This indicates that cation exchange adsorption occurs in the evolution simulation. Different cations have different affinities for adsorption onto the rock surface, in the order of Ca2+ > Mg2+ > K+ > Na+. When Ordovician limestone water with mainly Ca2+ and Mg2+ enters the coal-bearing aquifer, which predominantly adsorbs Na+ and K+, Ca2+ and Mg2+ in the water replace some of the Na+ and K+ adsorbed by the coal-bearing aquifer rocks. The concentrations of K+ and Na+ and the amount of potassium and albite also reflect the occurrence of cation exchange adsorption. During the process of change from a water source ratio of 0.2 to 1.6, the concentrations of K+ and Na+ in the evolutionary simulation experiment are higher than those in the mixing simulation experiment. However, during this process, the amount of potassium feldspar and albite does not decrease, indicating that the higher concentrations of K+ and Na+ are not due to the dissolution of potassium feldspar and albite, but rather due to cation exchange adsorption, where Ca2+ and Mg2+ replace some of the Na+ and K+ adsorbed by the coal-bearing aquifer rocks. In fact, from a water source ratio of 1.6 to 80, the mass of potassium feldspar and albite decreases, as the concentration of K+ and Na+ in the solution decreases, leading to the dissolution of potassium feldspar and albite, supplying K+ and Na+ to the water;
(3)
It can be observed that from a water source ratio of 1.6 to 40, in the evolutionary simulation experiment, calcite decreases while dolomite increases, and the concentration of HCO3 initially increases then decreases, stabilizes for a period, and then increases again. In contrast, in the mixing simulation experiment, the concentration of HCO3 continuously increases, while calcite does not decrease, and no dolomite is generated. It is possible that dolomitization occurs in the evolution simulation, where calcite undergoes transformation into dolomite under certain Mg2+ and Ca2+ ratios. Dolomitization involves several steps, including calcite → magnesian calcite → high-calcium dolomite → low-calcium dolomite → dolomite transformation, and it is influenced by various factors such as fluid dynamic conditions and the Mg2+/Ca2+ ratio [26]. There are four chemical reaction formulas that have been proposed for dolomitization in recent studies [27,28,29,30]. Generally, dolomitization is favored when the Mg2+/Ca2+ ratio is approximately 1.24 to 3.64 [27].
C a 2 + + M g 2 + + 2 C O 3 2 C a M g ( C O 3 ) 2
C a C O 3 + M g 2 + + C O 3 2 C a M g ( C O 3 ) 2
2 C a C O 3 + M g 2 + C a M g ( C O 3 ) 2 + C a 2 +
C a C O 3 + M g C O 3 C a M g ( C O 3 ) 2
  • The ratio of Mg2+ molar concentration to Ca2+ molar concentration in the two sets of experiments is shown in Figure 14 and Table 8. In the evolutionary simulation experiment, as the water source ratio increases from 1.6 to 36, the concentration ratio of Mg2+ to Ca2+ increases. The ratio reaches its maximum between a water source ratio of 24 and 40 and then decreases from a water source ratio of 40 to 80. Comparing this with the composition of rock samples, from a water source ratio of 1.6 onwards, there is a gradual increase in dolomite in the evolution simulation. The maximum increase in dolomite is observed between a water source ratio of 24 and 40, after which the increase diminishes from a water source ratio of 40 to 80. In contrast, in the mixing simulation experiment, the molar ratio of Mg2+ to Ca2+ remains consistently low, indicating the absence of dolomite formation.
  • The changes in HCO3 concentration also illustrate the process of dolomitization. In the evolutionary simulation experiment, the HCO3 concentration continuously increases, then gradually decreases, and then stabilizes from a water source ratio of 1.6 to 40. This trend similarly reflects the process of dolomitization, where HCO3 continuously converts to CO32−, complementing the dolomitization process;
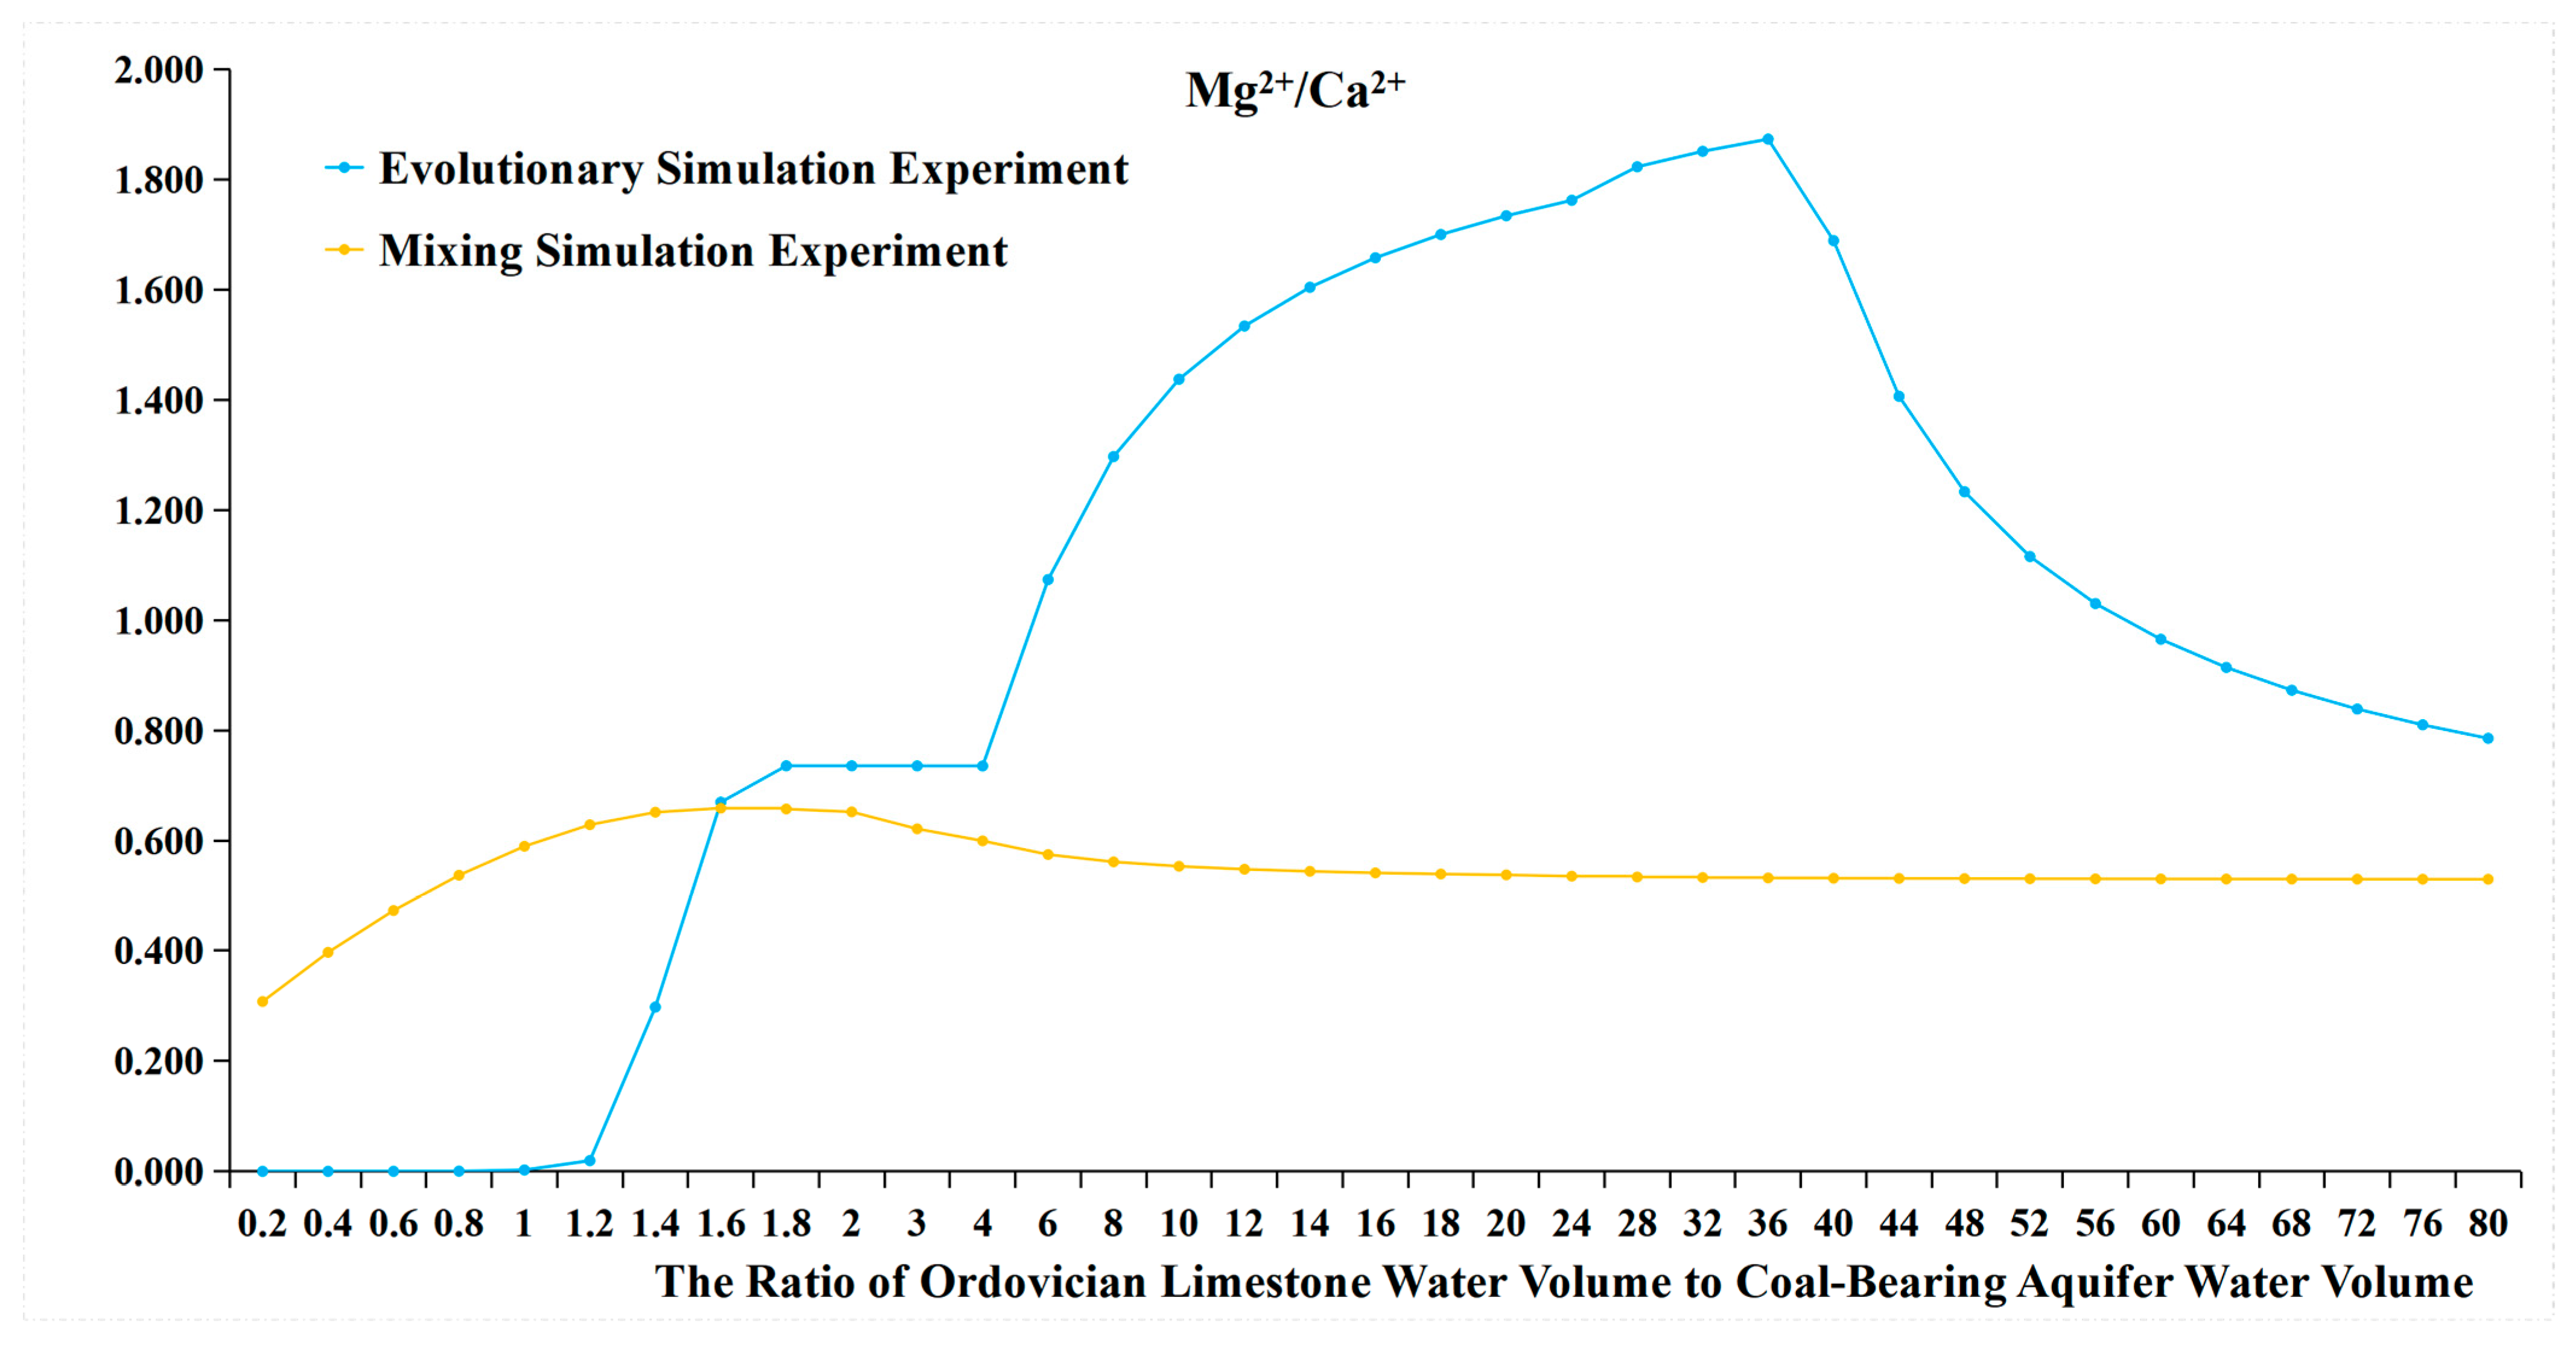
Figure 14. The molar concentration ratio of Mg2+ to Ca2+.
Water 16 02506 g014
(4)
Only the precipitation of calcite occurs in the mixing simulation experiment, while the evolutionary simulation experiment involves more complex hydrochemical reactions, such as the precipitation of calcite, cation exchange adsorption, and dolomitization. The mechanism of hydrochemical reactions is illustrated in Figure 15.

5.2. Hydrochemical Reactions and Water Source Proportions at Mine Water Discharge Points

By comparing the ion concentrations in the water from the 8# Coal-Bearing Aquifer Observation Borehole, 9# Coal-Bearing Aquifer Observation Borehole, 10# Coal-Bearing Aquifer Observation Borehole, and 11# Coal-Bearing Aquifer Observation Borehole with the diagram of the concentration of each ion in the evolutionary simulation experiment and the diagram of the concentration of each ion in the mixing simulation experiment, it was found that the water source proportions of the four discharge points could not be determined from the mixing simulation experiment. However, the proportions could be determined from the evolutionary simulation experiment. This indicates that the anomalous water discharge points experienced evolution rather than just mixing. By comparing the ion concentration diagram with the ion concentrations in the four coal-bearing aquifers with anomalous ion concentrations, it was determined that the ratio of Ordovician limestone water to coal-bearing aquifer water in the 8# Coal-Bearing Aquifer Observation Borehole is between 1:1 and 1.2:1; in the 9# Coal-Bearing Aquifer Observation Borehole, the ratio is between 56:1 and 60:1; in the 10# Coal-Bearing Aquifer Observation Borehole, the ratio is between 64:1 and 68:1; in the 11# Coal-Bearing Aquifer Observation Borehole, the ratio is between 48:1 and 52:1.

5.3. Analysis of Different Reasons for the Proportion of Ordovician Limestone Water in Typical Discharge Points

The recharge of the coal-bearing aquifer by Ordovician limestone water involves multiple mechanisms of water inrush. However, in all cases, the Ordovician limestone water acts as the source of the inrush, supplying the coal-bearing aquifer through water-conducting channels. The main water-conducting channels include karst collapse pillars, fault structures, mining-induced fractures, and poorly closed boreholes [31].
The outcomes of water quality evolutionary simulations reveal that the 9#Coal-Bearing Aquifer Observation Borehole, 10#Coal-Bearing Aquifer Observation Borehole, and 11#Coal-Bearing Aquifer Observation Borehole exhibit a higher proportion of Ordovician limestone water content compared to the 8#Coal-Bearing Aquifer Observation Borehole, suggesting the presence of stronger water-conducting channels in their vicinities. This finding is supported with empirical data, which indicate the existence of collapse pillars near the locations of the 9#Coal-Bearing Aquifer Observation Borehole, 10#Coal-Bearing Aquifer Observation Borehole, and 11#Coal-Bearing Aquifer Observation Borehole. These collapse pillars demonstrate hydroconductivity, facilitating the infiltration of Ordovician limestone water into the coal-bearing aquifers. Historical records of the mining area reveal that the 8#Coal-Bearing Aquifer Observation Borehole was once connected to the Ordovician limestone aquifer, but this connection was subsequently sealed by the coal mine. However, this suggests the possibility of inadequately sealed sections within the borehole, enabling Ordovician limestone water to infiltrate into the coal-bearing aquifer through these poorly sealed sections. Compared to poorly sealed boreholes, water-conducting collapse pillars serve as larger-scale water-conducting channels, allowing for a higher throughput of Ordovician limestone water. Consequently, the proportion of Ordovician limestone water is relatively small in the 8#Coal-Bearing Aquifer Observation Borehole and larger in the other three observation boreholes.
(1)
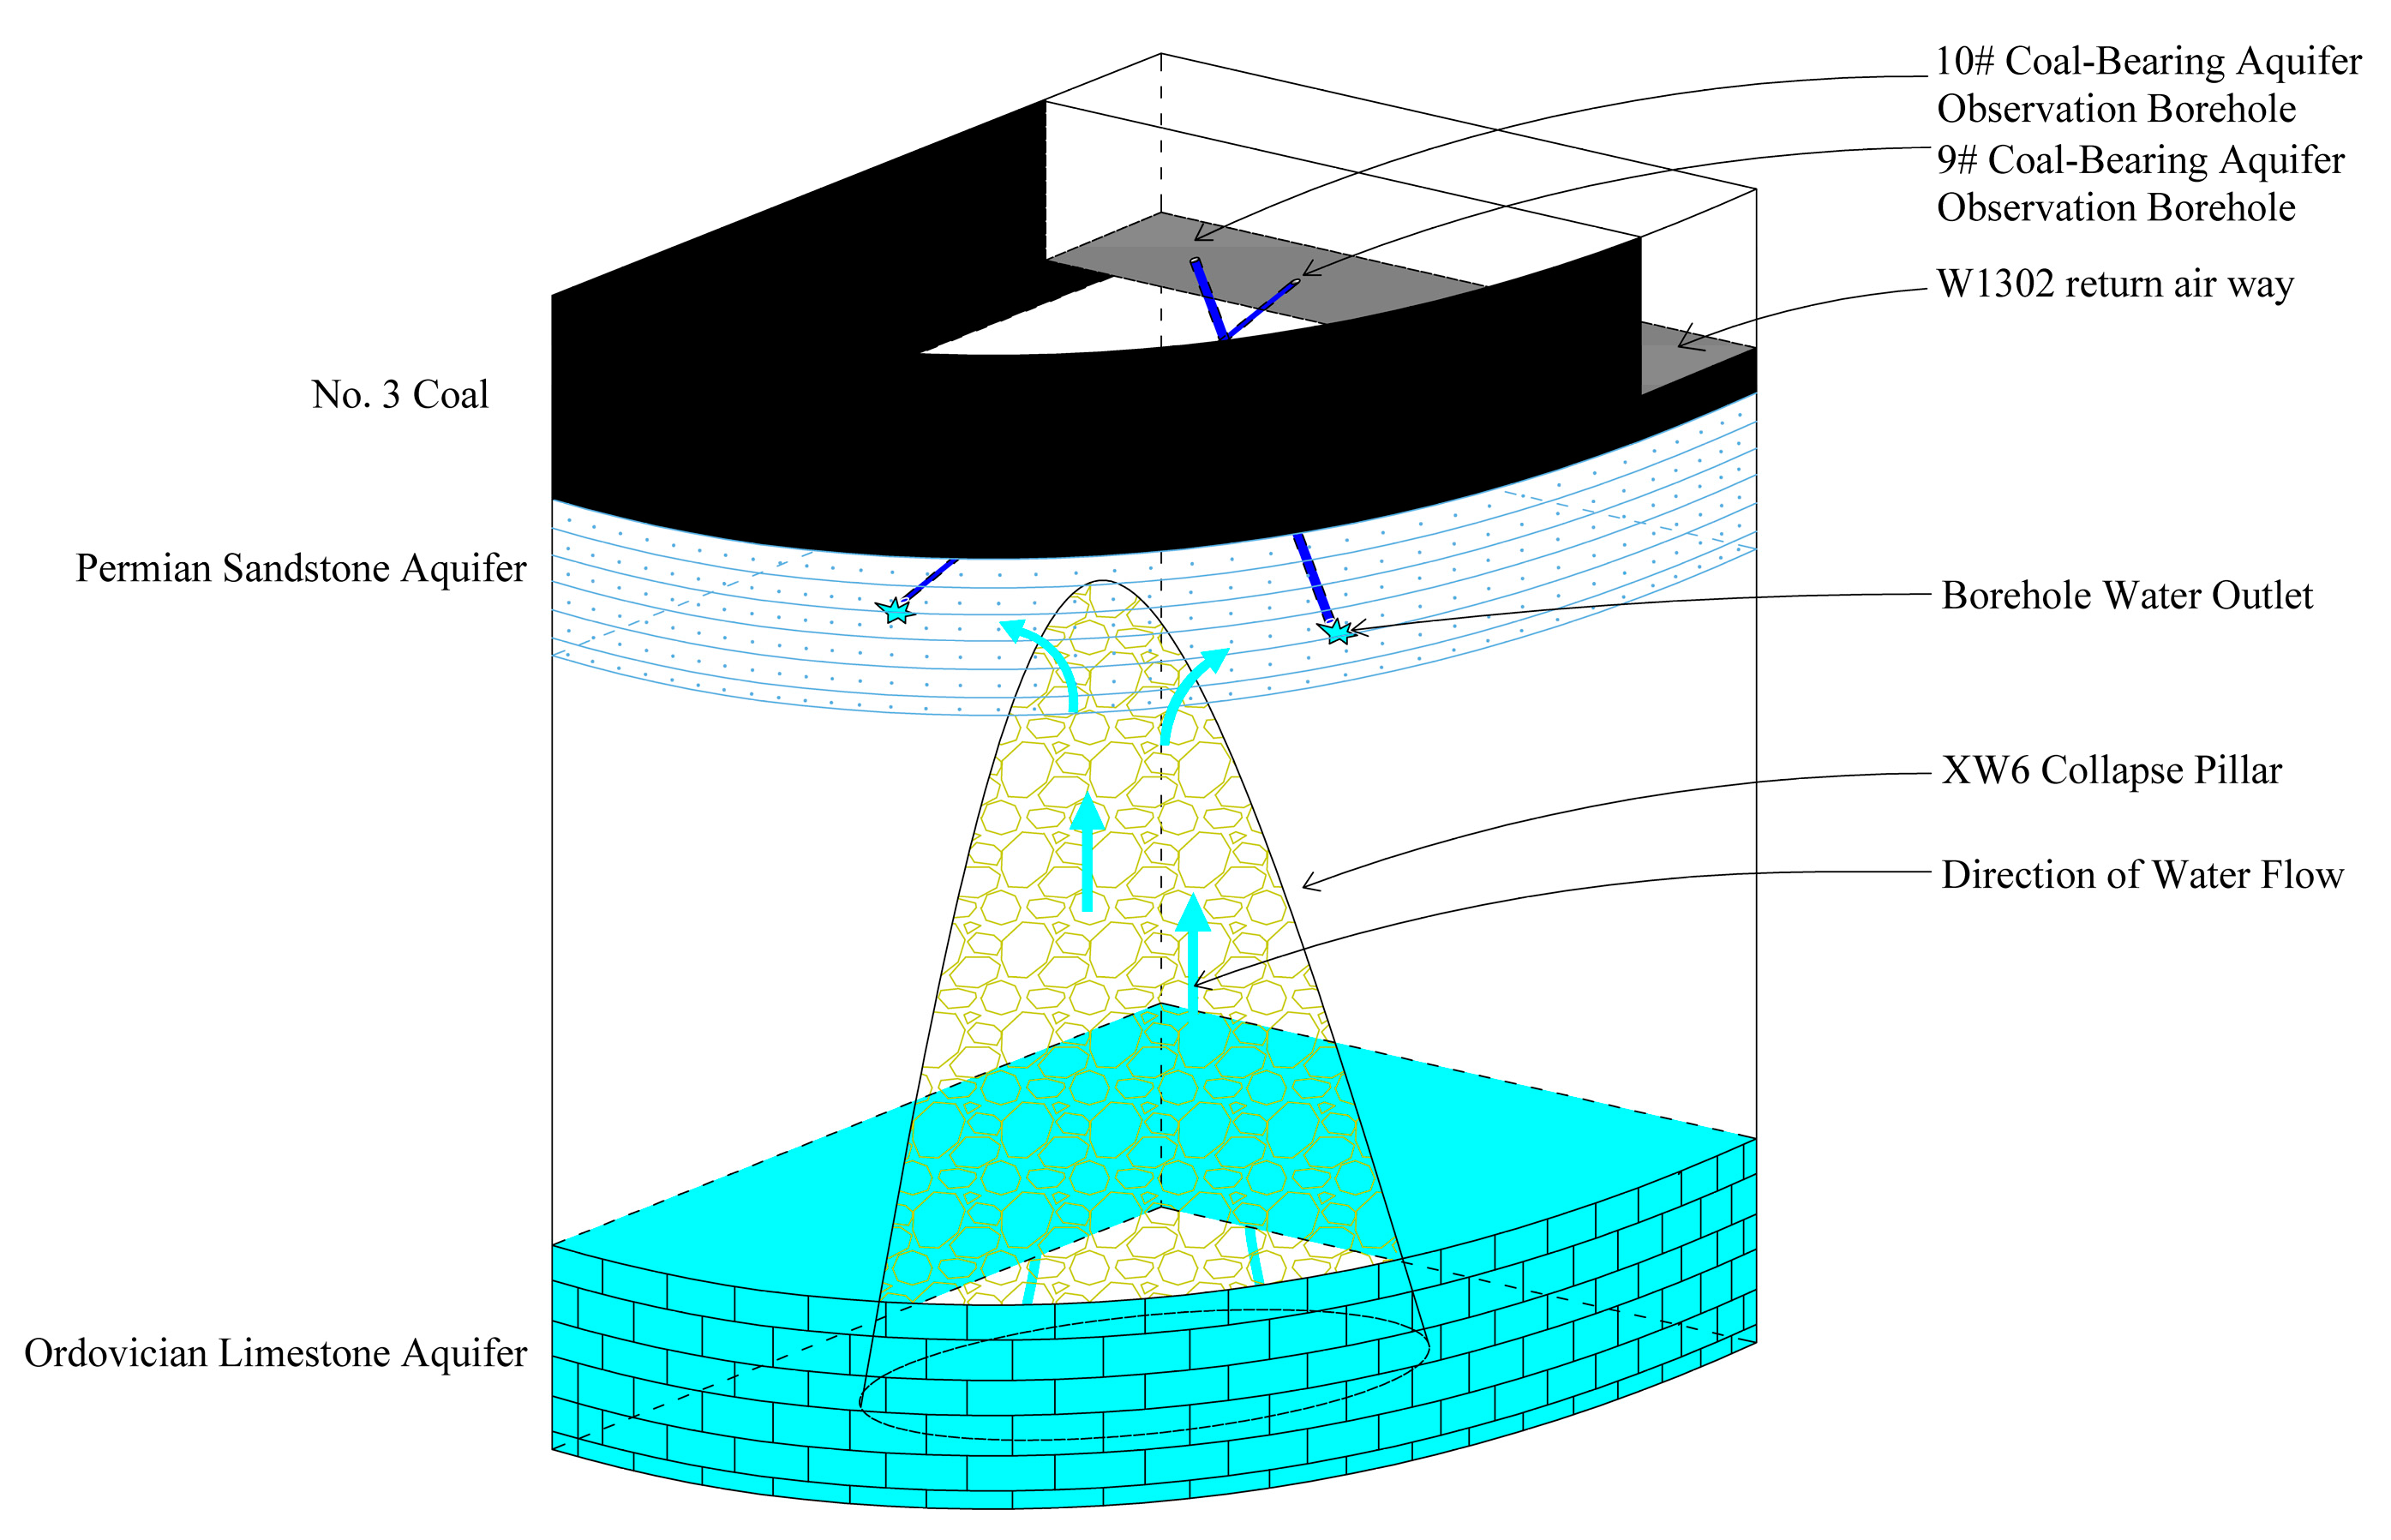
The Ordovician limestone water supplies the coal-bearing aquifer through water-conducting channels formed by collapse pillars.
Based on 3D seismic exploration data and ground transient electromagnetic detection, the Gaohe Coal Mine has preliminarily identified that the W1302 return air way is located within the predicted range of the XW6 collapse pillar. Furthermore, drilling investigations were conducted on the Permian sandstone aquifer beneath the 3# coal seam within the W1302 return air way, revealing water outflow in some boreholes, such as the 9# Coal-Bearing Aquifer Observation Borehole and 10# Coal-Bearing Aquifer Observation Borehole. As shown in Figure 16, Ordovician limestone water enters the coal-bearing aquifer through the XW6 collapse pillar, subsequently reacting with the coal-bearing aquifer water and surrounding rocks, resulting in abnormal water quality;
(2)
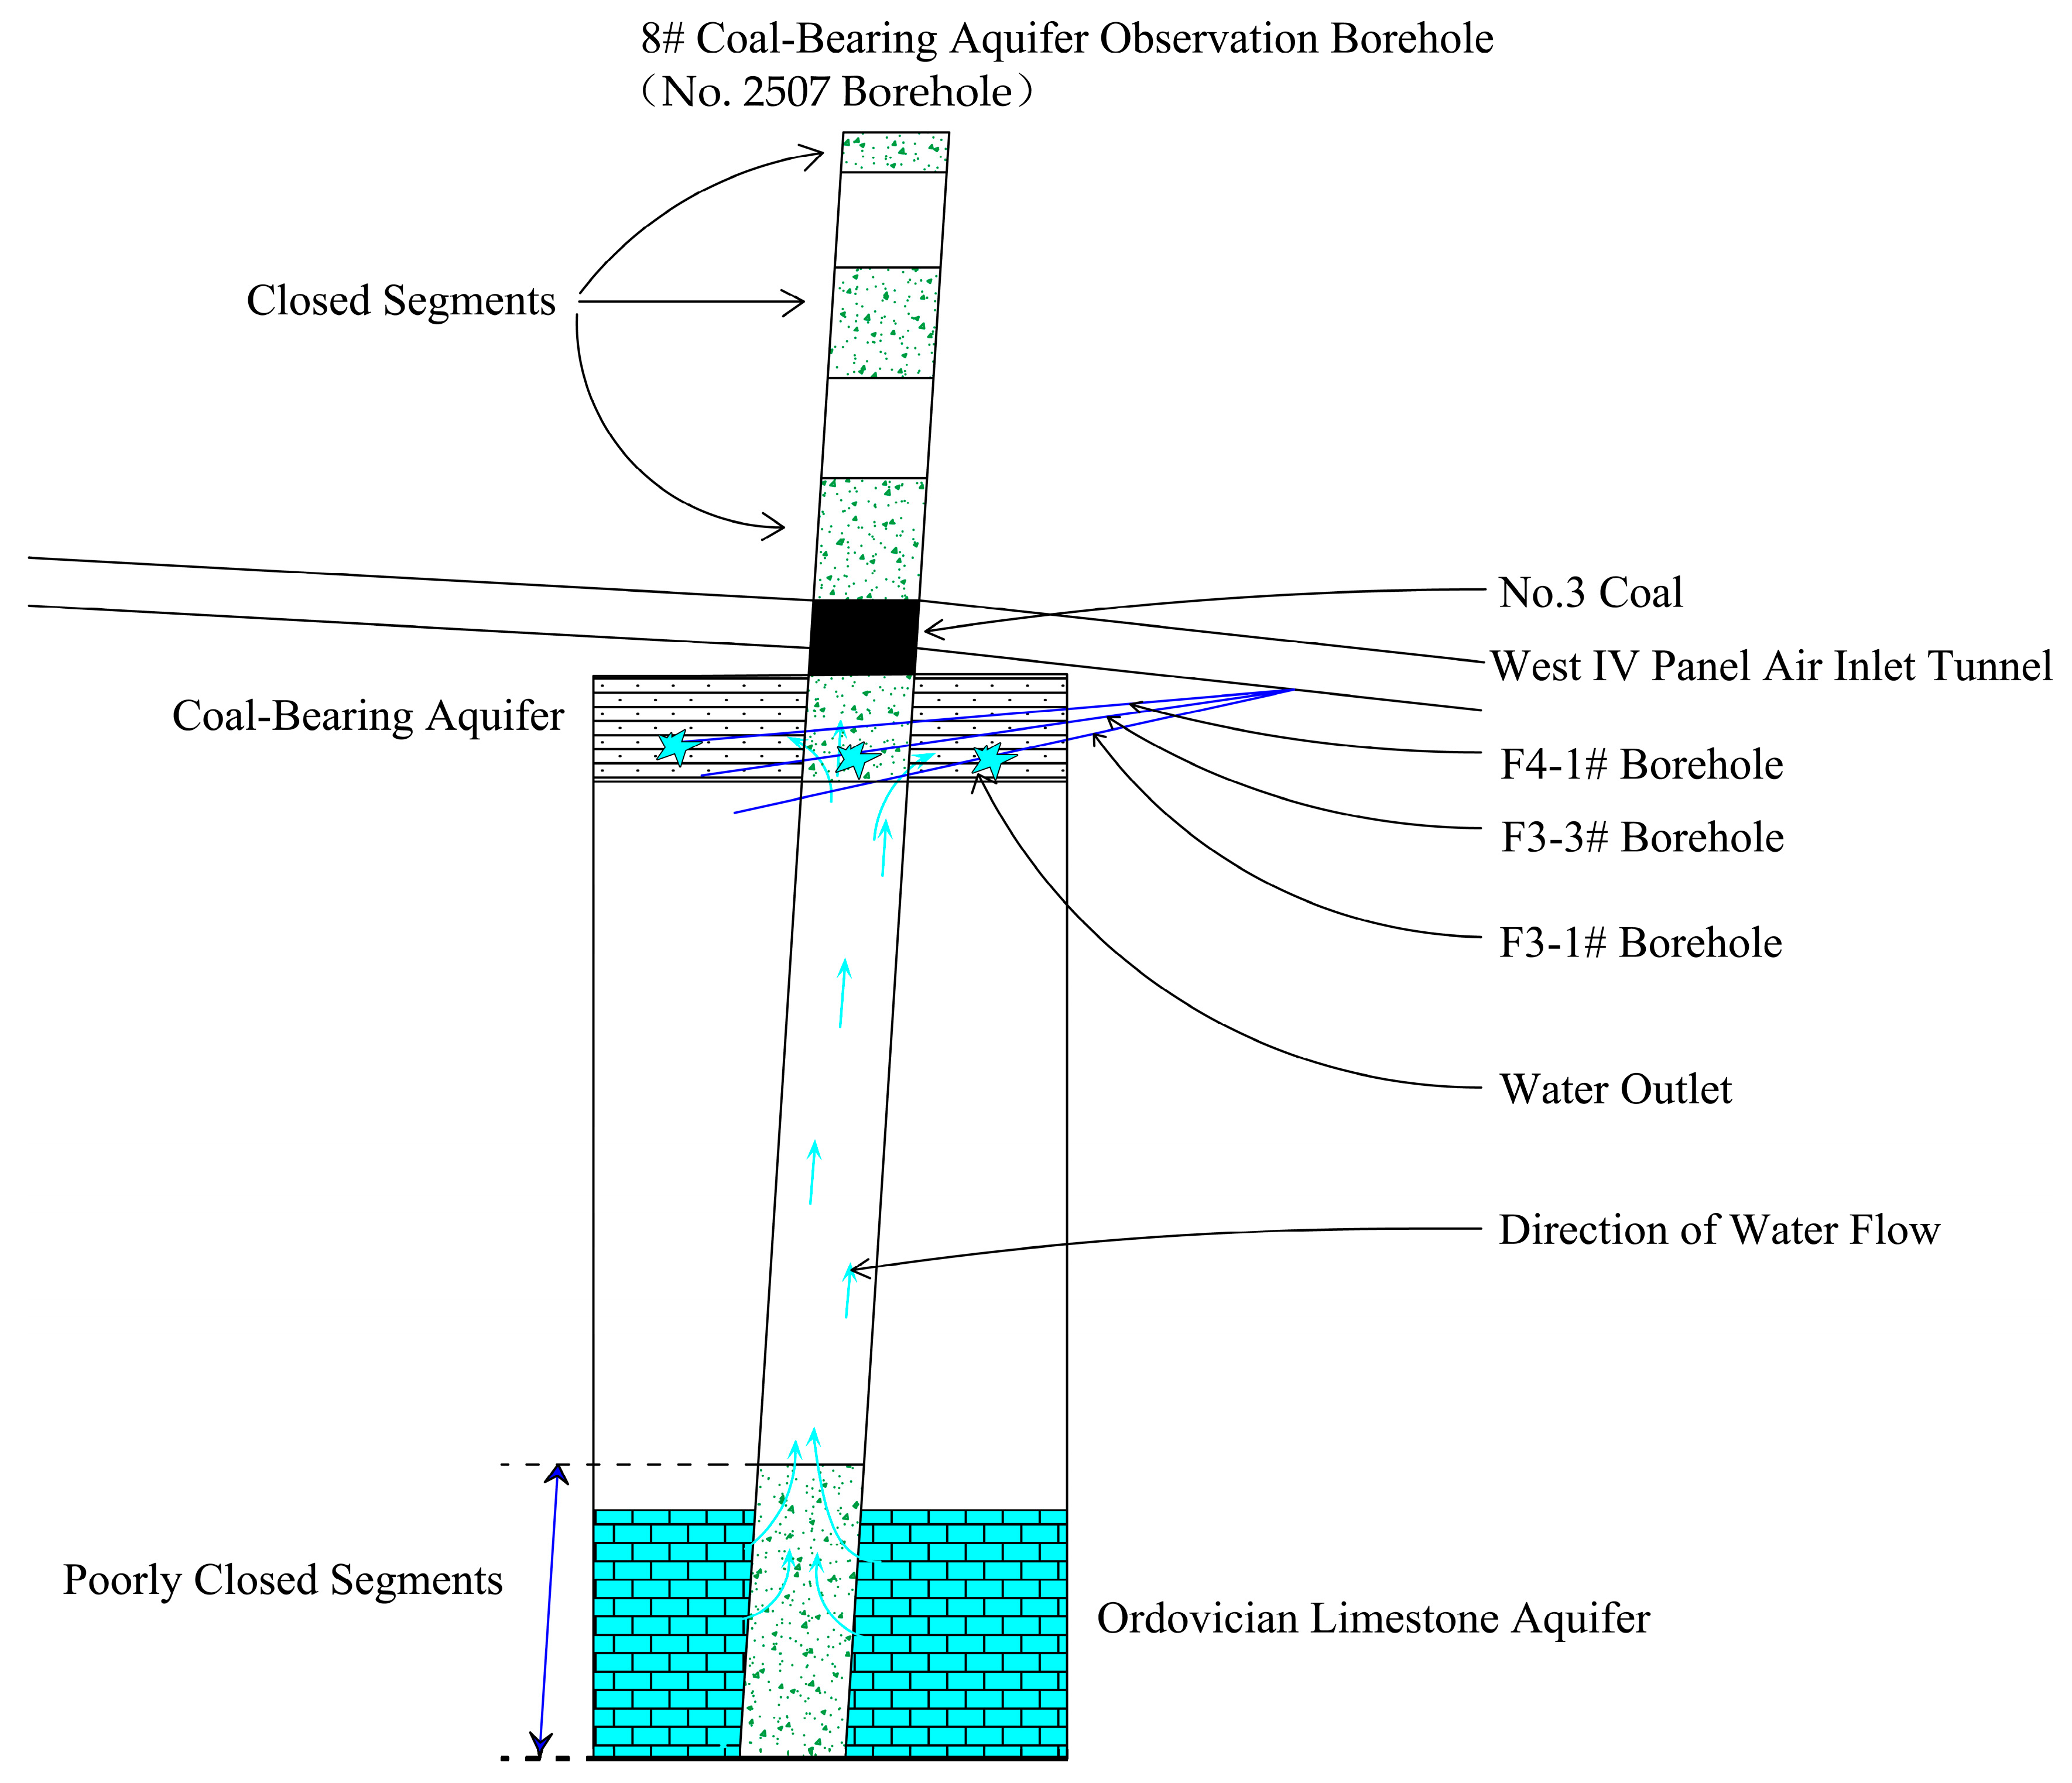
The Ordovician limestone water supplies the coal-bearing aquifer through water-conducting channels formed by poorly closed boreholes
The 8# Coal-Bearing Aquifer Observation Borehole corresponds to the No. 2507 Borehole in the mining area. In 2023, the Gaohe Coal Mine conducted advanced exploration of Borehole No. 2507 within the air intake roadway of the West Quaternary Panel, discovering water effusion in some of the exploratory boreholes, such as F3-1#, F3-3#, and F4-1#.
As depicted in the Figure 17, the No. 2507 Borehole of the Gaohe Coal Mine terminates in the Middle series of Ordovician Fengfeng Formation, which underwent sealing treatment years ago. This study indicates that poor sealing exists in the Ordovician limestone aquifer and the upper section of the No. 2507 Borehole, failing to effectively block water flow. Consequently, Ordovician limestone water infiltrates into the coal-bearing aquifer through the borehole, interacting with the aquifer water and surrounding rocks, leading to abnormal water quality phenomena.

6. Conclusions

(1)
The chemical reactions occurring in the evolutionary simulation experiment and mixing simulation experiment are different. The evolutionary simulation experiment involves more complex water evolution reactions, including cation exchange adsorption and dolomitization reactions, rather than simple mixing reactions;
(2)
At the four water quality anomaly points in the Gaohe Coal Mine, water quality evolutionary reactions that are influenced by Ordovician limestone water recharge have occurred, with the ratio of Ordovician limestone water to coal-bearing aquifer water in the 8# Coal-Bearing Aquifer Observation Borehole ranging from 1:1 to 1.2:1; in the 9# Coal-Bearing Aquifer Observation Borehole, the ratio ranged from 56:1 to 60:1; in the 10# Coal-Bearing Aquifer Observation Borehole, the ratio ranged from 64:1 to 68:1; and in the 11# Coal-Bearing Aquifer Observation Borehole, the ratio ranged from 48:1 to 52:1;
(3)
Collapse pillars, serving as water conduits, have larger dimensions compared to poorly sealed boreholes, allowing for greater Ordovician limestone water transmission. Consequently, the Ordovician limestone water proportion is higher in the 9# Coal-Bearing Aquifer Observation Borehole, 10# Coal-Bearing Aquifer Observation Borehole, and 11# Coal-Bearing Aquifer Observation Borehole, while it is lower in the 8# Coal-Bearing Aquifer Observation Borehole;
(4)
The investigation of the above-mentioned water quality evolution laws serves three primary purposes: firstly, to analyze the causes of water quality abnormalities and determine whether Ordovician limestone water is the source of water inrush; secondly, to assess the ratio of Ordovician limestone water recharge to the water volume in the coal-bearing aquifer; and thirdly, to evaluate the scale of water-conducting channels. This is of paramount importance for the prevention and control of water hazards in coal mines, particularly those related to Ordovician limestone water hazards caused by water-conducting channels, and for ensuring the safety of coal mine production.

Author Contributions

Methodology, P.L., J.X. and B.L.; Investigation, Y.Z. and J.C.; Resources, J.W. and F.L.; Writing—original draft, P.L. All authors have read and agreed to the published version of the manuscript.

Funding

The research supported by the General Program of National Natural Science Foundation of China (No. 52274243) and the Fundamental Research Funds for the Central Universities (No. 2024QN11025).

Data Availability Statement

Restrictions apply to the availability of these data. Data was obtained from third party and are available from the authors with the permission of third party.

Conflicts of Interest

Author Junxian Wei and Feng Li was employed by the Shanxi Gaohe Energy Co., Ltd. The remaining authors declare that the research was conducted in the absence of any commercial or financial relationships that could be construed as a potential conflict of interest.

References

  1. Wu, Q. Progress, problems and prospects of prevention and control technology of mine water and reutilization in China. J. China Coal Soc. 2014, 5, 795–805. [Google Scholar]
  2. Xu, X.; Tian, K.Y.; Sun, G.Z. Discrimination of Water Inrush Water Source in Mine Based on Bayes Stepwise Method. Coal Technol. 2018, 37, 130–131. [Google Scholar]
  3. Gao, X.W.; Huang, H. Discrimination of Water Bursting Source Based on Change of Water Quantity and Water Level and Hydrochemical Characteristics. Coal Technol. 2018, 37, 198–200. [Google Scholar]
  4. Yuan, W.H.; Gui, H.R. The Characteristics of Geothermal Temperature and Its Application in Distinguishing the Source of Water in Ren lou Mine. J. Anhui Univ. Sci. Technol. 2005, 25, 9–11. [Google Scholar]
  5. Ren, D.J.; Sun, Y.Y.; Li, J.Y. Hydrochemical characteristics and control of water hazard from coal seam roof in Gaojiabao coal mine. Coal Geol. Explor. 2019, 47, 26–311. [Google Scholar]
  6. Huang, P.H.; Chen, J.S. The chemical features of ground water and FDA model used to distinguish source of water burst in Jiaozuo mine area. Coal Geol. Explor. 2011, 2, 42–46. [Google Scholar]
  7. Yang, W.F.; Xia, X.H.; Pan, B.L.; Gu, C.S.; Yue, J.G. The fuzzy comprehensive evaluation of water and sand inrush risk during underground mining. J. Intell. Fuzzy Syst. 2016, 30, 2289–2295. [Google Scholar] [CrossRef]
  8. Yan, P.C.; Shang, S.H.; Zhang, C.Y.; Yin, N.N.; Zhang, X.F.; Yang, G.K.; Zhang, Z.; Sun, Q.S. Research on the Processing of Coal Mine Water Source Data by Optimizing BP Neural Network Algorithm with Sparrow Search Algorithm. IEEE Access 2021, 9, 108718–108730. [Google Scholar] [CrossRef]
  9. Zhang, H.T.; Xu, G.Q.; Chen, X.Q.; Wei, J.; Yu, S.T.; Yang, T.T. Hydrogeochemical Characteristics and Groundwater Inrush Source Identification for a Multi-aquifer System in a Coal Mine. Acta Geol. Sin.-Engl. Ed. 2019, 93, 1922–1932. [Google Scholar] [CrossRef]
  10. Zhang, H.; Yao, D.X. The Bayes Recognition Model for Mine Water Inrush Source Based on Multiple Logistic Regression Analysis. Mine Water Environ. 2020, 39, 888–901. [Google Scholar] [CrossRef]
  11. Wang, T.T.; Jin, D.W.; Liu, J.; Yang, J.; Wang, X.Y.; Zhao, W. Application of dynamic weight-set pair analysis model in mine water inrush discrimination. J. China Coal Soc. 2019, 44, 2840–2850. [Google Scholar]
  12. Bi, Y.S.; Wu, J.W.; Zhai, X.R.; Wang, G.T.; Shen, S.H.; Qing, X.B. Discriminant analysis of mine water inrush sources with multi-aquifer based on multivariate statistical analysis. Environ. Earth Sci. 2021, 80, 144. [Google Scholar] [CrossRef]
  13. Jiang, C.L.; Jiang, Z.Q.; Sun, Q. Classification of rocks surrounding tunnel using Fisher discriminant analysis method. J. China Coal Soc. 2012, 10, 1665–1670. [Google Scholar]
  14. Kang, Y.; Morooka, K.; Nagahashi, H. Texture classification using hierarchical linear discriminant space. IEICE Trans. Inf. Syst. 2005, E88D, 2380–2388. [Google Scholar] [CrossRef]
  15. Chen, Y.; Zhu, S.Y.; Xiao, S.J. Discussion on controlling factors of hydrogeochemistry and hydraulic connections of groundwater in different mining districts. Nat. Hazards 2019, 99, 689–704. [Google Scholar] [CrossRef]
  16. Zhang, M.; Chen, L.W.; Yao, D.X.; Zhang, J. Hydrogeochemical characteristics and water-rock interaction of limestone groundwater of Carboniferous Taiyuan Formation in Suxian mining area. J. Hefei Univ. Technol. 2022, 45, 396–405. [Google Scholar]
  17. Zheng, X.Q.; Wang, K.; Zhang, F.; Chen, J.F.; Li, A.M.; Chen, Y.P. Analysis of the Erosion Law of Karst Groundwater Using Hydrogeochemical Theory in Liulin Spring Area, North China. Water 2018, 10, 674. [Google Scholar] [CrossRef]
  18. Yin, S.X.; Lian, H.Q.; Liu, D.M.; Yin, H.C. 70 years of investigation on Karst collapse column in North China Coalfield: Cause of origin, mechanism and prevention. Coal Sci. Technol. 2019, 47, 1–29. [Google Scholar]
  19. Zhang, T.; Sun, L.Y.; Yang, Y.; TU, S.; Wang, J.F. A method for identifying karst collapse columns based on an improved residual network. Coal Geol. Explor. 2023, 51, 171–179. [Google Scholar]
  20. Cao, Z.Z.; Ren, Y.L.; Wang, Q.T.; Yao, B.H.; Zhang, X.C. Evolution Mechanism of Water-Conducting Channel of Collapse Column in Karst Mining Area of Southwest China. Geofluids 2021, 2021, 1–8. [Google Scholar] [CrossRef]
  21. Phurst, D.L.; Appelo, C.A.J. User’s Guide to PHREEQC (Version 2): A Computer Program for Speciation, Batch-Reaction, One-Dimensional Transport, and Inverse Geochemical Calculations. Available online: https://doi.org/10.3133/wri994259 (accessed on 28 August 2024).
  22. Charlton, S.R.; Parkhurst, D.L. Modules based on the geochemical model PHREEQC for use in scripting and programming languages. Comput. Geosci. 2011, 37, 1653–1663. [Google Scholar] [CrossRef]
  23. Holmes, N.; Tyrer, M.; West, R.; Lowe, A.; Kelliher, D. Using PHREEQC to model cement hydration. Constr. Build. Mater. 2022, 319, 126129. [Google Scholar] [CrossRef]
  24. Elakneswaran, Y.; Owaki, E.; Miyahara, S.; Ogino, M.; Maruya, T.; Nawa, T. Hydration study of slag-blended cement based on thermodynamic considerations. Constr. Build. Mater. 2016, 124, 615–625. [Google Scholar] [CrossRef]
  25. Lu, P.; Zhang, G.R.; Apps, J.; Zhu, C. Comparison of thermodynamic data files for PHREEQC. Earth-Sci. Rev. 2022, 225, 103888. [Google Scholar] [CrossRef]
  26. Aref, M.A.; Taj, R.J. Hydrochemical characteristics of sabkha brines, evaporite crystallization and microbial activity in Al-Kharrar sabkha and their implication on future infrastructures in Rabigh area. Red Sea Coast. Plain Saudi Arab. 2017, 76, 360. [Google Scholar]
  27. He, Y.L.; Liu, B.; Qin, S. Study on the Dolomitization and Dolostone Genesis. Acta Sci. Nat. Univ. Pekin. 2010, 6, 53–63. [Google Scholar]
  28. Wang, Y. Dolomite Problem and Precambrian Enigma. Adv. Earth Sci. 2006, 8, 857–862. [Google Scholar]
  29. Huang, S.J.; Qing, H.R.; Hu, Z.W.; Zou, M.L.; Feng, W.L.; Wang, C.M.; Gao, X.Y.; Wang, Q.D. Closed-system dolomitization and the significance for petroleum and economic geology:An example from Feixianguan carbonates, Triassic NE Sichuan basin of China. Acta Petrol. Sin. 2007, 23, 2955–2963. [Google Scholar]
  30. Montes-Hernandez, G.; Findling, N.; Renard, F.; Auzende, A.-L. Precipitation of ordered dolomite via simultaneous dissolution of calcite and magnesite: New experimental insights into an old precipitation enigma. Cryst. Growth Des. 2014, 14, 671–677. [Google Scholar] [CrossRef]
  31. Wu, Q.; Guo, X.M.; Bian, K.; Du, X.; Xu, K.; Bu, W.Y.; Zeng, Y.F. Carrying out general survey of the water disaster-causing factors to prevent the occurrence of coal mine water disasters. China Coal 2023, 49, 3–15. [Google Scholar]
Figure 1. Location of the study area and the aquifer profile.
Water 16 02506 g001
Figure 2. Runoff characteristics map of the study area.
Water 16 02506 g002
Figure 3. Aquifer and aquiclude profile map of the study area.
Water 16 02506 g003
Figure 4. Sample collection points.
Water 16 02506 g004
Figure 5. The steps for water quality evolutionary simulation experiment.
Water 16 02506 g005
Figure 6. The steps for water quality mixing simulation experiment.
Water 16 02506 g006
Figure 7. Hydrogeochemical types of three types of water samples.
Water 16 02506 g007
Figure 8. Photomicrographs of rock samples.
Water 16 02506 g008
Figure 9. Diagram of the concentration of each ion in the evolutionary simulation experiment.
Water 16 02506 g009
Figure 10. Diagram of the concentration of each ion in the mixing simulation experiment.
Water 16 02506 g010
Figure 11. Diagram of the mass of each component in the rock samples from the two sets of experiments.
Water 16 02506 g011
Figure 12. Concentrations of each ion in the two sets of experiments.
Water 16 02506 g012
Figure 13. Concentrations of HCO3 in the two sets of experiments.
Water 16 02506 g013
Figure 15. Mechanism of hydrochemical reactions.
Water 16 02506 g015
Figure 16. Mechanism diagram of Ordovician limestone water inrush through collapse pillars as water-conducting channels.
Water 16 02506 g016
Figure 17. Mechanism diagram of Ordovician limestone water inrush through poorly closed boreholes as water-conducting channels.
Water 16 02506 g017
Table 1. Characteristics of the main aquifers in the coalfield.
AquifersSpecific Yield (L/s·m)Hydraulic Conductivity (m/d)Hydrogeochemical Type (Schaefer Classification)
Unconsolidated layer porous aquifer group0.102–0.0610.446–0.498HCO3·Cl—Ca·K + Na·Mg
Bedrock weathering zone fractured aquifer0.024–0.2270.076–0.478HCO3·SO4—K + Na, HCO3·Cl—K + Na·Ca
Sandstone fractured aquifer of the Lower Shihezi Formation of the Lower Permian Series9.8 × 10−5–0.0084.82 × 10−4–0.074HCO3·Cl—K + Na
Sandstone fractured aquifer of the Shanxi Formation of the Lower Permian Series9.8 × 10−5–0.0084.82 × 10−4–0.074HCO3·Cl—K + Na
Aquifer in clastic rocks with intercalated carbonate rocks of the Taiyuan Formation of the Upper Carboniferous Series0.000244–0.0010.00107–0.004HCO3·Cl—Na
Middle series of Ordovician Fengfeng Formation limestone karst fractured aquifer0.1098–2.1420.3362–15.718SO4·HCO3—Ca·Mg
Table 2. Water samples from sampling points.
NumberCollection PointAnalysis Time
1# Coal-Bearing Aquifer Observation BoreholeWest II Panel Air Inlet Tunnel10 February 2023
2# Coal-Bearing Aquifer Observation BoreholeW3305 Air Inlet Tunnel3 February 2023
3# Coal-Bearing Aquifer Observation BoreholeW2307 Transportation Tunnel16 February 2023
4# Coal-Bearing Aquifer Observation BoreholeW3303 Air Inlet Tunnel16 June 2023
5# Coal-Bearing Aquifer Observation BoreholeE2310 Transportation Tunnel7 October 2023
6# Coal-Bearing Aquifer Observation BoreholeSouth 9# Transportation Tunnel25 October 2023
7# Coal-Bearing Aquifer Observation BoreholeW4302 Return Air Way20 February 2023
8# Coal-Bearing Aquifer Observation BoreholeNo. 2507 Borehole1 August 2023
9# Coal-Bearing Aquifer Observation BoreholeW1302 Return Air Way 6–8# Borehole7 April 2023
10# Coal-Bearing Aquifer Observation BoreholeW1302 Return Air Way 5–11# Borehole6 April 2023
11# Coal-Bearing Aquifer Observation BoreholeDx7 collapse pillar8 April 2023
1# Ordovician Limestone Observation Borehole1# Ordovician Limestone Observation Borehole10 May 2023
2# Ordovician Limestone Observation Borehole2# Ordovician Limestone Observation Borehole6 January 2023
3# Ordovician Limestone Observation Borehole3# Ordovician Limestone Observation Borehole2 May 2023
4# Ordovician Limestone Observation Borehole4# Ordovician Limestone Observation Borehole16 May 2023
5# Ordovician Limestone Observation Borehole5# Ordovician Limestone Observation Borehole2 June 2023
Table 3. Rock samples from sampling points.
NumberCollection PointQuantityAnalysis Time
1# Coal-Bearing Aquifer Rock SampleE2310 Transportation Tunnel D6 Borehole229 December 2023
2# Coal-Bearing Aquifer Rock SampleE2310 Transportation Tunnel D9 Borehole229 December 2023
3# Coal-Bearing Aquifer Rock SampleW2306 Air Inlet Tunnel229 December 2023
Table 4. Water quality information table.
NumberK+, Na+ (mg/L)Ca2+ (mg/L)Mg2+ (mg/L)Cl (mg/L)SO42− (mg/L)HCO3 (mg/L)CO32− (mg/L)pHTDS (mg/L)Temperature (°C)
1# Coal-Bearing Aquifer Observation Borehole256.571.661.51199.0113.95586.64.858.2486619
2# Coal-Bearing Aquifer Observation Borehole251.533.011.22105.682.4467.3510.558.3959818
3# Coal-Bearing Aquifer Observation Borehole392.751.070.65155.1522.62708.1418.378.8993619
4# Coal-Bearing Aquifer Observation Borehole283.922.440.49118.163.9542.434.859.0368017
5# Coal-Bearing Aquifer Observation Borehole302.211.670.5142.679.98604.96.268.6472017
6# Coal-Bearing Aquifer Observation Borehole348.362.00 1.82121.169.58642.9215.679108019
7# Coal-Bearing Aquifer Observation Borehole236.643.35 1.55141.5117.637511.917.0358.5282317
8# Coal-Bearing Aquifer Observation Borehole46.080.49097200.2384.430.167.4538.9516
9# Coal-Bearing Aquifer Observation Borehole177.0761.7730.5522.54288.32404.3207.6277916
10# Coal-Bearing Aquifer Observation Borehole163.1168.2835.4833.82272.73411.1207.7677616
11# Coal-Bearing Aquifer Observation Borehole163.1752.3722.6823239.07359.8418.377.8767717
1# Ordovician Limestone Observation Borehole44.88142.6758.9822.45336.65389.950.637.485618
2# Ordovician Limestone Observation Borehole29.8163.7641.6324.32384.25312.370.547.385418
3# Ordovician Limestone Observation Borehole36.09159.3552.2219.9376.13372.6607.681317
4# Ordovician Limestone Observation Borehole34.79152.8547.6518.85371.15404.507.885016
5# Ordovician Limestone Observation Borehole33.06179.1362.1113.35355.16295.650.217.783317
Table 5. Mass ratios of components in coal-bearing aquifer rock samples.
Composition of Rock SamplesMass Ratio
Quartz1
Potassium Feldspar0.189
Albite0.077
Muscovite0.104
Calcite0.021
Dolomite0.010
Table 6. The molar concentration ratio of CO32- to HCO3-.
Water Mass RatioEvolutionary Simulation ExperimentMixing Simulation Experiment
0.216.26 45.80
0.410.19 32.19
0.65.74 22.36
0.82.62 15.06
Table 7. The ratio of ion concentration in the evolutionary simulation experiment to that in the mixing simulation experiment.
Water Mass RatioCa2+Mg2+K+ and Na+
0.20.03 0.00 1.02
0.40.02 0.00 1.01
0.60.01 0.00 1.02
0.80.01 0.00 1.02
10.01 0.00 1.02
1.20.02 0.00 1.03
1.40.19 0.09 1.04
1.60.31 0.32 1.04
Table 8. The molar concentration ratio of Mg2+ to Ca2+.
Water Mass RatioEvolutionary Simulation ExperimentMixing Simulation Experiment
0.20.000 0.308
0.40.000 0.397
0.60.000 0.473
0.80.000 0.537
10.002 0.589
1.20.019 0.629
1.40.298 0.651
1.60.669 0.659
1.80.735 0.657
20.735 0.652
30.735 0.621
40.735 0.599
61.074 0.574
81.297 0.561
101.438 0.553
121.534 0.548
141.605 0.544
161.658 0.541
181.700 0.539
201.734 0.537
241.763 0.535
281.823 0.534
321.851 0.533
361.874 0.532
401.689 0.531
441.406 0.531
481.233 0.531
521.116 0.530
561.030 0.530
600.965 0.530
640.914 0.530
680.873 0.530
720.839 0.530
760.810 0.530
800.785 0.530
Disclaimer/Publisher’s Note: The statements, opinions and data contained in all publications are solely those of the individual author(s) and contributor(s) and not of MDPI and/or the editor(s). MDPI and/or the editor(s) disclaim responsibility for any injury to people or property resulting from any ideas, methods, instructions or products referred to in the content.