Article

Evaluating Uncertainties in an SM-Based Inversion Algorithm for Irrigation Estimation in a Subtropical Humid Climate

by
Laura Almendra-Martín
1,*,
Jasmeet Judge
1,
Alejandro Monsivaís-Huertero
2 and
Pang-Wei Liu
3
1
Center for Remote Sensing, Agricultural and Biological Engineering Department, University of Florida, Gainesville, FL 32611, USA
2
Escuela Superior de Ingeniería Mecánica y Eléctrica Unidad Ticomán, Instituto Politécnico Nacional, Mexico City 07340, Mexico
3
Hydrological Sciences Lab, NASA Goddard Space Flight Center, Greenbelt, MD 20771, USA
*
Author to whom correspondence should be addressed.
Water 2024, 16(17), 2445; https://doi.org/10.3390/w16172445
Submission received: 16 July 2024 / Revised: 22 August 2024 / Accepted: 24 August 2024 / Published: 29 August 2024
(This article belongs to the Section Hydrology)

Abstract

:
Monitoring irrigation is crucial for sustainable water management in freshwater-limited regions. Even though soil moisture (SM)-based inversion algorithms have been widely used to estimate irrigation, scarcity of irrigation records has prevented a thorough understanding of their uncertainties, especially in humid regions. This study assesses the suitability of the SM2RAIN algorithm for estimating irrigation at field scale using high-temporal-resolution data from four corn growing experiments conducted in north-central Florida. Daily irrigation estimates were compared with observations, revealing root mean squared differences of 1.26 to 3.84 mm/day and Nash–Sutcliffe Efficiencies of 0.33 to 0.89. The estimates were more sensitive to uncertainties in static inputs of porosity, saturation moisture and soil thickness than they were to noise in time series inputs. Defining the saturation moisture as porosity made the algorithm insensitive to both parameters, while increasing soil thickness from 40 to 200 mm improved detection accuracies by 34–46%. In addition, the impact of SM on the estimations was investigated based on satellite overpass times. The analysis showed that morning passes produced more accurate estimates for the study site, while evening passes doubled the uncertainty. This study enhances the understanding of the SM2RAIN algorithm for irrigation estimation in subtropical humid conditions, guiding future high-resolution applications.

1. Introduction

Freshwater is a key natural resource for the sustainable development of ecosystems and life, but it is also one of the most jeopardized resources due to climate change. The majority of freshwater use, about 70%, is for irrigated agriculture [1]. Irrigated water use is increasing with population growth, a trend that is projected to continue in the future. Irrigation practices increase evapotranspiration (ET) rates, altering the energy and water fluxes, and impacting regional climate [2,3]. Over-irrigation can deplete groundwater levels [4] and drive nutrient leaching for crops [5]. In addition, the lack of accurate knowledge of large-scale irrigation water use can negatively impact social and environmental aspects, such as deficient water management. Therefore, a better understanding of the amount of water used for irrigation is essential to comprehend its environmental and social impacts and to ensure future sustainable agriculture.
Typically, irrigated water use is reported from census surveys, that may contain biases due to varying incentives, experiences, and monitoring capabilities of farmers [6]. Obtaining high-quality global information on the water amount used for irrigation is challenging [7]. Some remote sensing (RS)-based methodologies for irrigation estimation involve detecting discrepancies between RS observations of soil moisture (SM) and/or ET, and reference rainfed simulations, and attribute these differences to irrigation [8,9,10,11,12]. However, the methodologies are highly sensitive to uncertainties in the RS observations. More sophisticated RS-based data assimilation techniques, such as a particle filter, an ensemble Kalman filter, or a particle batch smoother filter, have also been used to combine RS observations and hydrology models to enhance the representation of irrigation within the models [13,14,15,16,17]. However, poor parameterization of the model irrigation schemes, significantly affects irrigation estimations, and the best estimates are obtained when irrigation occurrence is already known [15].
Another RS-based method, the SM-based inversion algorithm (hereafter referred to as SM2RAIN) has demonstrated strong capabilities in estimating irrigation amount across various regions [18,19,20,21,22]. This algorithm, combined with satellite RS data, has been used to develop weekly regional irrigation datasets, showing satisfactory performance [23]. Although RS can be a convenient tool for irrigation monitoring, current products may over- or under-estimate irrigation due to errors in retrieval algorithms, and observational biases and spatial resolutions [15]. Coarse spatial resolutions of current microwave products constitute one of the main limitations when estimating irrigation [7]. Moreover, Brocca et al. [18] also found that the performance of the algorithm was sensitive to satellite revisit time. Estimating irrigation water amount and occurrence using satellites can be challenging since most microwave missions in sun-synchronous orbits provide observations at 6 am and 6 pm local times [24]. As a result, most SM2RAIN applications employ SM derived from the soil conditions at the time of the satellite overpass and use it as daily SM. However, nocturnal irrigation events, different irrigation methods such as seepage and flood irrigation, or same day rainfall and irrigation occurrence may contribute to erroneous estimates. These factors can make it challenging to estimate irrigation and its uncertainty solely using RS techniques.
Few experiments at the field scale have been conducted to evaluate the SM2RAIN algorithm, primarily due to limited well-managed irrigation records. For example, Filippucci et al. [25] evaluated SM2RAIN for estimating irrigation during a tomato growing season in Italy using SM estimations from proximal gamma-ray spectroscopy. They found that daily SM sampling was the most suitable for daily irrigation estimation. However, in the study, the satellite overpass times were not considered. Since root zone SM (RZSM) is critical in plant water uptake [26], insufficient RZSM information can provide inaccurate irrigation estimates [6]. In addition to RZSM, ET also plays a critical role in irrigation estimation. Although efforts have been made to enhance the accuracy of ET [20], ground-based data for its calibration and validation remains scarce. Therefore, gaining deeper insights into the potential uncertainties associated with the SM2RAIN algorithm is essential for improving irrigation estimates, particularly at field scales.
Many humid areas are turning to irrigation systems to sustain agriculture due to climate change and rapidly increasing population [27]. Florida is one of the most heavily irrigated states in the Eastern United States (US) [28] due to its humid climate and sandy soils with low water-holding capacity [29]. The goal of this study is to understand the applicability of the SM2RAIN algorithm for irrigation estimation in subtropical humid conditions at field scales. For this, we utilize data from season-long experiments conducted in north-central Florida during four corn growing seasons. The study identified the main sources of uncertainty in the algorithm physics and input variables and quantified their impact on irrigation estimation. In addition, we explored the most suitable satellite overpass time of the retrieved SM product for irrigation estimation. The findings of this research provide guidance for utilizing high resolution SM products with SM2RAIN algorithm at a field scale. For example, the upcoming NASA–Indian Space Research Organization (ISRO) Synthetic Aperture Radar (NISAR) will provide SM product at a spatial resolution of 200 m [30], which may be capable of monitoring irrigation at field scales.

2. Material and Methods

2.1. Study Area and Datasets

The Microwave Water and Energy Balance Experiments (MicroWEXs) were conducted during corn, cotton, and elephant grass growing seasons in north-central Florida at the University of Florida Institute of Food and Agricultural Sciences (UF/IFAS) Plant Science Research and Education Unit (PSREU) (Figure 1). Specifically, this study utilizes data from four corn growing seasons, namely the second [31], fifth [32], tenth [33], and eleventh [34] MicroWEXs, hereafter referred to as MicroWEX-2, MicroWEX-5, MicroWEX-10, and MicroWEX-11, respectively. Corn is one of the main crops in Florida [35], and it is highly sensitive to water stress [36] and thus, heavily irrigated. The planting dates varied significantly among the four experiments, resulting in a variety of hydrometeorological conditions with different irrigation requirements (see Table 1).
Throughout each experiment, four rain gauges located at the field edges and within the field monitored precipitation and overhead, linear-move irrigation, every 15 min. In addition, the PSREU recorded the water amount applied to the field for both irrigation and fertigation. A micro-meteorological station monitored down-welling shortwave radiation, relative humidity, and air temperature at the field site. During MicroWEX-2 and MicroWEX-5, latent heat fluxes were observed every 30 min using an Eddy Covariance System [38]. Volumetric SM and soil temperatures were also measured every 15 min, using the widely used Campbell Scientific time-domain reflectometers (CS616) [39] and thermistors at depths of 2, 4, 8, 16, 32, 64, and 100 cm. Soil physical and hydraulic properties, such as organic matter content, texture, and water retention curves were measured throughout the root zone profile.
In addition to the MicroWEX data, auxiliary meteorological observations from the Florida Automated Weather Network (FAWN) were utilized [40]. FAWN consists of 42 stations distributed across the state, providing every 15 min observations of temperatures at different heights, soil temperature, humidity, rainfall, wind speed and direction, solar radiation, and barometric pressure. Moreover, a continuous dataset from 2005 to 2020 has recently been generated [41]. In this study, observations from the Citra station located at PSREU were utilized as auxiliary weather data in case of data gaps in the MicroWEX observations.

2.2. SM2RAIN Implementation

The SM2RAIN algorithm is based on the inversion of the soil water balance equation given by Equation (1a):
n Z d S ( t ) d t = W i n ( t ) e ( t ) g ( t ) s r ( t )
W i n ( t ) = i ( t ) + r ( t )
where S ( t ) [-], Z [mm], and n [-] represent relative SM, soil layer thickness, and soil porosity, respectively. These water balance components, expressed in mm during a given time epoch, t, are the water input, W i n ( t ) , actual ET e ( t ) , drainage into deeper soil layers g ( t ) , and surface runoff s r ( t ) . Where W i n ( t ) represents both rainfall r ( t ) and irrigation i ( t ) (Equation (1b)). In general, irrigated fields in Florida are flat and highly sandy, so the runoff effect is negligible. Therefore, by rearranging Equations (1a) and (1b) the irrigation rate amount i ( t ) can be calculated from Equation (2) when the remaining water balance components are known:
i ( t ) = n Z d S ( t ) d t + e ( t ) + g ( t ) r ( t )
S ( t ) represents the volumetric SM ( θ ) on a relative scale between moisture saturation level ( θ s ) and the residual level ( θ r ) (Equation (3)) [42].
S ( t ) = θ ( t ) θ r θ s θ r
In this study, θ profiles were calculated by vertically interpolating data from sensors at different depths [43]. The Z was set to 160 mm, as it aligns with satellite SM effective depth of representation [44], and is sensitive enough to detect changes in SM resulting from irrigation events, as recorded in the MicroWEXs data. Values for n, θ s , and θ r were obtained from soil analysis during the MicroWEXs, and were set to 0.34 [-], 0.34 m 3 m 3 and 0.0051 m 3 m 3 , respectively. Furthermore, the study field showed no significant variation in the distribution of soil properties along the sandy profile [45,46]. Therefore, n, θ s , and θ r were considered constant within the 1-meter profile.
The e ( t ) rates were obtained from latent heat flux observations during MicroWEX-2 and -5. For the MicroWEX-10 and -11, the e ( t ) was obtained using the FAO56 approach [47]:
e ( t ) = K c ( t ) E T 0 ( t )
where E T 0 ( t ) is the reference ET calculated using the Penman–Monteith equation [48,49]. Air temperature, solar radiation, wind speed and relative humidity collected during the experiments, and from FAWN station as auxiliary, were utilized to calculate the E T 0 ( t ) . K c represents the crop coefficient, which was fixed based on predefined coefficients for corn and the stage of plant development. It has been demonstrated that this approach is more suitable for irrigated fields as it accounts for transpiration from the crops than an SM-limited approach [20].
The drainage rates were estimated as changes in relative SM of deeper layers, S g , [-] for a given soil thickness, Z g , [mm] with n.
g ( t ) = n Z g d S g ( t ) d t
The Z g was set at 1 m, a standard depth for the root zone [50]. In addition, the SM observations were stable at this depth, making them representative of the bottom layer for soil water recharge. This approach to calculating the drainage term can take into account water uptake by deeper roots represented by negative values.
Hourly water rates of e ( t ) , g ( t ) and S ( t ) terms in Equation (2) were obtained by averaging 15-min values. Estimated W i n was then accumulated to a daily scale for evaluation, which has been shown to provide better algorithm performance than finer temporal resolutions [51]. Daily irrigation rates were obtained as a difference between the estimated daily W i n and the daily rainfall observations from the FAWN station. All estimations lower than 2 mm/day, which was the minimum water applied during the MicroWEXs, were set to 0.

Evaluation Metrics

The performance of the SM2RAIN algorithm was evaluated for the occurrence and amount of water of the irrigation events. The ability of SM2RAIN to detect the occurrence of irrigation events was evaluated using three performance metrics including the probability of detection (POD, Equation (6a)) that evaluates the ability of the algorithm to correctly identify irrigation days. Values of POD range from 0 to 1, with 1 representing the best performance. The false alarm ratio (FAR, Equation (6b)) measures the rate of falsely detected irrigation events. Values range from 0 to 1, with 0 showing the best performance. The critical success index (CSI, Equation (6c)) metric considers both hits and false alarms. Values range from 0 to 1, with a higher CSI indicating a better performance.
POD = T P T P + F N
FAR = F P F P + T P
CSI = T P T P + F N + F P
where T P are the true positives and T N true negatives for accurately identifying observed events and no events, respectively, and F P are the false positives and F N false negatives for inaccurate irrigation occurrence and missed events, respectively.
The accuracy of the amount of water input during irrigation was evaluated as the overall percentage deviation ( % D ), the root mean square difference (RMSD) and the Nash–Sutcliffe Efficiency (NSE) during each growing season, as shown in Equations (7a)–(7c).
% D = I e s t I o b s I o b s · 100
RMSD = j = 0 N ( i e s t j i o b s j ) 2 N
NSE = 1 j = 0 N ( i e s t j i o b s j ) 2 j = 0 N ( i o b s j i o b s ¯ ) 2
where I e s t is the total irrigation water estimated with SM2RAIN, I o b s the observed total irrigation water during the growing season, while i e s t and i o b s are the estimated and observed irrigation values, respectively, for each day, j of the growing season of length N, and i o b s ¯ is the average observed irrigation. Negative values of % D indicate an underestimation by the algorithm, while positive values indicate overestimation. The NSE ranges from − to 1, where values below 0.5 indicate unsatisfactory performance of SM2RAIN, and values closer to 1 indicate more accurate irrigation estimates [52].

2.3. Sources of Uncertainty

2.3.1. Sensitivity Analysis

To evaluate the possible sources of uncertainty, a widely used one-factor-at-a-time (OAT) analysis was performed [53]. This approach was chosen over a global sensitivity analysis because the focus was to explore the individual contribution of the parameters to irrigation estimations rather than understanding their interactions. In this analysis, one parameter is changed at a time while others are held in a fixed baseline. Possible sources of uncertainty in the SM2RAIN algorithm can come from parameters, errors of input variables [22], and the soil thickness [18]. The sensitivity analysis was conducted for MicroWEX-2 and -5 since these experiments had observations of actual ET.
The uncertainty contribution of the static soil parameters, n, θ s , and Z were evaluated. The θ r was not included in the analysis as the value is typically low for sandy soils and does not impact the algorithm. The fixed baseline for n and θ s was obtained from MicroWEXs; however, a wide range was tested for each soil parameter (Table 2). An additional case in which θ s was set to the n value [42] was investigated. In this case, both n and θ s were changed simultaneously using identical values. As SM was interpolated for different depths, when Z changed, it was re-interpolated and recalculated for the new thickness.
For time series parameters, S ( t ) , g ( t ) , and e ( t ) , the uncertainty impact was investigated by incorporating randomly generated normally distributed noise with zero mean and a standard deviation of ε /3, which predefined variability ( ± ε ) within a 99.7% confidence interval. The noise ranges for S ( t ) , g ( t ) , and e ( t ) were from 0 to 3, 4, and 2, mm/day, respectively. These values were chosen to introduce a maximum of 30% variability [54] using maximum observed values during MicroWEX-2 and MicroWEX-5, as is a common target error for RS estimations.

2.3.2. Impact of Satellite Overpass Times

In this study, we aimed to evaluate the impact of satellite overpass time on irrigation estimates. SM2RAIN was run using SM values at 6 am and at 6 pm from MicroWEXs, identical to the ascending and descending passes, respectively, of the current NASA Soil Moisture Active and Passive (SMAP) and upcoming NISAR missions. The daily irrigation estimates using SM observations at 6 am were compared with the estimates using SM at 6 pm and with estimates obtained from using averaged daily SM observations from MicroWEX, as described in Section 2.2.

3. Results and Discussion

3.1. Irrigation Estimates

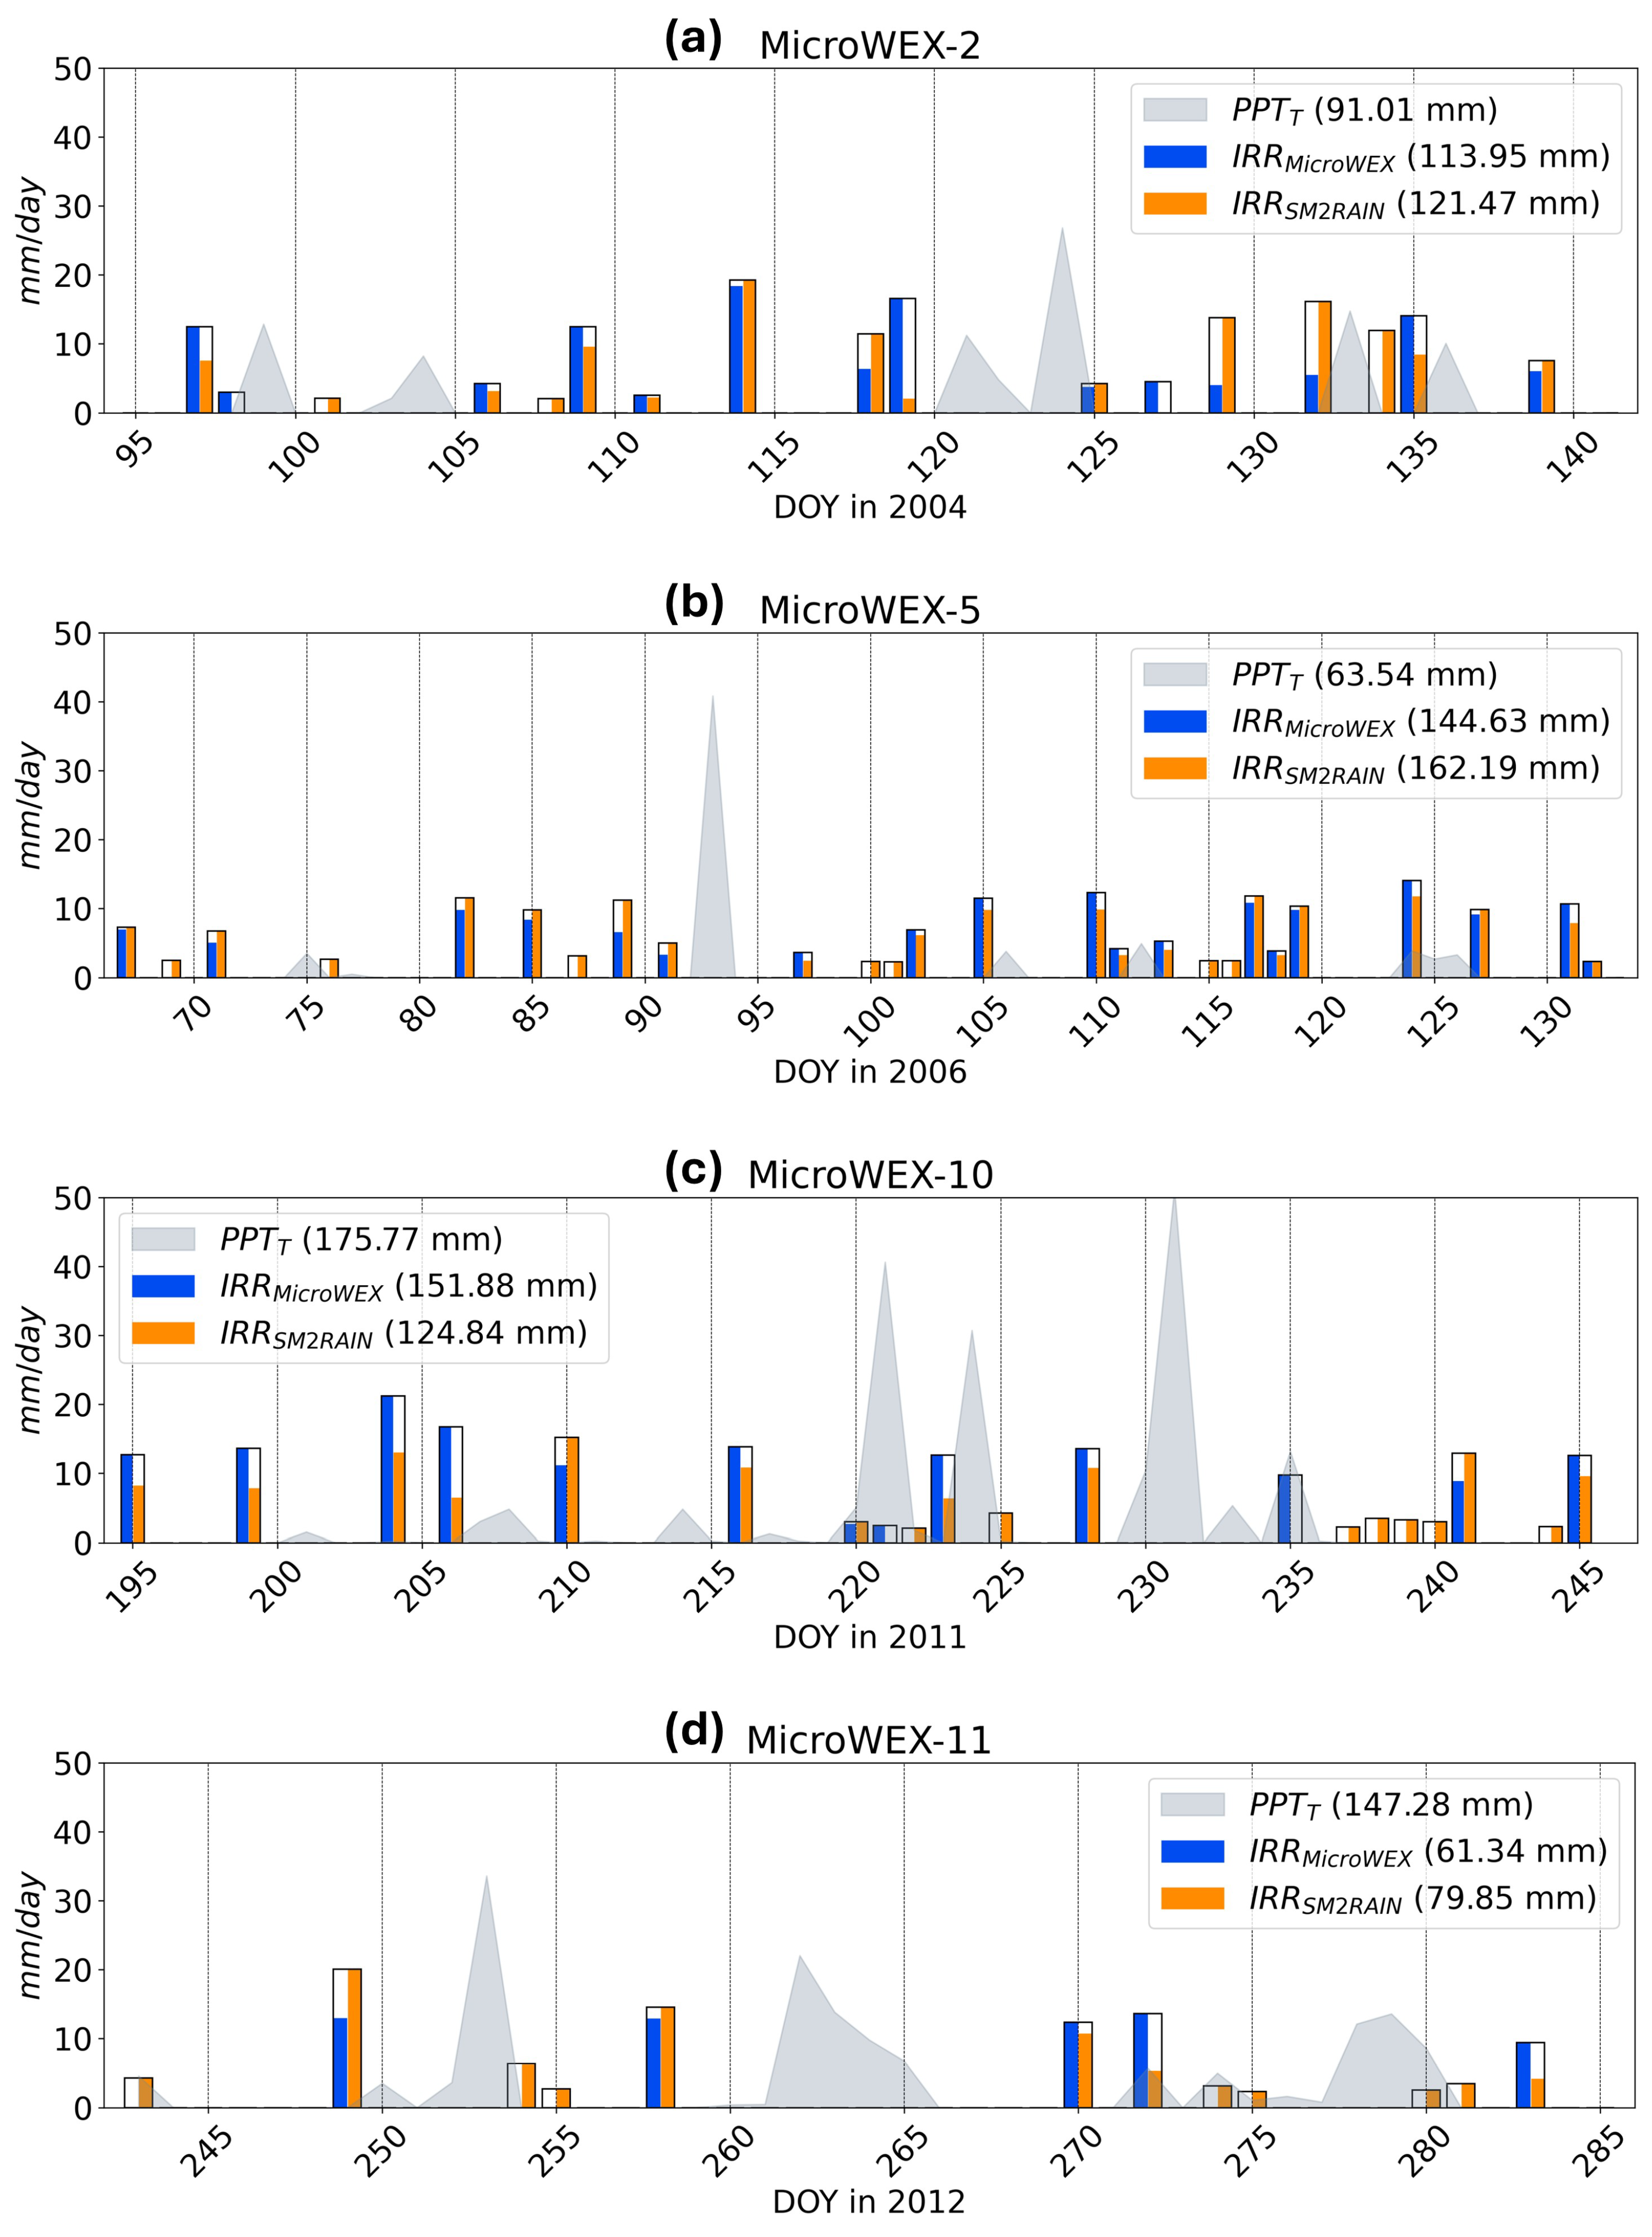
Figure 2a–d show the time series of daily irrigation observed during MicroWEXs and those estimated by SM2RAIN. Overall, SM2RAIN captures the occurrence and amount of irrigation well. When evaluating the occurrence detection, MicroWEX-2 and MicroWEX-5 showed the highest accuracy, with CSI values over 0.7, and MicroWEX-11 showed the worst performance (Table 3). In all cases, POD values remain close to 1, which means the algorithm shows a good capability for event detection. All events were detected during MicroWEX-5 and MicroWEX-11, and two events were missed during MicroWEX-2 when a low amount of water was applied during fertigation (Figure 2a). During MicroWEX-10, only one event was missed on DOY 235 when there was both rain and irrigation (Figure 2c). The main discrepancies observed were due to F P . During MicroWEX-11, all F P by SM2RAIN occurred during rainy days (Figure 2d). Intense irrigation events, typical at the study site, can significantly increase SM, occasionally saturating the soil. Due to rapid drainage in sandy soils and limited ET during rainy days, the W i n ( t ) can be overestimated at daily temporal resolutions. Consequently, a residual value may be incorrectly identified as an irrigation event. In addition, false events were obtained for the dry periods during MicroWEX-5 between DOYs 69, 87, 100–101 and 115–116, and after DOY 235 during MicroWEX-10 (Figure 2b,c). The e ( t ) can significantly rise during hot periods following rainy days. Both the soil and plants have ample water available for ET, resulting in increased moisture loss. However, on a daily basis, e ( t ) and changes in S ( t ) may not align. Daily e ( t ) can drive SM flow upward in shallow layers leading to a more humid surface soil [55]. Therefore, despite the long-term SM decrease, daily disparities can cause the false detection of irrigation events. Although the estimated water amounts during these false events were typically low, they exceeded the residual 2 mm threshold.
The results for the water amount estimates generally indicate low discrepancies. MicroWEX-5 showed the least RMSD of 1.26 mm/day and the NSE closest to 1, as shown in Table 3, indicating an accurate estimation of the irrigation water amount through the growing season. Although the lowest % D , in absolute terms, is observed during MicroWEX-2, it exhibits the lowest NSE of 0.33 and the highest RMSD, above 3 mm/day, similar to findings in [25]. This discrepancy may arise from the differing temporal dynamics among the terms of the water balance equation. While accumulated total irrigation is accurately estimated due to the precision of the water balance over the growing season, daily variations are less accurately estimated. Similarly, analyses for MicroWEX-10 show smaller total deviation and higher RMSD than MicroWEX-11. However, in this case a higher NSE of 0.7 is observed in MicroWEX-10, indicating a better performance of the algorithm. In general, the SM2RAIN shows a tendency to overestimate, with MicroWEX-11 showing the highest total difference of over 18 mm over the growing season (Figure 2d). However, the absolute % D between observed and estimated irrigation remains below the target error of 40% for irrigation estimations [7] for all the four MicroWEXs. A significant, recurrent underestimation was observed during MicroWEX-10, despite showing the highest FAR values. This underestimation could stem from an underestimation in the ET calculation, as standard crop coefficient values were utilized, and crop phenology may vary between early and late-year growing seasons. In fact, overall poorer performance of the SM2RAIN when estimating water amounts was observed during the late-year growing seasons, MicroWEX-10 and MicroWEX-11, which typically have higher temperatures and precipitation.
The above findings suggest that the SM2RAIN can effectively identify irrigation occurrence and water amount at a daily scale. However, it may not be able to disentangle rainfall and ET signals, especially during extremely wet and hot seasons. This could be the reason why SM2RAIN performed better during MicroWEX-5, as it was the driest and coolest growing season. This limitation can be particularly relevant in humid regions like Florida, where growing seasons coincide with the rainy season, which occurs during the hottest months. Throughout the corn growing seasons, no consistent pattern was observed for different growth stages, suggesting that SM2RAIN lacks sensitivity to the crop stage.

3.2. Sensitivity Analysis

Accurate irrigation estimations necessitate the calibration of soil parameters within the SM2RAIN algorithm. A sensitivity analysis was carried out during MicroWEX-2 and MicroWEX-5 to evaluate the impact of static soil parameters, n, θ s , and Z and time series parameters, S ( t ) , g ( t ) , and e ( t ) , in the algorithm. Results obtained for the static soil parameters are shown in Figure 3. The irrigation amount estimated by SM2RAIN, indicated by % D , show a strong sensitivity to n and θ s . An overestimation of n or underestimation of θ s increases the % D up to 70% and 40% in MicroWEX-2 and MicroWEX-5, respectively. The occurrence detection, indicated by the CSI values, also shows a strong sensitivity to n and θ s . Increasing n decreases CSI values to 0.57 during MicroWEX-2, while it increases CSI values to 0.85 in MicroWEX-5. An inverse impact is observed with θ s , where CSI increases to 0.8 during MicroWEX-2 but decreases to 0.5 in MicroWEX-5. In the literature, θ s and θ r are commonly chosen as normalization values based on the maximum and minimum SM observed. However, when applying this approach to RS products, associated biases must be considered [56] and values of θ s surpassing n must be avoided. We also examined the case where n and θ s are equal, finding that the impact of both parameters offsets each other, resulting in negligible sensitivity (Figure 3c,g). This approach assumes that all pores will be filled with water at saturation level. However, this may not always occur, depending on the type of soil structure or air entrapment [57]. In general, agricultural fields aim for loose soils that permit free entry and movement of water, facilitating the filling of pores. Therefore, setting the same values for both parameters can be a good practice to avoid incorporating uncertainty into the estimates while maintaining physical meaning in the algorithm.
An increase in the detection accuracy for the parameter Z was observed for both MicroWEX-2 and MicroWEX-5. Increasing Z improved the CSI by 34–46%, however, without any further improvement beyond approximately 200 mm. Regarding the water amount estimation, an increase with Z in the percentage difference can be noticed only in MicroWEX-2 (Figure 3d), leading to underestimations for low values of Z and overestimations for higher values of Z. This suggests that using layers that are too shallow can lead to a decrease in the SM2RAIN performance, likely due to the high variability of SM in these layers in sandy soils. This can be a limitation for RS products, which have a penetration depth of a few centimeters [58]. Conversely, increasing Z can enhance detection ability up to a certain level. Drainage can occur rapidly in sandy soils, and deeper soil layers exhibit less sensitivity to sudden SM changes caused by irrigation and are more sensitive to root water uptake.
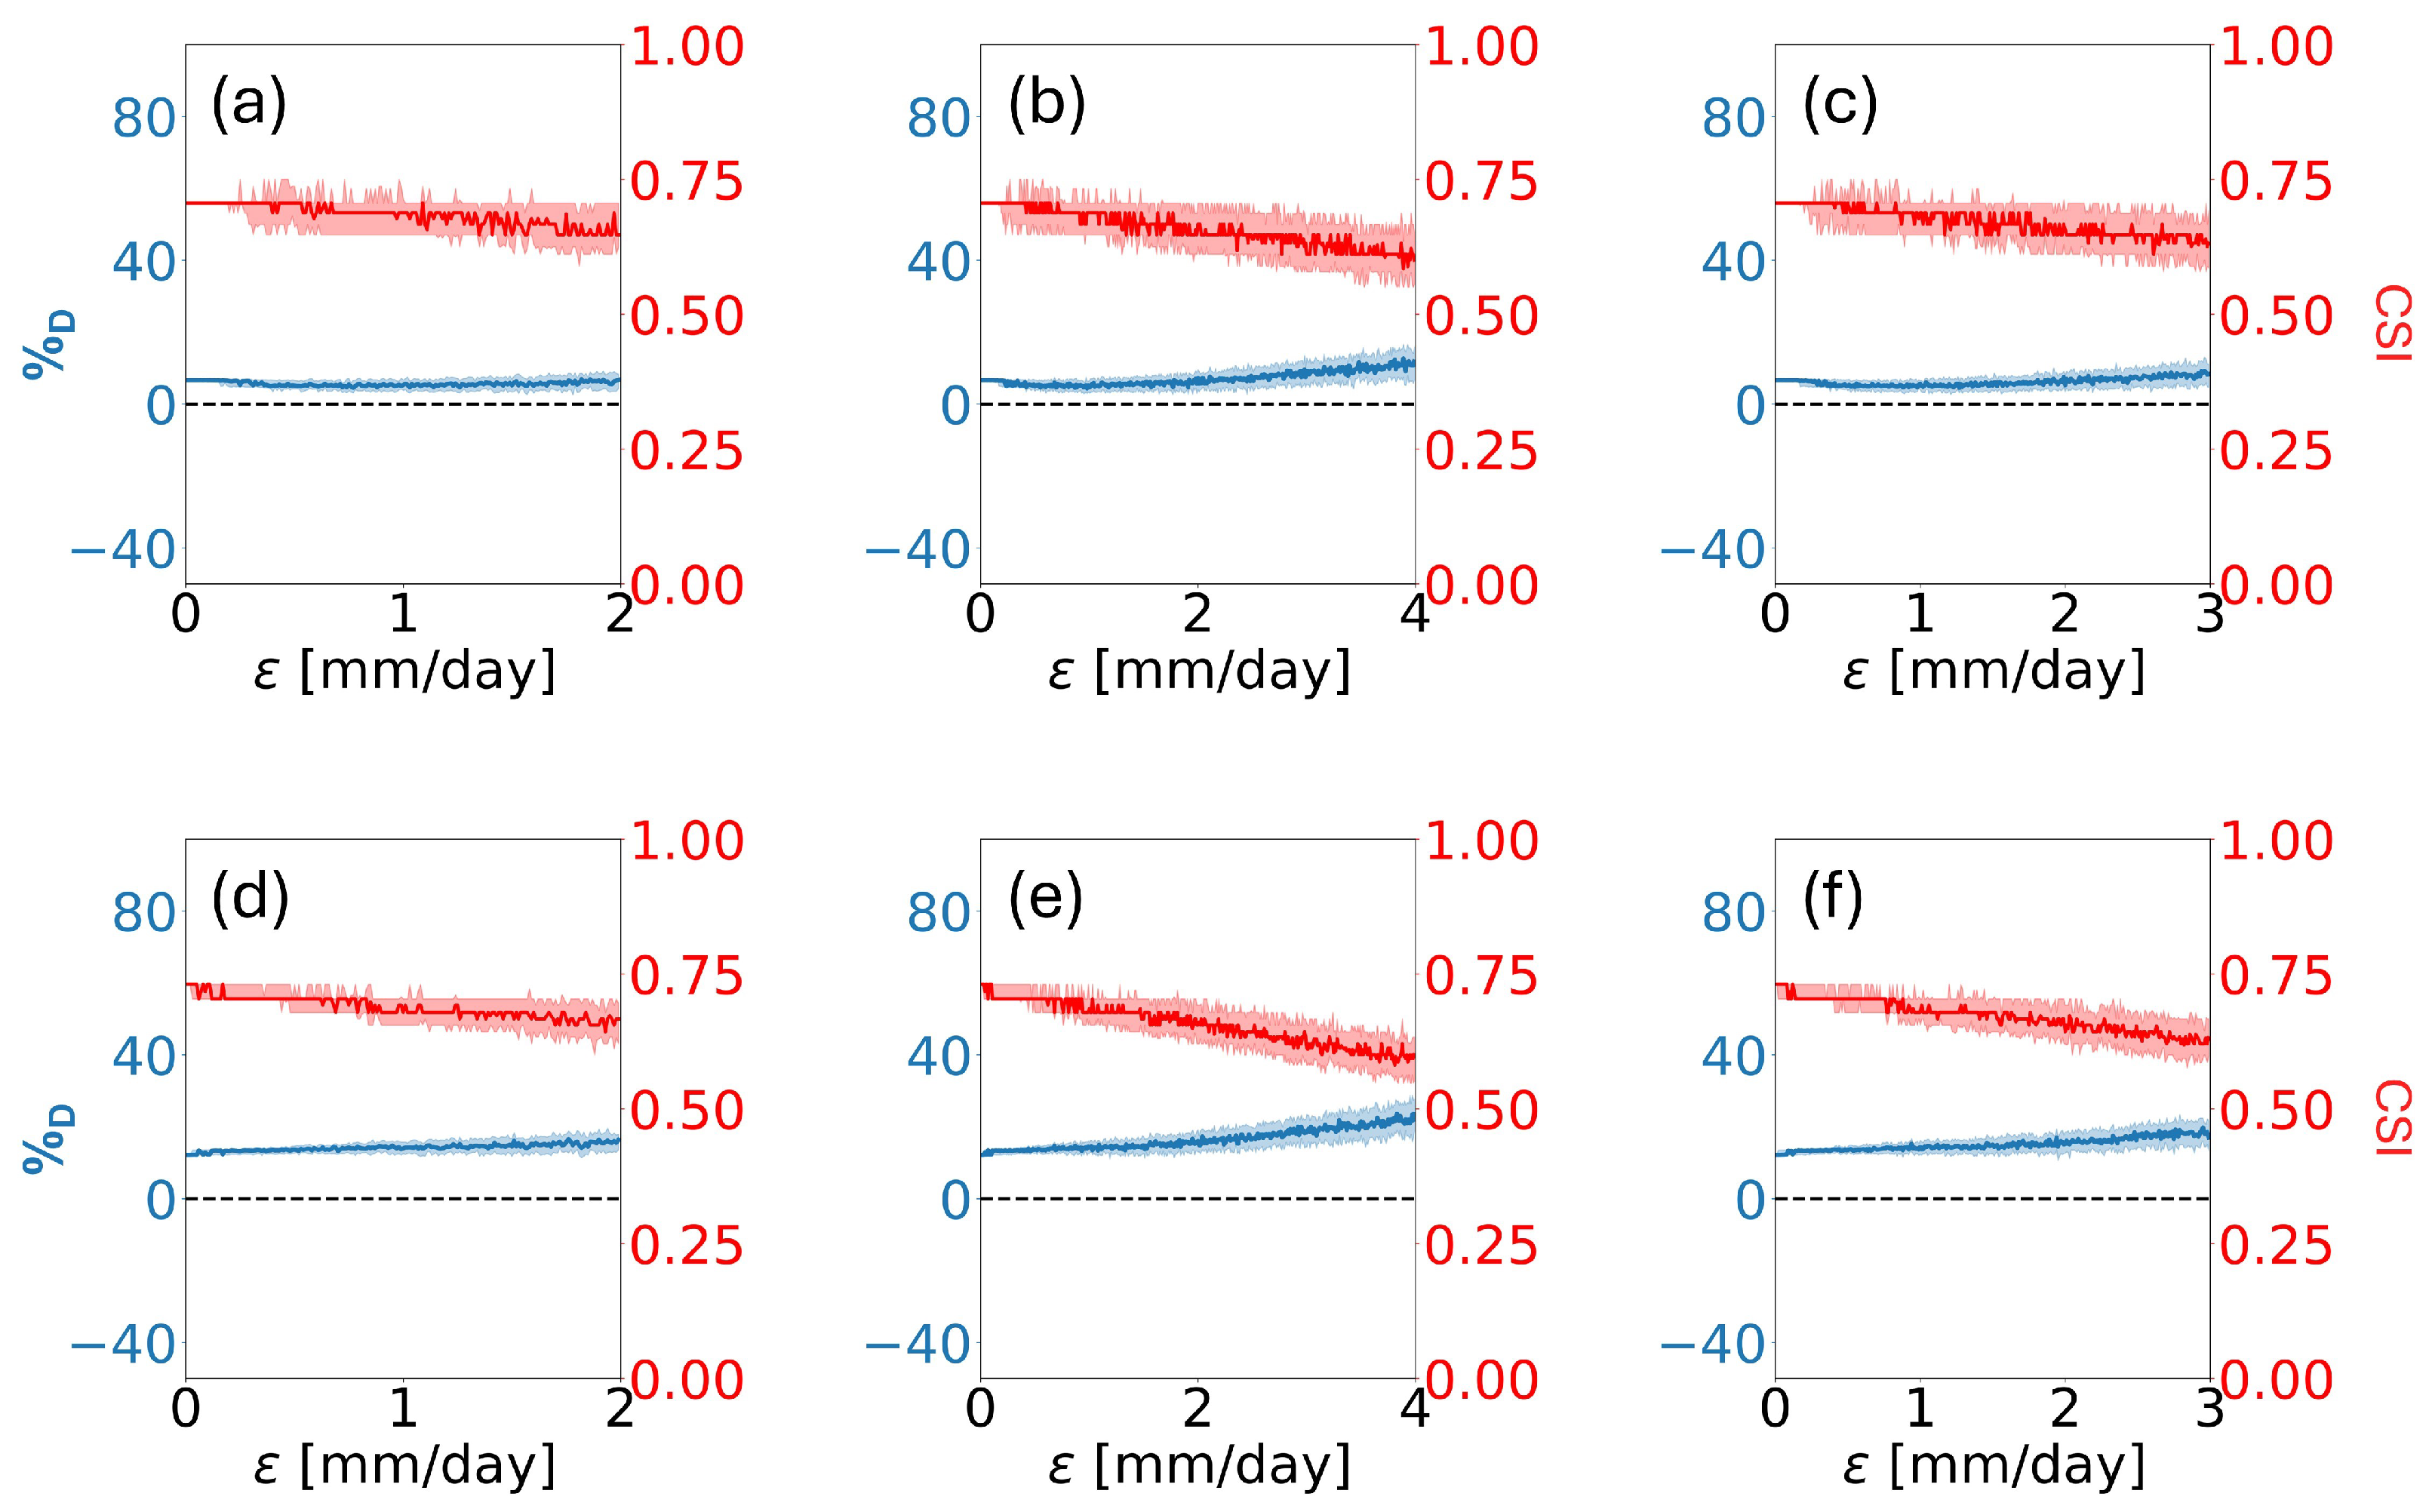
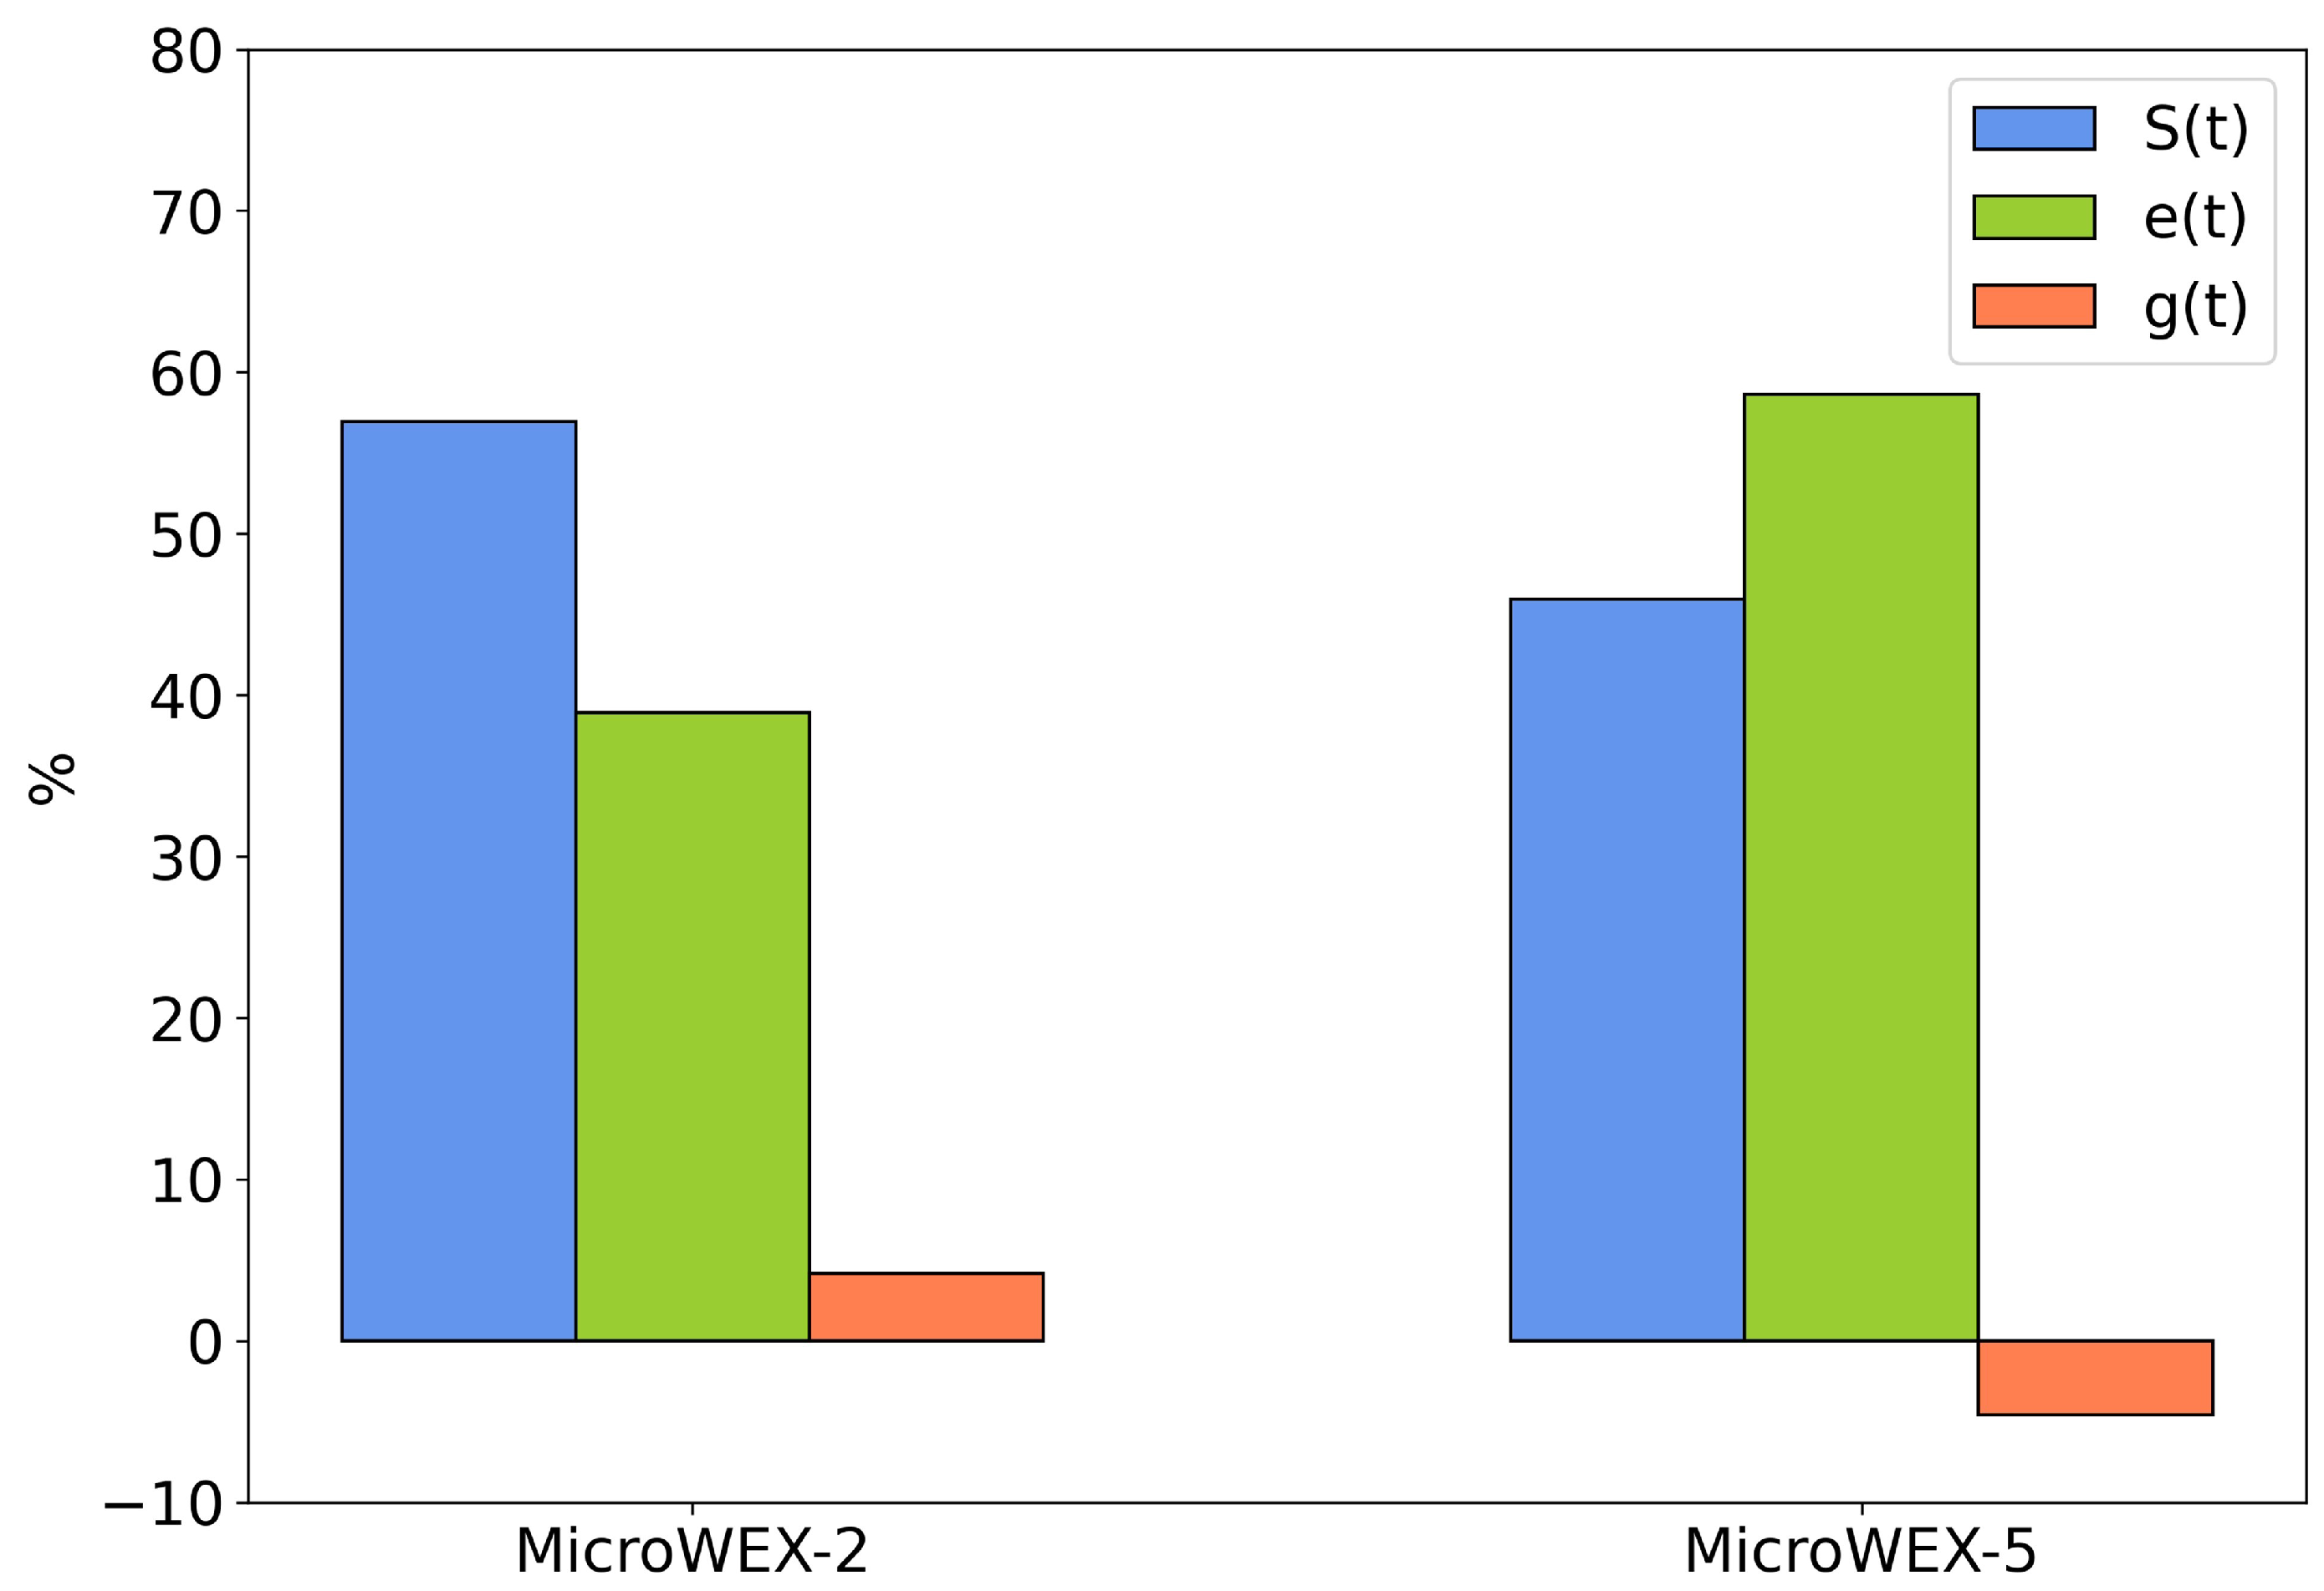
Figure 4 shows the results obtained for the time series parameters, e ( t ) , S ( t ) , and g ( t ) . Slight variations in daily e ( t ) time series had minimal or negligible effects on the SM2RAIN performance, with the total water amount remaining largely unchanged. Similar results can be observed in both MicroWEX-2 and MicroWEX-5 (Figure 4a,d). This suggests that minor noise in e ( t ) daily time series does not significantly affect performance under humid conditions. However, this does not mean SM2RAIN is insensitive to biases in ET products. Previous studies have shown decreased performance when using less sophisticated techniques for e ( t ) calculation [20]. In fact, when studying the contributions of each time series parameter to the total estimated irrigation water, it can be observed that e ( t ) has a major role, with a contribution varying between 39% and 58%, as shown in Figure 5. This was also noted by Dari et al. [19] in a semi-arid region.
Conversely, when noise was introduced to the S ( t ) term in Equation (1a), a higher impact was observed. Overall, noise in S ( t ) primarily impacted the event detection capability, as CSI decreases to 0.6 for both MicroWEXs (Figure 4b,e). This was expected, as t h e e ( t ) and S ( t ) terms were major contributors to the total estimated irrigation water (Figure 5). However, the overall impact of noise was generally small. Similar findings were reported by Brocca et al. [18], who observed a slight performance decrease when SM error was introduced to synthetic data of a semi-humid climate. As for e ( t ) , the small influence of noise in the time series on SM2RAIN performance does not imply that the algorithm is insensitive to other sources of uncertainty in S ( t ) data.
Regarding the g ( t ) , a similar impact to that observed in S ( t ) can be noticed for both MicroWEX-2 and MicroWEX-5, with an overall decrease in the detection capability similar to that found for S ( t ) and an increase in the percentage difference of the irrigation water amount (Figure 4c,f). This sensitivity to noise in soil water-related variables is expected due to their higher temporal variability compared to e ( t ) . However, the similarity between S ( t ) and g ( t ) sensitivity is noteworthy concerning the minimal contribution of g ( t ) to the total amount of estimated irrigation water varying from 4% to −4% (Figure 3). The negative contribution during MicroWEX-5 indicates an elevated water uptake by corn plants during this growing season. Even with this small contribution, SM2RAIN showed some sensitivity to noise in g ( t ) , which could be due to its role during rainfall events. High rainfall events, typical of subtropical climates and the low retention of sandy soils can rapidly increase drainage, leading, for example, to false irrigation events, as shown in Section 3.1. Similar negligible contribution of this term during the irrigation season was observed by Jalilvand et al. [22], but with an increasing role in the algorithm during the rainy season. Therefore, this term must be properly taken into account to accurately resolve the water balance in irrigated fields in similar regions.

3.3. Impact of Satellite Overpass Time

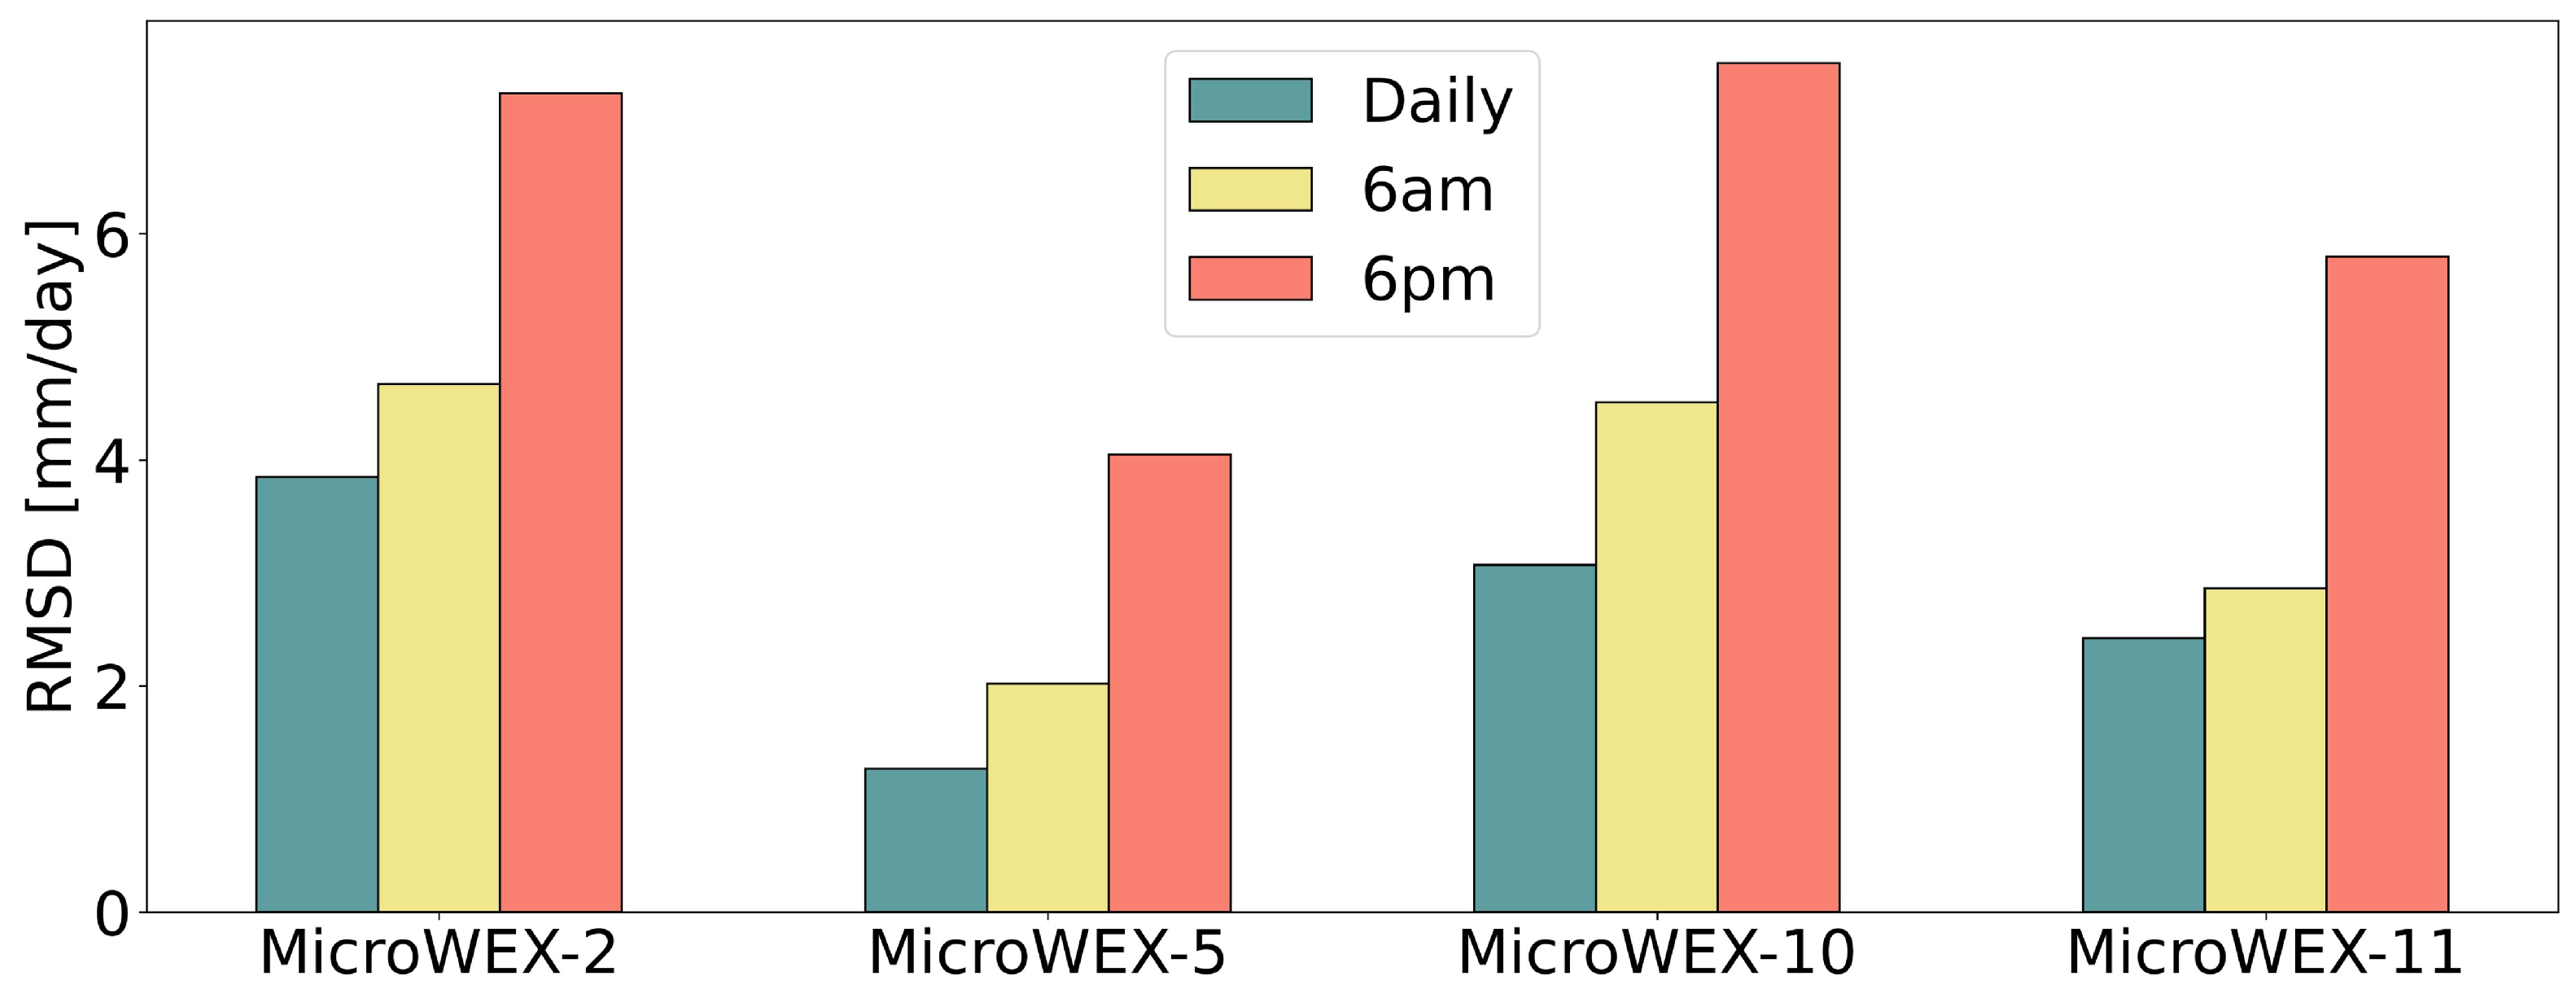
Figure 6 and Figure 7 compare the performance of using daily averages versus using 6 am or 6 pm SM values. Observations at 6 am showed similar results to those obtained with daily averages, with a slight decrease in both the occurrence detection and the accuracy of water amount. However, a significant decline in the occurrence detection is observed when using 6 pm measurements in most cases, with doubled FAR values ranging from 0.34 to 0.45 for MicroWEX-11 and MicroWEX-2, respectively, and halved POD ranging from 0.74 for MicroWEX-5 and 0.38 for MicroWEX-10 (Figure 6). The CSI follows a similar pattern as that observed for the POD when using 6 pm measurements, with values ranging between 0.36 and 0.11 for MicroWEX-5 and MicroWEX-11, respectively. Water amount estimates follow a similar pattern, and RMSD values were doubled when using 6 pm data for all the MicroWEXs, ranging from 4 mm/day to 7.5 mm/day for MicroWEX-5 and MicroWEX-10, respectively (Figure 7). The fact that these findings were consistent across all MicroWExs, means daily averages, followed by 6 am observations, can provide better results regardless of weather conditions and time of the growing season. However, the results may be influenced by irrigation schedules during the MicroWEXs, since the irrigation was typically applied during daytime, with few events occurring during nighttime.
The results showed significant differences among the three observation times, suggesting that SM2RAIN is sensitive to the timing of SM observations. Morning observations can be more appropriate for retrieving irrigation estimates under the conditions at the study site. However, the findings of this study may not be extrapolated to other regions, with different irrigation systems or schedules.

4. Conclusions

Estimating irrigation occurrence and water amount through RS techniques is a challenging task, and current algorithms need to be better explored for this purpose. This study evaluated the SM2RAIN algorithm’s applicability for estimating irrigation at the field scale in subtropical humid conditions. Data from field experiments conducted during four irrigated corn growing seasons in north-central Florida were used. The algorithm effectively estimated irrigation over long-term periods in the study field, accurately capturing occurrences and amounts of water. The highest accuracy was obtained during the driest season MicroWEX-5, showing a deficiency in the algorithm distinguishing between rainfall and irrigation signals. This can be a limitation when the growing season coincides with the wet season in humid regions like Florida, such as during MicroWEX-10 and MicroWEX-11. A tendency to overestimate the irrigation water amount was observed; however, the relative differences between total observed and estimated irrigation were less than 30%.
The sensitivity analysis performed to assess the sources of uncertainty shows that setting equal values for porosity and saturation moisture levels can minimize uncertainty while maintaining the physical meaning of the SM2RAIN algorithm. Additionally, inappropriate soil thickness can lead to less accurate estimations in sandy soils. When evaluating the role of noise in input time series on the SM2RAIN performance a minimal impact was observed. However, ET and SM showed a major contribution to total irrigation water estimates. Therefore, associated biases or other sources of uncertainty in input time series can deteriorate the algorithm’s performance. Specifically, the SM2RAIN algorithm has shown sensitivity to the timing of SM observations.
In this study, results obtained from the ground-based data could not be compared with RS-based irrigation estimations due to the lack of operational satellite missions measuring SM at moderate spatial resolution during the MicroWEXs. However, findings in this study not only contribute to understanding the algorithm’s performance in sub-tropical humid conditions but also offer insights for future applications, including its potential with high-resolution products like the upcoming 200 m NISAR SM product.

Author Contributions

Conceptualization: L.A.-M., J.J., A.M.-H. and P.-W.L.; Data curation: L.A.-M., J.J., A.M.-H. and P.-W.L.; Formal analysis: L.A.-M.; Funding acquisition: J.J.; Methodology: L.A.-M., J.J., A.M.-H. and P.-W.L.; Project administration: J.J.; Software: L.A.-M.; Supervision: J.J.; Visualization: L.A.-M.; Writing—original draft: L.A.-M.; Writing—review and editing: L.A.-M., J.J., A.M.-H. and P.-W.L. All authors have read and agreed to the published version of the manuscript.

Funding

This study was supported by CIG-USDA (Award no. AGR00020960).

Data Availability Statement

All MicroWEX data are described in technical reports [31,32,33,34] and the data are available upon request from the authors.

Acknowledgments

The authors thank the anonymous reviewers for their time and suggestions to improve the manuscript.

Conflicts of Interest

The authors declare no conflicts of interest.

References

  1. FAO. The State of the World’s Land and Water Resources for Food and Agriculture—Systems at Breaking Point (SOLAW 2021); FAO: Rome, Italy, 2021. [Google Scholar] [CrossRef]
  2. Alter, R.E.; Im, E.S.; Eltahir, E.A. Rainfall consistently enhanced around the Gezira Scheme in East Africa due to irrigation. Nat. Geosci. 2015, 8, 763–767. [Google Scholar] [CrossRef]
  3. Douglas, E.M.; Beltrán-Przekurat, A.; Niyogi, D.; Pielke, R.A.; Vörösmarty, C.J. The impact of agricultural intensification and irrigation on land–atmosphere interactions and Indian monsoon precipitation—A mesoscale modeling perspective. Glob. Planet. Chang. 2009, 67, 117–128. [Google Scholar] [CrossRef]
  4. Liu, P.W.; Famiglietti, J.S.; Purdy, A.J.; Adams, K.H.; McEvoy, A.L.; Reager, J.T.; Bindlish, R.; Wiese, D.N.; David, C.H.; Rodell, M. Groundwater depletion in California’s Central Valley accelerates during megadrought. Nat. Commun. 2022, 13, 7825. [Google Scholar] [CrossRef]
  5. Nakamura, K.; Harter, T.; Hirono, Y.; Horino, H.; Mitsuno, T. Assessment of Root Zone Nitrogen Leaching as Affected by Irrigation and Nutrient Management Practices. Vadose Zone J. 2004, 3, 1353–1366. [Google Scholar] [CrossRef]
  6. McDermid, S.; Nocco, M.; Lawston-Parker, P.; Keune, J.; Pokhrel, Y.; Jain, M.; Jägermeyr, J.; Brocca, L.; Massari, C.; Jones, A.D.; et al. Irrigation in the Earth system. Nat. Rev. Earth Environ. 2023, 4, 435–453. [Google Scholar] [CrossRef]
  7. Massari, C.; Modanesi, S.; Dari, J.; Gruber, A.; De Lannoy, G.J.M.; Girotto, M.; Quintana-Seguí, P.; Le Page, M.; Jarlan, L.; Zribi, M.; et al. A Review of Irrigation Information Retrievals from Space and Their Utility for Users. Remote Sens. 2021, 13, 4112. [Google Scholar] [CrossRef]
  8. Lawston, P.M.; Santanello, J.A.; Kumar, S.V. Irrigation Signals Detected From SMAP Soil Moisture Retrievals. Geophys. Res. Lett. 2017, 44, 11860–11867. [Google Scholar] [CrossRef]
  9. Kragh, S.J.; Fensholt, R.; Stisen, S.; Koch, J. The precision of satellite-based net irrigation quantification in the Indus and Ganges basins. Hydrol. Earth Syst. Sci. 2023, 27, 2463–2478. [Google Scholar] [CrossRef]
  10. Kragh, S.J.; Dari, J.; Modanesi, S.; Massari, C.; Brocca, L.; Fensholt, R.; Stisen, S.; Koch, J. An inter-comparison of approaches and frameworks to quantify irrigation from satellite data. Hydrol. Earth Syst. Sci. 2024, 28, 441–457. [Google Scholar] [CrossRef]
  11. Zaussinger, F.; Dorigo, W.; Gruber, A.; Tarpanelli, A.; Filippucci, P.; Brocca, L. Estimating irrigation water use over the contiguous United States by combining satellite and reanalysis soil moisture data. Hydrol. Earth Syst. Sci. 2019, 23, 897–923. [Google Scholar] [CrossRef]
  12. Zohaib, M.; Choi, M. Satellite-based global-scale irrigation water use and its contemporary trends. Sci. Total Environ. 2020, 714, 136719. [Google Scholar] [CrossRef]
  13. Jalilvand, E.; Abolafia-Rosenzweig, R.; Tajrishy, M.; Kumar, S.V.; Mohammadi, M.R.; Das, N.N. Is It Possible to Quantify Irrigation Water-Use by Assimilating a High-Resolution Satellite Soil Moisture Product? Water Resour. Res. 2023, 59, e2022WR033342. [Google Scholar] [CrossRef]
  14. Abolafia-Rosenzweig, R.; Livneh, B.; Small, E.E.; Kumar, S.V. Soil Moisture Data Assimilation to Estimate Irrigation Water Use. J. Adv. Model. Earth Syst. 2019, 11, 3670–3690. [Google Scholar] [CrossRef] [PubMed]
  15. Modanesi, S.; Massari, C.; Bechtold, M.; Lievens, H.; Tarpanelli, A.; Brocca, L.; Zappa, L.; De Lannoy, G.J.M. Challenges and benefits of quantifying irrigation through the assimilation of Sentinel-1 backscatter observations into Noah-MP. Hydrol. Earth Syst. Sci. 2022, 26, 4685–4706. [Google Scholar] [CrossRef]
  16. Laluet, P.; Olivera-Guerra, L.E.; Altés, V.; Paolini, G.; Ouaadi, N.; Rivalland, V.; Jarlan, L.; Villar, J.M.; Merlin, O. Retrieving the irrigation actually applied at district scale: Assimilating high-resolution Sentinel-1-derived soil moisture data into a FAO-56-based model. Agric. Water Manag. 2024, 293, 108704. [Google Scholar] [CrossRef]
  17. Ouaadi, N.; Jarlan, L.; Khabba, S.; Ezzahar, J.; Le Page, M.; Merlin, O. Irrigation Amounts and Timing Retrieval through Data Assimilation of Surface Soil Moisture into the FAO-56 Approach in the South Mediterranean Region. Remote Sens. 2021, 13, 2667. [Google Scholar] [CrossRef]
  18. Brocca, L.; Tarpanelli, A.; Filippucci, P.; Dorigo, W.; Zaussinger, F.; Gruber, A.; Fernández-Prieto, D. How much water is used for irrigation? A new approach exploiting coarse resolution satellite soil moisture products. Int. J. Appl. Earth Obs. Geoinf. 2018, 73, 752–766. [Google Scholar] [CrossRef]
  19. Dari, J.; Brocca, L.; Quintana-Seguí, P.; Escorihuela, M.J.; Stefan, V.; Morbidelli, R. Exploiting high-resolution remote sensing soil moisture to estimate irrigation water amounts over a Mediterranean region. Remote Sens. 2020, 12, 2593. [Google Scholar] [CrossRef]
  20. Dari, J.; Quintana-Seguí, P.; Morbidelli, R.; Saltalippi, C.; Flammini, A.; Giugliarelli, E.; Escorihuela, M.J.; Stefan, V.; Brocca, L. Irrigation estimates from space: Implementation of different approaches to model the evapotranspiration contribution within a soil-moisture-based inversion algorithm. Agric. Water Manag. 2022, 265, 107537. [Google Scholar] [CrossRef]
  21. Zhang, K.; Li, X.; Zheng, D.; Zhang, L.; Zhu, G. Estimation of Global Irrigation Water Use by the Integration of Multiple Satellite Observations. Water Resour. Res. 2022, 58, e2021WR030031. [Google Scholar] [CrossRef]
  22. Jalilvand, E.; Tajrishy, M.; Ghazi Zadeh Hashemi, S.A.; Brocca, L. Quantification of irrigation water using remote sensing of soil moisture in a semi-arid region. Remote Sens. Environ. 2019, 231, 111226. [Google Scholar] [CrossRef]
  23. Dari, J.; Brocca, L.; Modanesi, S.; Massari, C.; Tarpanelli, A.; Barbetta, S.; Quast, R.; Vreugdenhil, M.; Freeman, V.; Barella-Ortiz, A.; et al. Regional data sets of high-resolution (1 and 6 km) irrigation estimates from space. Earth Syst. Sci. Data 2023, 15, 1555–1575. [Google Scholar] [CrossRef]
  24. Entekhabi, D.; Njoku, E.G.; O’Neill, P.E.; Kellogg, K.H.; Crow, W.T.; Edelstein, W.N.; Entin, J.K.; Goodman, S.D.; Jackson, T.J.; Johnson, J.; et al. The Soil Moisture Active Passive (SMAP) Mission. Proc. IEEE 2010, 98, 704–716. [Google Scholar] [CrossRef]
  25. Filippucci, P.; Tarpanelli, A.; Massari, C.; Serafini, A.; Strati, V.; Alberi, M.; Raptis, K.G.C.; Mantovani, F.; Brocca, L. Soil moisture as a potential variable for tracking and quantifying irrigation: A case study with proximal gamma-ray spectroscopy data. Adv. Water Resour. 2020, 136, 103502. [Google Scholar] [CrossRef]
  26. Clothier, B.E.; Green, S.R. Rootzone processes and the efficient use of irrigation water. Agric. Water Manag. 1994, 25, 1–12. [Google Scholar] [CrossRef]
  27. McDonald, R.I.; Girvetz, E.H. Two Challenges for U.S. Irrigation Due to Climate Change: Increasing Irrigated Area in Wet States and Increasing Irrigation Rates in Dry States. PLoS ONE 2013, 8, e65589. [Google Scholar] [CrossRef]
  28. Dieter, C.A.; Maupin, M.A.; Caldwell, R.R.; Harris, M.A.; Ivahnenko, T.I.; Lovelace, J.K.; Barber, N.L.; Linsey, K.S. Estimated use of water in the United States in 2015. Circular 2018, 1441, 1–65. [Google Scholar] [CrossRef]
  29. Shin, S.; Her, Y.G.; Zhang, G.; Lusher, W. What Does Florida Weather during the Past 20 Years Look Like? Florida Weather Represented by the Florida Automated Weather Network (FAWN): AE537, 1/2020. EDIS 2020, 2020, 1–8. [Google Scholar] [CrossRef]
  30. Lal, P.; Singh, G.; Das, N.N.; Entekhabi, D.; Lohman, R.; Colliander, A.; Pandey, D.K.; Setia, R.K. A multi-scale algorithm for the NISAR mission high-resolution soil moisture product. Remote Sens. Environ. 2023, 295, 113667. [Google Scholar] [CrossRef]
  31. Judge, J.; Casanova, J.; Lin, T.Y.; Tien, K.J.C.; Jang, M.Y.; Lanni, O.; Miller, L. Field Observations During the Second Microwave Water and Energy Balance Experiment (MicroWEX-2): From March 17 through June 3, 2004. EDIS 2005, CIR1480, 1–47. Available online: https://edis.ifas.ufl.edu/publication/AE360 (accessed on 26 August 2024).
  32. Casanova, J.; Yan, F.; Jang, M.y.; Fernandez, J.; Judge, J.; Slatton, C.; Calvin Tien, K.J.; Lin, T.y.; Lanni, O.; Miller, L.; et al. Field Observations During the Fifth Microwave Water and Energy Balance Experiment (MicroWEX-5): From March 9 through May 26, 2006. EDIS Circular 2007, 1514, 1–45. Available online: https://edis.ifas.ufl.edu/publication/AE407 (accessed on 26 August 2024). [CrossRef]
  33. Bongiovanni, T.; Liu, P.W.; Nagarajan, K.; Preston, D.; Rush, P.; Duan, X.; Chen, G.; Terwilleger, R.; Monsivais-Huertero, A.; Judge, J.; et al. Field Observations during the Tenth Microwave Water and Energy Balance Experiment (MicroWEX-10): From March 1, 2011, through January 5, 2012. EDIS 2015, AE512, 1–97. Available online: https://edis.ifas.ufl.edu/publication/AE512 (accessed on 26 August 2024).
  34. Bongiovanni, T.; Liu, P.W.; Nagarajan, K.; Preston, D.; Rush, P.; Van Emmerik, T.H.M.; Steele-Dunne, S.; Terwilleger, R.; Baar, E.; Wallace, M.; et al. Field Observations during the Eleventh Microwave Water and Energy Balance Experiment (MicroWEX-11): From April 25, 2012, through December 6, 2012. EDIS 2015, AE514, 1–86. Available online: https://edis.ifas.ufl.edu/publication/AE514 (accessed on 26 August 2024).
  35. USDA. National Agricultural Statistics Service 2023 Florida State Agriculture Overview. 2024. Available online: https://www.nass.usda.gov/Quick_Stats/Ag_Overview/stateOverview.php?state=FLORIDA (accessed on 12 August 2024).
  36. Wright, D.L.; Rowland, D.; Sidhu, S. Water Use and Irrigation Management of Agronomic Crops. EDIS. 2022, Volume SS-AGR-15, pp. 1–5. Available online: https://edis.ifas.ufl.edu/publication/AA131 (accessed on 26 August 2024).
  37. Dewitz, J. National Land Cover Database (NLCD) 2021 Products; U.S. Geological Survey, Earth Resources Observation and Science (EROS) Center: Sioux Falls, SD, USA, 2023.
  38. Wilson, K.B.; Hanson, P.J.; Mulholland, P.J.; Baldocchi, D.D.; Wullschleger, S.D. A comparison of methods for determining forest evapotranspiration and its components: Sap-flow, soil water budget, eddy covariance and catchment water balance. Agric. For. Meteorol. 2001, 106, 153–168. [Google Scholar] [CrossRef]
  39. Ferrarezi, R.S.; Nogueira, T.A.R.; Zepeda, S.G.C. Performance of Soil Moisture Sensors in Florida Sandy Soils. Water 2020, 12, 358. [Google Scholar] [CrossRef]
  40. Lusher, W.; Jackson, J.L.; Morgan, K. The Florida Automated Weather Network: Ten Years of Providing Weather Information to Florida Growers. Proc. Fla. State Hort. Soc. 2008, 121, 69–74. [Google Scholar] [CrossRef]
  41. Peeling, J.A.; Judge, J.; Misra, V.; Jayasankar, C.B.; Lusher, W.R. Gap-free 16-year (2005–2020) sub-diurnal surface meteorological observations across Florida. Sci. Data 2023, 10, 907. [Google Scholar] [CrossRef] [PubMed]
  42. Brooks, R.H.; Corey, A.T. Hydraulic Properties of Porous Media; Colorado State University: Fort Collins, CO, USA, 1965. [Google Scholar]
  43. Fernández-Gálvez, J.; Simmonds, L.P.; Barahona, E. Estimating detailed soil water profile records from point measurements. Eur. J. Soil Sci. 2006, 57, 708–718. [Google Scholar] [CrossRef]
  44. Feldman, A.F.; Short Gianotti, D.J.; Dong, J.; Akbar, R.; Crow, W.T.; McColl, K.A.; Konings, A.G.; Nippert, J.B.; Tumber-Dávila, S.J.; Holbrook, N.M.; et al. Remotely Sensed Soil Moisture Can Capture Dynamics Relevant to Plant Water Uptake. Water Resour. Res. 2023, 59, e2022WR033814. [Google Scholar] [CrossRef]
  45. Casanova, J.J.; Judge, J. Estimation of energy and moisture fluxes for dynamic vegetation using coupled SVAT and crop-growth models. Water Resour. Res. 2008, 44, W07415. [Google Scholar] [CrossRef]
  46. Monsivais-Huertero, A.; Judge, J.; Steele-Dunne, S.; Liu, P.W. Impact of Bias Correction Methods on Estimation of Soil Moisture When Assimilating Active and Passive Microwave Observations. IEEE Trans. Geosci. Remote Sens. 2016, 54, 262–278. [Google Scholar] [CrossRef]
  47. Allen, R.; Pereira, L.; Raes, D.; Smith, M. Crop Evapotranspiration—Guidelines for Computing Crop Water Requirements—FAO Irrigation and Drainage Paper 56; FAO: Rome, Italy, 1998. [Google Scholar]
  48. Penman, H.L. Natural evaporation from open water, bare soil and grass. Proc. R. Soc. Lond. Ser. A Math. Phys. Sci. 1948, 193, 120–145. [Google Scholar]
  49. Monteith, J.L. Evaporation and Environment. The state and movement of water in living organism. Symp. Soc. Exp. Biol. 1965, 19, 205–234. [Google Scholar]
  50. Baldwin, D.; Manfreda, S.; Keller, K.; Smithwick, E.A. Predicting root zone soil moisture with soil properties and satellite near-surface moisture data across the conterminous United States. J. Hydrol. 2017, 546, 393–404. [Google Scholar] [CrossRef]
  51. Lai, Y.; Tian, J.; Kang, W.; Gao, C.; Hong, W.; He, C. Rainfall estimation from surface soil moisture using SM2RAIN in cold mountainous areas. J. Hydrol. 2022, 606, 127430. [Google Scholar] [CrossRef]
  52. Moriasi, D.N.; Arnold, J.G.; Van Liew, M.W.; Bingner, R.L.; Harmel, R.D.; Veith, T.L. Model evaluation guidelines for Systematic Quantification of Accuracy in Watershed Simulations. Trans. ASABE 2007, 50, 885–900. [Google Scholar] [CrossRef]
  53. Ferretti, F.; Saltelli, A.; Tarantola, S. Trends in sensitivity analysis practice in the last decade. Sci. Total Environ. 2016, 568, 666–670. [Google Scholar] [CrossRef] [PubMed]
  54. Glenn, E.P.; Huete, A.R.; Nagler, P.L.; Hirschboeck, K.K.; Brown, P. Integrating Remote Sensing and Ground Methods to Estimate Evapotranspiration. Crit. Rev. Plant Sci. 2007, 26, 139–168. [Google Scholar] [CrossRef]
  55. Wang, Y.; Zhang, Y.; Yu, X.; Jia, G.; Liu, Z.; Sun, L.; Zheng, P.; Zhu, X. Grassland soil moisture fluctuation and its relationship with evapotranspiration. Ecol. Indic. 2021, 131, 108196. [Google Scholar] [CrossRef]
  56. Colliander, A.; Jackson, T.J.; Bindlish, R.; Chan, S.; Das, N.; Kim, S.B.; Cosh, M.H.; Dunbar, R.S.; Dang, L.; Pashaian, L.; et al. Validation of SMAP surface soil moisture products with core validation sites. Remote Sens. Environ. 2017, 191, 215–231. [Google Scholar] [CrossRef]
  57. Hillel, D. Environmental Soil Physics; Academic Press: San Diego, CA, USA, 1998. [Google Scholar]
  58. Beck, H.E.; Pan, M.; Miralles, D.G.; Reichle, R.H.; Dorigo, W.A.; Hahn, S.; Sheffield, J.; Karthikeyan, L.; Balsamo, G.; Parinussa, R.M.; et al. Evaluation of 18 satellite- and model-based soil moisture products using in situ measurements from 826 sensors. Hydrol. Earth Syst. Sci. 2021, 25, 17–40. [Google Scholar] [CrossRef]
Figure 1. Location of the Plant Science Research and Education Unit (PSREU) in Florida, US. Background source: the National Land Cover Database [37].
Water 16 02445 g001
Figure 2. Daily series of water inputs for each MicroWEX. Values for each day of the year (DOY) observed during the MicroWEXs and estimated with SM2RAIN irrigation water are shown in blue and orange bars, respectively. Rainfall rates are displayed in gray. Amount in mm of total precipitation ( P P T T ), observed irrigation ( I R R M i c r o W E X ) and estimated irrigation ( I R R S M 2 R A I N ) accumulated during each growing season are also displayed.
Water 16 02445 g002
Figure 3. Sensitivity to static soil parameters for MicroWEX-2 (top row) and MicroWEX-5 (bottom row): porosity, n, (a,e), saturated moisture content, θ s , (b,f), equal n and θ s (c,g) and soil thickness, Z, (d,h). Blue lines represent the difference in percentage ( % D ) between the total estimated and observed irrigation water amount during the growing season, and the red lines represent the critical success index (CSI) for irrigation occurrence detection.
Water 16 02445 g003
Figure 4. Sensitivity to time series parameters for MicroWEX-2 (top row) and MicroWEX-5 (bottom row) for ET (a,d), SM (b,e), and drainage (c,f) noise. The difference in percentage ( % D ) between the total estimated and observed irrigation water amount during the growing season is shown in blue, and the critical success index (CSI) for irrigation occurrence detection is shown in red. Solid lines indicate the median of the repetitions that introduce random noise, while the colored areas represent the range between the 75th and 25th percentiles.
Water 16 02445 g004
Figure 5. Contributions in percentage of S ( t ) , e ( t ) and g ( t ) terms from Equation (1a) to the total estimated irrigation amount of water during the growing season for each MicroWEX.
Water 16 02445 g005
Figure 6. Metrics used for evaluating SM2RAIN capability to detect irrigation occurrences during the different MicroWEXs when utilizing daily SM observations, as well as utilizing solely at 6 am and 6 pm observations.
Water 16 02445 g006
Figure 7. RMSD between the estimated with SM2RAIN and observed irrigation water amounts when utilizing daily SM observations, as well as utilizing solely at 6 am and 6 pm observations during the different MicroWEXs.
Water 16 02445 g007
Table 1. Weather conditions and irrigation practices during the corn growing seasons used in this study.
MicroWEX-2MicroWEX-5MicroWEX-10MicroWEX-11
Year2004200620112012
PeriodApr–MayMarch–MayJuly–SepAug–Oct
Total rainfall (mm) [No. events (days)]91.01 [8]63.54 [8]175.77 [20]147.28 [18]
Total irrigation (mm) [No. events (days)]115.33 [15]144.63 [19]151.88 [13]61.34 [5]
Minimum–maximum temperatures (°C)13.57–28.0613.84–27.9323.15–34.2221.01–31.20
Average PET (mm/day)4.835.194.513.58
Table 2. Fixed baseline and range of values for each parameter used in the OAT analysis.
ParameterUnitBaselineRange
Porosity (n)[-]0.340.2–0.6
Saturated moisture content ( θ s ) m 3 m 3 0.340.2–0.6
Soil thickness (Z)mm16040–300
Table 3. Metrics used for evaluating SM2RAIN performance for irrigation estimation during the different MicroWEXs: the unit-less false alarm ratio (FAR), probability of detection (POD) and critical success index (CSI), the total deviation in percentage ( % D ), the root mean squared deviation (RMSD) expressed in mm/day, and the Nash–Sutcliffe Efficiency (NSE).
FARPODCSI % D RMSDNSE
MicroWEX-20.090.860.716.593.840.33
MicroWEX-50.151.000.7312.141.260.89
MicroWEX-100.180.850.55−17.803.070.70
MicroWEX-110.181.000.4230.192.420.63
Disclaimer/Publisher’s Note: The statements, opinions and data contained in all publications are solely those of the individual author(s) and contributor(s) and not of MDPI and/or the editor(s). MDPI and/or the editor(s) disclaim responsibility for any injury to people or property resulting from any ideas, methods, instructions or products referred to in the content.