Article

Study on Leakage Assessment and Stability Analysis of Water Level Changes in Tunnels near Reservoirs

1
School of Architectural and Civil Engineering, Shenyang University, Shenyang 110044, China
2
Northeast Geological S&T Innovation Center of China Geological Survey, Shenyang 110044, China
3
School of Civil Engineering, Shandong Jianzhu University, Jinan 250101, China
*
Author to whom correspondence should be addressed.
Water 2024, 16(17), 2378; https://doi.org/10.3390/w16172378
Submission received: 26 July 2024 / Revised: 21 August 2024 / Accepted: 22 August 2024 / Published: 24 August 2024

Abstract

:
The geological and hydrological conditions of tunnels near reservoirs are complex, and the impact of water level changes on the stability and leakage assessment of the lining structure is not considered in the current leakage evaluation. In order to construct an evaluation model for leakage level of tunnels near reservoirs, the influences of water level changes on tunnel stability and changes in environmental conditions on the leakage of tunnels were researched. Based on the AHP and extensibility theory, a hierarchical system for leakage assessment was created, incorporating values from nine indexes representing three aspects: geological conditions, hydrological conditions, and tunnel engineering. Numerical simulation was used to analyze the influence of water level changes. It was found that the water level change index greatly influences the displacement and stress distribution inside the tunnel structure. The leakage evaluation model was applied to the Tiebeishan Tunnel, resulting in a rating of 3, indicating medium-level leakage. Attention should be paid to water leakage in tunnels with changes in reservoir water levels. The leakage evaluation model for tunnels near reservoirs can effectively assess leakage levels under various conditions, providing a reference for safety assessments of tunnel leakage near reservoirs.

1. Introduction

With the gradual improvement of China’s comprehensive transportation system, tunnel engineering construction is in a phase of rapid development. However, complex geological conditions and operational environments can affect the structural performance of tunnels, disrupt normal traffic flow, and even jeopardize tunnel stability and road safety [1,2,3]. Extensive research has been conducted on tunnel structural safety evaluations, with both domestic and international researchers employing qualitative and quantitative methods to analyze them, achieving notable results [4,5,6].
Hamidi et al. [7] conducted a safety assessment based on the analytic hierarchy process for uncertain factors such as geological and geotechnical activities during tunnel construction. Hyun et al. [8] applied fault tree analysis to categorize risk factors into geological, design, construction, and management aspects, combining this with AHP to evaluate and analyze shield tunnel risks. Park et al. [9] evaluated the safety of common tunnel defects, categorizing tunnel lining structure conditions into five levels based on defined defect indicators. However, given the intricate and dynamic geological conditions in tunnels and underground engineering, waterproofing measures are influenced by construction conditions and external factors, thereby making leakage a critical factor impacting the safety of underground engineering.
In recent years, significant progress has been made in the research on tunnel leakage. Gong et al. [10] analyzed the types and causes of leakage in tunnels and underground engineering and proposed a concept of leakage prevention throughout the life cycle from the design and construction stages to the service period. The researchers discussed methods for detecting leakage, treatment measures, and innovative grouting materials, establishing a solid foundation for practical implementation and further research on leakage prevention in tunnel and underground engineering. Yang et al. [11] analyzed the interaction mechanisms between groundwater and surrounding rock using experimental and numerical simulation methods and investigated the disaster evolution process and patterns of karst cave water bursts in deep high-pressure tunnels. Li et al. [12] studied a risk assessment system for karst tunnel water inrush by combining geographic information systems (GIS) with the analytic hierarchy process (AHP), enabling real-time assessment of karst tunnel water inrush. Jiang et al. [13] employed matter element analysis and AHP to determine evaluation indicators, which are based on geological and hydrological conditions, to construct a predictive model for tunnel water inrush disasters. Based on distance discriminant analysis theory, Pan [14] established a classification prediction and analysis model for tunnel seepage water diseases, conducting evaluations of seepage water disease levels using fuzzy comprehensive evaluation and BP neural network methods and developing a visualization program, laying a theoretical foundation for preventing tunnel seepage water. Based on an improved generative adversarial network (GAN) and Swin Transformer model, Wu et al. [15] established a Swin Transformer model to visualize and reconstruct the 3D coordinates of the leakage area and realized the quantitative evaluation of the leakage area. The segmentation results achieves mAcc, mIoU, mF score, mPrecision, and mRecall metrics of 93.1%, 91.5%, 82.83%, 85.62%, and 80.3%, respectively. Feng et al. [16] constructed forty U-shaped semantic segmentation models by deep learning, a leakage detection scheme with the best efficiency and accuracy was proposed, and a quantitative comparison was made with the existing dominant approaches, which can quickly and accurately assess the health status of subway tunnels. Lai et al. [17] focused on lining concrete with two types of defects, namely, holes and cracks, and used TOUGH2 (V2.0) software to assess the impact of different seepage conditions on tunnel water leakage. The results indicated that fernal water pressure and defect size have a significant effect on water leakage. Sun et al. [18] analyzed the interaction between tunnel structures and different soils, such as sandy soil and clay, during the process of water level changes through model experiments. It was found that the structures exhibited periodic sinking and floating behavior, with significant subsidence occurring in the final stage of water level decline. These achievements provided significant understanding of tunnel seepage water diseases, detection methods, and safety assessments. However, there is limited research on the types of tunnel seepage water diseases near reservoir tunnels and their impact on structures.
Currently, several scholars are investigating the stress characteristics and drainage technologies of tunnels near reservoirs. Li et al. [19], focusing on subsea tunnels, discovered that both external water pressure and water inflow in the grouting area increase linearly with rising groundwater levels by comparing analytical and numerical solutions of pore pressure distribution and water inflow. Zhang et al. [20] examined the impact of different water storage conditions at the Longsheng Reservoir on the seepage and stress fields of tunnels near reservoirs during construction and operation, proposing potential risks and improvement measures. Shen [21] researched drainage schemes for tunnels near reservoirs, analyzed the effects of various schemes on water pressure distribution and lining stress, and evaluated the applicability of drainage and water-blocking schemes. Chen [22], through on-site observation tests and three-dimensional numerical simulations, analyzed the stress and displacement changes in metro tunnel linings and surrounding rocks near reservoirs during water level fluctuations, guiding effective deformation and displacement control during operation.
In conclusion, existing research has not adequately considered the effects of external factors such as water level variations and water erosion on the safety assessment of leakage in tunnels near reservoirs. Addressing this gap, this paper analyzes the causes and influencing factors of tunnel leakage, investigates the effects of different reservoir water levels on tunnel structural stability, and establishes a hierarchical evaluation system for leakage in tunnels near reservoirs. Using the Tiebeishan Tunnel as a case study, a risk assessment of tunnel leakage diseases was conducted, and the preliminary discussion focused on the impact of factors such as changes in water pressure and water erosion on tunnel structure leakage.

2. Leakage Evaluation Model for Tunnels near Reservoirs

2.1. Analytic Hierarchy Process System

Based on the analytic hierarchy process (AHP) and extenics theory, a hierarchical model was constructed to determine the weight of each indicator, integrating qualitative and quantitative assessments for a comprehensive evaluation of tunnel leakage disease grades. During the model construction process, the rationality of the evaluation indicators directly influences the accuracy and applicability of the evaluation model. To achieve a combination of qualitative and quantitative evaluation of leakage, the hierarchical evaluation system for leakage in tunnels near reservoirs was established by referencing relevant domestic research on tunnel leakage and considering actual conditions of tunnel projects near reservoirs [23,24]. The primary goal of the model evaluation is to assess the risk of tunnel leakage near reservoirs, with secondary indicators including geological conditions, hydrological conditions, and tunnel engineering. Based on the actual situation, influential factor indicators corresponding to the secondary indicators were selected, totaling nine indicators as the basis for assessing the risk of tunnel leakage near reservoirs, as shown in Figure 1.

2.2. Classical Domain Matter Elements, Sectional Domain Matter Elements, and Target Matter Elements

Based on the matter element theory and tunnel leakage evaluation indicators, the classical domain matter element Rab, the node domain matter element RP, and the target matter element R are determined as follows:
R a b = P i , C , μ = P i C i 1 μ i 1 min , μ i 1 max C i 2 μ i 2 min , μ i 2 max C i m μ i m m i n , μ i m m a x
R p = P , C , μ p = P C 1 μ 1 min , μ 1 max C 2 μ 2 min , μ 2 max C m μ m m i n , μ m m a x
R = P C 1 μ 1 C 2 μ 2 C m μ m
where μ represents the value taken by the evaluation indicator C, which usually needs to be evaluated according to relevant norms or standards or by professional technicians. The matter element analysis method typically uses three elements, “object P”, “characteristic C”, and “value μ”, to describe and form the triplet matter element R = (P, C, μ).

2.3. Selection of Status Values for Indicators and Consistency Check

To compare the importance of various evaluation indicators, the Saaty scale method is applied [25], as shown in Table 1, and the judgment matrix is as follows in Table 2.
Based on Table 2, the weight set of tunnel leakage evaluation indicators can be obtained, and the square root method is applied to calculate the weight values:
A i = j = 1 i a i j i
where aij is the ith row and jth column element in the judgment matrix.
After normalization, the weight vectors of each indicator in the target model are obtained:
α i = A i / j = 1 n A j
The maximum eigenvalue of the judgment matrix is calculated as follows:
λ = i = 1 n R A i n A i
where R is the judgment matrix, A is the normalized vector of Ai1α2…αi…αn), and n is the order of the judgment matrix.
Finally, a consistency check is conducted, with the ratio expressed as follows:
C R = C I R I
where CI is the consistency index, CR is the consistency ratio, and RI is the random consistency index.

2.4. Correlation Calculation

The correlation degree of tunnel leakage levels is calculated based on the matter element correlation matrix, as follows:
k j i = ρ μ i , μ j i ρ μ i , μ p i ρ μ i , μ j i μ i μ j i ρ μ i , μ j i μ j i μ i μ j i
ρ μ i , μ j i = μ i 1 2 ( μ j i m i n + μ j i m a x ) 1 2 ( μ j i m a x μ j i m i n )
ρ μ i , μ p i = μ i 1 2 ( μ p i m i n + μ p i m a x ) 1 2 ( μ p i m a x μ p i m i n )
where kji represents the correlation degree of evaluation indicator i concerning evaluation level j, μji is the value range of the classical domain, and μpi is the value range of the specific domain.
After determining the weight of each matter element indicator in the evaluation model, the correlation degree of the evaluation indicators concerning the severity level of structural leakage is determined using the above formula. Consequently, the comprehensive correlation degree of each evaluation indicator concerning the evaluation level of the tunnel to be assessed is derived as follows:
k j = i = 1 n α i k j i
where αi is the weight of each evaluation indicator in the matter element model and kji represents the correlation degree of evaluation indicator i concerning tunnel leakage level j.

2.5. Determination of Water Seepage Levels

When all of the above parameters have been determined, the water leakage level of the target tunnel can be assessed:
k = max k j | j = 1 , 2 n

3. Effects of Water Level Changes on the Stability of Near-Reservoir Tunnels

3.1. Numerical Models

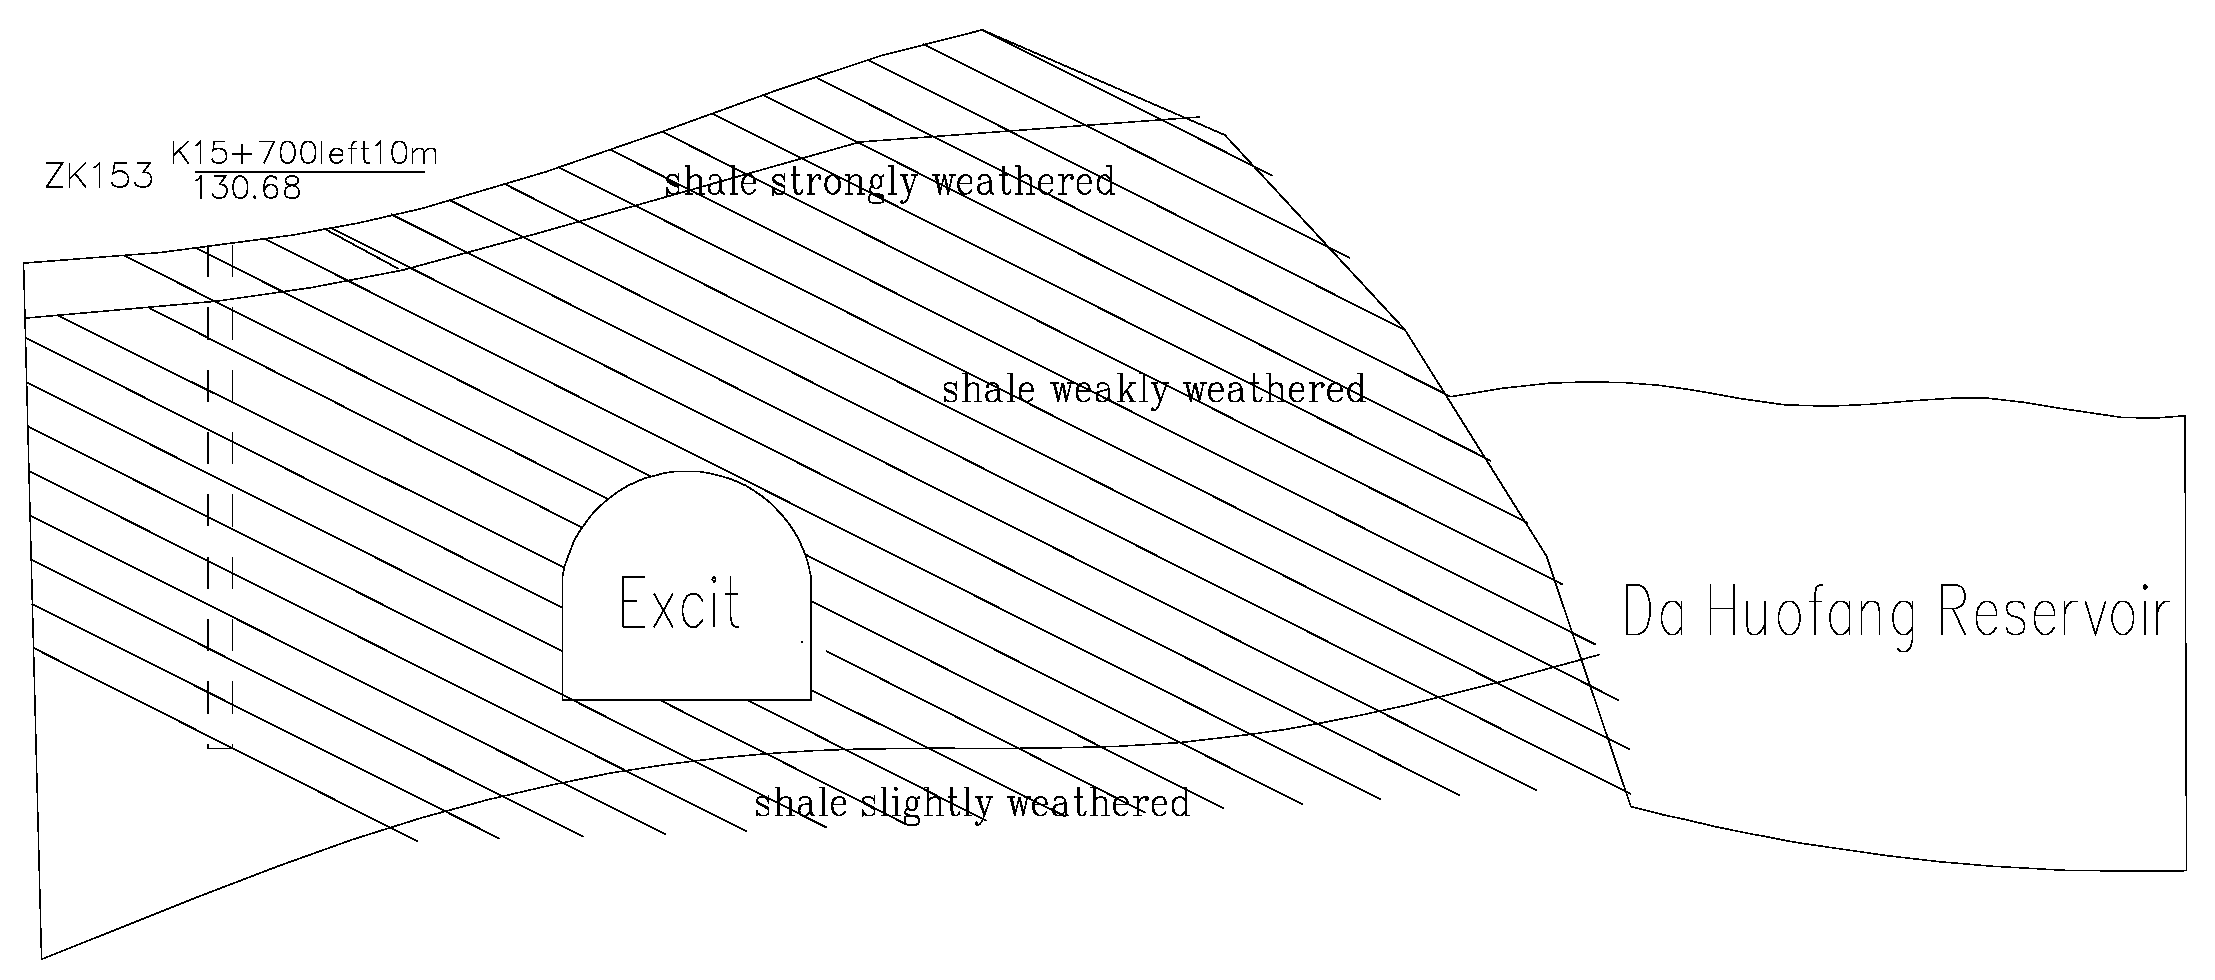
To use numerical simulation methods to explore the influence of different water levels on the stability of tunnels, FLAC3D (V5.0) finite difference software was employed for modeling, with a model plane size of 75 m × 75 m × 10 m. Figure 2 depicts the relative positions of the reservoir and the existing tunnel. The geological layers and lining were modeled using three-dimensional solid elements. The model had a buried depth of 25 m, based on actual engineering conditions. The model adopted a lateral peripheral pressure loading mode with a constant load of 0.55 MPa in the longitudinal direction and a lateral pressure coefficient of 0.5. Based on on-site borehole analysis, the surrounding rock comprised 5 m of highly weathered shale, 20 m of weakly weathered shale (Grade IV), and 20 m of slightly weathered limestone. Two types of boundary conditions were applied to the model’s perimeter, fixed and free, with no constraints applied to the top surface. The porosity of the surrounding rock was set at 0.307, and the permeability coefficient was set at 2.5 × 10⁻¹⁰ m²/(Pa·s). The seepage boundaries were impermeable on the two sides and the bottom of the model. The calculation parameters are detailed in Table 3.
Due to the reservoir being located beside the tunnel, the water level is inclined. Based on the survey data, simulations were conducted under four different conditions, with water levels set at 0 m, 5 m, 15 m, and 25 m, using the road surface as the reference point.

3.2. Calculation Results

3.2.1. Deformation Analysis

When the water level was at a high level of 25 m, the deformation of the arch reached its maximum. Under inclined water levels, the vertical displacement of the arch was the greatest, reaching 2.56 mm at the water level of 25 m, as shown in Figure 3. At the same time, the horizontal displacement of the right arch shoulder and side wall changed drastically, reaching 0.73 mm, several times greater than the condition without considering the water level effect, as shown in Figure 4. The variation in the reservoir water level significantly affected the deformation of the surrounding rock. The monitoring points rapidly increased under water pressure in a short period, with the inner-side displacement of the tunnel being larger than the outer-side due to the bias effect of the inclined water level.

3.2.2. Stress Analysis

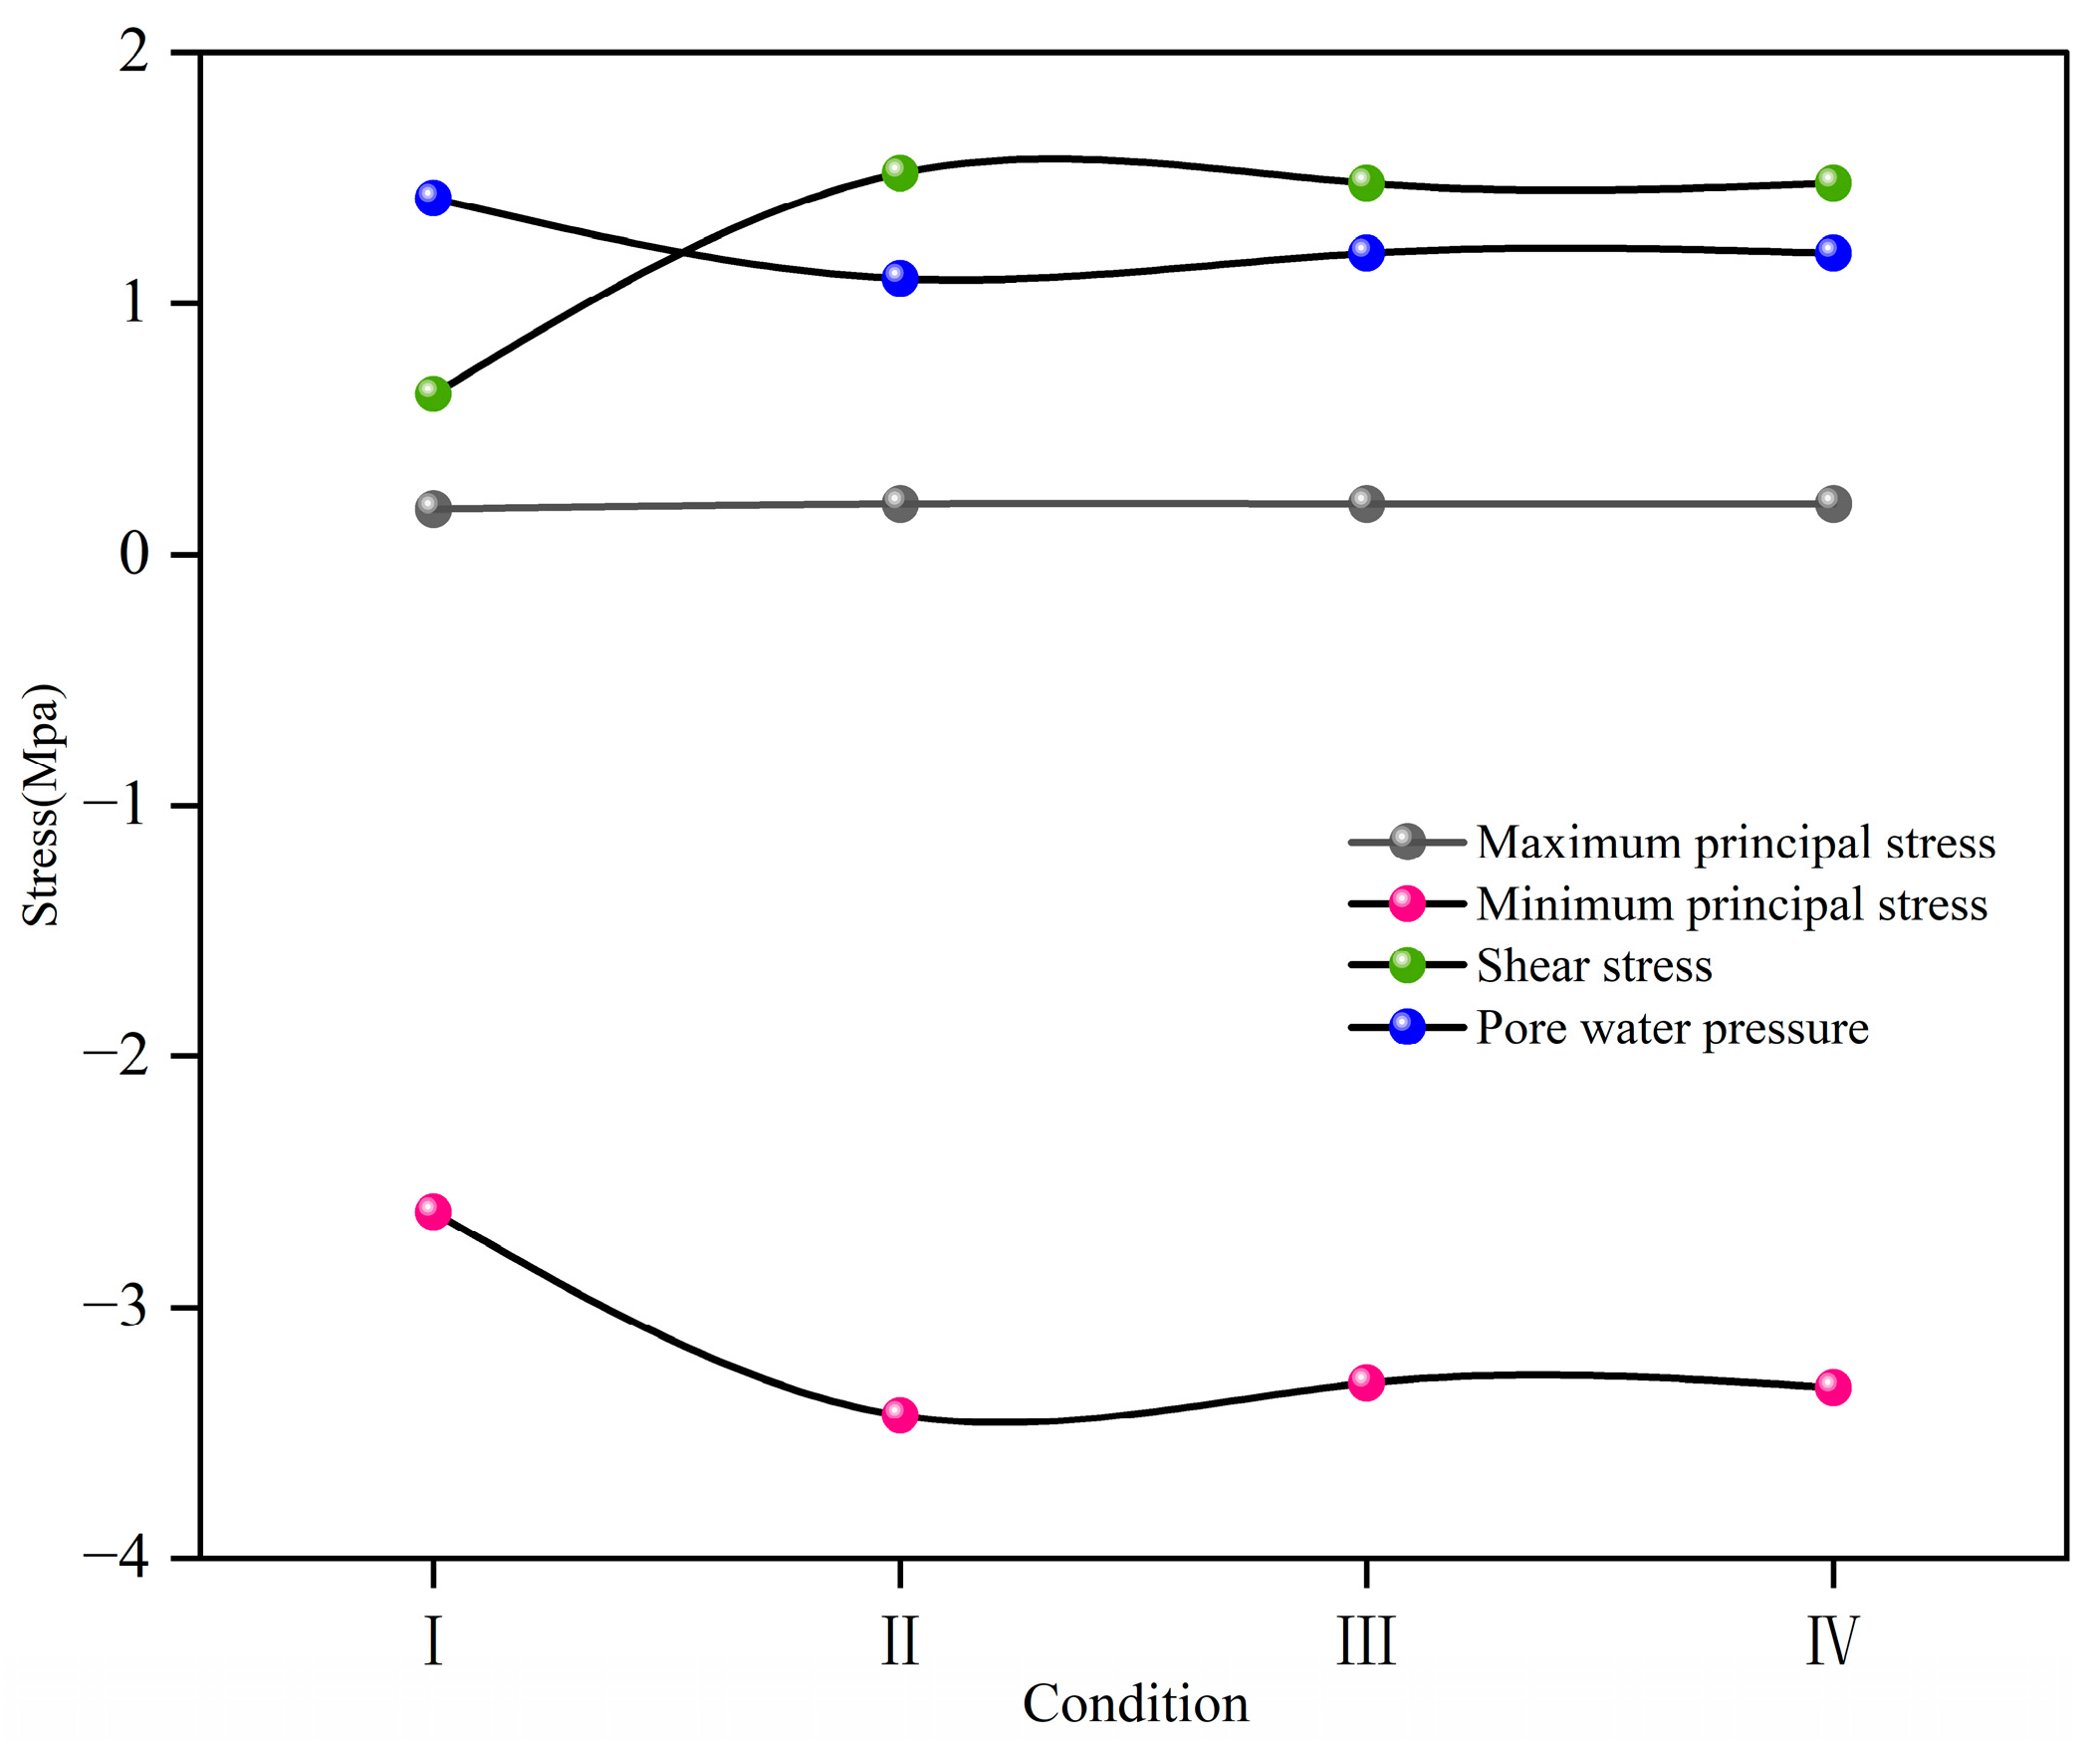
The principal stresses increased significantly with the rise of the reservoir water level. The maximum principal stress at the inner arch reached 0.21 MPa, and the compressive stress at the inner foot reached 3.45 MPa. At high water levels, the vertical stress at the inner foot reached 3.22 MPa, with the maximum horizontal stress at the foot reaching 0.98 MPa. The horizontal stress was noticeably affected by water level changes, causing variations in stress distribution. Stress concentrations appeared at the foot, shoulder, and arch, with the inner side of the water level having a larger stress concentration range than the outer side. The maximum vertical stress was at the foot, primarily due to the tunnel being in a biased pressure state from the tilted water level, as shown in Figure 5.

3.2.3. Plastic Zone Distribution

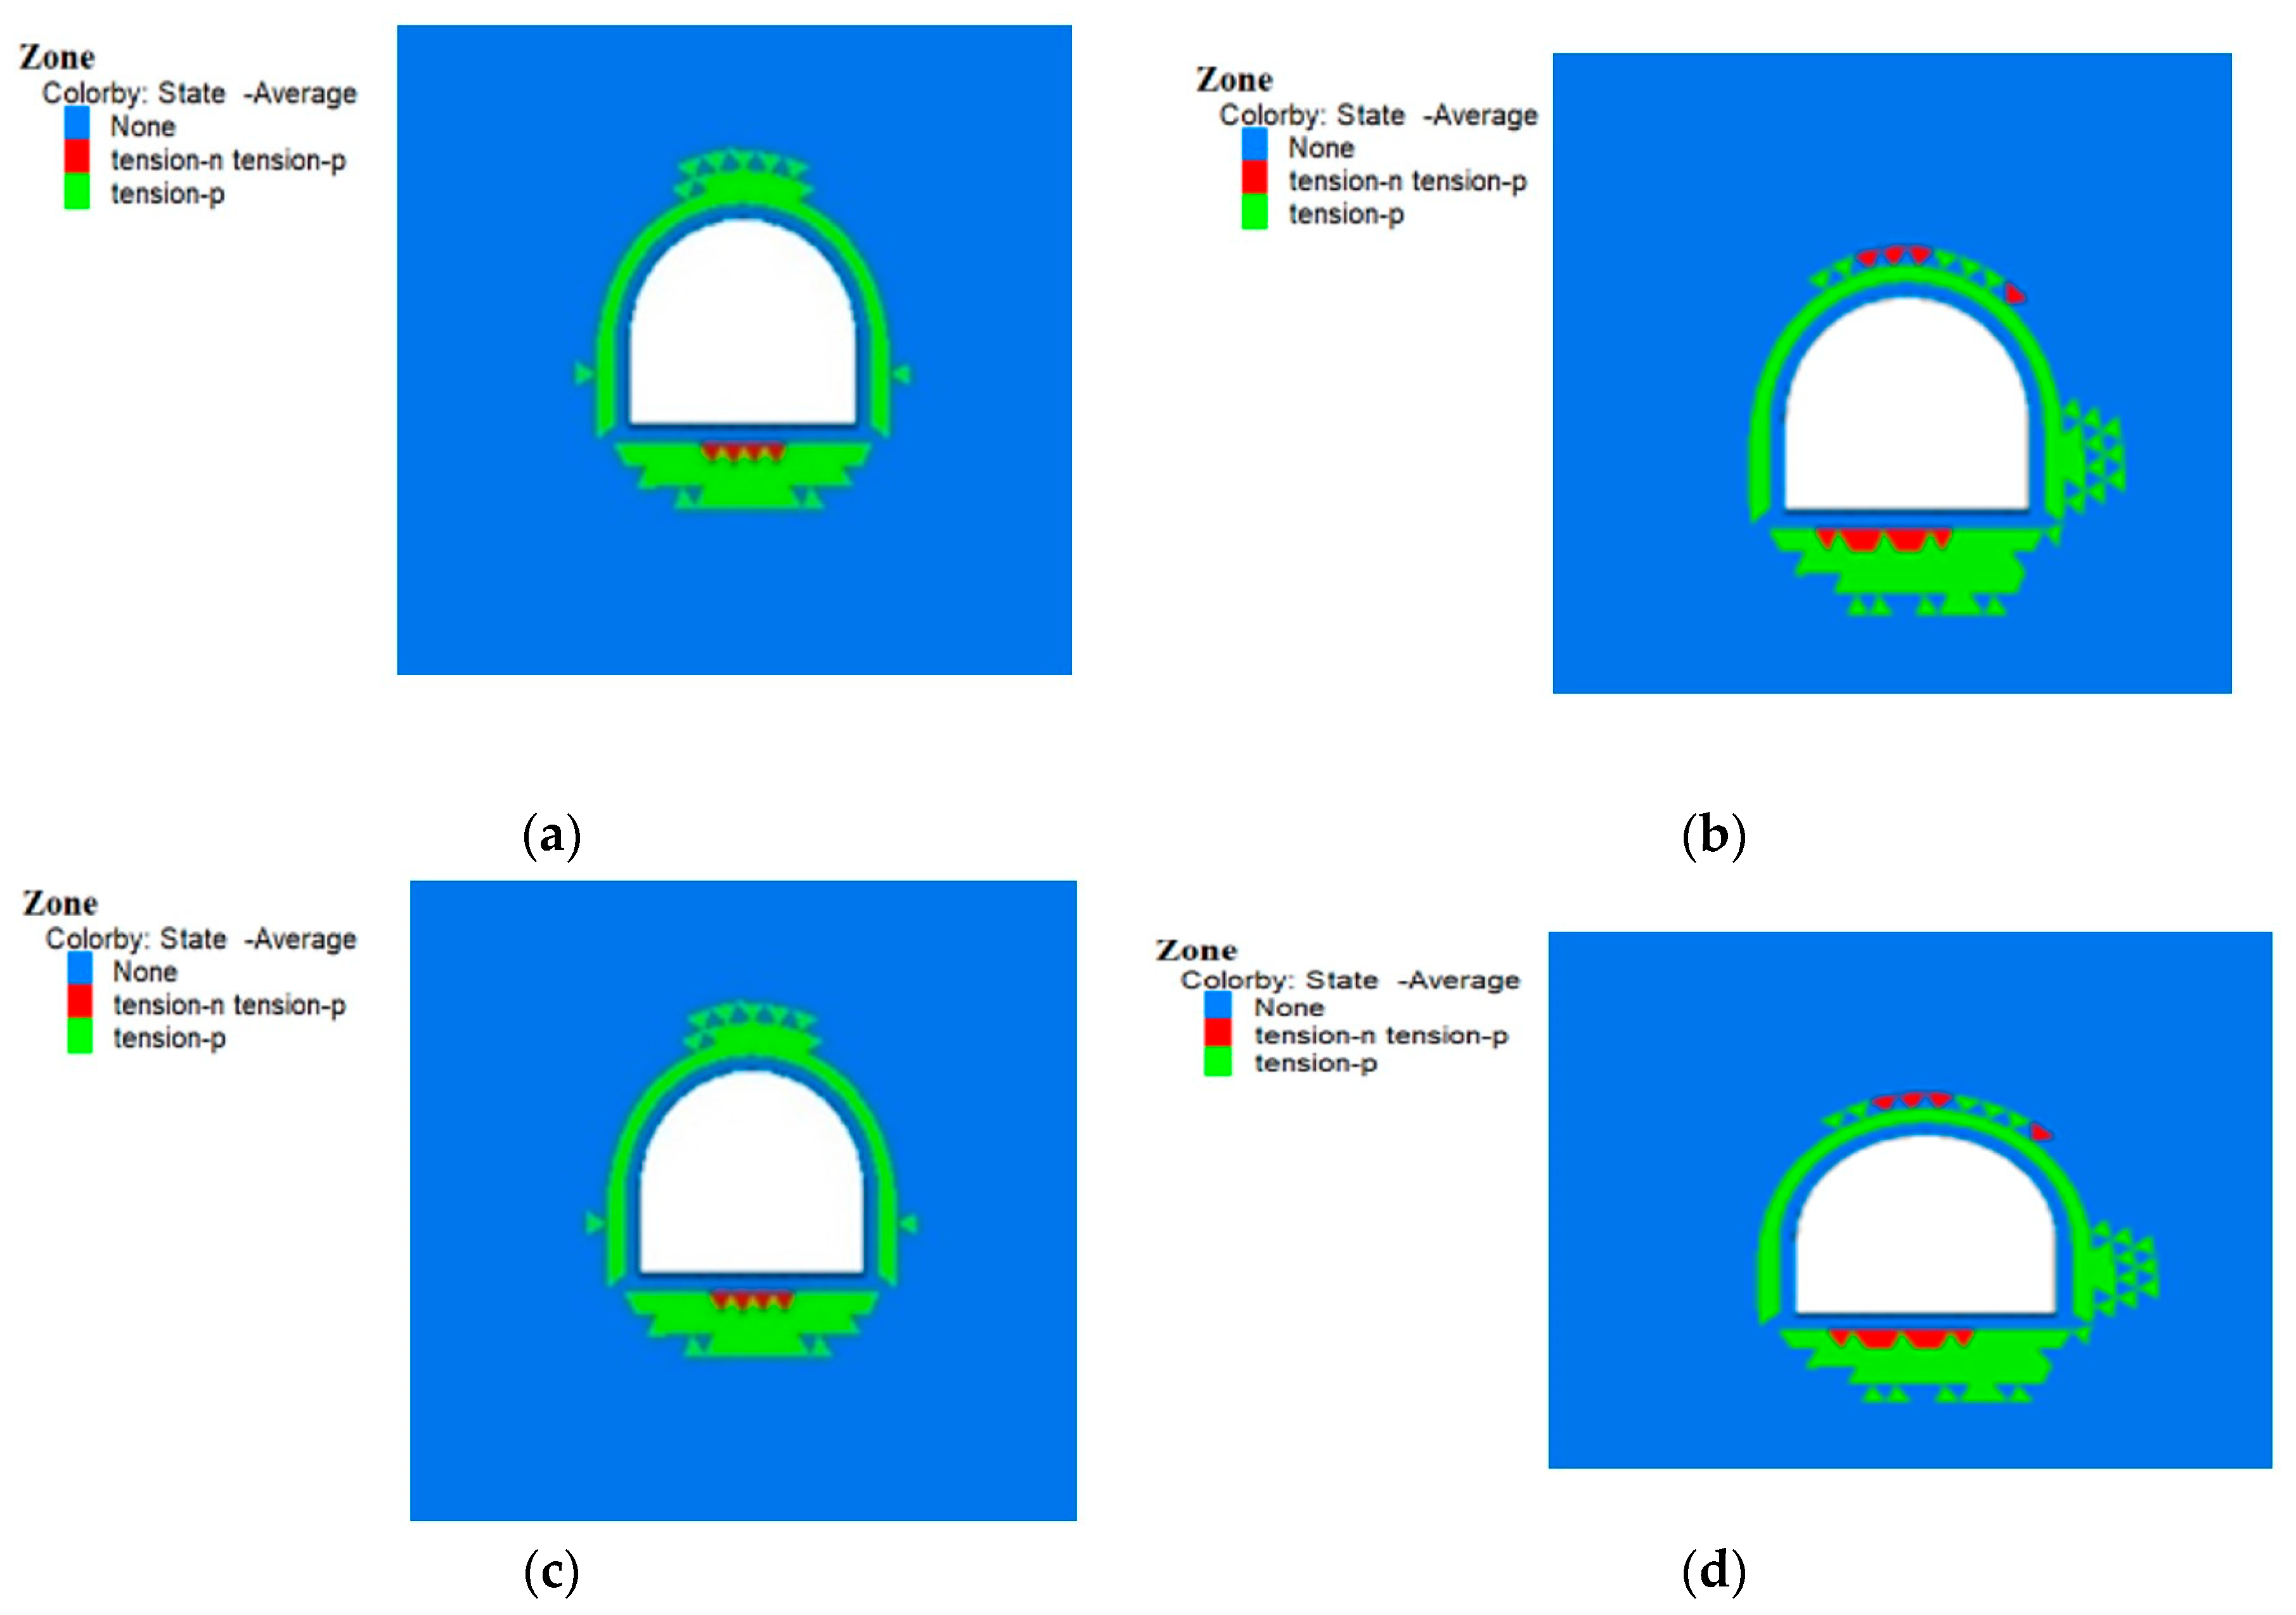
The variation in reservoir water levels affected the distribution of the plastic zone in the surrounding rock, with particular changes observed in the inner arch and side walls. With the rise of reservoir water levels, the extension range and depth of the plastic zones in the inner arch and side walls increased markedly, while the plastic zones in the outer-side walls and floor showed little change. Primarily due to the increasing water level, the pore water pressure increased, affecting the stress distribution of the surrounding rock, resulting in the continuous expansion of the plastic zone, as shown in Figure 6.
Through numerical calculations, it was found that tunnels near reservoirs are significantly affected by water level changes, reflected not only in the stress distribution and magnitude of the lining but also in the increased deformation of the lining and surrounding rock with rising water levels. The deformation and cracking of the tunnel lining and surrounding rock can lead to a gradual increase in seepage pressure, thereby affecting the degree of water leakage within the tunnel. Therefore, the reservoir water level is one of the important factors influencing the leakage grade of tunnel structures.

4. Determination of Status Values for Water Leakage Evaluation Indicators

After determining the evaluation indicators, a method for classifying the relevant indicators of the tunnel is proposed. Supplementary and quantified evaluation criteria for each status indicator are determined, with the value range set from 0 to 4, detailed in Table 4, Table 5, Table 6, Table 7, Table 8, Table 9, Table 10, Table 11 and Table 12.

4.1. Surrounding Rock Classification

The comprehensive indicators of the surrounding rock are usually determined by its classification, considering factors such as strength, structural influence, and weathering condition. Based on the rock mass rating (RMR) classification standards for rock geomechanics, a scheme for classifying the impact of tunnel leakage water is determined, as shown in Table 4.
Table 4. Parameters of Surrounding Rock Classification.
ScaleDescription of the Technical Situation
1Score of RMR classification >80
2Score of RMR classification is between 60 and 80
3Score of RMR classification is between 40 and 60
4Score of RMR classification <40

4.2. Surrounding Rock Fracture

Indicators for rock mass joints and fractures are typically evaluated using the volume of joint number in the rock mass. The development degree of rock mass joints and fractures is used to classify the water leakage levels of tunnels, as shown in Table 5.
Table 5. Evaluation criteria for surrounding rock fracture.
ScaleDescription of the Technical Situation
1Volumetric joint count of the rock mass (jv) <10 lines/m3
210 < Jv < 20 lines/m3
320 < Jv < 30 lines/m3
4Jv >30 lines/m3

4.3. Overlying Relative Water Aquicludes

The indicator for the overlying relative aquiclude is evaluated by the thickness of the aquiclude. Aquicludes refer to impermeable layers, which are rock layers and soil layers with poor permeability, making it difficult for groundwater to pass through. The classification table for tunnel water leakage levels is determined, as shown in Table 6.
Table 6. Evaluation criteria for relative water aquicludes.
ScaleRelatively Impermeable Layer Thickness
1>6 m
23~6 m
30.5~3 m
4<0.5 m

4.4. Aquifer Permeability

The seepage performance of rock mass aquifers is an important indicator for evaluating tunnel seepage water, reflecting the permeability of the rock mass. The greater the permeability, the higher the likelihood of tunnel seepage water occurrence. The permeability index of the rock mass can be represented by the permeability coefficient of the rock mass. The classification table for tunnel water leakage levels is determined, as shown in Table 7.
Table 7. Evaluation criteria for the aquifer permeability.
ScaleDescription of the Technical Situation
1Permeability coefficient (K) <10−4 (cm/s)
2Permeability coefficient (K) is between 10−4 and 0.5 × 10⁻³ (cm/s)
3Permeability coefficient (K) is between 0.5 × 10⁻³ and 10−2 (cm/s)
4Permeability coefficient (K) >10−2 (cm/s)

4.5. Water Levels of Reservoirs

The groundwater level is closely related to the overlying water pressure and the burial depth of tunnels, and this relationship is not linear. Based on the analysis of the effects of different groundwater levels on tunnel structural displacement, stress, and plastic zones, the relative depth of tunnel burial to groundwater level is used to measure the impact of reservoir water levels on tunnel water leakage. The classification table is determined, as shown in Table 8.
Table 8. Evaluation criteria for water level of reservoirs.
ScaleDescription of the Technical Situation
1Relative height greater than design pavement elevation 0~5 (m)
2Relative height greater than design pavement elevation 5~15 (m)
3Relative height greater than design pavement elevation 15~25 (m)
4Relative height greater than design pavement elevation >25 (m)

4.6. Water Erosion

Water erosion significantly impacts the durability of concrete structures. The erosion indicators are affected by the external environment and different mineral compositions of the water. The classification table for the impact of tunnel water leakage is determined, as shown in Table 9.
Table 9. Evaluation criteria for water erosion.
ScalePhErosive CO2 (mg/L)Water Cl (mg/L)
1>6.5<15<100
25.0–6.515–30100–500
34.0–5.030–60500–5000
4<4.0>60>5000

4.7. Buried Depth of Tunnels

The greater the tunnel depth, the larger the catchment area and the more groundwater supplied. Therefore, the average depth of the tunnel affects tunnel water leakage. For a specific tunnel, there is a minimum inflow depth that influences tunnel water leakage. The relative height of the minimum inflow depth can be used for evaluation. The classification table for the impact of tunnel water leakage is determined, as shown in Table 10.
Table 10. Evaluation criteria for the buried depth of tunnels.
ScaleDescription of the Technical Situation
1The tunnel depth is near the buried depth of the theoretical minimum water inflow.
2The tunnel depth is less than the theoretical minimum water inflow.
3The tunnel depth is greater than the theoretical minimum water inflow.
4The tunnel depth is far greater than the theoretical minimum water inflow.

4.8. Area of Tunnel Cross Section

After tunnel excavation, the water pressure in the surrounding area decreases, acting like a drainage channel. Therefore, the larger the cross-sectional area of the tunnel, the more serious the water leakage. The classification table for the impact of tunnel water leakage is determined, as shown in Table 11.
Table 11. Evaluation criteria for the cross section of tunnel.
ScaleDescription of the Technical Situation
1Cross-sectional area <10 (m2)
210 < cross-sectional area < 30 (m2)
330 < cross-sectional area < 50 (m2)
4cross-sectional area >50 (m2)

4.9. Tunnel Drainage Facilities for Water Leakage

Tunnel drainage systems span the design, construction, and operational service stages. The effectiveness of drainage facilities depends on whether the design is reasonable, construction quality meets standards, and regular inspections are conducted during the operational service stage. It also depends on whether issues are promptly identified and addressed. The classification table for the impact of tunnel drainage facilities on water leakage is determined, as shown in Table 12.
Table 12. Evaluation criteria for the drainage facilities.
ScaleDescription of the Technical Situation
1Well-designed anti-drainage, standardized construction, regular maintenance
2Well-designed anti-drainage, poor construction quality, regular maintenance
3Well-designed anti-drainage, poor construction quality, irregular maintenance
4Poor drainage protection design, poor construction quality, irregular maintenance

5. Leakage Evaluation of Tiebeishan Tunnel

5.1. Surrounding Rock Classification Project Overview

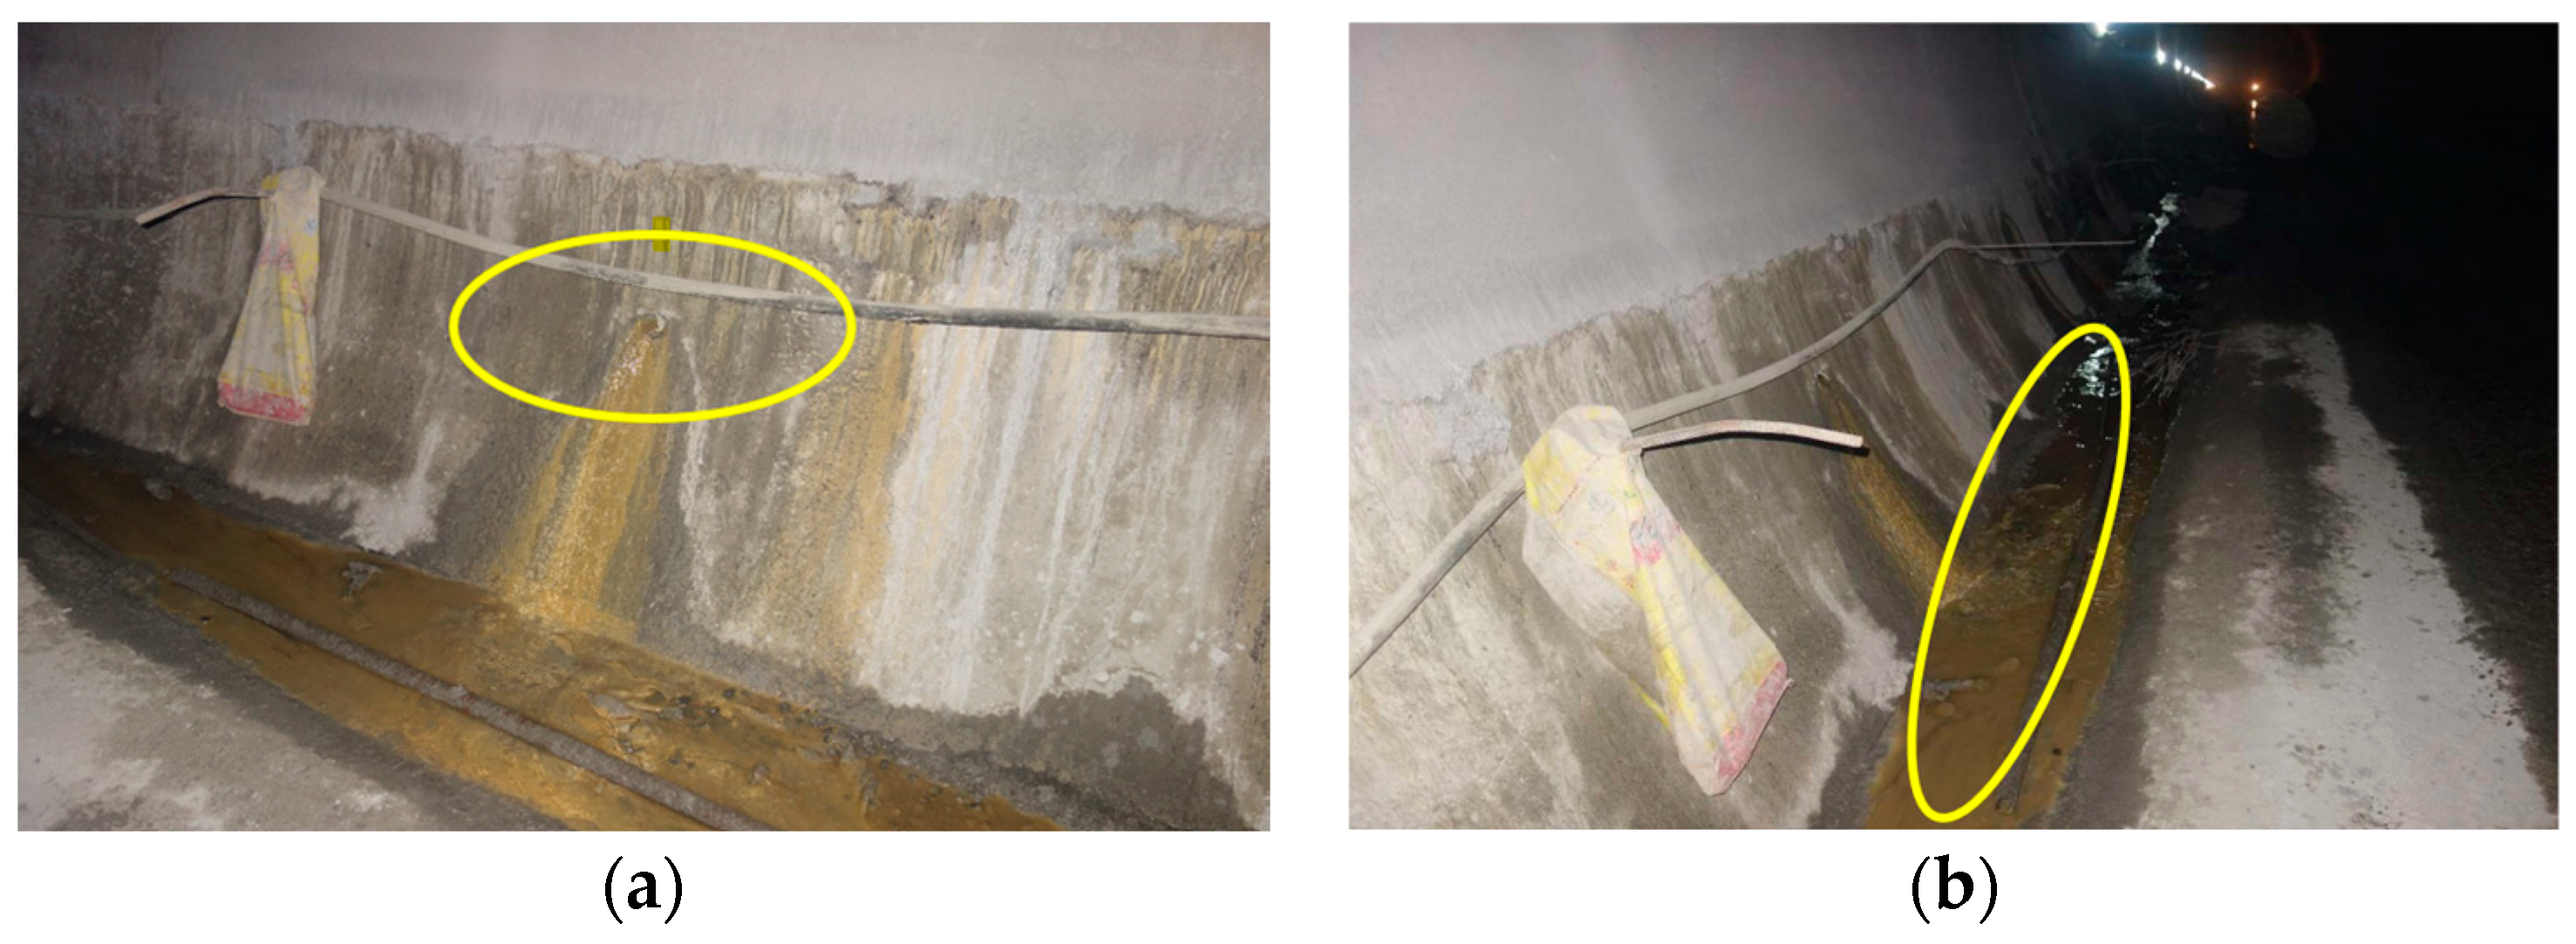
Tiebeishan Tunnel, located within the Gaoliyingzi region on the Heida line in Fushun City, Liaoning Province, China, was built in 1989. The tunnel has a total length of 178 m, a clear width of 7 m, and a vertical clearance height of 5 m. The geological conditions at the tunnel site are complex, with a maximum tunnel depth of 48 m. The surrounding rock is composed of relatively stable granite gneiss. There is a fault zone trending from northwest to southeast passing 1 km to the southeast. The joint fractures in the surrounding rock are well developed, causing varying degrees of surface water infiltration at the tunnel’s entrance and exit sections, leading to the emergence of a certain amount of groundwater. Over the years, regular inspections have found serious water leakage problems in the tunnel, as shown in Figure 7. Consequently, major repairs have been undertaken on the drainage system to address these issues.
The spatial relationship between the tunnel and the reservoir is illustrated in Figure 8. The average distance between the tunnel and the reservoir is 128 m, with the closest point being 8 m from the water source. The Dahuofang Reservoir, which holds water year-round, has a controlled catchment area of 5437 square kilometers and a total storage capacity of 21.81 billion cubic meters.
The proximity of the tunnel to the reservoir, combined with the well-developed fractures in the surrounding rock, creates a water seepage pathway on the side of the tunnel nearest to the reservoir. Changes in the reservoir water level can affect the stress on the tunnel lining structure. Inspections have confirmed severe leakage problems in the tunnel, which, at their worst, can compromise the structural stability of the tunnel and traffic safety.

5.2. Determination of the Matter Element Model

The classification of tunnel water leakage damage is divided into four categories: P1 for intact condition, P2 for minor leakage, P3 for moderate leakage, and P4 for severe leakage. After determining the classical domain and section domain of the matter element model, the matter element to be evaluated is determined based on the actual engineering situation of the Tiebeishan Tunnel.
R = P   C 1 2   C 2 3   C 3 1   C 4 2   C 5 3   C 6 2   C 7 1   C 8 3   C 9 2

5.3. Determination of Evaluation Indicator Weights and Consistency Tests

Based on the criterion of relative importance, a judgment matrix for the nine evaluation indicators in the matter element evaluation model is formed, as shown in Table 13.
After establishing the judgment matrix, the weight for each indicator and the maximum eigenvalue of the judgment matrix are calculated by Equation (4), based on the square root method.
After calculation, the values for A1, A2, A3, A4, A5, A6, A7, A8, and A9 are 2.579, 2.579, 0.416, 0.717, 1.730, 0.728, 0.364, 0.373, and 2.819, respectively. The normalized weight vector for each evaluation indicator is
A = (0.210,0.210,0.034,0.058,0.141,0.059,0.030,0.030,0.229)T
The maximum eigenvalue λ is 9.81. Therefore, the value of the consistency indicator can be derived from the following equation:
C I = λ n n 1 = 9.81 9 9 1 = 0.101
By calculating the stochastic consistency index RI as 1.46, followed by the following equation, the consistency ratio can be found.
C R = C I R I = 0.069 < 0.1
The result proves that the weight set meets the consistency test requirement. A is the calculated weight set of each matter element, representing the weight accounted for by each evaluation indicator.

5.4. Correlation Calculation and Determination of Disease Levels

Based on the four levels of the tunnel disease degree classified in Section 4.2, combined with Equations (8)–(10), the correlation of each index is calculated. The specific process is as follows:
k 11 = ρ ( μ 1 , μ 11 ) ρ ( μ 1 , μ p 1 ) ρ ( μ 1 , μ 11 ) = 1 3
k 21 = ρ ( μ 1 , μ 21 ) μ 22 = 0  
k 31 = ρ ( μ 1 , μ 31 ) ρ ( μ 1 , μ p 1 ) ρ ( μ 1 , μ 31 ) = 0  
k 41 = ρ ( μ 1 , μ 41 ) ρ ( μ 1 , μ p 1 ) ρ ( μ 1 , μ 41 ) = 1 3
where kji represents the relevance of evaluation indicator i to evaluation level j. μji denotes the value range of the classical domain, and μpi denotes the value range of the section domain. ρ(μiji) is the distance from point μi to the interval (μjiminjimax), and ρ(μipi) is the distance from point μi to the interval (μpiminpimax). The relevance matrix, which summarizes the relevance of each evaluation indicator to the different evaluation levels, is presented in Table 14.
After calculating the correlation of each evaluation indicator regarding the four classes, based on Equation (11), the combined correlation of the disease classes of the evaluation model can be calculated as follows:
k j = i = 1 n α i k j i
Calculation yields k1, k2, k3, k4 as −0.439, −0.191, −0.032, −0.228; according to the rating rules, the tunnel disease level is
k = max k j | j = 1 , 2 n = 0.032 j = 3
The evaluation grade of water leakage in the tunnel is Grade III, indicating moderate water leakage.

5.5. Analysis of Evaluation Results

Based on the theories of extenics and the analytic hierarchy process, each evaluation indicator was quantified and its importance and weight were calculated. Ultimately, the comprehensive correlation degree was determined, concluding that the leakage evaluation level of Tiebeishan Tunnel reached Grade 3, indicating leakage. The evaluation model was found to align with the actual situation based on on-site inspection results and water leakage statistics. During inspections, severe cracks were observed in the tunnel lining structure, and issues like water leakage and efflorescence were noted during the rainy season, impacting traffic safety. This demonstrates that the established tunnel leakage evaluation model accurately reflects engineering realities and can serve as a valuable reference for similar projects.

6. Conclusions

(1) Based on the existing methods for evaluating tunnel water leakage, the impact of external environmental changes on tunnels near reservoirs was considered. It is proposed that the leakage evaluation index should be divided into geological conditions, hydrological conditions, and tunnel engineering aspects. Various factors influencing tunnel water leakage were analyzed, and a hierarchical evaluation index system for tunnel water leakage was proposed.
(2) The changes in reservoir water level significantly affect the stability of tunnels. With increasing water levels, the displacements and stresses of the tunnel structure gradually increase, with the inner side of the water level experiencing significantly greater effects than the outer side. The plastic zone undergoes notable changes, and structural damage progresses from the inner side to the entire cross section. Tunnels near reservoirs should receive focus on water level changes and have targeted reinforcement measures implemented to improve the stress state of tunnels.
(3) Combining the qualitative and quantitative descriptions of leakage conditions, the evaluation indicators and value standards for water leakage were specified based on the analytic hierarchy process (AHP) and the theory of extension. A hierarchical evaluation model for the leakage of tunnels near reservoirs was constructed.
(4) The proposed leakage evaluation model was applied to the Tiebeishan Tunnel project. A judgment matrix was constructed, and the comprehensive relevance degree of the leakage grade was determined. The leakage level of the Tiebeishan Tunnel is Grade 3 indicating moderate leakage. This application verified the rationality and applicability of the evaluation model.

Author Contributions

Conceptualization, methodology, software, writing—original draft preparation, Y.L.; writing—review and editing, Z.W.; funding acquisition, validation, X.L.; supervision, data curation, writing—review, J.H. All authors have read and agreed to the published version of the manuscript.

Funding

This research was funded by the National Natural Science Foundation of China (Grant No.52078306), the Doctoral Research Initiation of Foundation of Liaoning Province, China (No. 2023-BS-205), the Funding Project of Northeast Geological S&T Innovation Center of China Geological Survey (No. QCJJ2023-44), and the Project of Transportation Science and Technology of Liaoning Province, China (No. 202341).

Data Availability Statement

Data were curated by the authors and are available upon request.

Conflicts of Interest

The authors declare no conflicts of interest.

References

  1. Janda, T.; Šejnoha, M.; Šejnoha, J. Applying Bayesian Approach to Predict Deformations during Tunnel Construction. Num. Anal. Meth. Geomech. 2018, 42, 1765–1784. [Google Scholar] [CrossRef]
  2. Ye, F.; Qin, N.; Liang, X.; Ouyang, A.; Qin, Z.; Su, E. Analyses of the Defects in Highway Tunnels in China. Tunn. Undergr. Space Technol. 2021, 107, 103658. [Google Scholar] [CrossRef]
  3. Qian, Q. Scientific use of the urban underground space to construction the harmonious livable and beautiful city. Hazard Control. Tunn. Undergr. Eng. 2019, 1, 1–7. [Google Scholar] [CrossRef]
  4. Coli, N.; Pranzini, G.; Alfi, A.; Boerio, V. Evaluation of Rock-Mass Permeability Tensor and Prediction of Tunnel Inflows by Means of Geostructural Surveys and Finite Element Seepage Analysis. Eng. Geol. 2008, 101, 174–184. [Google Scholar] [CrossRef]
  5. Li, S.; Zhou, Z.; Li, L.; Xu, Z.; Zhang, Q.; Shi, S. Risk Assessment of Water Inrush in Karst Tunnels Based on Attribute Synthetic Evaluation System. Tunn. Undergr. Space Technol. 2013, 38, 50–58. [Google Scholar] [CrossRef]
  6. Luciani, A.; Peila, D. Tunnel Waterproofing: Available Technologies and Evaluation Through Risk Analysis. Int. J. Civ. Eng. 2019, 17, 45–59. [Google Scholar] [CrossRef]
  7. Khademi Hamidi, J.; Shahriar, K.; Rezai, B.; Rostami, J.; Bejari, H. Risk Assessment Based Selection of Rock TBM for Adverse Geological Conditions Using Fuzzy-AHP. Bull. Eng. Geol. Environ. 2010, 69, 523–532. [Google Scholar] [CrossRef]
  8. Hyun, K.C.; Min, S.; Choi, H.; Park, J.; Lee, I.-M. Risk Analysis Using Fault-Tree Analysis (FTA) and Analytic Hierarchy Process (AHP) Applicable to Shield TBM Tunnels. Tunn. Undergr. Space Technol. 2015, 49, 121–129. [Google Scholar] [CrossRef]
  9. Park, S.W.; Shin, Y.S.; Oh, Y.S.; Ahn, S.R. A Guideline on Condition Assessment of Existing Old Railway Tunnels. Tunn. Undergr. Space Technol. 2006, 21, 329–330. [Google Scholar] [CrossRef]
  10. Gong, X.N.; Guo, P.P. Prevention and mitigation methods for water leakage in tunnels and underground structures. China J. Highw. Transp. 2021, 34, 1–30. [Google Scholar] [CrossRef]
  11. Yang, W.; Fang, Z.; Wang, H.; Li, L.; Shi, S.; Ding, R.; Bu, L.; Wang, M. Analysis on Water Inrush Process of Tunnel with Large Buried Depth and High Water Pressure. Processes 2019, 7, 134. [Google Scholar] [CrossRef]
  12. Li, X.; Li, Y. Research on Risk Assessment System for Water Inrush in the Karst Tunnel Construction Based on GIS: Case Study on the Diversion Tunnel Groups of the Jinping II Hydropower Station. Tunn. Undergr. Space Technol. 2014, 40, 182–191. [Google Scholar] [CrossRef]
  13. Jiang, S.Y.; Chen, J.H.; Li, T.; Gao, Y. Assessment and prediction of water gushing disaster risk in underwater tunnel. China Saf. Sci. J. 2013, 23, 101–106. [Google Scholar] [CrossRef]
  14. Pan, H.Z. Study on Groundwater Disaster Prevention and Evaluation System of Tunnel Engineering; Southwest Jiaotong University: Chengdu, China, 2009. [Google Scholar]
  15. Wu, C.; Huang, H.W.; Zhang, L.; Chen, J.; Tong, Y.; Zhou, M. Towards automated 3D evaluation of water leakage on a tunnel face via improved GAN and self-attention DL model. Tunn. Undergr. Space Technol. 2023, 142, 105432. [Google Scholar] [CrossRef]
  16. Feng, S.J.; Feng, Y.; Zhang, X.L.; Chen, Y.H. Deep learning with visual explanations for leakage defect segmentation of metro shield tunnel. Tunn. Undergr. Space Technol. 2023, 136, 105107. [Google Scholar] [CrossRef]
  17. Lai, L.; Zhang, Y.; Xu, K. Prediction of Wet Area of Underwater Tunnel Lining. Buildings 2024, 14, 408. [Google Scholar] [CrossRef]
  18. Sun, W.; Han, F.; Zhang, Y.; Zhang, W.; Zhang, R.; Su, W. Experimental assessment of structural responses of tunnels under the groundwater level fluctuation. Tunn. Undergr. Space Technol. 2023, 137, 105138. [Google Scholar] [CrossRef]
  19. Li, P.; Wang, F.; Long, Y.; Zhao, X. Investigation of Steady Water Inflow into a Subsea Grouted Tunnel. Tunn. Undergr. Space Technol. 2018, 80, 92–102. [Google Scholar] [CrossRef]
  20. Zhang, B.; Wang, H.; Ye, Y.; Tao, J.; Zhang, L.; Shi, L. Potential Hazards to a Tunnel Caused by Adjacent Reservoir Impoundment. Bull. Eng. Geol. Environ. 2019, 78, 397–415. [Google Scholar] [CrossRef]
  21. Shen, Y.F. Analysis on fatigue of warm mix asphalt mixture. Urban Roads Rridges Flood Control 2021, 6, 289–295+30. [Google Scholar] [CrossRef]
  22. Chen, H. Research on Mechanical Properties of Subway Tunnel Structure and Surrounding Rock Due to the Water Level Fluctuation of Adjacent Water Body; Hunan University of Science and Technology: Xiangtan, China, 2014. [Google Scholar]
  23. Sun, Z.; Zhang, D.; Fang, Q.; Wang, J.; Chu, Z.; Hou, Y. Analysis of Interaction between Tunnel Support System and Surrounding Rock for Underwater Mined Tunnels Considering the Combined Effect of Blasting Damage and Seepage Pressure. Tunn. Undergr. Space Technol. 2023, 141, 105314. [Google Scholar] [CrossRef]
  24. Xin, C.-I.; Gao, B.; Sui, C.; Zhou, Y. Analysis of External Water Pressure on the Support and Lining of Deep Mountain Tunnels below High Water Tables. J. Highway Transp. Res. Dev. (Engl. Ed.) 2014, 8, 61–66. [Google Scholar] [CrossRef]
  25. Band, P.; Shelake, A.; Gogate, N. AHP Approach for Risk Factors Prioritisation in Tunnel Construction. In Civil Engineering for Multi-Hazard Risk Reduction; IACESD 2023. Lecture Notes in Civil Engineering; Sreekeshava, K.S., Kolathayar, S., Vinod Chandra Menon, N., Eds.; Springer: Singapore, 2023; Volume 457. [Google Scholar] [CrossRef]
Figure 1. Leakage water evaluation system of tunnels near reservoirs.
Water 16 02378 g001
Figure 2. Cross section of the tunnel.
Water 16 02378 g002
Figure 3. Vertical deformation changes of different conditions.
Water 16 02378 g003
Figure 4. Horizontal deformation changes of different conditions.
Water 16 02378 g004
Figure 5. Stress changes of different conditions.
Water 16 02378 g005
Figure 6. Plastic zone of different conditions: (a) Condition I; (b) Condition II; (c) Condition III (d) Condition IV.
Water 16 02378 g006
Figure 7. Leakage diseases of tunnel: (a) water seepage; (b) water stain.
Water 16 02378 g007
Figure 8. Location of tunnel.
Water 16 02378 g008
Table 1. The meaning of each indicator scale.
ScalesComparative Statement of Importance
1Compared to the same importance
3One factor is slightly more important than the other
5One factor is clearly more important than the other
7One factor is more strongly important than the other
9The extreme importance of one factor over another
2, 4, 6, 8Neighborhood judgment median
1/aijWhen two factors are compared, if the former takes the above value for the latter, the latter takes the reciprocal of it
Table 2. General form of judgment matrix.
RC1C2Cn
C11a12a1n
C21/a121a2n
Cn1/a1n1/a2n1
Table 3. Parameters of numerical calculation.
TypeDensity (g·cm−3)Poisson’s RatioElastic Modulus (Pa)φ (°)c (MPa)
Gravelly clay1.750.410.063 × 101016.90.41
Weak, slightly weathered metamorphic rocks1.90.380.15 × 1010250.35
Weak weathering2.090.320.47 × 1010330.45
Limestone2.40.281.3 × 101044.51.1
Weak weathering2.30.23.15 × 1010541.8
Table 13. Discriminant squares of tunnel structure disease evaluation model.
RC1C2C3C4C5C6C7C8C9
C1116325741
C2116325741
C31/61/611/31/51/3311/5
C41/31/3311/41/3331/5
C51/31/25415551/3
C61/51/5331/51221/5
C71/71/71/31/31/51/2131/6
C81/41/411/31/51/21/311/5
C9115535651
Table 14. Correlation degree of evaluation index on evaluation grade.
Evaluation IndicatorsK1K2K3K4
C1−1/300−1/3
C2−2/3−1/200
C300−1/2−2/3
C4−1/300−1/3
C5−2/3−1/200
C6−1/300−1/3
C700−1/2−2/3
C8−2/3−1/200
C9−1/300−1/3
Disclaimer/Publisher’s Note: The statements, opinions and data contained in all publications are solely those of the individual author(s) and contributor(s) and not of MDPI and/or the editor(s). MDPI and/or the editor(s) disclaim responsibility for any injury to people or property resulting from any ideas, methods, instructions or products referred to in the content.