Abstract
The supercritical water gasification (SCWG) of different kinds of feed including glycerol, lignin, humic acid, and ethylene glycol is investigated to predict product gas yields using a non-stoichiometric thermodynamic model. This model employs Gibbs free energy minimization, coupled with the penalty method as an optimization method. The results demonstrate excellent prediction accuracy for hydrogen yield, with average absolute relative deviations (AARDs) of 2.70%, 11.23%, and 0.17% for glycerol, humic acid, and ethylene glycol, respectively. Lignin prediction showed a higher AARD of 25.95%. Furthermore, the penalty method exhibited superior performance compared to the Lagrange method, achieving a reduction in error ranging from 66% to 88%. Moreover, the effect of reaction temperature and feed concentration on the molar gas yields was elucidated. This study establishes that the penalty method within the thermodynamic model effectively predicts product gas yields from biomass and bio-renewable feedstocks, with deviations below 10%. The developed thermodynamic model provides a reliable method for optimizing gasification processes, potentially improving the efficiency and accuracy of hydrogen production from diverse biomass and bio-renewable resources. This advancement supports the reduction in greenhouse gas emissions and promotes the use of sustainable energy sources.
1. Introduction
Biomass and bio-renewable organic sources, significant and environmentally friendly energy sources globally encompassing wood, municipal solid waste, and agricultural residues, offer a promising approach to reducing greenhouse gas emissions, particularly CO2, compared to fossil fuel combustion [1,2,3,4,5,6,7]. Beyond combustion engines, biomass and bio-renewable organic sources find applications in diverse fields, including chemical production and fuel generation [8,9]. They can be directly converted into fuel gas such as hydrogen, which can be exploited as a clean gas with highly efficient fuel cells. Thermo-chemical gasification remains a cost-effective conversion process despite the high drying cost associated with wet feedstocks [10,11,12]. Gasification in supercritical water (SCW) as a promising technology can be utilized for wet biomass and bio-renewable organic sources because it prevents the drying process. Supercritical water gasification technology can potentially obtain energy by combusting organic waste streams and lead to a decrease in pollution from the waste stream and, as a result, decreases its potential toxic and dangerous effects [13,14]. Water, with interesting thermo-physical properties that are between gas and liquid and over its critical point ( = 374 °C and = 22.1 MPa), as a reactant is used in supercritical water gasification (SCWG) media [13,15,16,17]. Supercritical water has fewer hydrogen bonds with weak strength and its polarity is also much lower in this state [18,19]. As a result, SCW and organic solvents behave alike. Moreover, the solubility of organic compounds and gasses become high in it. Therefore, chemical reactions are conducted in a single supercritical phase, with a shorter residence time and smaller reactor volumes so that no interphase mass transport processes occur to hinder reaction rates [20,21]. In addition, biomass gasification in SCW with a high reaction rate has high gasification efficiency at much lower temperatures of approximately 673K compared with conventional gasification [22]. However, many authors have recommended different methods and calculation strategies to obtain a valid method to predict the product of biomass gasification [14,23,24,25,26]. Work on the thermodynamic analysis of supercritical water gasification process is limited. The models are kinetic rate models, thermodynamic equilibrium models, and neural network models [27,28,29,30,31,32,33,34,35]. Some models utilize the process simulator Aspen Plus [36], incorporating thermodynamic and kinetic rate models. Equilibrium models generally involve two approaches: stoichiometric and non-stoichiometric.
All of the chemical reactions and involved species are defined clearly in a stoichiometric approach. However, in a non-stoichiometric one, both chemical reactions and involved species are not present. It should be noted that the reaction temperature, pressure, and elemental composition of the feedstock obtained from the final analysis data are the input of the non-stoichiometric approach. Particularly, this method is suitable for unclear reaction mechanisms and feed streams like biomass whose precise chemical compositions are unknown. This model of non-stoichiometric equilibrium is widely applied in biomass, coal, or bio-renewable organic conventional gasification [37,38,39].
In this study, we hypothesize that a non-stoichiometric two-phase model coupled with the penalty method will provide more accurate predictions of product gas yield in supercritical water reforming compared to existing models. Therefore, this method, used for the first time for supercritical water reforming different kinds of feed including glycerol, lignin, humic acid, and ethylene glycol, is developed and implemented for the optimization of process conditions to attain maximum performance. Furthermore, the model will be used to investigate the effects of temperature and feed concentration on the product gas yield. Moreover, the calculation accuracy of the product gas mole fractions from the aqueous solutions of glycerol using two different optimization methods including the Lagrange and Penalty methods was compared.
2. Thermodynamic Models and Methods
Chemical Equilibrium
Gibbs free energy with constant T and P can be calculated by
where and are the molar number and chemical potential of component i, respectively.
The equation of element conservation is described as follows:
where is the molar number of element j in compound i, and is the total molar number of element j in the initial reactant. Gibbs free energy is minimum when a multicomponent system reaches chemical equilibrium. The nonstoichiometric approach, while minimizing the Gibbs free energy function under mass balance constraints, leads to a constrained optimization problem. This problem, due to the complexity and non-linearity of the developed model and equations, can be time consuming to solve using traditional optimization techniques as shown in the existing literature [40].
The Lagrange multiplier method, a common approach, addresses constraints by introducing Lagrange multipliers that are added to the Gibbs free energy function, resulting in an unconstrained problem [40]. However, this method introduces a new challenge: the partial derivatives of the Lagrange function create a set of non-linear algebraic equations. These equations share the drawbacks of the original problem—nonlinearity and sensitivity to the initial guess. To address these limitations, this work proposes the penalty method for minimizing the Gibbs free energy function while incorporating mass balance constraints. The penalty method offers a reliable approach for transforming constrained problems into unconstrained ones. It achieves this by constructing a sequence of unconstrained problems with solutions that ideally converge towards the solution of the original constrained problem [41].
These unconstrained problems are formed by adding a penalty term to the objective function. This term comprises a penalty parameter multiplied by a measure of constraint violation. The violation measure becomes non-zero when constraints are broken and remains zero when they are satisfied. The developed objective function could be expressed as
where r is a penalty weighting coefficient. This coefficient (r) is a hyperparameter that controls the severity of the penalty. This coefficient can theoretically range from 0 to infinity, influencing how much constraint impacts the objective function. For our analysis, we explored values within the range of 106 to 1010. Our results indicated that increasing the penalty coefficient beyond 109 did not significantly alter the outcome. Consequently, we selected 1010 as the penalty weighting coefficient for our final calculations.
There is another constraint that should be considered which is that all ni should be positive.
A suitable expression is needed to solve these equations for , which can be calculated by the following expression:
The chemical potential of component i, , can be calculated by the following expression:
where R is the ideal gas constant, and is the chemical potential of component i in a standard state.
is the standard free energy of formation for species i. can be calculated as follows:
is the sum of the heat capacity of a compound and its elements, and is the stoichiometric coefficient. is the standard entropy change in formation, and is 298.15 K. , and are extracted from Ref. [27]. is the partial fugacity of component i which is calculated by the PR equation of state.
The dimensionless fugacity coefficient, , can be calculated through an EoS. The Peng–Robinson EoS was chosen (Equations (10)–(21)), which has been extensively used [42,43] (Tang and Kitagawa, 2005; Voll et al., 2009).
denotes binary interaction parameters between species i and j, and elements were calculated according to [44]
where v is the molar volume (m3/ mol).
In this paper, we used a high-temperature range (375–800 °C, and the value of the fugacity coefficient from the PR-EoS was obtained near one and had a negligible effect on the process calculations. So, its value was assumed to be one in this work.
3. Validation of the Model
MATLAB (R2014b) software was used to work with the model. In order to perform the minimization of Gibbs free energy, a routine numerical mathematical solution was utilized. This routine enables us to solve a minimization problem subject to constraints based on the method of penalty multipliers. This method tackles minimization problems with constraints. In our case, the system composition is subject to two constraints: (a) elemental balance, where the amount of each element is conserved between input and output streams, and (b) non-negative mole numbers ( ≥ 0).
The algorithm depicted in Scheme 1 illustrates the sequential steps of the mathematical method.

Scheme 1.
The sequential steps of the mathematical method.
To validate the model, its results were compared with the experimental data reported by Byrd et al. (2008), Gutierrez Ortiz et al. (2015), Furusawa et al. (2007), Gong et al. (2017), and Vlieger et al. (2012) [45,46,47,48,49], who carried out a study of the SCWG of glycerol, lignin, humic acid, and ethylene glycol, respectively, at different temperatures (375 °C to 800 °C and feed concentrations (5 to 40 wt.%). As shown in Table 1, Table 2, Tables 7–9, the total average absolute relative deviation of H2 yield for different types of feed is in the range from 0.17 to 25.95%. These errors confirm the accuracy of the model assessed in this work.
4. Results and Discussion
In this study, different kinds of feed including glycerol, lignin, humic acid, and ethylene glycol are used to predict the amount of the product gas yields. Also, the effect of temperature and feed concentration on the product gas yield is investigated. A detailed description of the results is presented below.
4.1. SCWG of Glycerol
These comparisons confirmed the model validated in this work.
4.1.1. Effect of Temperature on the Gas Yields
Figure 1 presents the predicted product gas yields from the supercritical water gasification of a glycerol–water solution at temperatures ranging from 700 to 800 °C. Gas yield is defined as the moles of product gas per mole of glycerol fed. The order of gas yields with increasing temperature is H2 > CO2 > CH4 > CO with increasing temperature. It is evident from the figure that methane yield is higher at 700 °C. As the temperature increases, the yields of hydrogen and carbon dioxide become more significant. The high water content leads to a greater formation of hydrogen and carbon dioxide instead of carbon monoxide. The carbon monoxide formed reacts with water in the water–gas shift reaction, which favors the production of hydrogen and carbon dioxide [50,51,52,53,54].
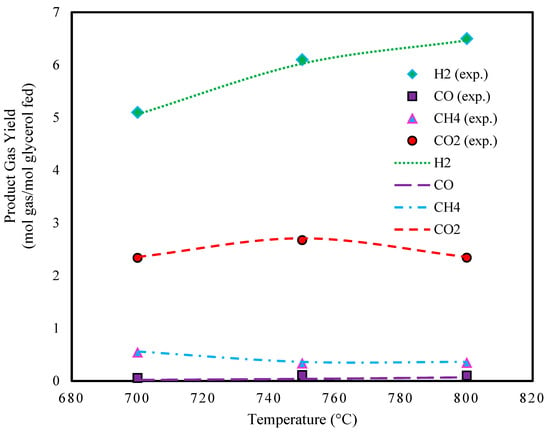
Figure 1.
Effect of temperature on glycerol gasification in SCW (P: 241 bar, feed conc.: 5 wt.%, and experimental data extracted from Ref. [45]).
Figure 2 and Figure 3 illustrate the effect of temperature on the predicted yields of product gasses. It is observed that the yields of H2 and CO2 continuously increase with temperature. In contrast, the yield of CO shows minimal change with increasing temperature. The CH4 yield follows a similar trend to H2 and CO2 at temperatures below 550 °C, but it declines at higher temperatures.
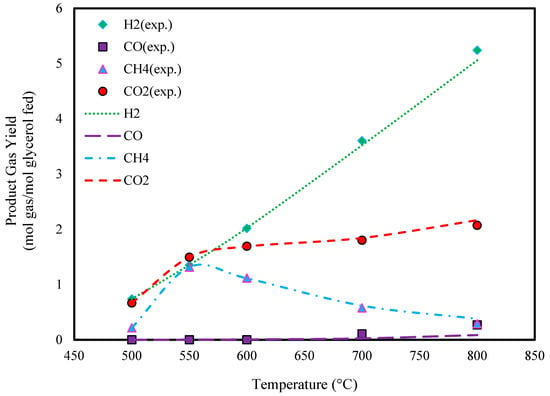
Figure 2.
Effect of temperature on glycerol gasification in SCW (P: 240 bar, feed conc.: 10 wt.%, and experimental data extracted from Ref. [46]).
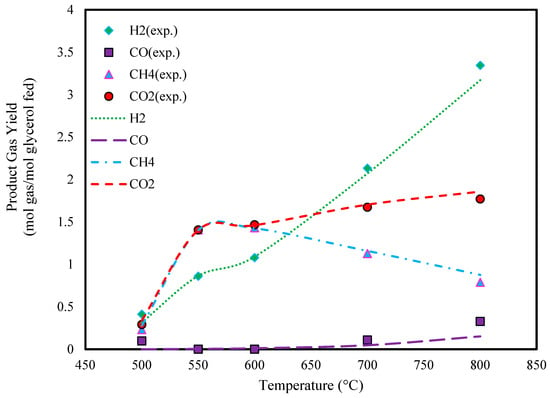
Figure 3.
Effect of temperature on glycerol gasification in SCW (P: 240 bar, feed conc.: 20 wt.%, and experimental data extracted from Ref. [46]).
4.1.2. Effect of Concentration of Solution on the Gas Yields
To investigate the effect of feed concentration, the glycerol concentration was varied from 5 to 40 wt.%. Figure 4 and Figure 5 show that the yields of hydrogen and carbon dioxide decrease with increasing feed concentration, while the yield of methane increases. This trend can be attributed to the lower water content in the reactor at higher concentrations. At low steam-to-carbon ratios, carbon monoxide is more likely to produce methane by consuming hydrogen [55]. The carbon balance confirmed that the complete conversion of glycerol to gaseous products occurred even at the highest feed concentrations tested.
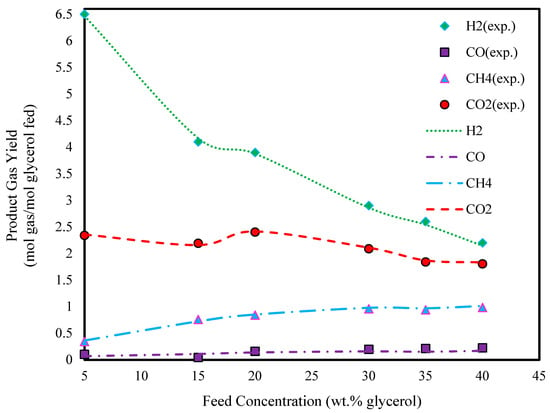
Figure 4.
Effect of glycerol feed concentration on glycerol gasification in SCW (T: 800 °C, P: 241 bar, and experimental data extracted from Ref. [45]).
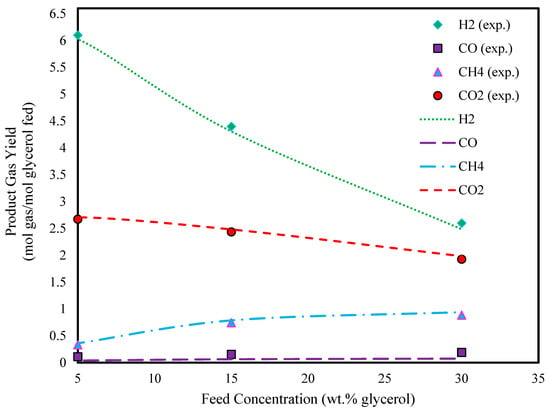
Figure 5.
Effect of glycerol feed concentration on glycerol gasification in SCW (T: 750 °C, P: 241 bar, and experimental data extracted from Ref. [45]).
Furthermore, Figure 6 and Figure 7 show the product gas yields in different glycerol feed concentrations. As can be seen from these figures, the yields of all components decrease with increasing glycerol feed concentrations, results that are similar to those seen in Figure 4 and Figure 5.
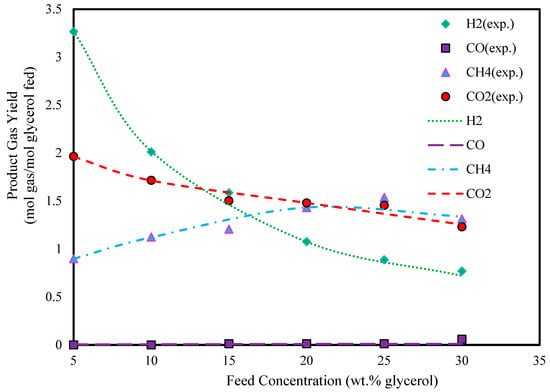
Figure 6.
Effect of glycerol feed concentration on glycerol gasification in SCW (T: 600 °C, P: 240 bar, and experimental data extracted from Ref. [46]).
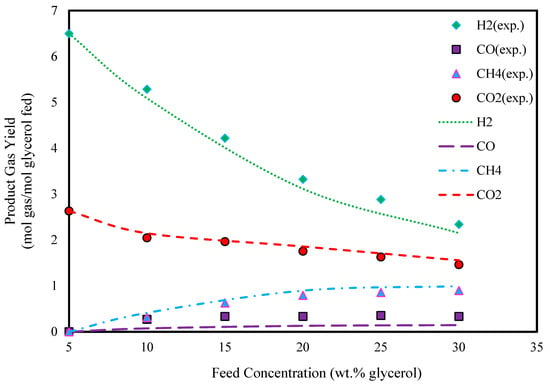
Figure 7.
Effect of glycerol feed concentration on glycerol gasification in SCW (T: 800 °C, P: 240 bar, and experimental data extracted from Ref. [46]).
In addition to the figures, some results have been listed in Table 1 and Table 2. As can be seen, the proposed model is sufficiently accurate to predict hydrogen yields at different temperatures (600–800 °C) and feed concentrations (5–40 wt.%), with the AARD ranging from 1.61 to 5.16%.

Table 1.
Absolute relative deviation (ARD) in the predicted H2 yield at different temperatures using Gibbs free energy minimization coupled with the penalty method (P: 241 bar).
Table 1.
Absolute relative deviation (ARD) in the predicted H2 yield at different temperatures using Gibbs free energy minimization coupled with the penalty method (P: 241 bar).
| Temperature T (°C) | Glycerol Concentration (wt.%) | H2 Yield a (mol gas/mol Glycerol) | H2 Yield— This Work (mol gas/mol Glycerol) | ARD b % | Temperature T (°C) | Glycerol Concentration (wt.%) | H2 Yield a (mol gas/mol Glycerol) | H2 Yield— This Work (mol gas/mol Glycerol) | ARD b % |
|---|---|---|---|---|---|---|---|---|---|
| 800 | 5 | 6.5 | 6.46 | 0.6 | 750 | 2.5 | 5.8 | 5.79 | 0.1 |
| 800 | 15 | 4.1 | 4.16 | 1.4 | 750 | 5 | 6.10 | 6.02 | 1.3 |
| 800 | 20 | 3.9 | 3.87 | 0.7 | 750 | 15 | 4.40 | 4.30 | 2.2 |
| 800 | 30 | 2.9 | 2.86 | 1.3 | 750 | 30 | 2.60 | 2.48 | 4.6 |
| 800 | 35 | 2.6 | 2.53 | 2.6 | --- | --- | --- | --- | --- |
| 800 | 40 | 2.2 | 2.14 | 2.7 | --- | --- | --- | --- | --- |
| AARD c | 1.6 | AARD c | 2.0 |
Notes: a Experimental data extracted from Ref. [45]. b c
, where N is the number of data points.

Table 2.
Absolute relative deviation (ARD) in the predicted H2 yield at different temperatures using Gibbs free energy minimization coupled with the penalty method (P: 240 bar).
Table 2.
Absolute relative deviation (ARD) in the predicted H2 yield at different temperatures using Gibbs free energy minimization coupled with the penalty method (P: 240 bar).
| Temperature T (°C) | Glycerol Concentration (wt.%) | H2 Yield a (mol gas/mol Glycerol) | H2 Yield— This Work (mol gas/mol Glycerol) | ARD b % | Temperature T (°C) | Glycerol Concentration (wt.%) | H2 Yield a (mol gas/mol Glycerol) | H2 Yield— This Work (mol gas/mol Glycerol) | ARD b % |
|---|---|---|---|---|---|---|---|---|---|
| 800 | 5 | 6.52 | 6.49 | 0.4 | 600 | 5 | 3.27 | 3.27 | 0.0 |
| 800 | 10 | 5.27 | 5.08 | 3.6 | 600 | 10 | 2.02 | 2.01 | 0.4 |
| 800 | 20 | 3.36 | 3.11 | 7.4 | 600 | 20 | 1.08 | 1.07 | 0.9 |
| 800 | 30 | 2.37 | 2.15 | 9.2 | 600 | 30 | 0.77 | 0.72 | 6.4 |
| AARD c | 5.1 | AARD c | 1.9 |
Notes: a Experimental data extracted from Ref. [46]. b c , where N is the number of data points.
4.2. Comparison of the Optimization Methods
Lagrange’s optimization method is the most commonly used technique for modeling the gasification of biomasses such as glycerol, glucose, and cellulose. In this study, we evaluated the penalty method for its potential to model different systems. The performance of the penalty method was compared to that of the Lagrange method for glycerol modeling, as shown in Table 3, Table 4, Table 5 and Table 6. The results indicate that the penalty method outperforms Lagrange’s optimization method in predicting the product gas mole fraction, with a reduction in the average absolute relative deviation (AARD) ranging from 3% to 45%.

Table 3.
Absolute relative deviation (ARD) in the predicted composition of H2 at different feed concentrations using Gibbs free energy minimization coupled with the Lagrange or penalty method (T: 800 °C, P: 241 bar).

Table 4.
Absolute relative deviation (ARD) in the predicted composition of CO at different feed concentrations using Gibbs free energy minimization coupled with the Lagrange or penalty method (T: 800 °C, P: 241 bar).

Table 5.
Absolute relative deviation (ARD) in the predicted composition of CH4 at different feed concentrations using Gibbs free energy minimization coupled with the Lagrange or penalty method (T: 800 °C, P: 241 bar).

Table 6.
Absolute relative deviation (ARD) in the predicted composition of CO2 at different feed concentrations using Gibbs free energy minimization coupled with the Lagrange or penalty method (T: 800 °C, P: 241 bar).
4.3. SCWG of Lignin
Lignin, a common plant polymer, is known as a dense, complex, amorphous, and secondary cell wall polymer. It can be found in trachea elements and the sclerenchyma of terrestrial plants. Two aromatic amino acids, tyrosine and phenylalanine, form the basic building blocks of lignin [57].
Effect of Temperature on the Gas Yields
Figure 8 depicts the results of gas products at different temperatures. As observed, all of the components decrease with temperatures higher than 700 °C.
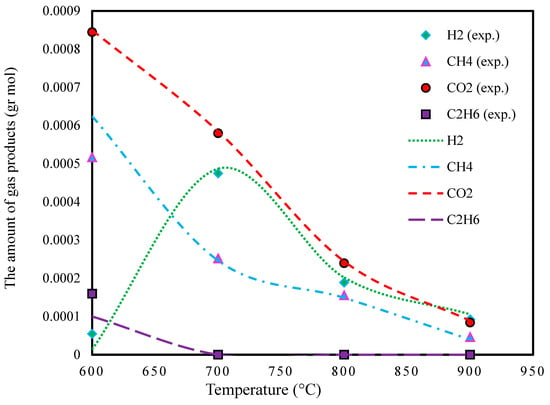
Figure 8.
Effect of temperature on lignin gasification in SCW (P: 15 bar, feed conc.: 10 wt.%, and the experimental data extracted from Ref. [47]).
The absolute relative deviation in the predicted yields of H2 in the temperature range from 600 to 900 °C is reported in Table 7.

Table 7.
Absolute relative deviation in the predicted H2 yield at different temperatures using Gibbs free energy minimization coupled with the penalty method (P: 15 bar, feed conc.: 10 wt.%).
Additionally, the average absolute relative deviations in CH4, CO2, and C2H6 were found to be 24.9, 2.33, and 12.5, respectively.
4.4. SCWG of Humic Acid
More than 80% of humic substances in sewage sludge are humic acids, which are structured aromatically, are darkly colored, and have high molecular weight [58].
Effect of Temperature on the Gas Yields
The effect of temperature on the predicted composition of product gasses from the gasification of humic acid in supercritical water is depicted in Figure 9. As can be seen, the H2 and CO2 yield increase with temperature constantly.
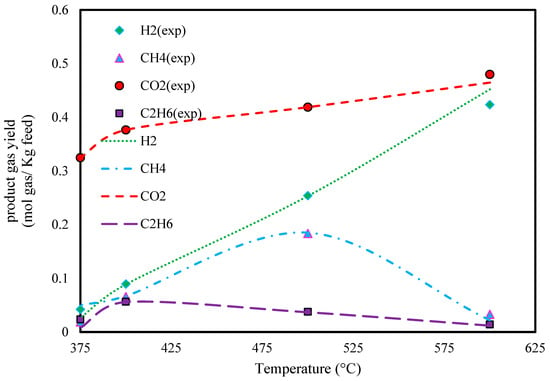
Figure 9.
Effect of temperature on humic acid gasification in SCW (P: 240 bar, feed conc.: 25 wt.%, and experimental extracted data from Ref. [48]).
The absolute relative deviation in the predicted yields of H2 in the temperature range from 375 to 600 °C is reported in Table 8.

Table 8.
Absolute relative deviation in the predicted H2 yield at different temperatures using Gibbs free energy minimization coupled with the penalty method (P: 240 bar, feed conc.: 25 wt.%).
Additionally, the average absolute relative deviations in CH4, CO2, and C2H6 were found to be 50.83, 0.79, and 3.29, respectively.
4.5. SCWG of Ethylene Glycol
Ethylene glycol, which is the product of a water and ethylene oxide chemical reaction, is a colorless, odorless, viscous, and sweet-tasting liquid. It has commercial and industrial applications such as its use as an antifreeze and coolant [59].
Effect of Concentration of Solution on the Gas Yields
The results of product gas yields are shown at a pressure of 25 MPa, temperature of 727.15 K, and different feed concentrations (5–30 wt.% ethylene glycol) in Figure 10. The results show that the CH4 yield increases with increasing ethylene glycol concentration. As can be seen, increasing the ethylene glycol concentration leads to a decrease in the yield of CO2 and H2.
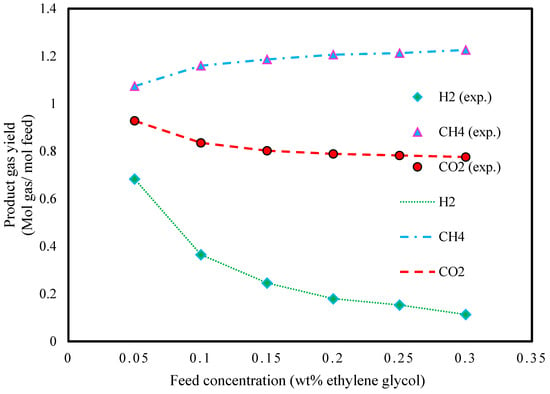
Figure 10.
Effect of ethylene glycol feed concentration on ethylene glycol gasification in SCW (T: 450 °C, P: 250 bar, and extracted data from Ref. [49]).
The absolute relative deviations in the predicted yields of H2 in the feed concentration range from 5 to 30% and are reported in Table 9.

Table 9.
Absolute relative deviation in the predicted H2 yield at different feed concentrations using Gibbs free energy minimization coupled with the penalty method (T: 450 °C, P: 250 bar).
Additionally, the average absolute relative deviations of CH4 and CO2 were found to be 0.01 and 12.5, respectively.
Overall, this study investigates the ability of a model to predict product gas yield from various feedstocks, including glycerol, lignin, humic acid, and ethylene glycol. We evaluated the model’s accuracy in predicting H2, CO, CO2, and CH4 yields for these feedstocks (C3H8O3, C2H6O2, C187H186O89N9S1, and C81H92O28). The model performed well for polar feedstocks with linear structures, such as glycerol and ethylene glycol. However, it fails to accurately predict product gas yield for feedstocks with aromatic structures and high molecular weights, like lignin and humic acids.
5. Conclusions
In this paper, we mathematically modeled the gasification of various biomasses and bio-renewable organic sources, including glycerol, ethylene glycol, lignin, and humic acid, in supercritical water based on a thermodynamic framework. The minimization of Gibbs free energy is accomplished by using the penalty mathematical optimization method together with two constraints: the mass balance of elements and the non-negativity of component moles. A comparison between this optimization method and the Lagrange method showed approximately a 75% reduction in the average error. The results across different feedstocks confirm the accuracy of the employed method. For instance, the error in H2 gas yield between the experimental and modeled states ranged from 0.17% to 25.95%. The low average absolute relative deviation (AARD) indicates that the proposed model is sufficiently accurate, particularly for linear and polar feeds at low concentrations. The Lagrange multiplier method addresses constraints by introducing Lagrange multipliers, converting them into unconstrained problems. However, this method generates non-linear algebraic equations, inheriting the original problem’s challenges. To address this, we propose the penalty method, which transforms constrained problems into unconstrained ones by adding a penalty term for constraint violations, while this approach increases the degrees of freedom in the system. This method increases the model’s flexibility and adaptability, enhancing constraint handling, especially in complex systems like supercritical water gasification. Overall, the results suggest that the highest efficiency is achieved at lower concentrations and higher temperatures.
Author Contributions
Z.M.: software, methodology, validation, formal analysis, investigation, writing—original draft, and writing—review and editing. Z.B.: software, methodology, validation, formal analysis, investigation, writing—original draft, and writing—review and editing. F.E.: conceptualization, investigation, writing—review and editing, and supervision. All authors have read and agreed to the published version of the manuscript.
Funding
This research received no external funding.
Data Availability Statement
Data is contained within the article.
Acknowledgments
The authors would like to express their appreciation to Shiraz University and the 111 project 444 (B16038) for the support provided. The authors thank Ali Behrad Vakylabad for his constructive advice.
Conflicts of Interest
The authors declare that they have no known competing financial interests or personal relationships that could have appeared to influence the work reported in this paper.
References
- Sadrul Islam, A.; Ahiduzzaman, M. Biomass energy: Sustainable solution for greenhouse gas emission. AIP Conf. Proc. 2012, 1440, 23–32. [Google Scholar]
- Ramli, A.N.; Jamek, S.; Azelee, N.I.; Manas, N.H.; Munir, N.; Patil, R. Agriculture Biomass Characterization and Exploitation. In Reference Module in Earth Systems and Environmental Sciences; Elsevier: Amsterdam, The Netherlands, 2023. [Google Scholar]
- Rasouli, J.; Zandifar, A.; Rasouli, K.; Sabbaghi, S.; Esmaeilzadeh, F.; Shah, M.; Ansari, K.B. High-efficiency ternary CeO2/WO3/AC photocatalyst supported by biomass waste-derived activated carbon for efficient doxycycline photodegradation: Optimization of synthesis conditions and operational parameters. Mater. Res. Bull. 2024, 178, 112874. [Google Scholar] [CrossRef]
- Moravvej, Z.; Makarem, M.A.; Rahimpour, M.R. The fourth generation of biofuel. In Second and Third Generation of Feedstocks; Elsevier: Amsterdam, The Netherlands, 2019; pp. 557–597. [Google Scholar]
- Moravvej, Z.; Soroush, E.; Makarem, M.A.; Rahimpour, M.R. Thermochemical routes for hydrogen production from biomass. In Advances in Bioenergy and Microfluidic Applications; Elsevier: Amsterdam, The Netherlands, 2021; pp. 193–208. [Google Scholar]
- Moravvej, Z.; Tabrizi, F.F.; Rahimpour, M.; Vakylabad, A.B. Exploiting the potential of cobalt molybdenum catalyst in elevated hydrodeoxygenation of furfural to 2-methyl furan. Fuel 2023, 332, 126193. [Google Scholar] [CrossRef]
- Bakhtyari, A.; Sakhayi, A.; Moravvej, Z.; Rahimpour, M.R. Converting cyclohexanone to liquid fuel-grade products: A characterization and comparison study of hydrotreating molybdenum catalysts. Catal. Lett. 2021, 151, 3343–3360. [Google Scholar] [CrossRef]
- Makarem, M.A.; Moravvej, Z.; Rahimpour, M.R.; Vakylabad, A.B. Biofuel production from microalgae and process enhancement by metabolic engineering and ultrasound. In Advances in Bioenergy and Microfluidic Applications; Elsevier: Amsterdam, The Netherlands, 2021; pp. 209–230. [Google Scholar]
- Mansoorsamaei, Z.; Mowla, D.; Esmaeilzadeh, F.; Dashtian, K. Sustainable biodiesel production from waste cooking oil using banana peel biochar-Fe2O3/Fe2K6O5 magnetic catalyst. Fuel 2024, 357, 129821. [Google Scholar] [CrossRef]
- Matsumura, Y.; Minowa, T.; Potic, B.; Kersten, S.R.; Prins, W.; van Swaaij, W.P.; van de Beld, B.; Elliott, D.C.; Neuenschwander, G.G.; Kruse, A. Biomass gasification in near-and super-critical water: Status and prospects. Biomass Bioenergy 2005, 29, 269–292. [Google Scholar] [CrossRef]
- Kruse, A.; Gawlik, A. Biomass conversion in water at 330−410 C and 30− 50 MPa. Identification of key compounds for indicating different chemical reaction pathways. Ind. Eng. Chem. Res. 2003, 42, 267–279. [Google Scholar] [CrossRef]
- Zandifar, A.; Esmaeilzadeh, F.; Rodríguez-Mirasol, J. Hydrogen-rich gas production via supercritical water gasification (SCWG) of oily sludge over waste tire-derived activated carbon impregnated with Ni: Characterization and optimization of activated carbon production. Environ. Pollut. 2024, 342, 123078. [Google Scholar] [CrossRef] [PubMed]
- Savage, P.E. Organic chemical reactions in supercritical water. Chem. Rev. 1999, 99, 603–622. [Google Scholar] [CrossRef]
- de Oliveira, J.F.; Corazza, M.L.; Voll, F.A. Thermodynamic Analysis of Municipal Solid Waste Gasification under Isothermal and Adiabatic Conditions by a Gibbs Free Energy Minimization Model. Waste Biomass Valorization 2018, 10, 1383–1393. [Google Scholar] [CrossRef]
- Shaw, R.W. Supercritical water a medium for chemistry. Chem. Eng. News 1991, 69, 26–39. [Google Scholar]
- Ghasemi, M.N.; Esmaeilzadeh, F.; Mowla, D.; Elhambakhsh, A. Treatment of methyldiethanolamine wastewater using subcritical and supercritical water oxidation: Parameters study, process optimization and degradation mechanism. Environ. Sci. Pollut. Res. 2022, 29, 57688–57702. [Google Scholar] [CrossRef] [PubMed]
- Ramezanzadeh, S.; Esmaeilzadeh, F.; Mowla, D.; Elhambakhsh, A.; Kanani, M. Insight into the application of supercritical water oxidation for dichlorvos degradation: Experimental and simulation aspects. Environ. Technol. 2023, 44, 4113–4122. [Google Scholar] [CrossRef] [PubMed]
- Yoshida, N.; Matsugami, M.; Harano, Y.; Nishikawa, K.; Hirata, F. Structure and properties of supercritical water: Experimental and theoretical characterizations. J 2021, 4, 698–726. [Google Scholar] [CrossRef]
- Aghamohammadi, N.; Esmaeilzadeh, F.; Mowla, D.; Elhambakhsh, A. Oxidation of 2, 6-dimethyl phenol in supercritical water: Experimental and molecular dynamics simulation study. Int. J. Environ. Sci. Technol. 2023, 20, 551–564. [Google Scholar] [CrossRef]
- Elliott, D.C.; Phelps, M.; Sealock, L.J.; Baker, E.G. Chemical processing in high-pressure aqueous environments. 4. Continuous-flow reactor process development experiments for organics destruction. Ind. Eng. Chem. Res. 1994, 33, 566–574. [Google Scholar] [CrossRef]
- Lu, Y.; Guo, L.; Zhang, X.; Yan, Q. Thermodynamic modeling and analysis of biomass gasification for hydrogen production in supercritical water. Chem. Eng. J. 2007, 131, 233–244. [Google Scholar] [CrossRef]
- Williams, P.T.; Onwudili, J. Composition of products from the supercritical water gasification of glucose: A model biomass compound. Ind. Eng. Chem. Res. 2005, 44, 8739–8749. [Google Scholar] [CrossRef]
- Barba, D.; Prisciandaro, M.; Salladini, A.; Di Celso, G.M. The gibbs free energy gradient method for RDF gasification modelling. Fuel 2011, 90, 1402–1407. [Google Scholar] [CrossRef]
- Kangas, P.; Hannula, I.; Koukkari, P.; Hupa, M. Modelling super-equilibrium in biomass gasification with the constrained Gibbs energy method. Fuel 2014, 129, 86–94. [Google Scholar] [CrossRef]
- Begum, S.; Rasul, M.; Akbar, D.; Ramzan, N. Performance analysis of an integrated fixed bed gasifier model for different biomass feedstocks. Energies 2013, 6, 6508–6524. [Google Scholar] [CrossRef]
- Yan, Q.; Guo, L.; Lu, Y. Thermodynamic analysis of hydrogen production from biomass gasification in supercritical water. Energy Convers. Manag. 2006, 47, 1515–1528. [Google Scholar] [CrossRef]
- Fiaschi, D.; Michelini, M. A two-phase one-dimensional biomass gasification kinetics model. Biomass Bioenergy 2001, 21, 121–132. [Google Scholar] [CrossRef]
- Giltrap, D.; McKibbin, R.; Barnes, G. A steady state model of gas-char reactions in a downdraft biomass gasifier. Sol. Energy 2003, 74, 85–91. [Google Scholar] [CrossRef]
- Di Blasi, C. Dynamic behaviour of stratified downdraft gasifiers. Chem. Eng. Sci. 2000, 55, 2931–2944. [Google Scholar] [CrossRef]
- Bacon, D.; Downie, J.; Hsu, J.; Peters, J. Modelling of fluidized bed wood gasifiers. In Fundamentals of Thermochemical Biomass Conversion; Springer: Berlin/Heidelberg, Germany, 1985; pp. 717–732. [Google Scholar]
- Double, J.; Smith, E. Computer Modelling of Fluidised Gasification in Pyrolysis and Gasification; Ferraro, G.L., Maniatis, K., Buekens, A., Bridgwater, A.V., Eds.; Elsevier Applied Science: London, UK, 1989. [Google Scholar]
- Jarungthammachote, S.; Dutta, A. Thermodynamic equilibrium model and second law analysis of a downdraft waste gasifier. Energy 2007, 32, 1660–1669. [Google Scholar] [CrossRef]
- Jarungthammachote, S.; Dutta, A. Equilibrium modeling of gasification: Gibbs free energy minimization approach and its application to spouted bed and spout-fluid bed gasifiers. Energy Convers. Manag. 2008, 49, 1345–1356. [Google Scholar] [CrossRef]
- Brown, D.; Fuchino, T.; Maréchal, F. Solid fuel decomposition modelling for the design of biomass gasification systems. In Computer Aided Chemical Engineering; Elsevier: Amsterdam, The Netherlands, 2006; Volume 21, pp. 1661–1666. [Google Scholar]
- Guo, B.; Li, D.; Cheng, C.; Lü, Z.-A.; Shen, Y. Simulation of biomass gasification with a hybrid neural network model. Bioresour. Technol. 2001, 76, 77–83. [Google Scholar] [CrossRef]
- Aspen Plus, version 2006; Aspen Technology Inc.: Cambridge, MA, USA, 2006.
- Li, X.; Grace, J.; Watkinson, A.; Lim, C.; Ergüdenler, A. Equilibrium modeling of gasification: A free energy minimization approach and its application to a circulating fluidized bed coal gasifier. Fuel 2001, 80, 195–207. [Google Scholar] [CrossRef]
- Li, X.; Grace, J.; Lim, C.; Watkinson, A.; Chen, H.; Kim, J. Biomass gasification in a circulating fluidized bed. Biomass Bioenergy 2004, 26, 171–193. [Google Scholar] [CrossRef]
- Schuster, G.; Löffler, G.; Weigl, K.; Hofbauer, H. Biomass steam gasification–an extensive parametric modeling study. Bioresour. Technol. 2001, 77, 71–79. [Google Scholar] [CrossRef]
- Mozafari, A.; Tabrizi, F.F.; Farsi, M.; Mousavi, S.A.H.S. Thermodynamic modeling and optimization of thermolysis and air gasification of waste tire. J. Anal. Appl. Pyrolysis 2017, 126, 415–422. [Google Scholar] [CrossRef]
- Edgar, T.F.; Himmelblau, D.M.; Lasdon, L.S. Optimization of Chemical Processes. 2001. Available online: https://cir.nii.ac.jp/crid/1130282270768160896 (accessed on 12 June 2024).
- Tang, H.; Kitagawa, K. Supercritical water gasification of biomass: Thermodynamic analysis with direct Gibbs free energy minimization. Chem. Eng. J. 2005, 106, 261–267. [Google Scholar] [CrossRef]
- Voll, F.; Rossi, C.; Silva, C.; Guirardello, R.; Souza, R.; Cabral, V.; Cardozo-Filho, L. Thermodynamic analysis of supercritical water gasification of methanol, ethanol, glycerol, glucose and cellulose. Int. J. Hydrog. Energy 2009, 34, 9737–9744. [Google Scholar] [CrossRef]
- Poling, B.E.; Prausnitz, J.M.; O’connell, J.P. The Properties of Gases and Liquids; Mcgraw-Hill: New York, NY, USA, 2001; Volume 5. [Google Scholar]
- Byrd, A.J.; Pant, K.; Gupta, R.B. Hydrogen production from glycerol by reforming in supercritical water over Ru/Al2O3 catalyst. Fuel 2008, 87, 2956–2960. [Google Scholar] [CrossRef]
- Ortiz, F.G.; Campanario, F.; Aguilera, P.; Ollero, P. Hydrogen production from supercritical water reforming of glycerol over Ni/Al2O3–SiO2 catalyst. Energy 2015, 84, 634–642. [Google Scholar] [CrossRef]
- Furusawa, T.; Sato, T.; Sugito, H.; Miura, Y.; Ishiyama, Y.; Sato, M.; Itoh, N.; Suzuki, N. Hydrogen production from the gasification of lignin with nickel catalysts in supercritical water. Int. J. Hydrogen Energy 2007, 32, 699–704. [Google Scholar] [CrossRef]
- Gong, M.; Nanda, S.; Romero, M.J.; Zhu, W.; Kozinski, J.A. Subcritical and supercritical water gasification of humic acid as a model compound of humic substances in sewage sludge. J. Supercrit. Fluids 2017, 119, 130–138. [Google Scholar] [CrossRef]
- De Vlieger, D.; Chakinala, A.; Lefferts, L.; Kersten, S.R.; Seshan, K.; Brilman, D.W.F. Hydrogen from ethylene glycol by supercritical water reforming using noble and base metal catalysts. Appl. Catal. B Environ. 2012, 111, 536–544. [Google Scholar] [CrossRef]
- Aleosfoor, A.; Rahimpour, M.R. Highly dispersed copper on biochar carbon as a promising catalyst for reverse water gas shift reaction. J. Energy Inst. 2024, 115, 101680. [Google Scholar] [CrossRef]
- Kiani, M.R.; Kamandi, R.; Nozarian, K.; Rahimpour, M.R. Introducing a novel catalyst for efficient conversion of CO2 into syngas through reverse-water-gas-shift (RWGS) reactions based on highly mesoporous structures MCM-41: Influence of the Fe incorporation. Energy Convers. Manag. 2024, 304, 118247. [Google Scholar] [CrossRef]
- Mohandessi, M.; Rahimpour, M.R. Bio-template fabrication of nanoporous Ni@ Al2O3: Durable catalyst for biogas reforming reaction. Ceram. Int. 2023, 49, 7476–7488. [Google Scholar] [CrossRef]
- Mohandessi, M.; Tavakolian, M.; Rahimpour, M.R. Cadmium as a robust and novel promoter over Ni@ γ-Al2O3 catalysts in dry methane reforming. ACS Appl. Energy Mater. 2023, 6, 8209–8220. [Google Scholar] [CrossRef]
- Mohandessi, M.; Kiani, M.R.; Yousefi, S.; Rahimpour, M.R. Tuning the basicity of the Ni@ MCM-41 catalyst via alkaline earth metal oxide promoters for CO 2 reforming of CH 4. React. Chem. Eng. 2023, 8, 1349–1361. [Google Scholar] [CrossRef]
- Xue, E.; O’Keeffe, M.; Ross, J. Water-gas shift conversion using a feed with a low steam to carbon monoxide ratio and containing sulphur. Catal. Today 1996, 30, 107–118. [Google Scholar] [CrossRef]
- Castello, D.; Fiori, L. Supercritical water gasification of biomass: Thermodynamic constraints. Bioresour. Technol. 2011, 102, 7574–7582. [Google Scholar] [CrossRef] [PubMed]
- Sannigrahi, P.; Pu, Y.; Ragauskas, A. Cellulosic biorefineries—Unleashing lignin opportunities. Curr. Opin. Environ. Sustain. 2010, 2, 383–393. [Google Scholar] [CrossRef]
- Brix, K.V.; Esbaugh, A.J.; Grosell, M. The toxicity and physiological effects of copper on the freshwater pulmonate snail, Lymnaea stagnalis. Comp. Biochem. Physiol. Part C Toxicol. Pharmacol. 2011, 154, 261–267. [Google Scholar] [CrossRef] [PubMed]
- Yong, E.; Brucal, S.G.; Samaniego, L.; Peruda, S.; Reyes, J.C.D.; Dulfo, P.C.; Gecale, G.M.; Mabborang, E.A. Development of an Incubator System for Polyethylene plastic-eating Wax Worm in Tropical Weather Condition. In Proceedings of the 2022 IEEE 14th International Conference on Humanoid, Nanotechnology, Information Technology, Communication and Control, Environment, and Management (HNICEM), Boracay, Philippines, 1–4 December 2022; pp. 1–6. [Google Scholar]
Disclaimer/Publisher’s Note: The statements, opinions and data contained in all publications are solely those of the individual author(s) and contributor(s) and not of MDPI and/or the editor(s). MDPI and/or the editor(s) disclaim responsibility for any injury to people or property resulting from any ideas, methods, instructions or products referred to in the content. |
© 2024 by the authors. Licensee MDPI, Basel, Switzerland. This article is an open access article distributed under the terms and conditions of the Creative Commons Attribution (CC BY) license (https://creativecommons.org/licenses/by/4.0/).