LithoSFR Model for Mapping Groundwater Potential Zones Using Remote Sensing and GIS
Abstract
1. Introduction
2. Materials
2.1. Study Area
2.2. Hydrogeology of the Study Area
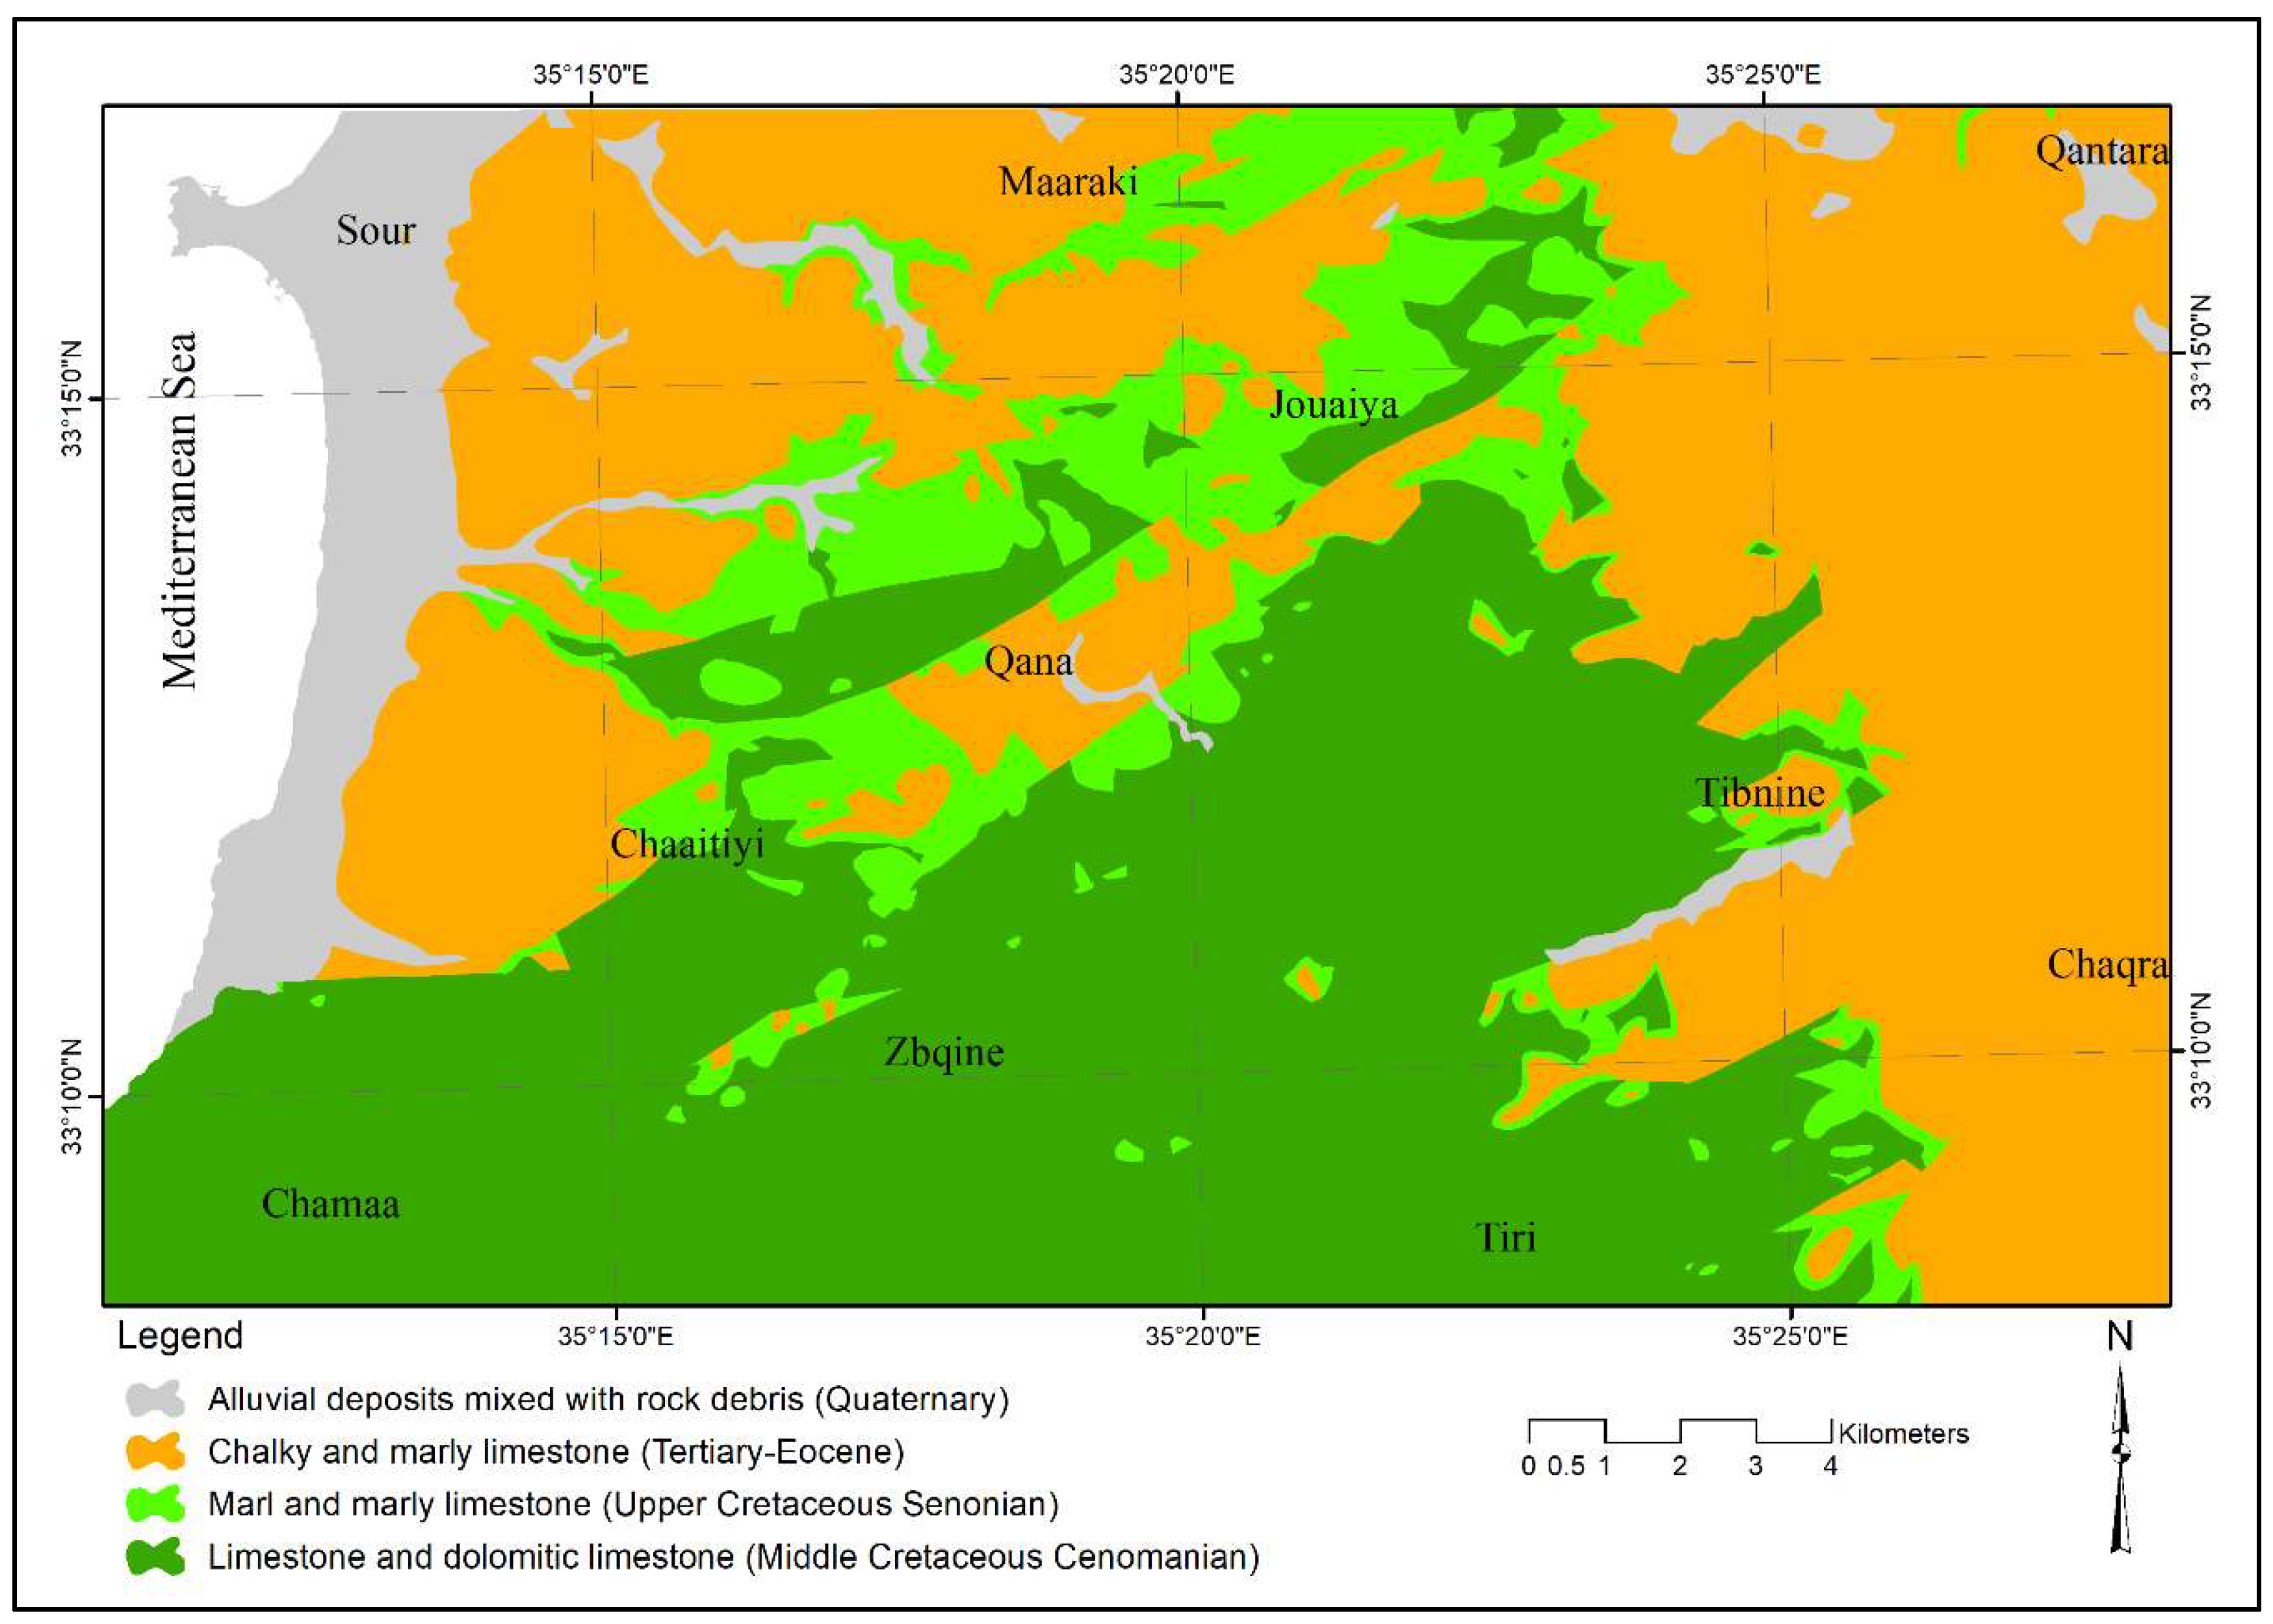
- Quaternary deposits: These are detrital materials composed mainly of alluvial deposits and sometimes mixed with rock debris and unconsolidated sediments from the surrounding highlands. They are often found in the low-lands and depressions. These deposits occur also in the coastal plain where sandy and loamy deposits are widespread. This rock formation has neither uniform thickness nor unified lithology.
- Eocene (Lower Tertiary–Lutetian) limestone: It comprises well-bedded carbonate rocks with a maximum 800 m thickness of thin to moderately thick and fractured, jointed, partly karstified beds of Nummulitic limestone with chert nodules, interbedded with marly and chalky limestone. This rock formation is exposed mainly in the NE of the study area, and it is considered as an aquifer due to the dominant spacing between its bedding planes and the common karstification and fractures, but the presence of chalk and marl, in some instances, reduces its aquiferous property [1].
- Senonian (Upper Cretaceous) Marl: This rock formation is composed largely of marl and some marly limestone, changing from massive, jointed, and fractured to soft and friable rocks. In the study area, it is exposed in different localities as elongated patches between the Tertiary and Cretaceous rocks. Nevertheless, the considerable clayey content, with minimal permeability, makes it unfavorable for groundwater flow, whether in the vertical or horizontal direction; therefore, it is considered as an “Aquiclude” [1].
- Cenomanian–Turonian (Middle Cretaceous) Limestone: The Turonian rocks (in the upper part of this formation) have marly limestone facies, have limited exposures, and are usually joining part of the Cenomanian rock formation. The latter is composed mainly of massive, thick to moderate thickness, well-bedded limestone and dolomitic limestone. This rock formation is highly fractured with developed karstic features (e.g., karstic conduits and galleries, etc.). It is well observed in the SW part of the study area. This rock formation is considered as an excellent aquifer, because it is characterized by secondary porosity and high permeability due to the abundant fracture systems, including fissure and multiple-set joints. In addition, karstification is well developed and represented by galleries and subsurface conduits, shafts, and grottos which are mostly filled with groundwater [34]. Therefore, the study area occupies two main aquifers (i.e., Eocene and Cenomanian), where the Cenomanian aquifer is known as the most productive groundwater reservoir not only in the study area but also in the entirety of Lebanon. The hydraulic characteristics of these aquiferous rock formations are shown in Table 1. These estimations have been adopted either from field measures or from different sources, e.g., [34,35,36,37].
2.3. Satellite Data Sources
- -
- IKONOS: https://www.satimagingcorp.com/gallery/ikonos/ (accessed on 13 March 2023).
- -
- Aster: https://asterweb.jpl.nasa.gov/data.asp (accessed on 22 May 2022).
- -
- Landsat 7 ETM+: https://geonarrative.usgs.gov/landsat-7/ (accessed on 8 June 2022).
- -
- SRTM:https://search.earthdata.nasa.gov/search?q=SRTM&ff=Map%20Imagery&lat=34.14729739882451&long=-3.375 (accessed on 15 February 2023).
- -
- ERDAS-Imagine 11 for satellite image processing (Leica Product, Atlanta, GA, USA).
- -
- Arc-GIS 10.2 for the manipulation of geospatial data (ESRI Product, Environmental System Research Institute, Redlands, CA, USA).
- -
- Geological maps of 1:50,000 scale. Sheets of Tyr-Nabatieh and Naqoura-Bent Jbeil [32].
- -
- Topographic maps of 1:20,000 scale with a 25 m contour interval. Sheets of Tyr, Ma’arakeh, Srifa, Rachidieh, Jouya, Tibnine, Naqoura, Aita Chaab, Bent Jbiel, Rmayesh, Yaroun [46].
- -
- Recharge potential map of the occidental zone of Lebanon with a 1: 1,000,000 scale [47].
- -
3. Methods
- An empirical method which depended mainly on the number of studies that mentioned any of the factors (or relevant elements to those factors). For this purpose, we implemented a detailed survey on the previous studies done on GWP mapping or any relevant groundwater recharge topic, and this is also one of the novelties of the LithoSFR Model. In this survey, 34 previous studies were analyzed and the number of used factors in each study was calculated (Table 3).
4. Results and Validation
4.1. Geospatial Data for the LithoSFR Model
- 1.
- Lithology
- 2.
- Fractures
- 3.
- Streams’ density
- 4.
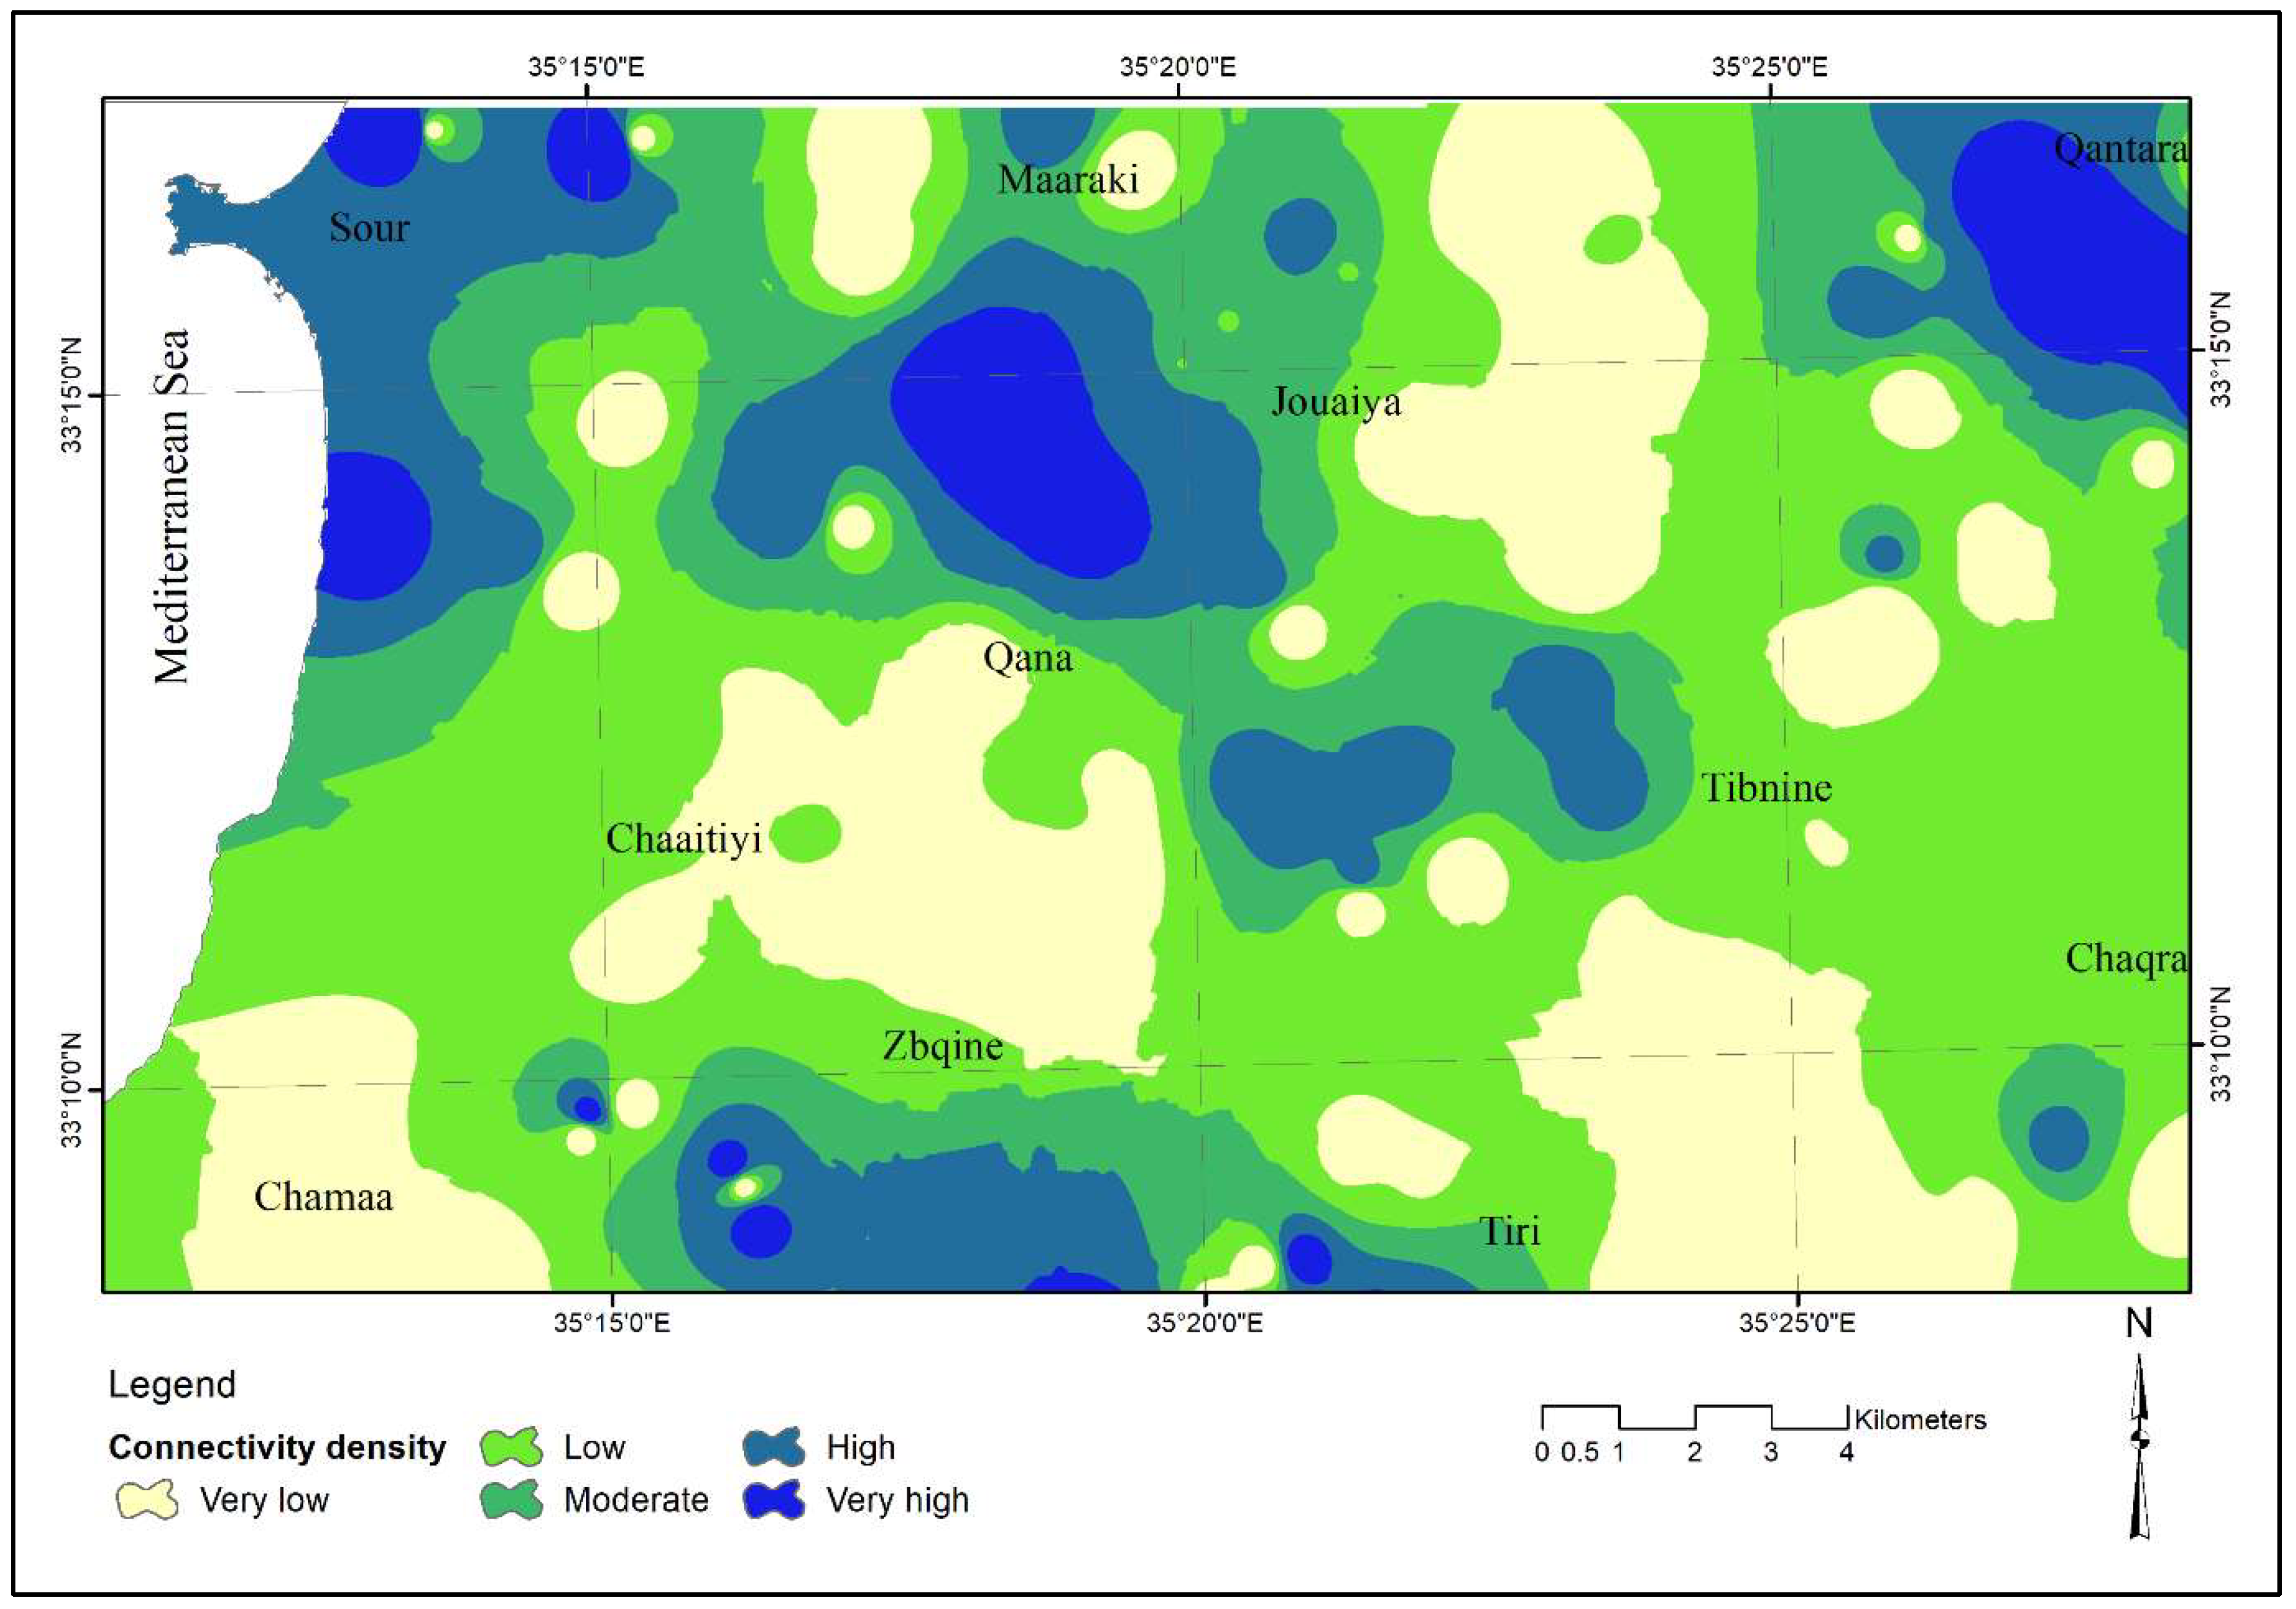
- Streams’ connectivity
- 5.
- Slope
- 6.
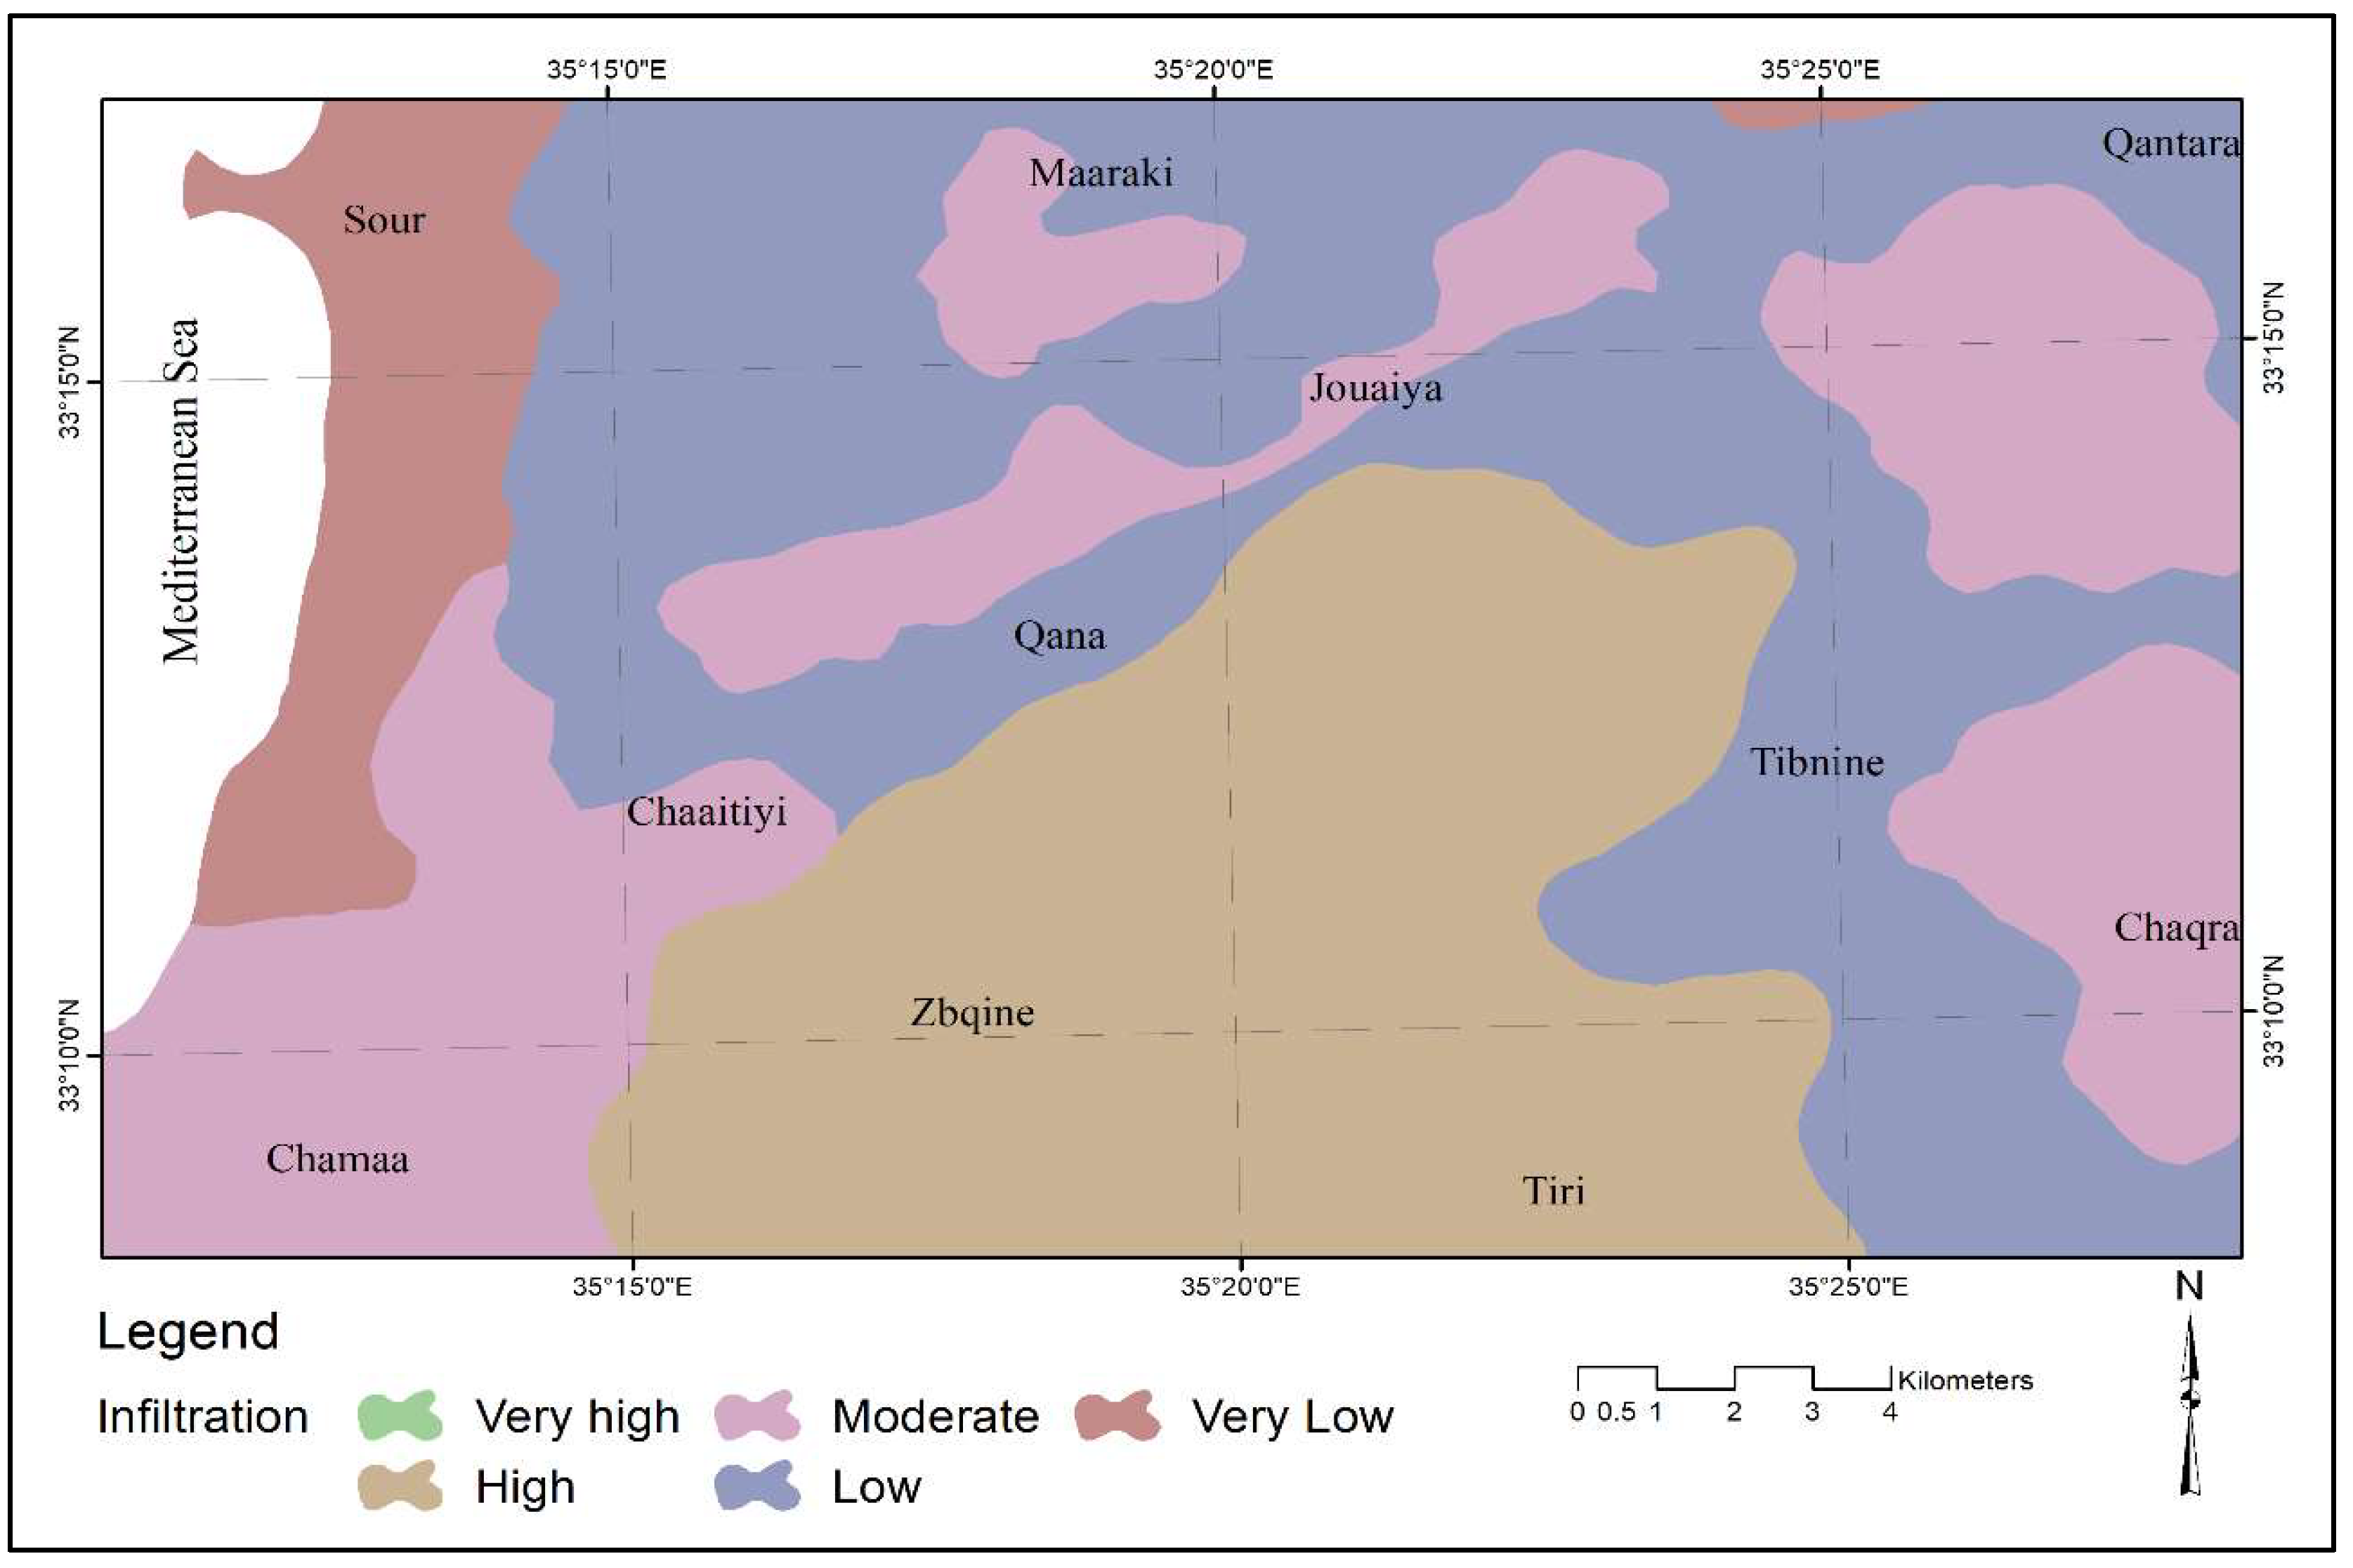
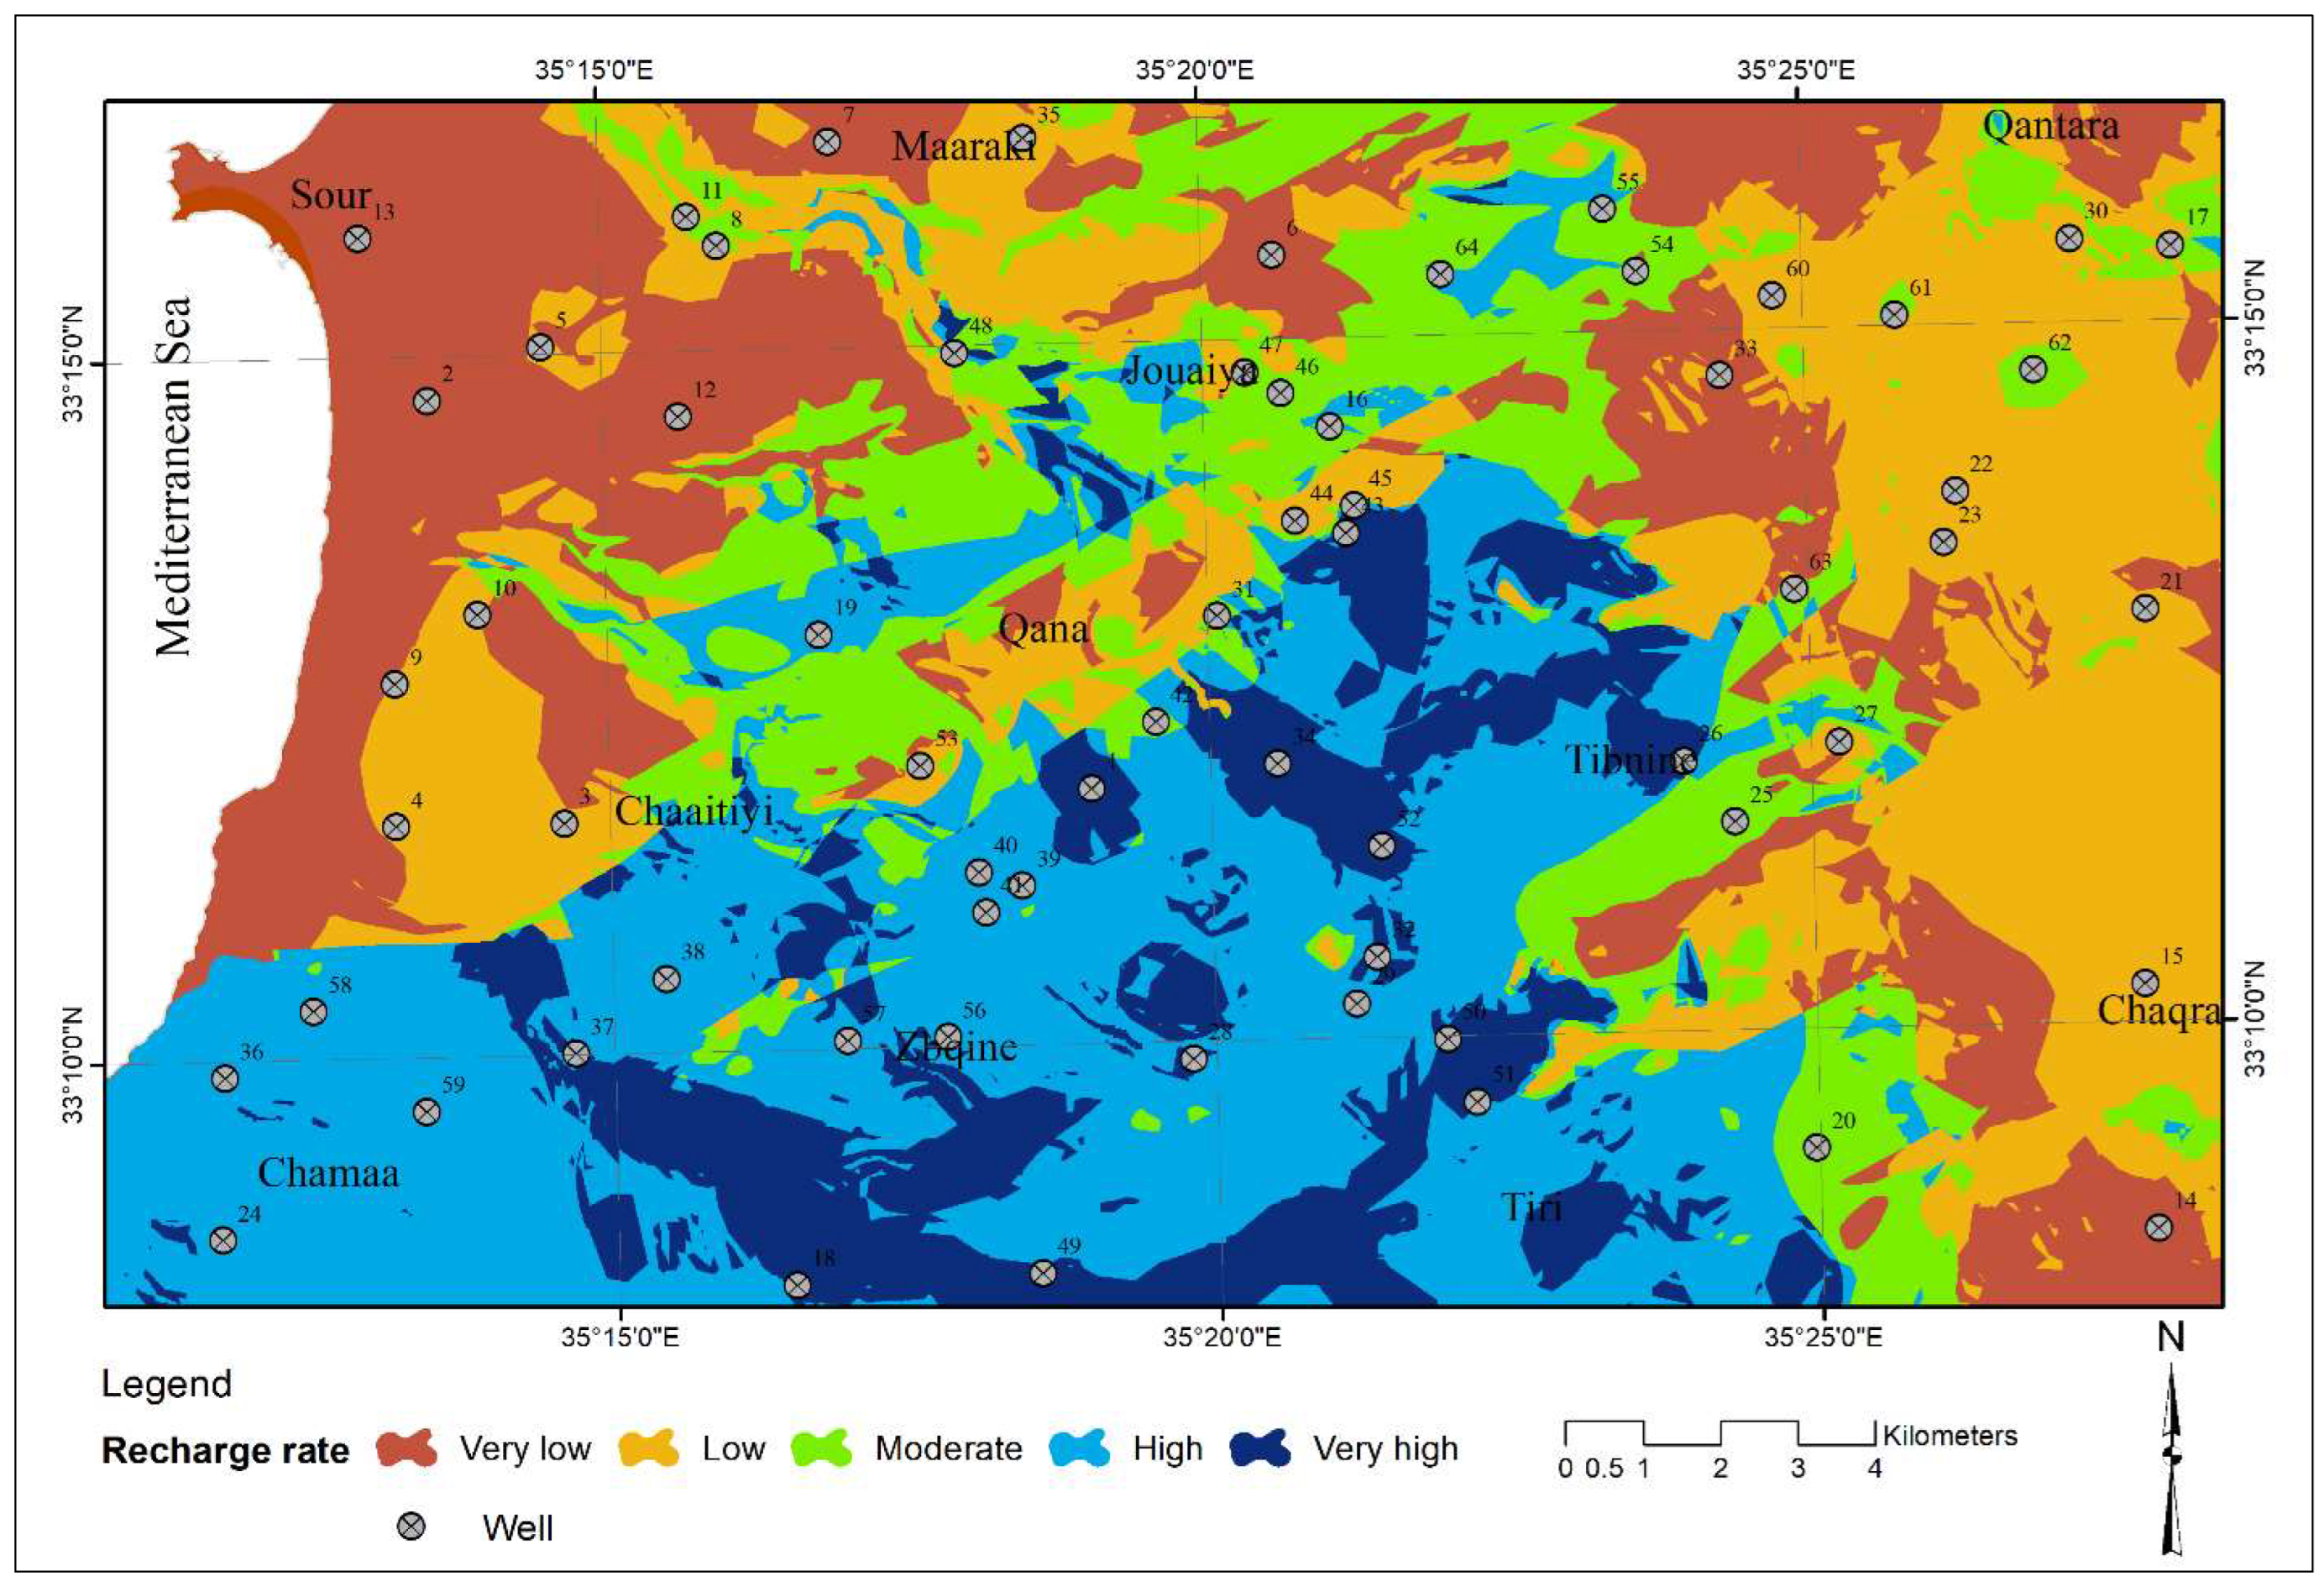
- Recharge rate
4.2. LithoSFR-Based GWP Map
- -
- Discharge rate greater than 12 L/s = Very high productivity.
- -
- Discharge rate between 12 and 8 L/s = High productivity.
- -
- Discharge rate between 8 and 4 L/s = Moderate productivity.
- -
- Discharge rate between 4 and 1 L/s = Low productivity.
- -
- Discharge rate less than 1 L/s = Very low productivity.
4.3. Results Validation
5. Discussion
6. Conclusions
Supplementary Materials
Author Contributions
Funding
Data Availability Statement
Acknowledgments
Conflicts of Interest
References
- Shaban, A. Water Resources of Lebanon; Springer Science Publisher: Cham, Switzerland, 2020; 229p, ISBN 978-3-030-48716-4. [Google Scholar]
- Shaban, A.; Hamzé, M. Shared Water Resources of Lebanon; Nova: New York, NY, USA, 2016; p. 150. [Google Scholar]
- Massoud, E.; Liu, Z.; Shaban, A.; El Hage, M. Groundwater depletion signals in the Beqaa Plain, Lebanon: Evidence from GRACE and Sentinel-1 data. Remote Sens. 2021, 13, 915. [Google Scholar] [CrossRef]
- MoPW. National Water Sector Strategy. 2010. Available online: http://extwprlegs1.fao.org/docs/pdf/leb166572E.pdf (accessed on 19 November 2023).
- FAO. Information System on Water and Agriculture-Aqua-stat Lebanon. 2008. Available online: http://www.fao.org/nr/water/aquastat/countries/lebanon/index.stm (accessed on 19 November 2023).
- UNDP. Assessment of Groundwater Resources of Lebanon; Technical Report; UNDP: New York, NY, USA, 2014; 88p. [Google Scholar]
- Shaban, A. Physical and Anthropogenic Challenges of Water Resources in Lebanon. J. Sci. Res. Rep. 2014, 3, 164–179. [Google Scholar] [CrossRef] [PubMed]
- IWMI; USAID. Groundwater Governance in Lebanon: The Case of Central Beqaa; Groundwater Governance in the Arab World: New York, NY, USA, 2017; 36p. [Google Scholar]
- Seelan, K. Satellite data in aid of groundwater exploration. A case study from Karnataka, India. In Proceedings of the International Conference on Groundwater Management, Sydney, Australia, 17–18 May 1983; pp. 169–173. [Google Scholar]
- Teeuw, R. Groundwater exploration using remote sensing and a low-cost geographic information system. Hydrogeol. J. 1995, 3, 21–30. [Google Scholar] [CrossRef]
- Rahmati, O.; Nazari Samani, A.; Mahdavi, M.; Pourghasemi, H.; Zeinivand, R. Groundwater Potential Mapping at Kurdistan Region of Iran Using Analytic Hierarchy Process and GIS. Arab. J. Geosci. 2015, 8, 7059–7071. [Google Scholar] [CrossRef]
- Arshad, A.; Zhang, Z.; Zhang, W.; Dilawar, A. Mapping favorable groundwater potential recharge zones using a GIS-based analytical hierarchical process and probability frequency ratio model: A case study from an agro-urban region of Pakistan. Geotech. Front. 2019, 11, 1805–1819. [Google Scholar] [CrossRef]
- Allafta, H.; Opp, C.; Patra, S. Identification of Groundwater Potential Zones Using Remote Sensing and GIS Techniques: A Case Study of the Shatt Al-Arab Basin. Remote Sens. 2021, 13, 112. [Google Scholar] [CrossRef]
- Errahmouni, A.; El Messari, J.; Taher, M. Estimation of groundwater recharge using APLIS method-case study of Bokoya Massif (Central Rif Morocco). Ecol. Eng. Environ. Technol. EEET 2022, 23, 57–66. [Google Scholar] [CrossRef] [PubMed]
- Tadmouri, R.; Shaban, A.; Baghdady, K.; Soliman, M. Unveiling novel APLIS model for identifying groundwater recharge zones in semi-arid regions: A case from Lebanon. Alex. Eng. J. 2024, 97, 360–375. [Google Scholar] [CrossRef]
- Ebraheem, A.; Garamoon, K. Numerical modeling of groundwater resource management options in the East Oweinat area, SW Egypt. Environ. Geol. 2003, 44, 433–447. [Google Scholar] [CrossRef]
- Bashi-Azghadi, N.; Kerachian, R. Locating monitoring wells in groundwater systems using embedded optimization and simulation models. Sci. Total Environ. 2009, 408, 2189–2198. [Google Scholar] [CrossRef]
- Cochand, F.; Therrien, R.; Lemieux, J.-M. Integrated Hydrological Modeling of Climate Change Impacts in a Snow-Influenced Catchment. Groundwater 2019, 57, 3–20. [Google Scholar] [CrossRef] [PubMed]
- Albers, B.; Molson, J.; Bense, V. Parameter Sensitivity Analysis of a Two-Dimensional Cryo-Hydrogeological Numerical Model of Degrading Permafrost Near Umiujaq (Nunavik, Canada). Hydrogeol. J. 2020, 28, 905–919. [Google Scholar] [CrossRef]
- Nag, S.; Ghosh, P. Delineation of Groundwater Potential Zone in Chhatna Block, Bankura District, West Bengal, India Using Remote Sensing and GIS Techniques. Environ. Earth Sci. 2013, 70, 2115–2127. [Google Scholar] [CrossRef]
- Liu, Y.; Gupta, H.V. Uncertainty in hydrologic modeling: Toward an integrated data assimilation framework. Water Resour. Res. 2007, 43, W07401. [Google Scholar] [CrossRef]
- Moghaddam, H.; Moghaddam, H.; Rahimzadeh, Z.; Bahreinimotlagh, M.; Javad Alizadeh, M. Developing comparative mathematic models, BN and ANN for forecasting of groundwater levels. Groundw. Sustain. Dev. 2019, 9, 100237. [Google Scholar] [CrossRef]
- Chen, C.; He, W.; Zhou, H.; Xue, Y.; Zhu, M. A comparative study among machine learning and numerical models for simulating groundwater dynamics in the Heihe River Basin, northwestern China. Sci. Rep. 2020, 10, 3904. [Google Scholar] [CrossRef] [PubMed]
- Ibrahim, A.; Wayayok, A.; Zulhaidi, H.; Shafri, M.; Toridi, M. Remote Sensing Technologies for Unlocking New Groundwater Insights: A Comprehensive Review. J. Hydrol. 2024, 23, 100175. [Google Scholar] [CrossRef]
- Gustafsson, P. SPOT satellite data for exploration of fractured aquifers in a semi-arid area in Botswana. Hydrogeol. J. 1994, 2, 9–18. [Google Scholar] [CrossRef]
- Per Sandra, F.; Chesley, M.; Minor, T. Groundwater assessment using remote sensing and GIS in a rural groundwater project in Ghana: Lessons learned. Hydrogeol. J. 1996, 4, 78–93. [Google Scholar]
- Shaban, A.; El-Baz, F.; Khawlie, M. The relation between water-wells productivity and lineaments morphometry: Selected zones from Lebanon. Hydrol. Res. 2007, 38, 187–201. [Google Scholar] [CrossRef]
- Ganapuram, S.; Kumar, G.; Krishna, I.; Kahya, E.; Demirel, M. Mapping of groundwater potential zones in the Musi basin using remote sensing and GIS. Adv. Eng. Softw. 2008, 40, 506–518. [Google Scholar] [CrossRef]
- Shaban, A. Support of Space Techniques for Groundwater Exploration in Lebanon. J. Water Res. Prot. 2010, 5, 354–368. [Google Scholar] [CrossRef]
- Senanayake, I.; Dissanayake, D.; Mayadunna, B.; Weerasekera, W. An Approach to Delineate Groundwater Recharge Potential Sites in Ambalantota, Sri Lanka Using GIS Techniques. Geosci. Front. 2016, 7, 115–124. [Google Scholar] [CrossRef]
- Dubertret, L. Carte Géologique de la Syrie et du Liban au 1/50000me. 21 Feuilles avec Notices Explicatrices; Ministère des Travaux Publics; l’Imprimerie Catholique: Beirut, Lebanon, 1953; 66p. [Google Scholar]
- Shaban, A. Geology and Hydrogeology of the Nabatieh Area. Unpublished Master’s Thesis, American University of Beirut, Geology Department, Beirut, Lebanon, 1987; 103p. [Google Scholar]
- Shaban, A. Etude de l’Hydrogéologie au Liban Occidental: Utilisation de la Télédétection. Ph.D. Dissertation, Bordeaux 1 Université, Pessac, France, 2003; 202p. [Google Scholar]
- Tabet, C. Geology and Hydrogeology of the Baskinta-Sannine Area, Central Lebanon. Master’s Dissertation, Geology Dept., AUB, Beirut, Lebanon, 1978; 123p. [Google Scholar]
- Canaan, G. The Hydrogeology of Western Slopes and Coastal Plain of Zahrani-Awali Region. Master’s Dissertation, Geology Dept., AUB, Beirut, Lebanon, 1992; 85p. [Google Scholar]
- Khadra, W. Hydrogeology of the Damour Upper Sannine-Maameltain Aquifer. Master’s Dissertation, Geology Dept., AUB, Beirut, Lebanon, 2005; 235p. [Google Scholar]
- Rauch, H.; LaRiccia, M. Water well yield related to lineaments in carbonates and shale of Hagerstown Valley, Maryland. In Proceedings of the Annual Meeting, Miami Beach, FL, USA, 17–21 April 1978; 59p. [Google Scholar]
- El Shazly, M.; El Raikaiby, M.; El Kassas, A. Groundwater investigation of Wadi Araba area, Eastern Desert of Egypt, Using Landsat Imagery. In Proceedings of the 17th Symposium on Remote Sensing of the Environment, Ann Arbor, MI, USA, 9–13 May 1983; pp. 1003–1113. [Google Scholar]
- Robinson, C.; El-Baz, F.; Singhory, V. Subsurface imaging by RADARSAT: Comparison with Landsat TM data and implications for groundwater in the Selima area, northwestern Sudan. Remote Sens. Abstr. 1999, 25, 45–76. [Google Scholar] [CrossRef]
- Sener, E.; Davraz, A.; Ozcelik, M. An integration of GIS and remote sensing in groundwater investigations: A case study in Burdur, Turkey. Hydrogeol. J. 2005, 13, 826–834. [Google Scholar] [CrossRef]
- Melese, T.; Belay, T. Groundwater Potential Zone Mapping Using Analytical Hierarchy Process and GIS in Muga Watershed, Abay Basin, Ethiopia. In Global Challenges; Wiley: Hoboken, NJ, USA, 2022; 13p. [Google Scholar]
- Elbeih, S. An overview of integrated remote sensing and GIS for groundwater mapping in Egypt. Ain Shams. Eng. J. 2015, 6, 1–15. [Google Scholar] [CrossRef]
- Nigussie, W.; Hailu, B.; Azagegn, T. Mapping of groundwater potential zones using sentinel satellites (−1 SAR and -2A MSI) images and analytical hierarchy process in Ketar watershed, Main Ethiopian Rift. J. Afr. Earth Sci. 2019, 160, 103632. [Google Scholar] [CrossRef]
- El Hage, M.; Robinson, C.; El-Baz, F.; Shaban, A. Fracture-controlled groundwater seeps into the Mediterranean Sea along the coast of Lebanon. Arab. J. Geosci. 2020, 13, 520. [Google Scholar] [CrossRef]
- Samida, H.; Dassi, L.; Boukhachem, K.; Masrouhi, A. Satellite remote sensing and GIS-based multi-criteria analysis for the assessment of groundwater potentiality in fractured limestone aquifer: Case study of Maknassy Basin, central Tunisia. J. Afr. Earth Sci. 2022, 195, 104643. [Google Scholar] [CrossRef]
- MoND (Ministry of National Defense). Topographic Maps of Lebanon (1:20.000); Directorate of Geographic Affairs: Beirut, Lebanon, 1962. [Google Scholar]
- Shaban, A.; Khawlie, M.; Abdallah, C. Use of remote sensing and GIS to determine recharge potential zones: The case of occidental Lebanon. Hydrogeol. J. 2006, 14, 433–443. [Google Scholar]
- Ali-Ahmad, G. Characterizing Groundwater Potential Zones in Nabatieh Area. Master’s Dissertation, Lebanese University, Faculty of Agronomy, Environmental Engineering Department, Beirut, Lebanon, 2015; 55p. [Google Scholar]
- Khalife, Z. Evaluation of Groundwater Quality under Agricultural Land Use in the Sub-Catchment Area of Ras El-Ain. Master’s Dissertation, Lebanese University, Faculty of Agronomy, Environmental Engineering Department, Beirut, Lebanon, 2021; 63p. [Google Scholar]
- Farhat, N.; Sleiman, W. Potential natural obstacles to groundwater engineering. J. Civ. Eng. Appl. 2023, 4, 46–61. [Google Scholar] [CrossRef]
- El-Baz, F.; Himida, I. Groundwater Potential of the Sinai Peninsula, Egypt; Project Summery; AID: Cairo, Egypt, 1995. [Google Scholar]
- Doll, P.; Lehner, B.; Kaspar, F. Global modeling of groundwater recharge. In Proceedings of the 3rd International Conference on Water Resources and the Environment Research, Technical Université of Dreseden, Dresden, Germany, 22 September 2002; Volume 1, pp. 27–33. [Google Scholar]
- Herron, N.; Wilson, C. A water balance approach to assessing the hydrologic buffering potential of an alluvial fan. Water Resour. Res. 2001, 37, 341–352. [Google Scholar] [CrossRef]
- Meisler, H. Hydrogeology of the Carbonate Rocks of the Lebanon Valley, Pennsylvania; 4th Series Groundwater Report; PA, USA, 1963; W17, 81p. Available online: https://pubs.usgs.gov/publication/70047455 (accessed on 18 December 2023).
- Taylor, L. Fracture traces and water wells: A review. Pa. Geol. 1980, 11, 2–4. [Google Scholar]
- Salman, A. Using Landsat image interpretation prospection around Qena providence. Egypt. Int. J. Remote Sens. 1983, 4, 179–189. [Google Scholar]
- Ahmed, F.; Hagaz, Y.; Andrawis, A. Landsat model for groundwater exploration in the Nuba Mountains, Sudan. Adv. Space Res. 1984, 4, 123–131. [Google Scholar] [CrossRef]
- El-Baz, F. Preliminary observations of environmental damage due to the Gulf war. Nat. Resour. Forum 1992, 16, 71–75. [Google Scholar] [CrossRef]
- Savane, I.; Goze, B.; Gwyn, H. Etude cartographique et structurale à l’aide des données Landsat de la région d’Odienne (Côte d’Ivoire). In Proceedings of the 26th International Symposium on Remote Sensing, Vancouver, BC, Canada, 25–29 March 1996; pp. 92–97. [Google Scholar]
- Edet, A.; Okereke, S.; Teme, C.; Esu, O. Application of remote sensing data to groundwater exploration: A case study of the Cross River State, southeastern Nigeria. Hydrogeol. J. 1998, 6, 394–404. [Google Scholar] [CrossRef]
- Das, D. GIS Application in Hydrogeological Studies. 2000. Available online: www.gisdevelopment.net (accessed on 19 November 2023).
- Murthy, K. Ground water potential in a semi-arid region of Andhra Pradesh-a geographical information system approach. Int. J. Remote Sens. 2000, 21, 1867–1884. [Google Scholar] [CrossRef]
- Bilal, A.; Ammar, O. Rainfall water management using satellite imagery: Examples from Syria. Int. J. Remote Sens. 2002, 23, 207–219. [Google Scholar] [CrossRef]
- Kumar, P.; Gopinath, G.; Seralathan, O. Application of remote sensing and GIS for the demarcation of groundwater potential areas of a river basin in Kerala, southwest coast of India. Int. J. Remote Sens. 2007, 28, 5583–5601. [Google Scholar] [CrossRef]
- Joycee, D.; Santhi, M. Mapping the groundwater potential zones in sub-basin of kodayar using satellite imagery with GIS application. Int. J. Earth Sci. Eng. 2014, 7, 1973–1980. [Google Scholar]
- Dinesan, V.; Gopinath, G.; Ashitha, M. Application of Geoinformatics for the Delineation of Groundwater Prospects Zones—A Case Study for Melattur Grama Panchayat in Kerala, India. Aquat. Procedia 2015, 4, 1389–1396. [Google Scholar] [CrossRef]
- Deepa, S.; Venkateswaran, S.; Ayyandurai, R.; Kannan, R.; Prabhu, M. Groundwater recharge potential zones mapping in upper Manimuktha Sub basin Vellar river Tamil Nadu India using GIS and remote sensing techniques Model. Earth Syst. Environ. 2016, 2, 137–146. [Google Scholar] [CrossRef]
- Andualem, T.; Demeke, G. Groundwater potential assessment using GIS and remote sensing: A case study of Guna tana landscape, upper Blue Nile Basin, Ethiopia. J. Hydrol. Reg. Stud. 2019, 24, 610. [Google Scholar] [CrossRef]
- Chenini, I.; Msaddek, M.; Dlala, M. Hydrogeological characterization and aquifer recharge mapping for groundwater resources management using multicriteria analysis and numerical modeling: A case study from Tunisia. J. Afr. Earth Sci. 2019, 154, 59–69. [Google Scholar] [CrossRef]
- Aslan, V.; Çelik, R. Integrated GIS-Based Multi-Criteria Analysis for Groundwater Potential Mapping in the Euphrates’s Sub-Basin, Harran Basin, Turkey. Sustainability 2021, 13, 7375. [Google Scholar] [CrossRef]
- Hakim, B. Recherches Hydrologiques et Hydrochimiques sur Quelques Karsts Méditerranéens: Liban, Syrie et Maroc; Publications de l’Université Libanaise: Beirut, Lebanon, 1985; 701p. [Google Scholar]
- NCRS; GORS. Geological and Hydrogeological Studies Assessing Water-Feeding Mechanisms of Coastal LEBANON; Final Report; National Center for Remote Sensing: Beirut, Lebanon, 2002; 56p. [Google Scholar]





| Rock Formation | Maximum Thickness * | Hydraulic Properties | |||||
|---|---|---|---|---|---|---|---|
| Porosity (Ø) | Permeability (P) ** | Moisture Content (ɱ) | Hydraulic Conductivity (k) | Specific Yield (Sy) | Transmissivity (T) | ||
| (m) | % | - | % | m/s | % | m2/s | |
| Lutetian | 550 | 4–6 | M-H | 7–9 | 10–5–10 ** | 14–24 | 1.2 × 10⁻⁶ −1.4 × 10⁻⁶ |
| Cenomanian | 700 | 8–12 | H-VH | 6–8 | 10–5–10 ** | 16–26 | 1.8 × 10⁻⁶ −2.4 × 10⁻⁶ |
| Satellite | No of Bands | Spatial Resolution | Revisit Time | Swath Width (km) | Year of Retrieve |
|---|---|---|---|---|---|
| IKONOS | 5 | 0.82 m | 3 days | 11.3 × 11.3 | May 2021; July 2021, |
| Aster | 14 | 15 VNIR, 30 m SWIR, 90 m TIR. | 16 days | 60 × 60 | March 2006 |
| Landsat 7 ETM+ | 8 | 30 m, 120 m thermal, 15 m pan | 16 days | 183 × 183 | April 2008 |
| SRTM | 1 | 30 m, 90 m | one mission | 225 × 233 | July 2017 |
| # | Author(s) | Mentioned Factors * | |||||
|---|---|---|---|---|---|---|---|
| L | F | Sd | Sc | Ts | Rp | ||
| 1 | Meisler, H. 1963 [54] | X | |||||
| 2 | Rauch, H; LaRiccia, M. 1978 [37] | X | |||||
| 3 | Taylor, L. 1980 [55] | X | |||||
| 4 | El Shazly et al., 1983 [38] | X | |||||
| 5 | Seelan, K. 1983 [9] | X | X | ||||
| 6 | Salman, A. 1983 [56] | X | X | ||||
| 7 | Ahmed et al., 1984 [57] | X | X | ||||
| 8 | El-Baz, F. 1992 [58] | X | X | X | |||
| Savane et al., 1996 [59] | X | X | |||||
| 9 | Gustafsson, P. 1994 [25] | X | |||||
| 10 | Teeuw, R. 1995 [10] | X | |||||
| 11 | Per Sandra et al., 1996 [26] | X | X | X | |||
| 12 | |||||||
| 13 | Edet et al., 1998 [60] | X | |||||
| 14 | Robinson et al., 1999 [39] | X | X | ||||
| 15 | Das, D. 2000 [61] | X | X | ||||
| 16 | Murthy, K. 2000 [62] | X | X | X | |||
| 17 | Bilal, A.; Ammar, O. 2002 [63] | X | X | X | |||
| 18 | Doll et al., 2002 [52] | X | X | ||||
| 19 | Sener et al., 2005 [40] | X | X | ||||
| 20 | Shaban et al., 2006 [47] | X | X | X | |||
| 21 | Kumar et al., 2007 [64] | X | X | X | X | ||
| 22 | Ganapuram et al., 2008 [28] | X | X | X | |||
| 23 | Joycee, D.; Santhi, M. 2014 [65] | X | X | X | |||
| 24 | Ali-Ahmad, 2015 [48] | X | X | X | X | ||
| 25 | Elbeih, S. 2015 [42] | X | X | ||||
| 26 | Dinesan et al., 2015 [66] | X | X | X | |||
| 27 | Deepa et al., 2016 [67] | X | X | X | X | ||
| 28 | Senanayake et al., 2016 [30] | X | |||||
| 29 | Arshad et al., 2019 [12] | X | X | X | |||
| 30 | Nigussie et al., 2019 [43] | X | X | X | X | ||
| 31 | Andualem, T; Demeke. G. 2019 [68] | X | X | X | X | X | |
| 32 | Chenini et al., 2019 [69] | X | X | ||||
| 33 | Aslan andÇelik, 2021 [70] | X | X | X | X | ||
| 34 | Samida et al., 2022 [45] | X | X | X | |||
| Total | 19 | 25 | 17 | 3 | 13 | 4 | |
| Factor | Mentions in the Surveyed Studies (Mf) | Percentage of the Weight (Wt) |
|---|---|---|
| Lithology | 19 | 23% |
| Fractures | 25 | 31% |
| Streams’ density | 17 | 21% |
| Streams’ connectivity | 3 | 4% |
| Terrain slope | 13 | 16% |
| Recharge rate | 4 | 5% |
| Sum value (Sv) | 81 | 100% |
| Factor | Wt (%) | Classes (Sub-Factor) | Impact on GWP | Rt (%) | Ri (%) | Rip (%) |
|---|---|---|---|---|---|---|
| Lithology (Descriptive) | 19 | Cenomanian–Turonian Limestone | Very high | 25 | 4.75 | 5.86 |
| Eocene Limestone | High | 25 | 4.75 | 5.86 | ||
| Quaternary deposits | Moderate | 25 | 4.75 | 5.86 | ||
| Senonian Marl | Low | 25 | 4.75 | 5.86 | ||
| Fractures’ density (Lineaments/25 km2) | 25 | >26 | Very high | 20 | 5 | 6.17 |
| 26–20 | High | 20 | 5 | 6.17 | ||
| 19–13 | Moderate | 20 | 5 | 6.17 | ||
| 12–6 | Low | 20 | 5 | 6.17 | ||
| <6 | Very low | 20 | 5 | 6.17 | ||
| Streams’ density (km/km2) | 17 | 8.62–6.90 | Very high | 20 | 3.4 | 4.19 |
| 6.90–5.17 | High | 20 | 3.4 | 4.19 | ||
| 5.17–3.44 | Moderate | 20 | 3.4 | 4.19 | ||
| 3.44–1.[ | Low | 20 | 3.4 | 4.19 | ||
| <1.72 | Very low | 20 | 3.4 | 4.19 | ||
| Streams’ connectivity (connecting points/km2) | 3 | 4.92–3.15 | Very high | 20 | 0.6 | 0.74 |
| 3.15–2.5 | High | 20 | 0.6 | 0.74 | ||
| 2.5–2.03 | Moderate | 20 | 0.6 | 0.74 | ||
| 2.03–1.06 | Low | 20 | 0.6 | 0.74 | ||
| <1.6 | Very low | 20 | 0.6 | 0.74 | ||
| Terrain slope (Degree °) | 13 | >35 | Very high | 20 | 2.6 | 3.20 |
| 35–20 | High | 20 | 2.6 | 3.20 | ||
| 20–10 | Moderate | 20 | 2.6 | 3.20 | ||
| 10–5 | Low | 20 | 2.6 | 3.20 | ||
| <5 | Very low | 20 | 2.6 | 3.20 | ||
| Recharge rate (%) | 4 | 50–45 | Very high | 20 | 0.8 | 0.99 |
| 35–30 | High | 20 | 0.8 | 0.99 | ||
| 20–10 | Moderate | 20 | 0.8 | 0.99 | ||
| 10–5 | Low | 20 | 0.8 | 0.99 | ||
| <5 | Very low | 20 | 0.8 | 0.99 | ||
| Sum | 81 | 100 | ||||
| GWP | Area (km2) | Percentage of the Total Area | Remarks |
|---|---|---|---|
| Very high | 57.2 | 11.34% | Very high-GWP zones exist as elongated geographic patches on the Cenomanian rock formation, and they obviously correspond to several geologic structures and also the fault alignments. |
| High | 165.1 | 32.75% | These zones are almost coincident with the geographic distribution of the Cenomanian rock formation which extends through the middle and lower parts of the study area. |
| Moderate | 69.3 | 13.75% | These GWP zones are located mainly between the high- and low-GWP zones, and they do not have a defined geographic distribution, but they often sharply exist with straight lines, evidencing their control with the geologic structural controls. |
| Low | 109.9 | 21.80% | The low-GWP zones are situated mainly in the eastern and western flanks of the study area, but they are totally absent in the lower part of it where fractured and karstified carbonate rocks are present. |
| Very low | 102.5 | 20.33% | These GWP zones exist as elongated stretches in the eastern part of the study areas, and they are mainly situated along the coastal zone to the west where the argillaceous materials (e.g., marls) are mixed with limestone rocks. |
Disclaimer/Publisher’s Note: The statements, opinions and data contained in all publications are solely those of the individual author(s) and contributor(s) and not of MDPI and/or the editor(s). MDPI and/or the editor(s) disclaim responsibility for any injury to people or property resulting from any ideas, methods, instructions or products referred to in the content. |
© 2024 by the authors. Licensee MDPI, Basel, Switzerland. This article is an open access article distributed under the terms and conditions of the Creative Commons Attribution (CC BY) license (https://creativecommons.org/licenses/by/4.0/).
Share and Cite
Shaban, A.; Farhat, N.; El-Hage, M.; Fadel, B.; Sheib, A.; Bitar, A.; Darwish, D. LithoSFR Model for Mapping Groundwater Potential Zones Using Remote Sensing and GIS. Water 2024, 16, 1951. https://doi.org/10.3390/w16141951
Shaban A, Farhat N, El-Hage M, Fadel B, Sheib A, Bitar A, Darwish D. LithoSFR Model for Mapping Groundwater Potential Zones Using Remote Sensing and GIS. Water. 2024; 16(14):1951. https://doi.org/10.3390/w16141951
Chicago/Turabian StyleShaban, Amin, Nasser Farhat, Mhamad El-Hage, Batoul Fadel, Ali Sheib, Alaa Bitar, and Doha Darwish. 2024. "LithoSFR Model for Mapping Groundwater Potential Zones Using Remote Sensing and GIS" Water 16, no. 14: 1951. https://doi.org/10.3390/w16141951
APA StyleShaban, A., Farhat, N., El-Hage, M., Fadel, B., Sheib, A., Bitar, A., & Darwish, D. (2024). LithoSFR Model for Mapping Groundwater Potential Zones Using Remote Sensing and GIS. Water, 16(14), 1951. https://doi.org/10.3390/w16141951


