Article

Enhancing Hydrodynamic Performance of Floating Breakwaters Using Wing Plates

by
Fares Ali Al-Sairafi
1,
Jisheng Zhang
1,*,
Chaohua Jiang
1,
Abdullah I. Almansour
2 and
Bassiouny Saleh
3,4
1
College of Harbor, Coastal and Offshore Engineering, Hohai University, Nanjing 210098, China
2
Civil Engineering Department, King Saud University, Riyadh 11421, Saudi Arabia
3
College of Energy and Power Engineering, Nanjing University of Aeronautics and Astronautics, Nanjing 210016, China
4
Production Engineering Department, Alexandria University, Alexandria 21544, Egypt
*
Author to whom correspondence should be addressed.
Water 2024, 16(13), 1779; https://doi.org/10.3390/w16131779
Submission received: 21 May 2024 / Revised: 11 June 2024 / Accepted: 17 June 2024 / Published: 23 June 2024
(This article belongs to the Section Oceans and Coastal Zones)

Abstract

:
Understanding the dynamic response of floating breakwaters to wave forces is essential for optimizing their design and improving coastal protection. The response amplitude operator serves as a key parameter in accurately predicting the structural response amplitudes at different frequencies and wave angles. By incorporating this knowledge, adjustments can be made to enhance the effectiveness of floating breakwaters. In this study, a comprehensive 3D model of the mooring system is developed to simulate its behavior under various wave and current conditions. The model takes into account critical design factors such as pontoon shapes, anchor types, placements, and configurations. Through simulations, valuable insights are obtained regarding the performance of the wing-plate floating breakwater mooring system across different operational settings. These findings contribute to the optimization of floating breakwaters and their ability to protect coastlines from wave impacts.

1. Introduction

Breakwaters are constructed to mitigate the impact of waves on coastal areas and protect shorelines, harbors, ports, and other coastal infrastructure from erosion and damage. They serve as barriers that absorb, reflect, or dissipate wave energy, reducing the intensity of waves reaching the protected area [1,2]. Floating breakwaters (FBWs) are designed as floating structures that are anchored or moored in place. They are typically constructed using a combination of concrete, steel, or composite materials [3]. FBWs offer advantages such as cost-effectiveness, ease of installation, and flexibility in adapting to changing coastal conditions. Fixed breakwaters, on the other hand, are built on a solid foundation, usually extending from the coast into the water [4,5]. They are typically constructed using massive concrete blocks, rocks, or other durable materials. Fixed breakwaters provide robust protection against wave forces but are often more expensive and challenging to construct compared to FBWs [6,7]. FBWs are particularly suitable for calm coastal conditions where wave energy is relatively lower. They are commonly employed in areas with shallow waters, protected bays, or marinas. FBWs can also be advantageous in situations involving deep waters, difficult geotechnical conditions, severe sedimentation problems, and steep seabed slopes, where the installation of fixed breakwaters may be challenging or economically unfeasible [8,9]. The wave-structure interaction around breakwaters involves various components. Reflected waves refer to waves that bounce back off the breakwater, while turbulence-damped waves are waves that experience energy dissipation due to the presence of the breakwater [10,11]. Transmitted waves are the waves that pass through or around the breakwater, continuing their propagation beyond the protected area [12,13].
The effectiveness of an FBW is determined by the number of waves transmitted, and structures that reflect more waves generally perform better. An important parameter often analyzed when studying FBWs is the wave-transmission coefficient. It represents the ratio of transmitted wave height to incident wave height and serves as a measure of FBW performance. Various structural and hydrodynamic factors influence the wave-transmission coefficient and have been the focus of research by many scientists in this field [14,15]. Floating breakwaters effectively reduce wave energy and erosion. Research on different types of floating breakwaters, such as porous slope breakwaters [16], floating breakwaters for emergent vegetation [17], and floating breakwaters for wetlands [18], have been shown to be able to attenuate waves by a significant percentage of 38% and up to 96%. Factors that influence wave attenuation include wave orbital velocity, wave period, stem spacing, and the ratio of stem spacing to wave height. Furthermore, integrating floating breakwaters and wave-energy converters is a valuable research area to improve wave attenuation performance and sustainable development of the marine environment. These results highlight the importance and effectiveness of floating breakwaters in controlling wave energy and erosion and provide valuable insights for coastal engineering applications [19,20].
The wave attenuation performance and movement of some types of floating breakwaters (FBs) have been reported by Ning et al. [21], who used numerical and experimental approaches to study and develop a mooring system model to simulate FB limitations. The effectiveness of a series of porous breakwaters in reducing wave forces on a floating dock has been studied by Gayathri [22], based on the theory of small-amplitude water waves at finite water depth. To detect hump formation in the approach channel of Cambert Bay, a regional wave model using wind time series as input was developed by Roger et al. [23]. The results showed that the proposed solution using flooded breakwaters was effective in wave mitigation. Erosion occurs due to wave action. McCartney conducted a study comparing the performance of four different types of floating breakwaters. The findings of the study indicated that anchored pontoon breakwaters exhibited superior performance compared to the other types [24]. In another work, Sannasiraj et al. studied FBWs using a two-dimensional finite element model and concluded that fixed placement had no effect on swimming performance [25]. In their study, Lee et al. presented a methodology for determining the response of a floating pontoon pier. Their research demonstrated that the movement of the pontoon is directly related to its size, draft, and the characteristics of its anchoring system [26]. In their innovative research, Wang and Son developed a novel experimental model for a porous floating breakwater. Their model employed a configuration of diamond-shaped blocks to effectively mitigate transmitted waves. Through their study, they reached the significant conclusion that porous floating breakwaters have the capability to decrease the height of incident waves [27]. In a separate investigation, Pena et al. conducted experiments using multiple models to calculate the wave-transmission coefficient. Their study led them to the significant finding that the width of the pontoon plays a crucial role in determining the performance of the breakwater [28]. Additionally, they introduced a new type of FBW that incorporates a pneumatic chamber. Through their research, they demonstrated that the inclusion of a pneumatic chamber in the FBW significantly enhances the system’s overall performance [29]. Additionally, Martin et al. presented a computational fluid dynamics (CFD) model in their study to investigate the impact of various anchoring systems on floating breakwaters (FBWs) [30]. Their research aimed to understand how different anchoring systems affect the performance of FBWs. In a separate study, Cho examined an FBW with a rectangular shape and vertical porous plates. Through analysis, Cho concluded that the specific selection of porous plates significantly contributes to reducing the permeability coefficient of the FBW [31]. This finding highlights the importance of carefully choosing the characteristics of porous plates in enhancing the performance of FBWs. In another research effort, Penn et al. employed a numerical model to examine the interaction between waves and an FBW anchored in water [32]. Their study focused on investigating the dynamics of wave interaction and its effects on the FBW system, providing valuable insights into the behavior of FBWs in different wave conditions.
McCartney provided a comprehensive discussion on the design principles and considerations for floating breakwaters in the Journal of Waterway, Port, Coastal, and Ocean Engineering. The study focused on providing guidelines and insights into the design process of floating breakwaters [24]. In their paper published in Ocean Engineering, Sannasiraj et al. examined the mooring forces and motion responses of pontoon-type floating breakwaters. The study aimed to analyze the stability and behavior of these structures under various wave conditions, shedding light on the performance and structural aspects of pontoon-type floating breakwaters [25]. In another study, Lee et al. investigated the dynamic and structural motions of a floating-pier system in waves, predicting the movement and response of such systems to wave actions. The study, published in Ocean Engineering, aimed to enhance the understanding of the behavior and performance of floating-pier systems under wave-induced loads [26]. In another work, Wang and Sun conducted an experimental study on a porous floating breakwater, exploring its performance and wave-energy dissipation capabilities. Published in Ocean Engineering, the research aimed to evaluate the effectiveness of porous floating breakwaters in reducing wave energy and protecting coastal areas [27]. In another study, Peña et al. performed an experimental study on wave-transmission coefficient, mooring lines, and module connector forces, evaluating the effectiveness and structural aspects of different designs of floating breakwaters. The study, published in Ocean Engineering, focused on assessing the performance and structural behavior of various floating breakwater designs [28]. Moreover, He et al. investigated the hydrodynamic performance of a rectangular floating breakwater with and without pneumatic chambers in Ocean Engineering. The study aimed to analyze the impact of pneumatic chambers on wave-energy dissipation and enhance the understanding of the performance of such breakwater configurations [29]. In another paper, Martin et al. conducted a numerical simulation of interactions between water waves and a moored-floating breakwater, providing insights into the behavior and performance of such systems. The study aimed to enhance the understanding of wave-breakwater interactions and their implications for floating breakwater design [30]. In another work, Cho focused on investigating the wave-transmission characteristics of a floating rectangular breakwater with porous side plates in the International Journal of Naval Architecture and Ocean Engineering. The study aimed to analyze the specific design features that influence the wave-transmission properties of breakwaters [31]. In another study, Peng et al. performed a numerical simulation of interactions between water waves and inclined moored submerged floating breakwaters, analyzing the behavior and effectiveness of such breakwater configurations. The study, published in Coastal Engineering, aimed to enhance understanding of the performance of inclined submerged floating breakwaters under wave conditions [32]. In addition, Sannasiraj et al. conducted a study on the wave-transmission characteristics of a floating breakwater, analyzing its performance in reducing wave energy and protecting coastal areas. The research aimed to evaluate the effectiveness of floating breakwaters in attenuating waves and their role in coastal protection [33]. In another work, Kim et al. presented a numerical study on the wave-transmission characteristics of a floating breakwater, examining its effectiveness in attenuating waves and reducing wave-induced forces. The study aimed to analyze the wave-transmission properties and the efficiency of floating breakwaters as wave-energy dissipators [34].
In another work, Kim et al. investigated the wave-transmission characteristics of a trapezoidal floating breakwater, evaluating its performance in wave-energy dissipation and coastal protection [35]. In another study, Sannasiraj et al. studied the wave-transmission characteristics of a floating breakwater with a porous barrier, assessing its effectiveness in reducing wave heights and protecting coastal structures [36]. In another research, Kim et al. conducted an experimental study on the wave-transmission characteristics of a floating breakwater with a perforated barrier, analyzing its performance in wave-energy dissipation and coastal defense [37]. In another study, Sannasiraj et al. investigated the wave-transmission characteristics of a floating breakwater with a sloping front face, evaluating its efficiency in reducing wave impacts and protecting coastal areas [38]. In another paper, Kim et al. performed a numerical investigation on the wave-transmission characteristics of a floating breakwater with a sloping front face, assessing its effectiveness in wave attenuation and coastal defense [39]. Also, Sannasiraj et al. analyzed the wave-transmission characteristics of a floating breakwater with a wave absorber, studying its performance in wave-energy dissipation and coastal protection [40]. Moreover, Kim et al. conducted an experimental study on the wave-transmission characteristics of a floating breakwater with a wave absorber, evaluating its efficiency in reducing wave impacts and protecting coastal structures [41]. In another study, Sannasiraj et al. investigated the wave-transmission characteristics of a floating breakwater with a wave reflector, analyzing its effectiveness in wave attenuation and coastal defense [42].
Based on the above literature review, the aim of this paper is to understand the dynamic response of floating breakwaters to wave forces and utilize this knowledge to optimize their design and improve coastal protection. The focus is on investigating the response amplitude operator as a crucial parameter for accurately predicting structural response amplitudes at various frequencies and wave angles. By incorporating this understanding, adjustments can be made to enhance the effectiveness of floating breakwaters. Thus, in this study, a comprehensive 3D model of the mooring system is developed to simulate its behavior under different wave and current conditions. The model considers critical design factors such as pontoon shapes, anchor types, placements, and configurations. Through simulations, the study aims to provide valuable insights into the performance of the wing-plate floating breakwater mooring system across different operational settings. These insights will contribute to the optimization of floating breakwaters and their ability to protect coastlines from wave impacts, thereby enhancing coastal protection measures.

2. Theoretical Framework

The response amplitude operator (RAO) is an important parameter to characterize the dynamic response of floating breakwater structures to wave loading. RAO represents the amplitude of a structure’s response at a specific frequency and wave direction. This is a fundamental tool for evaluating the performance and stability of floating breakwaters under wave conditions. RAO is typically calculated through numerical simulations or experimental tests. In the numerical simulation, the RAO is obtained by solving the equations of motion of a floating breakwater structure subjected to wave loads using ANSYS-AQWA. This allows prediction of the dynamic response of the structure in terms of amplitude and phase of motion at different frequencies and wave directions. RAO is an important parameter for the design and optimization of floating breakwaters. This helps assess the structural integrity and stability of the breakwater under different wave conditions. By analyzing the RAO, designers can identify potential problem areas and make informed decisions to improve structure performance and safety. Propagating long wavefront harmonics is the most attractive result of linear wave theory. To describe this harmonic (regular wave), we can use a sine wave with propagation amplitude ( a ), arc frequency ( ω ), and wave number ( k ). Below is the equation showing the sine wave harmonic equation.
η ( x , t ) = H 2 sin ( 2 π T t 2 π L x ) = a sin ( ω t k x )
The wave propagates at a forward speed (c) called the phase speed, whereas the phase ( ω t k x ) remained the same. This indicates in mathematics that the time derivative of the phase is equal to zero. This allows for the calculation of phase speed. Figure 1 displays the parameters utilized in the equations.
c = ω k = L T
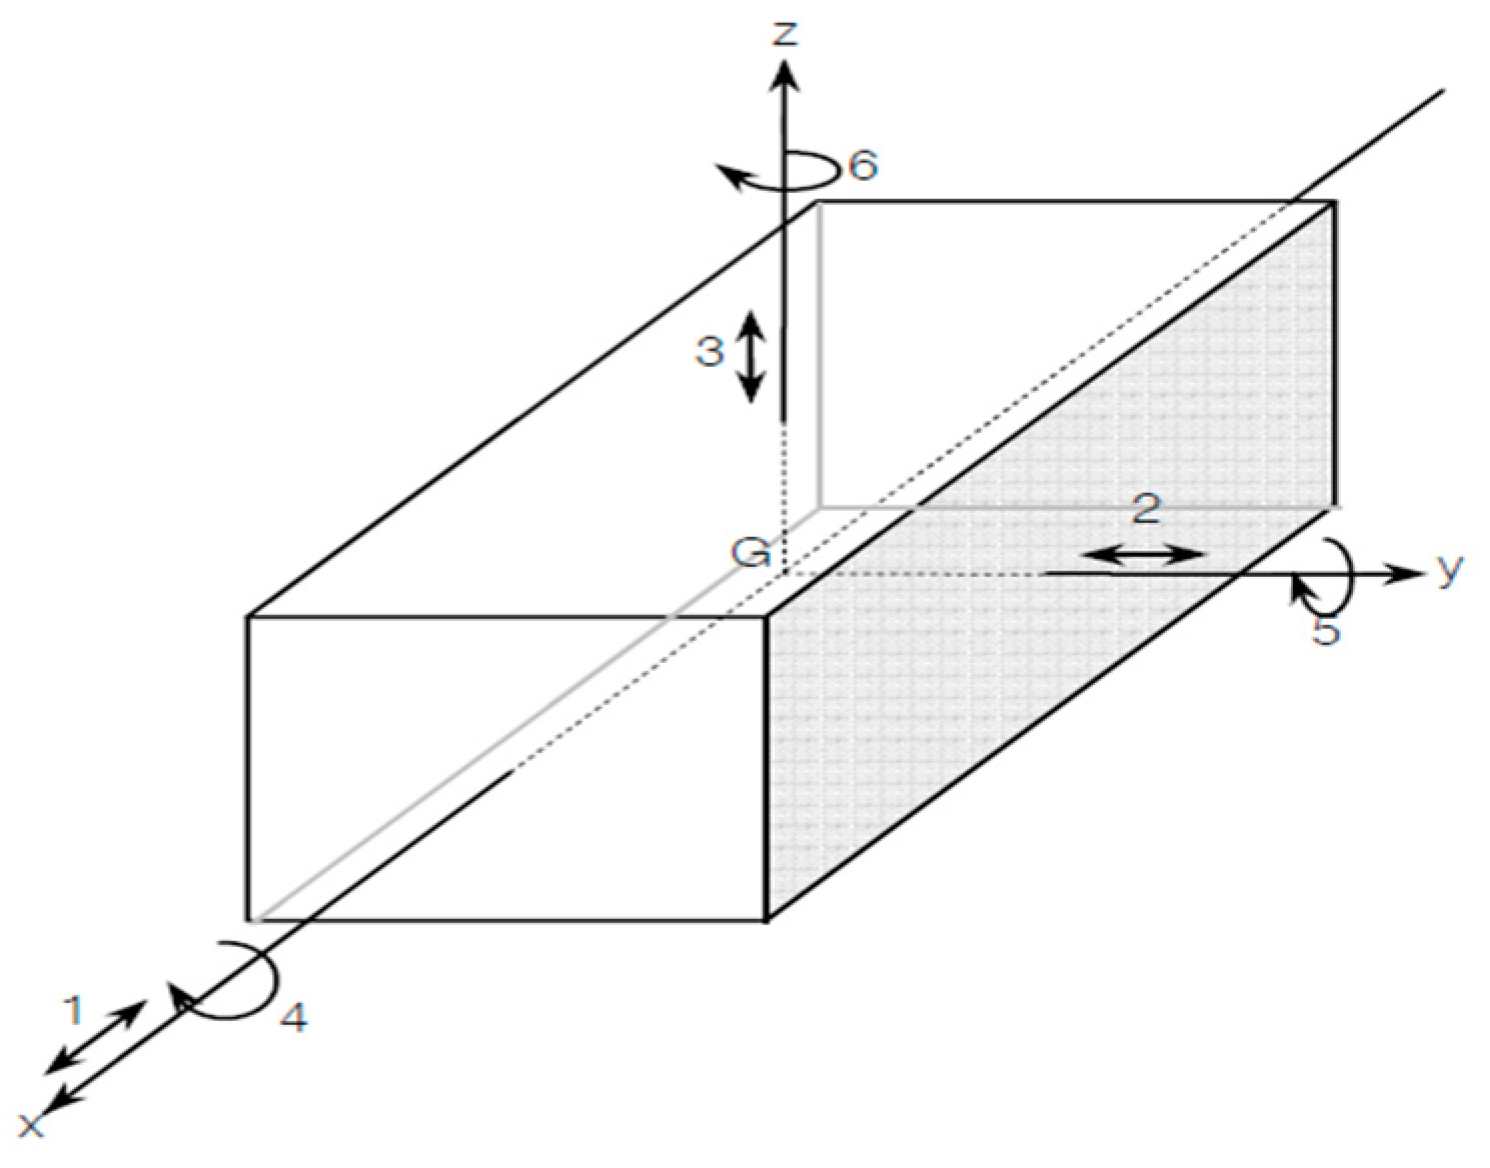
Breakwaters are regularly subjected to wave stress. Floating structures accelerate and move in response to these cyclic loads, generating internal forces within the structure and anchorage system. This section describes the equations that describe the motion of a floating breakwater. A floating body has six degrees of freedom in a 3D reference system. Three displacements of the center of gravity of the structure along the X, Y, and Z axes and three rotations around these axes were performed. These translations and rotations of a pontoon-type floating breakwater are shown in Figure 2.
Since the incoming wave is harmonic, the equations defining the structure’s motions will also be harmonic. Superposition can determine the motions at any place on the structure when the center of gravity’s motions are known. The following equation can be used to explain how the center of gravity of a floating body moves [26]
surge : x = x a cos ( ω e t + ε x ζ )
sway :   y = y a cos ( ω e t + ε y ζ )
Heave :   z = z a cos ( ω e t + ε z ζ )
Roll :   ϕ = ϕ a cos ( ω e t + ε ϕ ζ )
Pitch :   θ = θ a cos ( ω e t + ε θ ζ )
in which
n a =   Motion   amplitude   [ m ] , [ rad ]
ε n ζ =   Phase   angle   [ rad ]
ω =   Circular   wave   frequency   [ rad / s ]

2.1. Model Formulation

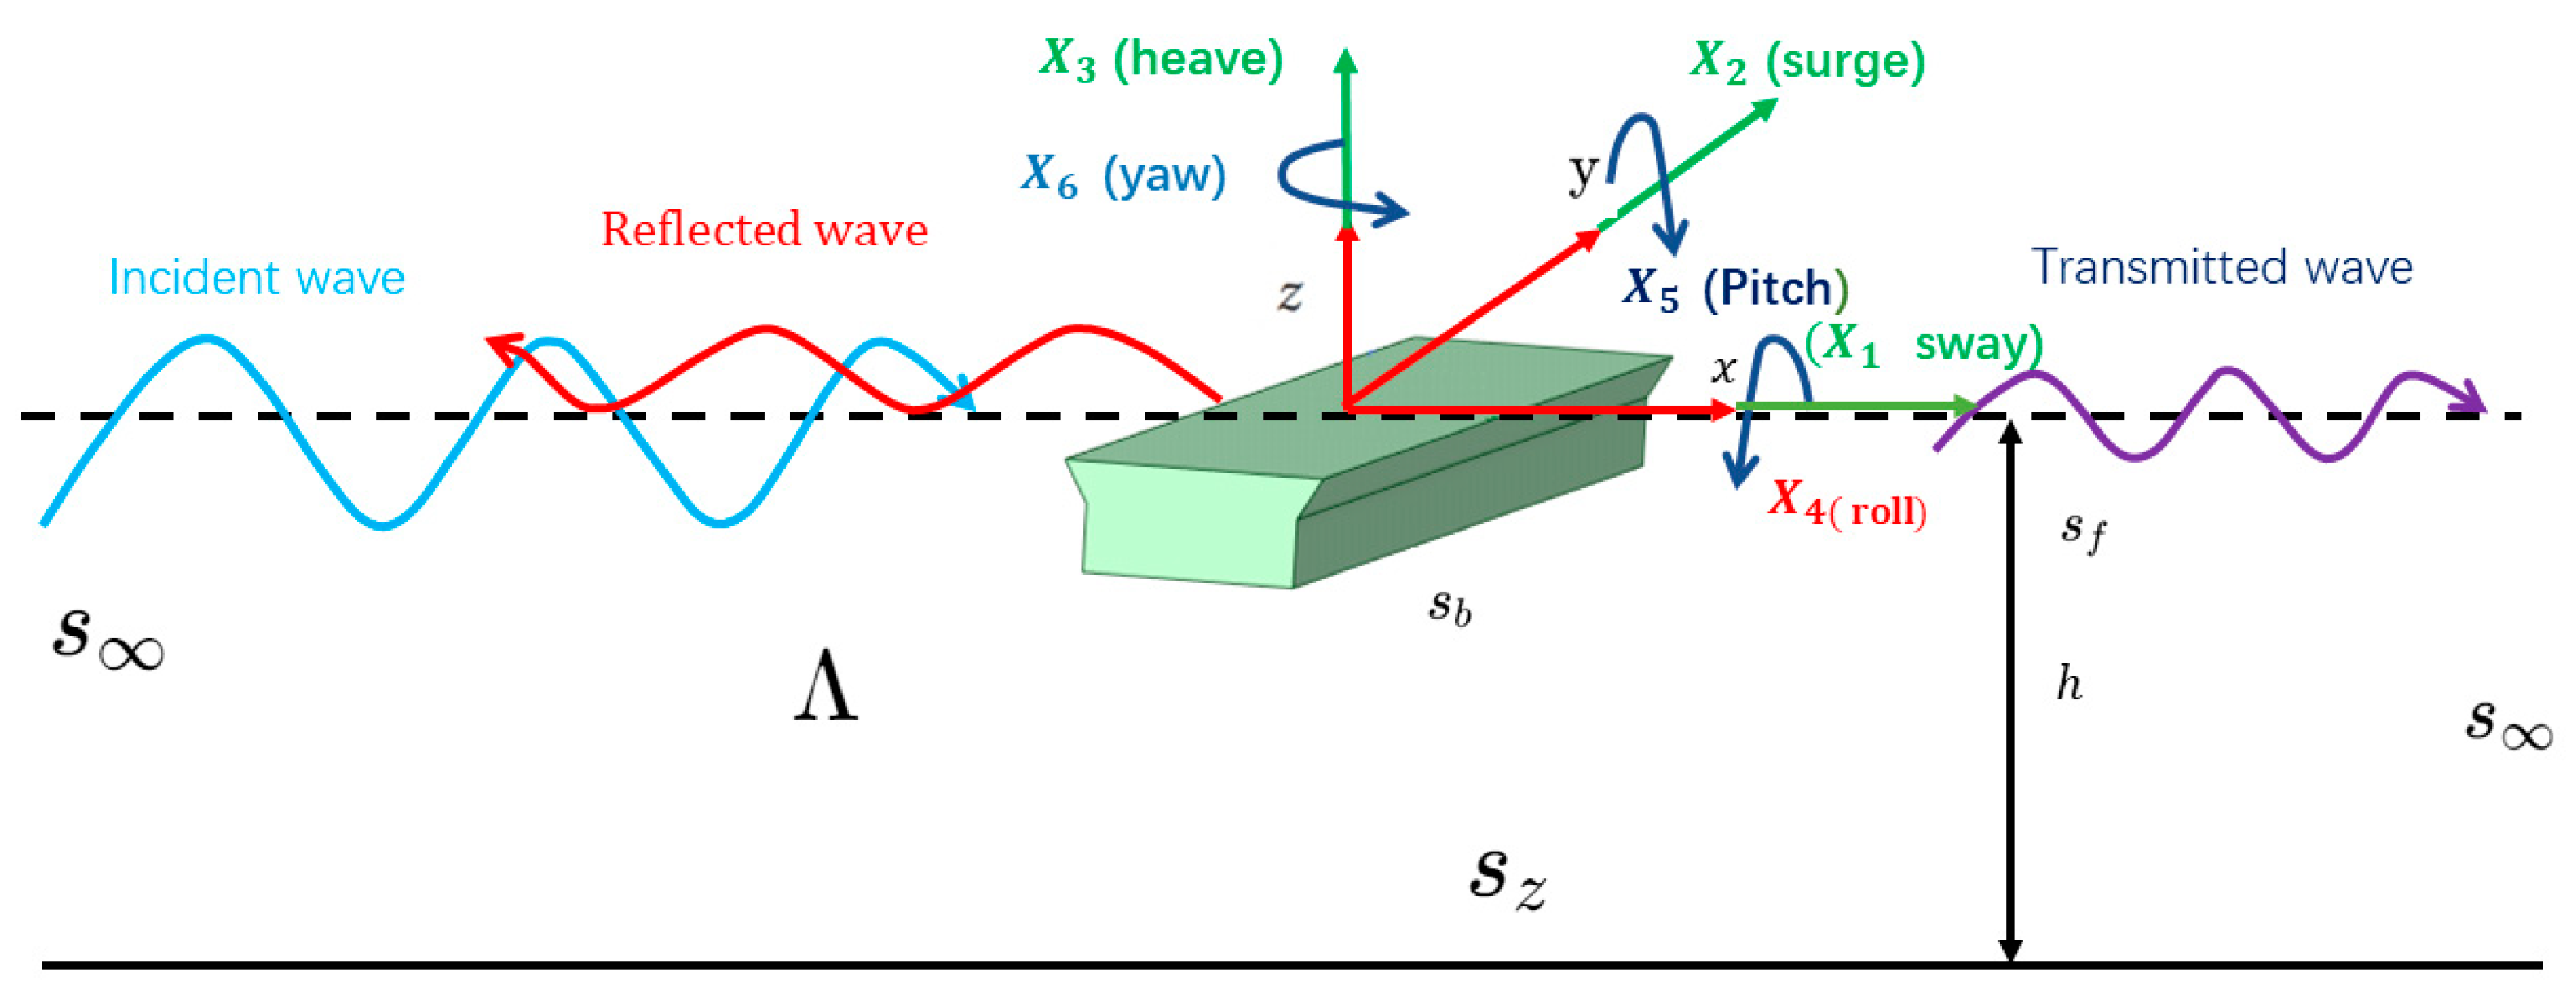
Most hydrodynamic issue analyses assume that the fluid is Newtonian and incompressible. For water, this kind of assumption is appropriate. The Navier–Stokes (N–S) equations describe the fluid flow that is controlled by a system of elliptic partial differential equations. The structure’s enormous size makes the fluid viscosity insignificant. Water is therefore believed to be inviscid everywhere. When combined with the assumption of incompressibility, these assumptions produce an ideal fluid and reduce the N–S equations to the Euler equations, which eliminate all viscous stresses. The governing equations reduce to a linear partial differential equation known as the Laplace equation under the assumption that the flow is irrotational. Potential flow is the name given to such a flow. One benefit of the boundary element method (BEM) is that it can potentially increase computational efficiency by transforming a domain integration problem into a surface integration problem. However, the most common use of BEM is in the Laplace equation, where Green’s theorem guarantees a complete volume-surface transformation [43]. In wave-structure interaction problems, Laplace equation computations have shown satisfactory results, assuming an irrotational flow and incompressible fluid [44]. The main goal of this work is to analyze the effects of wave environmental factors on pontoon floating breakwaters (FBWs). It is important to consider the interaction between the waves and the structure while analyzing the impact of water waves concerning wavelength on major maritime structures. Figure 3 shows the interaction of a floating pontoon breakwater with a linear wave, considering radiation and diffraction issues. We used the commercial program ANSYS-AQWA for the hydrodynamic analysis of floating structures in the time and frequency domains. This paper outlines the approach and strategies used with this program to overcome the difficulties encountered.

2.1.1. Governing Equations

The idea of velocity potential is presented in reference [45] to describe the fluid flow field surrounding a floating structure.
Φ ( X , t ) = A φ ( X ) e i ω t ,
where A stands for the incident amplitude of the wave, the wave frequency is indicated by ω, the time is indicated by t, and the position with respect to fixed reference axes (FRA) is specified by X = ( x , y , z ) . The body’s center of gravity is subjected to three translational and three rotational movements caused by an incident wave with a unit amplitude, using standard symbols for floating rigid motions.
{ X j = u j , ( j = 1 , 2 , 3 ) , X j = θ j 3 , ( j = 4 , 5 , 6 )
where φ ( X ) is defined as the cumulative sum of three independent components, the incident wave potential ( φ I ) , ( φ D ) the diffracted wave potential, and ( φ R ) the radiated wave potential. The following mathematical relationship can be understood since all of these potentials satisfy the Laplace equation.
φ | ( X ) e i ω t = [ φ I + φ D + j = 1 6 φ R j X j ] e i ω t ,
where the unit wave amplitude φ I represents the unit wave characteristic first-order potential of the incident wave, and the potential of the diffracted wave is represented by φ D , while the potential of the radiation wave, which is related to the j-th motion with a unit motion amplitude, is represented by φ R j .
The velocity potential function, represented by the expression Φ ¨ ( X . t ) , has a time-independent component φ ˙ ( X ) . The following equations describe the fluid dynamics under the assumption of irrotational flow and linear hydrodynamic theory applied to incompressible, inviscid fluids:
(i)
The Laplace equation prevailing within the fluid domain ( Λ ) [46]:
2 φ ( x , y , z ) = 2 φ x 2 + 2 φ y 2 + 2 φ z 2 = 0 ,
(ii)
Linear free surface ( s f ) on z = 0:
ω 2 φ + g φ z & = 0 ,
(iii)
Body surface conditions ( s b ):
φ n & = { i ω n j , for   radiation   potential , φ n , for   diffraction   potential ,
(iv)
Seabed surface condition ( s z ) at z = −h:
φ z = 0 ,
(v)
For far-field conditions ( s ) where x 2 + y 2   ,
| φ | 0 .
As mentioned before, the potential-based BEM is employed in this study to calculate the velocity potential using the ANSYS-AQWA software (version 2021 R1). Besides the boundary conditions described in the previous section, the fluid domain additionally satisfies the follow21ing boundary condition, as mentioned in [47]:
2 G ( X , ξ , ω ) = 2 G x 2 + 2 G y 2 + 2 G z 2 = δ ( X ξ ) .
where X Λ , ξ Λ , ξ = ( ξ , η , ζ ) is the source location on the FBW wetted surface, and δ ( X ξ ) is the Dirac function, which is described as
δ ( X ξ ) & = { 0 , where , X ξ 0 , co , where , X ξ = 0 .
The Dirac function can, therefore, be used to denote Green’s function as
G ( X , ξ , ω ) = 1 r + 1 r 2 + 0 2 ( k + ν ) e k h cos h [ k ( z + h ) ] cos h [ k ( ζ + h ) ] k sin h ( k h ) ν cos h ( k h ) j 0 ( k R ) d k = i 2 π ( k 0 + ν ) e k 0 h cos h [ k 0 ( z + h ) ] cos h [ k 0 ( ζ + h ) ] sin h ( k 0 h ) + k 0 h cos h ( k 0 h ) ν h sin h ( k 0 h ) j 0 ( k 0 R ) ,
where j 0 is the Bessel function first kind, and k 0 tan h ( k 0 h ) = ν ,
R = ( x ξ ) 2 + ( y η ) 2 , r = R 2 + ( z ζ ) 2 , r 2 = R 2 + ( z + ζ 2 h ) 2 , ν = ω 2 g ,
where k = ( 2 π / L ) , and ω , L , and g are the wavenumber, wave frequency, wavelength, and the gravitational acceleration, respectively.
Here, Green’s theorem defines the velocity potential of radiation and diffraction waves as a Fredholm integral equation of the second sort.
c φ ( X ) = S 0 { φ ( ξ ) G ( X , ξ , ω ) n ( ξ ) G ( X , ξ , ω ) φ ( ξ ) n ( ξ ) } d S , c = { 0 , X Λ S 0 2 π , X S 0 , 4 π , X Λ .
Then, the potential of fluid is expressed as
φ ( X ) = 1 4 π S b σ ( ξ ) G ( X , ξ , ω ) d S ,
where X Λ S b .
Equation (15) defines the source strength over the mean wetted hull surface as follows, based on the hull surface boundary condition provided by Equation (6).
φ ( X ) n ( X ) = 1 2 σ ( X ) + 1 4 π S b σ ( ξ ) G ( X , ξ , ω ) n ( X ) d S ,
where X S b .

2.1.2. Equation of Motion and RAOs

The diffraction and radiation issues’ derived solutions can be used in conjunction with the floating FBW system’s equation of motion to examine the structural system’s dynamic responses in both the time and frequency domains.
The structural equation of motion in the frequency domain is provided by
[ ω 2 ( M s + M a ) i ω C + K h y s + K a ] [ X j m ] = [ F j m ] ,
where M a is matrices of the total added mass, C is the hydrodynamic damping matrix, M s is the total structural mass, K a is matrices of additional structural stiffness, F i m represents the total Froude–Krylov and K h γ s represents the assembled hydrostatic stiffness. Furthermore, j stands for motion modes and m stands for the structure.
Next, the time-domain equation of motion is written as
M X ¨ ( t ) + C X ˙ ( t ) + K X ( t ) = F ( t ) ,
where M is the additional mass in the mass matrix, C is the hydrodynamic damping in the damping matrix, both frequency-dependent, and K is the total stiffness matrix. In this case, the equation of motion in the frequency domain cannot be directly translated into the time-domain equation due to the constant amplitude external force ( F ( t ) ) . Consequently, the equation of motion can be defined as follows by using a convolution integral form [48]:
{ M s + A } X ¨ ( t ) + c X ˙ ( t ) + K X ( t ) + 0 t R ( t τ ) X ˙ ( τ ) d τ = F ( t ) ,
where A , R, c , and K are additional mass in the mass matrix at the infinite frequency, the matrix of velocity impulse function, the damping matrix, and the total stiffness matrix, respectively.
Furthermore, the following is possible when using the acceleration impulse function matrix in the equation of motion:
{ M s + A } X ¨ ( t ) + c X ˙ ( t ) + K X ( t ) + 0 t h ( t τ ) X ¨ ( τ ) d τ = F ( t ) .
It is possible to ascertain the acceleration impulse function matrix as
h ( t ) = 2 π 0 B ( ω ) sin ( ω t ) ω d ω = 2 π 0 { A ( ω ) A } cos ( ω t ) d ω ,
where B ( ω ) is the hydrodynamics damping matrix and A ( ω ) is the added mass matrix.
The motion equation is found by substituting the first- and second-order wave loads into Equation (19).
{ m + A } X ¨ ( t ) = F ( 1 ) ( t ) + F ( 2 ) ( t ) + F t ( t ) c X ˙ ( t ) K X ( t ) 0 t h ( t τ ) X ¨ ( τ ) d τ ,
where F t ( t ) is the mooring and articulation force, F ( 1 ) ( t ˙ ) is the first-order wave excitation force and moment; and F ( 2 ) ( t ) is the second-order wave excitation force. K is the total stiffness matrix, which also includes the linear hydrostatics and mooring stiffness.
The motion of a floating structure caused by hydrodynamic wave force in the six degrees of freedom (surge, sway, heave, roll, pitch, and yaw) is known as the response amplitude operator (RAO). On a marine floating structure, RAOs are used as input data for calculations that find the displacements, accelerations, and velocities at any given location. RAO is often determined by taking the ratio of the FBW’s response amplitude X i to the wave amplitude A i for linear motion, and for rotational motion, the ratio of the FBW’s response amplitude to the wave slope α i , which can be described as follows:
RAO = X j A i , where X j = u j ,   ( j = 1 , 2 , 3 ) , RAO = X j α i , where X j = θ j 3 ,   ( j = 4 , 5 , 6 ) .
where α i is the wave slope, A i is the wave amplitude, and X i is the response amplitude of FBW in rotational ( θ i 3 ) and displacement ( u i ) mode.
ANSYS-AQWA analyzes linear algebraic equations to ascertain the body’s harmonic response to regular waves. These amplitude-dependent response characteristics are called relative amplitudes (RAOs).

2.1.3. Mooring System

Numerous elements, including the impacts of cable mass, drag forces, inline elastic tension, and bending moment, must be considered to assess the dynamics of the cable motion. In general, cables act nonlinearly, and the forces applied to them change with time. Cable dynamics simulation is required to discretize the cable along its length and combine the mass and applied forces. As seen in Figure 4, each mooring line is discretized as a sequence of Morison-type elements sensitive to different external forces.
The following are the general equations for the force and moment operating on the cable:
T s e + V s e + w + F h = m 2 R t 2 , M s e + R s e × V = q ,
where V represents the shear force vector at the element’s first node, T represents the tensile force vector at the first node, M represents the bending moment vector at the first node of the element, and R is the position vector of the cable element’s first node. The external hydrodynamic loading vectors are represented by F k ; the distributed moment loading is represented by q ; the structural mass is represented by m; the element weight is defined by w ; the element’s diameter is represented by D e ; and the element’s length is represented by Δ s ε . The following definitions of the cable material’s axial and bending stiffness are related to the bending moment and tension:
M = EI R s e × 2 R s e 2 , T = EA E ,
where M represents cable bending moment, EA represents cable axial stiffness, T represents cable tension, ε is the axial strain of the element, and EI represents cable bending stiffness.

2.1.4. Wave Transmission and Reflection Coefficients

The wave travels through the structure due to the radiation-wave energy transfer from the FBW. As seen in Figure 3, there are three ways that this energy is transferred: by the waves moving over the structure, under the structure, and by the waves created by the motion of the structure.
The purpose of FBWs is to lessen wave transmission. As mentioned in the Introduction and as seen in Figure 4, the wave-transmission coefficient is the main and most important factor in deciding how well FBWs work. According to a straight line, the FBW’s total wave energy per unit length equals the square of the wave height [49].
H i 2 = H r 2 + H t 2 ,
where H i represents the wave height of the incident,   H t represents the height of the reflected wave, and H t is the height of the transmitted wave. C t = ( H t / H j ) is the transmission coefficient, and C r = ( H r / H i ) is the reflection coefficient. Therefore, we can create the following equation by changing the defined values in Equation (26):
C t 2 + C r 2 = 1 .
Since viscous dissipation occurs in the actual scenario, Equation (26) can be expressed as
C t 2 + C r 2 + C d 2 = 1 ,
where C d is the dissipation coefficient caused by viscous phenomena and the following energy losses, including wave breaking, friction, and vortex shedding.
The ANSYS-AQWA AQWA-GS module was utilized to compute the wave-transmission coefficient in this work. This module displays the computation results in several ways. The wave amplitude can be calculated at various domain locations after applying a wave load with predetermined characteristics. The wave-transmission coefficient is then determined by dividing the incident wave’s amplitude by the wave’s amplitude behind the rear front beam wave.
C t = A t A i = H t H i .
where A t represents the amplitude of the transmitted wave, A i represents the incident wave amplitude, H t represents the height of the transmitted wave, and H i represents the height of the incident wave.

3. Case Study

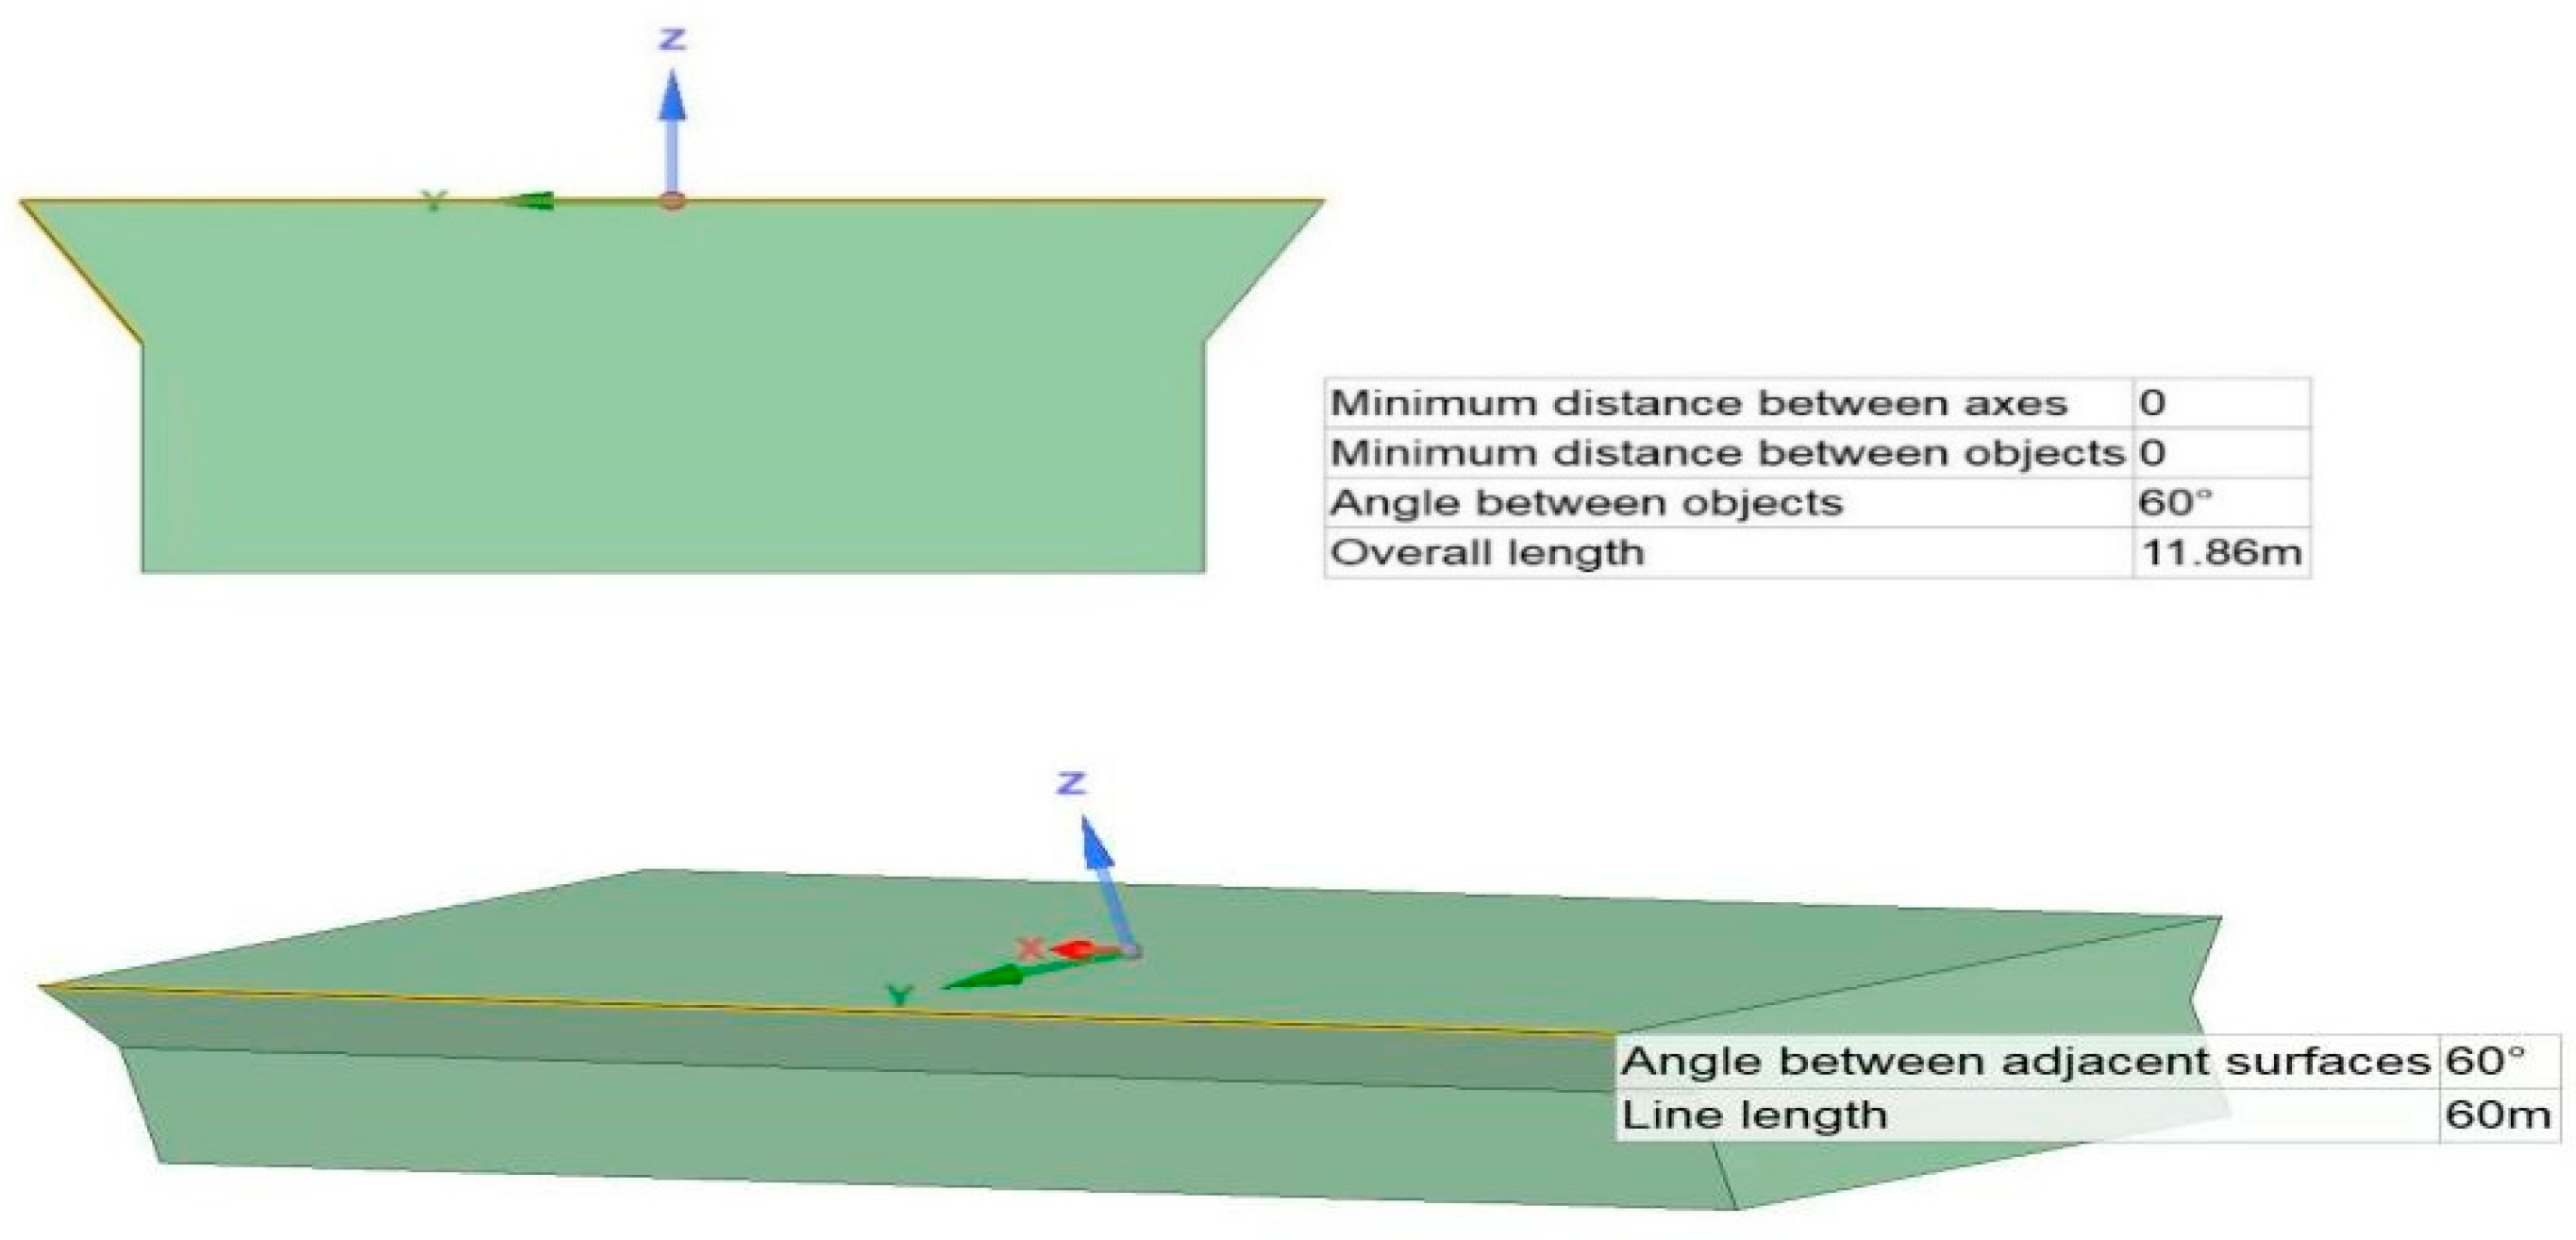
As seen in Figure 5, the influence of factors such as the vanes on the wave-dissipating performance of the breakwater was investigated. Numerical simulation calculations of buoyancy were carried out by changing the number of parts under the influence of regular waves.
The coefficient calculation determines the influence of various factors on the permeability coefficient of perforated floating breakwaters and provides an optimal specification method. See Table 1 for the main dimensions of the buoy.
In Figure 6, a single-part model of a floating breakwater is presented. Also, in Figure 7, a multi-part model for buoys of a floating breakwater is illustrated.

4. Verification of Model

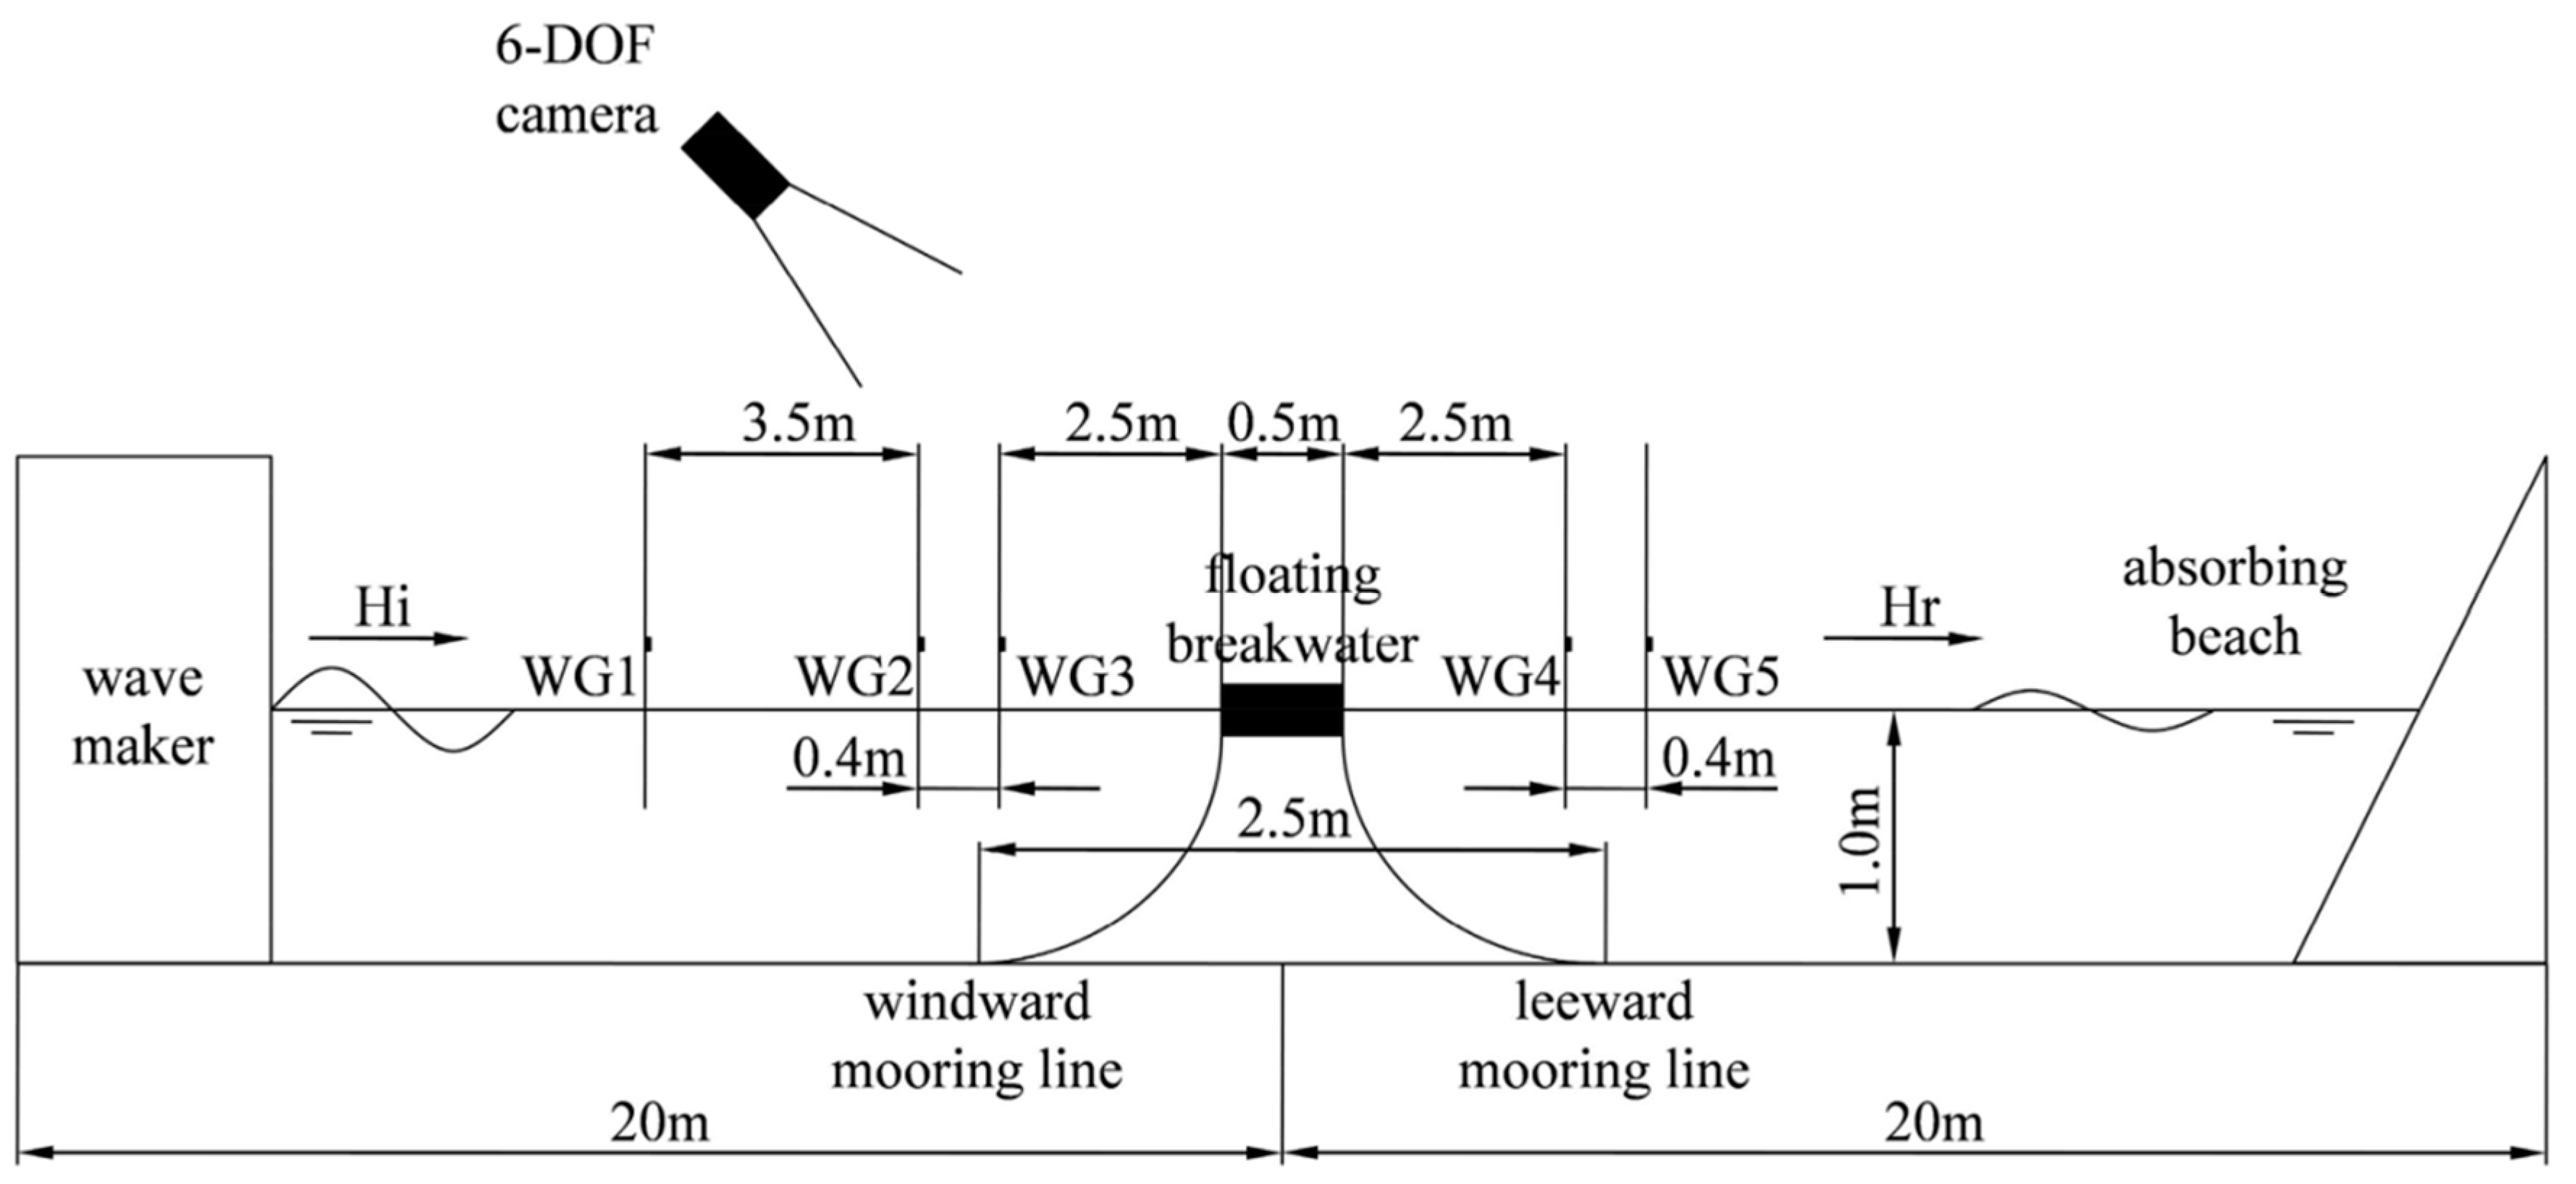
To verify the accuracy of the numerical model, a validation process was conducted by comparing its results to an experimental model, as described in the research conducted by Ji et al. [50]. In their study, Ji et al. examined the performance of single- and double-row breakwaters through various tests, as depicted in Figure 8. The experimental tests were conducted with a wave period of 1.1 s, and wave heights ranging from 0.075 to 0.175 m. The mooring line used in the experiments had a length of 1.6 m and a line density of 0.63 kg/m. In contrast, the numerical model utilized a nonlinear catenary cable for the mooring line simulation. This comparison between the experimental and numerical models allowed for the validation of the numerical model’s precision and accuracy.
As seen in Figure 9, the results of the numerical and experimental analyses are compared. The results of the wave-transmission coefficients (Ct) versus (L/B) and (H/B) are in good agreement with the experimental data. The effect of (H/B) is not significant on Ct, while (L/B) affects Ct.

5. Results and Discussion

5.1. Motion RAO

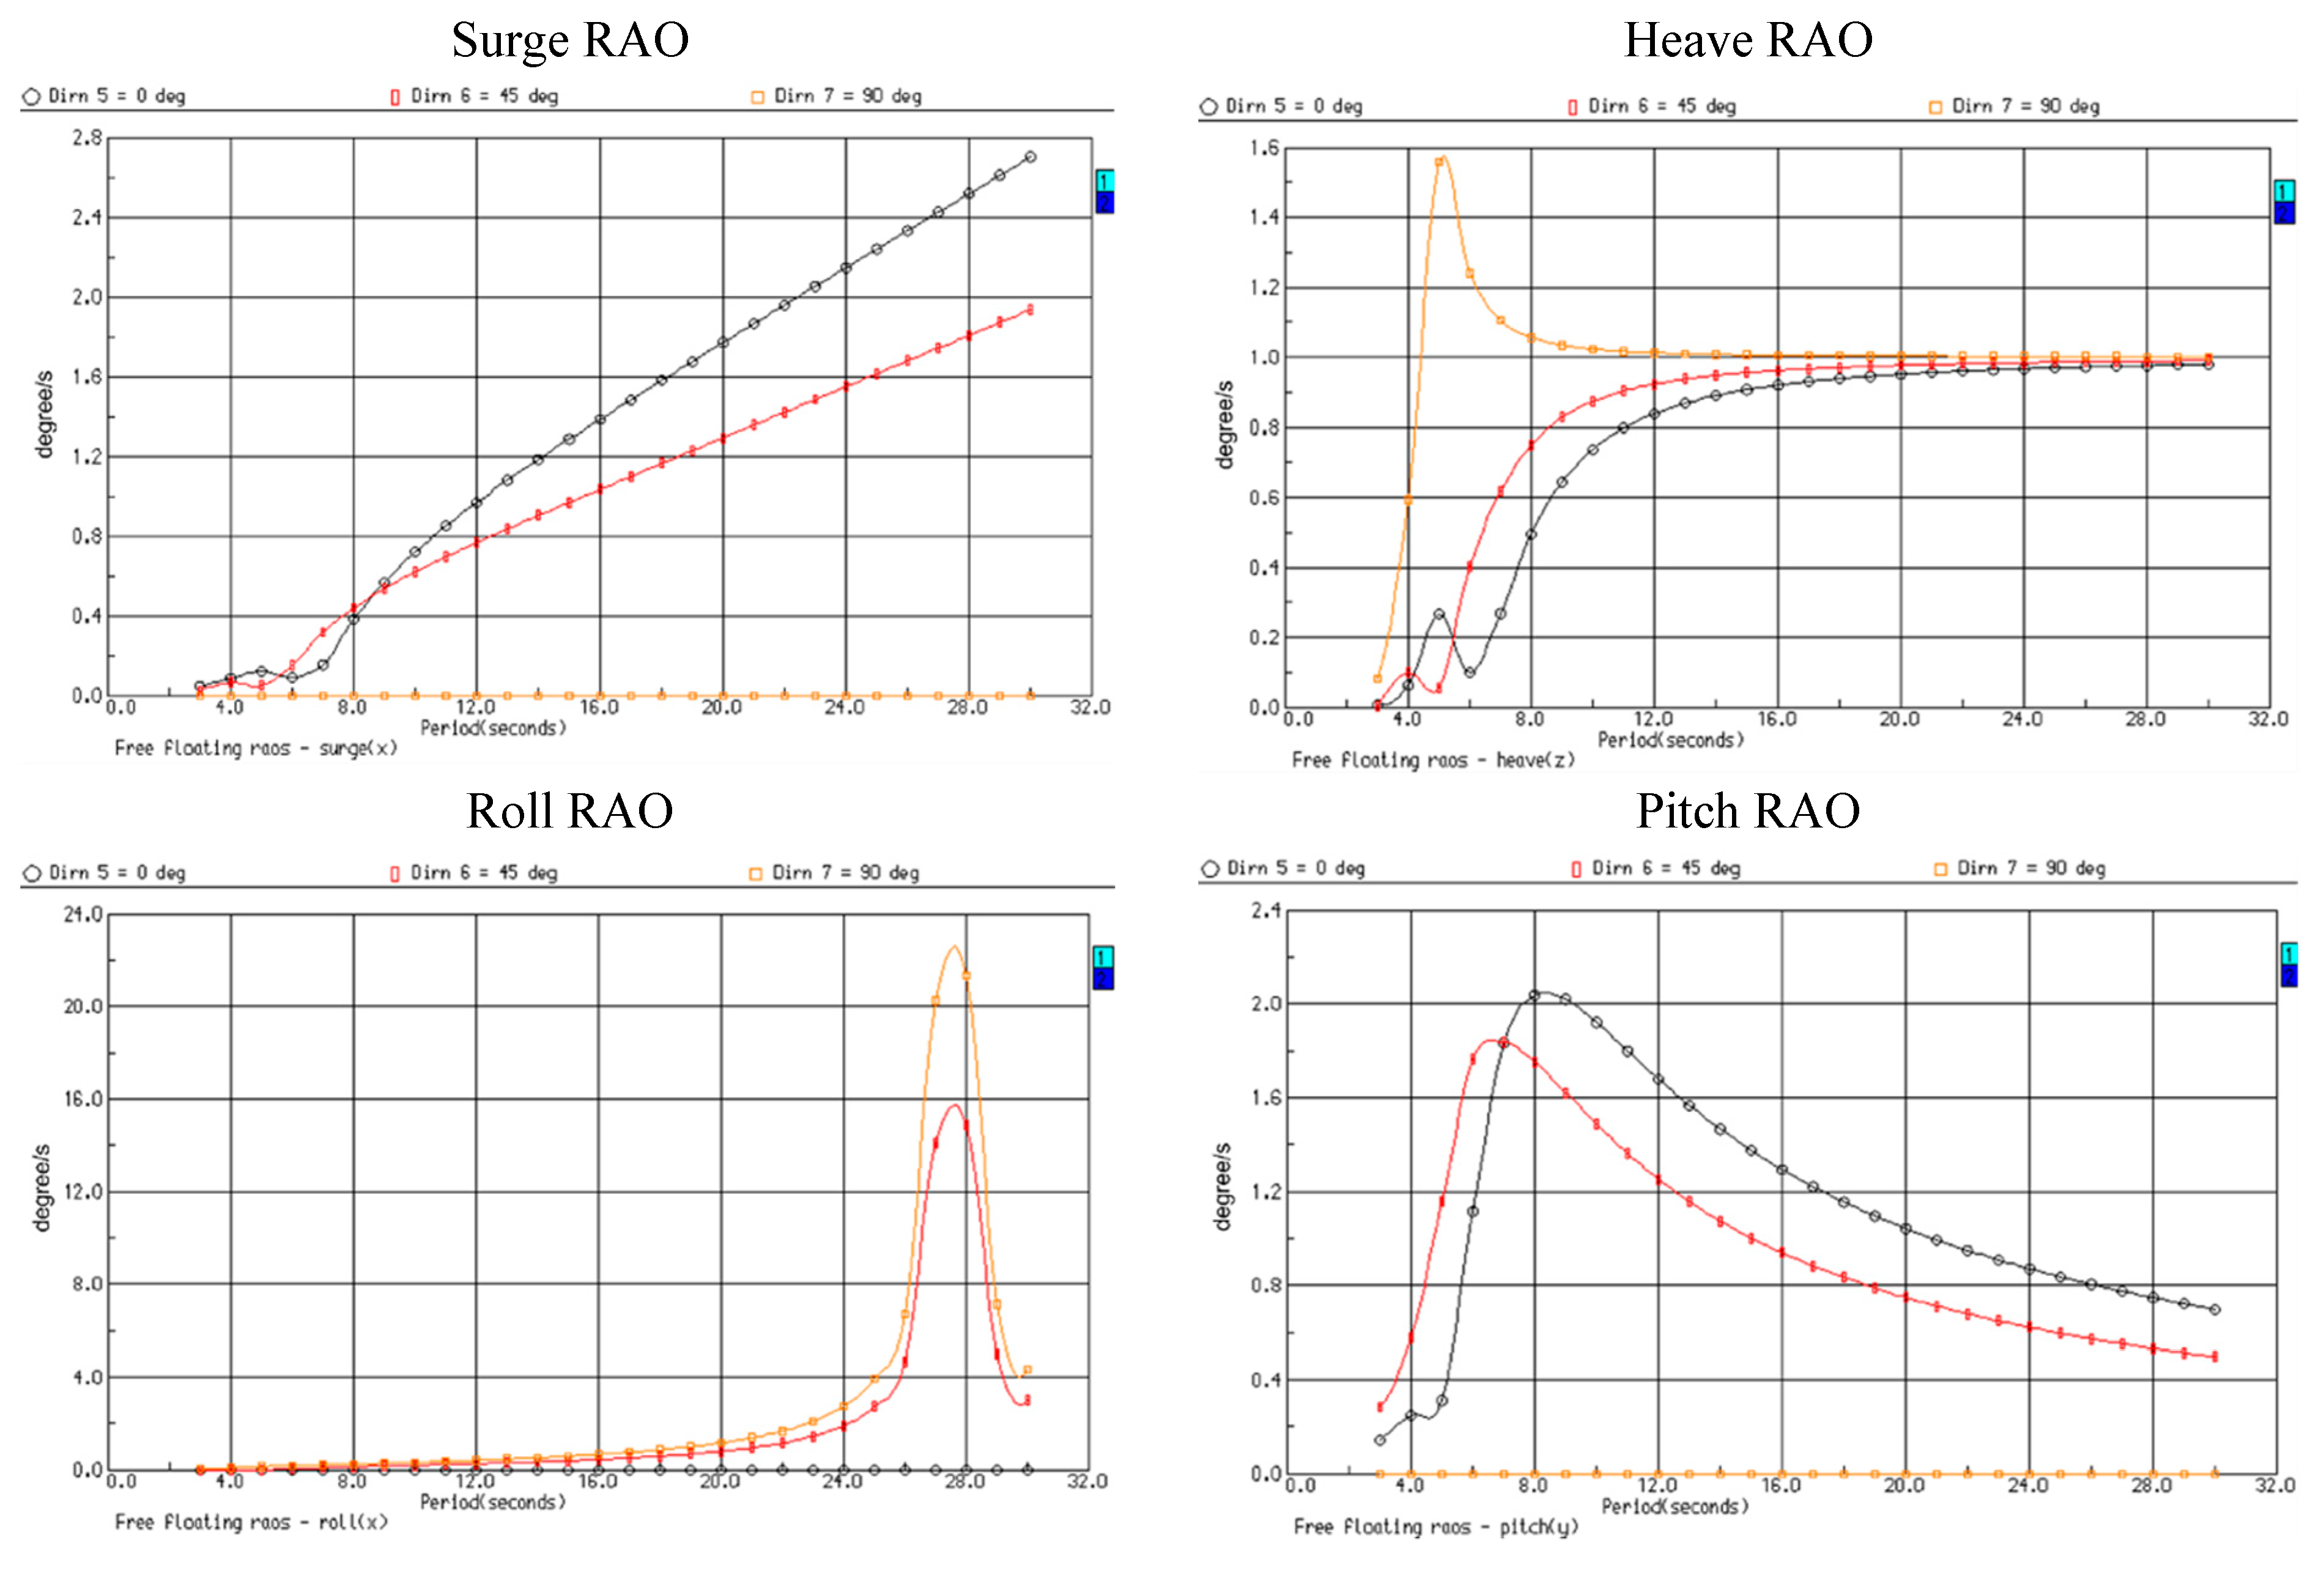
Figure 10 shows the RAO of thrust, heave, roll, and pitch motions in the frequency domain for a single portion of the FBW. The frequency analysis results show that the longer the period, the greater the movement. The one-piece FBW heave and pitch RAO low-wave periods have several significant consequences. The single-part FBW results show that RAO increases significantly over 5 s. During the lifting motion, the RAO increase decreases slightly, but then follows a stable process. During the throwing motion, this increase decreases over 5 s until the desired course is reached. In the wave-transmission analysis, the individual-part FBW results showed a significant increase in wave transmission over 5 s. Additionally, during periods of high waves, the wave penetration is high, which reduces the performance of a single-component His FBW. The reason for the increased wave transmission of the monolithic FBW may be the increased vibration of the FBW. In fact, the wave energy increased due to the movement of the floating breakwater.
If the conditions remain the same for different FBWs, the differences in their shape and displacement can explain the variations observed. The shape and displacement of FBWs affect the inertia term, which includes additional mass and structural mass, in the equations of motion governing the behavior of FBWs. Based on frequency-domain analysis, it was found that the FBW equipped with wing plates exhibited a stable response across all examined movements and wave periods. This indicates that the presence of wing plates contributes to the stability of the FBW. In contrast, the monolithic FBW demonstrated increased wave transmission, which could be attributed to the amplified vibrations observed in Figure 10. These vibrations may lead to a less effective wave-energy dissipation mechanism, resulting in higher wave transmission through the breakwater.
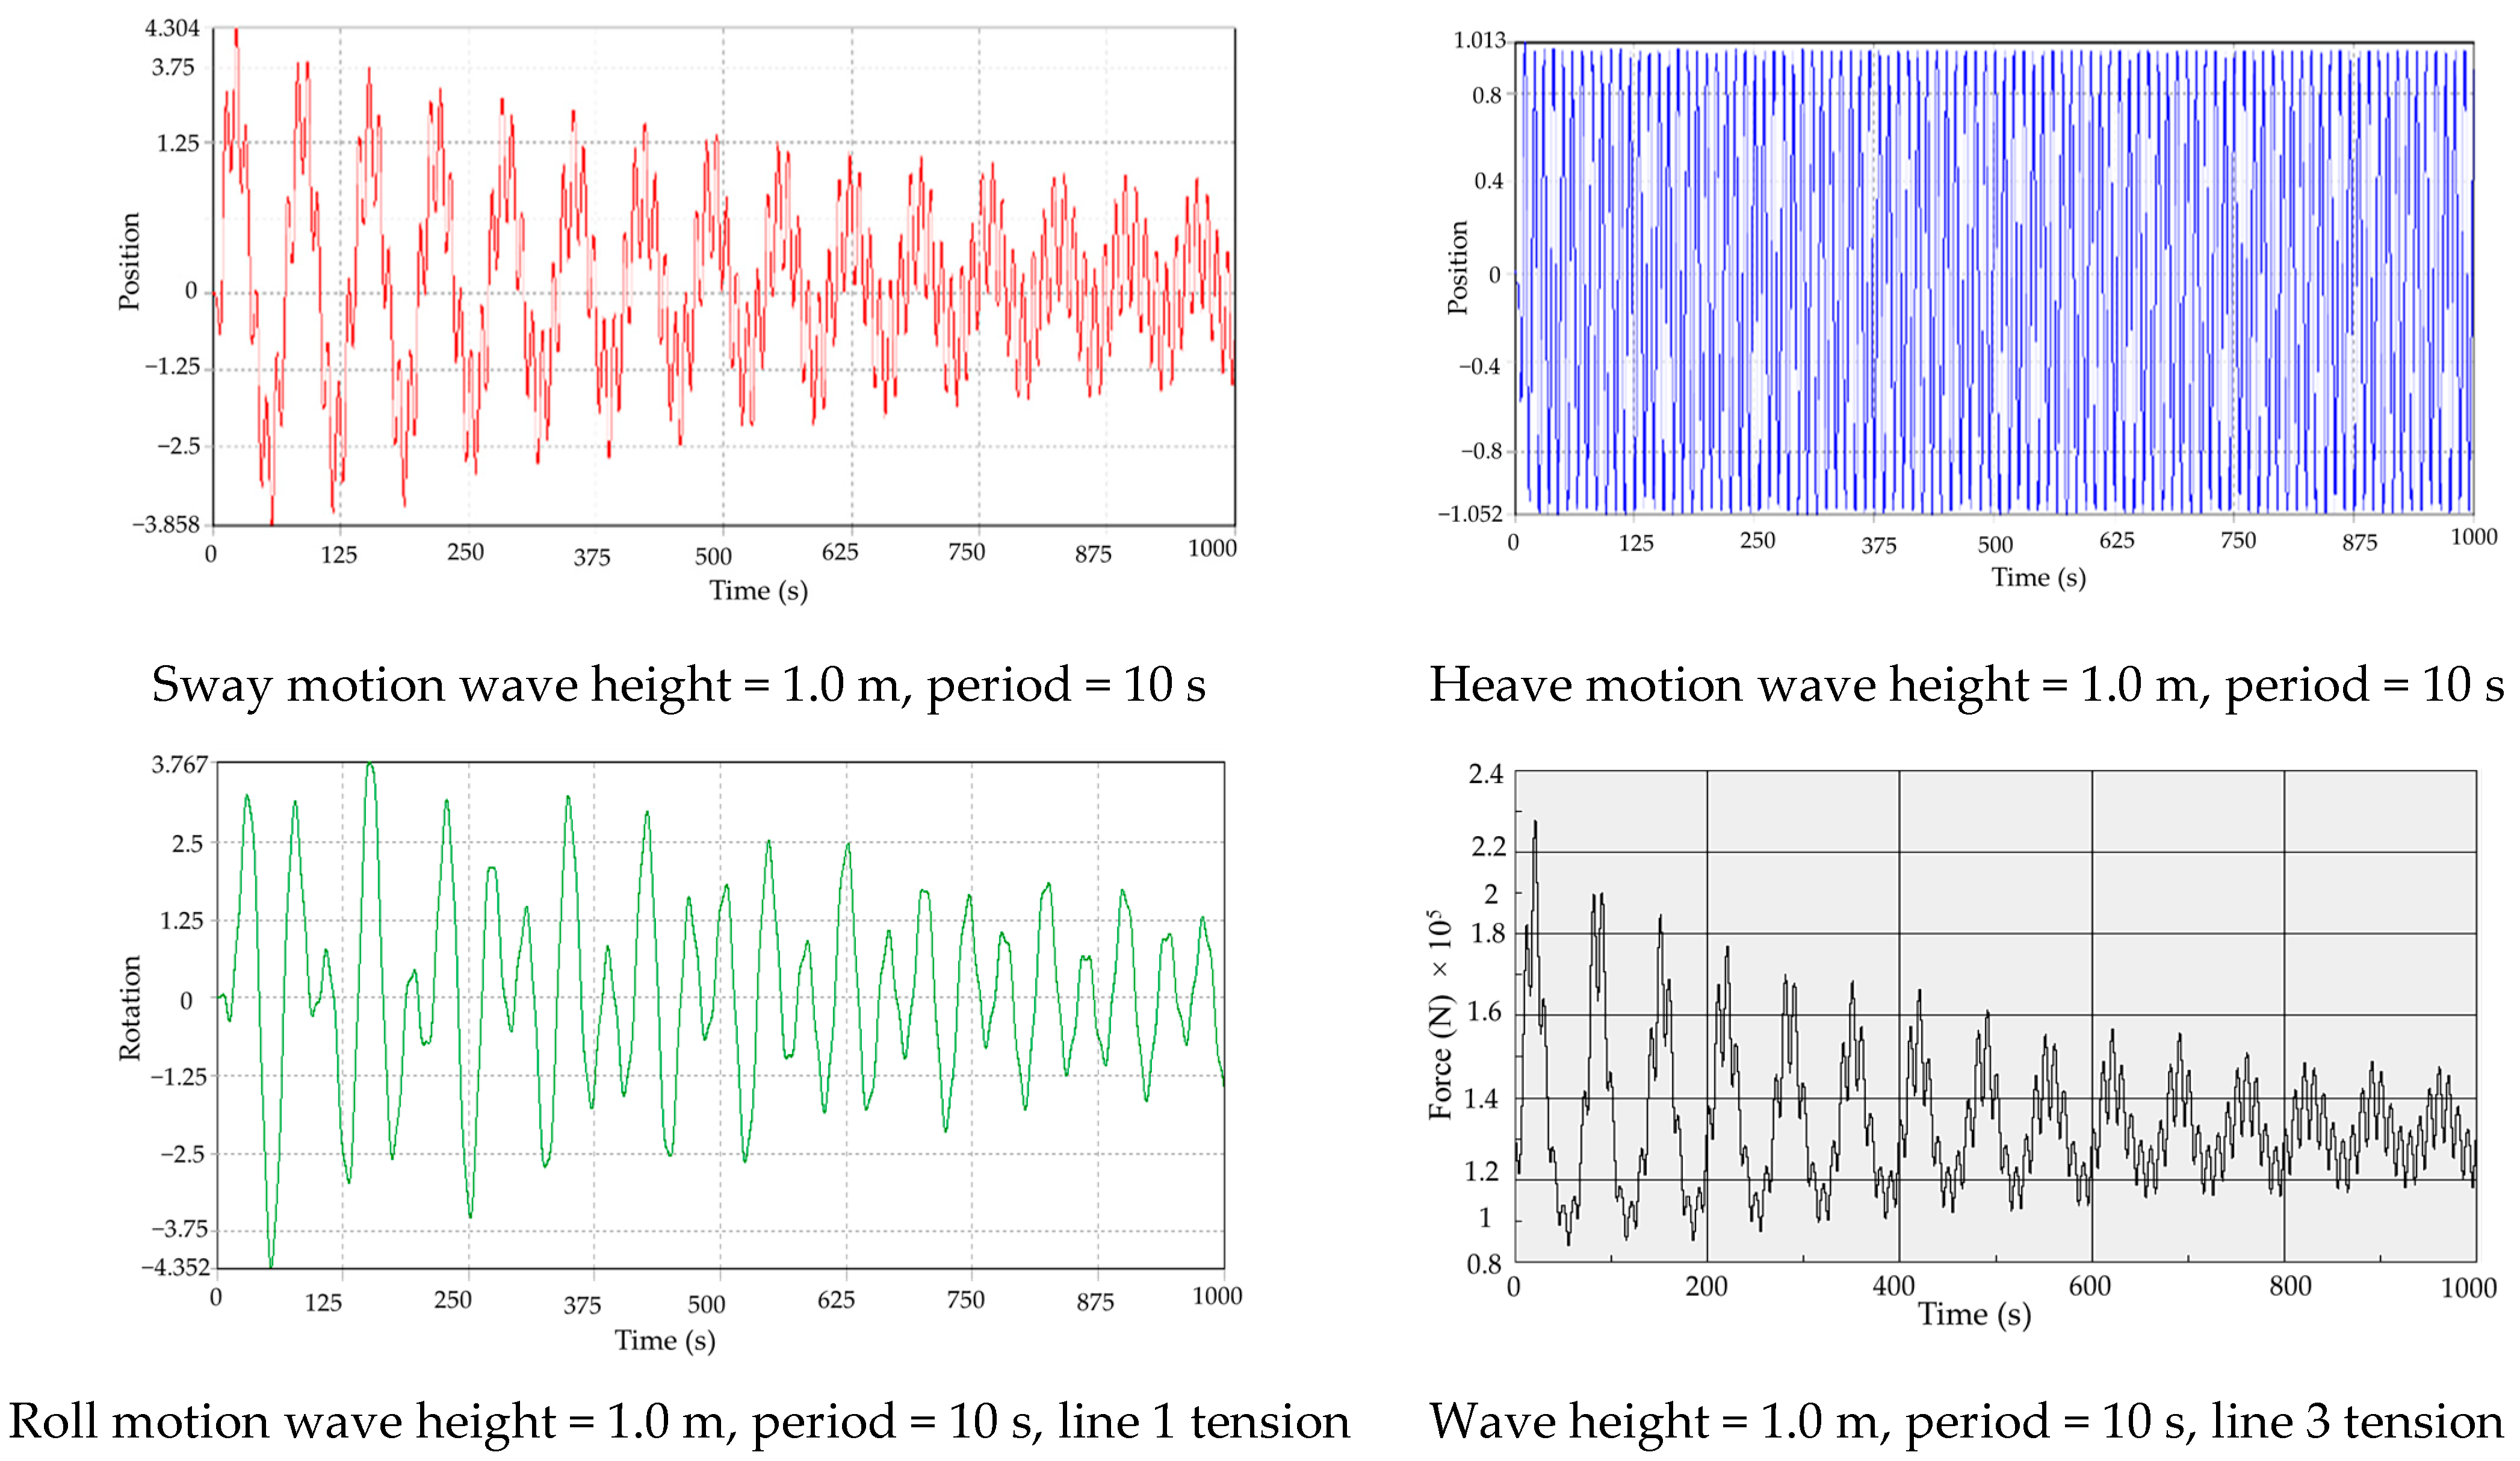
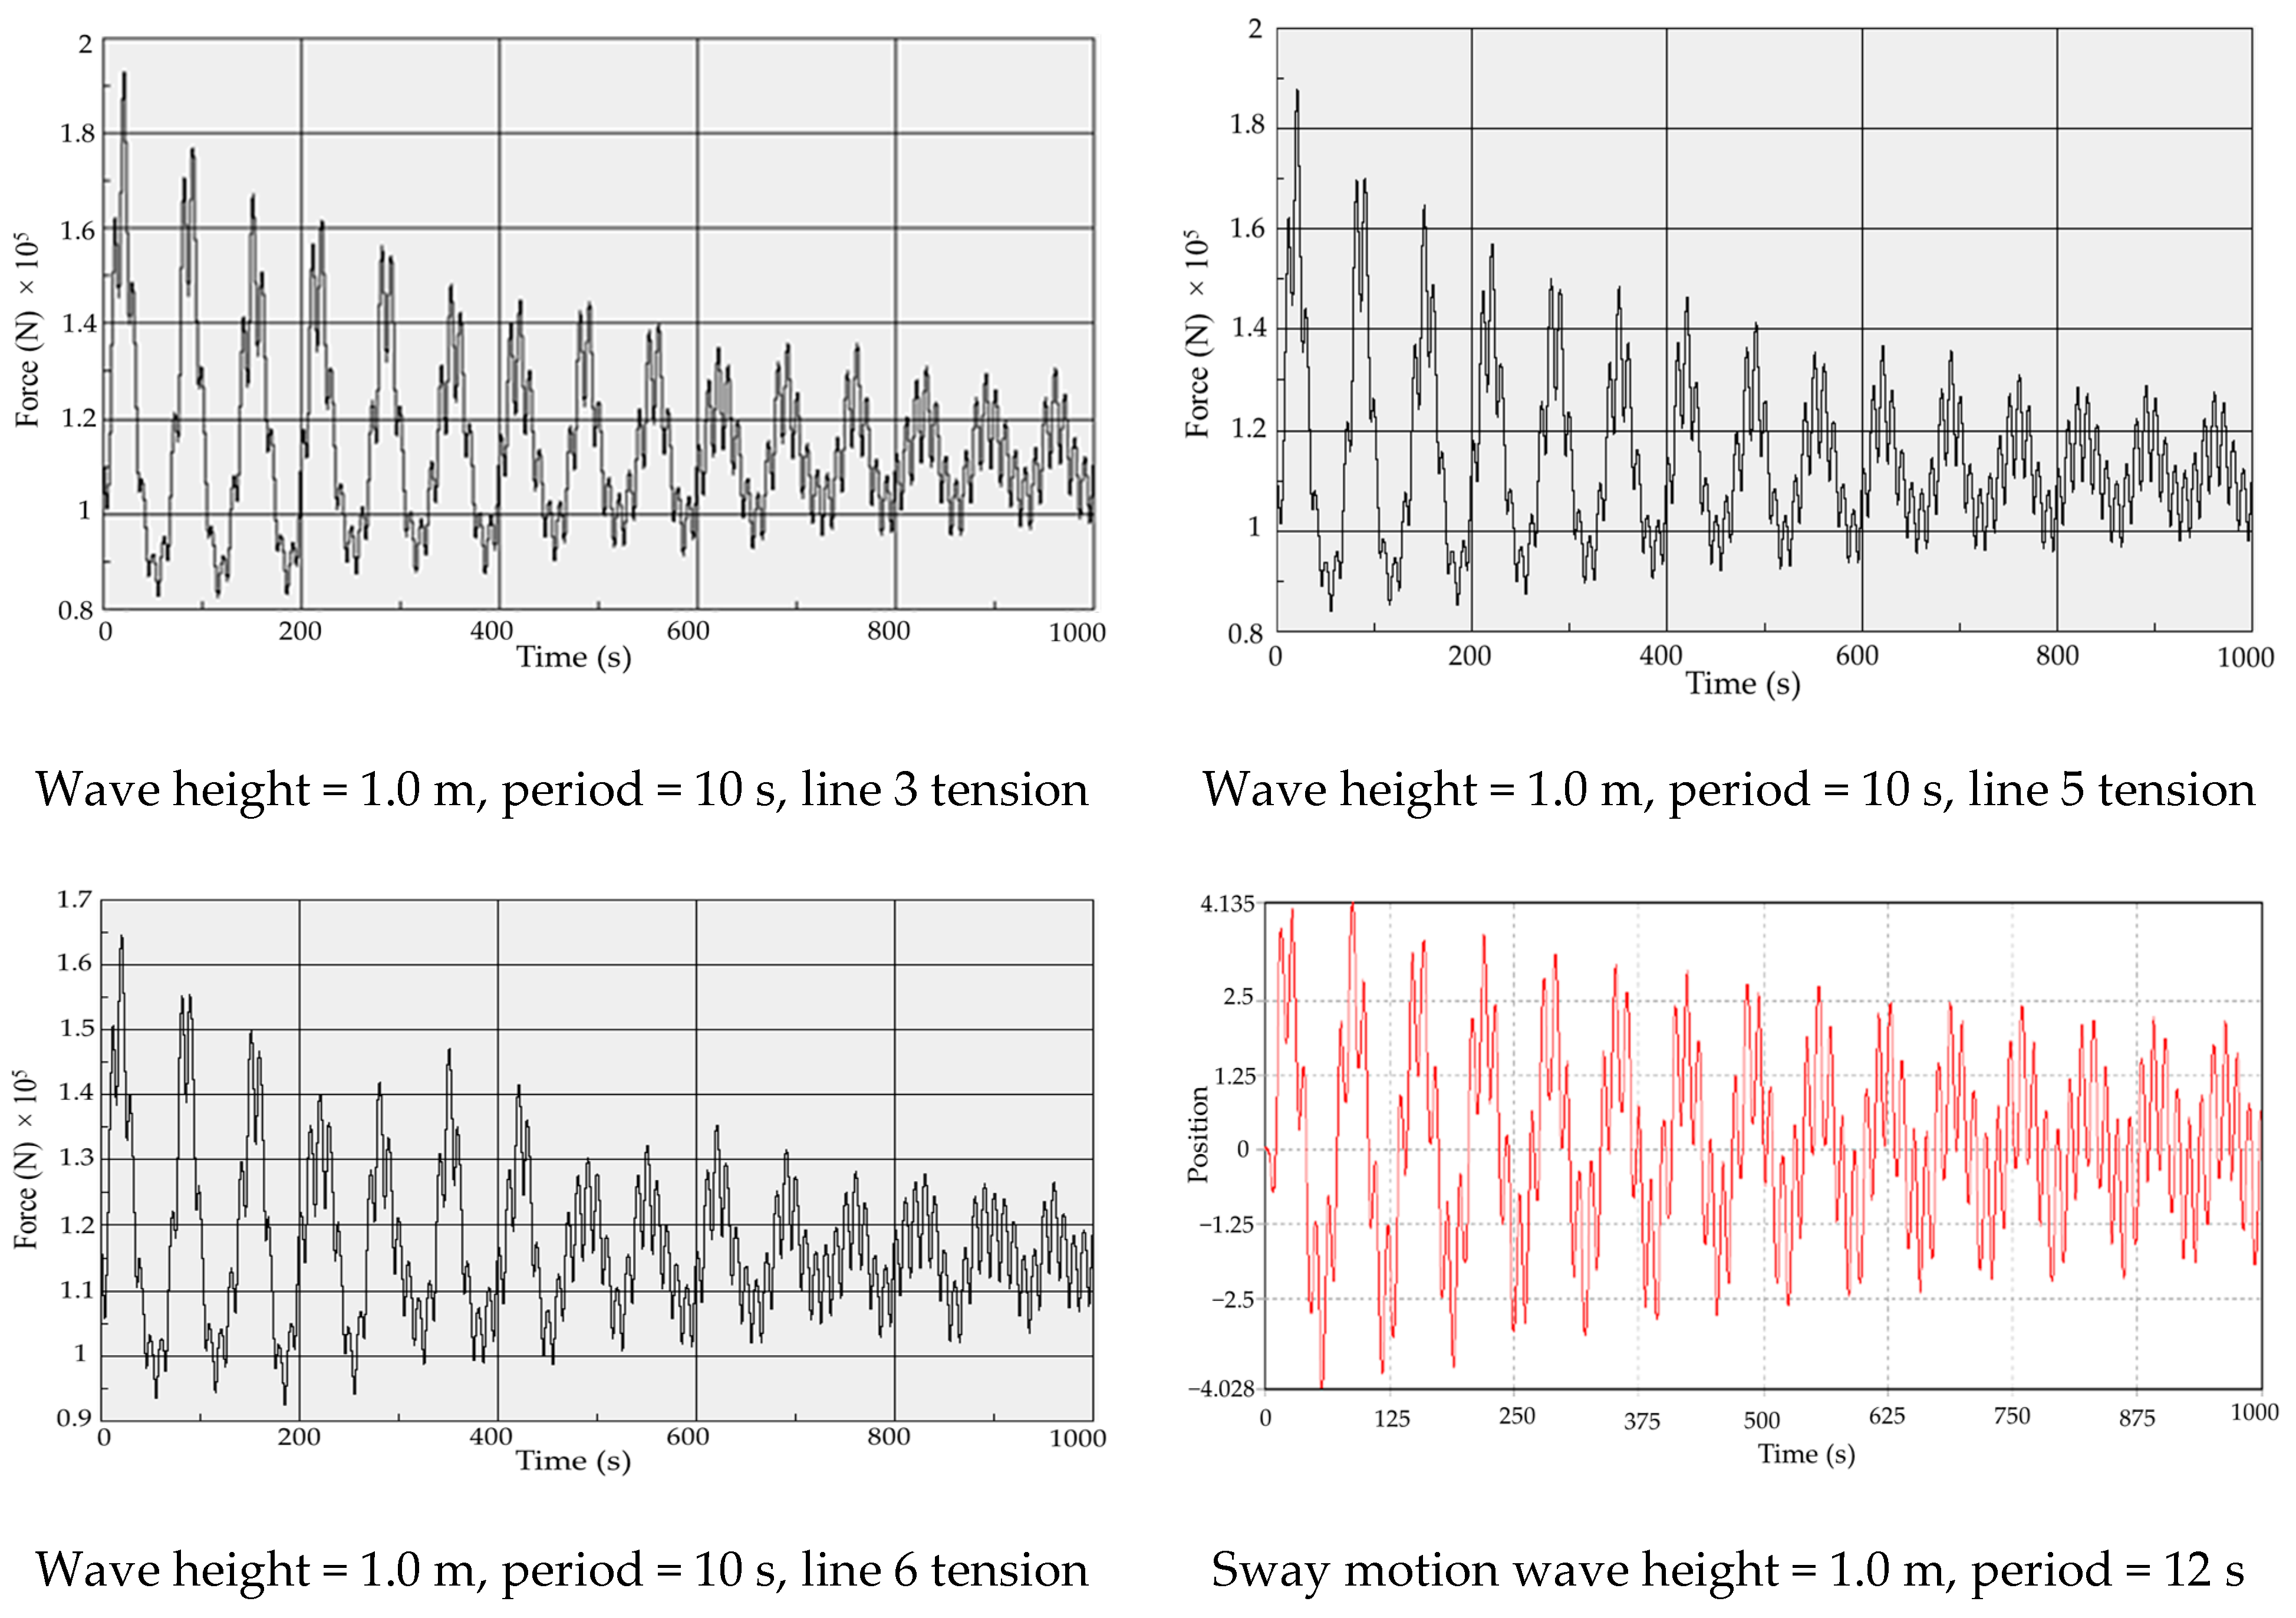
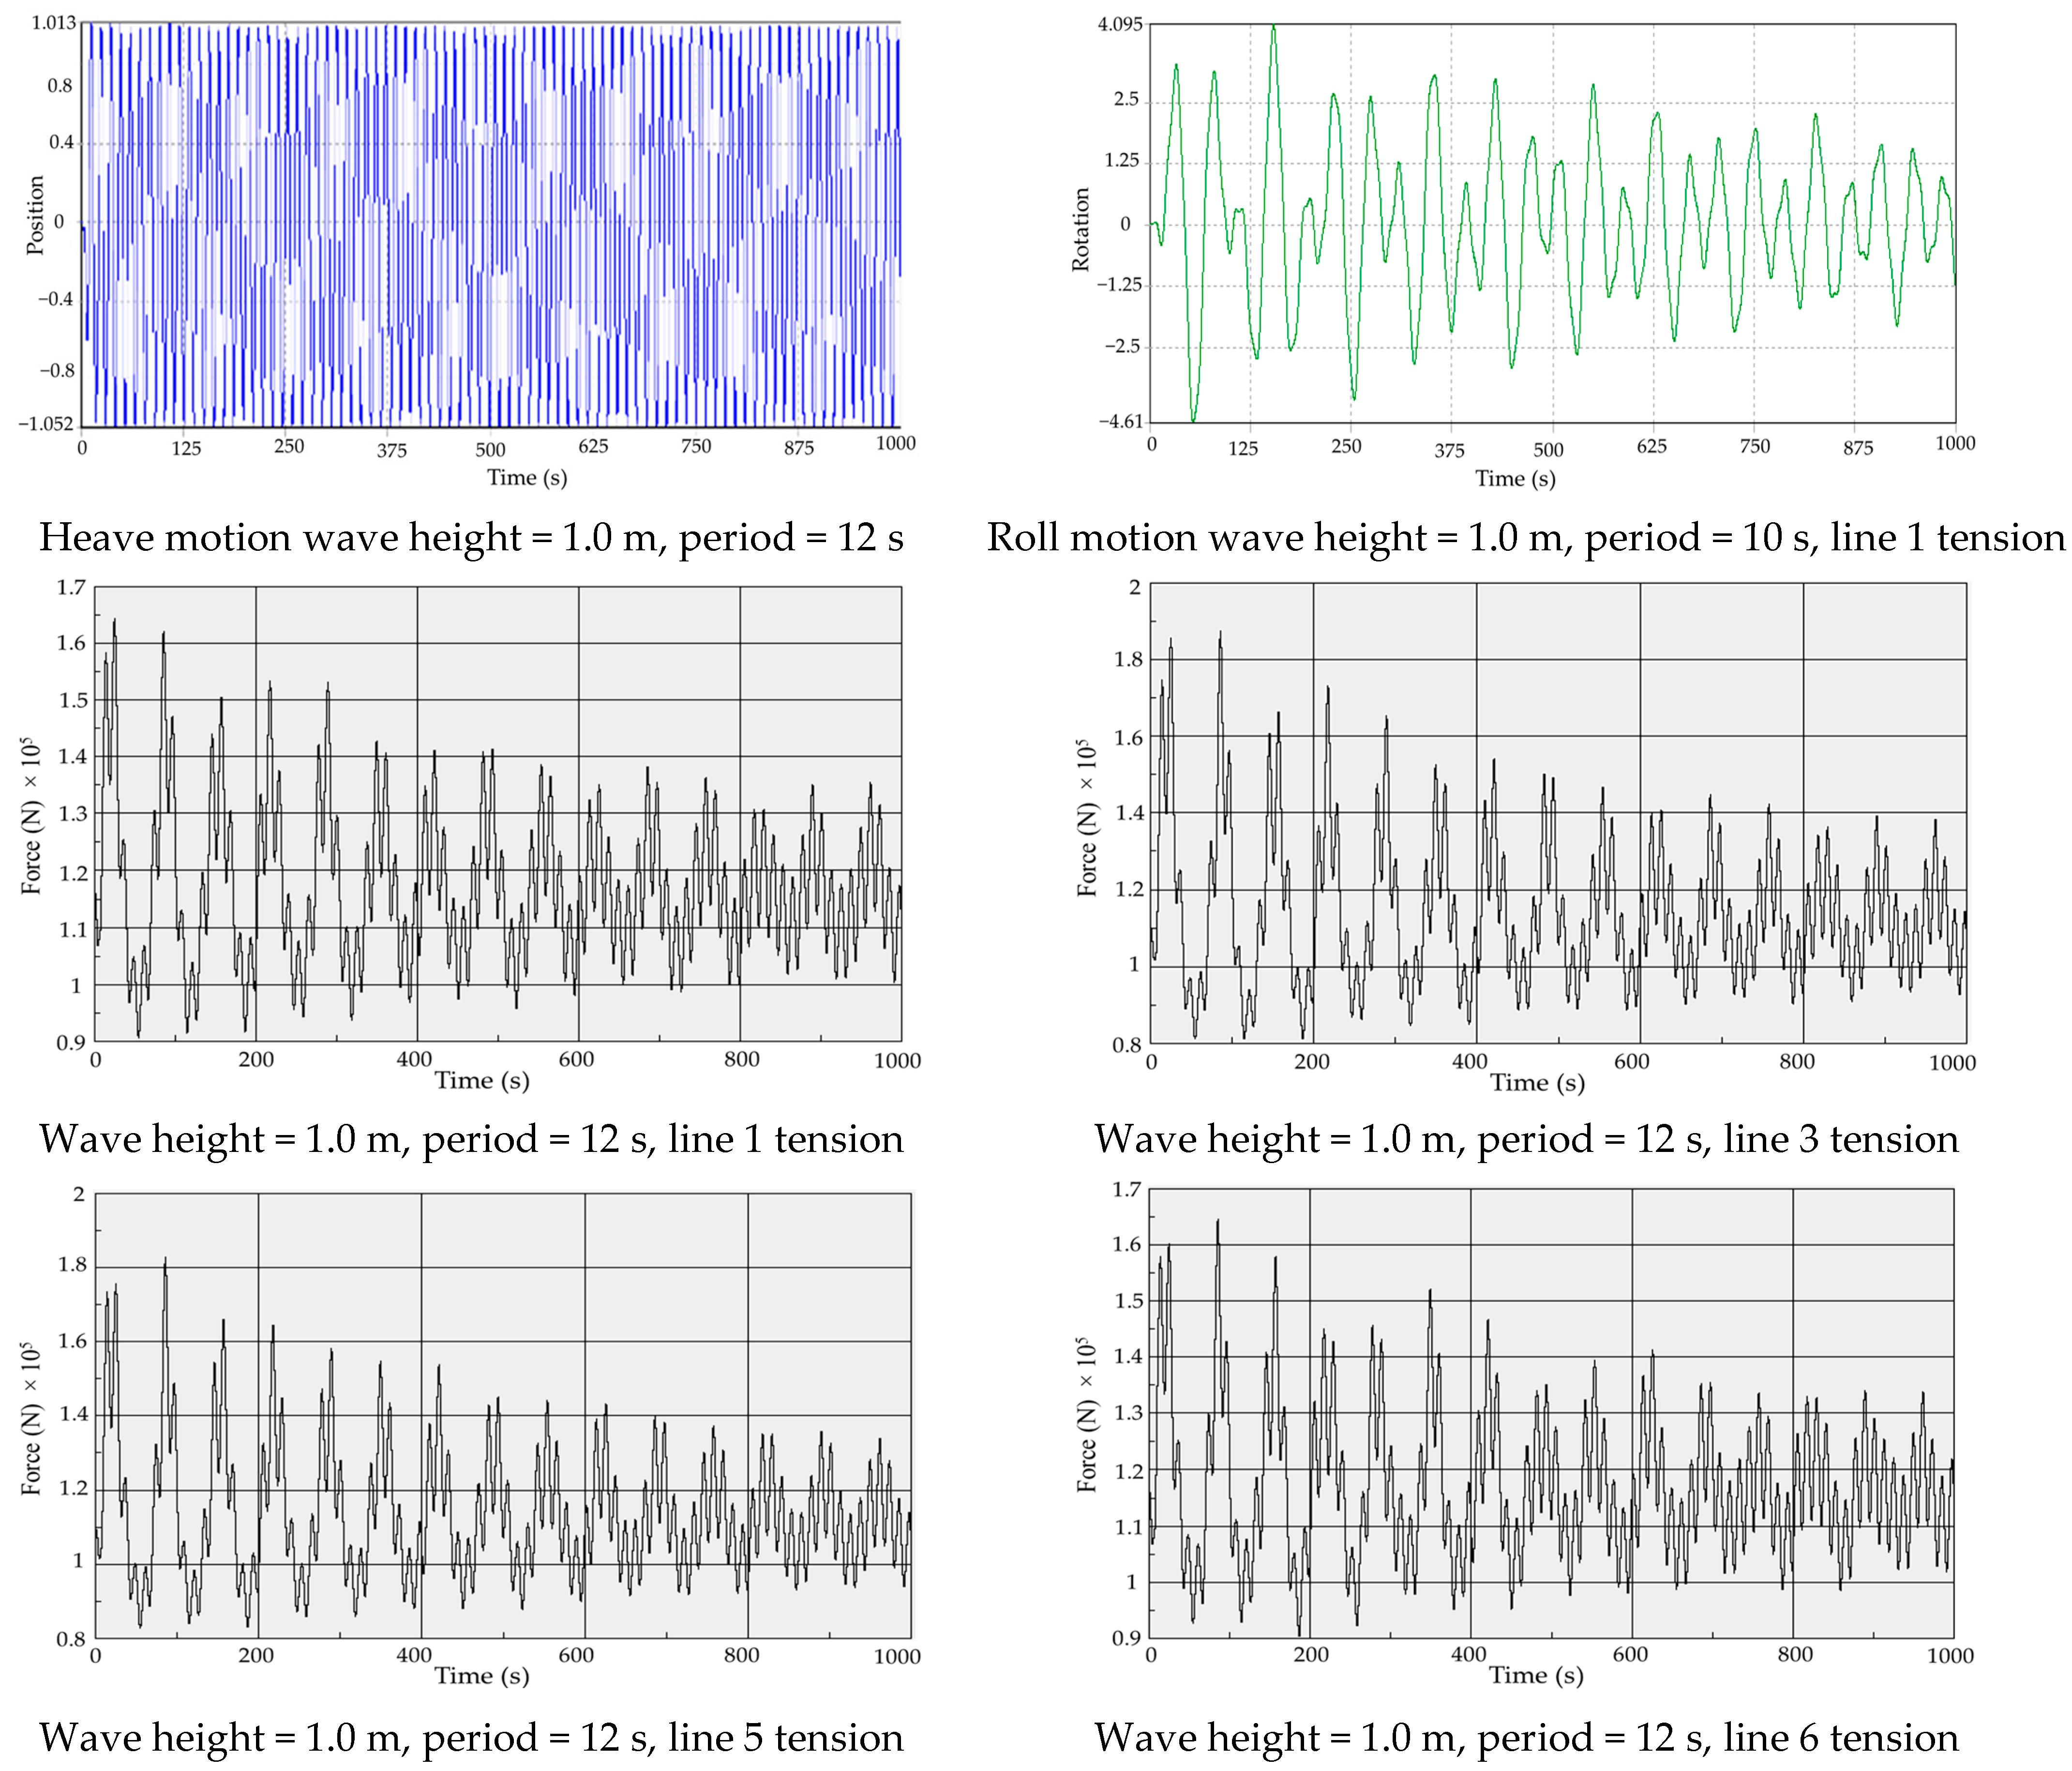
Figure 11 and Figure 12 show the RAO (surge, heave, and pitch) timing of the airfoil FBW in two periods of 10 and 12 s. The simulation runs for 100 s with steps of 0.001 s. The height of the incident wave is 1 m, and the influence of shape and composition ratio on the FBW response is shown and discussed in the time domain. The results show that the FBW has larger amplitude than the simple FBW without a wing plate in all three motion responses for 10 s. Irregular movements are observed every 12 s, probably due to instability. Based on both the frequency-domain and the time-domain results, the airfoil-type FBW has a lower amplitude (RAO) and a more efficient and stable response at all periods, as seen in Figure 13.

5.2. Transmission Coefficients

As mentioned in the Introduction, the wave transmission coefficient (Ct) is an important parameter for the hydrodynamic performance of FBWs. The lower the Ct value, the better the performance.
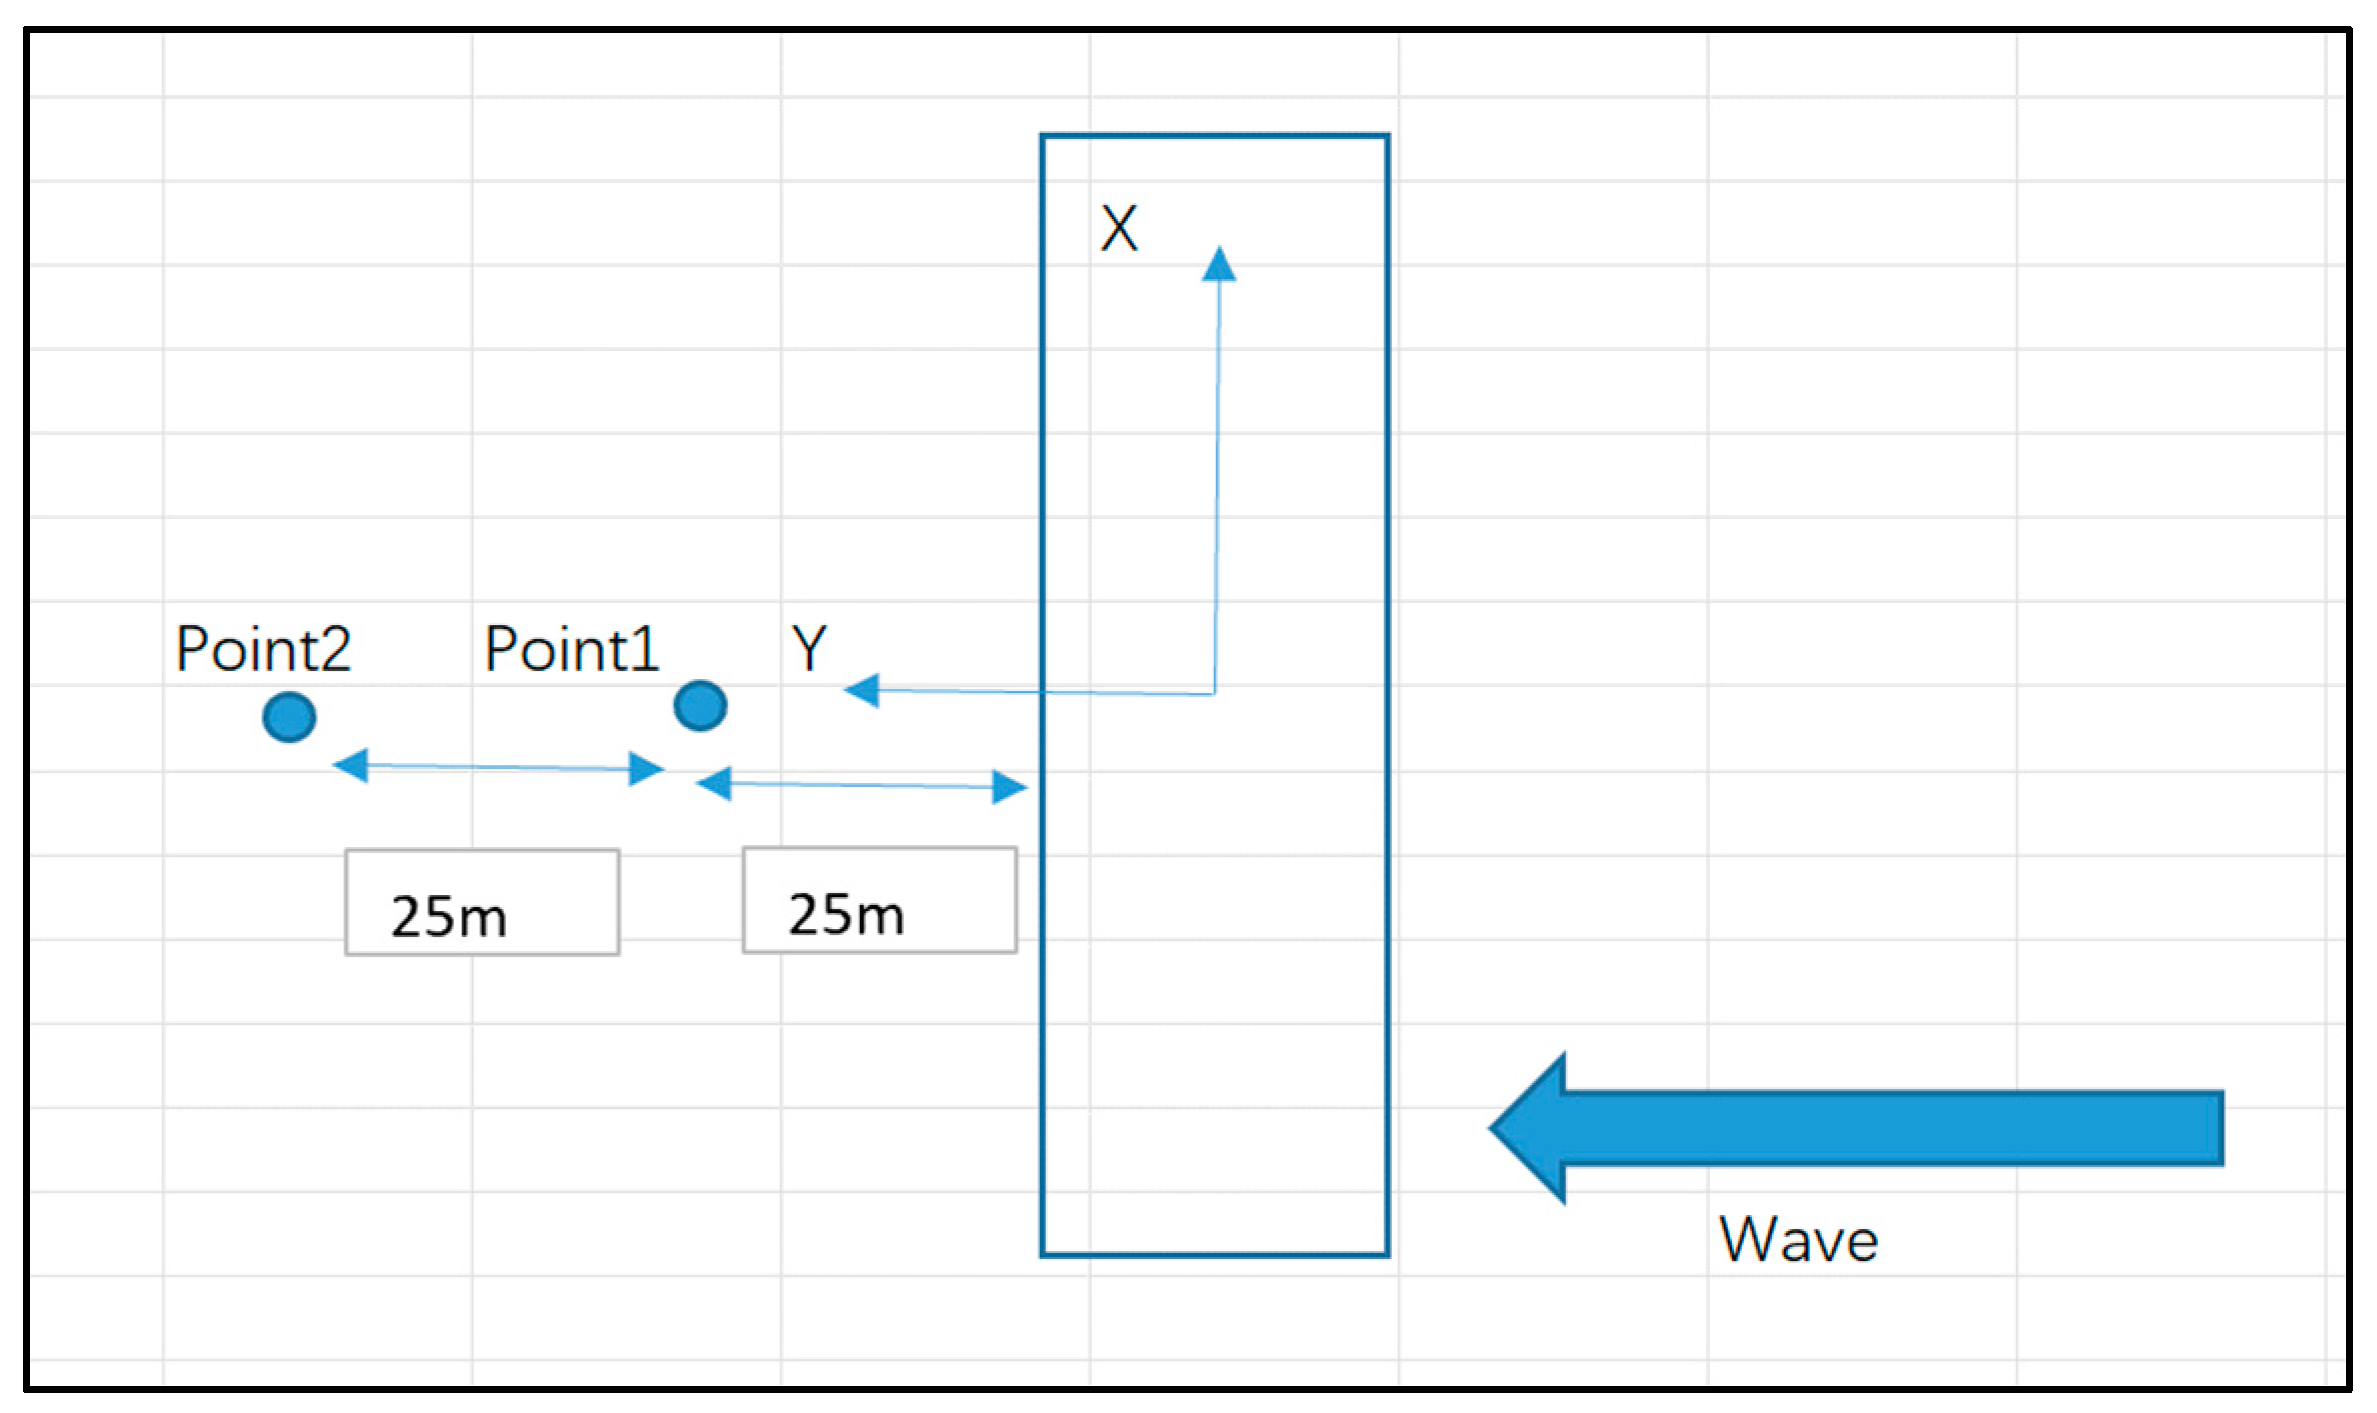
A lot of research has been conducted on this FBW during the low vibration period. Due to the increase in wave period, the FBW output suddenly decreases. This section examines the effect of additional wing plates on the FBW on the peak phase performance. The locations of the two observation points are shown in Figure 14.
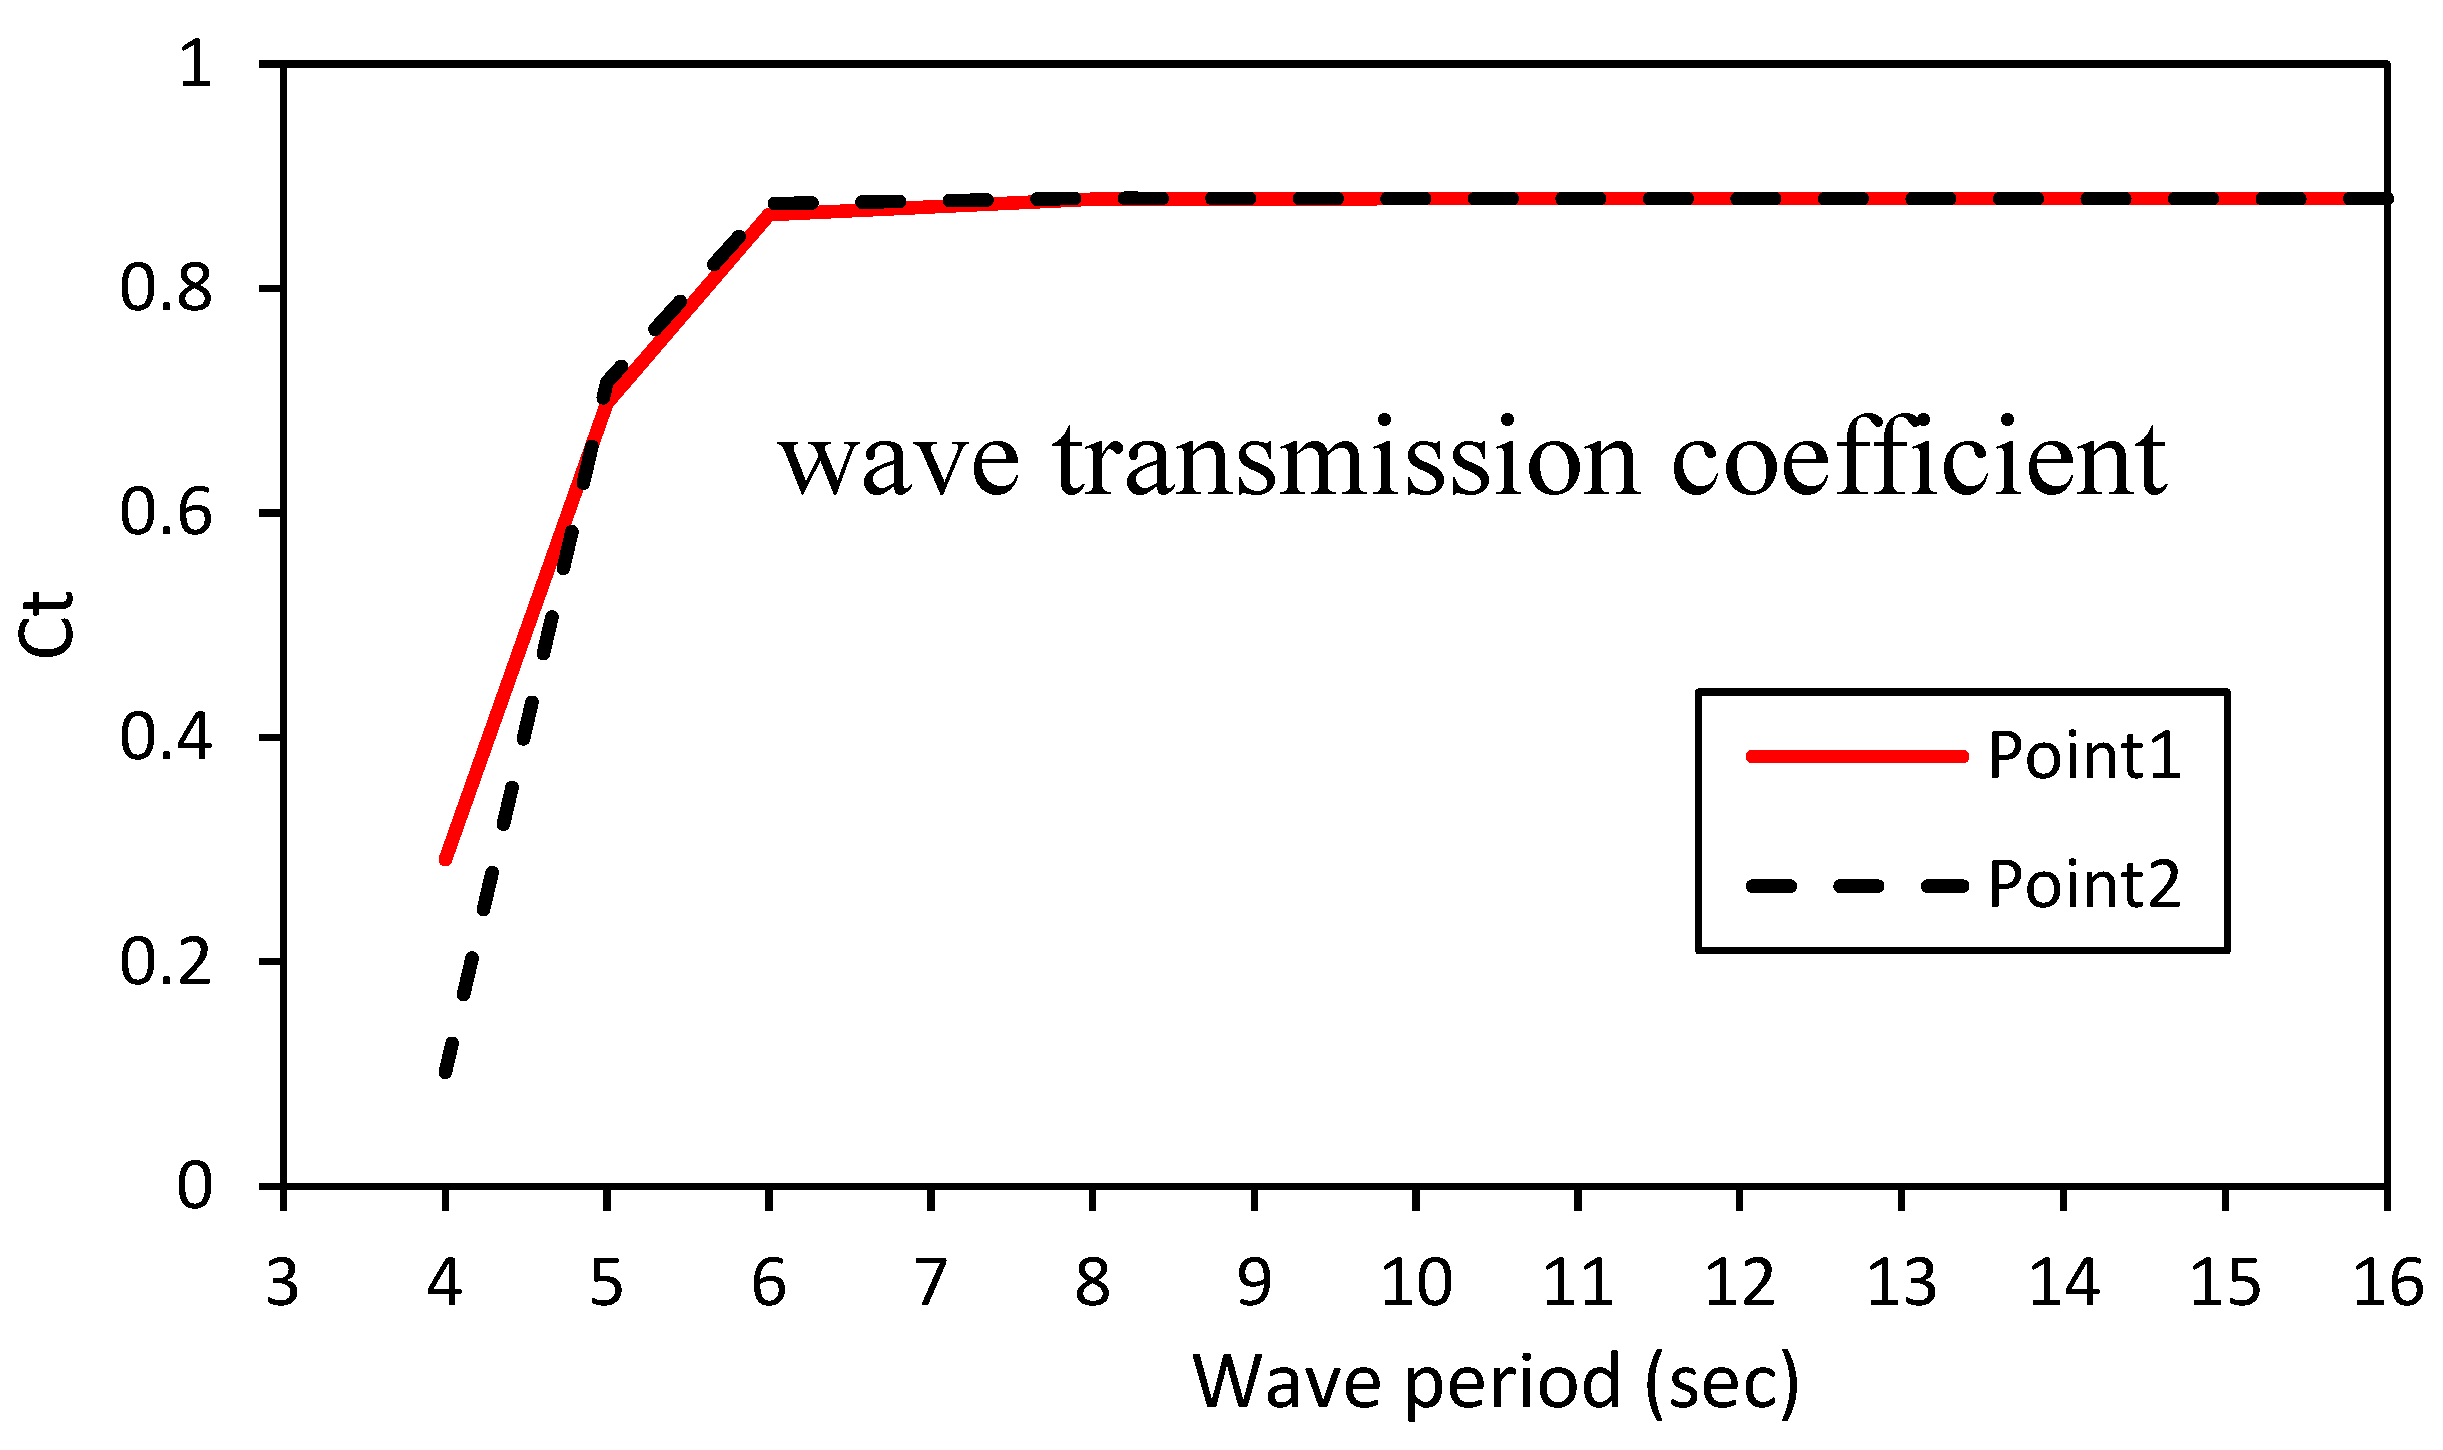
The values of the wave-transmission coefficients for all models in the period 4–16 s are shown in Figure 15. This figure compares the Ct values of two control points at different wave periods. This result shows that wave height has little effect on the Ct results. The FBW wing plate can be used with wave periods up to 6 s but will not work with higher periods.
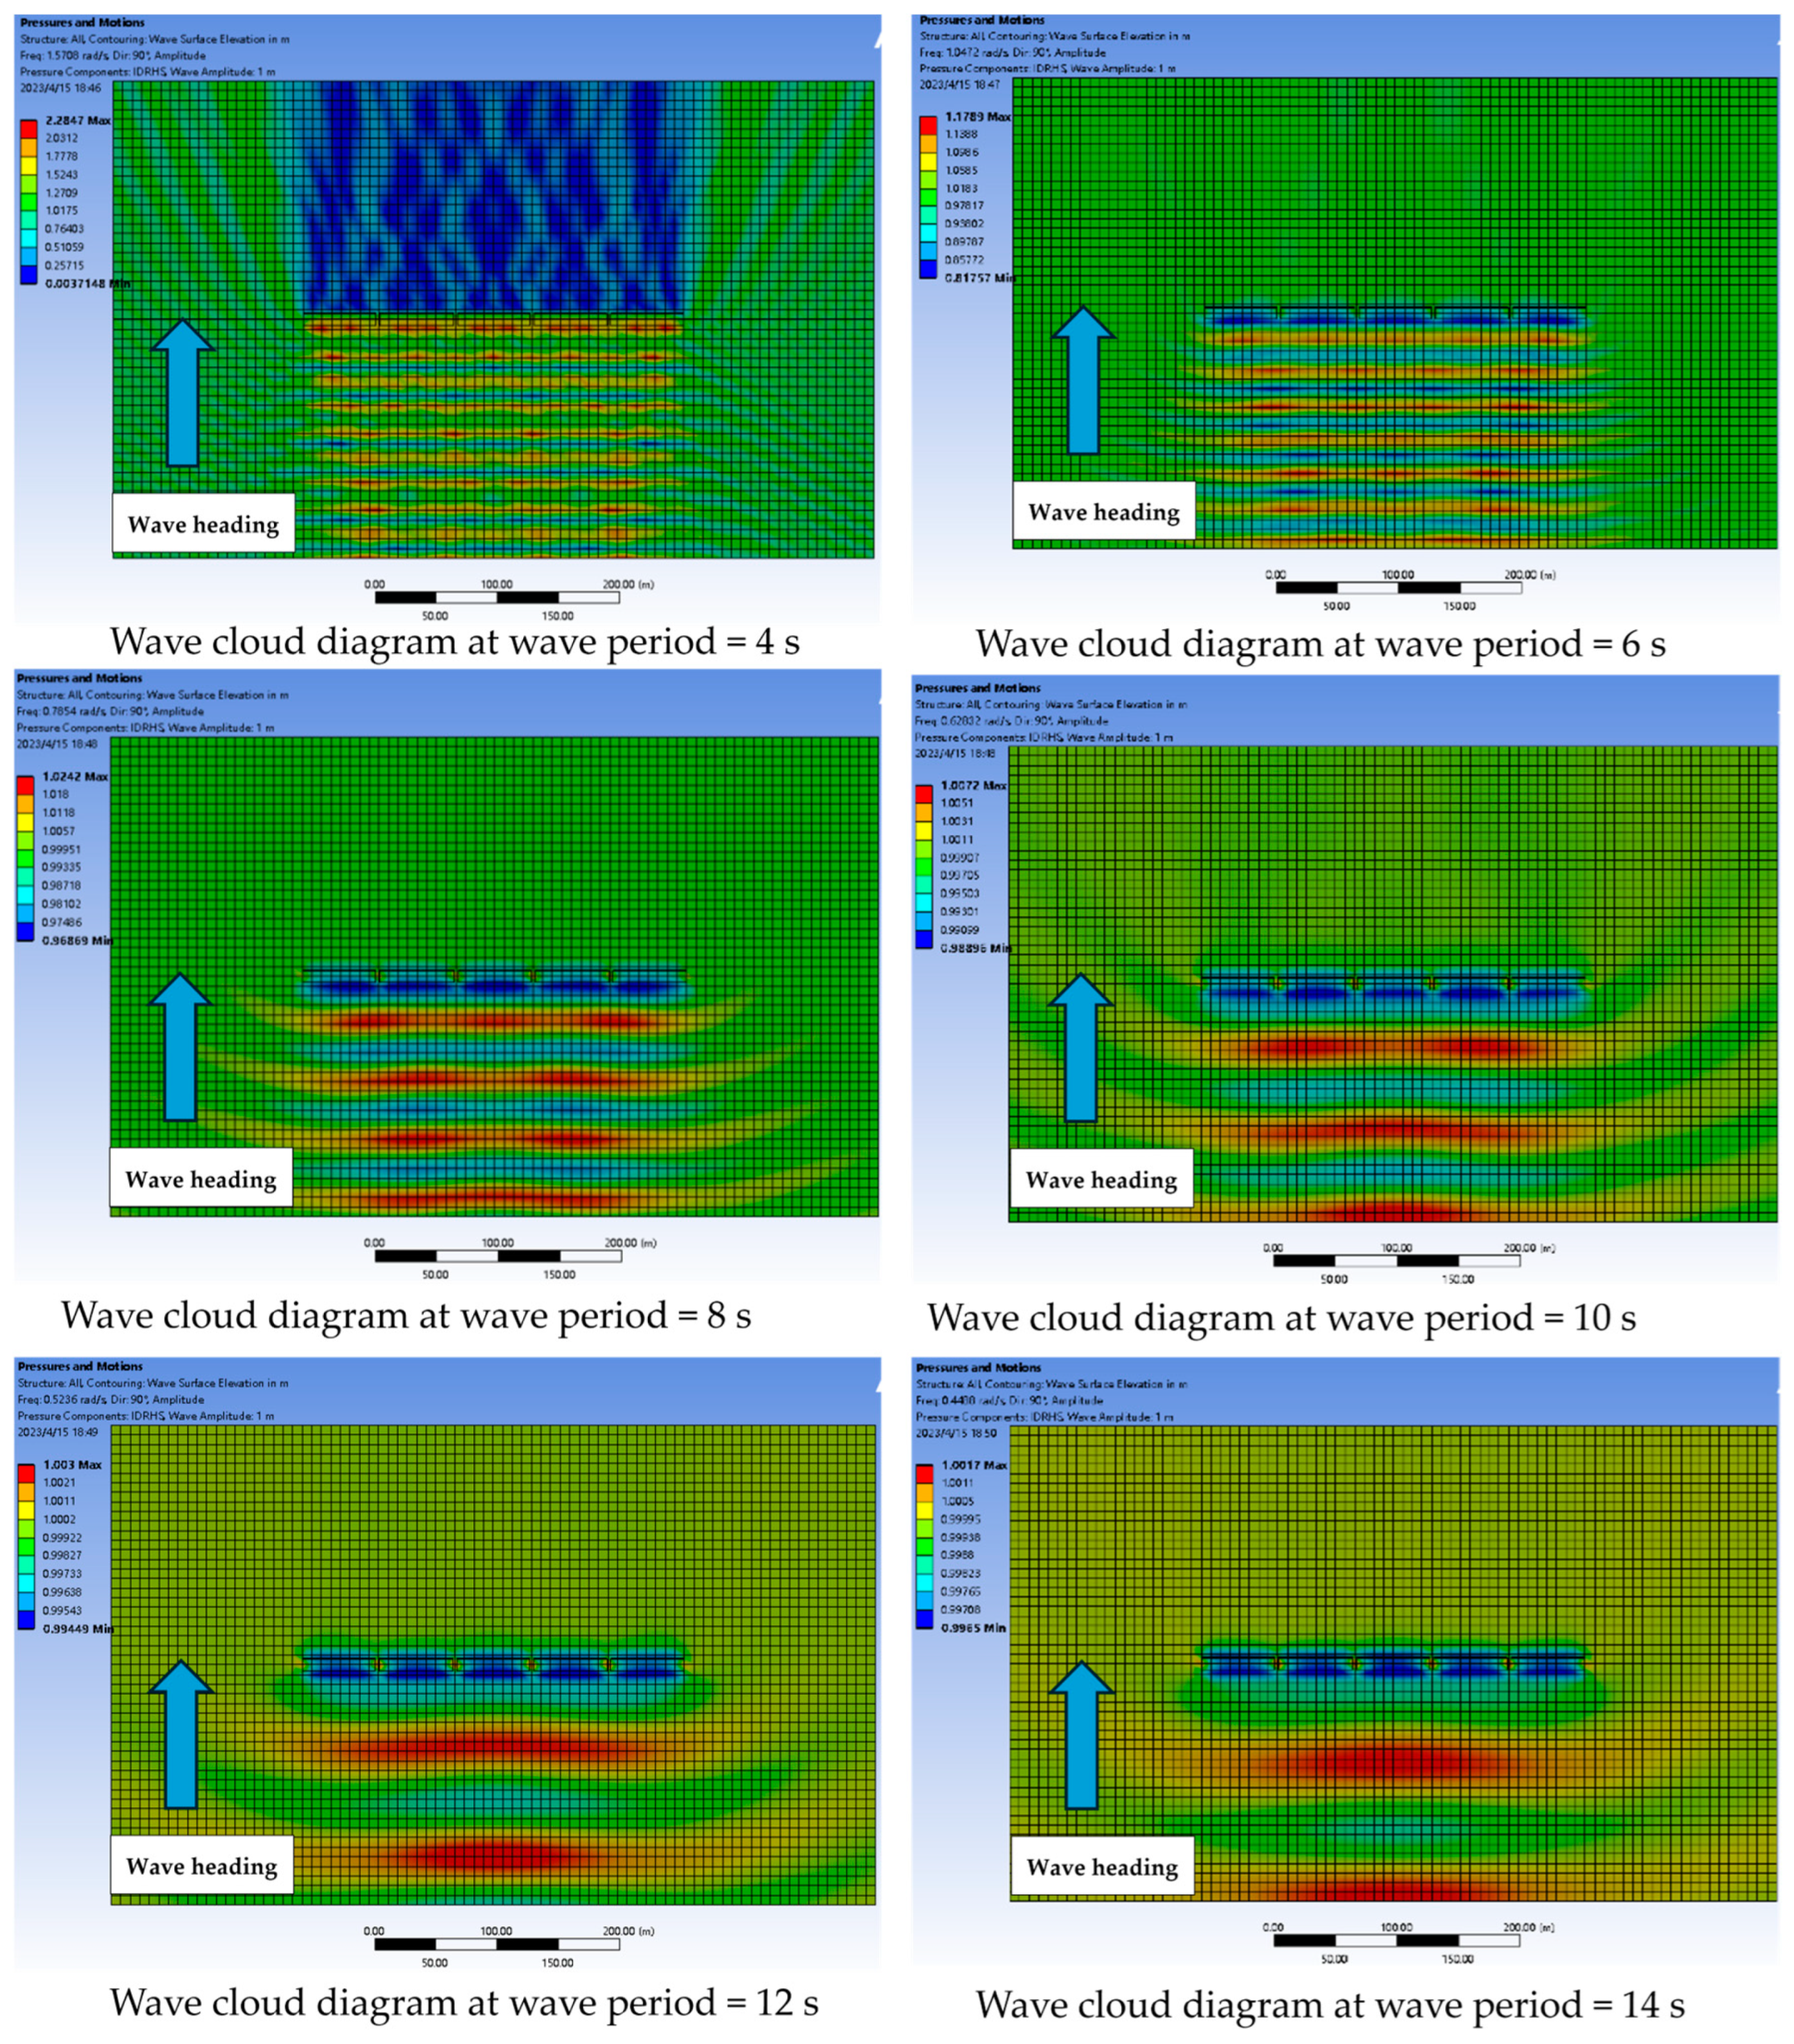
The significant increase in the wave-transmission coefficient for 5 s in the vane FBW means that after the incident wave impinges on the FBW, the height of the transmitted wave becomes larger than the height of the incident wave. We can also observe that the situation of individual FBWs is more stable. To view the waveform around the FBW, we applied a wave to the FBW with an amplitude of 1 m and two periods of 4 and 10 s. The 4 and 10 s periods were chosen to simultaneously display the wave amplitude fluctuations after affecting the FBW during both high- and low-wave periods.
Figure 16 shows the contours of the waveform patterns for all models. The contour lines indicate the wave amplitude around the FBW. As shown in these figures, to verify the performance of the structure, we selected a point 20 m behind the rear FBW, measured the wave amplitude, and calculated Ct. The FBW contours of the airfoils show that the FBW performs well with a period of 4 s, and the amplitude of the wave behind the aft FBW (amplitude of the transmitted wave) is significantly reduced compared to the amplitude of the incident wave. However, as shown before, for a period of 10 s, the contour lines show that the amplitude of the incident wave (1 m) and the amplitude of the transmitted wave are the same, indicating that the FBW is losing power. The figure shows the wave amplitude contours around the blade FBW at two different periods of 4 and 14 s.

5.3. Connection Configuration

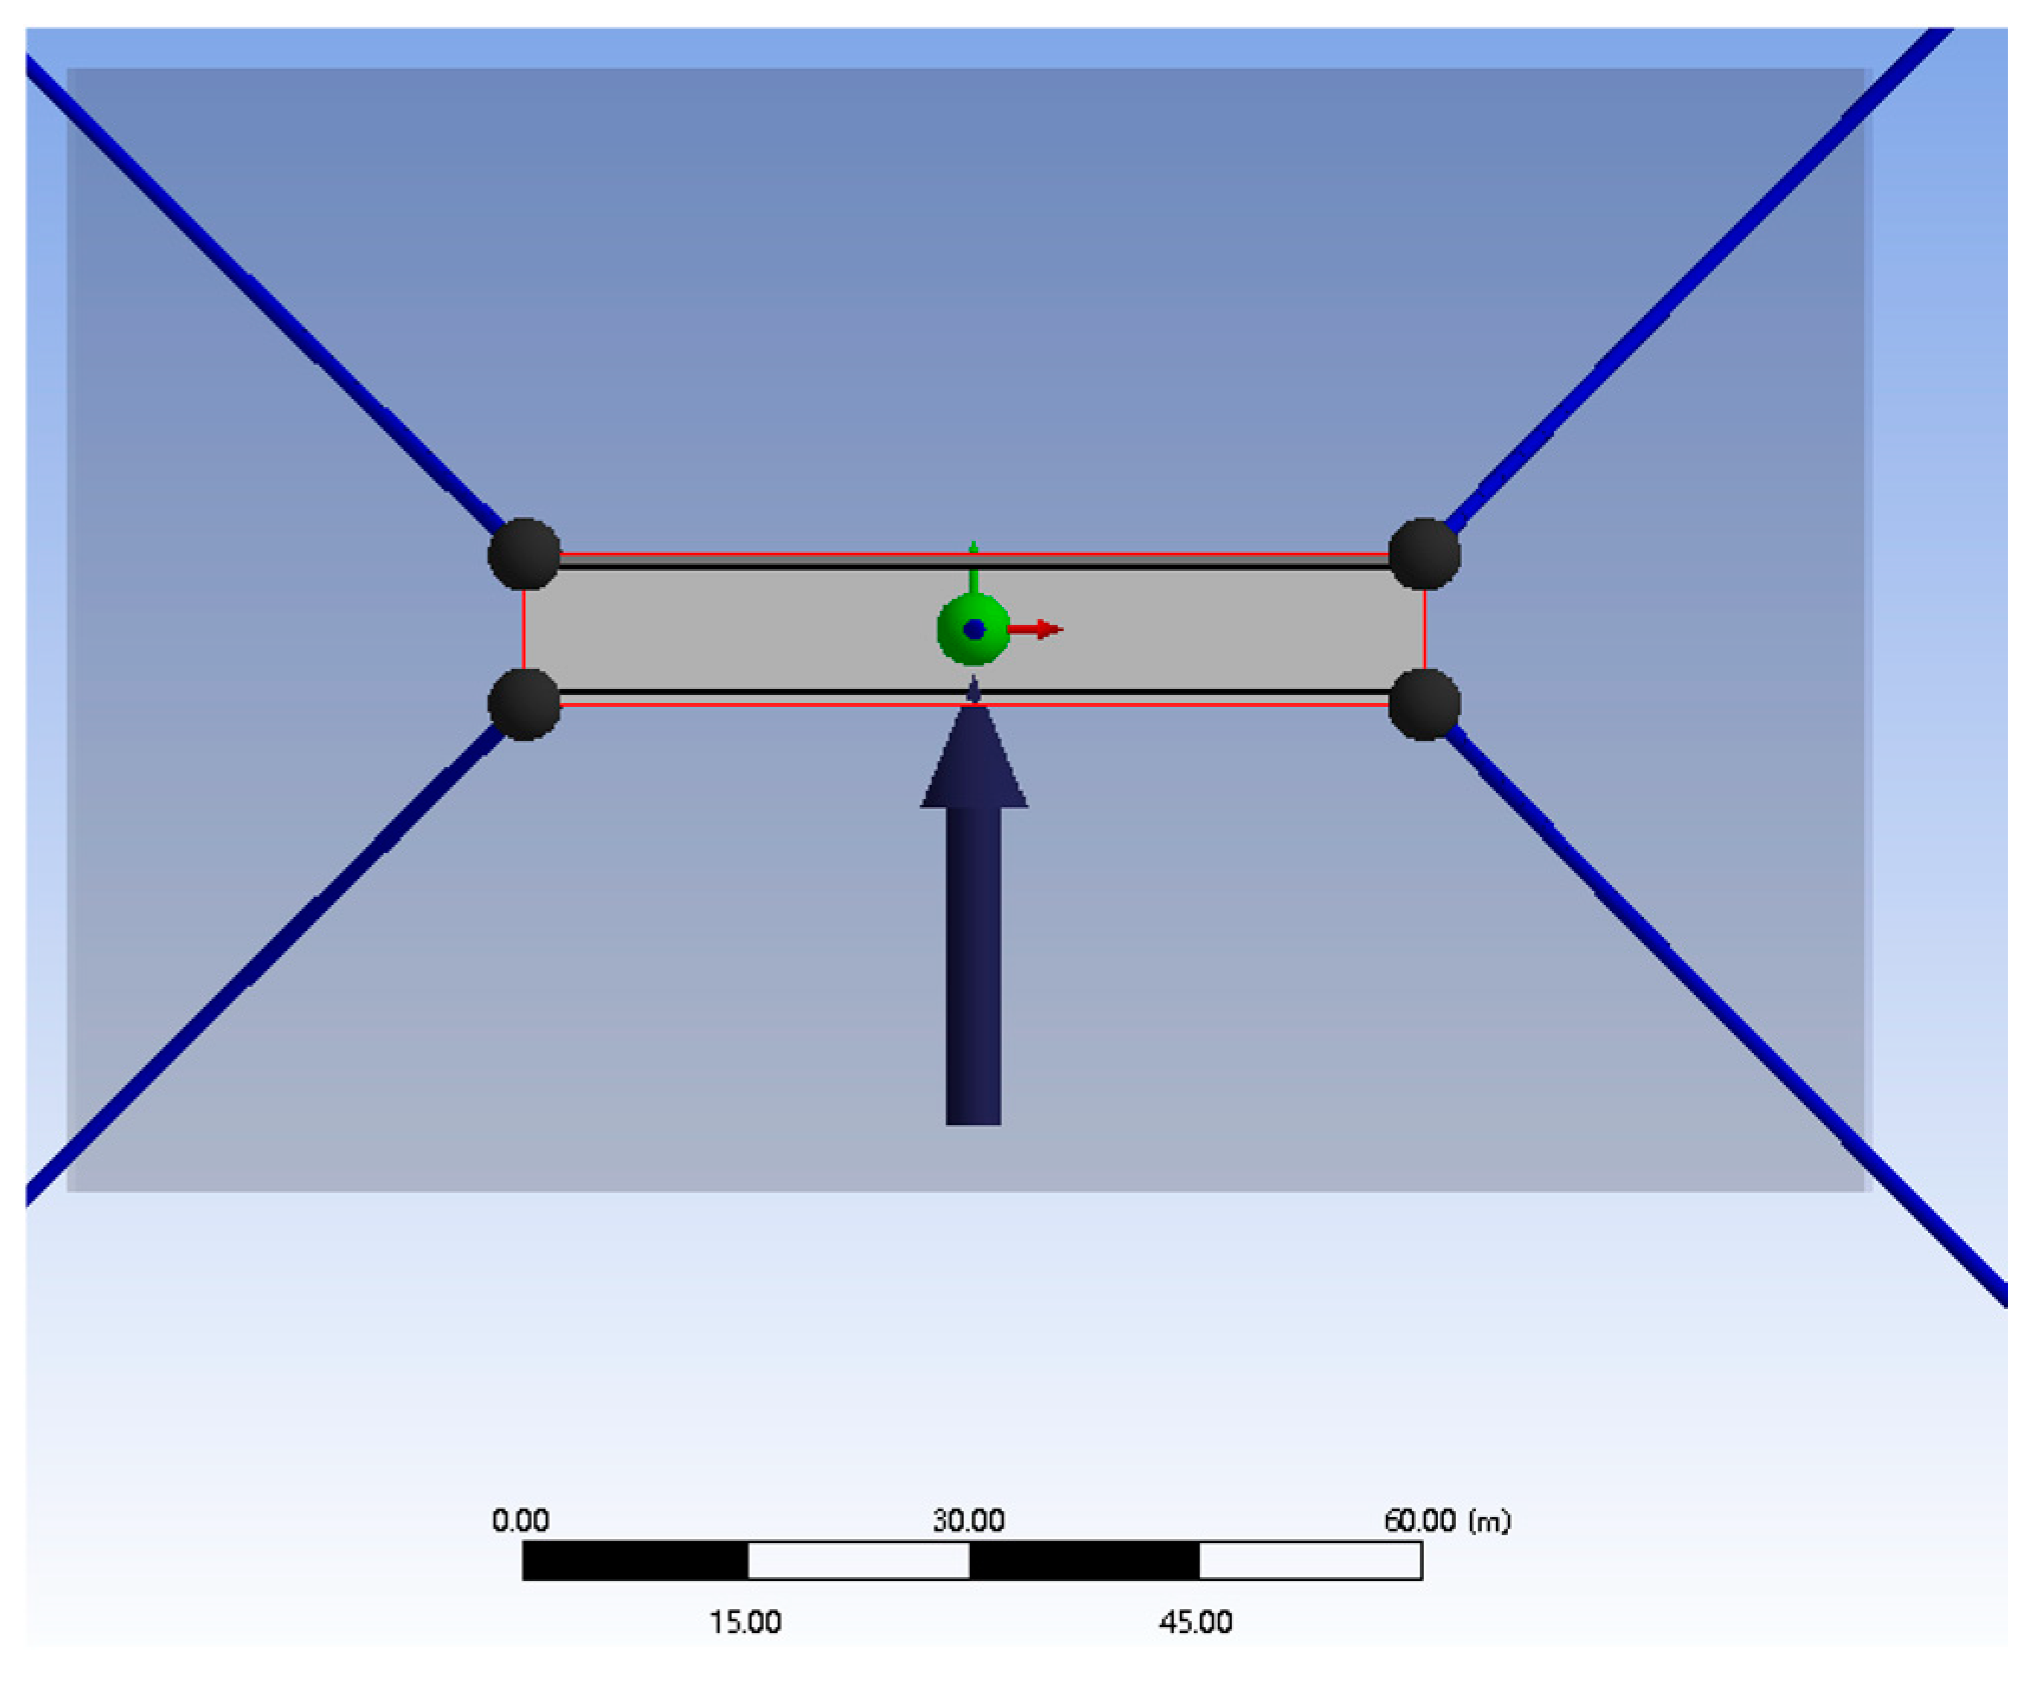
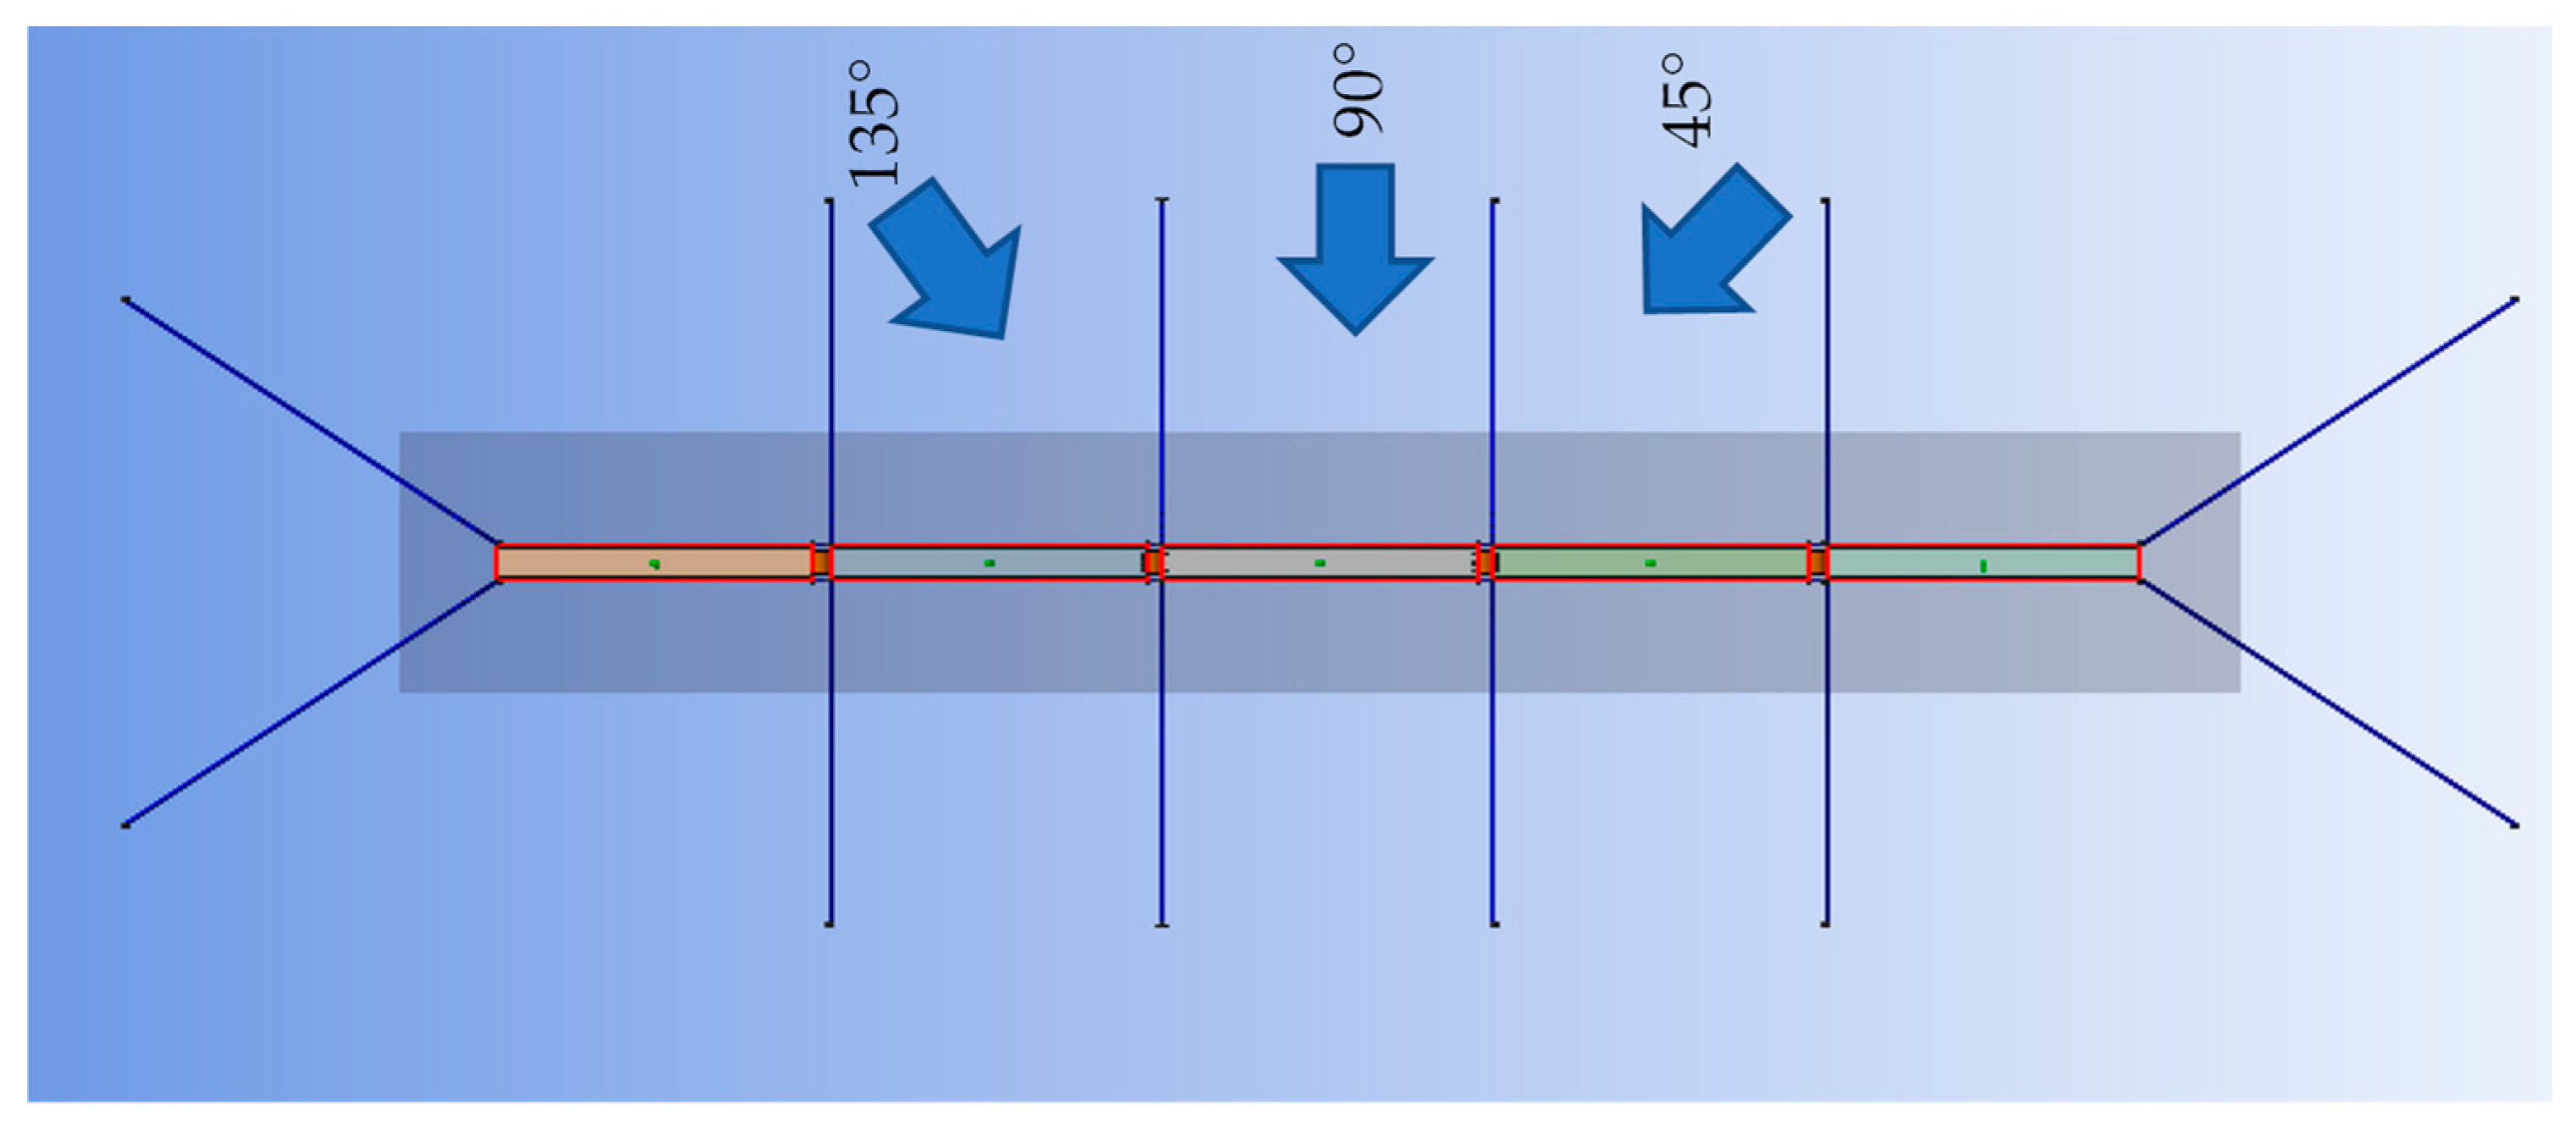
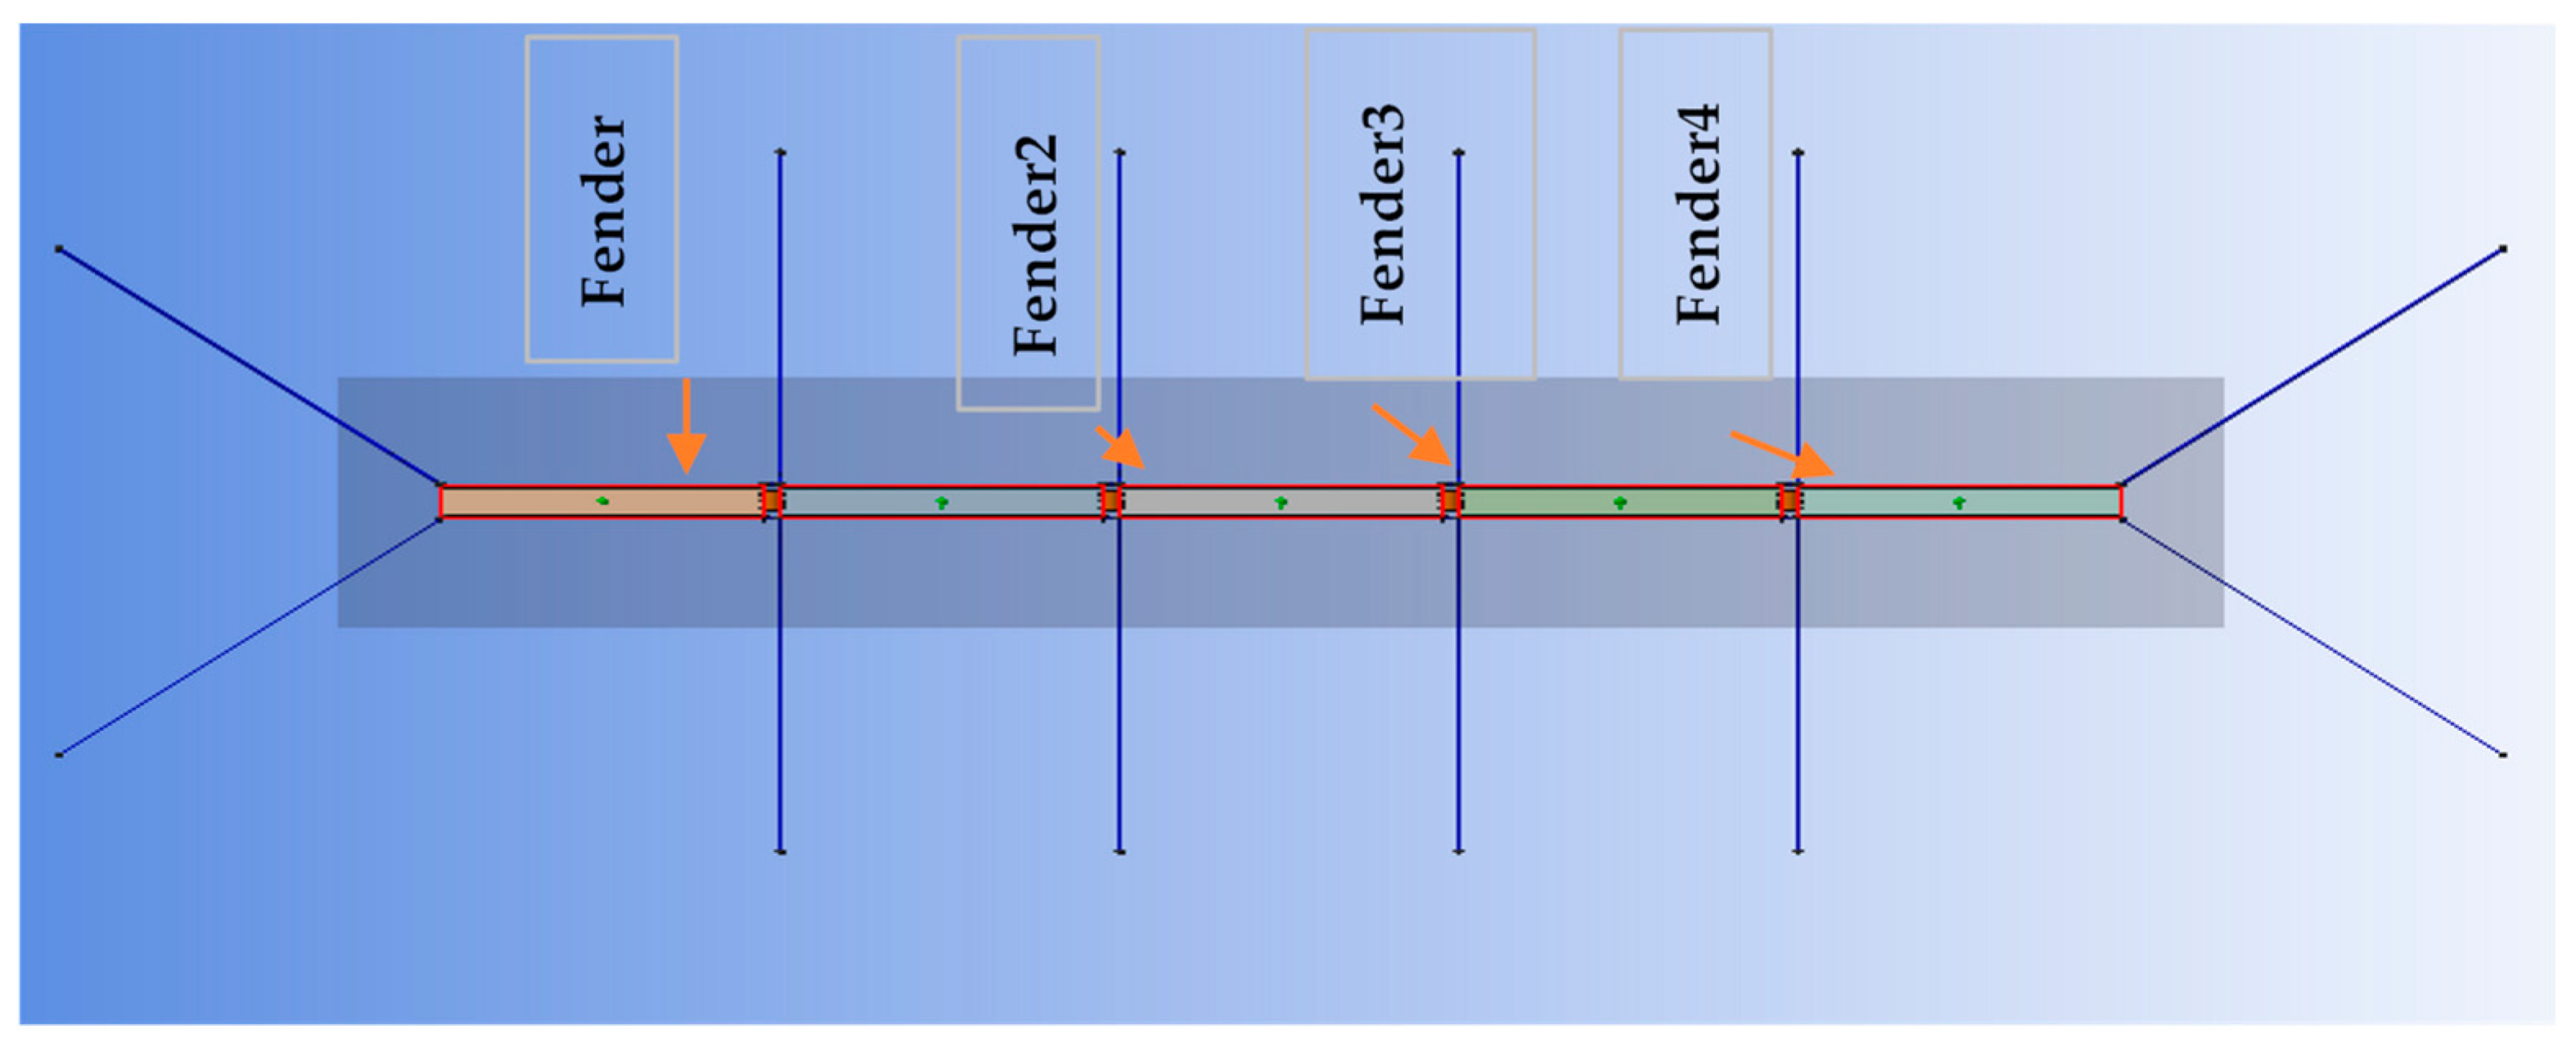
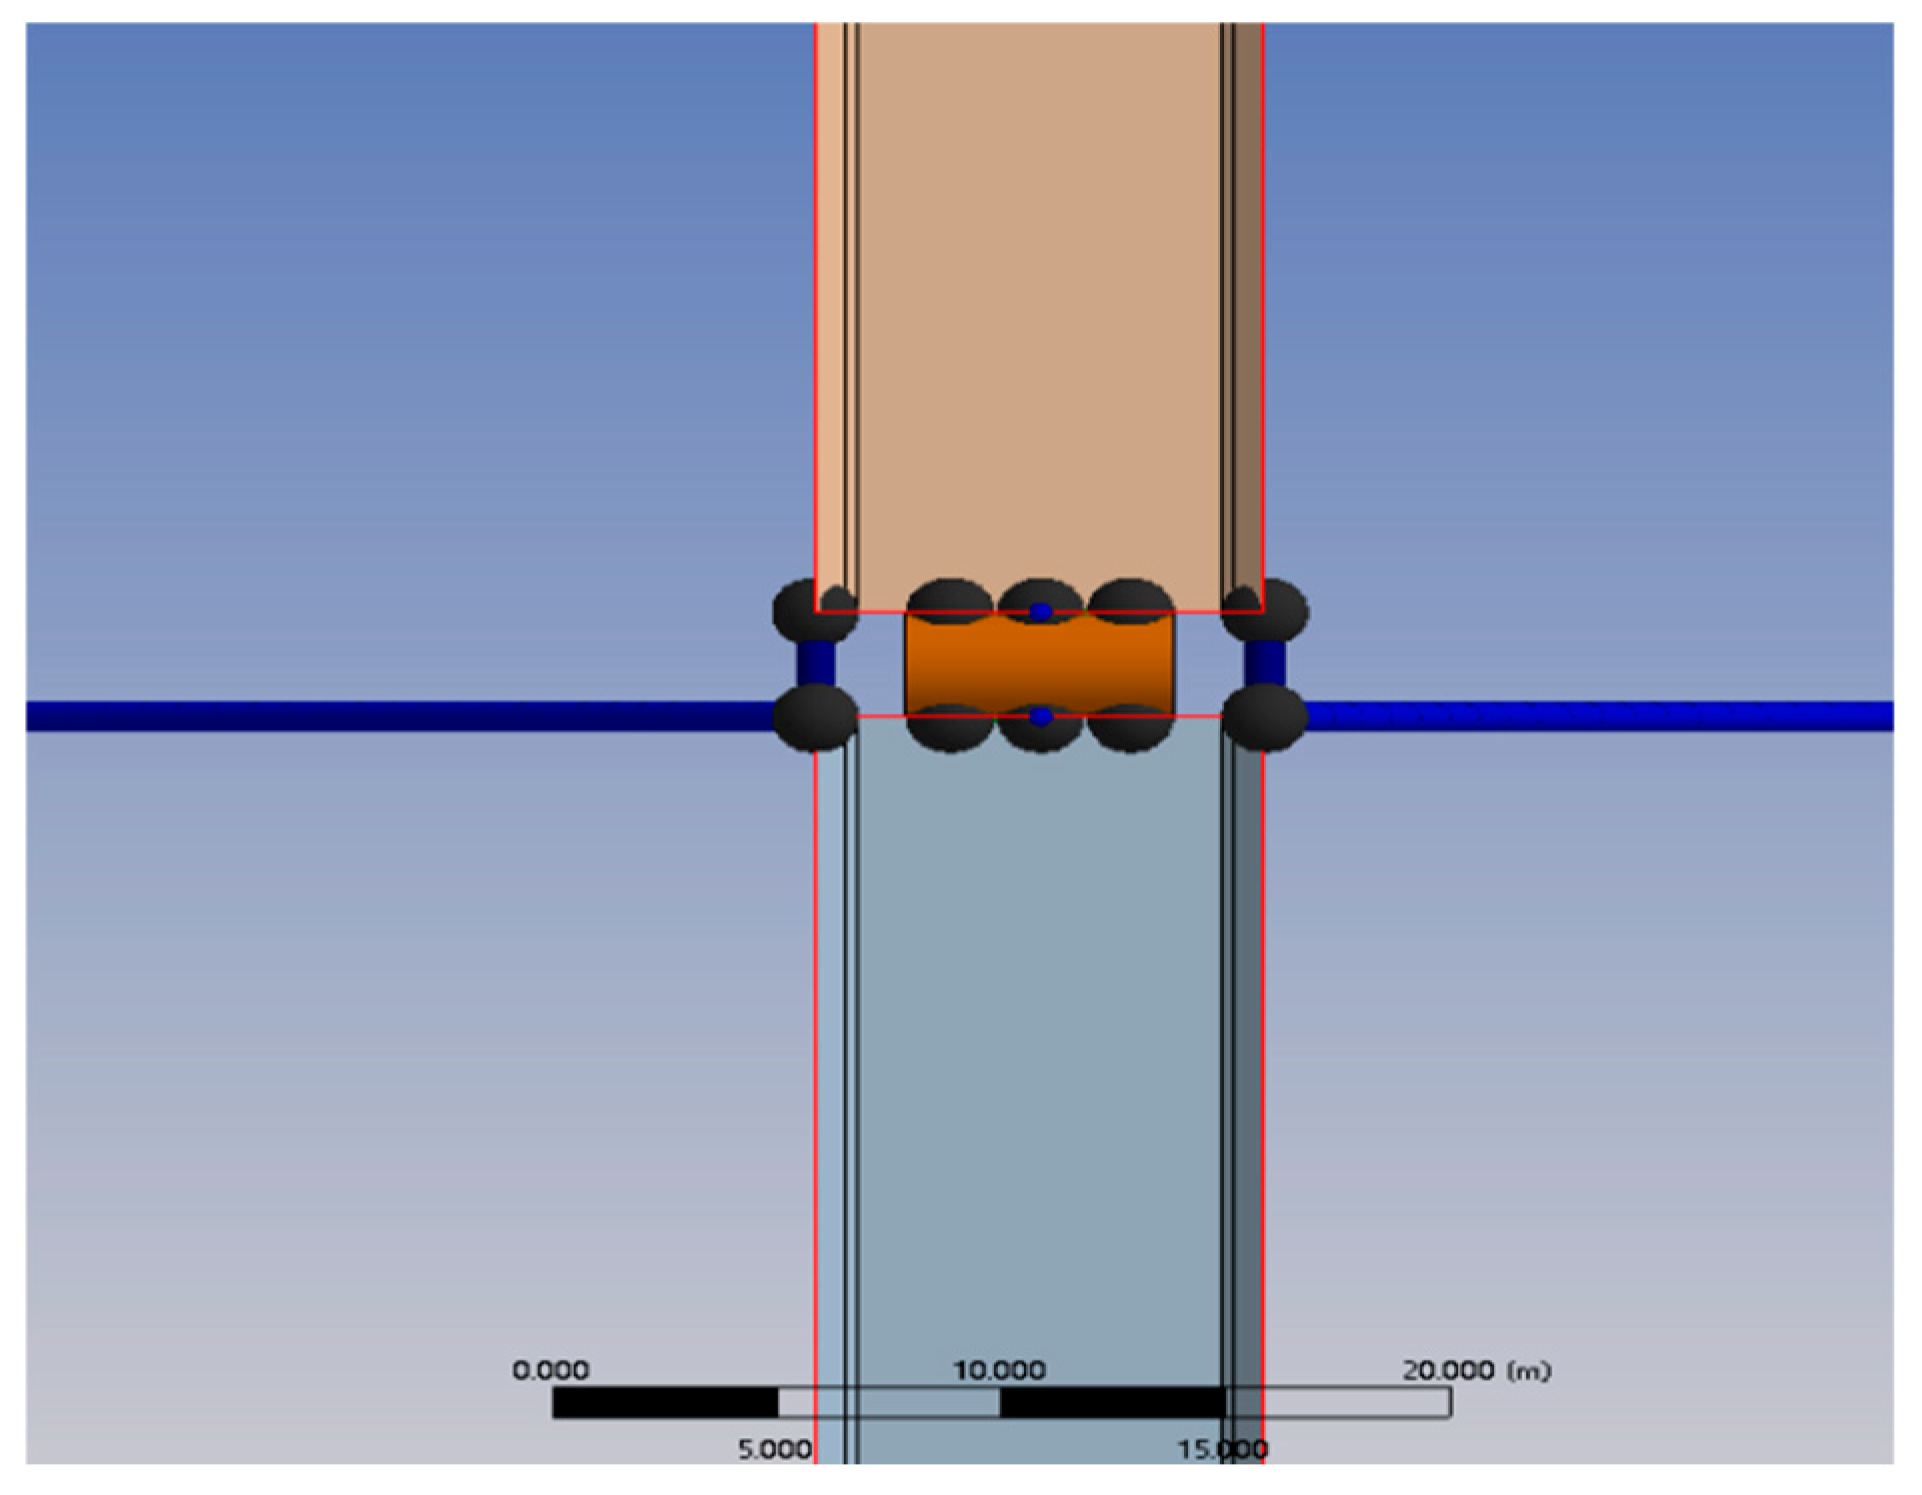
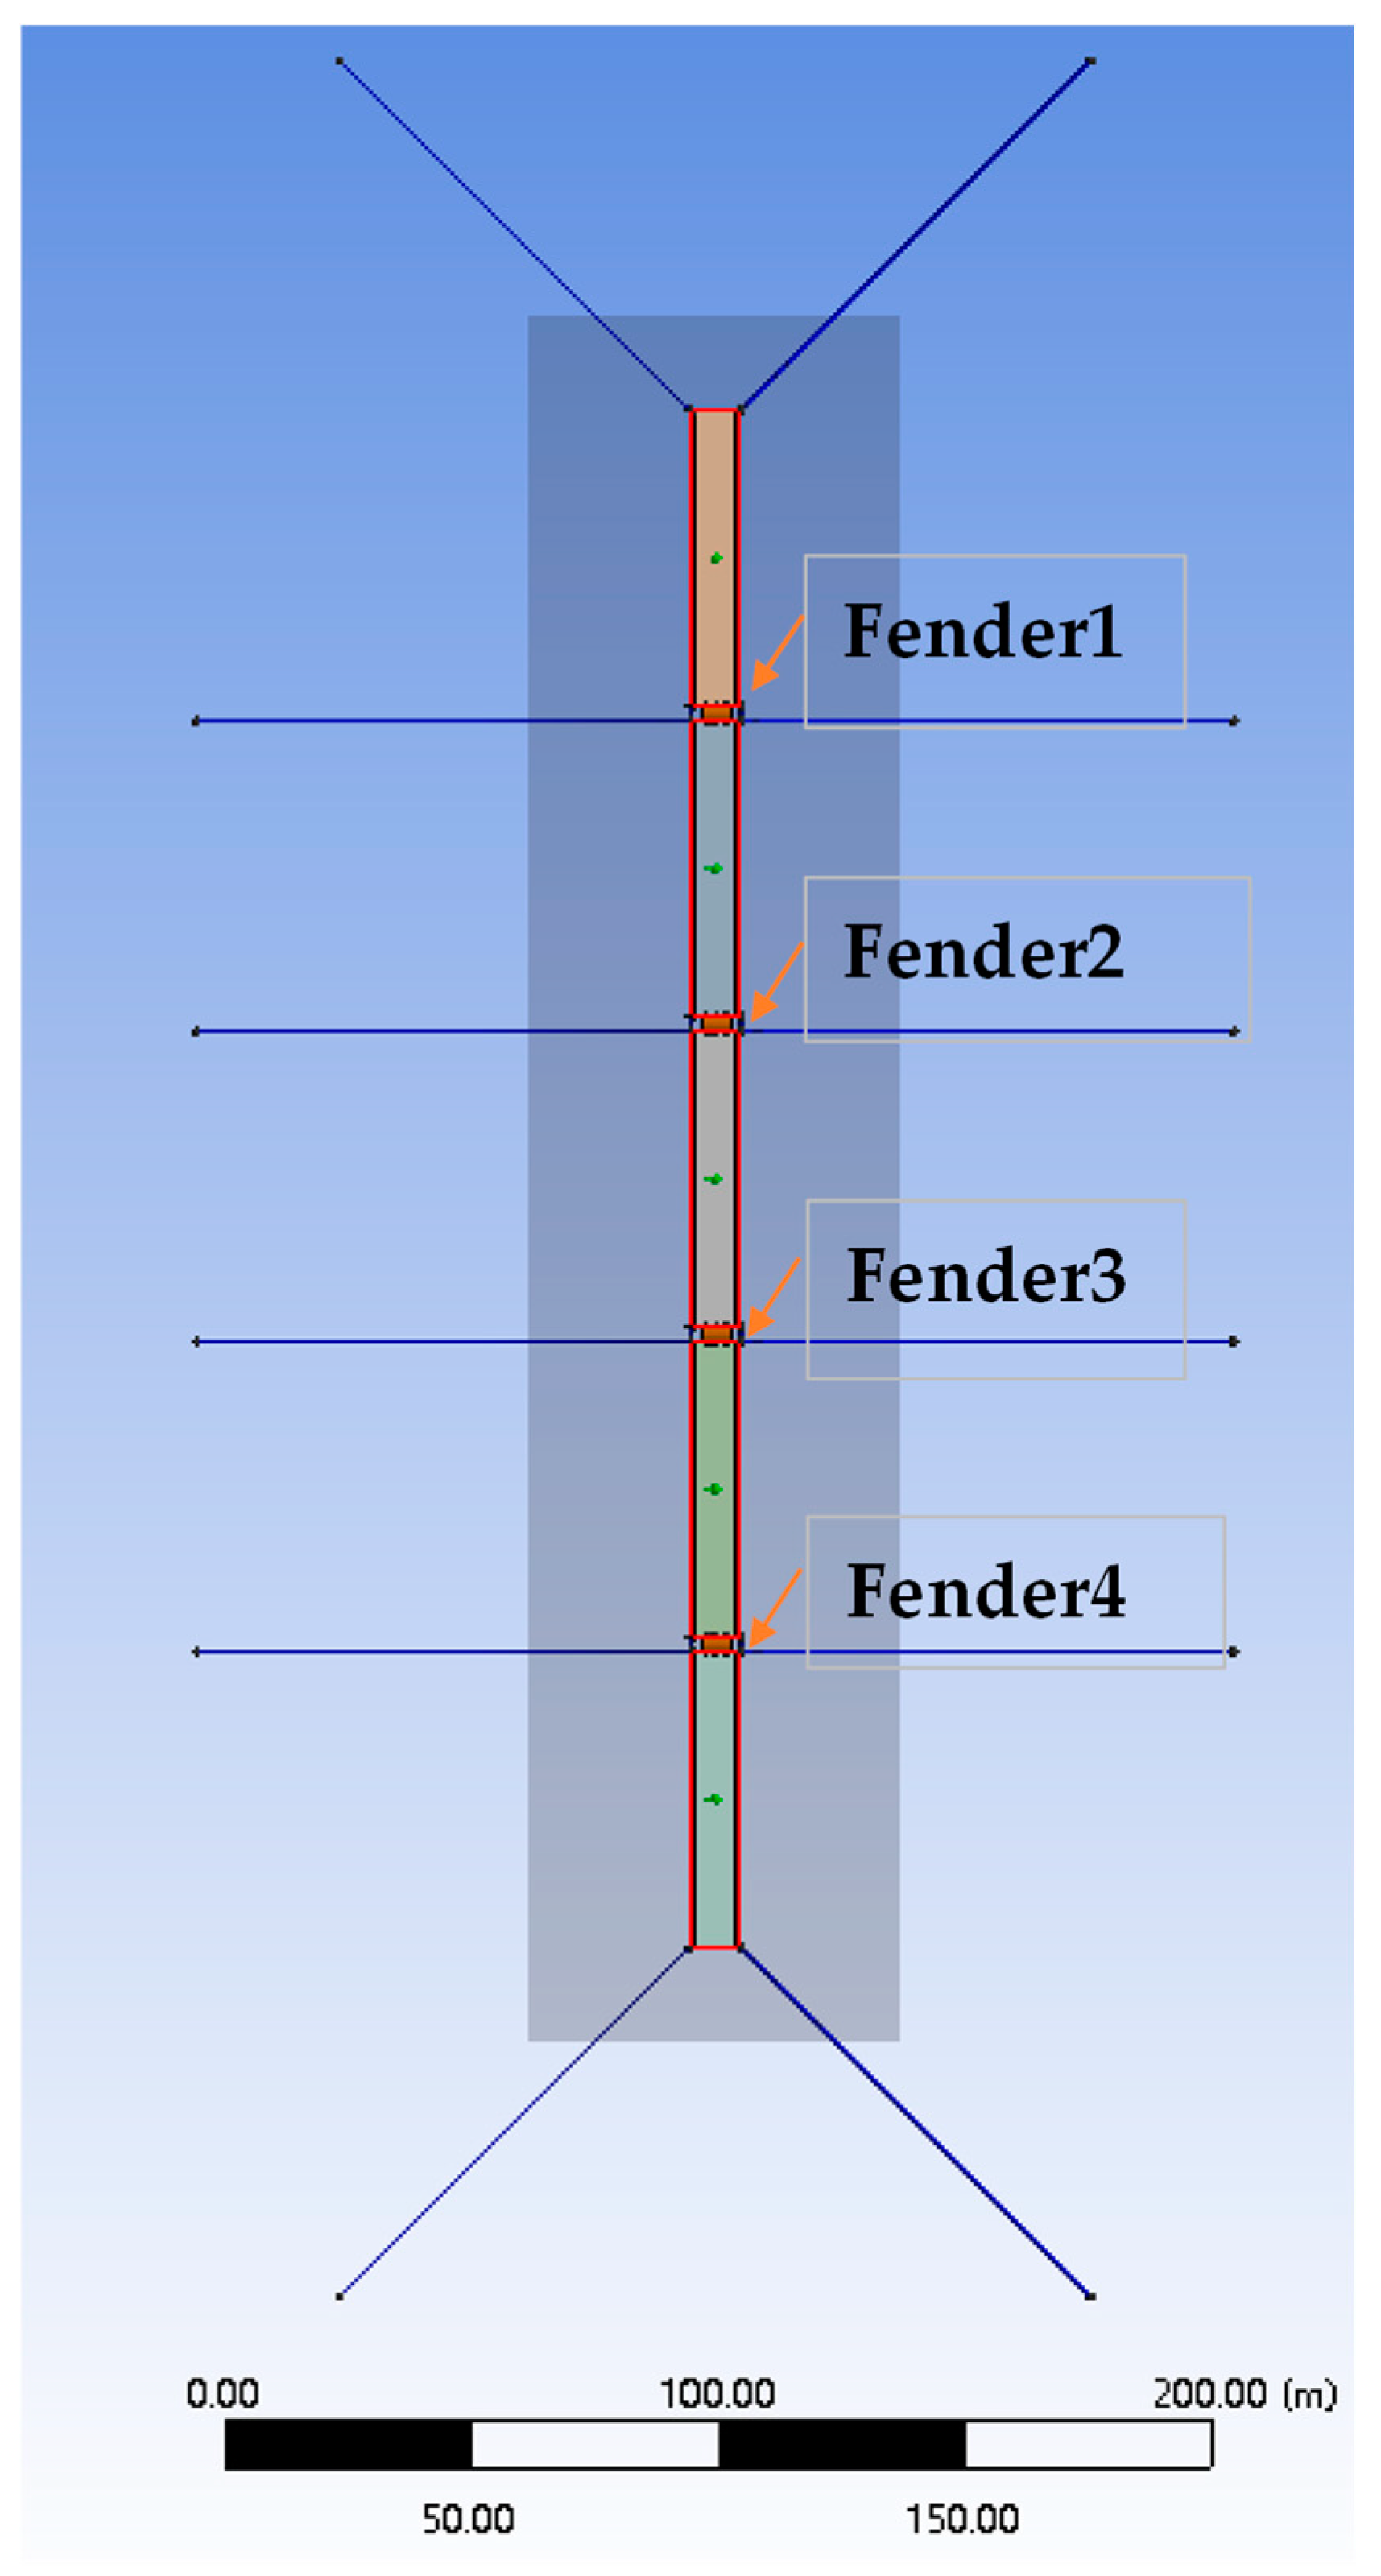
The connection method between floating breakwaters is anchor cable and ball, and an anchor chain is connected to prevent floating breakwaters moving away, as shown in Figure 17 and Figure 18. The monomers of the breakwater move toward each other, and the balls serve to prevent the monomers of the floating breakwater from colliding with each other. In this work, the spacing between floating breakwaters is set to 3 m. Table 2 displays the forces acting on different lines at the connection point.
In this section, we will design the connection mode between each module of the floating breakwater as shown in Figure 19, use the anchor cable and ball connection method, calculate various anchor-cable connection methods, and analyze the anchor cable, according to the force of the anchor cable.
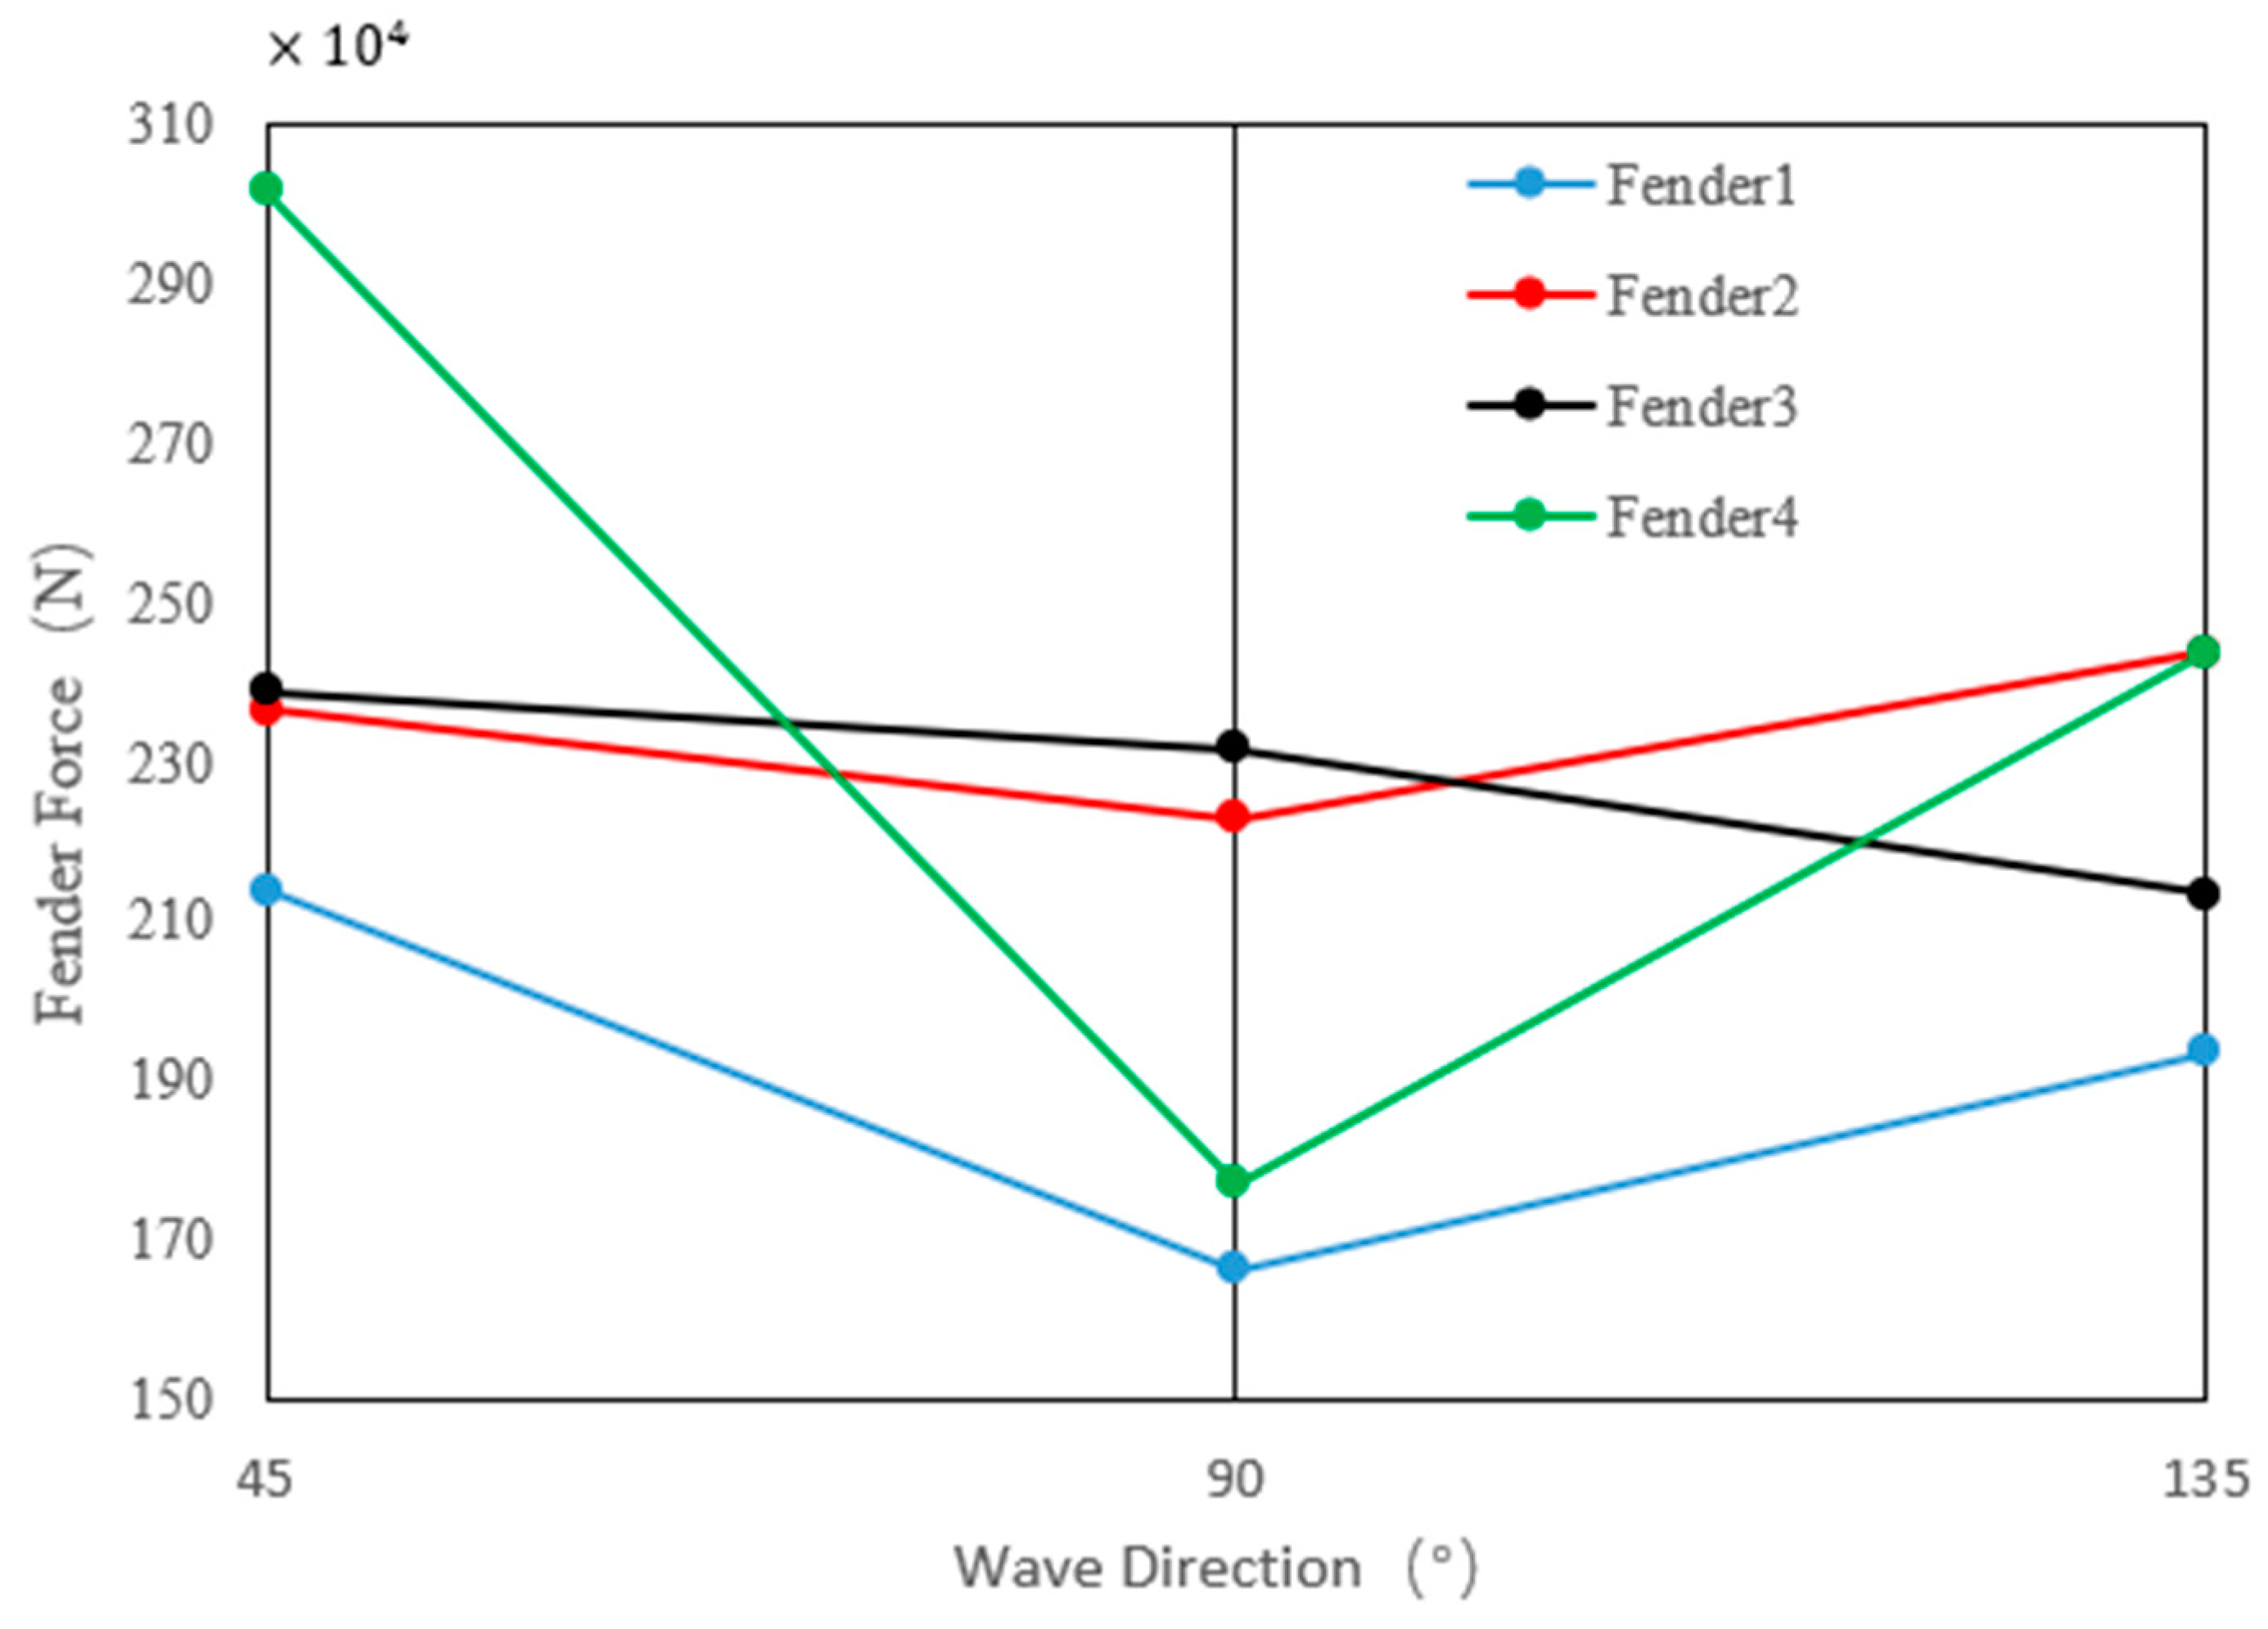
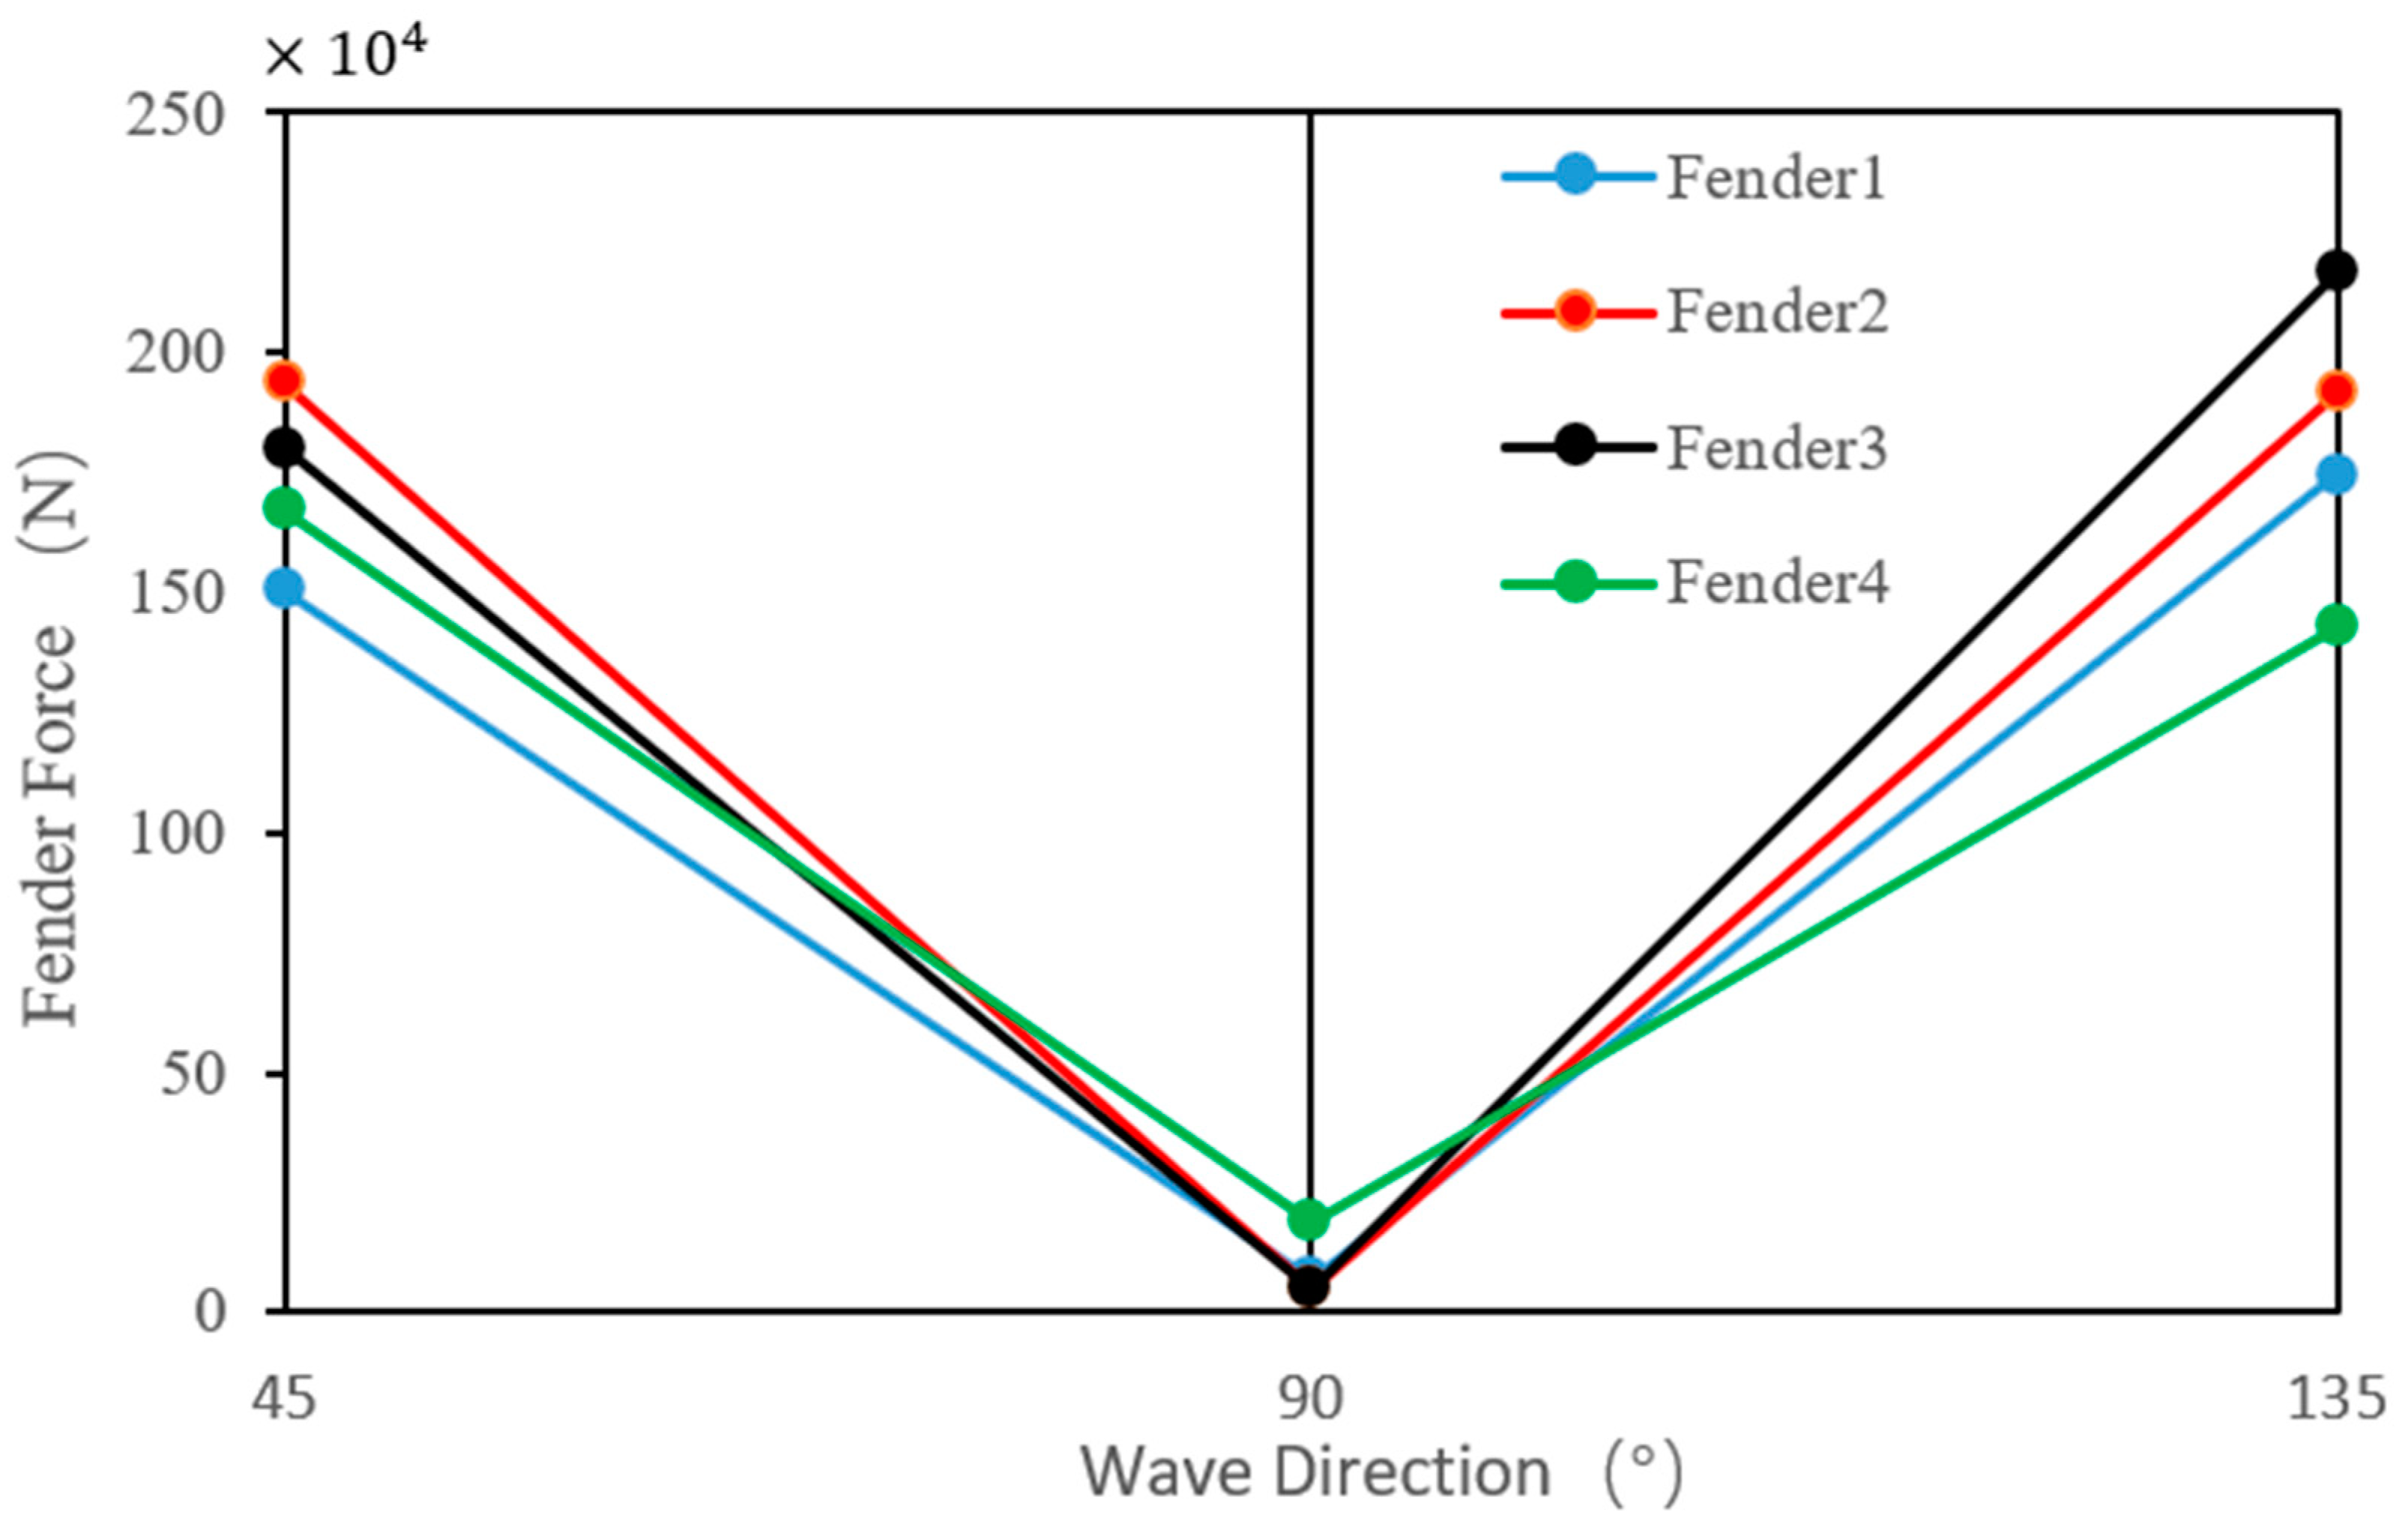
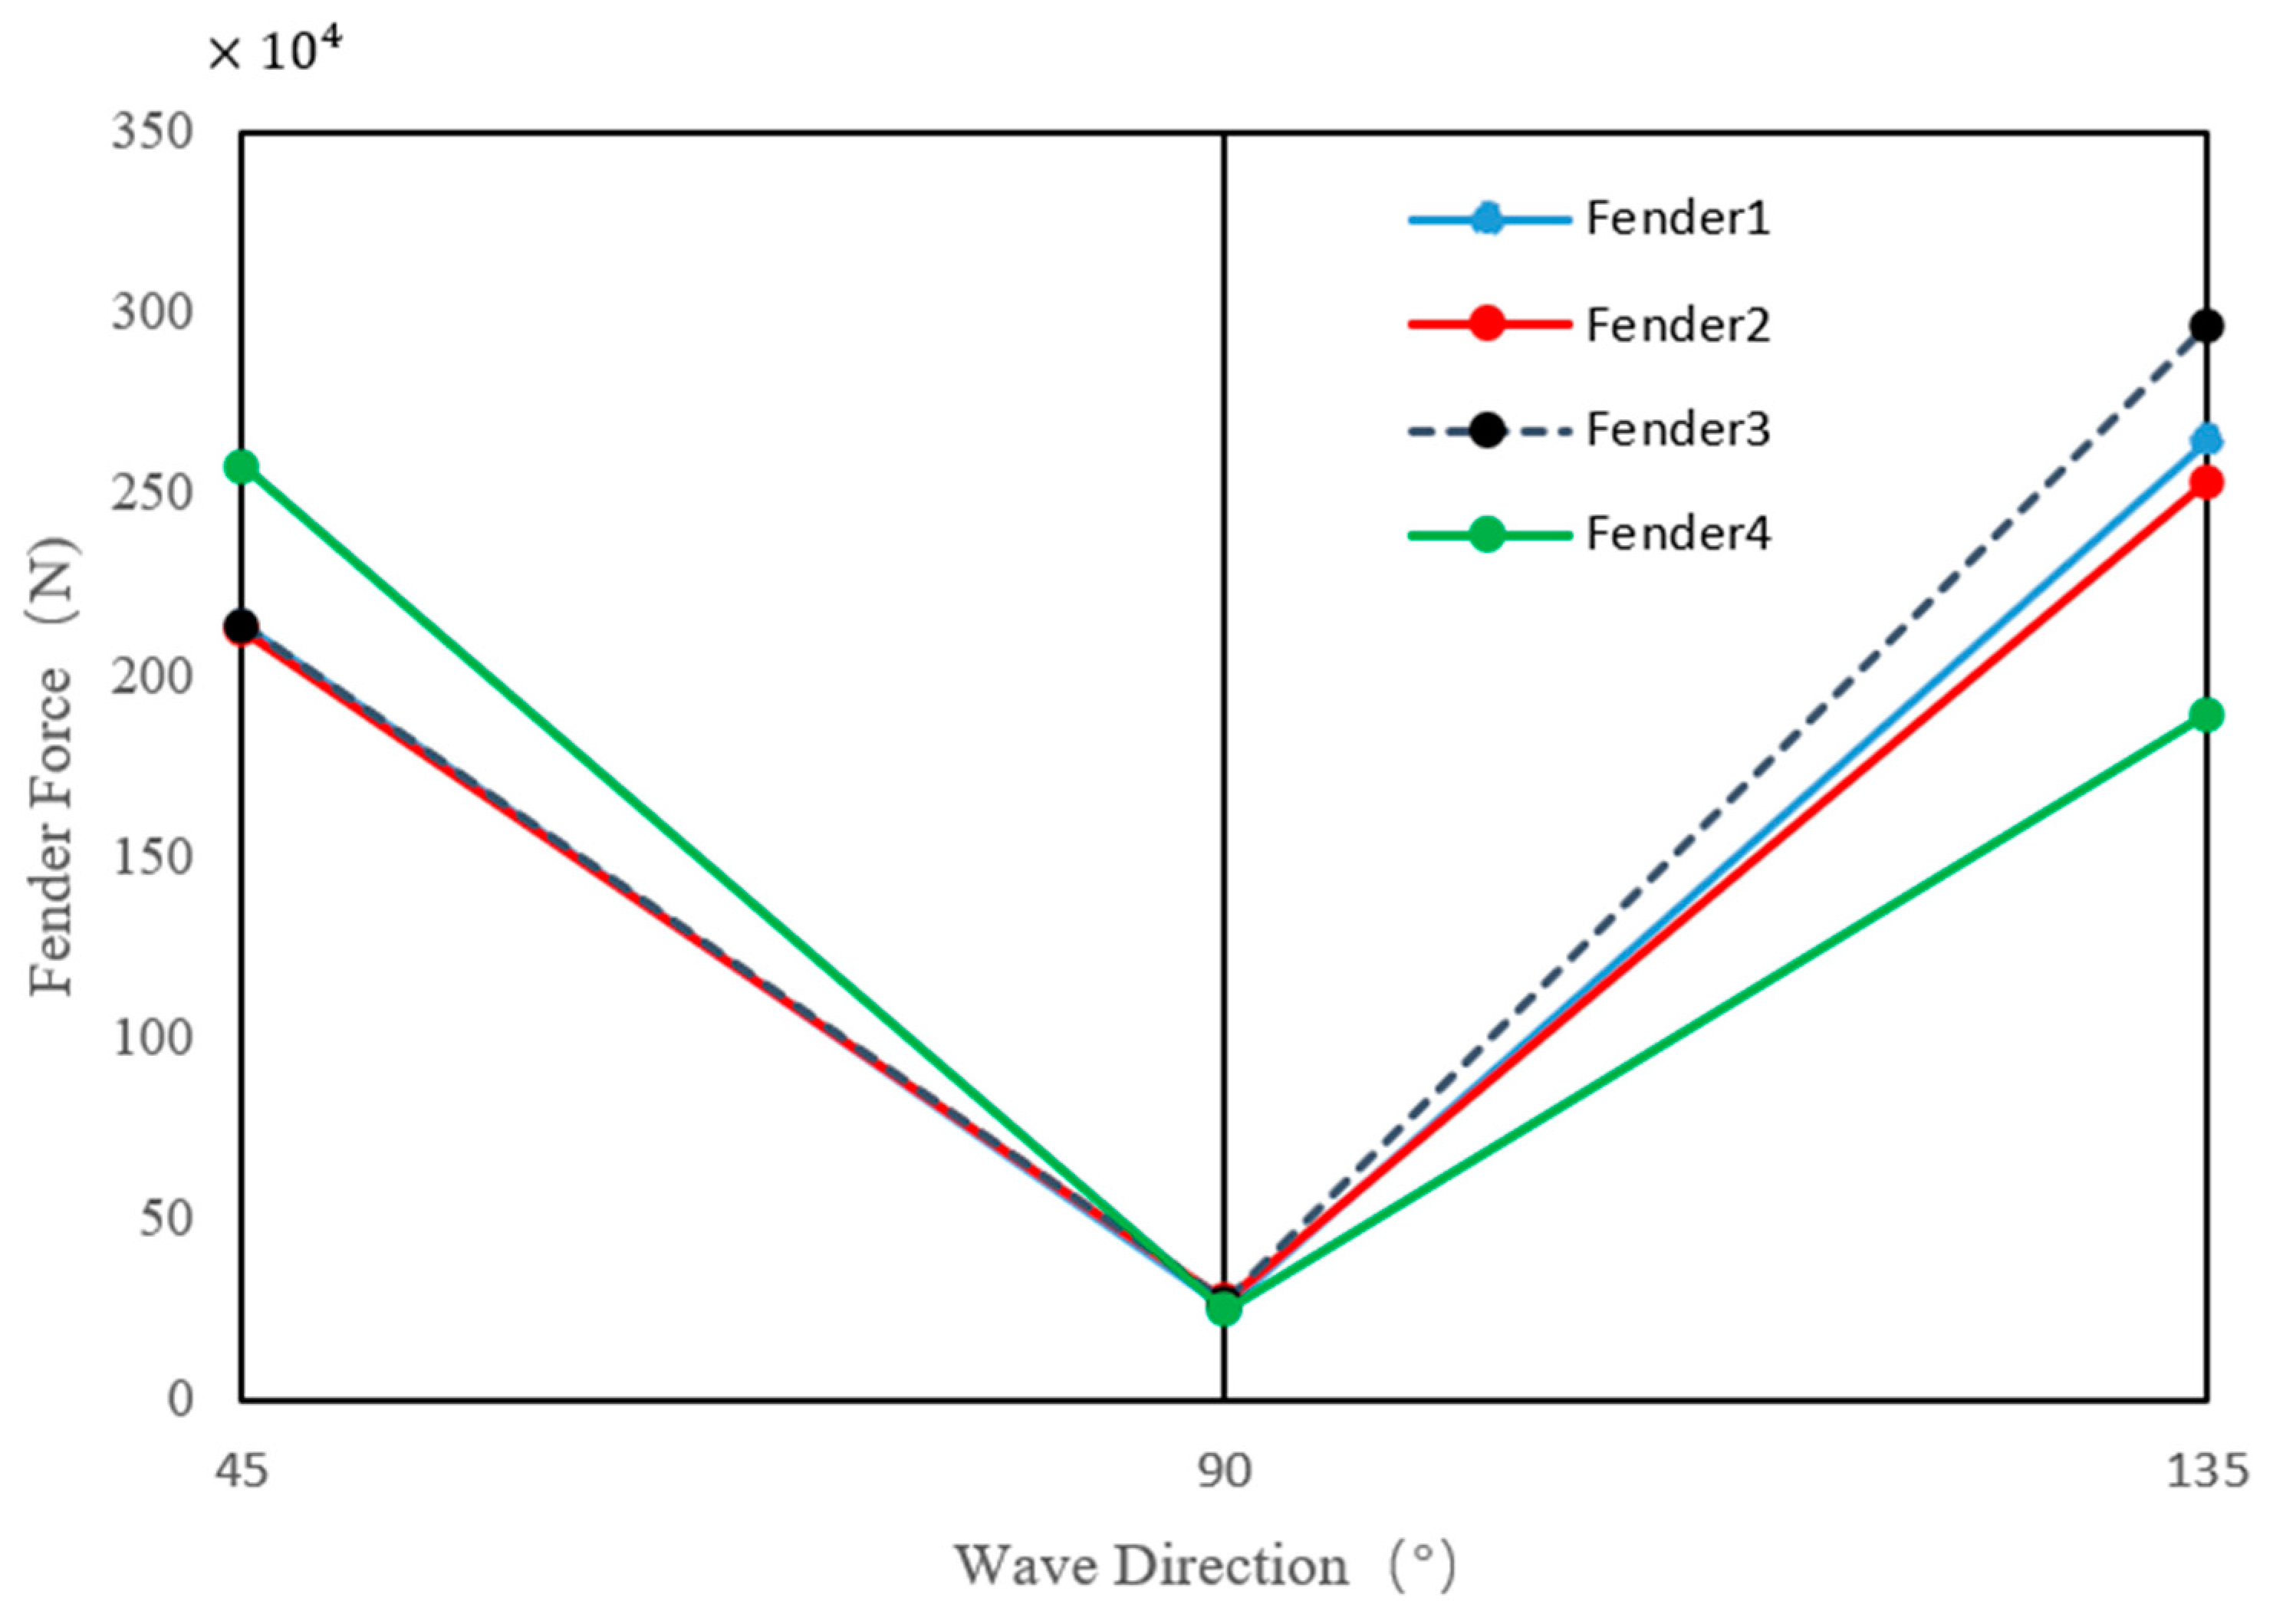
Anchor cables are used to connect single floating breakwaters, and their arrangement is divided into three types: parallel type, single-cross type and double-cross type. Below this, the strength of the parallel-connected anchor chain is clearly compromised. Wave dissipation performance deteriorates as the distance between floating breakwaters increases. Table 3, Table 4, Table 5 and Table 6 display the force data associated with the fender of parallel type. The following conclusions can be drawn from the Figure 20, Figure 21, Figure 22, Figure 23 and Figure 24:
(1)
Anchor cables are used to connect single floating breakwaters, and their arrangement is of three types: parallel, single cross, and double cross. They can be divided into the power of parallel link anchor chains. The strength of an anchor chain is superior to that of a single-cross type and double-cross type.
(2)
The force generated when connecting the anchor chain and supporting it on the ball increases with increasing wave height. If the wave direction is 45 degrees or 135 degrees, the forces on the anchor chain and ball will be maximum, creating dangerous working conditions. If the direction of the waves is 90°, it is safer to connect the anchor chain and rely on the ball with minimal force.
(3)
When the wave height in the design state reaches the maximum value of 1 m, the maximum force of the connected anchor chain shall not exceed the breaking load. The maximum force on the ball does not exceed its reaction force. Both the ball and the anchor rope are safe.

6. Conclusions

The Floating Breakwater Model with Anchor System is a physical representation of a floating breakwater designed to mitigate wave impacts in bodies of water. The model consists of floating modules anchored using ropes or chains attached to seabed anchors. These modules, typically constructed from durable materials like concrete or steel, are arranged in a linear formation to create a protective barrier that absorbs wave energy and safeguards shorelines and structures. By simulating different wave conditions and water depths, the model enables engineers and planners to optimize breakwater design and placement for maximum effectiveness. The utilization of floating breakwater models with anchoring systems contributes to the improvement of coastal protection measures, ensuring the safety and sustainability of coastal communities and ecosystems. Key findings from the study include:
  • Successful development of a computer model that demonstrated good agreement with the physical model.
  • The effectiveness of the breakwater diminishes if the natural period of the structure aligns with the period of the waves. Therefore, it is recommended that this factor is considered during breakwater construction.
  • Modifying the breakwater design to increase the extinction coefficient or enhance wave reflection can improve its effectiveness.
  • Among the investigated designs, the simple pontoon breakwater performed best in waves with a period of 16 s and a draft level of 3 m. Additionally, the step-pontoon breakwater exhibited superior performance under similar wave conditions.
  • The force exerted on the anchor chain is greater than that of the single-cross type and the double-cross type.
  • The force on the anchor chain and the ball increases with increasing wave height, with the most significant force occurring at wave directions of 45° or 135°, representing dangerous working conditions. Connecting the anchor chain and relying on the ball is safer when the wave direction is 90°.
These conclusions provide valuable insights into the behavior and performance of the Floating Breakwater Model with Anchor System, guiding future designs and implementations for enhanced coastal protection.

Author Contributions

Conceptualization, F.A.A.-S., J.Z., C.J., A.I.A. and B.S.; Methodology, F.A.A.-S. and B.S.; Software, F.A.A.-S. and B.S.; Validation, J.Z. and C.J.; Investigation, F.A.A.-S. and B.S.; Resources, A.I.A.; Data curation, F.A.A.-S. and B.S.; Writing—original draft, F.A.A.-S.; Writing—review & editing, J.Z., C.J., A.I.A. and B.S.; Supervision, J.Z. and C.J.; Funding acquisition, A.I.A. All authors have read and agreed to the published version of the manuscript.

Funding

This research was funded by Researchers Supporting Project number (RSP2024R424), King Saud University, Riyadh, Saudi Arabia.

Data Availability Statement

The data presented in this study are available on request from the corresponding author.

Conflicts of Interest

The authors declare that they have no known competing financial interests or personal relationships that could have appeared to influence the work reported in this paper.

References

  1. Chen, X.; Cui, J.; Li, M.Y. Numerical simulation and energy extraction power fitting of OWSCs under regular waves using SPH method. Ocean Eng. 2023, 283, 115077. [Google Scholar] [CrossRef]
  2. Cui, J.; Chen, X.; Sun, P.N.; Li, M.Y. Numerical investigation on the hydrodynamic behavior of a floating breakwater with moon pool through a coupling SPH model. Ocean Eng. 2022, 248, 110849. [Google Scholar] [CrossRef]
  3. Paotonan, C.; Rachman, T.; Ashury Putra, T.P. The Analytical Solution of Waves Transmission Coefficient on Semi Fixed Floating Breakwater. IOP Conf. Ser. Mater. Sci. Eng. 2020, 875, 012082. [Google Scholar] [CrossRef]
  4. Kit, A.Y.J.; Giap, S.G.E.; Ahmad, M.F. Experimental Study on Wave Transmission Coefficient of Double Cylindrical Floating Breakwater in a Wave Basin. J. Adv. Res. Fluid Mech. Therm. Sci. 2024, 112, 33–42. [Google Scholar] [CrossRef]
  5. Teh, H.M.; Mohammed, N.I. Wave interactions with a floating breakwater. In Proceedings of the 2012 IEEE Colloquium on Humanities, Science and Engineering (CHUSER), Kota Kinabalu, Malaysia, 3–4 December 2012; pp. 84–87. [Google Scholar] [CrossRef]
  6. Cui, J.; Chen, X.; Sun, P. Numerical investigation on the hydrodynamic performance of a new designed breakwater using smoothed particle hydrodynamic method. Eng. Anal. Bound. Elem. 2021, 130, 379–403. [Google Scholar] [CrossRef]
  7. Sujantoko; Pramestika, G.A.; Mustain, M.; Ikhwani, H.; Hadiwidodo, Y.S. Simulation of a Wave Hydrodynamic Numerical Model on a Single Vertical Porous Breakwater. IOP Conf. Ser. Earth Environ. Sci. 2024, 1298, 012007. [Google Scholar] [CrossRef]
  8. He, Y.; Han, B.; Ji, W.; Yan, L.; Han, X. Dynamic analysis of floating piers for curved bridge under wave load and effect of submerged annular rippled breakwater. Ocean Eng. 2022, 266, 112946. [Google Scholar] [CrossRef]
  9. Diwedar, A.I.; Abdelhaleem, F.S.; Ali, A.M. Wave parameters influence on breakwater stability. IOP Conf. Ser. Earth Environ. Sci. 2019, 326, 012013. [Google Scholar] [CrossRef]
  10. Zheng, Y.; Li, J.; Mu, Y.; Zhang, Y.; Huang, S.; Shao, X. Numerical Study on Wave Dissipation Performance of OWC-Perforated Floating Breakwater under Irregular Waves. Sustainability 2023, 15, 11427. [Google Scholar] [CrossRef]
  11. Sarkar, B.; De, S.; Gayen, R. Water wave scattering by pair of porous barriers in the presence of a bottom-standing rectangular obstacle. Ships Offshore Struct. 2023, 19, 1–23. [Google Scholar] [CrossRef]
  12. Sujantoko; Rasman, I.F.; Mustain, M.; Pratikto, W.A.; Frestiqauli, S. Effect of Interparticle Distance on Smoothed Particle Hydrodynamics on Wave Transformation through Submerged Breakwater. IOP Conf. Ser. Earth Environ. Sci. 2024, 1298, 012001. [Google Scholar] [CrossRef]
  13. Kumar, U.V.; Saha, S.; Koley, S. A comparative study of wave scattering by non-porous and porous flexible plates in the presence of a submerged porous structure. Meccanica 2023, 58, 1329–1346. [Google Scholar] [CrossRef]
  14. He, M.; Liang, D.; Ren, B.; Li, J.; Shao, S. Wave interactions with multi-float structures: SPH model, experimental validation, and parametric study. Coast. Eng. 2023, 184, 104333. [Google Scholar] [CrossRef]
  15. Cheng, X.; Liu, C.; Zhang, Q.; He, M.; Gao, X. Numerical study on the hydrodynamic characteristics of a double-row floating breakwater composed of a pontoon and an airbag. J. Mar. Sci. Eng. 2021, 9, 983. [Google Scholar] [CrossRef]
  16. Sujantoko; Djatmiko, E.B.; Wardhana, W.; Firmasyah, I.N.G. Numerical Modeling of Hydrodynamic Performance on Porous Slope Type Floating Breakwater. Nase More 2023, 70, 77–87. [Google Scholar] [CrossRef]
  17. Li, Y.; Zhao, D.; Yu, G.; Xie, L. Wave Height Attenuation over a Nature-Based Breakwater of Floating Emergent Vegetation. Sustainability 2023, 15, 10749. [Google Scholar] [CrossRef]
  18. Vogel, J.R.; O’Brien, M.; Diallo, S.; Graves, G.M.; Strevett, K.; Storm, D.; Patterson, S. Optimizing and Implementing Floating Wetland Breakwaters to Reduce Shoreline Erosion in Reservoirs. In Soil Erosion Research Under a Changing Climate, Aguadilla, PR, USA, 8–13 January 2023; ASABE: St. Joseph, MI, USA, 2023; p. 1. [Google Scholar] [CrossRef]
  19. Sun, B.; Zhang, H.; Li, C.; Li, Z. Research Progress and Prospect of Wave Attenuation Performance and Integration of Wave-Energy Converter of Floating Breakwater. J. Environ. Eng. 2023, 149, 03123001. [Google Scholar] [CrossRef]
  20. Krishna, K.R.A.; Karaseeri, A.G.; Karmakar, D. Oblique wave propagation through composite permeable porous structures. Mar. Syst. Ocean Technol. 2023, 17, 164–187. [Google Scholar] [CrossRef]
  21. Peng, N.N.; Lau, W.K.; Wai, O.W.H.; Chow, K.W. Computational and experimental studies of wave–structure interaction: Wave attenuation by a floating breakwater. Phys. Fluids 2023, 35, 45112. [Google Scholar] [CrossRef]
  22. Gayathri, R.; Khan, M.B.M.; Behera, H. Attenuation of wave force on a floating dock by multiple porous breakwaters. Eng. Anal. Bound. Elem. 2022, 143, 70–89. [Google Scholar] [CrossRef]
  23. Sawant, R.; Barve, K.H.; Ranganath, L.R.; Agrawal, J.D. A Numerical Approach for the Efficiency of Submerged Breakwater to Reduce Wave Impact on an Eroding Beach Adjacent to Estuary BT—Coastal, Harbour and Ocean Engineering. In Coastal, Harbour and Ocean Engineering. HYDRO 2021; Timbadiya, P.V., Deo, M.C., Singh, V.P., Eds.; Lecture Notes in Civil Engineering; Springer: Singapore, 2023; Volume 321, pp. 75–88. [Google Scholar]
  24. McCartney, B.; ASCE, M. Floating Breakwater Design. J. Waterw. Port Coast. Ocean Eng. 1985, 111, 304–318. [Google Scholar] [CrossRef]
  25. Sannasiraj, S.A.; Sundar, V.; Sundaravadivelu, R. Mooring forces and motion responses of pontoon-type floating breakwaters. Ocean Eng. 1998, 25, 27–48. [Google Scholar] [CrossRef]
  26. Lee, H.H.; Chen, L.-Y.; Weng, W.-K.; Shyue, S.-W. The prediction of the dynamic and structural motions of a floating-pier system in waves. Ocean Eng. 2007, 34, 1044–1059. [Google Scholar] [CrossRef]
  27. Wang, H.Y.; Sun, Z.C. Experimental study of a porous floating breakwater. Ocean Eng. 2010, 37, 520–527. [Google Scholar] [CrossRef]
  28. Peña, E.; Ferreras, J.; Sanchez-Tembleque, F. Experimental study on wave transmission coefficient, mooring lines and module connector forces with different designs of floating breakwaters. Ocean Eng. 2011, 38, 1150–1160. [Google Scholar] [CrossRef]
  29. He, F.; Huang, Z.; Law, A.W.-K. Hydrodynamic performance of a rectangular floating breakwater with and without pneumatic chambers: An experimental study. Ocean Eng. 2012, 51, 16–27. [Google Scholar] [CrossRef]
  30. Martin, T.; Kamath, A.; Bihs, H. Numerical simulation of interactions between water waves and a moored-floating breakwater. Coast. Eng. Proc. 2018, 1, 105. [Google Scholar] [CrossRef]
  31. Cho, I.-H. Transmission coefficients of a floating rectangular breakwater with porous side plates. Int. J. Nav. Archit. Ocean Eng. 2016, 8, 53–65. [Google Scholar] [CrossRef]
  32. Peng, W.; Lee, K.-H.; Shin, S.-H.; Mizutani, N. Numerical simulation of interactions between water waves and inclined moored submerged floating breakwaters. Coast. Eng. 2013, 82, 76–87. [Google Scholar] [CrossRef]
  33. Sannasiraj, S.A.; Sundar, V.; Sundaravadivelu, R. Wave transmission characteristics of a floating breakwater. Coast. Eng. 1996, 29, 137–153. [Google Scholar]
  34. Kim, D.S.; Kim, Y.J.; Kim, Y.S. Numerical study on the wave transmission characteristics of a floating breakwater. Ocean Eng. 2002, 29, 189–205. [Google Scholar]
  35. Kim, D.S.; Kim, Y.J.; Kim, Y.S. Wave transmission characteristics of a trapezoidal floating breakwater. Coast. Eng. 2004, 51, 563–579. [Google Scholar]
  36. Sannasiraj, S.A.; Sundar, V.; Sundaravadivelu, R. Wave transmission characteristics of a floating breakwater with a porous barrier. Ocean Eng. 2006, 33, 677–692. [Google Scholar]
  37. Kim, D.S.; Kim, Y.J.; Kim, Y.S. Experimental study on the wave transmission characteristics of a floating breakwater with a perforated barrier. Coast. Eng. 2008, 55, 1136–1150. [Google Scholar]
  38. Sannasiraj, S.A.; Sundar, V.; Sundaravadivelu, R. Wave transmission characteristics of a floating breakwater with a sloping front face. Ocean Eng. 2010, 37, 623–636. [Google Scholar]
  39. Kim, D.S.; Kim, Y.J.; Kim, Y.S. Numerical investigation on the wave transmission characteristics of a floating breakwater with a sloping front face. Coast. Eng. 2012, 65, 1–15. [Google Scholar]
  40. Sannasiraj, S.A.; Sundar, V.; Sundaravadivelu, R. Wave transmission characteristics of a floating breakwater with a wave absorber. Ocean Eng. 2014, 87, 1–14. [Google Scholar]
  41. Kim, D.S.; Kim, Y.J.; Kim, Y.S. Experimental study on the wave transmission characteristics of a floating breakwater with a wave absorber. Coast. Eng. 2016, 111, 1–14. [Google Scholar]
  42. Sannasiraj, S.A.; Sundar, V.; Sundaravadivelu, R. Wave transmission characteristics of a floating breakwater with a wave reflector. Ocean Eng. 2018, 158, 1–13. [Google Scholar]
  43. Lin, P. Numerical Modeling of Water Waves; CRC Press: Boca Raton, FL, USA, 2008. [Google Scholar]
  44. Jin, J. A Mixed Mode Function-Boundary Element Method for Very Large Floating Structure-Water Interaction Systems Excited by Airplane Landing Impacts. Doctoral Dissertation, University of Southampton, Southampton, UK, 2007. [Google Scholar]
  45. Barltrop, N.D. Floating Structures: A Guide for Design and Analysis, Vol. 1 and 2, Centre for Marine and Petroleum Technology; Oilfield Publications Ltd.: Herefordshire, UK, 1998; ISBN 1870553357. [Google Scholar]
  46. Newman, J.N. The theory of ship motions. Adv. Appl. Mech. 1979, 18, 221–283. [Google Scholar]
  47. Havelock, T.H. Waves due to a floating sphere making periodic heaving oscillations. Proc. R. Soc. Lond. Ser. A Math. Phys. Sci. 1955, 231, 1–7. [Google Scholar]
  48. Cummins, W.E. Le Impulse Response Function and Ship Motions (No. DTMB-1661); David Taylor Model Basin: Washington, DC, USA, 1962. [Google Scholar]
  49. Duan, W.; Xu, S.; Xu, Q.; Ertekin, R.C.; Ma, S. Performance of an F-type floating breakwater: A numerical and experimental study. Proc. Inst. Mech. Eng. Part M J. Eng. Marit. Environ. 2017, 231, 583–599. [Google Scholar] [CrossRef]
  50. Ji, C.; Deng, X.; Cheng, Y. An experimental study of double-row floating breakwaters. J. Mar. Sci. Technol. 2019, 24, 359–371. [Google Scholar] [CrossRef]
Figure 1. Propagating harmonic sine wave.
Water 16 01779 g001
Figure 2. Degrees of freedom of translations and rotations of a pontoon-type floating breakwater.
Water 16 01779 g002
Figure 3. Definition sketch for theoretical analysis.
Water 16 01779 g003
Figure 4. Sketch of wave-energy transmission around FBW.
Water 16 01779 g004
Figure 5. Schematic diagram of wing-plate floating breakwater.
Water 16 01779 g005
Figure 6. Single-part model of a floating breakwater.
Water 16 01779 g006
Figure 7. Multi-part model for buoys of a floating breakwater.
Water 16 01779 g007
Figure 8. Sketch of single-row FB [50].
Water 16 01779 g008
Figure 9. Comparison of experimental and numerical results.
Water 16 01779 g009
Figure 10. Different motion tests on the model breakwater (Wave amplitude = 1.0 m, wave heading = 90°).
Water 16 01779 g010
Figure 11. Time response of the RAO motion for the FBW at period 10 s.
Water 16 01779 g011
Figure 12. Time response of mooring force for the FBW.
Water 16 01779 g012
Figure 13. Time response of the RAO motion for the FBW at period 12 s.
Water 16 01779 g013
Figure 14. Point of location.
Water 16 01779 g014
Figure 15. Wave-transmission coefficients at point 1 and point 2.
Water 16 01779 g015
Figure 16. Wave pattern contour around FBW.
Water 16 01779 g016
Figure 17. Design of different wave directions.
Water 16 01779 g017
Figure 18. Double-cross type position of fenders of multi-body composite floating breakwater.
Water 16 01779 g018
Figure 19. Connection mode and analysis of anchor cable in floating breakwater modules.
Water 16 01779 g019
Figure 20. Double-cross type.
Water 16 01779 g020
Figure 21. Connecting cable stress curve of anchor cable in floating breakwater modules.
Water 16 01779 g021
Figure 22. Pneumatic rubber fenders hydrodynamic model.
Water 16 01779 g022
Figure 23. Connecting cable stress curve.
Water 16 01779 g023
Figure 24. Single-cross type position of fenders of multi-body composite floating breakwater.
Water 16 01779 g024
Table 1. Buoy’s main dimensions.
DimensionValue
Length60 m
Beam10 m
Depth4.21 m
Draft3 m
Radius of gyration, Rxx17.6 m
Radius of gyration, Ryy3.1 m
Radius of gyration, Rzz17.6 m
Table 2. Force on different lines at connection point.
H = 1.0 mLine Force [N]
Wave DirectionLine 1Line 2Line 3Line 4
45467,800488,400470,400423,800
9069,33096,30085,30068,290
135458,500386,600409,300411,000
Table 3. Force table by fender of parallel type.
H = 1.0 mFender Force [N]
Wave DirectionFender 1Fender 2Fender 3Fender 4
451,506,0001,936,0001,802,0001,673,000
9069,00048,70048,950186,900
1351,747,0001,917,0002,166,0001,428,000
Table 4. A comprehensive force analysis for a fender system.
H = 1.0 mLine Force [N]
Wave DirectionLine 1Line 2Line 3Line 4
45245,000232,000283,900210,000
90670012,00087006600
135175,000277,000248,800186,600
Table 5. Force table by fender with different wave directions.
H = 1.0 mFender Force [N]
Wave DirectionFender 1Fender 2Fender 3Fender 4
452,138,0002,125,0002,141,0002,580,000
90252,500276,200272,900252,100
1352,652,0002,538,0002,970,0001,894,000
Table 6. Effect of wave direction on line force.
H = 1.0 mLine Force [N]
Wave DirectionLine 1Line 2Line 3Line 4
45598,800834,000873,900602,200
90123,300129,900126,300130,600
135541,200720,900731,400755,500
Disclaimer/Publisher’s Note: The statements, opinions and data contained in all publications are solely those of the individual author(s) and contributor(s) and not of MDPI and/or the editor(s). MDPI and/or the editor(s) disclaim responsibility for any injury to people or property resulting from any ideas, methods, instructions or products referred to in the content.