
Spillway Capacity Estimation Using Flood Peak Analysis and Probable Maximum Flood Method
 ,
,
Abstract
1. Introduction
2. Materials and Methods
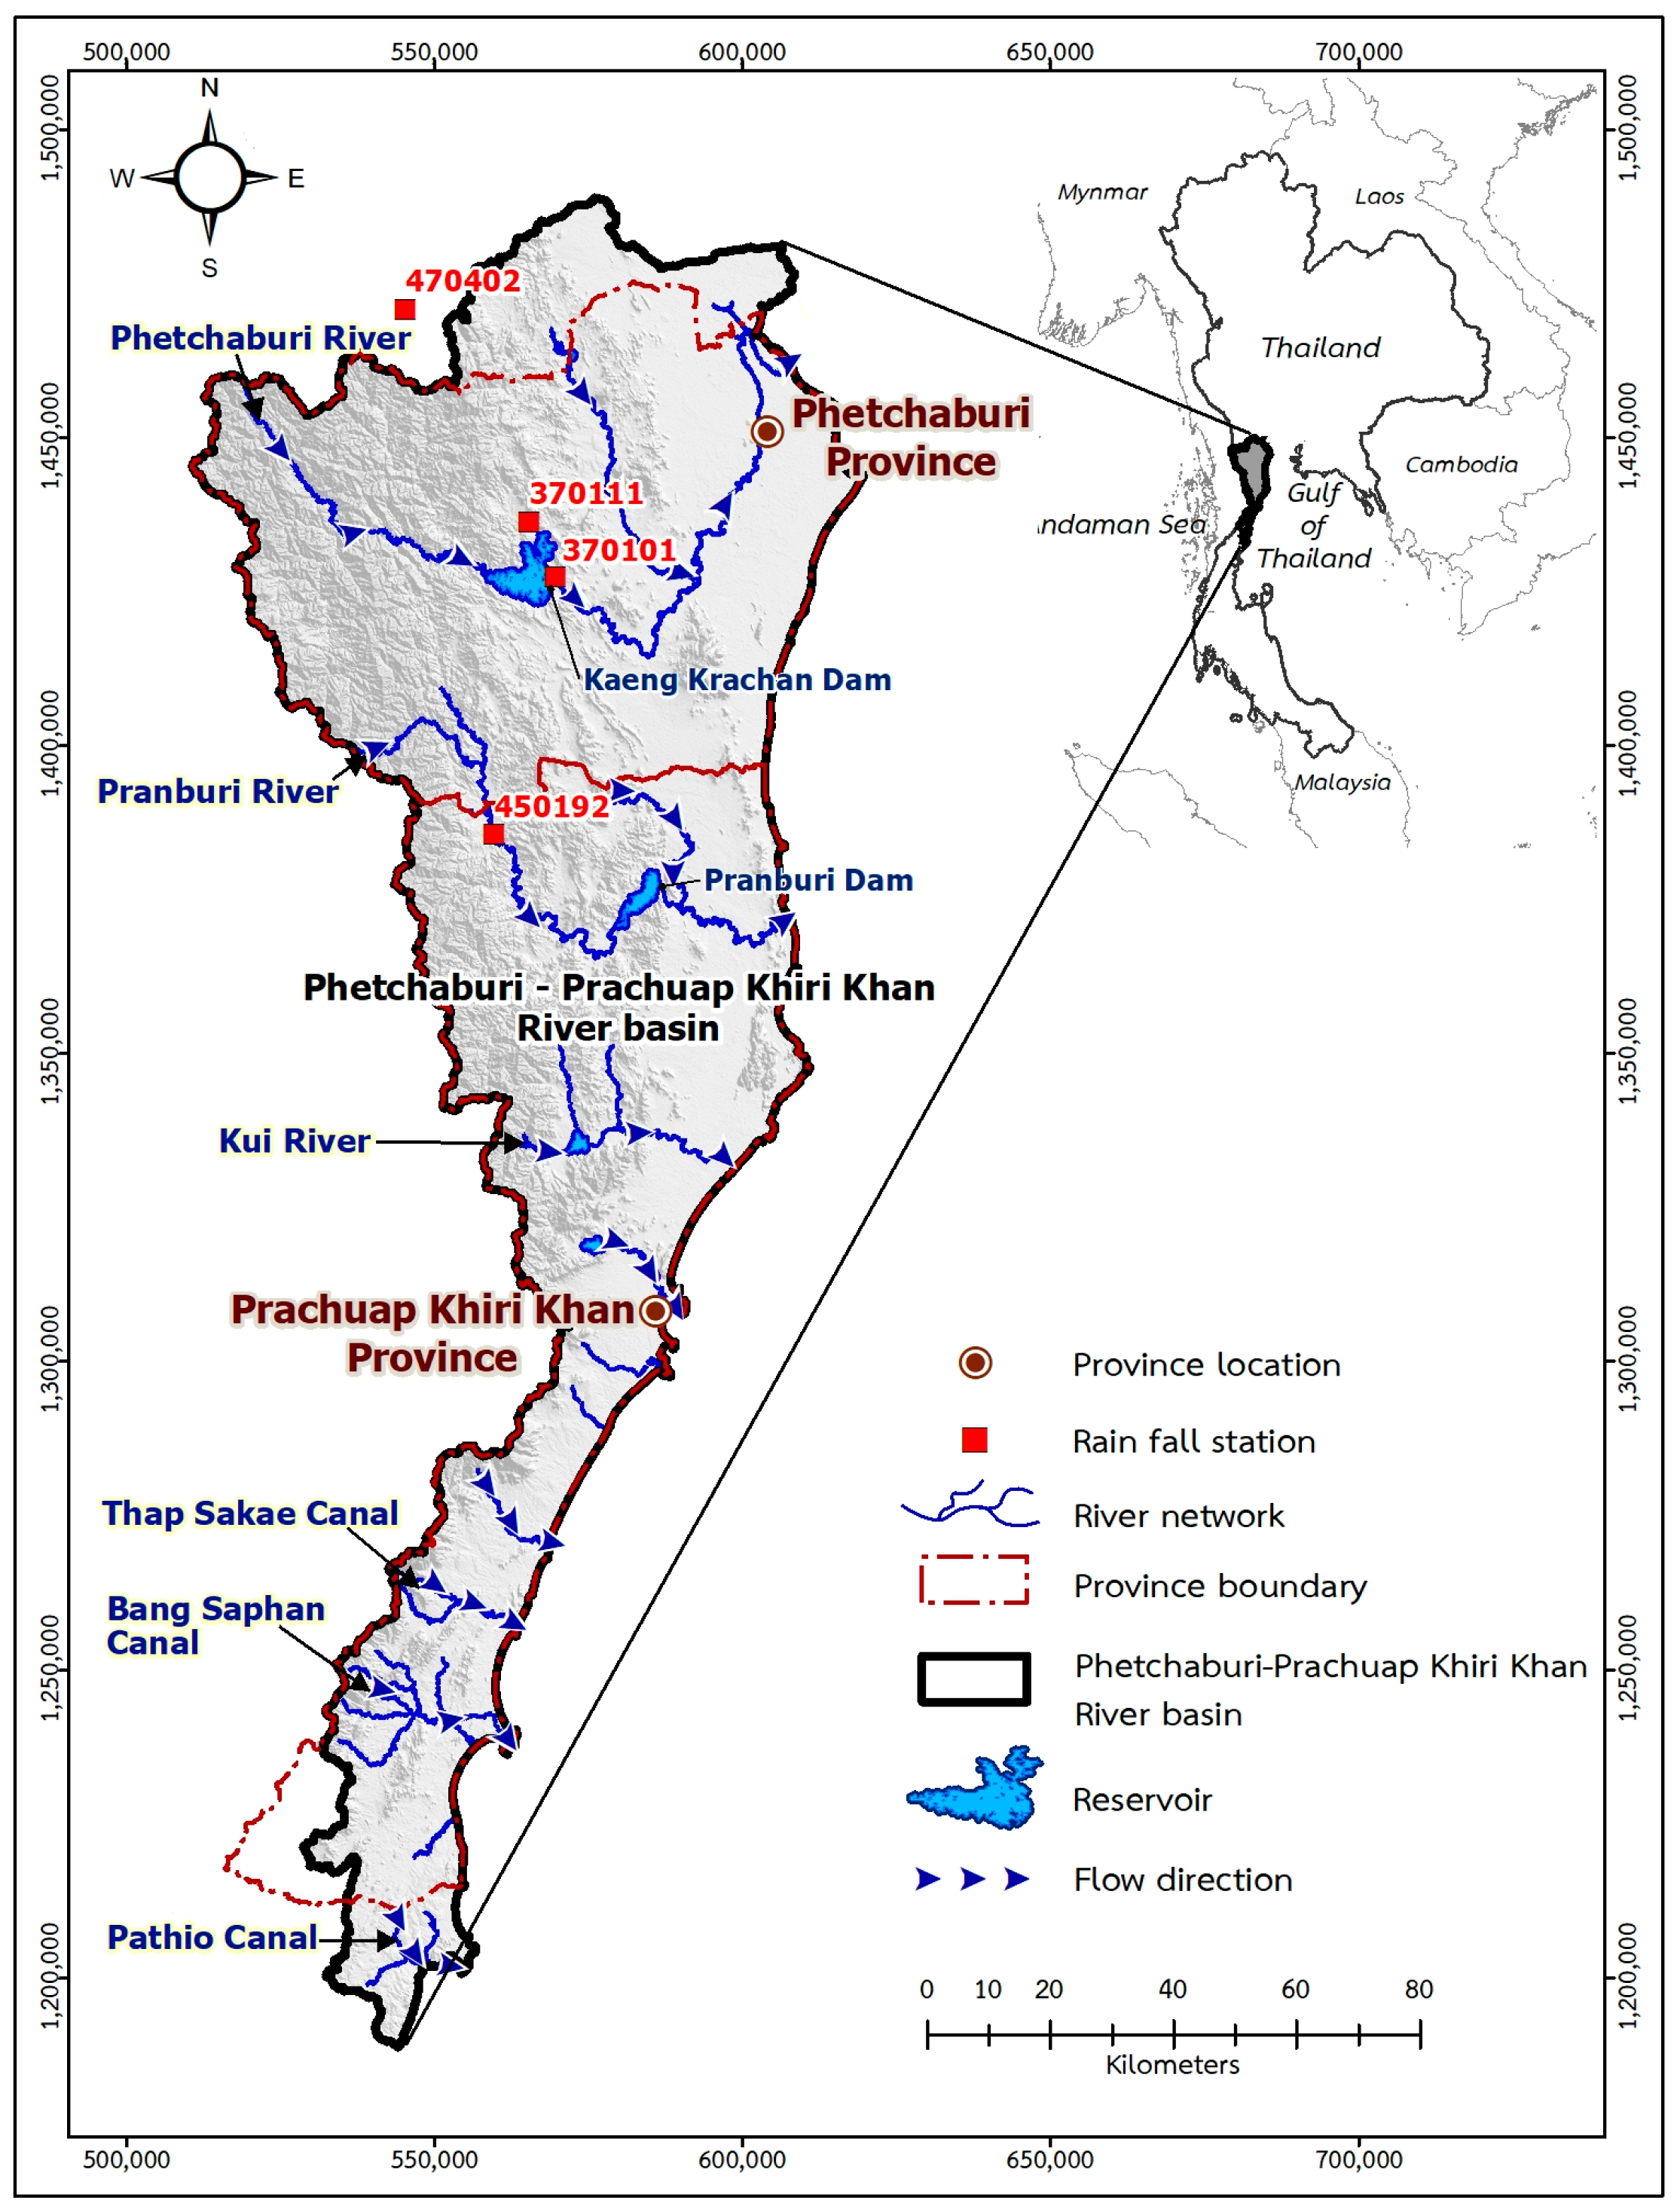
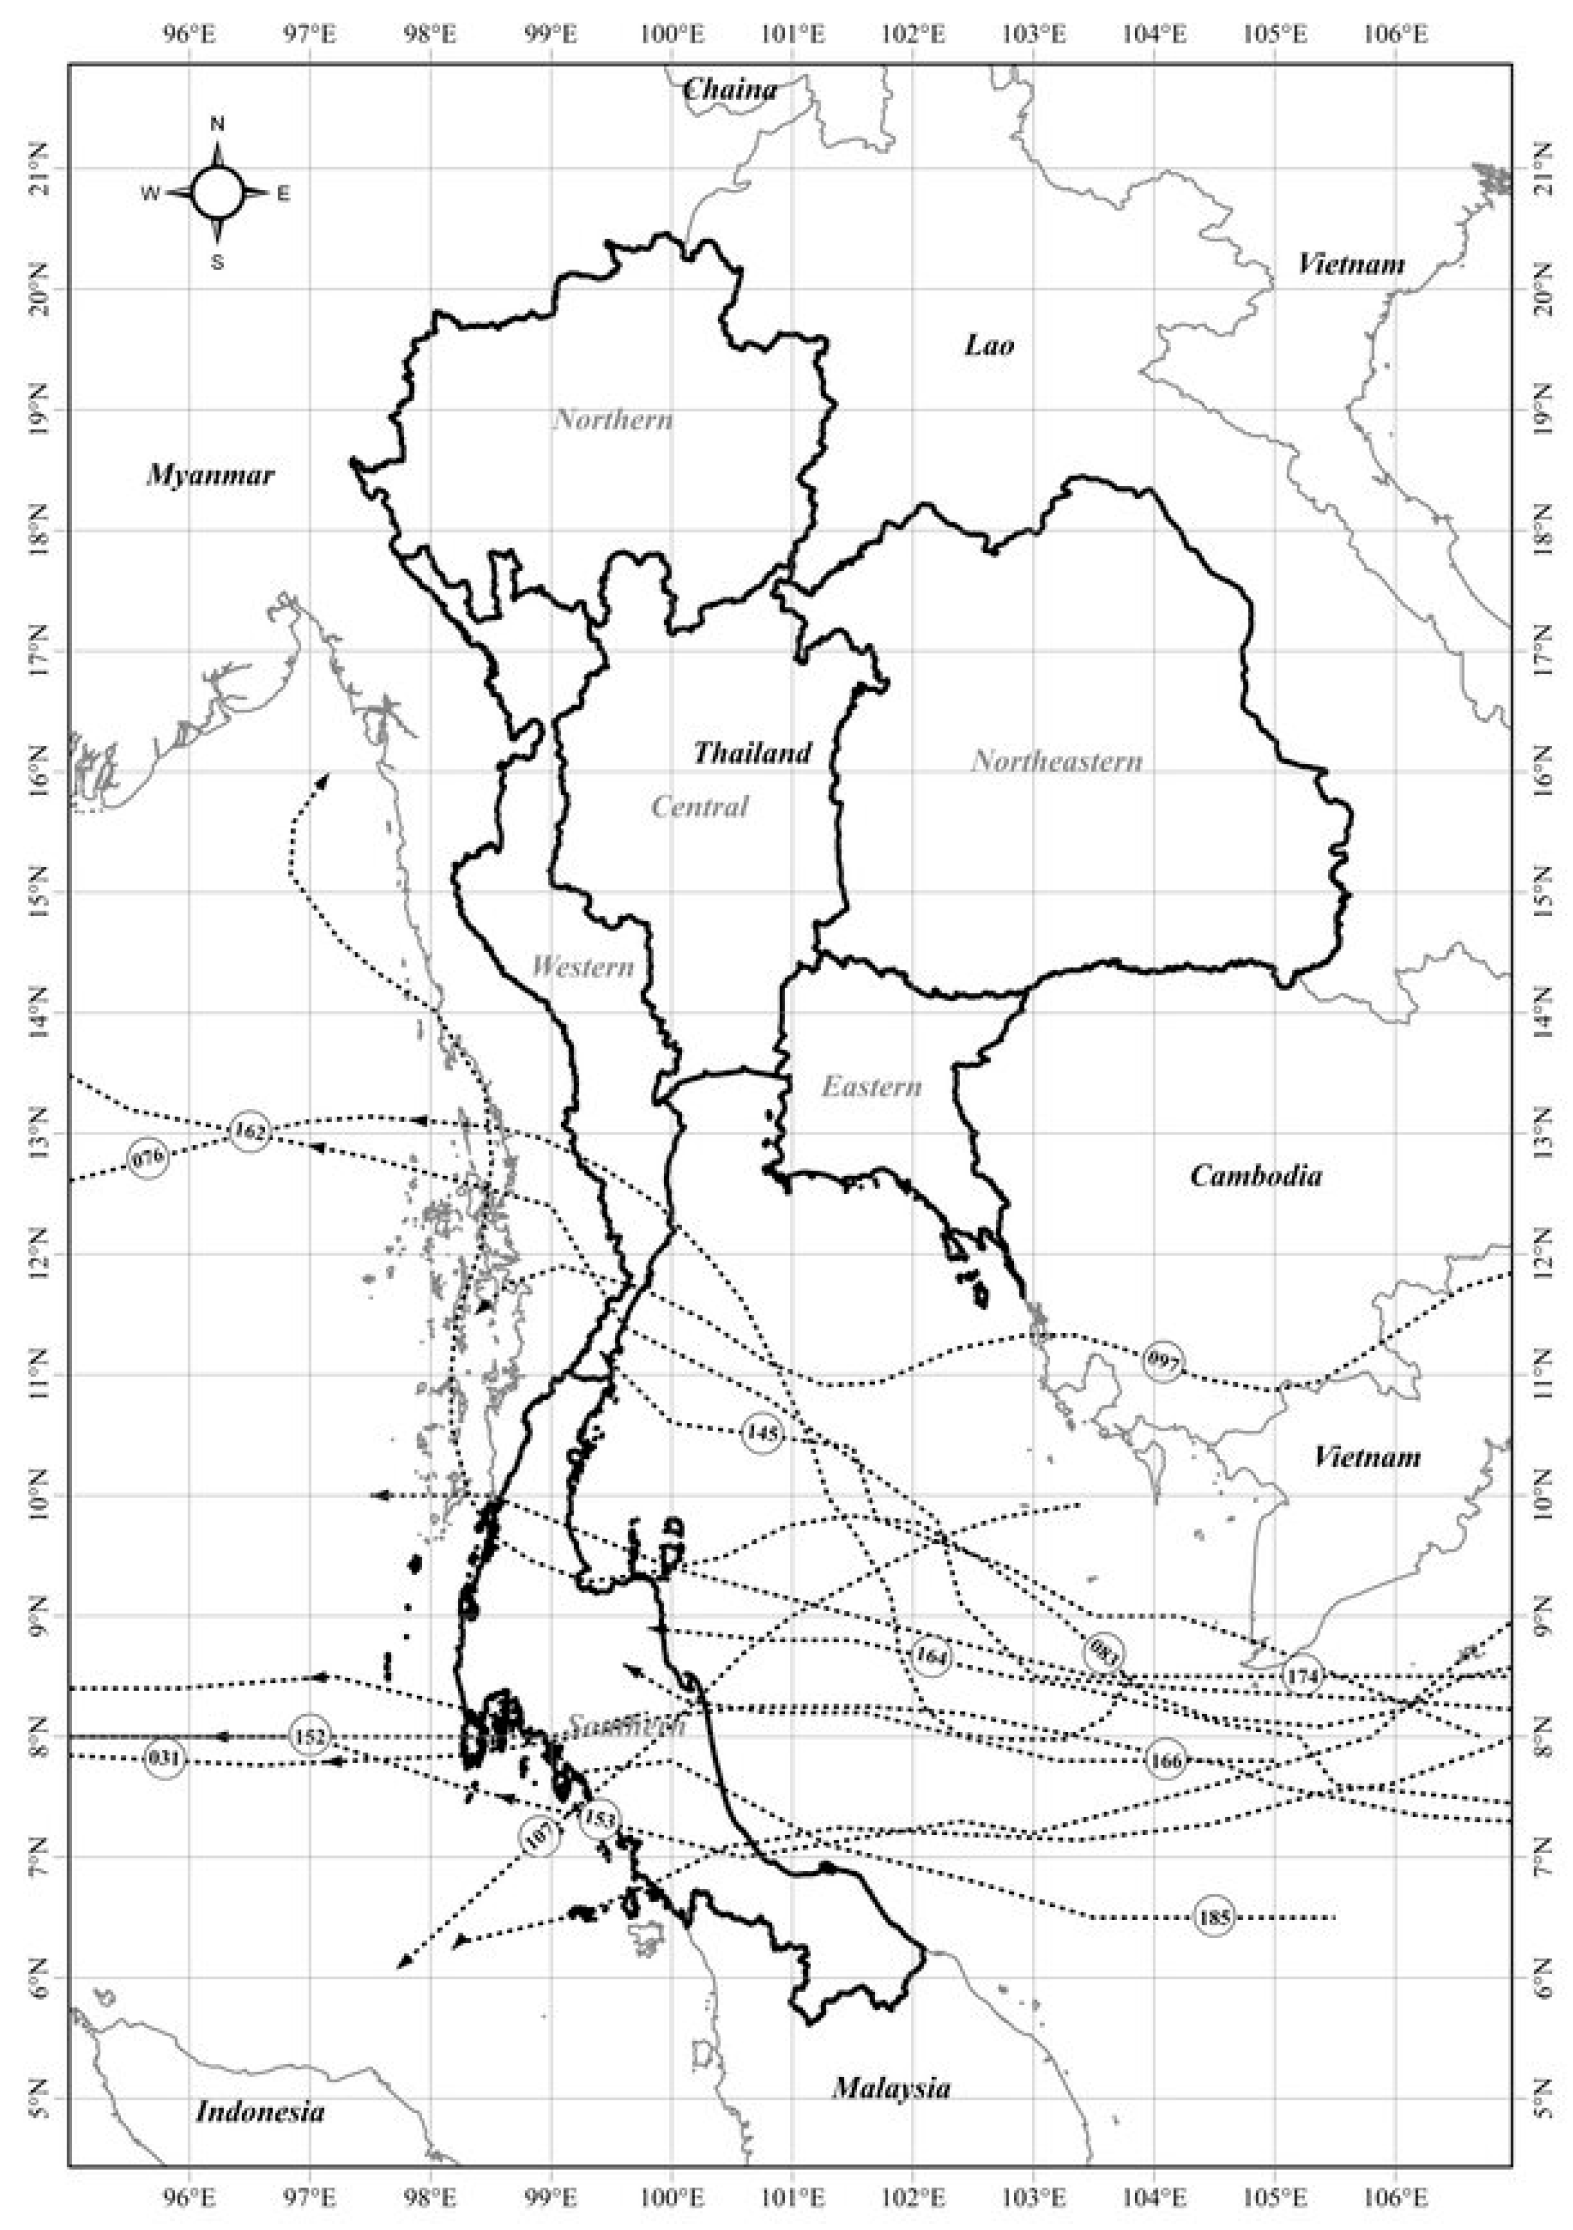
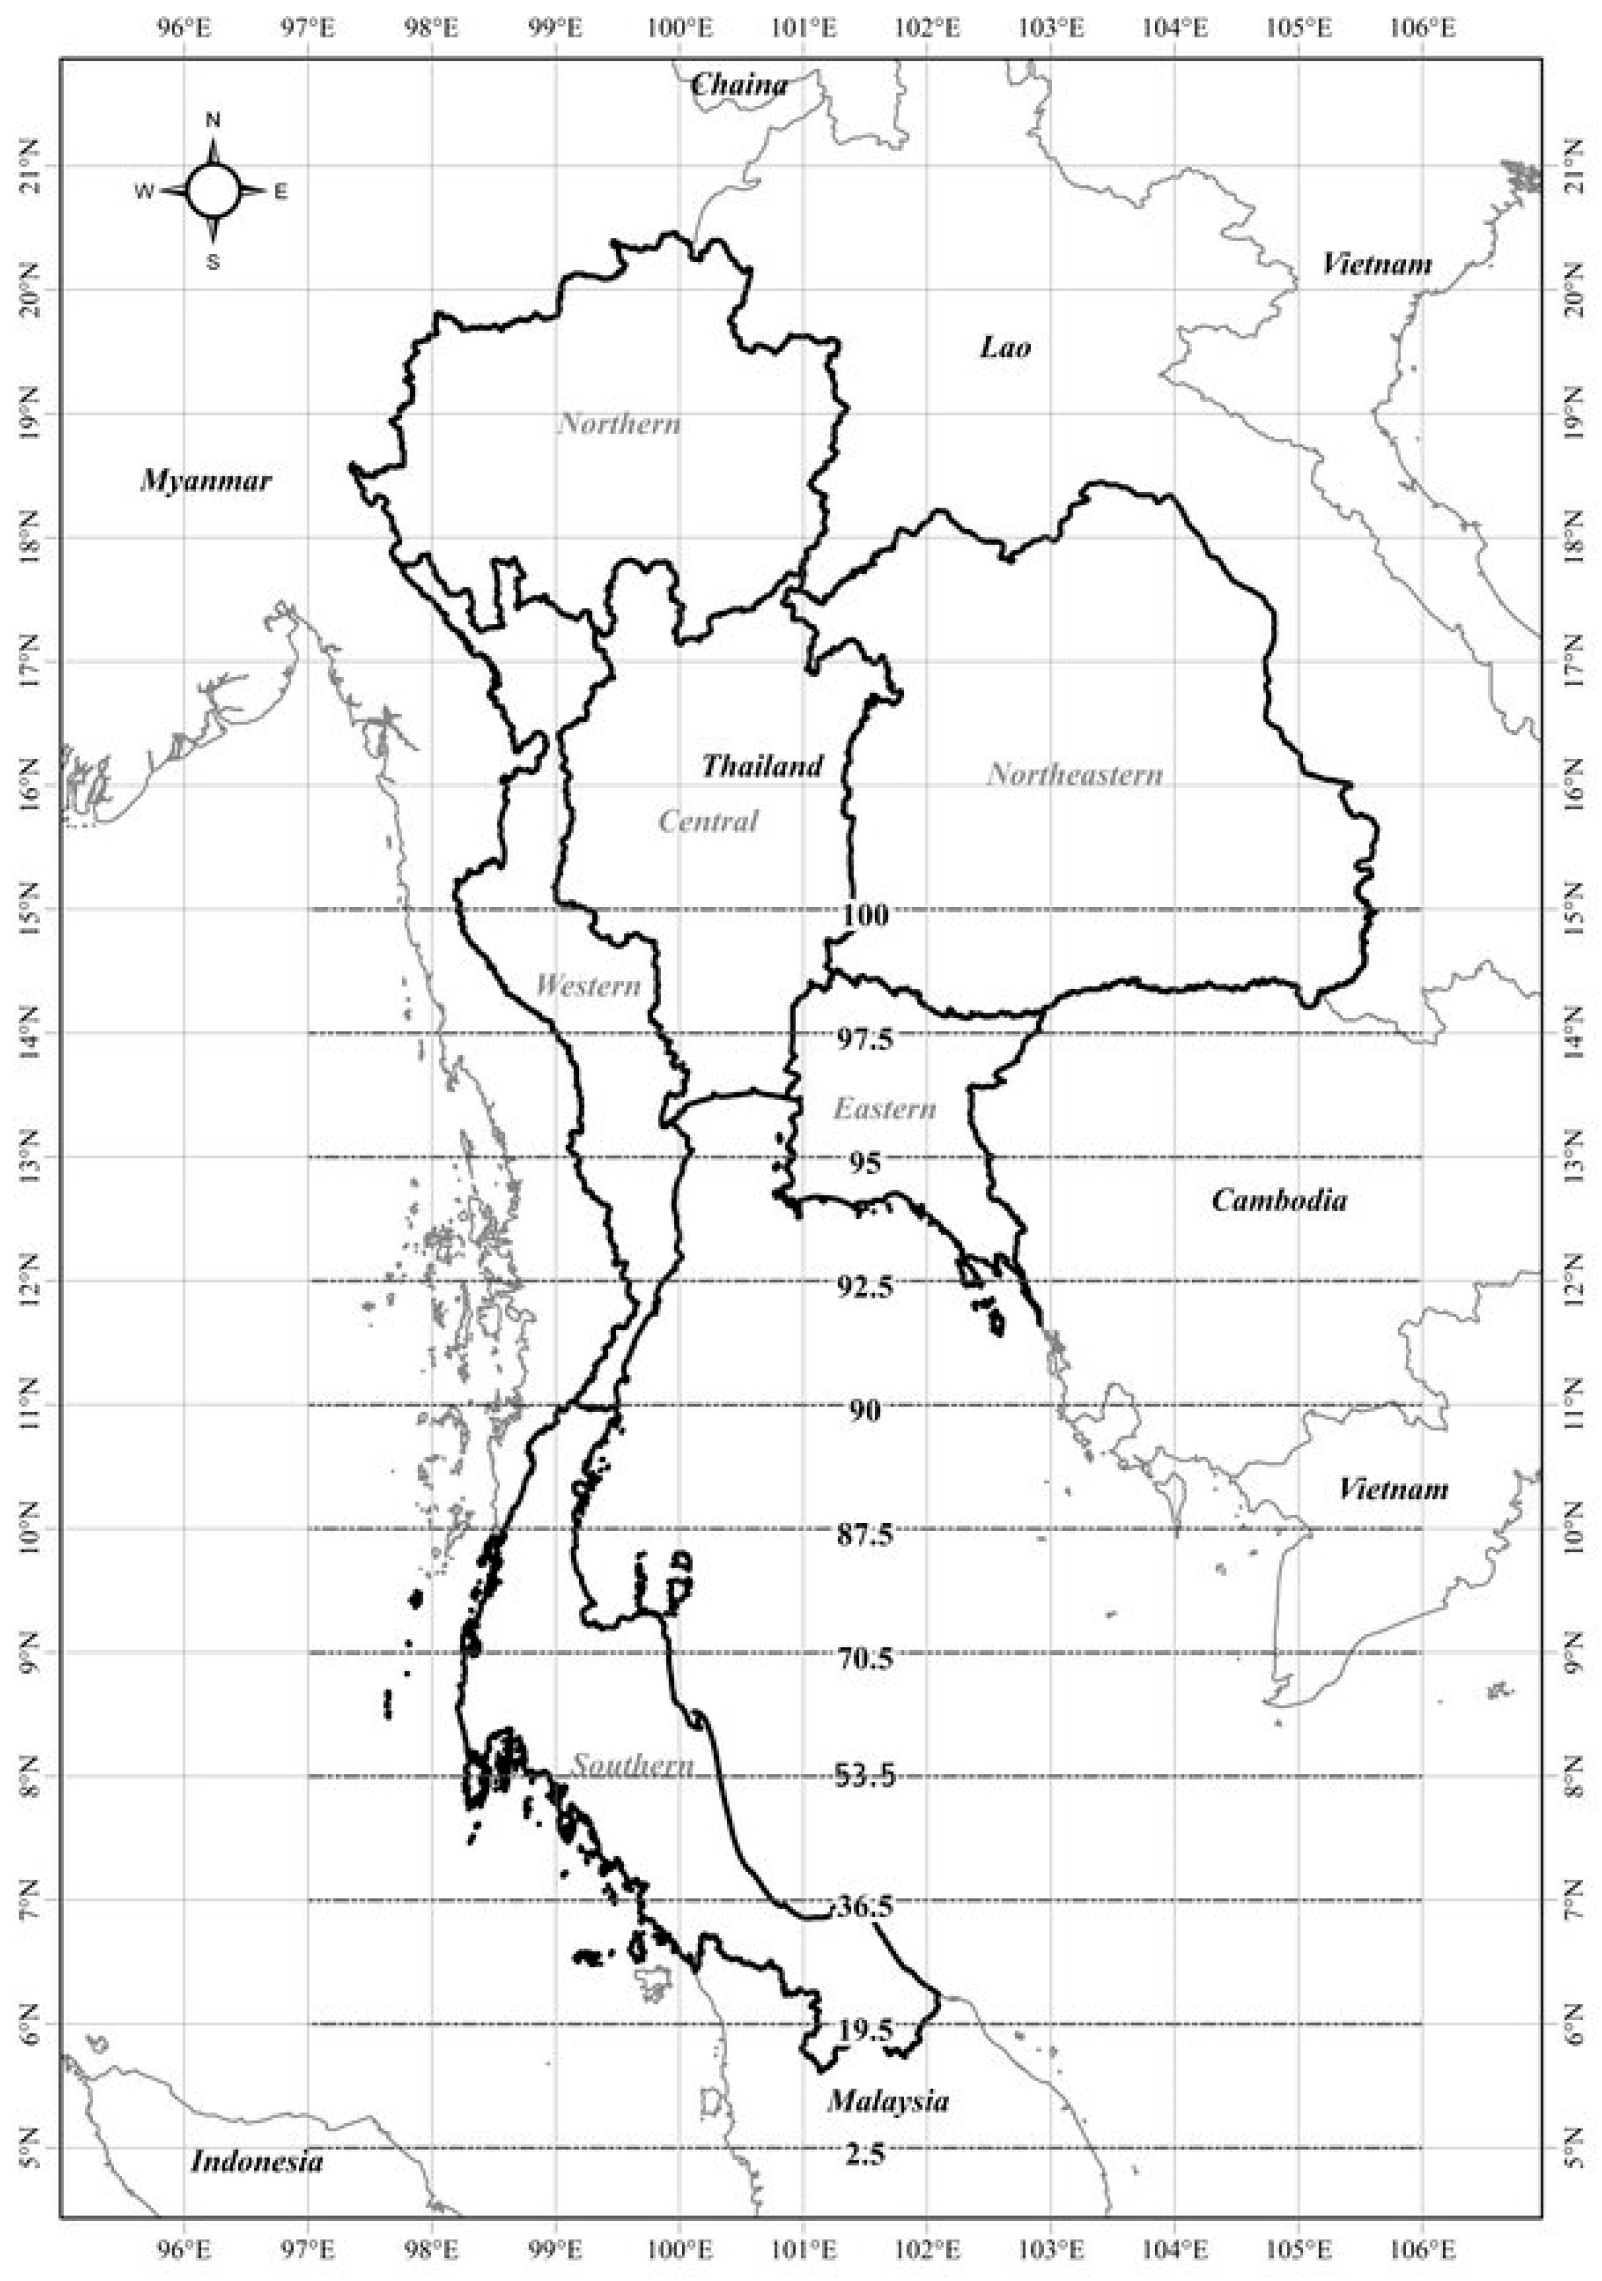
2.1. Study Area
2.2. Methodology
2.2.1. The Analysis of Maximum Rainfall at Different Return Periods
2.2.2. The Analysis of Probable Maximum Precipitation (PMP)
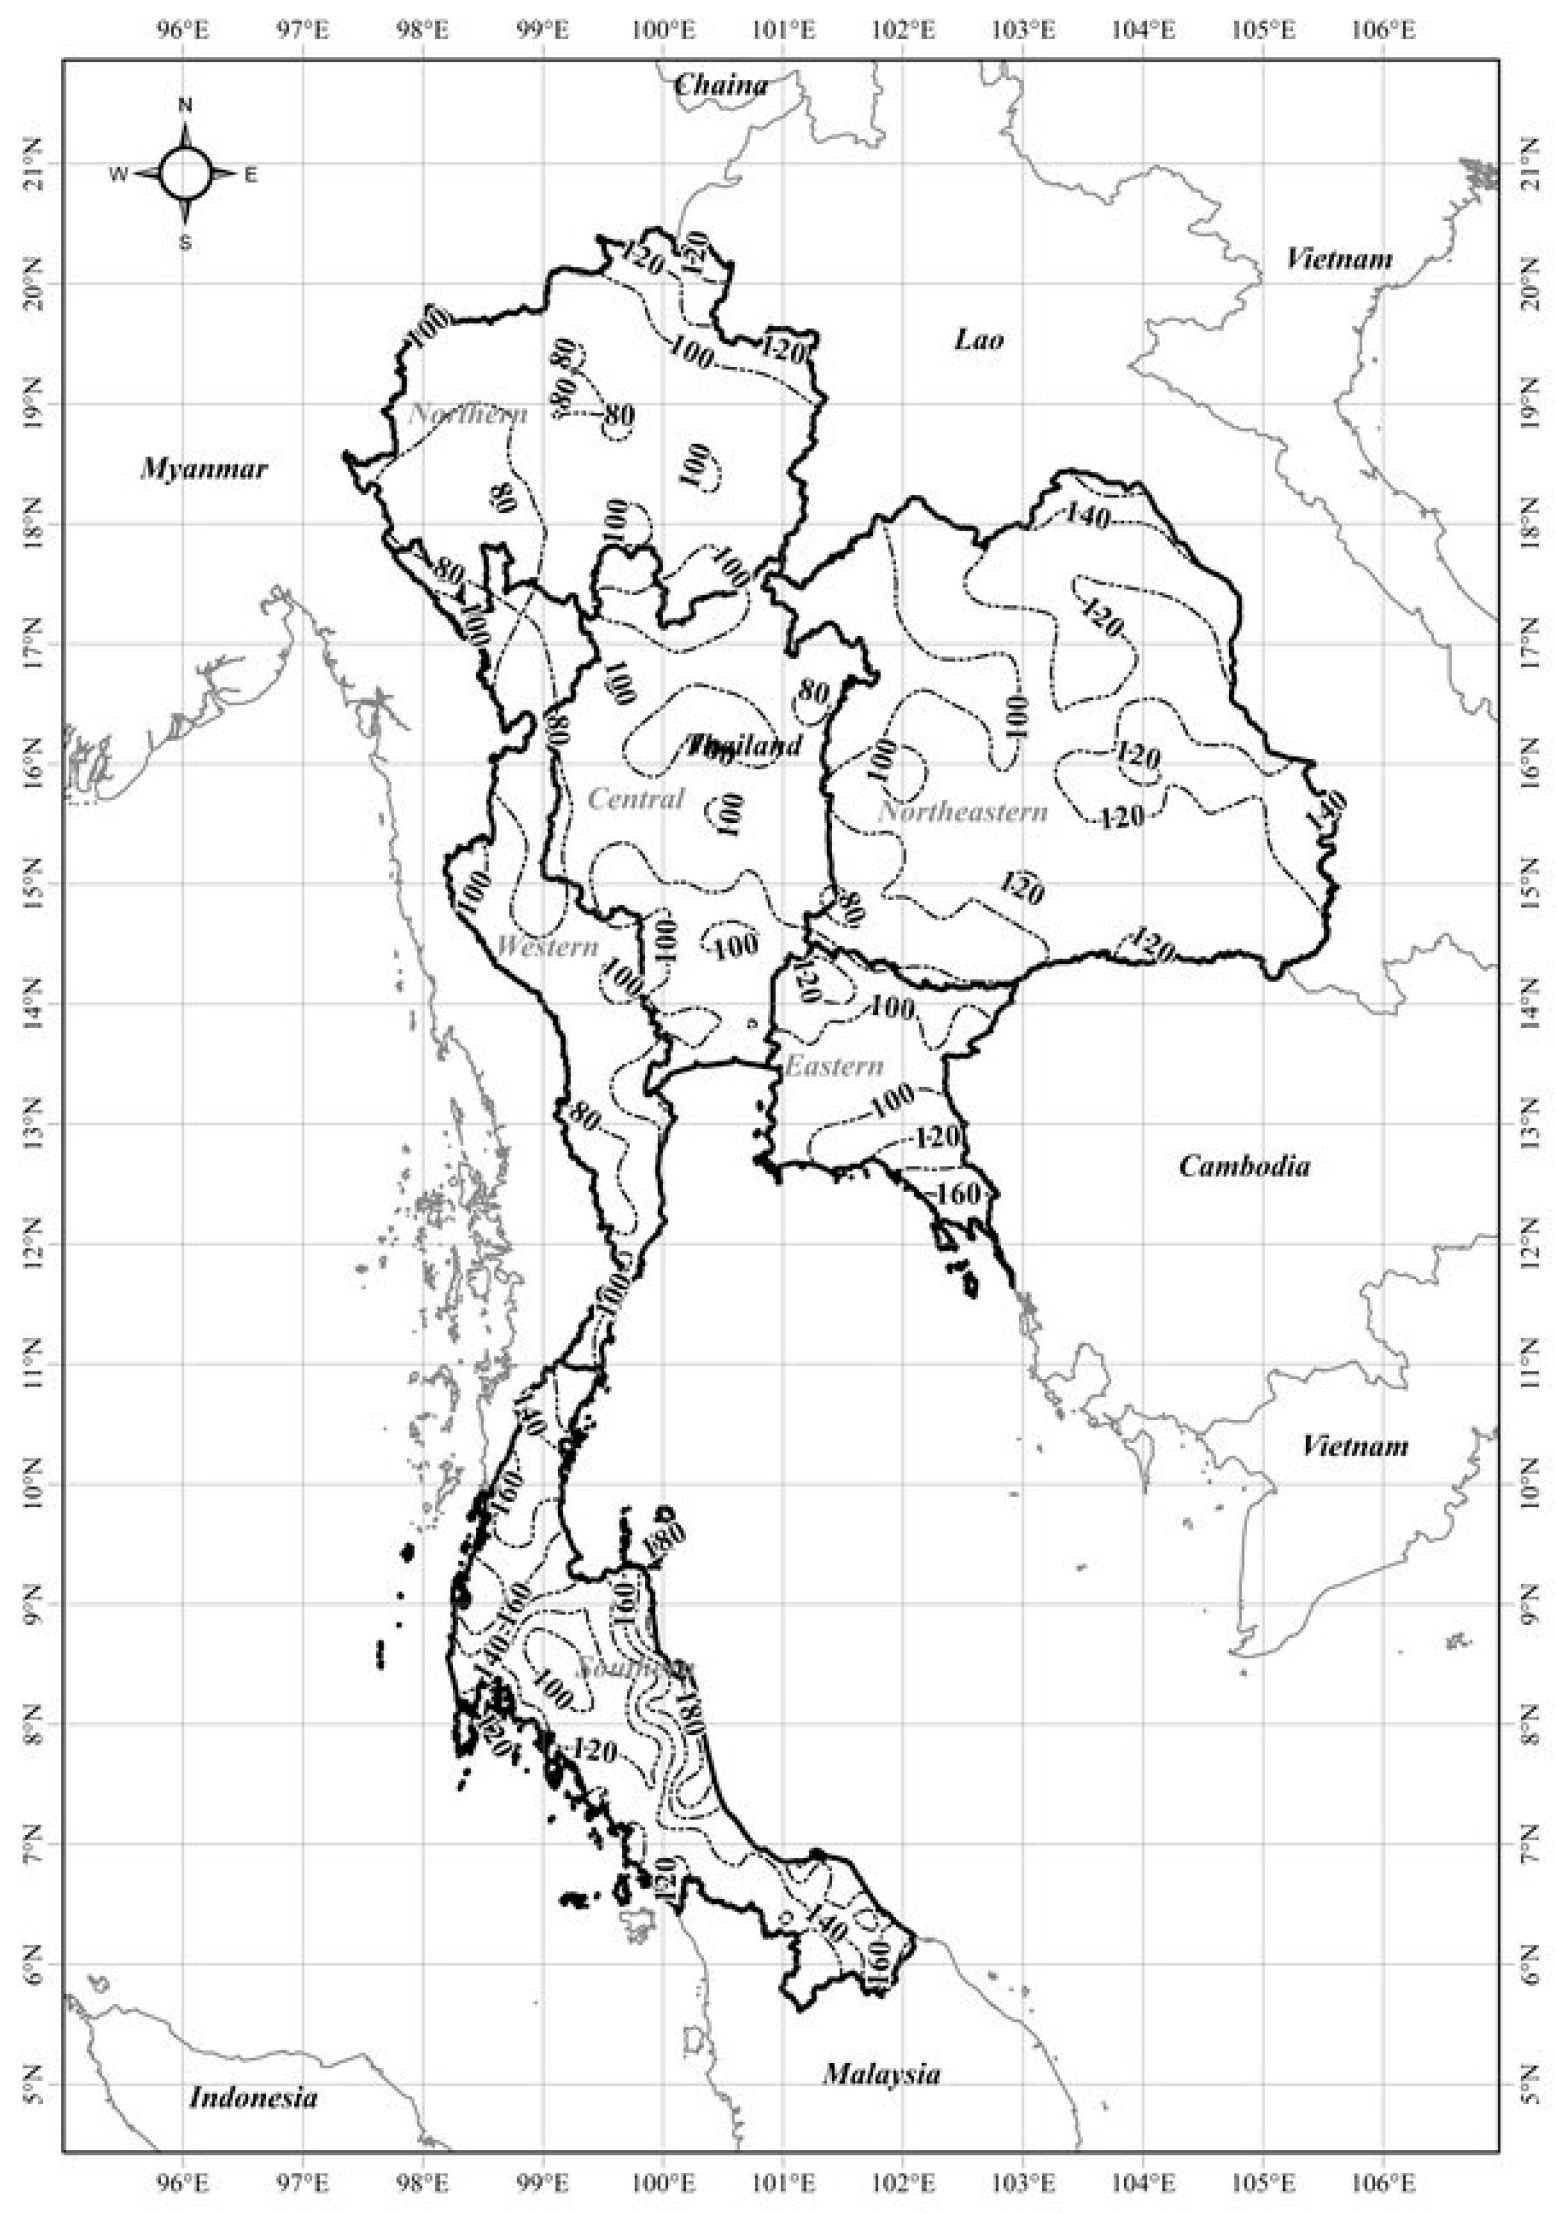
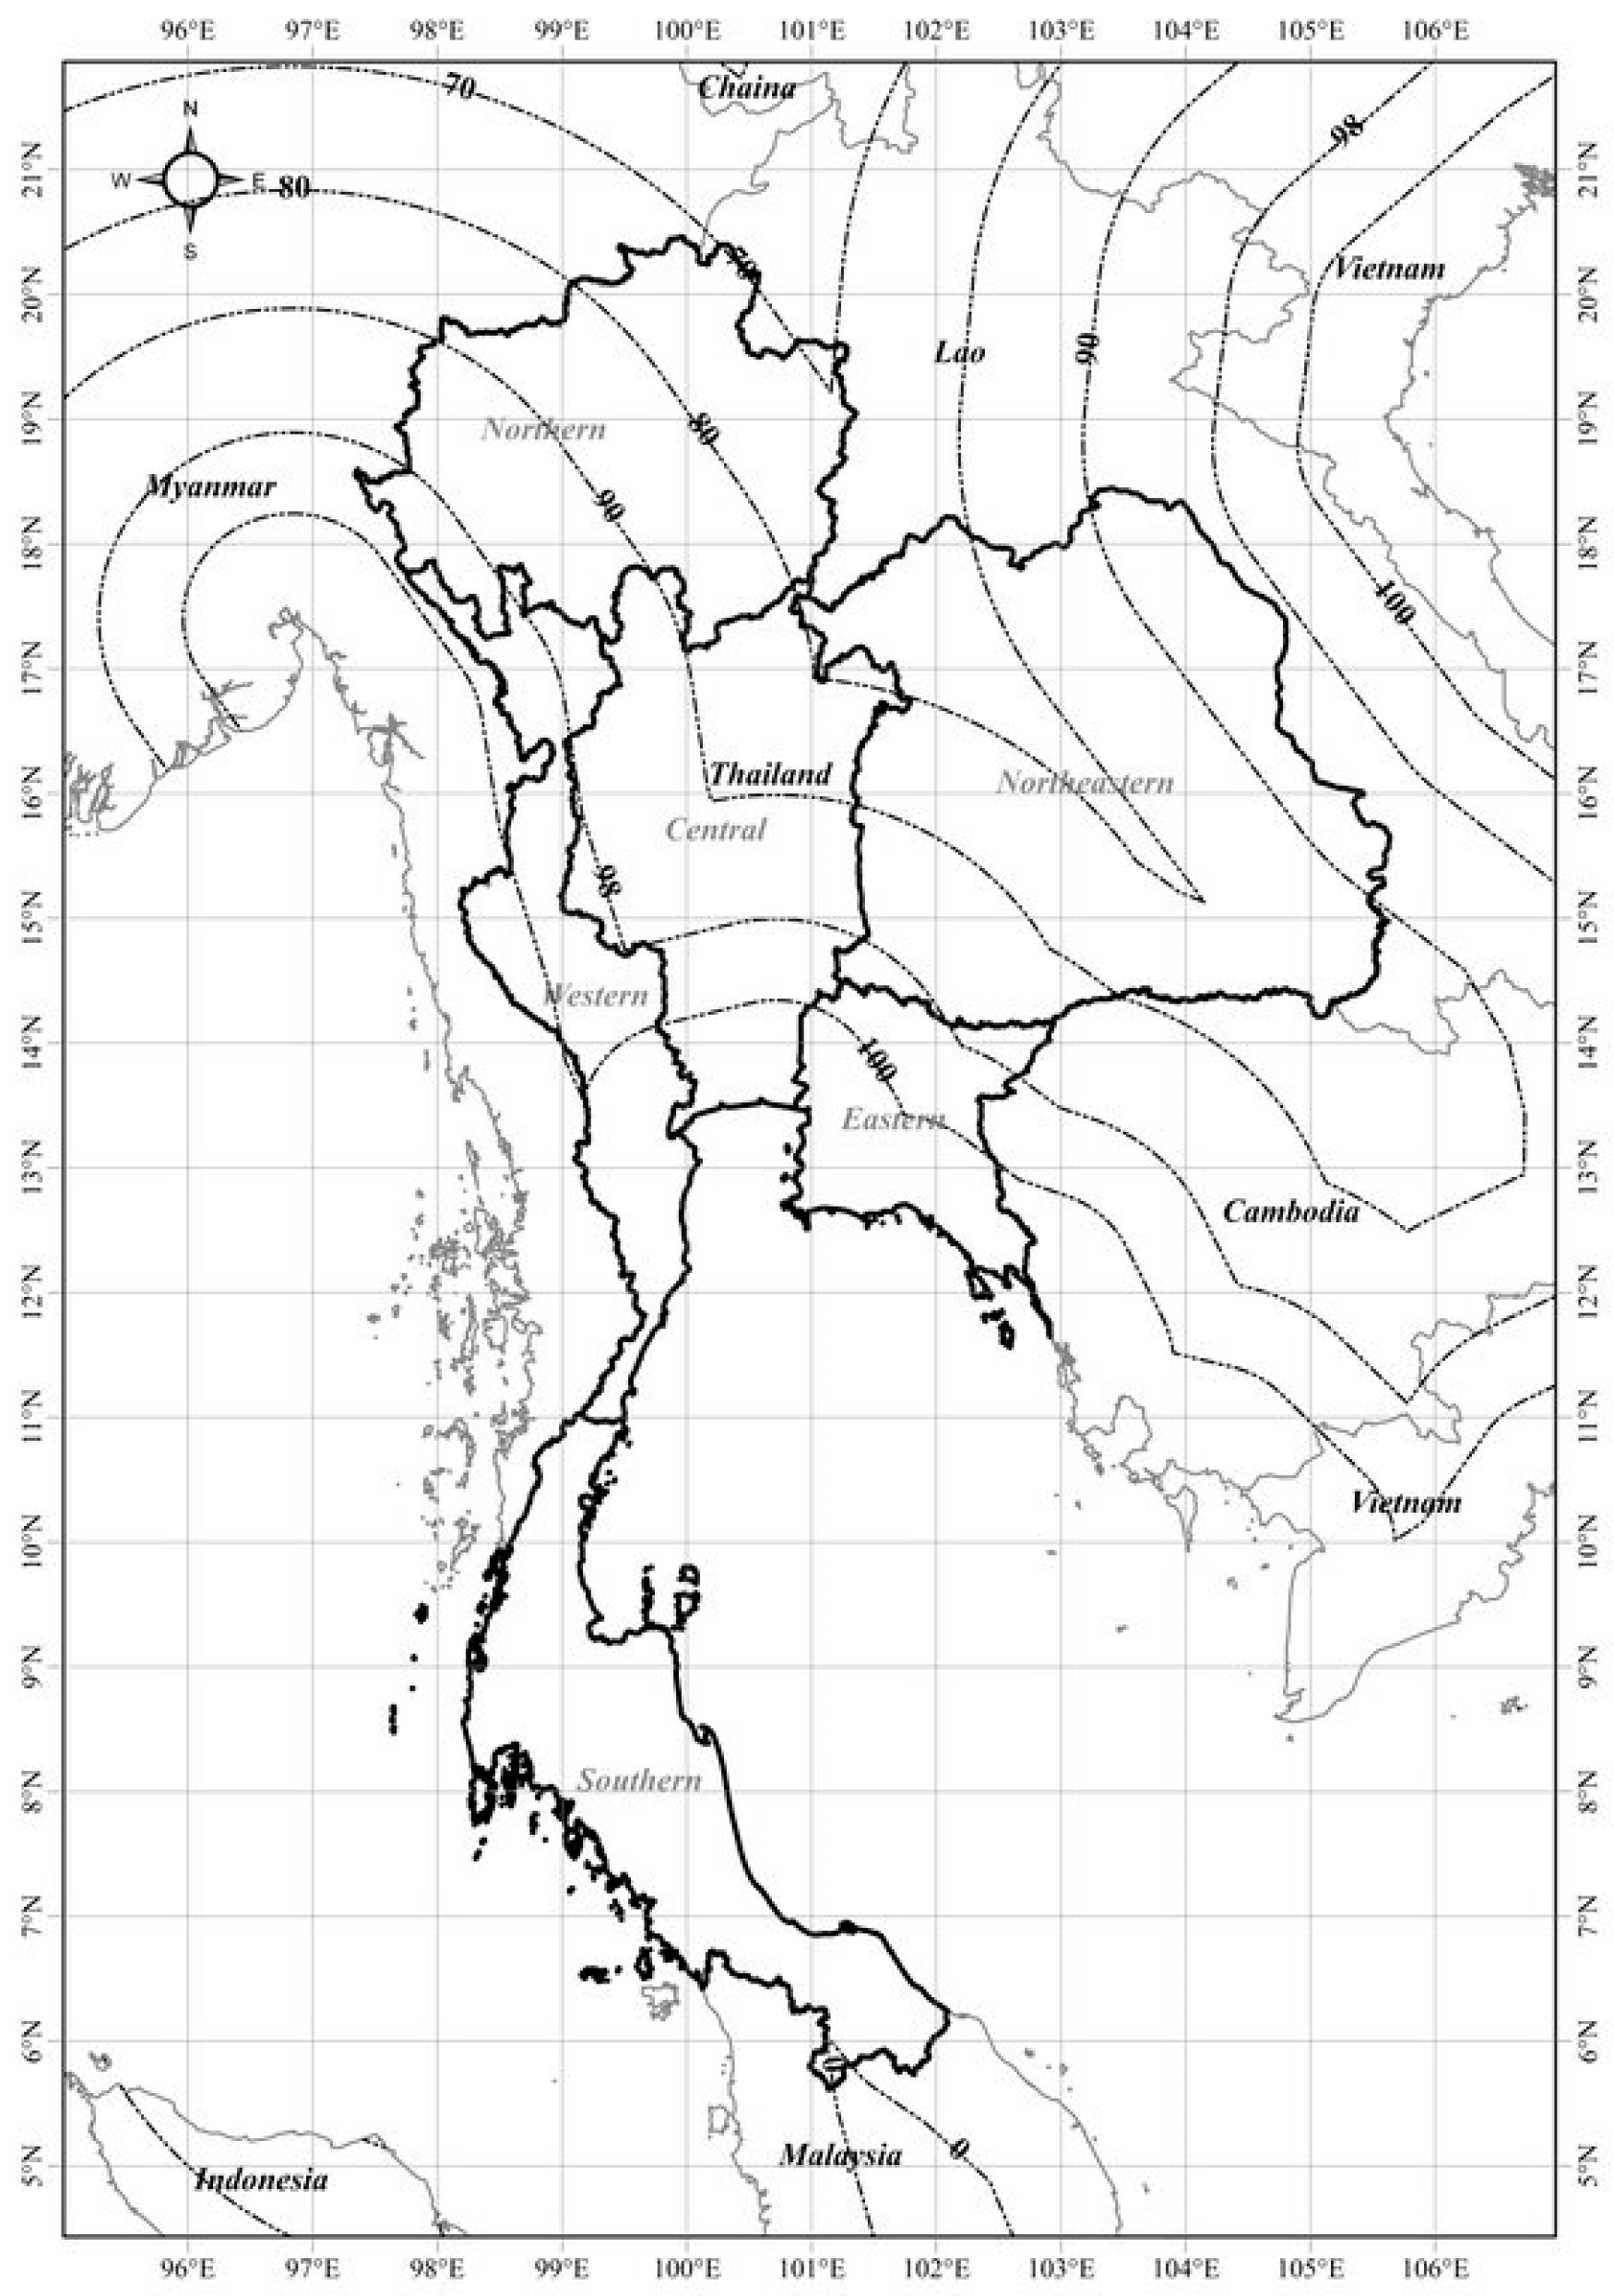
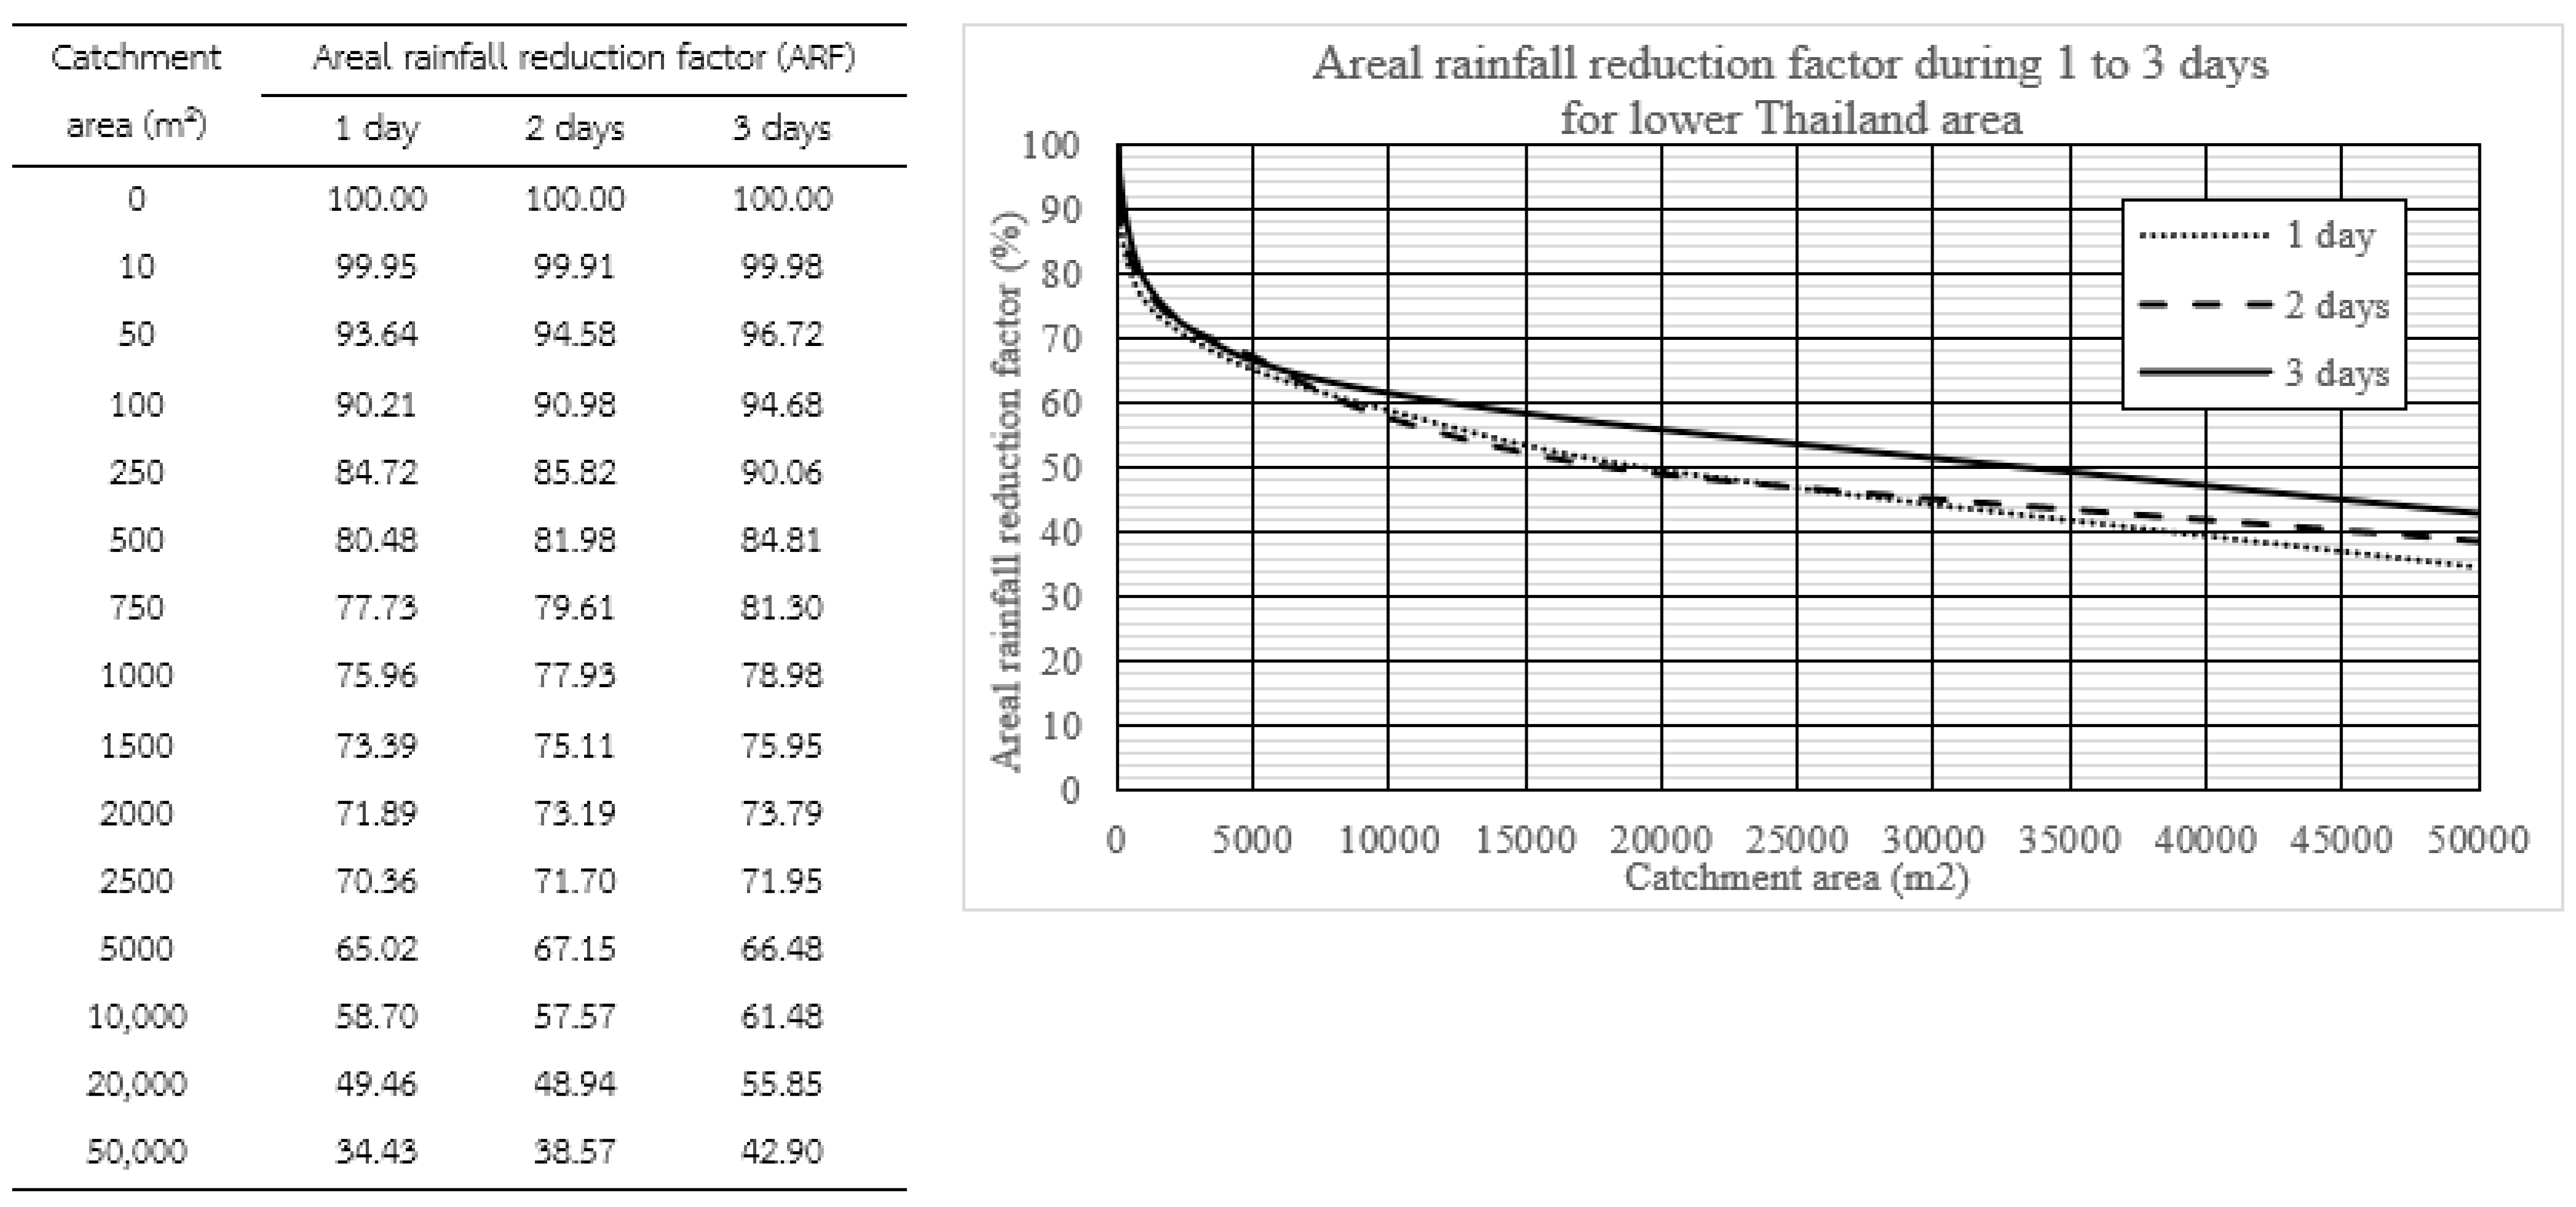
2.2.3. Area Rainfall Reduction Factor Analysis
2.2.4. Analysis of Probable Maximum Flood (PMF)
2.2.5. Estimation of Spillway Capacity
3. Results
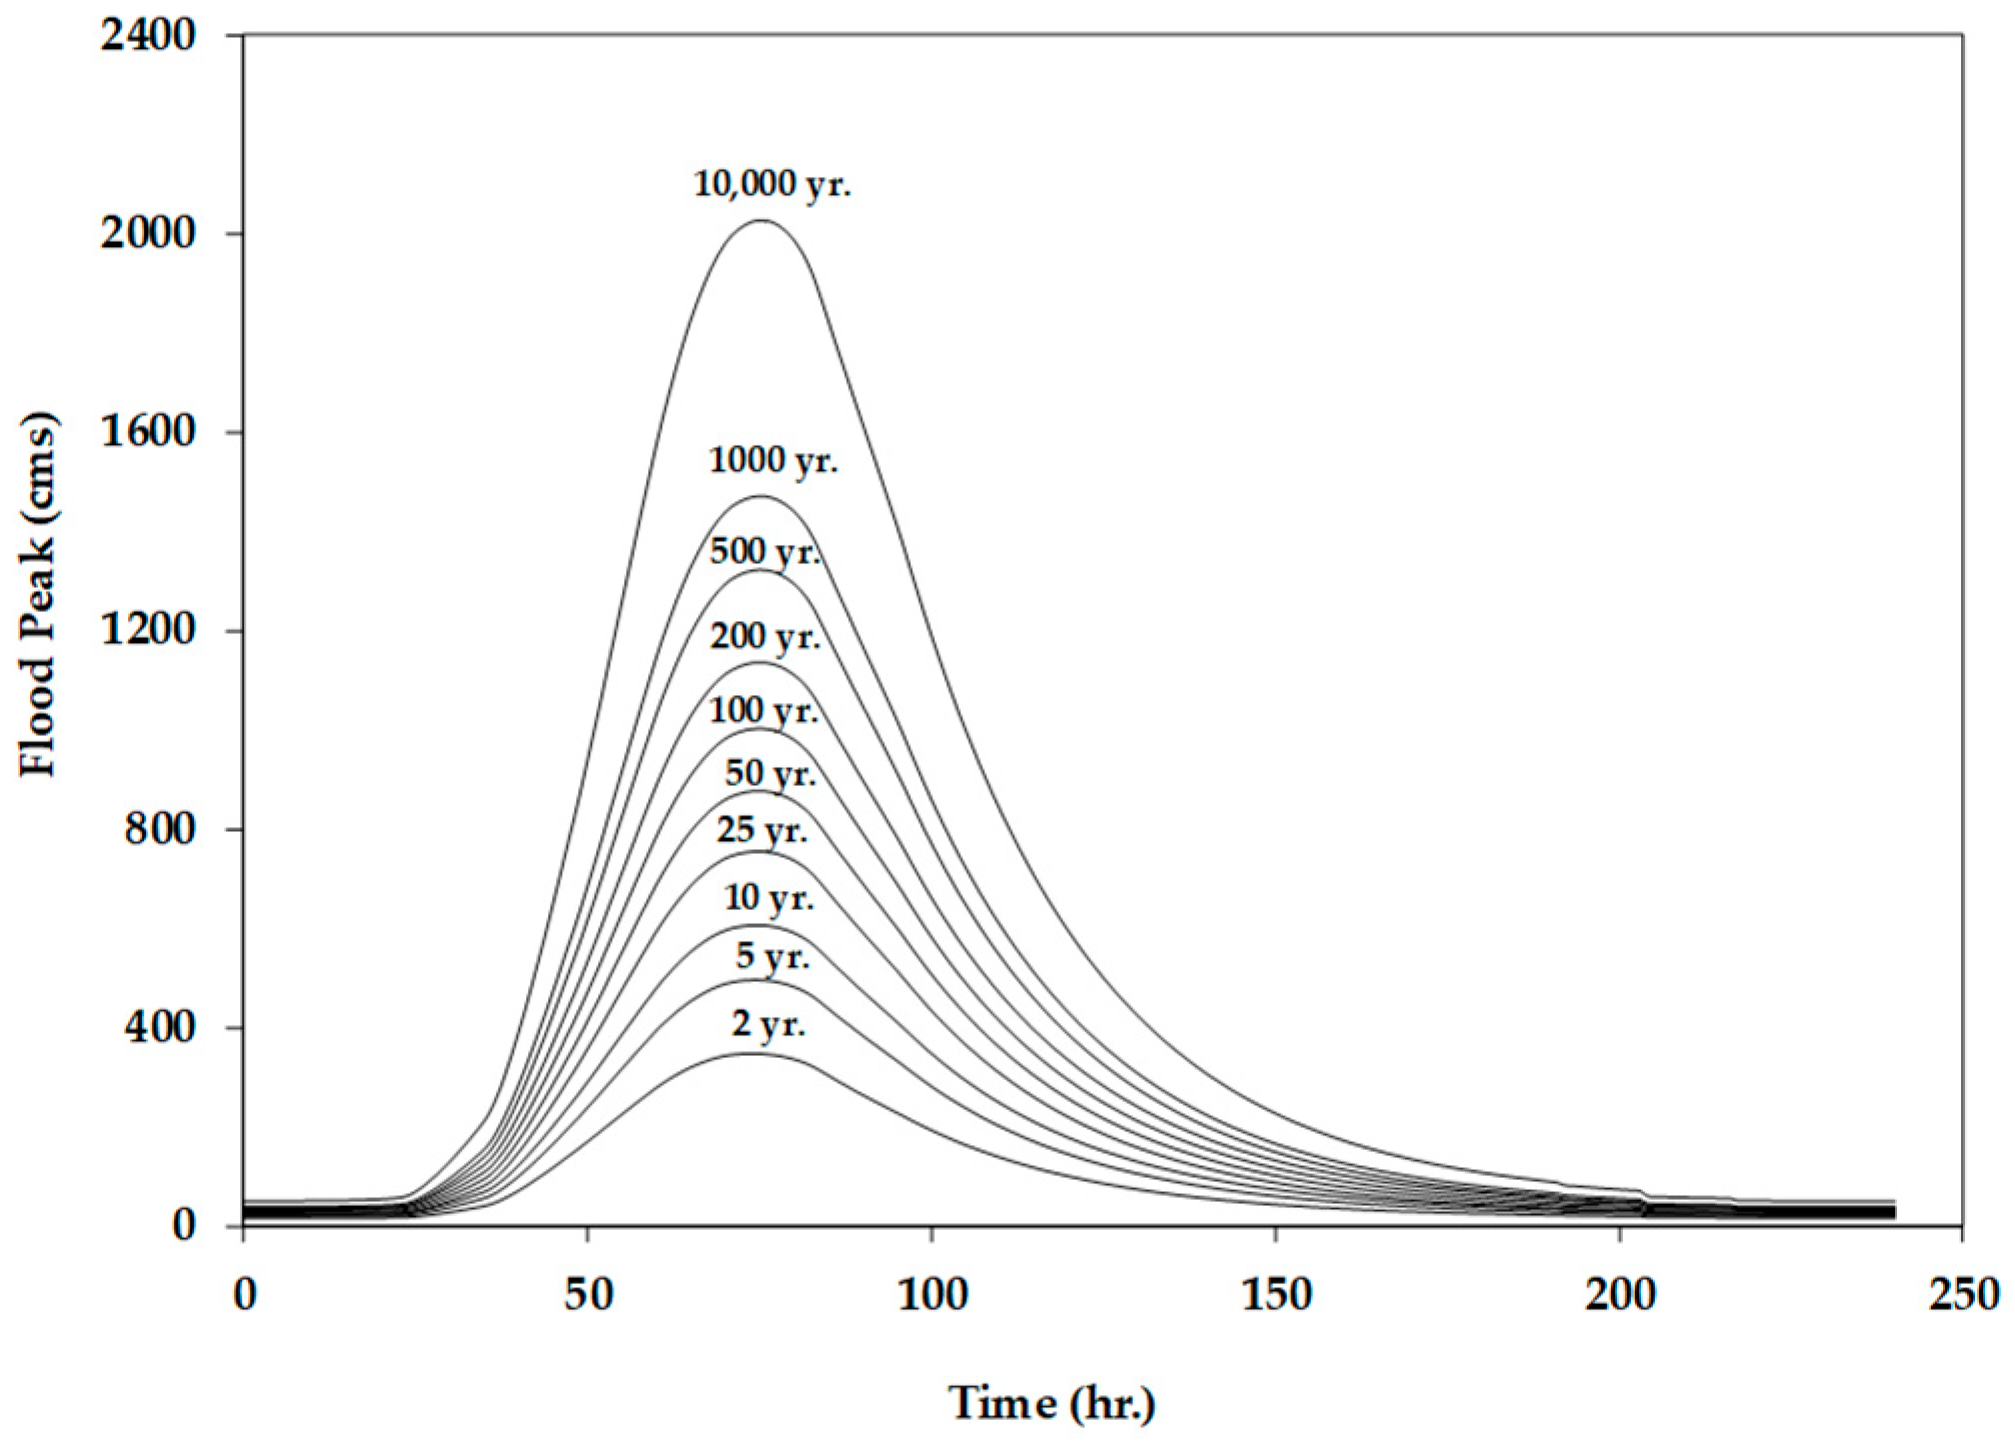
3.1. Maximum Rainfall at Different Return Periods
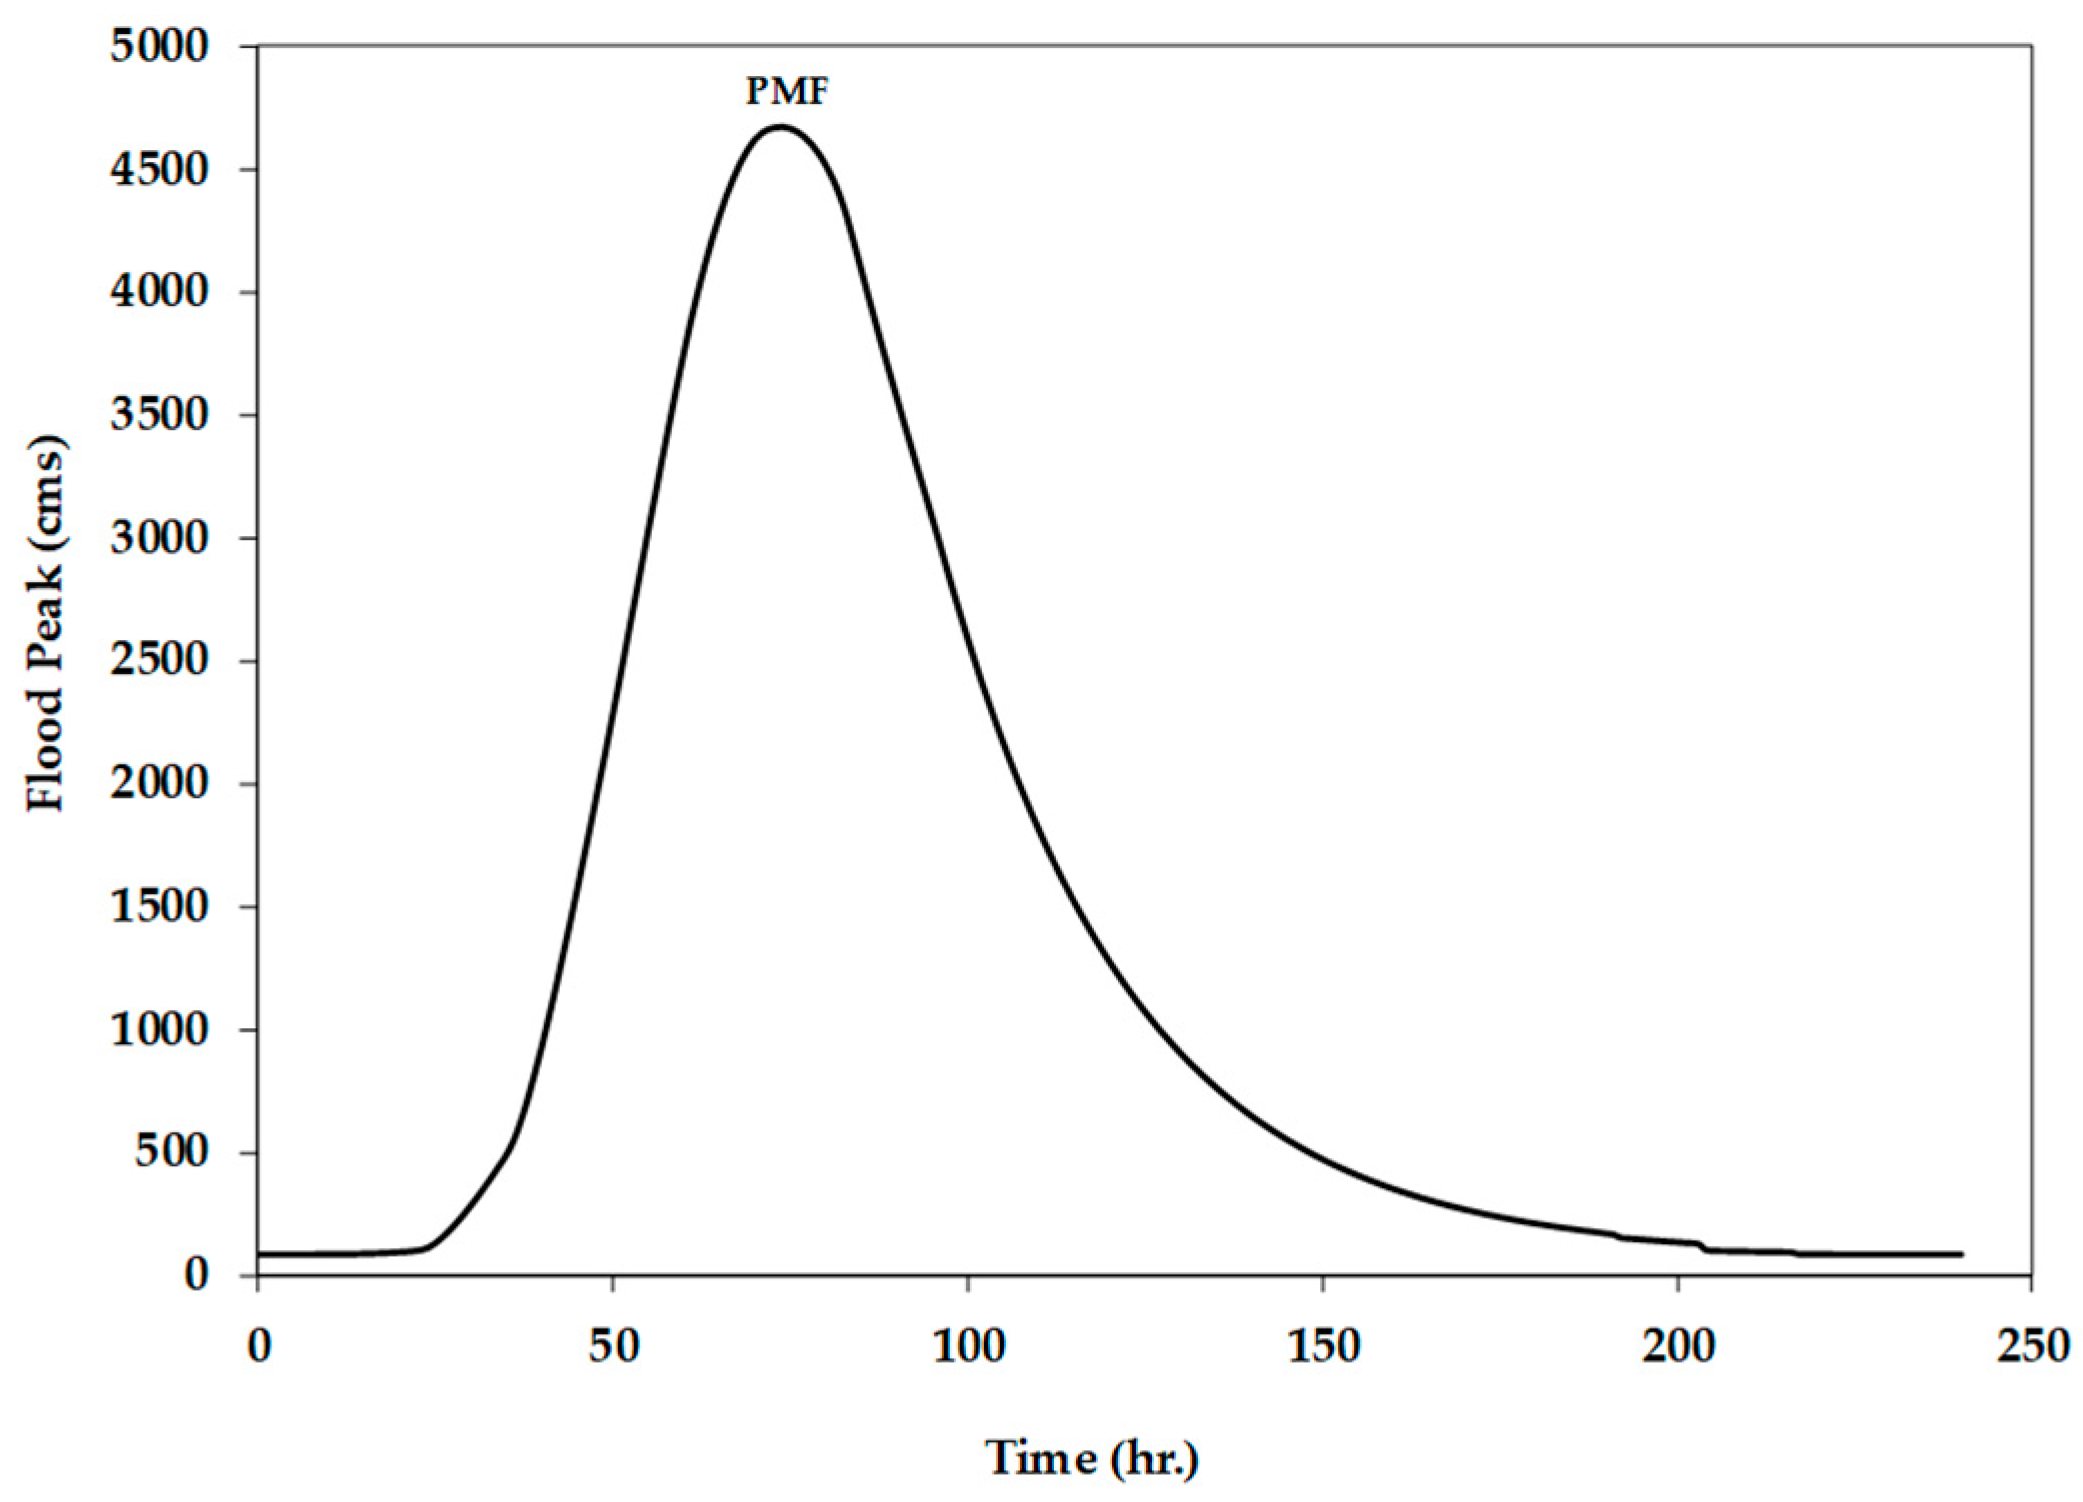
3.2. Probable Maximum Precipitation and Maximum Flood Analysis
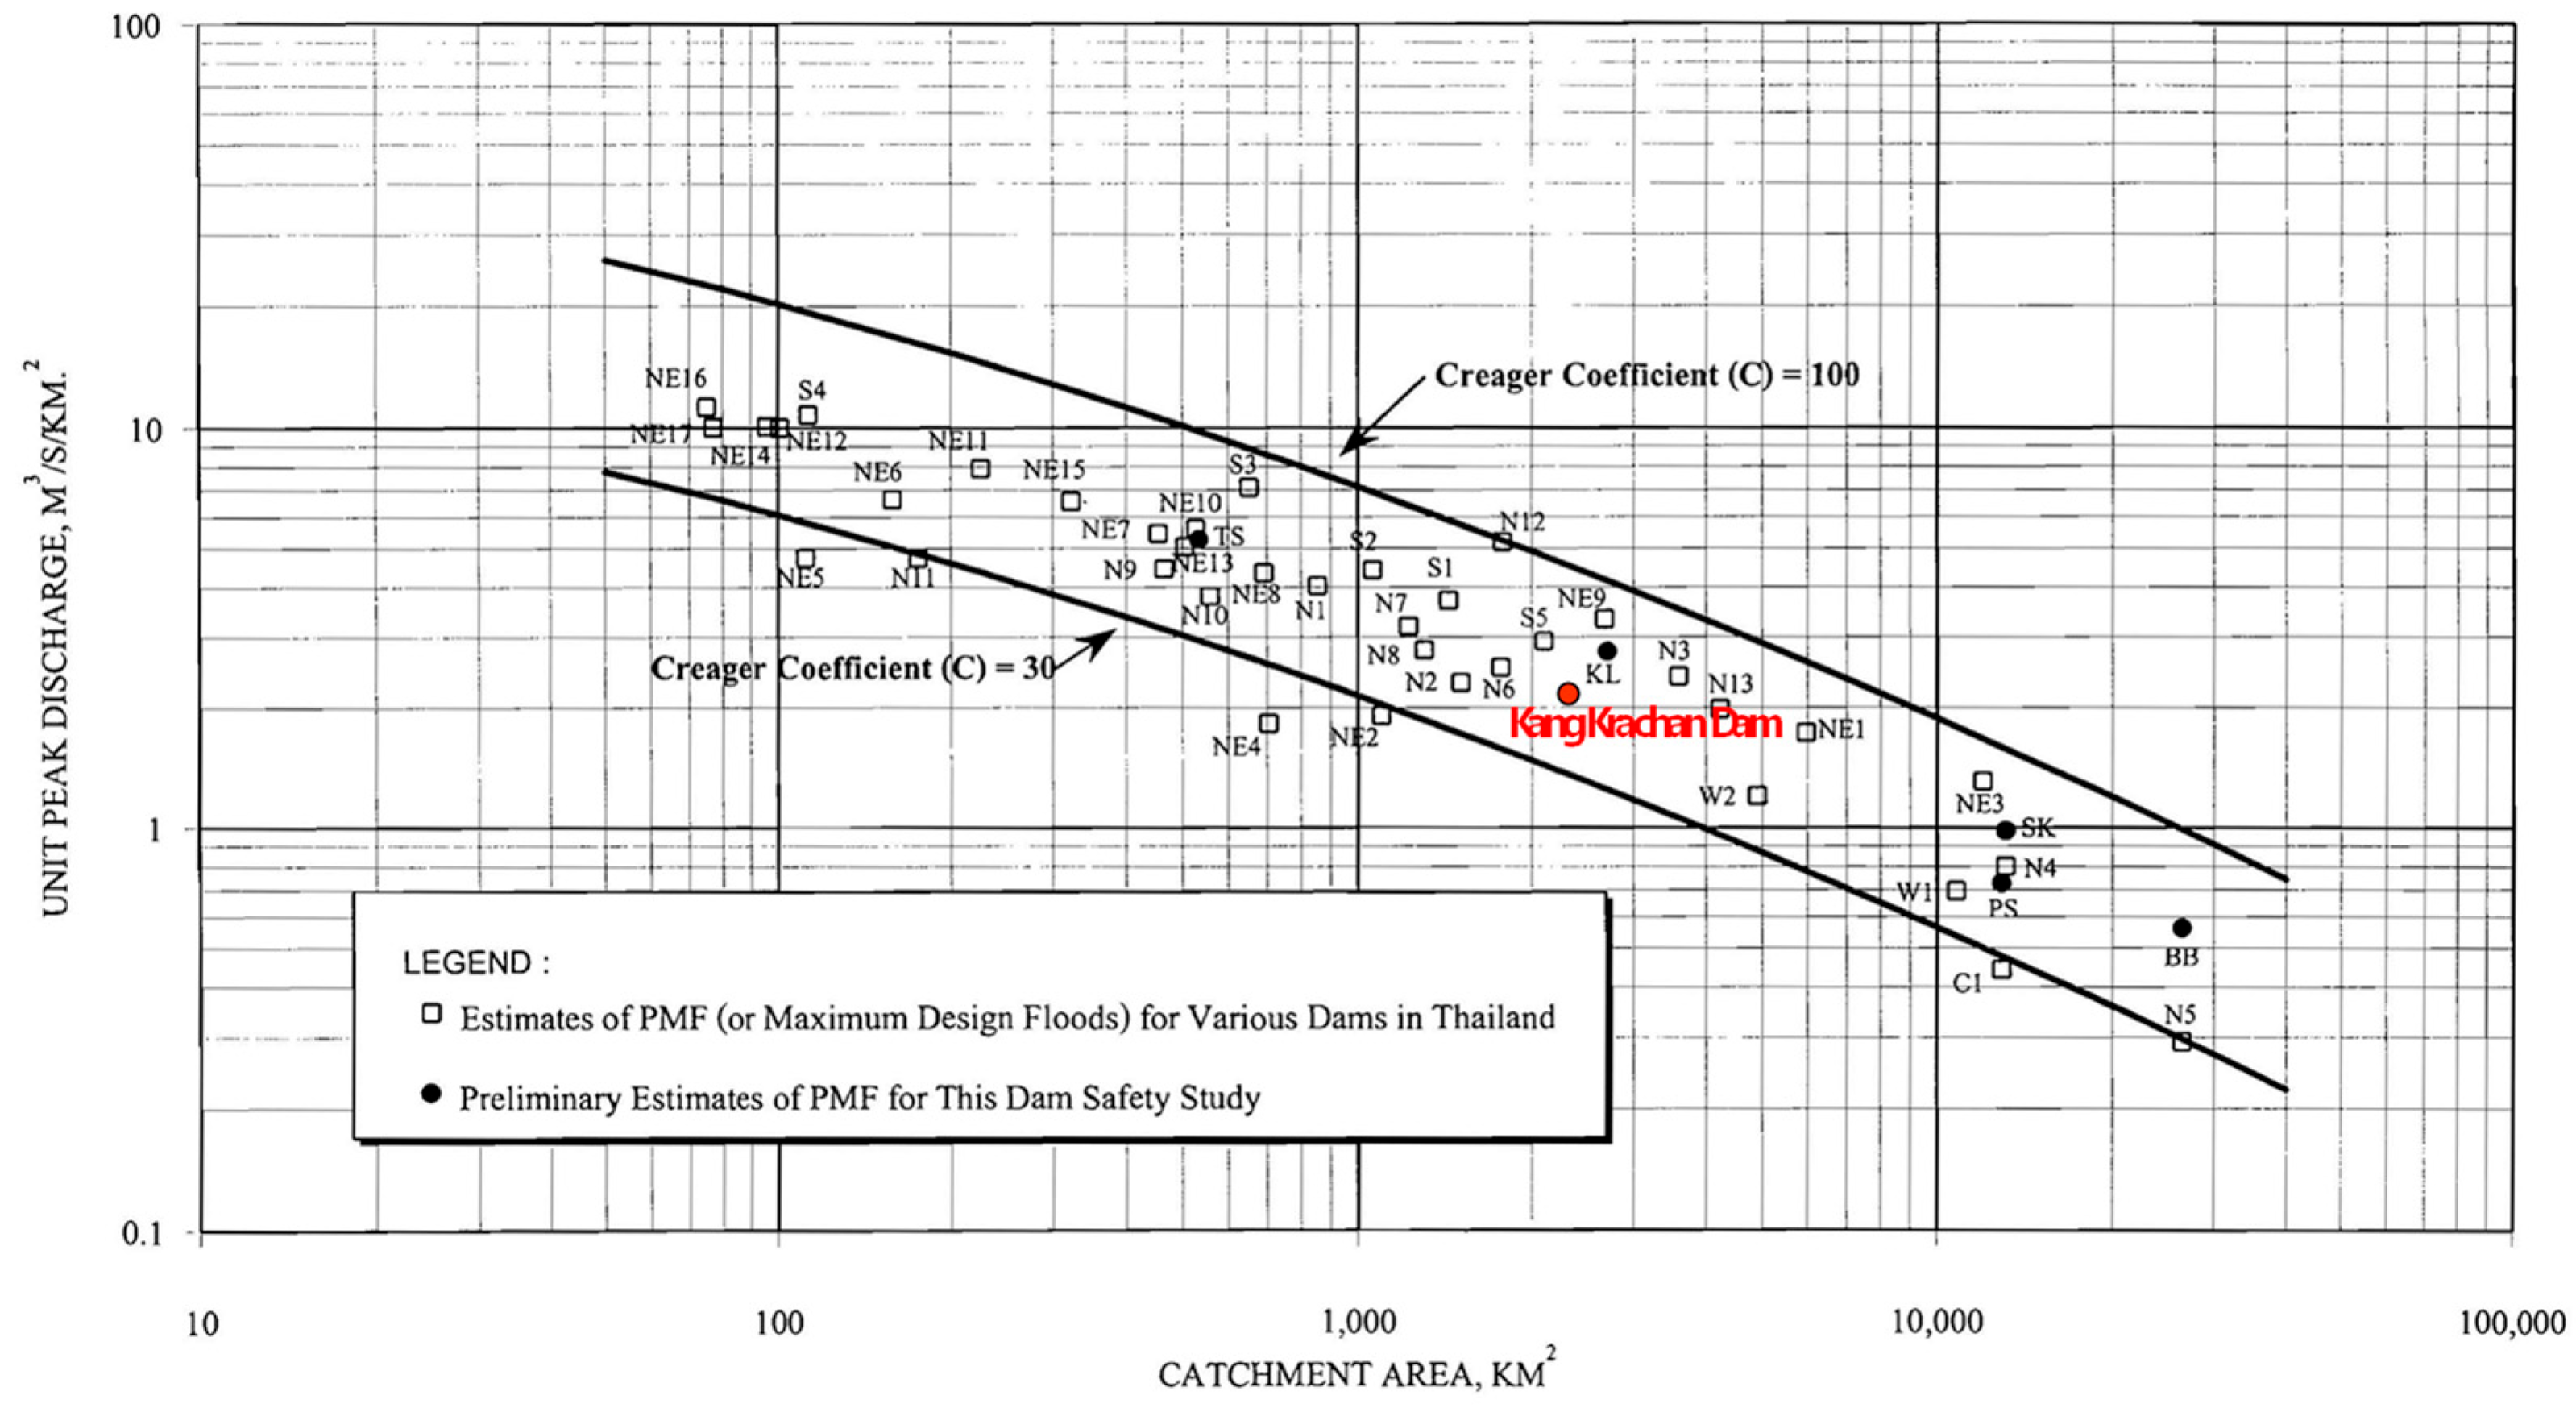
3.3. Comparing the Results of the Historical PMF Analysis
3.4. Assessment of the Spillway’s Capacity
4. Conclusions and Discussion
5. Recommendation
Author Contributions
Funding
Data Availability Statement
Acknowledgments
Conflicts of Interest
References
- Wangwongwiroj, N.; Khemngoen, C. Probable maximum precipitation in tropical zone (Thailand) as estimated by generalized method and statistical method. Int. J. Climatol. 2018, 39, 4953–4966. [Google Scholar] [CrossRef]
- Boota, M.W.; Nabi, G.; Abbas, T.; Yaseen, M.; Faisal, M.; Azam, M.I. Estimation of probable maximum flood (PMF): A case study of Pothwar region, Pakistan. Sci. Int. 2015, 27, 6471–6476. [Google Scholar]
- Gangrade, S.; Kao, S.C.; Naz, B.S.; Rastogi, D.; Ashfaq, M.; Singh, N.; Preston, B.L. Sensitivity of probable maximum flood in a changing environment. Water Resour. Res. 2018, 54, 3913–3936. [Google Scholar] [CrossRef]
- Visser, J.B.; Kim, S.; Wasko, C.; Nathan, R.; Sharma, A. The impact of climate change on operational probable maximum precipitation estimates. Water Resour. Res 2022, 58, e2022WR032247. [Google Scholar] [CrossRef]
- Turcotte, R.; Lafleur, J.; Larouche, B. Probable maximum flood in a changing climate: An overview for Canadian basins. J. Hydrol. Reg. Stud. 2017, 13, 11–25. [Google Scholar]
- Jothityangkoon, C.; Hirunteeyakul, C.; Boonrawd, K.; Sivapalan, M. Assessing the impact of climate and land use changes on extreme floods in a large tropical catchment. J. Hydrol. 2013, 490, 88–105. [Google Scholar] [CrossRef]
- Sittichok, K.; Vongphet, J.; Seidou, O. Predicted rainfall, surface runoff and water yield responses to climate change in the Phetchaburi River Basin, Thailand. Asian J. Water Environ. Pollut. 2022, 19, 1–13. [Google Scholar] [CrossRef]
- Rathnayake, R.M.P.J.; Rattanapun, P.; Chaisri, B.; Dubsok, A.; Wachirasirodom, R.; Kittipongvises, S. Ecological risk assessment of Kaeng Krachan National Park emphasis on landuse/land cover. In Proceedings of the 6th International Conference on Research Methodology for Built Environment and Engineering 2023 (ICRMBEE2023), Bangkok, Thailand, 28 February–2 March 2023. ICRMBEE2023. [Google Scholar]
- Sabur, M.A. Regional Flood Frequency Analysis of Thailand. Master’s Thesis, Asian Institute of Technology, Bangkok, Thailand, 1982. (In Thai). [Google Scholar]
- World Meteorological Organization (WMO). Manual on Estimation of Probable Maximum Precipitation (PMP) 2009; WMO: Geneva, Switzerland, 2009; pp. 1–72. [Google Scholar]
- Meteorological Department. Annual Tropical Cyclone Report; Weather Report No. 551.515.2; Climate Center Bureau of Meteorological Development: Bangkok, Thailand; pp. 1951–2013.
- U.S. Department of Commerce Environmental Science Services Administration; U.S. Department of the Army; Corps of Engineers. Probable Maximum Precipitation, Mekong River Basin; Hydrometeorological Report NO.46; National Weather Service: Silver Spring, MD, USA, 1970; 152p.
- Maneesarn, W. Topography and Seasonal Weather of Each Region in Thailand; Academic Document No. 551.582-02-2538; U.S. Department of the Interior Bureau of Reclamation: Washington, DC, USA, 1995; ISBN 974-7567-25-3. (In Thai)
- Hansen, E.M.; Schwarz, F.K.; Riedel, J.T. Probable Maximum Precipitation Estimates, Colorado River and Great Basin Drainages; hydrometeorological Report No. 49; U.S. Government Printing Office: Washington, DC, USA, 1984.
- Gray, W.M. Global View of the Origin of Tropical Disturbances and Storms. Mon. Weather Rev. 1968, 96, 669–700. [Google Scholar] [CrossRef]
- Teasombat, V. Potential Flood Control of Upper Chao Phraya by Large and Medium Reservoirs; National research Council of Thailand: Bangkok, Thailand, 2001.
- USBR. Dam Safety Program, Hydrologic Hazard Curve Estimating Procedures; Research Report DSO-04-08; U.S. Department of the Interior Bureau of Reclamation: Denver, CO, USA, 2004; 80p.
- Hydrology Division. Unit Hydrograph of Basin in Thailand; Hydrology No. 1502/08; Bureau of Hydrology and Water Management, Royal Irrigation Department: Bangkok, Thailand, 2009.
- Thanisaro, S. Study on Rainfall Loss Rate for Maximum Design Flood Hydrographs. Master’s Thesis, Department of Water Resources Engineering Kasetsart University, Bangkok, Thailand, 2000. (In Thai). [Google Scholar]
- Goodrich, R.D. Rapid calculation of reservoir discharge. Civ. Eng 1931, 1, 417–418. [Google Scholar]
- FAO. Report on Dam Safety under Natural Resources Management Project for Bhumibol Dam, Sirikit Dam, Kiu Lom Dam, ThapSalao Dam, Pasak Dam; Dam Safety Review Panel: Bangkok, Thailand, 2000. [Google Scholar]

| Storm Code | Name Storm | Date (D/M/Y) | Rainfall Station Code | Maximum Rainfall (mm) | ||
|---|---|---|---|---|---|---|
| 1 Day | 2 Days | 3 Days | ||||
| 031 | HARRIET (6225) | 24–27 October 1962 | 34022 | 390.80 25 October 1962 | 394.60 24–25 October 1962 | 426.70 23–25 October 1962 |
| 076 | Depression | 31–4 November 1969 | 45043 | 429.20 2 November 1969 | 603.10 2–3 November 1969 | 726.40 1–3 November 1969 |
| 083 | RUTH (7026) | 26–2 December 1970 | 10090 | 420.80 29 November 1970 | 511.00 29–30 November 1970 | 569.00 28–30 November 1970 |
| 097 | SARAH (7319) | 10–14 November 1973 | 45013 | 193.90 12 November 1973 | 307.80 12–13 November 1973 | 479.70 12–14 November 1973 |
| 102 | KIT (7432) | 19–27 December 1974 | 29072 | 220.20 25 December 1974 | 292.60 25–26 December 1974 | 452.80 25–27 December 1974 |
| 107 | Depression | 10–13 November 1977 | 35012 | 325.40 13 November 1977 | 573.60 12–13 November 1977 | 669.40 11–13 November 1977 |
| 145 | Depression 4 (TD 4) | 25–28 October 1991 | 45013 | 296.90 27 October 1991 | 311.70 26–27 October 1991 | 320.20 26–28 October 1991 |
| 152 | Depression 3 (TD 3) | 29–5 October 1993 | 58190 | 294.20 28 November 1993 | 374.10 27–28 November 1993 | 394.90 26–28 November 1993 |
| 153 | MANNY 9327 | 3–17 December 1993 | 35100 | 238.70 15 December 1993 | 421.40 15–16 December 1993 | 461.80 15–17 December 1993 |
| 162 | LINDA 9728 | 31–10 November 1997 | 37042 | 338.50 4 November 1977 | 339.70 4–5 November 1977 | 339.70 3–5 November 1977 |
| 164 | GIL 9817 | 9–13 December 1998 | 27013 | 330.90 12 December 1998 | 339.30 11–12 December 1998 | 429.80 11–13 December 1998 |
| 166 | Depression 4 | 3–6 December 1999 | 27122 | 225.20 4 December 1999 | 422.40 4–5 December 1999 | 474.10 4–6 December 1999 |
| 174 | MUIFA 0452 | 14–26 November 2004 | 10102 | 301.20 19 November 2004 | 328.10 18–19 November 2004 | 345.70 17–19 November 2004 |
| 185 | Depression 4 -JAI JAI 05B | 31 October–8 November 2010 | 33032 | 380.00 1 November 2010 | 445.00 31 October–1 November 2010 | 465.00 30 October–1 November 2010 |
| No. | Storm Code | Maximum Rainfall (mm) | Location of Storm | ||||
|---|---|---|---|---|---|---|---|
| 1 Day | 2 Days | 3 Days | Rainfall Station Code | Elevation (msl) | Dew Point (°C) | ||
| 1 | 076 | 429.20 | 603.10 | 726.40 | 450043 | 13.00 | 21.02 |
| 2 | 083 | 420.80 | 511.00 | 569.00 | 100090 | 12.00 | 23.31 |
| 3 | 031 | 390.80 | 394.60 | 402.00 | 340022 | 17.00 | 24.07 |
| 4 | 185 | 372.80 | 530.20 | 568.50 | 350022 | 8.00 | 23.31 |
| 5 | 162 | 338.50 | 339.70 | 339.70 | 370042 | 3.00 | 23.71 |
| 6 | 164 | 330.90 | 399.30 | 429.80 | 270013 | 12.00 | 22.53 |
| 7 | 107 | 325.40 | 573.60 | 669.40 | 350012 | 21.00 | 23.25 |
| 8 | 174 | 301.20 | 328.10 | 345.70 | 100102 | 53.00 | 22.99 |
| 9 | 145 | 296.90 | 311.70 | 320.20 | 450013 | 9.00 | 23.37 |
| 10 | 152 | 294.20 | 374.10 | 394.90 | 580190 | 0.00 | 23.85 |
| 11 | 153 | 238.70 | 421.40 | 461.80 | 580190 | 0.00 | 24.19 |
| 12 | 166 | 225.20 | 422.40 | 474.10 | 270122 | 12.00 | 23.53 |
| 13 | 097 | 193.90 | 307.80 | 479.70 | 450013 | 9.00 | 20.97 |
| 14 | 102 | 220.20 | 292.60 | 452.80 | 290072 | 20.00 | 22.94 |
| No. | Storm Code | Index Adjustment | ||||||||
|---|---|---|---|---|---|---|---|---|---|---|
| Moisture (83.53 *) | Topography (80.83 *) | Distance from Coast (100 *) | Latitude (84.93 *) | |||||||
| Original Position | Adjusted Index | Original Position | Adjusted Index | Original Position | Adjusted Index | Original Position | Adjusted Index | |||
| 1 | 076 | 56.96 | 1.55 | 94.90 | 0.85 | 100 | 1.00 | 93.90 | 0.90 | 1.20 |
| 2 | 083 | 69.57 | 1.27 | 116.02 | 0.70 | 100 | 1.00 | 88.79 | 0.96 | 0.85 |
| 3 | 031 | 74.36 | 1.19 | 143.14 | 0.56 | 100 | 1.00 | 83.47 | 1.02 | 0.68 |
| 4 | 185 | 69.65 | 1.27 | 177.58 | 0.46 | 100 | 1.00 | 80.87 | 1.05 | 0.61 |
| 5 | 162 | 72.32 | 1.22 | 113.09 | 0.71 | 100 | 1.00 | 95.54 | 0.89 | 0.78 |
| 6 | 164 | 64.84 | 1.37 | 145.24 | 0.56 | 100 | 1.00 | 83.54 | 1.02 | 0.77 |
| 7 | 107 | 69.01 | 1.28 | 145.94 | 0.55 | 100 | 1.00 | 81.56 | 1.04 | 0.74 |
| 8 | 174 | 66.78 | 1.33 | 148.77 | 0.54 | 100 | 1.00 | 86.96 | 0.98 | 0.70 |
| 9 | 145 | 70.00 | 1.26 | 90.41 | 0.89 | 100 | 1.00 | 92.02 | 0.92 | 1.04 |
| 10 | 152 | 73.31 | 1.21 | 184.14 | 0.44 | 100 | 1.00 | 81.81 | 1.04 | 0.55 |
| 11 | 153 | 75.52 | 1.17 | 184.14 | 0.44 | 100 | 1.00 | 81.81 | 1.04 | 0.53 |
| 12 | 166 | 70.93 | 1.25 | 198.30 | 0.43 | 100 | 1.00 | 85.51 | 0.99 | 0.53 |
| 13 | 097 | 56.80 | 1.56 | 90.41 | 0.89 | 100 | 1.00 | 92.02 | 0.92 | 1.29 |
| 14 | 102 | 67.14 | 1.32 | 158.84 | 0.51 | 100 | 1.00 | 83.25 | 1.02 | 0.68 |
| Days | Maximum Rainfall with Different Return Periods (mm) | |||||||||
|---|---|---|---|---|---|---|---|---|---|---|
| 2 | 5 | 10 | 25 | 50 | 100 | 200 | 500 | 1000 | 10,000 | |
| 1 | 65.11 | 83.63 | 95.90 | 111.43 | 122.93 | 134.38 | 145.75 | 160.77 | 172.10 | 209.81 |
| 2 | 84.30 | 110.87 | 128.45 | 150.72 | 167.18 | 183.56 | 199.87 | 221.38 | 237.63 | 291.60 |
| 3 | 98.03 | 133.95 | 157.75 | 187.86 | 210.79 | 232.32 | 254.37 | 283.49 | 305.49 | 378.52 |
| No. | Storm Code | Maximum Rainfall (mm) | Total Adjustments (rm) | PMP (mm) | ||||
|---|---|---|---|---|---|---|---|---|
| 1 Day | 2 Days | 3 Days | 1 Day | 2 Days | 3 Days | |||
| 1 | 076 | 429.20 | 603.10 | 726.40 | 1.20 | 513.90 | 722.12 | 869.76 |
| 2 | 083 | 420.80 | 511.00 | 569.00 | 0.85 | 356.85 | 433.34 | 482.52 |
| 3 | 031 | 390.80 | 394.60 | 402.00 | 0.68 | 267.33 | 269.93 | 274.99 |
| 4 | 185 | 372.80 | 530.20 | 568.50 | 0.61 | 226.52 | 322.15 | 345.42 |
| 5 | 162 | 338.50 | 339.70 | 339.70 | 0.78 | 263.28 | 264.21 | 264.21 |
| 6 | 164 | 330.90 | 399.30 | 429.80 | 0.77 | 255.62 | 308.46 | 332.02 |
| 7 | 107 | 325.40 | 573.60 | 669.40 | 0.74 | 240.76 | 424.39 | 495.27 |
| 8 | 174 | 301.20 | 328.10 | 345.70 | 0.70 | 211.88 | 230.81 | 243.19 |
| 9 | 145 | 296.90 | 311.70 | 320.20 | 1.04 | 309.84 | 325.29 | 334.16 |
| 10 | 152 | 294.20 | 374.10 | 394.90 | 0.55 | 161.90 | 205.87 | 217.32 |
| 11 | 153 | 238.70 | 421.40 | 461.80 | 0.53 | 127.51 | 225.11 | 246.70 |
| 12 | 166 | 225.20 | 422.40 | 474.10 | 0.53 | 119.21 | 223.59 | 250.96 |
| 13 | 097 | 193.90 | 307.80 | 479.70 | 1.29 | 249.38 | 395.86 | 616.95 |
| 14 | 102 | 220.20 | 292.60 | 452.80 | 0.68 | 150.74 | 200.30 | 309.96 |
| Return Periods | Flood Peak | Flood Volume | Base Flow |
|---|---|---|---|
| (Year) | (cms) | (mcm) | (cms) |
| 2 | 345.42 | 82.21 | 14.54 |
| 5 | 496.65 | 117.78 | 18.67 |
| 10 | 606.75 | 143.44 | 21.42 |
| 25 | 756.86 | 178.28 | 24.94 |
| 50 | 876.67 | 206.01 | 27.58 |
| 100 | 1002.88 | 235.09 | 30.25 |
| 200 | 1136.12 | 265.75 | 32.95 |
| 500 | 1322.03 | 308.49 | 36.56 |
| 1000 | 1472.70 | 343.03 | 39.37 |
| 10,000 | 2028.93 | 470.10 | 49.03 |
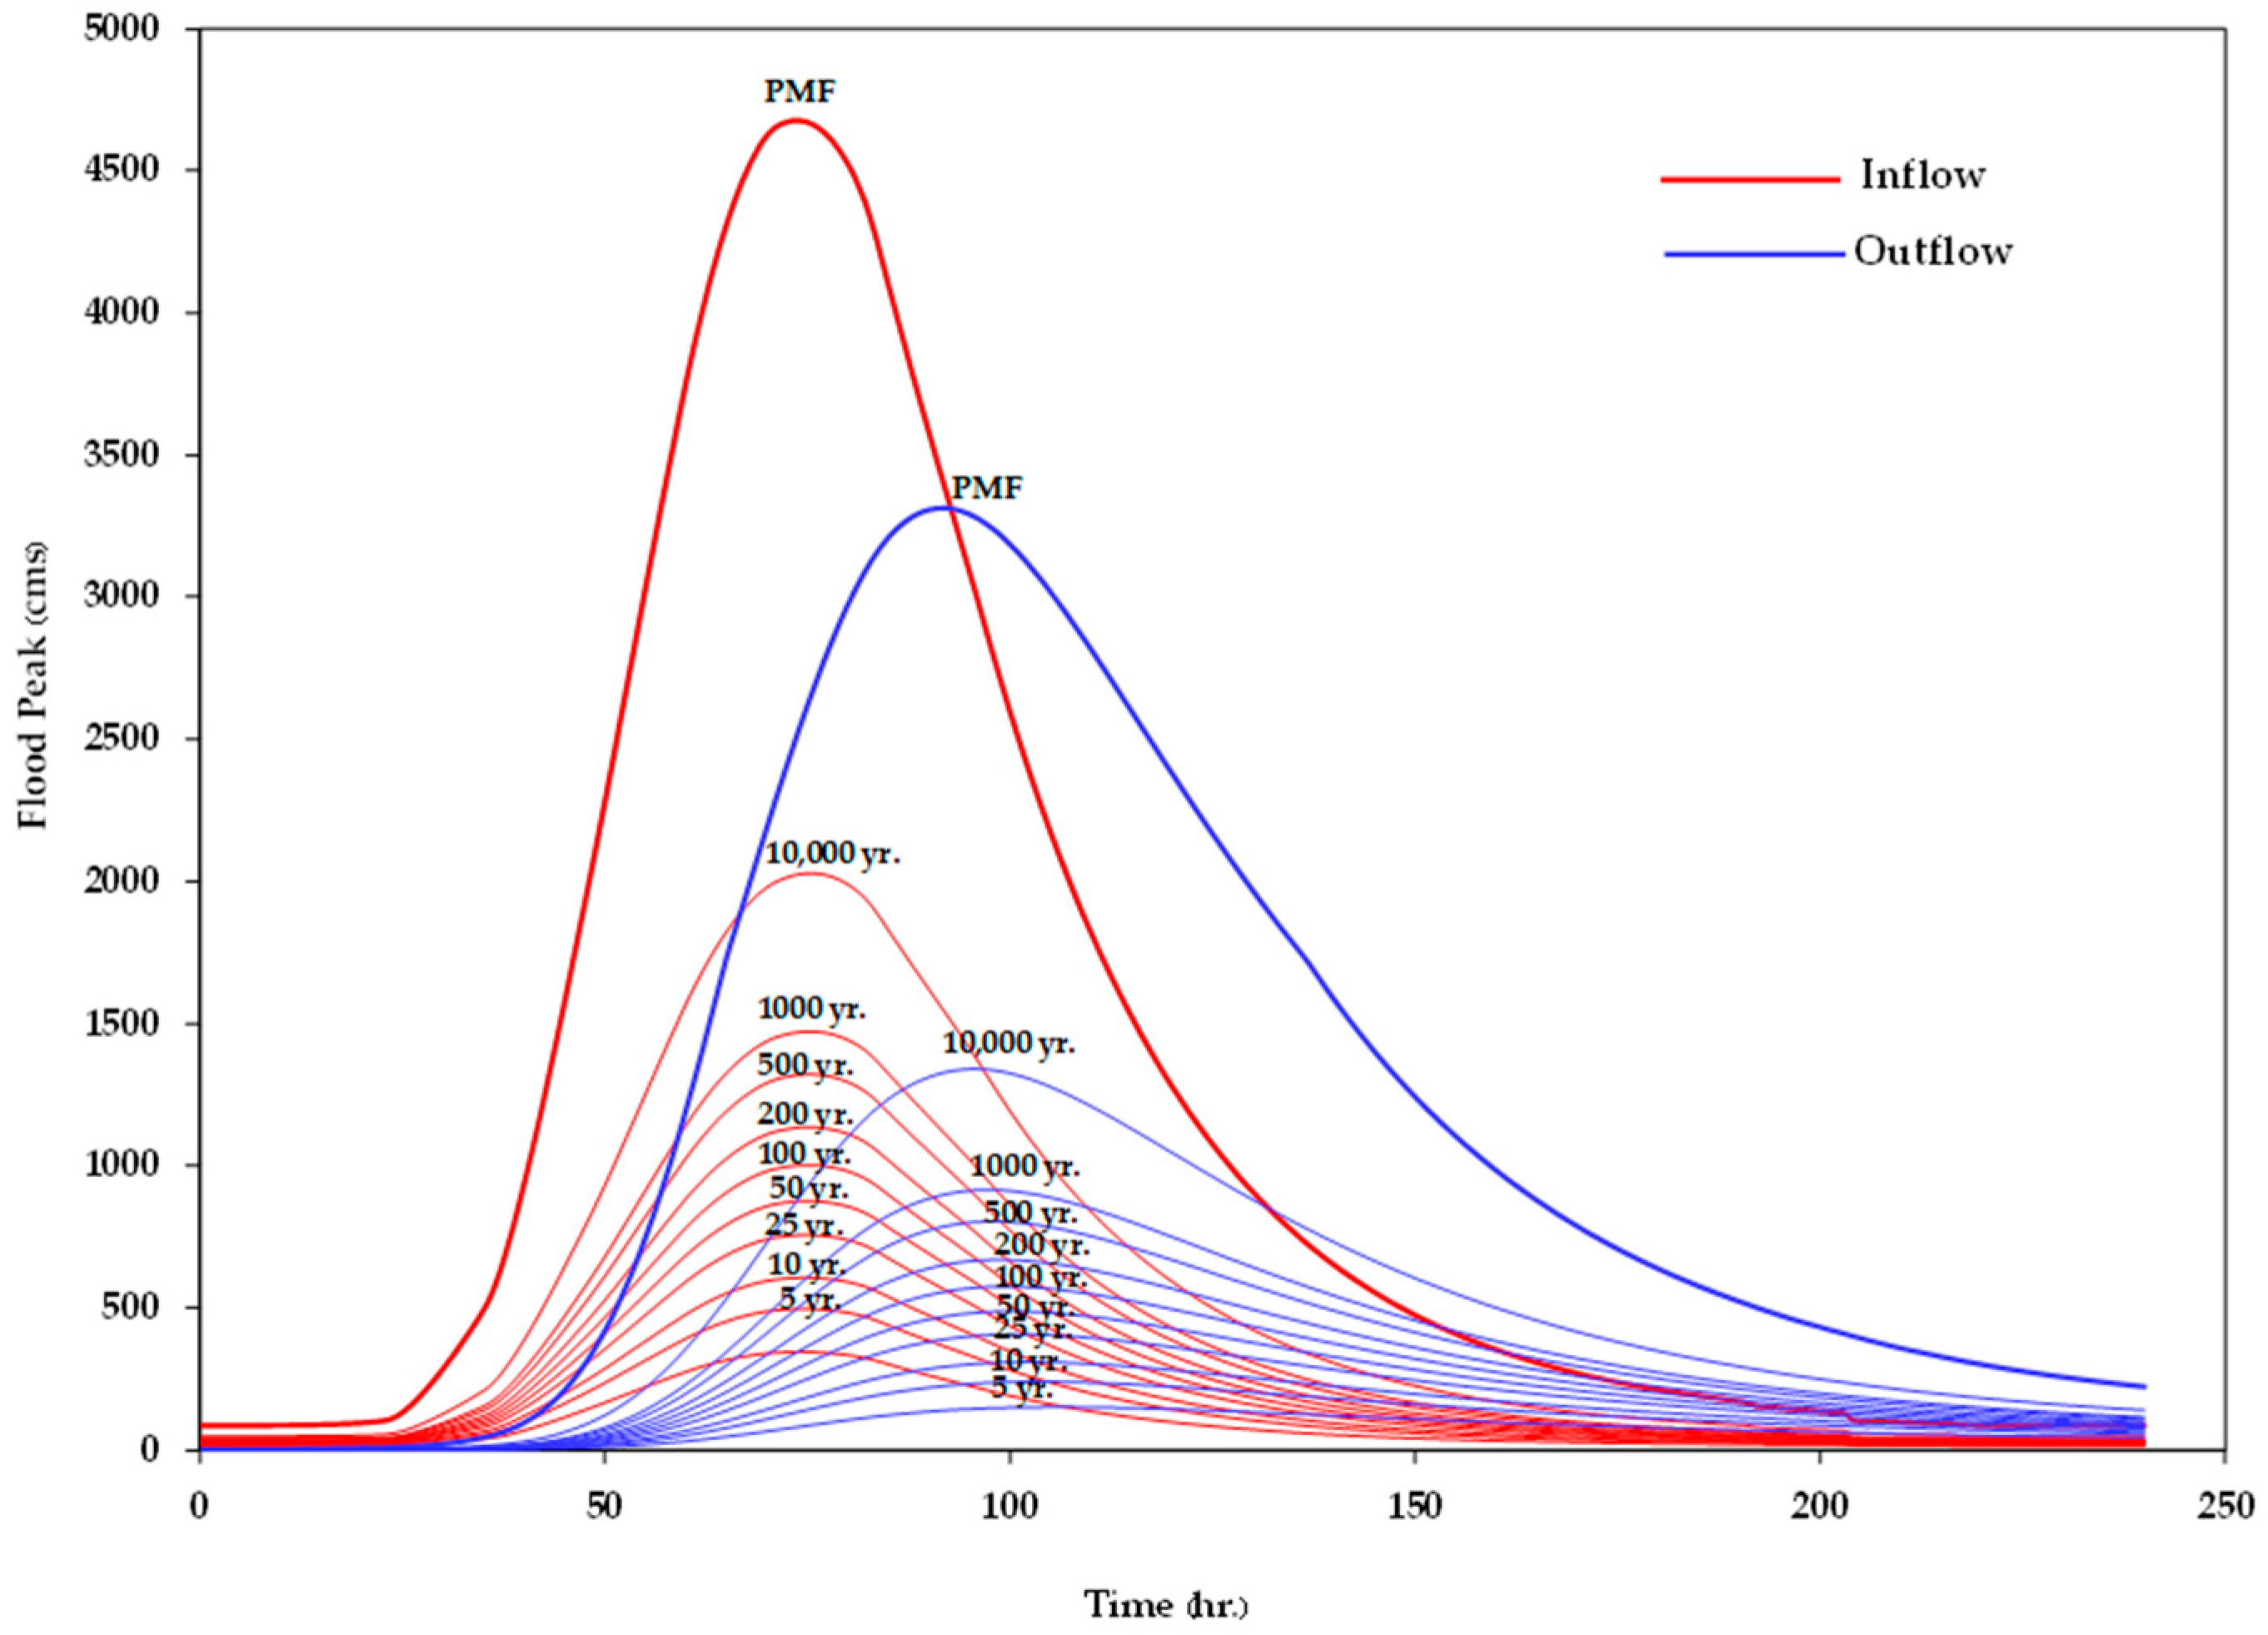
| PMF | 4676.96 | 1057.62 | 86.80 |
| Results | PMF | ||
|---|---|---|---|
| Maximum Flood (cms) | Flood Volume (mcm) | Base Flow (cms) | |
| Current study | 4677.0 | 1057.6 | 86.8 |
| Previous study (1963) | 4720.0 | 265.2 | 300.0 |
| Return Periods (Year) | Max. Inflow (cms) | Max. Water Level (msl) | Surcharge (m) | Max. Outflow (cms) | Percentage of Max. Outflow | Freeboard (m) |
|---|---|---|---|---|---|---|
| 2 | 345.42 | 99.70 | 0.70 | 151.80 | 56.05 | 6.30 |
| 5 | 496.65 | 100.00 | 1.00 | 241.10 | 51.45 | 6.00 |
| 10 | 606.75 | 100.20 | 1.20 | 309.90 | 48.92 | 5.80 |
| 25 | 756.86 | 100.40 | 1.40 | 407.70 | 46.13 | 5.60 |
| 50 | 876.67 | 100.60 | 1.60 | 488.50 | 44.28 | 5.40 |
| 100 | 1002.88 | 100.80 | 1.80 | 575.80 | 42.59 | 5.20 |
| 200 | 1136.12 | 101.00 | 2.00 | 670.00 | 41.03 | 5.00 |
| 500 | 1322.03 | 101.20 | 2.20 | 804.70 | 39.13 | 4.80 |
| 1000 | 1472.70 | 101.40 | 2.40 | 916.10 | 37.79 | 4.60 |
| 10,000 | 2028.93 | 102.10 | 3.10 | 1340.90 | 33.91 | 3.90 |
| PMF | 4676.96 | 104.70 | 5.70 | 3313.70 | 29.15 | 1.30 |
| Return Periods (Year) | Max. Inflow (cms) | Max. Water Level (msl) | Surcharge (m) | Max. Outflow (cms) | Percentage of Max. Outflow | Freeboard (m) |
|---|---|---|---|---|---|---|
| 2 | 345.42 | 99.70 | 0.70 | 151.80 | 56.05 | 6.30 |
| 5 | 496.65 | 100.00 | 1.00 | 241.10 | 51.45 | 6.00 |
| 10 | 606.75 | 100.20 | 1.20 | 309.90 | 48.92 | 5.80 |
| 25 | 756.86 | 100.40 | 1.40 | 407.70 | 46.13 | 5.60 |
| 50 | 876.67 | 100.60 | 1.60 | 488.50 | 44.28 | 5.40 |
| 100 | 1002.88 | 100.80 | 1.80 | 575.80 | 42.59 | 5.20 |
| 200 | 1136.12 | 101.00 | 2.00 | 670.00 | 41.03 | 5.00 |
| 500 | 1322.03 | 101.20 | 2.20 | 804.70 | 39.13 | 4.80 |
| 1000 | 1472.70 | 101.40 | 2.40 | 916.10 | 37.79 | 4.60 |
| 10,000 | 2028.93 | 102.10 | 3.10 | 1340.90 | 33.91 | 3.90 |
| PMF | 4676.96 | 104.70 | 5.20 | 3857.10 | 17.53 | 1.80 |
| PMF * | 4676.96 | 102.60 | 3.60 | 4254.20 | 9.04 | 1.80 |
Disclaimer/Publisher’s Note: The statements, opinions and data contained in all publications are solely those of the individual author(s) and contributor(s) and not of MDPI and/or the editor(s). MDPI and/or the editor(s) disclaim responsibility for any injury to people or property resulting from any ideas, methods, instructions or products referred to in the content. |
© 2024 by the authors. Licensee MDPI, Basel, Switzerland. This article is an open access article distributed under the terms and conditions of the Creative Commons Attribution (CC BY) license (https://creativecommons.org/licenses/by/4.0/).
Share and Cite
Thepprasit, C.; Intavong, A.; Chompuchan, C.; Chulee, N.; Sittichok, K. Spillway Capacity Estimation Using Flood Peak Analysis and Probable Maximum Flood Method. Water 2024, 16, 1727. https://doi.org/10.3390/w16121727
Thepprasit C, Intavong A, Chompuchan C, Chulee N, Sittichok K. Spillway Capacity Estimation Using Flood Peak Analysis and Probable Maximum Flood Method. Water. 2024; 16(12):1727. https://doi.org/10.3390/w16121727
Chicago/Turabian StyleThepprasit, Chaiyapong, Apinyaporn Intavong, Chuphan Chompuchan, Napassakorn Chulee, and Ketvara Sittichok. 2024. "Spillway Capacity Estimation Using Flood Peak Analysis and Probable Maximum Flood Method" Water 16, no. 12: 1727. https://doi.org/10.3390/w16121727
APA StyleThepprasit, C., Intavong, A., Chompuchan, C., Chulee, N., & Sittichok, K. (2024). Spillway Capacity Estimation Using Flood Peak Analysis and Probable Maximum Flood Method. Water, 16(12), 1727. https://doi.org/10.3390/w16121727