Abstract
Landscape has significant effects on hydrological processes in a watershed. In the Sudano-Sahelian area, watersheds are subjected to a quick change in landscape patterns due to the human footprint, and the exact role of the actual landscape features in the modification of the hydrological process remains elusive. This study tends to assess the effects of landscape on the genesis of the runoff in the Mayo Mizao watershed. To achieve this goal, 62 infiltration tests were performed at different points and depths (5 cm and 20 cm) using the double-ring method and the Porchet method. The results show that the combination of many factors (soil type, land use, and farming practices) can guide the hydraulic conductivity behavior of soils. For example, at 5 cm depths, clayey-evolved soils, such as vertisols and halomorphic soils, inhibit infiltration, as opposed to non-evolved mineral soils, such as lithosols and clayey-sandy soils. However, at 20 cm depths, gray soils with halomorphic tendencies followed by vertisols have a low sensitivity to infiltration, as opposed to soils derived from loose materials and halomorphic soils. For a given soil type, rainfed crops are the primary land use that runs against infiltration. However, the effect of tillage varies according to the soil type. Finally, given the extent of vertisols and halomorphic soils in the Far North region of Cameroon in general, and in the Mayo Mizao watershed in particular, and regarding the increase in cultivated areas, a probable reduction in the infiltration capacity of soils in this region is to be expected in the medium term. The results of this study can be used as a basis for land-use planning and sustainable watershed management in semi-arid tropical zones.
1. Introduction
The temporal evolution of the number of floods that occurred between 1900 and 2023 reveals an upward trend, marked by a resurgence in the 1950s [1]. The increase in the number of flood occurrences could be associated with the various changes to which hydrological catchments have always been subject. Watersheds exhibit great variability in landscape structure (topography, geology, soils, occupation, and land management). This variability, in turn, controls the distribution of precipitation into different components: soil moisture, runoff, evapotranspiration, infiltration, and groundwater flow [2]. Runoff and floods occur when one or a combination of the above factors runs against infiltration [3]. Given the ecological changes affecting our environment, a close relationship has been established between landscape structure and flooding [4]. In the Sahelian area, major environmental changes that have occurred in recent decades [5] are likely to have led to profound changes in the landscape, raising the risk of flood disasters. Indeed, the Sahelian population, whose way of life has long remained most dependent on natural resources, has led to a high ecological footprint on the environment [6], with a significant change in the landscape features. This phenomenon seems to be the cause of the decrease in the soil’s infiltration capacity [7,8,9,10]. Sahelian population growth has been accompanied by urban sprawl [11] and a high demand for livelihoods [12,13]. Thus, with the aim of attempting to satisfy the needs of the population, the cropland’s size and urban area increased while new farming practices were developed [14]. The combination of many factors will then have an impact on hydrosystem functioning, increasing runoff and river flows [15]. People will then have to face more environmental hazards. In Far North Cameroon, several disastrous flooding events have been recorded [16]. The geohistorical analysis performed by Bouba et al. [17] enabled the identification of approximately 21 large-scale flood disasters between 1977 and 2011. The Maroua urban area (the greatest city in Far North Cameroon) appeared to be the most affected by the flood disaster. Therefore, with the aim of improving the resilience of populations, it is crucial to facilitate the comprehension of the origin of this hazard. On the one hand, the results obtained by Bouba et al. [17] highlighted that, despite the increase in rainfall since 1990, the occurrence of flood hazards in Far North Cameroon is far from being a direct consequence of the rainfall pattern. On the other hand, some studies have linked the vegetation cover evolution with human activities [18,19,20,21,22]. Their results showed a loss of vegetation cover and a development of cropland. However, change in landscape and landform is a rapid phenomenon, while accommodation as a response to the hydro-environmental consequences of these changes is slow or non-existent. Thus, identifying the implications of landscape on hydro-environmental processes in a watershed is a key that can help predict the watershed’s hydrological response and anticipate runoff and flash flood hazards. What incidence has the actual landscape on the saturated hydraulic conductivity of soils in the Mayo Mizao catchment? How sensitive is the Mayo Mizao watershed to runoff and flooding under different landscape conditions? The aim of this study was to assess the impacts of soil type, land use, and farming practices on the field-saturated hydraulic conductivity of soils in the Mayo Mizao watershed. To achieve this goal, a field experiment based on the determination of soil permeability was carried out.
2. Materials and Methods
Two main components of the methodology are presented: the field campaign method and the data analyzing processing methods.
2.1. Presentation of the Mayo Mizao Watershed
The Mayo Mizao watershed is located at 10.58° N; 14.20° E (Figure 1). It is actually a sub-basin of the Mayo Kaliao River, the main tributary of the Mayo Tsanaga River, which is also a tributary of the Logone River. The Logone River is a tributary of the Chari, which is the main source for providing water to Lake Chad [23].
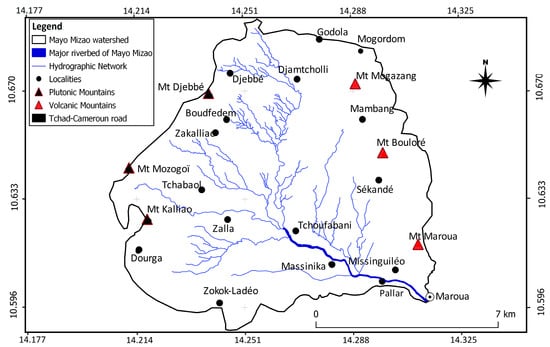
Figure 1.
Location of the Mayo Mizao watershed.
The Mayo Mizao watershed size is 100 km2. It is surrounded to the west by granitic mountains that form the Precambrian basement [24]. These mountains have altitudes ranging from 520 m (Mt Kaliao) to 640 m (Mt Djebbé) (Figure 1). Toward the east side, there is Mt Bouloré (700 m) and Mt Mogazang (700 m), made of volcanic and volcano-sedimentary rocks. The hypsometric characteristics of the watershed show, from upstream to downstream, three land surfaces: a surface of altitude greater than 440 m, a surface of altitude between 440 m and 420 m, and a surface of altitude less than 420 m. The slope varies in the same direction, from 3‰ to 16‰. The Gravelus compactness index (Kc = 1.21) is close to 1, giving the watershed a high compactness. The surface area is essentially covered by vertisols and gray soils with a halomorphic tendency. Vegetation that is mostly made of shrubs and grasses is characterized by a strong ecological footprint [20]. In terms of rainfall, the Mayo Mizao watershed area receives an annual rainfall of 800 mm. Between 2015 and 2019, daily rainfall varied from 1 mm to 170 mm, often generating severe flooding due to runoff. This was the case on 23 June 2018, when rainfall of 104 mm gave rise to significant floods observed in various localities of the watershed area.
2.2. Field Data Collection Process
Infiltration is the process of water entry into the soil. The saturated hydraulic conductivity Ks is an essential parameter for infiltration because if the soil is saturated and homogeneous, it represents the limit value for the infiltration rate. Hydraulic conductivity can be determined in the field or in the laboratory. In this study, the determination of Ks was performed on the field by applying two methods: the double-opened ring method used at a very shallow depth (5 cm) and the Porchet method (PM) at a depth of 20 cm. Both of these methods have a transient regime. They were requested because of their simplicity, accuracy, complementarity, and low implementation costs [25]. For each given test point, a double-ring method and a Porchet method were assigned. The 20 cm depth was chosen because it is considered to be a zone that is influenced by farming practices (plowing). According to Collinet and Lafforge [26], there is no clear relationship between soil infiltration capacity and the organization of their internal structures.
2.2.1. Double-Opened Ring Method: Device and Operation
In order to overcome equipment shortages and achieve our goal in this study, the double-ring infiltrometer device was designed with care using rigid steel. It was modeled with two rings of 22 cm in diameter for the inner ring and 38 cm in diameter for the outer ring. The equipment was set up in the field by sinking the double ring 5 cm deep into the ground to prevent lateral water flow during the experiment. At the same time, the device was fitted with a levelogger for the automatic measurement of water level into the inner ring and two Frequency Domain Reflectrometry (FDR) probes that controlled variation in soil water content during the experiment. The two sensors were calibrated on the basis of measurements taken at a time resolution of 5 min. Once the device was installed, the levelogger and the FDR probes were switched on. The experiment was carried out by uniformly spreading around 400 mL of water inside the double ring every 30 s for 15 min to achieve a complete saturation of the ground. Depending on the soil conditions, the duration of any trial could take from 1 to 4 h.
2.2.2. Porchet Method
The Porchet method was chosen because of its advantage in measuring permeability in multilayer soils [26]. The principle of the method consists of digging a hole, filling it with water, and measuring the temporal variation in water level. In this study, the hole was 20 cm deep and 10 cm in diameter. The use of pvc (PolyVinyl Chloride) pipe prevented the risk of the hole wall collapsing, which could distort the results of the experiment. Monitoring the decrease in the water level contained in the hole made it possible to calculate the hydraulic conductivity value by using empirical formulas.
2.2.3. Field Trial Deployment Method
Two main factors directed the deployment of the test points across the watershed area:
- -
- The combination of soil type, land use, and farming practices;
- -
- The steeper slope line of the watershed, which takes into account the different hydrogeomorphological aspects associated with the structural organization of the long profile shaped by erosion and alluvial deposits.
Indeed, in the first case, it is important to note that all soil types do not have the same occupation, and all cultivated plots do not have the same agricultural techniques. The location of any test point will, therefore, depend on all these factors. In the second case, the topography, which is defined by the longitudinal profile of the Mayo Mizao watershed, reflects a precise pedological organization shaped by water erosion (on upstream slopes) and sedimentation (downstream). The material removed from the slopes was deposited progressively, according to size. In this case, it may be noted that in the upstream of the watershed, soils are not very evolved and consist of coarse materials (products of physical alteration, nodules) that have been more or less reconstituted. In the middle stream, soils are clayey and well-reconstituted (evolved soils). In the downstream, there are colluvial deposits made up of fine, more or less powdery materials (silty-clay texture). Therefore, it seems worthwhile to take into account this structural organization of the landscape in the strategy aimed at defining the location of a field test point.
The number of test points was theoretically planned at first. Thus, for each land use class affected by any soil type, we assigned a test point (A in Table 1), and a total of 31 test points were required for each method. However, farming practices that are dependent on the will of the farmers can change on the same plot during the same rainy season. During the period of our field campaign, five farming practices were identified: rainfed crops plowed up with a machine; rainfed crops plowed up with a hoe; slash-and-burn crops; irrigated crops that are practiced in wetlands; fallowing (Figure 2). By taking into account this component of landscape (except irrigated land and fallowing), some of the soil types received more test points than others (B in Table 1) because of the difference observed in their agricultural development. The above criteria have resulted in a spatial distribution of test points in the field, as defined in Figure 3.

Table 1.
Distribution of the number of test points performed in the Mayo Mizao watershed area.
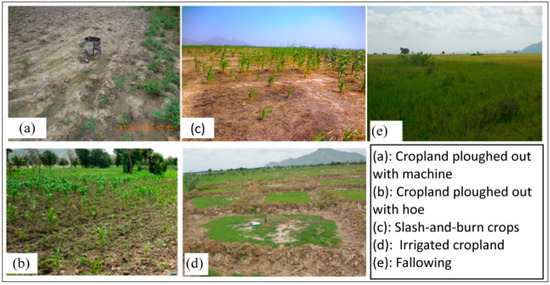
Figure 2.
Main farming practices identified in the Mayo Mizao watershed.
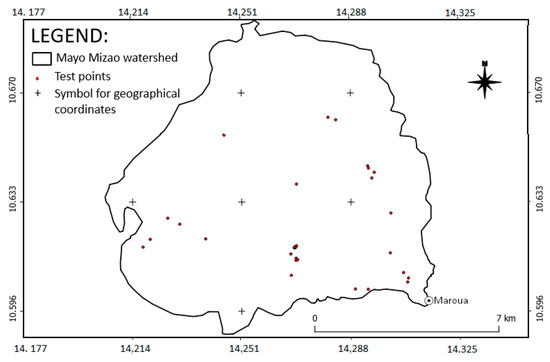
Figure 3.
Number and spatial distribution of the test points through the watershed surface area.
2.3. Data Processing and Analysis
The data processing methods included two essential steps, namely the calculation of hydraulic conductivity values based on empirical formulas and analysis of these.
2.3.1. The Calculation of the Saturated Hydraulic Conductivity Values
The saturated hydraulic conductivity values (Ks) are obtained by applying the empirical formulas to the raw data collected in the field when the vertical flow of water becomes constant, and the soil has reached its saturation state [25].
In the case of the double-ring test, we know that the flow inside the inner ring is considered to be constant. The quantity of infiltrated water is given by the equation below:
In Equation (1), is the expression of the speed of infiltration. Therefore, Darcy’s law can be applied to the vertical flow descending inside the inner ring, considering that at the depth Zw, the hydraulic load is null due to the influence of atmospheric pressure. In this case, the hydraulic gradient is given as follows:
where h∗ is the hydraulic load applied inside the inner ring. The relationship of Darcy can be written as follows:
v = ki
Equating the two equations of the flow inside the inner ring leads to obtaining the formula of hydraulic conductivity, also called the permeability coefficient:
Considering Equation (4) above, we can note the following:
Zw (cm) = the depth at which the double ring was sunk into the ground;
H (cm) = hydraulic load;
A (cm2) = the surface of the inner ring;
∆h (cm) = the variation of water level during the time “t” taken by the experiment;
V (cm3) = A1·∆h = the volume of the infiltrated water.
In the case of the Porchet test, we can note that at the initial time t1 (s), the water level in the hole is h1 (cm). Then, at the final time, t2 (s), the water level in the hole becomes h2 (cm). The flow rate of water into the soil is given as follows:
with
Q = KsSI,
Q (cm3/s) = flow rate of water flow into the soil;
Ks (cm/s) = saturated hydraulic conductivity;
I = driving slope;
S (cm2) = wet section (bottom surface of the hole + side surface).
According to the Darcy theory,
where l (cm) is the wet length. In this experiment, the driving slope I was not known, and we considered that I = 1, which is close to reality because it increases when the preliminary humectation is long [25].
I = h/l,
In this case, Formula (5) becomes the following:
Q = Ks·S
S, which represents the wet area of the hole, is expressed as follows:
where S (cm2) = moistened surface of the hole, R (cm) = the section of the hole, h (cm) = wet height, and π = 3.14.
S = ᴨR2 + 2ᴨRh,
By integrating Equation (8) with Equation (7), we obtained the following:
Q = 2ᴨKsR (h + R/2)
On the other hand, the expression of the flow rate of water through the ground is the following:
Q = −ᴨR2dh/dt
By equaling Equations (9) and (10), we obtained Equation (11) as follows:
−ᴨR2dh/dt = 2ᴨKsR (h + R/2)
By transforming Equation (11), we obtained the Equation (12) as follows:
By integrating (12), this became the following:
Equation (12) can also be explained as follows:
Finally, Equation (15) represents the expression of the saturated hydraulic conductivity that governs the Porchet method:
For both the double-ring and Porchet methods, the Ks values were corrected for temperature since the tests were performed in a warm environment where the temperature conditions were different from the reference temperature. For the Sudano-Sahelian environment, we considered that the reference temperature for this study was 20 °C, which corresponds to a dynamic water viscosity of 1 Centipoise and a correction factor of 0.66 (Table 2). The temperature correction is given by Equation (16):
with

Table 2.
Variation in field temperature correction factors according to reference temperature.
temperature correction factor that has no unit;
: saturated hydraulic conductivity measured at the field conditions;
: saturated hydraulic conductivity corresponding to the corrected temperature.
2.3.2. Data Analysis
The data analysis was based on graphical methods of data representation and then on statistical methods of data description, visualization, and comparison. Graphical data comparison methods allowed us to identify landscape conditions that were favorable or not favorable to infiltration. In addition, the use of descriptive statistics allowed us to characterize the distribution of saturated hydraulic conductivity values (Ksd and Ksp). Thus, parameters such as mean, standard deviation, and extreme values were performed. Following this, the application of the Boxplot method made it possible to assess the dispersion of Ksd and Ksp values around their means and to then visualize more easily the so-called ‘extreme values’, which are more likely to be outliers. In addition, the normality of the distributions of Ks values was verified by applying the Shapiro–Wilk test to the data series, and the Wilcoxon test was used to compare the two matched samples of field data (Ksd and Ksp).
3. Results
3.1. Lithology, Land Use Type, and Hydraulic Conductivity (Ks) of Soils in the Mayo Mizao Watershed
The Mayo Mizao watershed contains nine classes of soil (Figure 4). Among them, vertisols and gray soils with a halomorphic tendency occupy nearly 70% of the watershed surface area. The eastern and western borders of the watershed are bordered by outcrops of crystalline rocks. To the east, there are volcanic formations, mainly olivine basalt and dolerite. To the west, we find plutonic formations consisting mainly of anatexis granite, syntectonic granite, or migmatite [24].
The land use features are given from the African land cover database in 2015. Four main land use classes can be, therefore, identified: rainfed crops, mixed crops/vegetation, mixed vegetation/crops and closed to open landscape (Figure 5).
With regard to soil hydraulic conductivity values, the table below (Table 3) presents the statistical distribution of ks (Ksd, Ksd). At a depth of 5 cm, Ksd varies from 4 mm/h to 150 mm/h, with a mean of 36 mm/h and a standard deviation of 34 mm/h. However, at a depth of 20 cm, Ksp data range from 0.05 mm/h to 416 mm/h, with a mean of 38 mm/h and a standard deviation of 92 mm/h. Thus, we can see that there is a strong dispersion of Ks values around the means, especially with regard to data from the Porchet method (Ksd). Between the surface (5 cm) and the depth (20 cm), there is heterogeneity in hydraulic conductivity data, suggesting more extreme values of Ksp.

Table 3.
Statistical distribution of hydraulic conductivity values for the Mayo Mizao watershed.
3.2. Impact of Soil Type on the Variability of Ks in the Mayo Mizao Watershed
The balance between infiltration and runoff depends on the soil type due to its structure [27] and its surface conditions [28,29,30]. In the Mayo Mizao watershed, the results of this study show that regardless of the measurement technique, vertisols are the lithological formation that has the highest resistance to infiltration. Resistance to infiltration is also remarkably observed in soils derived from loose materials with a sandy-clay texture, in gray soils with a halomorphic tendency, and in undifferentiated halomorphic soils (Figure 6). The impermeability of the soils mentioned above could be justified firstly by their low organic matter content and secondly by their grain size, most of which is dominated by fine materials, sometimes adding a high proportion of sandy materials [28,31]. It should be noted that the structural stability of soil depends on its intrinsic characteristics, which could make it more vulnerable to rainfall aggressiveness and, hence, to crusting. Therefore, since these soil types cover more than 75% of the Mayo Mizao watershed surface area, their implication in the genesis of runoff and flooding should rightly be considered in this study.
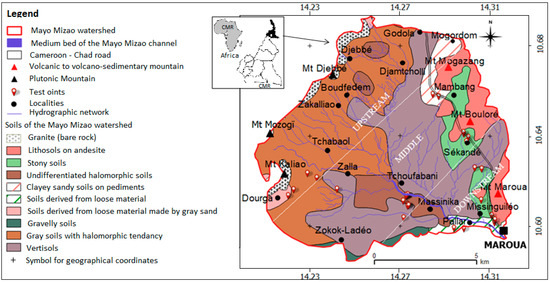
Figure 4.
Soil class distribution in the Mayo Mizao watershed [31].
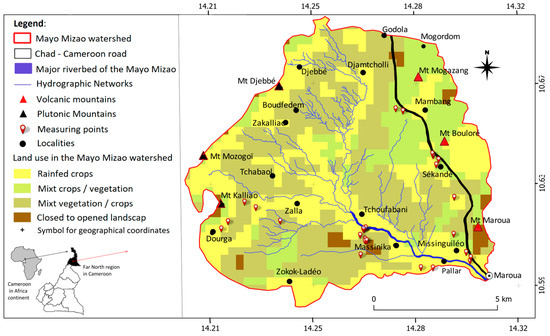
Figure 5.
Distribution of the main land use classes in the Mayo Mizao watershed (http://2016africalandcover20m.esrin.esa.int/ accessed on 11 August 2016).
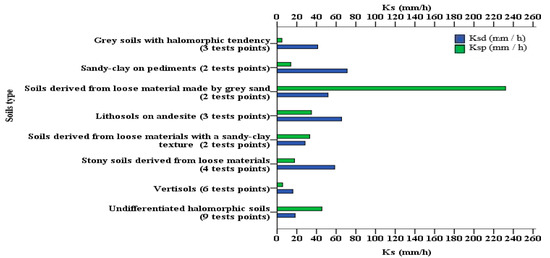
Figure 6.
Variability of KS values according to the soil type in the Mayo Mizao watershed.
In addition, we were given the opportunity to compare the degree of permeability observed between the surface (5 cm) and depth (20 cm) using the Wilcoxon test. Before doing so, it is important to check the normality of the distribution of Ks values by applying the Shapiro–Wilk test. Thus, to the null hypothesis H0 (samples follow a normal distribution), we opposed the alternative hypothesis Ha (samples do not follow a normal distribution). Regarding the results in (Table 4), we accept that the alternative hypothesis was retained for each of the two samples, as the calculated p-value (0.0001) was below the significance threshold α = 0.05. This means that the distributions of the two samples (Ksd and Ksp) did not follow a normal distribution and that the risk λ of rejecting the null hypothesis H0 when it is true was less than 1%.

Table 4.
Results of the Shapiro–Wilk test.
According to the Wilcoxon test itself, the principle consists of testing the null hypothesis H0 (the distribution of the two samples is not significantly different) against the Ha hypothesis (the distribution of the two samples is significantly different). The results show that the alternative hypothesis Ha (the two distributions are significantly different) was supported, and the risk λ of these results being considered true when they are false was less than 1.07% for the first sample (Ksd) and less than 4.89% for the second sample (Ksp). The results of this test (Table 5) mean that for the same type of soil, hydraulic conductivity values at the topsoil are different, with some obtained at depth. The variability of permeability at the soil surface area and depth is then under the control of different factors. It may be considered that the difference in the hydrodynamic behavior of soils is due to the organization and the structure of the soil layers, generally shaped by the nature of the soil, the land use type, and the cultivation practices.

Table 5.
Results of the Wilcoxon test applied to Ksd and Ksp values.
Analysis of the results in (Figure 7) shows that, for the majority of individual test points, the soils have high surface permeability and low depth permeability (Ksd > Ksp), with the exception of the following test points: 150813P4, 150901P7, 150901P8, 160309P13, 160317P17, 160930P20, 161001021, and 170320P31, where Ksd < Ksp. This result may not always be true when considering the weighted average of Ks values obtained from test points carried out on the same soil type (Figure 6). The exceptions mentioned above are linked, on the one hand, to an abundance of granular material on the surface and, on the other hand, to the modification of the surface condition due to encrusting. To better understand this, we need to look at material texture. Indeed, it should be noted that the silty-sandy texture, sandy texture, or sandy-clay texture of soil is a factor that is at the origin of soil crusting. Clearly, a crusted surface will inhibit infiltration [29,32]. The inverse gradient of permeability can be considered the result of an accumulation of alluvia upstream or the consequence of colluvial deposits left by flood damping in major beds. Similarly, the difference in soil permeability between the surface and the lower depth could also be explained by the differences in the layers’ structural homogeneity or in the operation between the two infiltration measurement methods. In fact, during the double-ring test, the lateral flow of water is prohibited by the outer ring; this makes the vertical flow more predominant, and the test should not concern many layers. In the case of the Porchet test, the flows are carried out in the vertical and lateral directions, and many layers may be affected by the test. In addition, we can see that the Porchet test provided very spread-out hydraulic conductivity values (upwards) with so many extreme values (332 mm/h and 415 mm/h) (Figure 8). The dispersion of the Ksp values could express the effect of the lateral flow during the Porchet experiment.
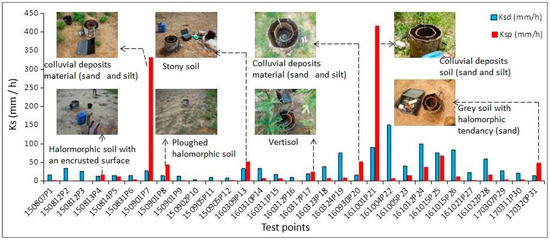
Figure 7.
Comparison of hydraulic conductivity values between the surface (5 cm) and the soil depth (20 cm).
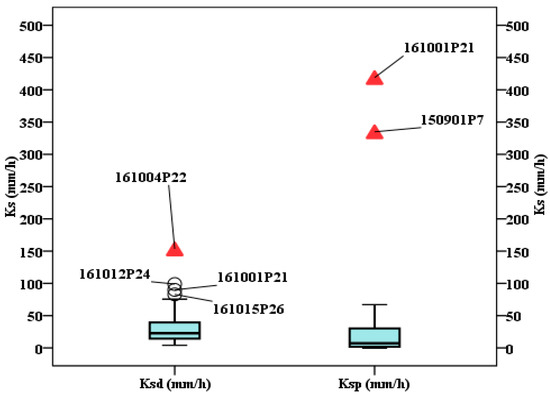
Figure 8.
Distribution of hydraulic conductivity values obtained using the double-ring test and the Porchet test.
3.3. Influence of Land Use Type on the Variability of Ks in the Mayo Mizao Watershed
According to Shukla [33] and Di et al. [34], land use has direct or indirect effects on infiltration capacity. In the case of the Mayo Mizao watershed, four main land use classes were identified and tested: rainfed crops; mixed crops (rainfed crops, off-season crops, irrigated crops)/vegetation (pasture, shrub, forest); mixed vegetation (pasture, shrub, forest)/crops (rainfed crops, off-season crops, market gardening), and finally, the closed to opened landscape (hardwood or softwood; evergreen or deciduous; shrubs). The results of the field experiments show that the cropland landscape is more favorable to infiltration than the covered land (closed to opened landscape, mixt vegetation/crops) (Figure 9).
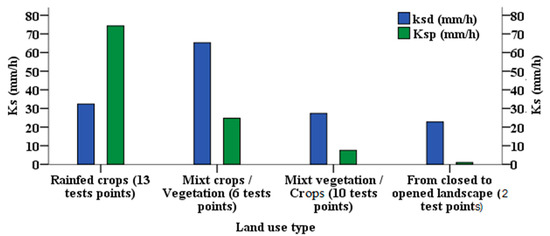
Figure 9.
Variability in saturated hydraulic conductivity related to land use type in the Mayo Mizao catchment.
The results above could be explained by the fact that tillage, which leads to the creation of clods, aggregates, and pore networks, makes the soil structure looser, less compact, and more permeable to water flow [28,29,30,35]. The high hydraulic conductivity values of the croplands and plowed lands have also been observed in other West African catchment areas, particularly in the Tougou catchment in northern Burkina Faso [36]. However, it is prudent to express reservations about the involvement of tillage in increasing soil hydraulic conductivity values. According to previous studies that have been carried out in both the Sahelian area [29,30,37,38] and in other bioclimatic environments, in particular in the Mediterranean area [35,39,40], the increase in soil infiltration capacity following plowing constitutes a dynamic state during that growing season. Thus, under the influence of the intensity and cumulative rainfall, the conditions of cropland surface are enhanced over time toward an unfavorable state for infiltration, as under the impact of the energy of successive raindrops, the aggregates and porosity initially generated by tillage fade after a certain time. From then on, encrusting is reconstituted at the surface, and subsequent rains, even of low intensity, will be sufficient to generate runoff. According to Andrieux [35], cumulation and rainfall intensities are not the only factors responsible for the decrease in infiltration capacity in the croplands. In fact, soils with high clay content in the first 10 cm of depth are also responsible for the decrease in soil infiltration capacity. When comparing the values of Ksd and Ksp obtained in the same given land use class, we can see that Ksd > Ksp, except in the case of plots occupied by rainfed crops, where Ksd < Ksp. This could once again reflect the short-term consequences of tillage activity in association with rainfall intensity and accumulation. However, it seems that the combination of the effects resulting from soil type and land use type could influence hydraulic conductivity in one direction or in the other, depending on the case.
3.4. Combined Effects of Soil Type and Land Use Type on the Variability of Ks
By taking into account the combined effects of soil type and land use type (Figure 10), we realized that for the same soil type, Ks vary according to the land use type. For example, in the case of vertisols, Ks is found to be higher on mixed vegetation/crop plots than on rainfed plots. Similarly, it can be seen that for the same land use type, Ks varies according to the soil type. For example, it can be noted that for a plot occupied by mixed vegetation/crops, Ks is higher in gray soils with a halomorphic tendency (at the surface) than in vertisols. Such observations, therefore, allow us to confirm that the preponderance of each soil type over the variability of Ks depends on the land use type, and the opposite is also true. However, the part of the influence of each landscape feature was not determined.
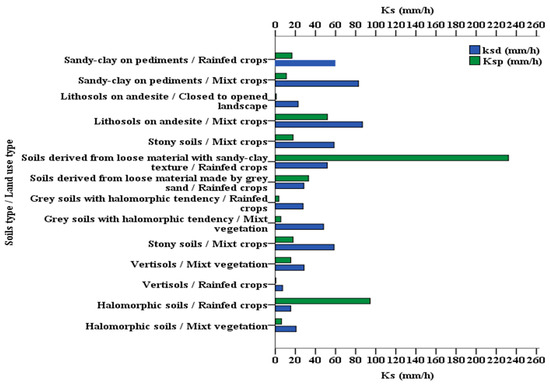
Figure 10.
Combined effects of soil type—land use type on the variability of the saturated hydraulic conductivity in the Mayo Mizao watershed.
3.5. Impact of the Cultivation Practices on the Variability of Ks in the Mayo Mizao Catchment
The influence of farming practices was tested on two of the most cultivated soil types in the Mayo Mizao catchment. These are vertisols and undifferentiated halomorphic soils. These two soil classes cover nearly half of the surface area of this catchment.
3.5.1. Farming Practices Conducted on the Vertisols
The spatial variability of saturated hydraulic conductivity as a function of farming practices on vertisols shows that plowed plots have the lowest Ks values (A in Figure 11). Therefore, we can consider that the practice of plowing on vertisols leads to a decrease in infiltration and an increase in runoff. This result is in line with those obtained by Seyni-Boukar [37] and Peugeot [29]. Thus, after studying the influence of tillage on the infiltration capacity of Sahelian soils, the above authors came to the conclusion that tillage is responsible for increasing runoff by reducing the infiltration capacity in vertisols. According to them, plowing helps to bring back to the surface the elementary particles buried in the soil. From then on, and under the effect of the kinetic energy of the raindrops, these elementary particles will cause the intergranular pores to clog. The result is the formation of an impermeable shell that prevents water infiltration. Similarly, Fiès and Castelao-Guegunde [39] also experimented with the effect of tillage on runoff. Thus, by applying kinetic energy rains ranging from 70 to 340 J·m−2 to a plowed silty-clayey soil, they noticed that the volume of structural pores decreases by 60% when the kinetic energy of the rain increases. They then estimated a reduction in soil infiltrability by a factor of 10. Such a mechanism of structural soil reorganization induced by tillage is particularly characteristic of vertisols due to their high fine content [37].
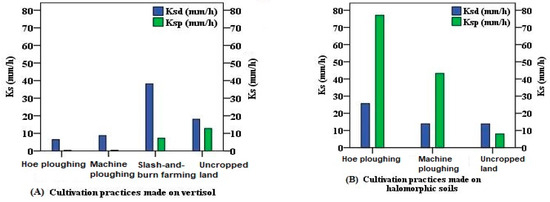
Figure 11.
Variability of hydraulic conductivity according to the farming practices made on the vertisols and on the halomorphic soils.
Contrary to the effect of plowing on the hydraulic conductivity of vertisols, the results show that slash-and-burn farming and fallowing seem to increase infiltration rather than runoff. This result is supported by [41]. Indeed, slash-and-burn farming has a reducing effect on the infiltration capacity of soils because of its structural modification. The magnitude of the effects of slash-and-burn farming on the hydraulic conductivity of soils would be dependent on the intensity of the calcination or the length of time between the pre-burnt and post-burnt periods. However, due to the high spatial and temporal variability of rainfall, there are many studies conducted under natural rainfall (rather than simulated rainfall) that have shown a more stimulating role for bushfire on soil infiltration capacity. Thus, to talk about the Mayo Mizao watershed, where this study was carried out under simulated rain, one would rather have expected a reducing effect from the practice of slash-and-burn farming on the infiltration capacity of the soil, which is quite the opposite. As such, one could attribute this difference in the hydrodynamic behaviors of burned land to the nature of the soil rather than to an agricultural practice itself. It would, therefore, be interesting to note that in vertisols, there are networks of shrinkage slits that constitute a significant source of permeability and whose densification could come from the desiccation process generated by the practice of burning [28]. In the case of fallowing, it should be noted that the increase in infiltration observed in this study could be explained by the influence of vegetation cover in the infiltration–runoff relationship. Vegetation cover is involved at several levels in the fight against runoff [42]. Thus, thanks to the interception of raindrops by the aerial parts of the plant (leaves, branches, and trunk), vegetation cover contributes to reducing the erosive energy of rainfall by preventing the splash effect. Thanks to the litter and bushes, the vegetation cover also acts directly on runoff by acting as an obstacle to the water flow. In addition, thanks to the root system, the plant cover ensures that the soil’s structural cohesion is maintained. Similarly, the development of organic matter from plant residues improves soil porosity and, therefore, promotes infiltration. To summarize, the action of vegetation in increasing infiltration takes place directly and indirectly. In terms of the vertical variability of hydraulic conductivity, it can be seen that whatever the farming practice, the Ks values are higher on the surface than at depth.
3.5.2. Farming Practices Conducted on the Halomorphic Soils
The hydraulic conductivity (Ks) on halomorphic soils is higher in plowed plots than in fallowed plots (B in Figure 11). This situation is quite the opposite of that observed in vertisols. We can see that the influence of soil type on hydraulic conductivity inhibits farming practices. In fact, halomorphic soils are indurated soils with low organic matter content and a high content of sandy or gravelly materials. Plowing breaks down the compactness of the land, making it looser and more permeable to water. This phenomenon has also been observed by Segalen [31], Casenave and Valentin [28], and Peugeot [29] in the same Sahelian environment. However, the practice of fallowing on halomorphic soils leads to reduced infiltration. Moreover, Fournier et al. [43], who studied the role of fallowing land on runoff and soil erosion in the locality of Bondukury in Burkina Faso, found the opposite results. The results of their study conducted on sandy soils with a low slope (5%) showed that the fallowed plots had the lowest annual runoff coefficients, i.e., 13% compared with 20% for cultivated plots and 50% for bare soil. However, the comparison between the results of the various studies should take into account the stage of evolution of the fallowed land itself [43]. It should, therefore, be noted that the capacity of fallowing to promote infiltration depends on the presence and extent of bedding or the density of the plant cover. In Far North Cameroon and specifically in the Mayo Mizao catchment, vegetation is almost entirely grassy, while the time allocated to fallowing is relatively short. Consequently, the mineral soils of this region are poorly covered with litter [28]. In addition, it should be noted that halomorphic soils in Far North Cameroon have mechanical properties that are not consistent with infiltration in the first 10 cm of depth due to their prismatic and compact structure [31]. During fallowing, the degree of the compactness of this soil should increase, and so runoff should increase as well [30].
To summarize the above paragraphs, we can note that the variability in hydraulic conductivity under different farming practices in the Mayo Mizao watershed suggests two contradictory situations depending on the nature of the soil where the tests were performed. In the case where cultivation practices are carried out on vertisols, plowing seems to be responsible for the decrease in infiltration. The practice of slash-and-burn farming and then fallowing, on the other hand, has less significant impacts, as it is inhibited by the natural properties of the vertisols. In the case of halomorphic soils, plowing seems to increase infiltration. This hydrodynamic behavior of plowed halomorphic soils is linked to their high sand content and to the dismantling of the surface level area, which gives this soil a looser and more permeable structure. On the other hand, halomorphic soils on which fallowing is practiced are against infiltration due to the encrusting that develops at the surface layers.
4. Discussion
Many researchers from all over the world have reported that different types of soil and land use have different abilities in passing water into the ground. Bare soil tends to be prone to erosion, reducing the soil’s infiltration capacity and increasing surface runoff. Increasing the runoff coefficient will increase the peak discharge in a watershed. The decrease in the river capacity due to sediment can cause a river flood. According to Basga et al. [44], flooded vertisols from northern Cameroon have a high content of clay that displays dispersion and flocculation under rainfall and then inhibits vertical infiltration. Shabtai et al. [45] studied the effects of soil and land use change on the structure and hydraulic conductivity (Ks) of vertisols in northern Ethiopia. Their results are similar to ours. Indeed, they observed a difference in saturated hydraulic conductivity between the surface of vertisols and depth. According to them, the low saturated hydraulic conductivity values observed at the surface are associated with the phenomenon of swelling of vertisols in contact with rainwater. These swellings are, therefore, higher at the surface than at depth and in cultivated soils than in savannah and forest soils. They, therefore, concluded that the conversion of natural savannah vegetation to crops and tillage operations must have destabilized the initial soil structure in cultivated plots, which in turn reduced the ability of the soil to infiltrate. Several other studies carried out in the Sahelian zone [37,46,47,48,49] have also confirmed the results of this study by concluding that the internal (clay and sandy-clay textures) and external soil factors, such as farming practices (plowing and slash-and-burn farming), lead to the crusting and then to the reduction in soil infiltration capacity. Similarly, numerous studies carried out in other semi-arid regions have produced the same conclusion. It is the case of Chartier et al. [50] in Patagonia (Argentina), Anderson [51] in the lower Mississippi River Valley, and Liu et al. [52] in Shandong (China). To conclude this paragraph, we can say that the involvement of vertisols and halomorphic soils on the one hand and cultivated land and plowing practices on the other hand in the genesis of floods is all the more significant given their considerable extent in the Far North region of Cameroon.
Overall, it should be noted that poor water transfer within the surface formations of a watershed is the cause of runoff and flooding. In the case of the Mayo Mizao watershed, soil types marked by grain seize and its external structural organization have an influence on infiltration and, therefore, on runoff and flooding. In addition, it should be noted that the evolution of landscapes, associated with changes in land use and land cover, and then certain farming techniques, are factors responsible for the genesis of runoff and flooding. Prior identification of the landscape factors behind flooding can help people improve flood hazard management and mitigation strategies. Thus, a number of land management actions can be applied to improve the infiltration capacity of soils across the catchment studied or across a similar environment. Strategies can be agronomic, hydraulic, or ecosystem-based. On the agronomic level, local farmers should limit machine plowing practices or, on the contrary, practice mulching in order to limit the impact of raindrops on soil erosion and crusting [53]. Similarly, practices such as crop rotation, fallowing, humification of cultivated plots [54], and subsoiling should be encouraged to ensure increased soil infiltration capacity. Ecologically, deforestation control and reforestation policies for denuded watersheds should be implemented to limit runoff and soil erosion [55]. Similarly, farmers should practice terrace cropping in steeply sloping areas (hillsides) to minimize runoff and soil water erosion [56]. According to hydraulic measures, farmers should ensure sediment trapping or set up temporary rainwater retention structures (folds, dikes, benches, ponds, hillside reservoirs, embankments, hedges, vegetated cordons) to slow runoff across the watershed [52,57].
To conclude this section, we can say that the involvement of vertisols and halomorphic soils on the one hand and cultivated land and plowing practices on the other in the genesis of floods is all the more significant given their considerable extent in the Far North region of Cameroon. Thus, through watershed redevelopment policies and the practice of agricultural techniques appropriate to each soil type, we could achieve sustainable flood management in the area concerned.
5. Conclusions
In a nutshell, this study shows that the genesis of runoff in the Mayo Mizao watershed is dependent on soil type, land use, and farming practices. The influences of these factors are simultaneous. However, with regard to soil type, it should be noted that vertisols, halomorphic soils, and gray soils with a halomorphic tendency are the three main soil types that offer considerable resistance to water infiltration. This is probably due to the high content of fine materials, the compactness that varies, and the advance or earlier stage of pedogenesis. As far as the influence of land use in infiltration, it should be noted that the role of croplands is relevant. With regard to the role of farming practices, it should be noted that, apart from plowing, which favors infiltration during the early stages of the rainy season (but is unfavorable in the advanced stage of the rainy season), the impacts of most agricultural practices on infiltration are strongly inhibited by the soil type.
This study is a contribution to a better understanding of the socio-ecological and hydrological functioning of the Sahelian watersheds, which have recently been dominated by many extreme hydrological events.
Supplementary Materials
The following supporting information can be down-loaded at https://www.mdpi.com/article/10.3390/w16121672/s1, Table S1: Methodology of the determination of the field saturated hydraulic conductivity values obtained by the double ring infiltrometry method; Table S2: Methodology of the determination of the field saturated hydraulic conductivity values obtained by the Porchet infiltrometry method.
Author Contributions
L.B. designed the project, prepared the figures, and wrote the manuscript. P.-A.A. designed the methodology and supplied the field instruments. S.S., P.-A.A. and L.B. read and improved the manuscript. All authors have read and agreed to the published version of the manuscript.
Funding
The authors declare that they have not received any funding.
Data Availability Statement
The data supporting the results of this study are available within this paper and in Supplementary Information File.
Conflicts of Interest
The authors declare no conflicts of interest.
References
- EM-DAT The International Disaster Database. CRED/UCLouvain. 2023. Available online: https://public.emdat.be (accessed on 12 August 2023).
- Assefa, M.M.; Wossenu, A. Landscape Dynamics, Soils and Hydrological Processes in Varied Climate; Springer International Publishing: Cham, Switzerland, 2016; 822p. [Google Scholar]
- Rogger, M.; Agnoletti, M.; Alaoui, A.; Bathurst, J.C.; Bodner, G.; Borga, M.; Chaplot, V.; Gallart, F.; Glatzel, G.; Hall, J.; et al. Land use change impacts on floods at the catchment scale: Challenges and opportunities for future research. Water Resour. Res. 2017, 53, 5209–5219. [Google Scholar] [CrossRef] [PubMed]
- Yuan, Y.; Fang, G.; Yan, M.; Sui, C.; Ding, Z.; Lu, C. Flood-Landscape Ecological Risk Assessment under the Background of Urbanization. Water J. 2019, 11, 1418. [Google Scholar] [CrossRef]
- Nwilo, P.C.; Olayinka, C.J.; Okolie, E.I.; Emmanuel, E.I.; Orji, M.J.; Daramola, O.E. Impacts of land cover changes on desertification in northern Nigeria and implications on the Lake Chad Basin. J. Arid Environ. 2020, 181, 104190. [Google Scholar] [CrossRef]
- Cotillon, S.E. Séries Chronologiques de L’utilisation et de L’occupation des Terres en Afrique de l’Ouest; Fact Sheet; U.S. Geological Survey: Reston, VA, USA, 2017; 4p. [Google Scholar] [CrossRef]
- Amogu, O.; Esteves, M.; Vandervaere, J.P.; Malam, A.M.; Panthou, G.; Rajot, J.-L.; Souley, Y.K.; Boubkraoui, S.; Lapetite, J.-M.; Dessay, N.; et al. Runoff evolution due to land-use change in a small Sahelian catchment. Hydrol. Sci. J. 2014, 60, 78–95. [Google Scholar] [CrossRef]
- Descroix, L.; Mahé, G.; Olivry, J.C.; Albergel, J.; Tanimoun, B.; Amadou, I.; Coulibaly, B.; Bouzou, M.I.; Faran, M.O.; Malam, A.M.; et al. Facteurs anthropiques et environnementaux de la recrudescence des inondations au Sahel. In Les Sociétés Rurales Face Aux Changements Climatiques et Environnementaux en Afrique de L’ouest; Sultan, B., Lalou, R., Amadou Sanni, M., Oumarou, A., Soumaré, M.A., Eds.; IRD: Wellington, New Zealand, 2015; pp. 153–170. [Google Scholar]
- Hermans, K.; McLeman, R. Climate change, drought, land degradation and migration: Exploring the linkages. Curr. Opin. Environ. Sustain. 2021, 50, 236–244. [Google Scholar] [CrossRef]
- Spinoni, J.; Barbosa, P.; Cherlet, M.; Forzieri, G.; McCormick, N.; Naumann, G.; Vogt, J.V.; Dosio, A. How will the progressive global increase of arid areas affect population and land-use in the 21st century? Glob. Planet. Chang. 2021, 205, 103597. [Google Scholar] [CrossRef]
- Chen, X.; Tian, C.; Meng, X.; Xn, Q.; Cui, G.; Zhang, Q.; Xiang, L. Analyzing the effect of urbanization on flood characteristics at catchment levels. Proc. IAHS 2015, 370, 33–38. [Google Scholar] [CrossRef]
- Guengant, J.P.; Banoin, M.; Quesnel, A. Dynamique des Populations, Disponibilités en Terres et Adaptation des Régimes Fonciers: Le Cas Du Niger; FAO et CICRED: Rome, Italy, 2003; 144p. [Google Scholar]
- Brandt, M.; Rasmussen, K.; Peñuelas, J.; Tian, F.; Schurgers, G.; Verger, A.; Mertz, O.; Palmer, J.R.B.; Fensholt, R. Human population growth offsets climate-driven increase in woody vegetation in sub-Saharan Africa. Nat. Ecol. Evol. 2017, 1, 0081. [Google Scholar] [CrossRef] [PubMed]
- CILSS. Les Paysages de L’afrique de L’ouest: Une Fenêtre sur un Monde en Pleine Evolution; U.S. Geological Survey EROS: Garretson, SD, USA, 2016; 236p. [Google Scholar]
- Gbohoui, Y.P.; Paturel, J.-E.; Fowe, T.; Karambiri, H.; Yacouba, H. Impacts des changements climatique et environnemental sur la réponse hydrologique du Nakambé à Wayen (Burkina Faso) à travers le cadre de budyko. Proc. IAHS 2021, 384, 269–273. [Google Scholar] [CrossRef]
- Ndongo, B.; Mbouendeu, L.S.; Hiregued, J.P. Impacts socio-sanitaires et environnementaux de la gestion des eaux pluviales en milieu urbain sahélien: Cas de Maroua, Cameroun. Afr. Sci. 2015, 11, 237–251. [Google Scholar]
- Bouba, L.; Sauvagnargues, S.; Gonné, B.; Ayral, P.-A.; Ombolo, A. Trends in rainfall and flood hazard in the Far North region of Cameroon. Geo-Eco-Trop 2017, 41, 339–358. [Google Scholar]
- Fotsing, E. Small Savannah: An Information System for the Integrated Analysis of Land Use Change in the Far North of Cameroon. Ph.D. Thesis, Universiteit Leiden, Leiden, The Netherlands, 2009; 376p. [Google Scholar]
- Wafo, T.G.; Fotsing, J.M. Quantification de l’évolution du couvert végétal dans la réserve forestière de Laf-Madjam au nord du Cameroun par télédétection satellitale. Sécheresse 2010, 21, 169–178. [Google Scholar]
- Leroux, L.; Oszwald, J.; Ngounou, N.B.; Sebag, D.; Penven, M.J.; Servat, E. Le bassin versant du Mayo-Tsanaga (Nord Cameroun): Un bassin versant expérimental pour une compréhension des relations Homme/Milieu. Rev. Française Photogram. Téléd. 2013, 202, 42–54. [Google Scholar] [CrossRef]
- Beidi, E.; Souaré, A.; Adamou, I. Evaluation of anthropization indicators of the floristic landscapes of Kaélé hills in the Sudano-Sahelian zone of Cameroon. Environ. Chall. 2021, 5, 100393. [Google Scholar] [CrossRef]
- Kodji, P.; Tchobsala, A.I. Use of plant resources by refugees from Minawao and their impact on the Sahelian savannah of Cameroon. Environ. Chall. 2021, 5, 100270. [Google Scholar] [CrossRef]
- Olivry, C. Fleuves et Rivières du Cameroun. Monog. Hydrol. ORSTOM 1986, 9, 781. [Google Scholar]
- Morin, S. «Géomorphologie». In Atlas de la Région de l’Extrême-Nord Cameroun; Seignobos, C., Iyébi-Mandejeck, O., Eds.; IRD: Paris, France, 2000; pp. 13–17. [Google Scholar]
- Chossat, J.-C. La Mesure de la Conductivité Hydraulique Dans les Sols. Choix des Méthodes; Lavoisier: Paris, France, 2005; 720p. [Google Scholar]
- Collinet, J.; Lafforgue, A. Mesures de Ruissellement et de L’érosion Sous Pluies Simulées Pour Quelques Types de Sols de Haute Volta; ORSTOM: Abidjan, Cote d’Ivoire, 1979; 129p. [Google Scholar]
- Masse, D. Amélioration du Régime Hydrique des Sols Dégradés en Vue de Leur Réhabilitation. Cas des Vertisols au Nord Cameroun; ORSTOM: Paris, France, 1993; 142p. [Google Scholar]
- Casenave, A.; Valentin, C. Les États de Surface de la Zone Sahélienne: Influence sur L’infiltration; ORSTOM: Paris, France, 1989; 231p. [Google Scholar]
- Peugeot, C. Influence de L’encroûtement Superficiel du Sol Sur le Fonctionnement Hydrologique D’un Versant Sahélien (Niger). Expérimentations In-Situ et Modélisation. Ph.D. Thesis, Joseph Fourier University, Grenoble, France, 1995; 355p. [Google Scholar]
- Boli, B.Z.; Roose, E.; Bep, A.; Ziem, B.; Kallo, S.; Waechter, F. Effets des techniques culturales sur le ruissellement, l’érosion et la production de coton et maïs sur un sol ferrugineux tropical sableux. Recherche de systèmes de culture intensifs et durables en région soudanienne du Nord-Cameroun (Mbissiri, 1991–1992). Cah. Orstom Sér. Pédol. 1993, 28, 309–325. [Google Scholar]
- Segalen, P. Carte Pédologique du Nord Cameroun au 1/1000 000. Feuille Maroua; ORSTOM: Paris, France, 1962; 71p. [Google Scholar]
- Tessier, D. Rôle de l’eau sur les propriétés physiques des sols. Sécheresse 1994, 5, 143–150. [Google Scholar]
- Shukla, M.K. Soil Hydrology, Land Use and Agriculture. Measurement and Modelling; CAB Intern.: Perai, Malaysia, 2011; 455p. [Google Scholar]
- Di, S.; Hong, Y.; Dexin, G.; Ming, Y.; Jiabing, W.; Fenghui, Y.; Changjie, J.; Anzhi, W.; Yushu, Z. The effects of land use change on soil infiltration capacity in China: A metaanalysis. Sci. Total Environ. 2018, 626, 1394–1401. [Google Scholar]
- Andrieux, P. Effets des Pratiques Culturales sur le Ruissellement et L’érosion. Vigne, Sol et Environnement. Une Rencontre Profession-Recherche en Languedoc-Roussillon. Campus Agro-Inra Montpellier. 2006. Available online: http://sol.ensam.inra.fr/lisah/ (accessed on 12 August 2023).
- Zouré, C.; Queloz, P.; Koïta, M.; Niang, D.; Fowé, T.; Yonaba, R.; Consuegra, D.; Yacouba, H.; Karambiri, H. Modelling the water balance on farming practices at plot scale: Case study of Tougou watershed in Northern Burkina Faso. Catena 2019, 173, 50–70. [Google Scholar] [CrossRef]
- Seiny-Boukar, L.; Floret, C.; Moukouri, K.H.; Pontanier, R. Dégradation des Vertisols Dans le Nord-Cameroun: Modification du Régime Hydrique des Terres et Tentative de Réhabilitation. Utilisation Rationnelle de L’eau des Petits Bassins Versants en Zone Aride; AUPERLF-UREF John Libbey Eurotext: Paris, France, 1991; pp. 287–291. [Google Scholar]
- Lamachère, J.M. Aptitude au ruissellement et à l’infiltration d’un sol sableux fin après sarclage. Soil Water Balance in the Sudano Sahelian Zone. In Proceedings of the Niamey Workshop, Niamey, Niger, 18–23 February 1991; IAHS Publisher: Wallingford, UK, 1991. 12p. [Google Scholar]
- Fiès, J.C.; Castelao-Gegunde, A.M. Modification de l’espace poral des croutes de surface sous l’action des pluies et conséquences sur l’infiltrabilité. Agronomie 1996, 16, 367–379. [Google Scholar] [CrossRef]
- Blavet, D.; De Noni, G.; Roose, E.; Maillo, L.; Laurent, J.-Y.; Asseline, J. Effets des techniques culturales sur les risques de ruissellement et d‘érosion en nappe sous vigne en Ardèche (France). Secheresse 2004, 15, 111–120. [Google Scholar]
- Haigh, M.J. Fire effects on soils and restoration strategies. Land Reconstr. Manag. 2009, 5, 579. [Google Scholar]
- Rey, F. Restaurer les Milieux et Prévenir les Inondations Grâce au Génie Végétal; Quae: Versailles, France, 2018; 119p. [Google Scholar]
- Fournier, J.; Serpantié, G.; Delhoume, J.P.; Gathelier, R. Rôle des jachères sur les écoulements de surface et l’érosion en zone soudanienne du Burkina. Application à la gestion des terres cultivées. Sud Sci. Technol. 2000, 5, 12. [Google Scholar] [CrossRef]
- Basga, D.S.; Tsozué, D.; Temga, J.P.; Balna, J.; Nguetnkam, J.P. Land use impact on clay dispersion/flocculation in irrigated and flooded vertisols from northern Cameroon. Int. Soil Water Conserv. Res. 2018, 6, 237–244. [Google Scholar] [CrossRef]
- Shabtai, I.A.; Shenker, M.; Edeto, W.L.; Warburg, A.; Ben-Hur, M. Effects of land use on structure and hydraulic properties of Vertisols containing a sodic horizon in northern Ethiopia. Soil Tillage Res. 2014, 136, 19–27. [Google Scholar] [CrossRef]
- Collinet, J. Comportements Hydrodynamiques et Érosifs de Sols de L’afrique de L’ouest, Évolution des Matériaux et des Organisations Sous Simulation de Pluies. Ph.D. Thesis, de l’Institut de Géologie Strasbourg, Strasbourg, France, 1988; 630p. [Google Scholar]
- Alaoui, A.; Rogger, M.; Peth, S.; Blöschl, G. Does soil compaction increase floods? A review. J. Hydrol. 2018, 557, 631–642. [Google Scholar] [CrossRef]
- Amani, R.; Ibrahimi, K.; Sher, F.; Milham, P.; Ghazouani, H.; Chehaibi, S.; Hussain, Z.; Iqbal, H.M.N. Impacts of different tillage practices on soil water infiltration for sustainable agriculture. Sustainability 2021, 13, 3155. [Google Scholar] [CrossRef]
- Yira, Y.; Bossa, A.Y. Agricultural Expansion-Induced Infiltration Rate Change in a West African Tropical Catchment. Appl. Environ. Soil Sci. 2019, 1, 2434512. [Google Scholar] [CrossRef]
- Chartier, M.P.; Rostagno, C.M.; Pazos, G.E. Effects of soil degradation on infiltration rates in grazed semiarid rangelands of northeastern Patagonia, Argentina. J. Arid Environ. 2011, 75, 656–661. [Google Scholar] [CrossRef]
- Anderson, L.R. Land Use and Soil Property Effects on Infiltration and Soil Aggregate Stability in the Lower Mississippi River Valley. Master’s Thesis, University of Arkansas, Fayetteville, AR, USA, 2019. Available online: https://scholarworks.uark.edu/etd/3144 (accessed on 12 August 2023).
- Liu, Y.; Han, J.; Jiao, J.; Liu, B.; Ge, W.; Pan, Q.; Wang, F. Responses of flood speaks to land use and landscape patterns under extreme rainstorms in small catchments. A case study of the rainstorm of Typhoon Lekima in Shandong, China. Int. Soil Water Conserv. Res. 2022, 10, 228–239. [Google Scholar] [CrossRef]
- Montoroi, J.-P. Rôle des sols sur la genèse des inondations. Problèmes actuels de la protection contre les inondations. In Proceedings of the Symposium Européen, Paris, France, 28–30 March 2012. 6p. [Google Scholar]
- Andriambelomanga, E.; Ratsivalaka, S.; Andriamampianina, N.; Randriamboavonjy, J.-C.; Mparany, A. Amélioration de la gestion paysanne de la fertilité des sols des versants cultivés des collines, du bassin versant de Maniandro (Madagascar). In Lutte Anti-Érosive. Réhabilitation des Sols Tropicaux et Protection Contre les Pluies Exceptionnelles; Roose, É., Duchaufour, H., De Noni, G., Eds.; IRD: Wellington, New Zealand, 2018; 758p. [Google Scholar]
- Duran Zuazo, V.H.; Pleguezuelo, C.R. Soil-erosion and runoff prevention by plant covers. A review. Agron. Sustain. Dev. 2008, 28, 65–86. [Google Scholar] [CrossRef]
- Wakponou, A.; Mainguet, M.; Dumay, F. Les techniques de cultures en terrasse dans les monts Mandara, Extrême Nord Cameroun. In Lutte Anti-Érosive. Réhabilitation des Sols Tropicaux et Protection Contre les Pluies Exceptionnelles; Roose, É., Duchaufour, H., De Noni, G., Eds.; IRD: Wellington, New Zealand, 2018; 758p. [Google Scholar]
- Poulard, C.; Chastan, B.P.R.; Degoutte, G.; Grelot, F.; Erlendbruch, K.; Nédélec, Y. Prévention des inondations par ralentissement dynamique: Principe et recommandation. Sci. Eaux Territ. 2008, 5–24, Consulté le 26 mai 202 à l’adresse. Available online: https://revue-set.fr/article/view/6263 (accessed on 12 August 2023).
Disclaimer/Publisher’s Note: The statements, opinions and data contained in all publications are solely those of the individual author(s) and contributor(s) and not of MDPI and/or the editor(s). MDPI and/or the editor(s) disclaim responsibility for any injury to people or property resulting from any ideas, methods, instructions or products referred to in the content. |
© 2024 by the authors. Licensee MDPI, Basel, Switzerland. This article is an open access article distributed under the terms and conditions of the Creative Commons Attribution (CC BY) license (https://creativecommons.org/licenses/by/4.0/).