
Landscape Pattern Changes of Aquatic Vegetation Communities and Their Response to Hydrological Processes in Poyang Lake, China


 ,
, 
Abstract
1. Introduction
2. Study Area and Data Sources
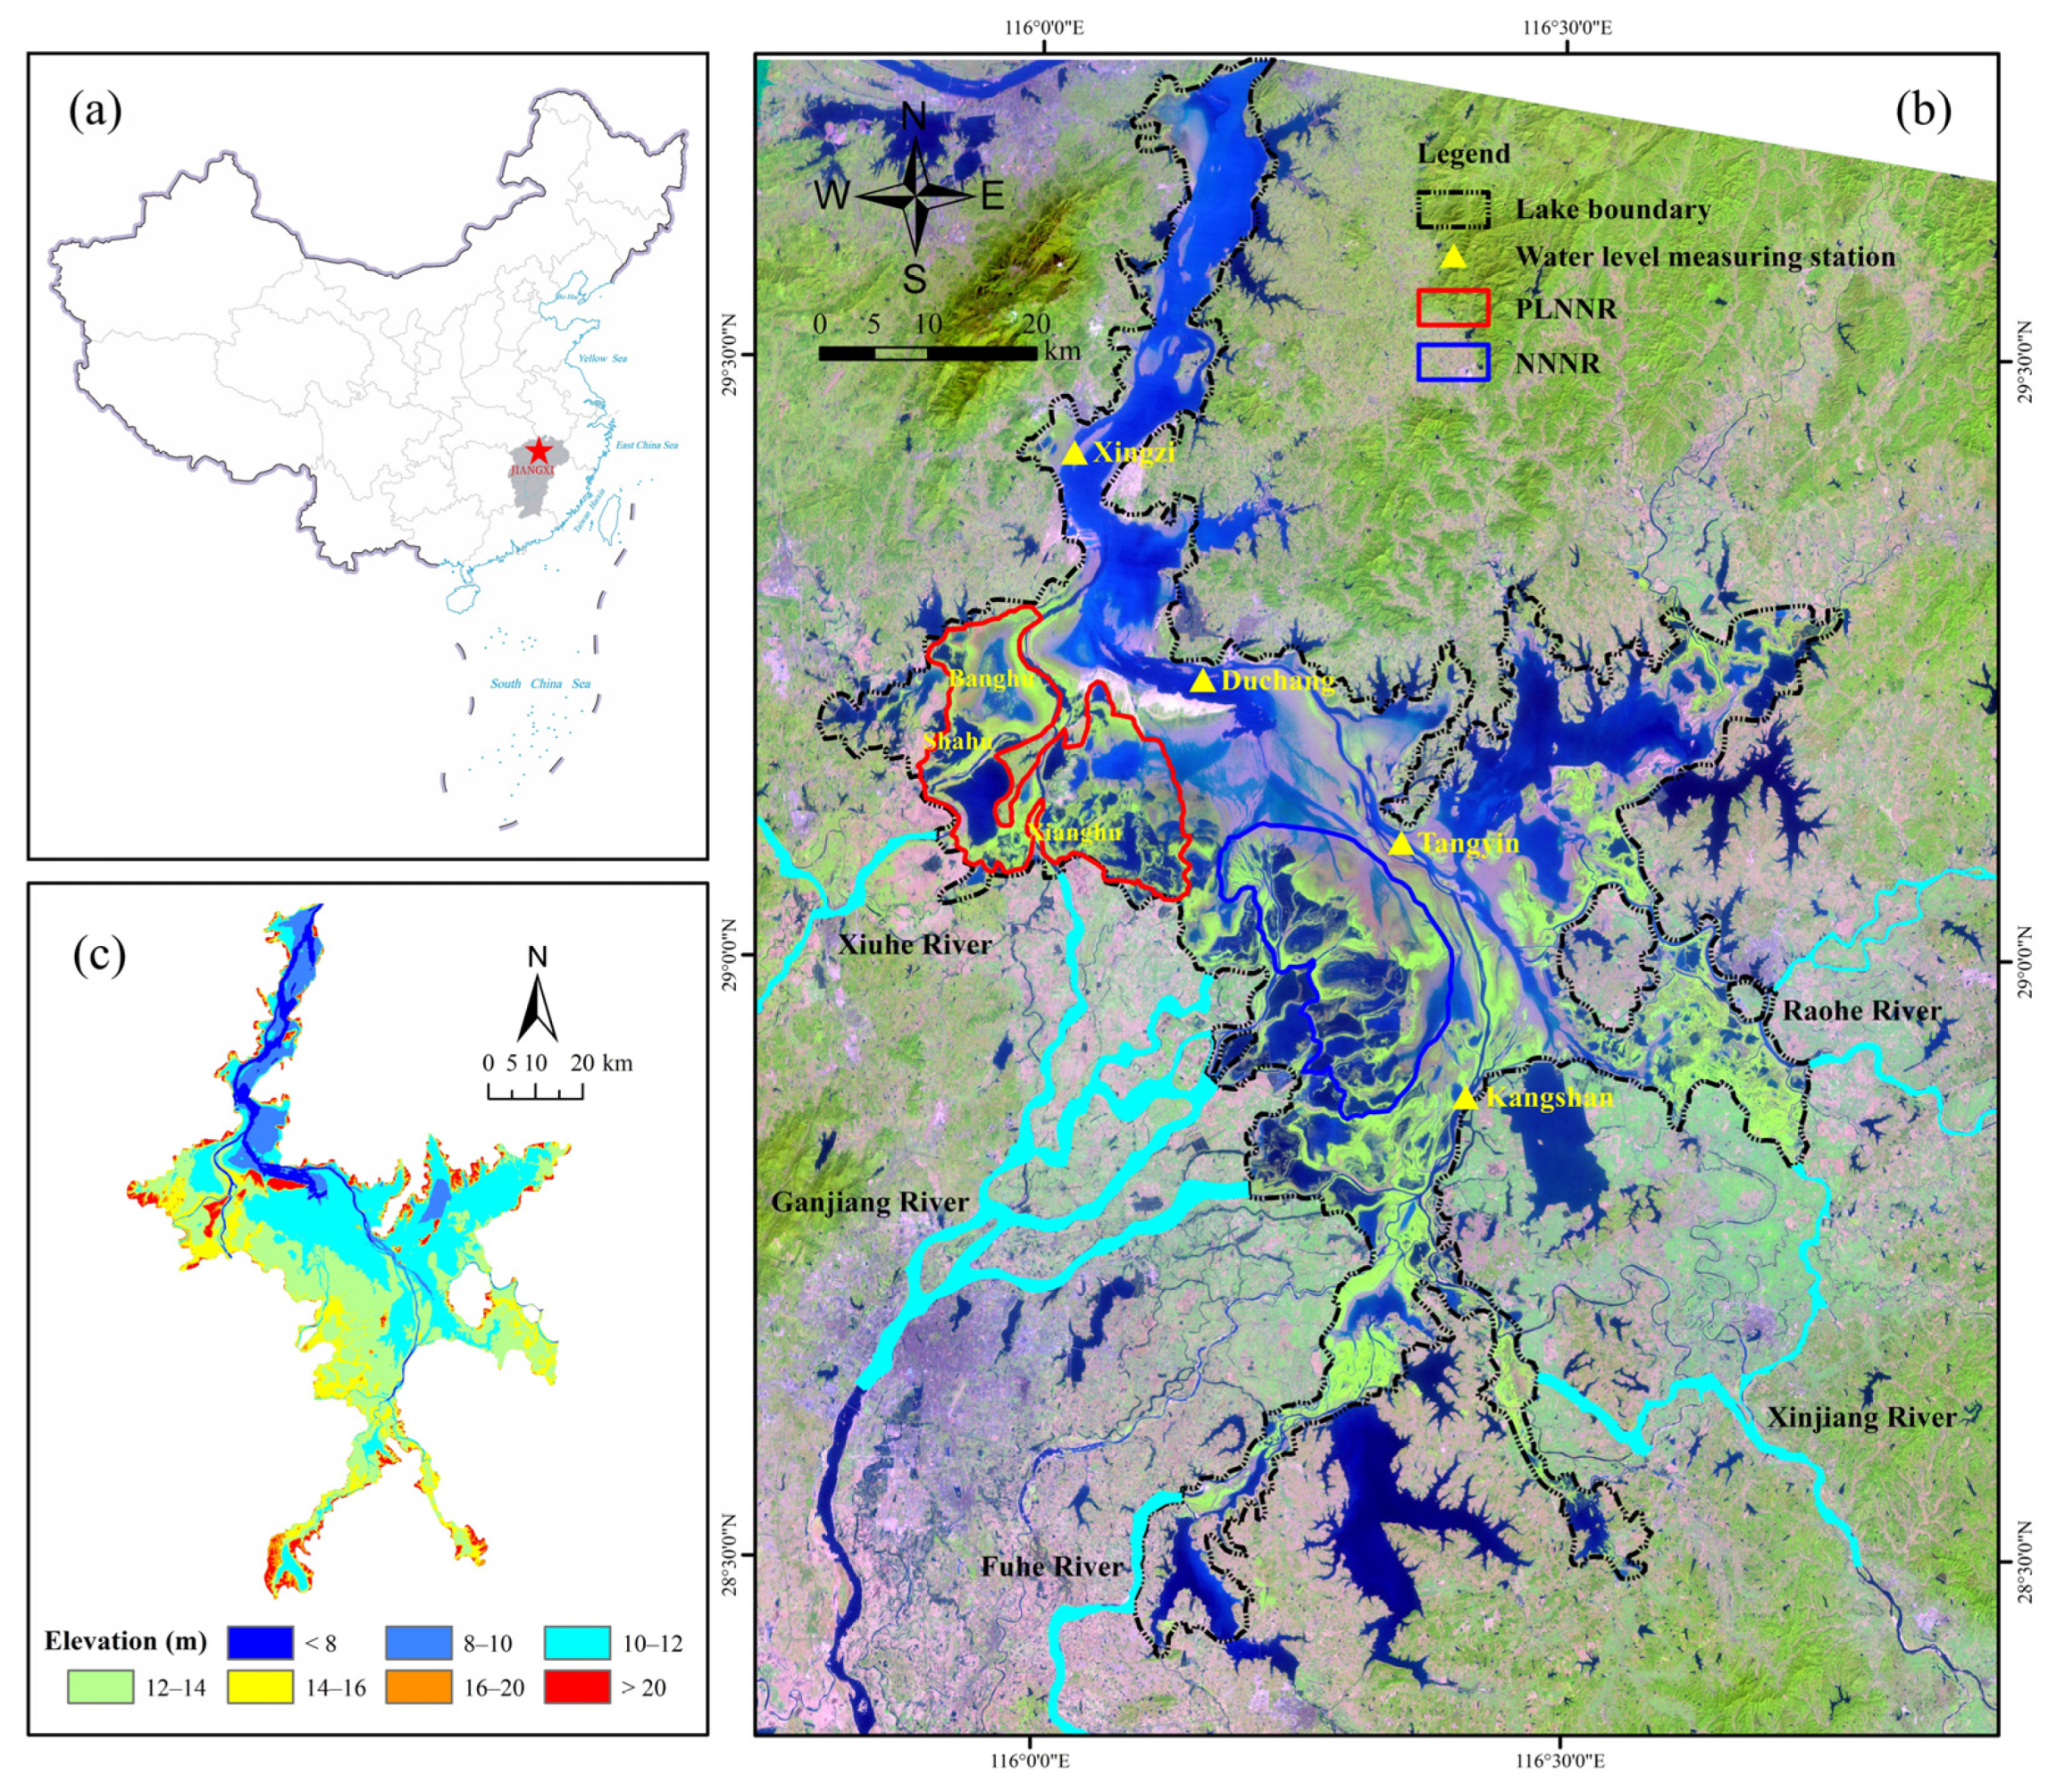
2.1. Study Area
2.2. Lake Morphology
2.3. Data Sources
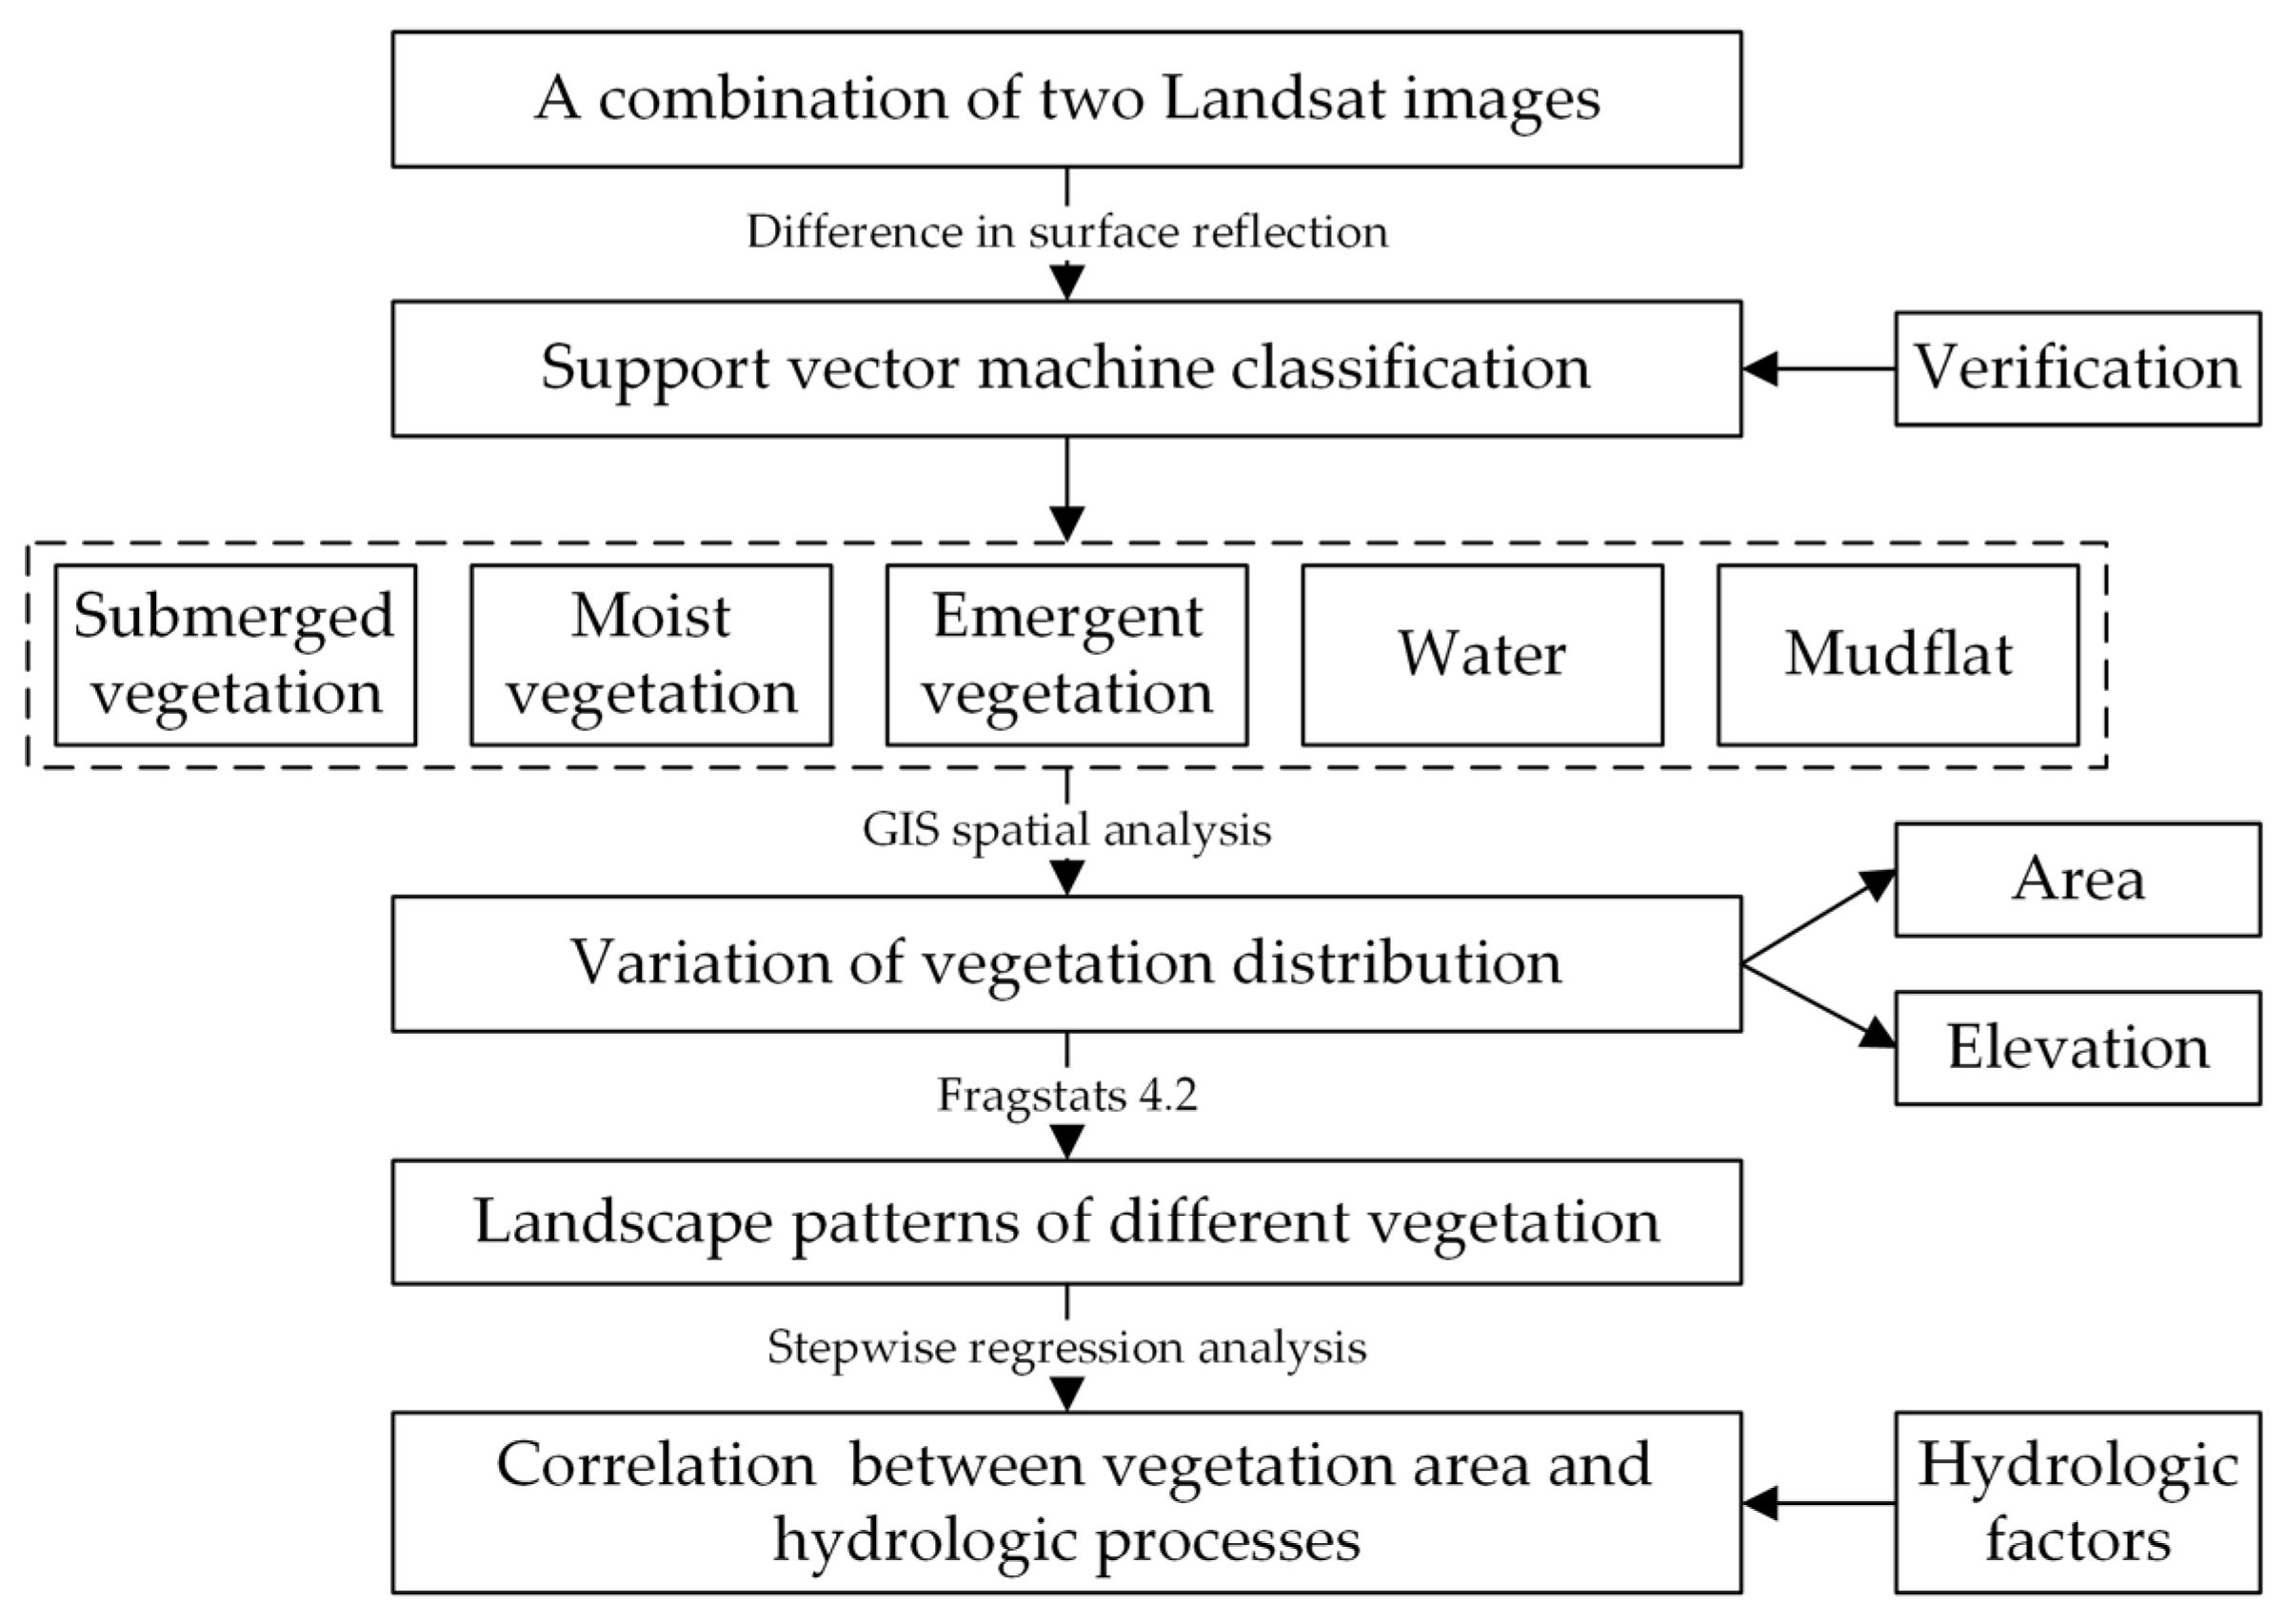
3. Method
3.1. Classification of Land-Cover Types
3.1.1. Difference in Surface Reflection
3.1.2. Image Processing
3.1.3. Accuracy Evaluation
3.2. Landscape Pattern Analysis
3.3. Correlation Analysis Method
4. Results
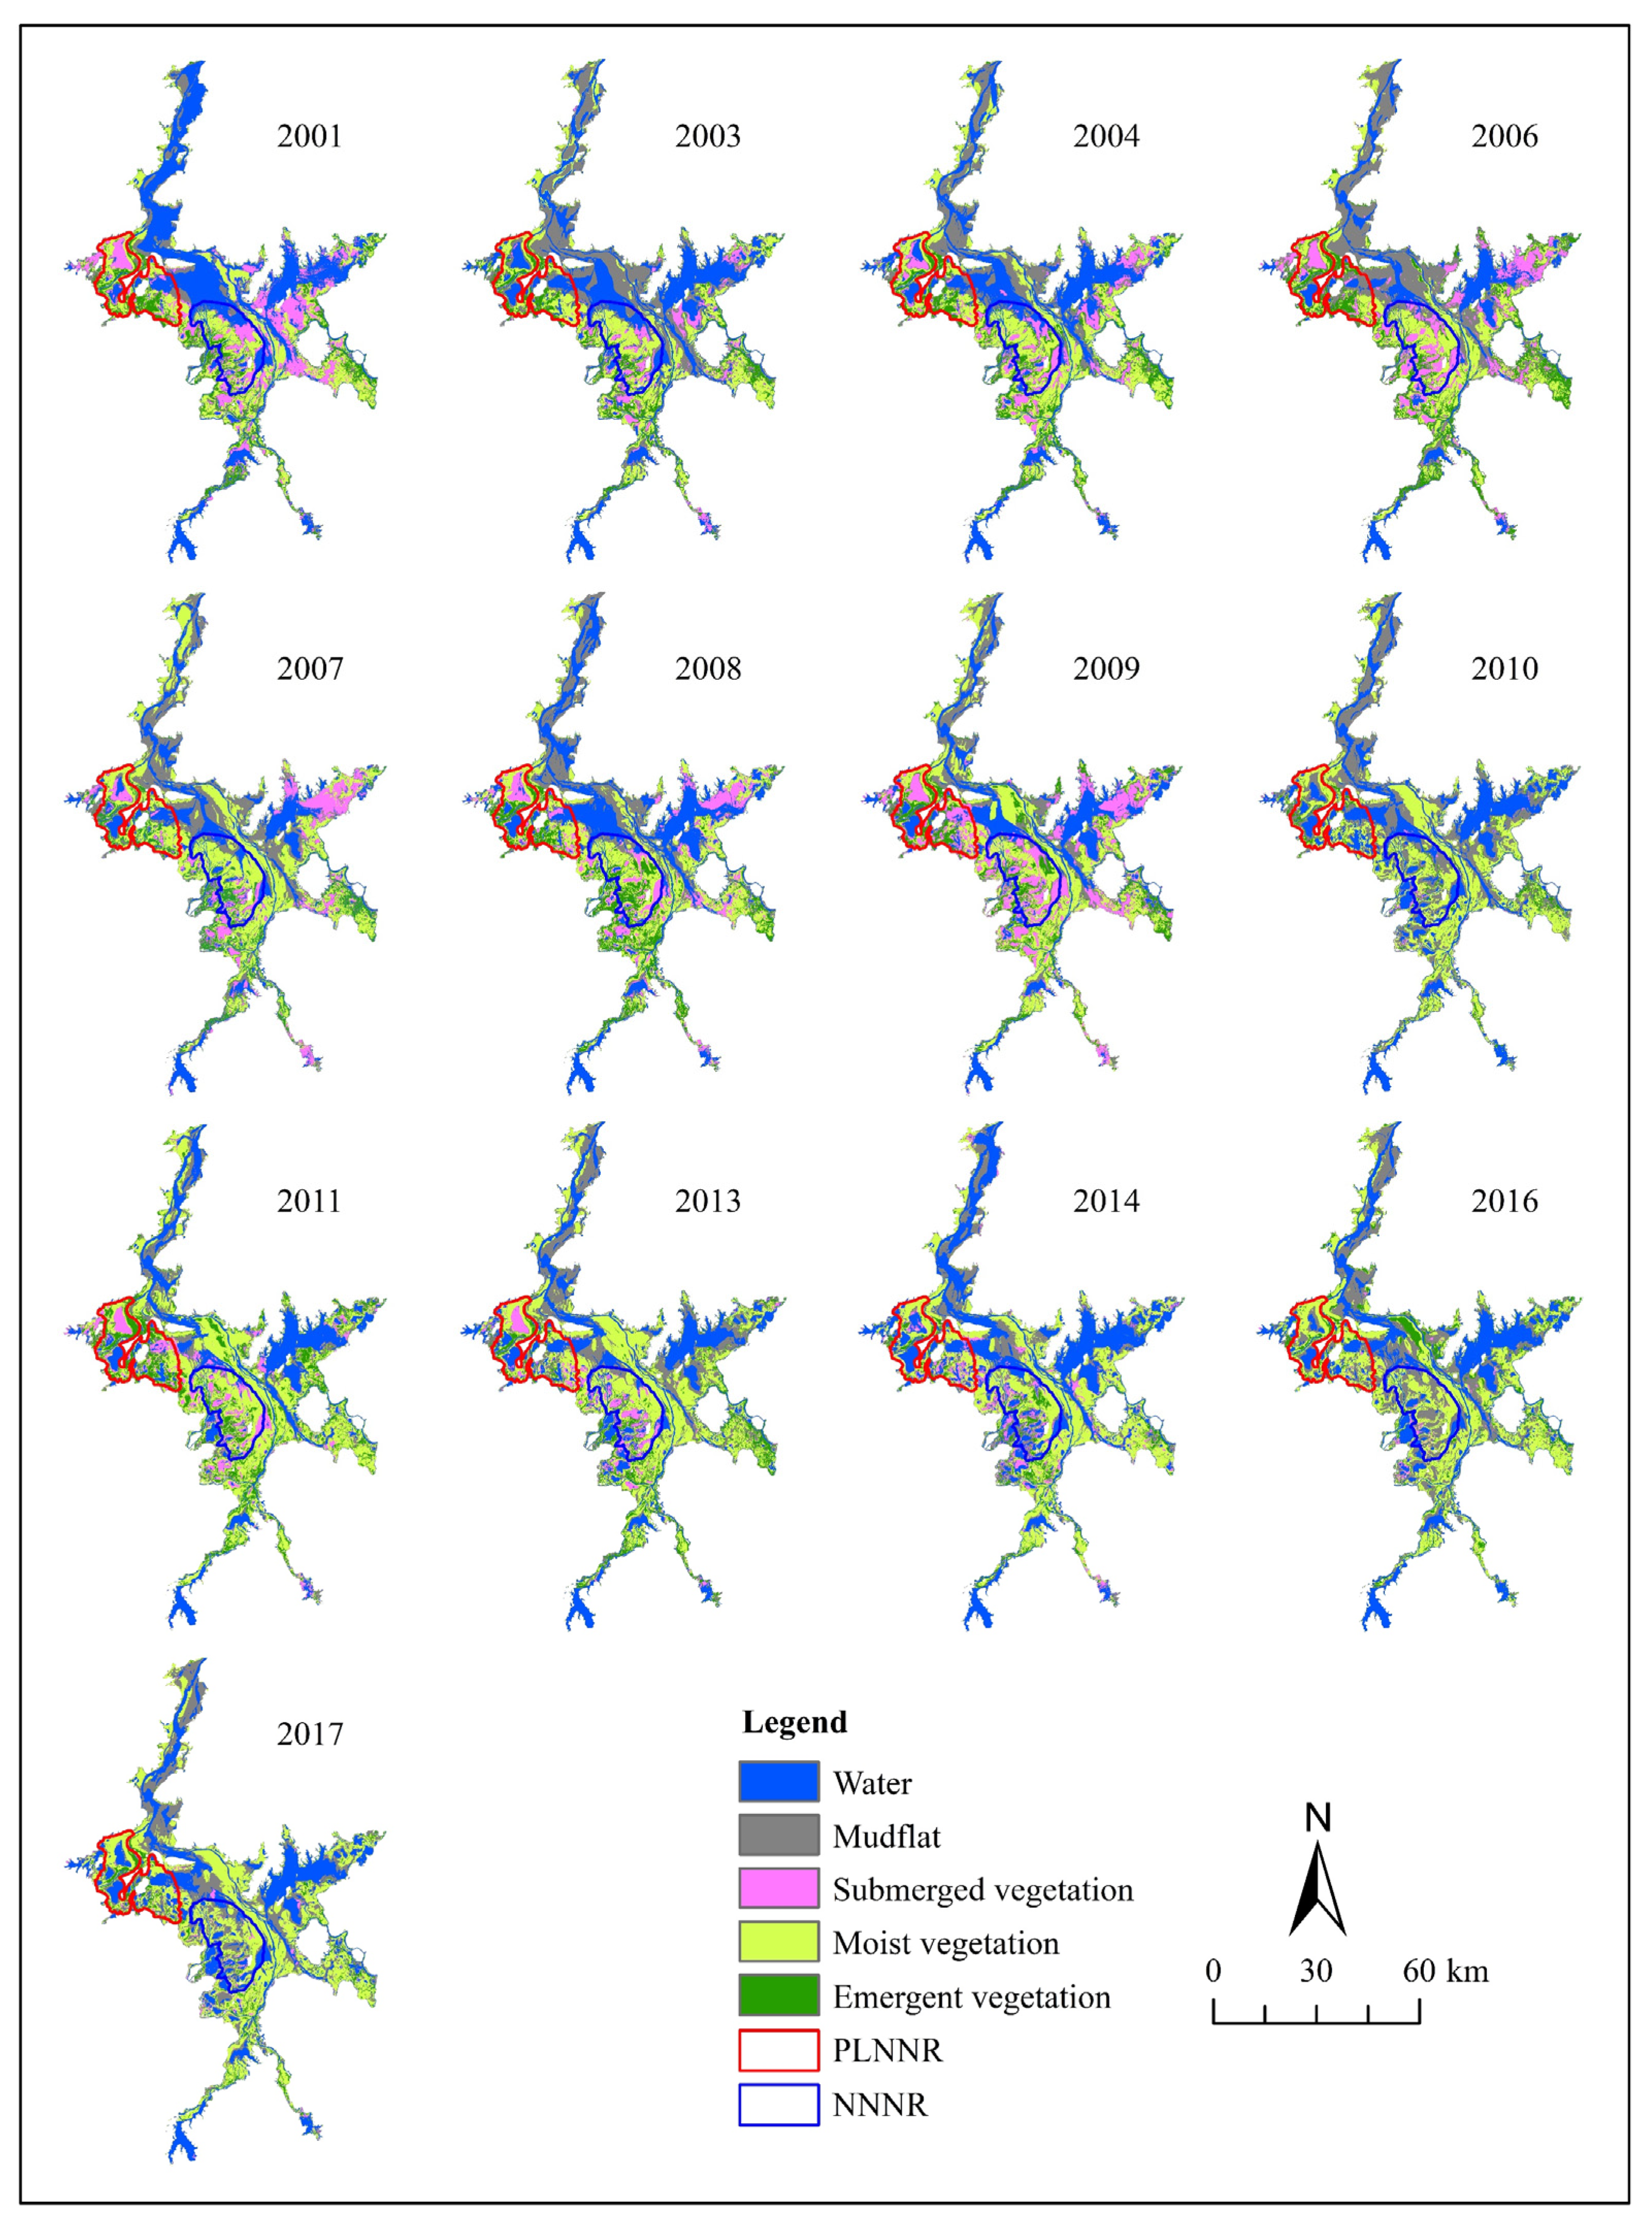
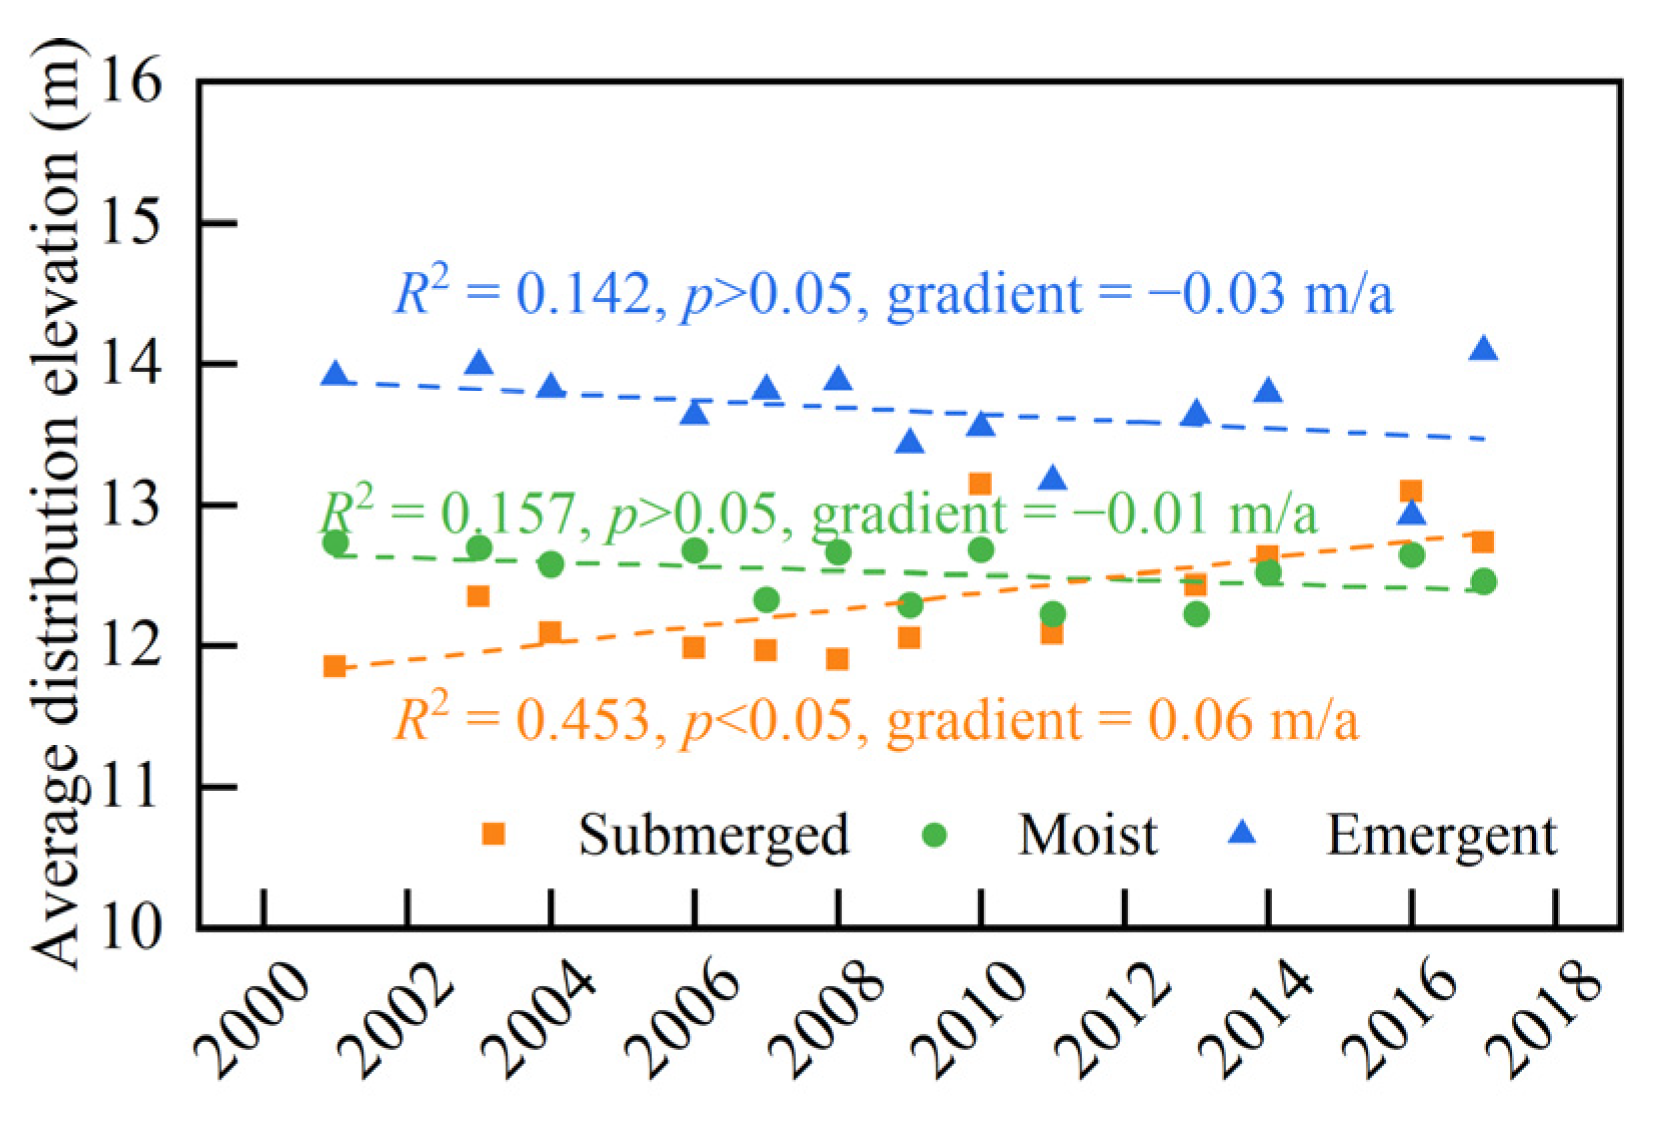
4.1. Annual Variation of Vegetation Communities in Poyang Lake
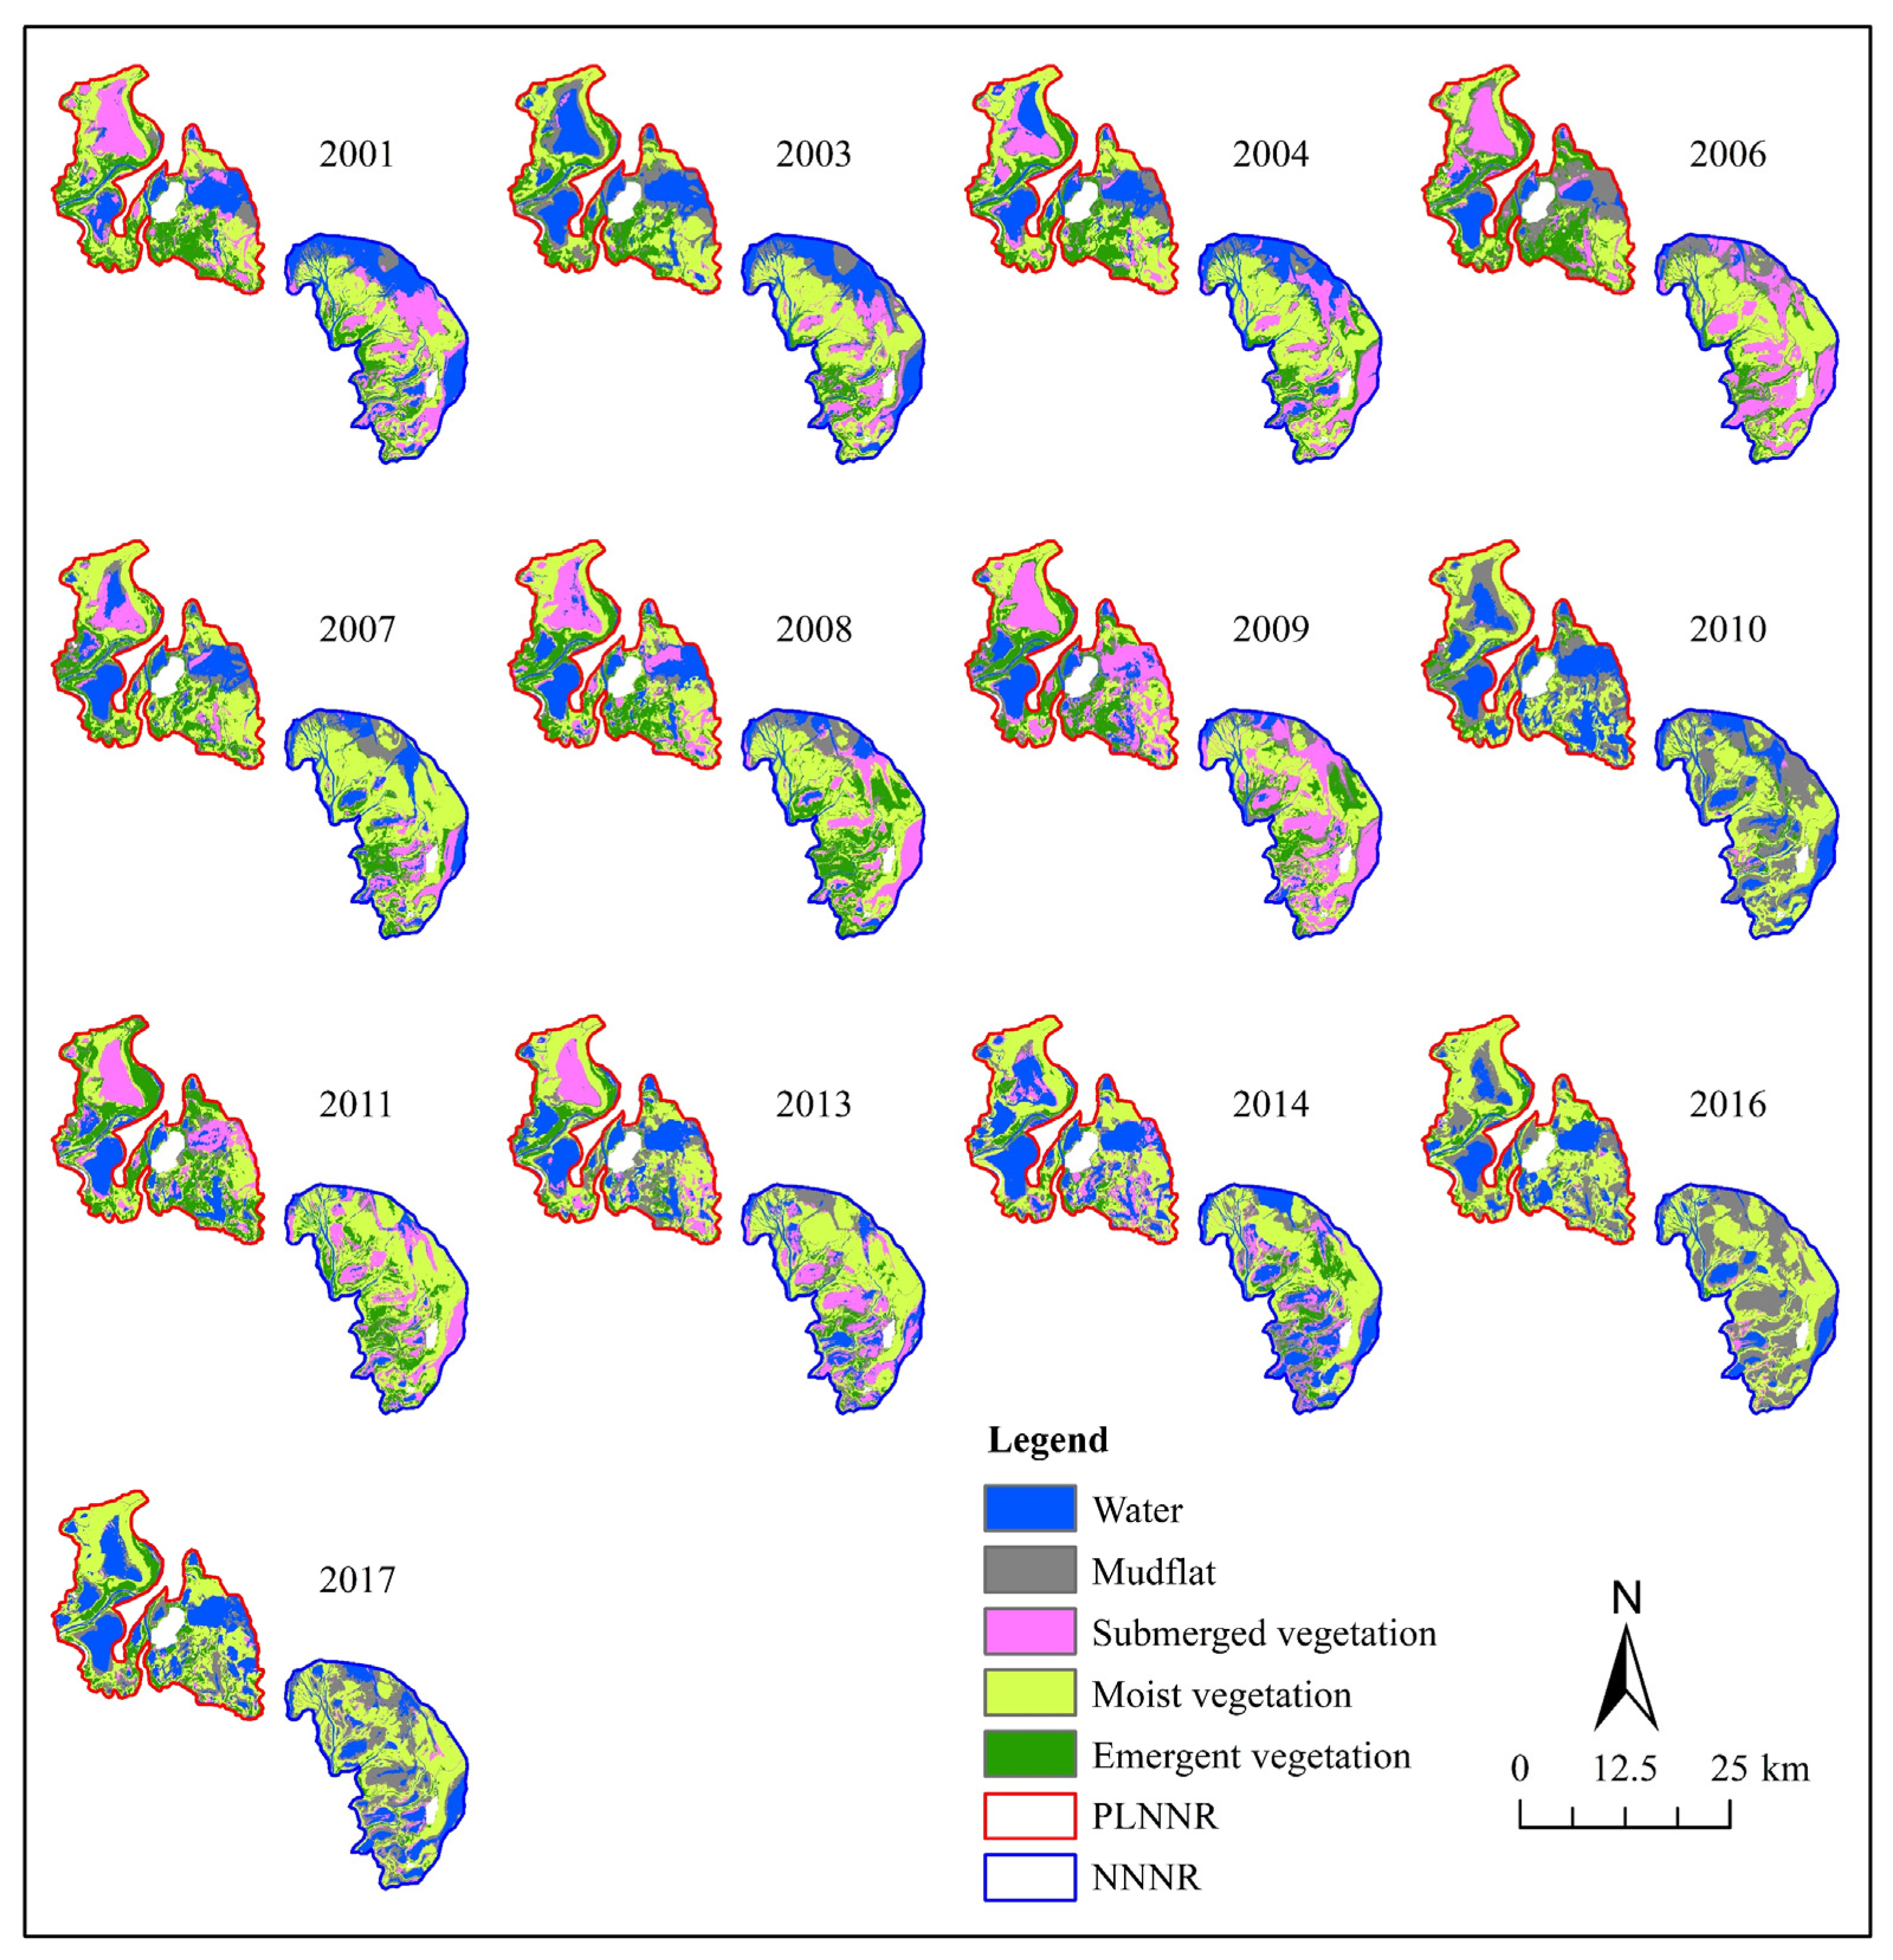
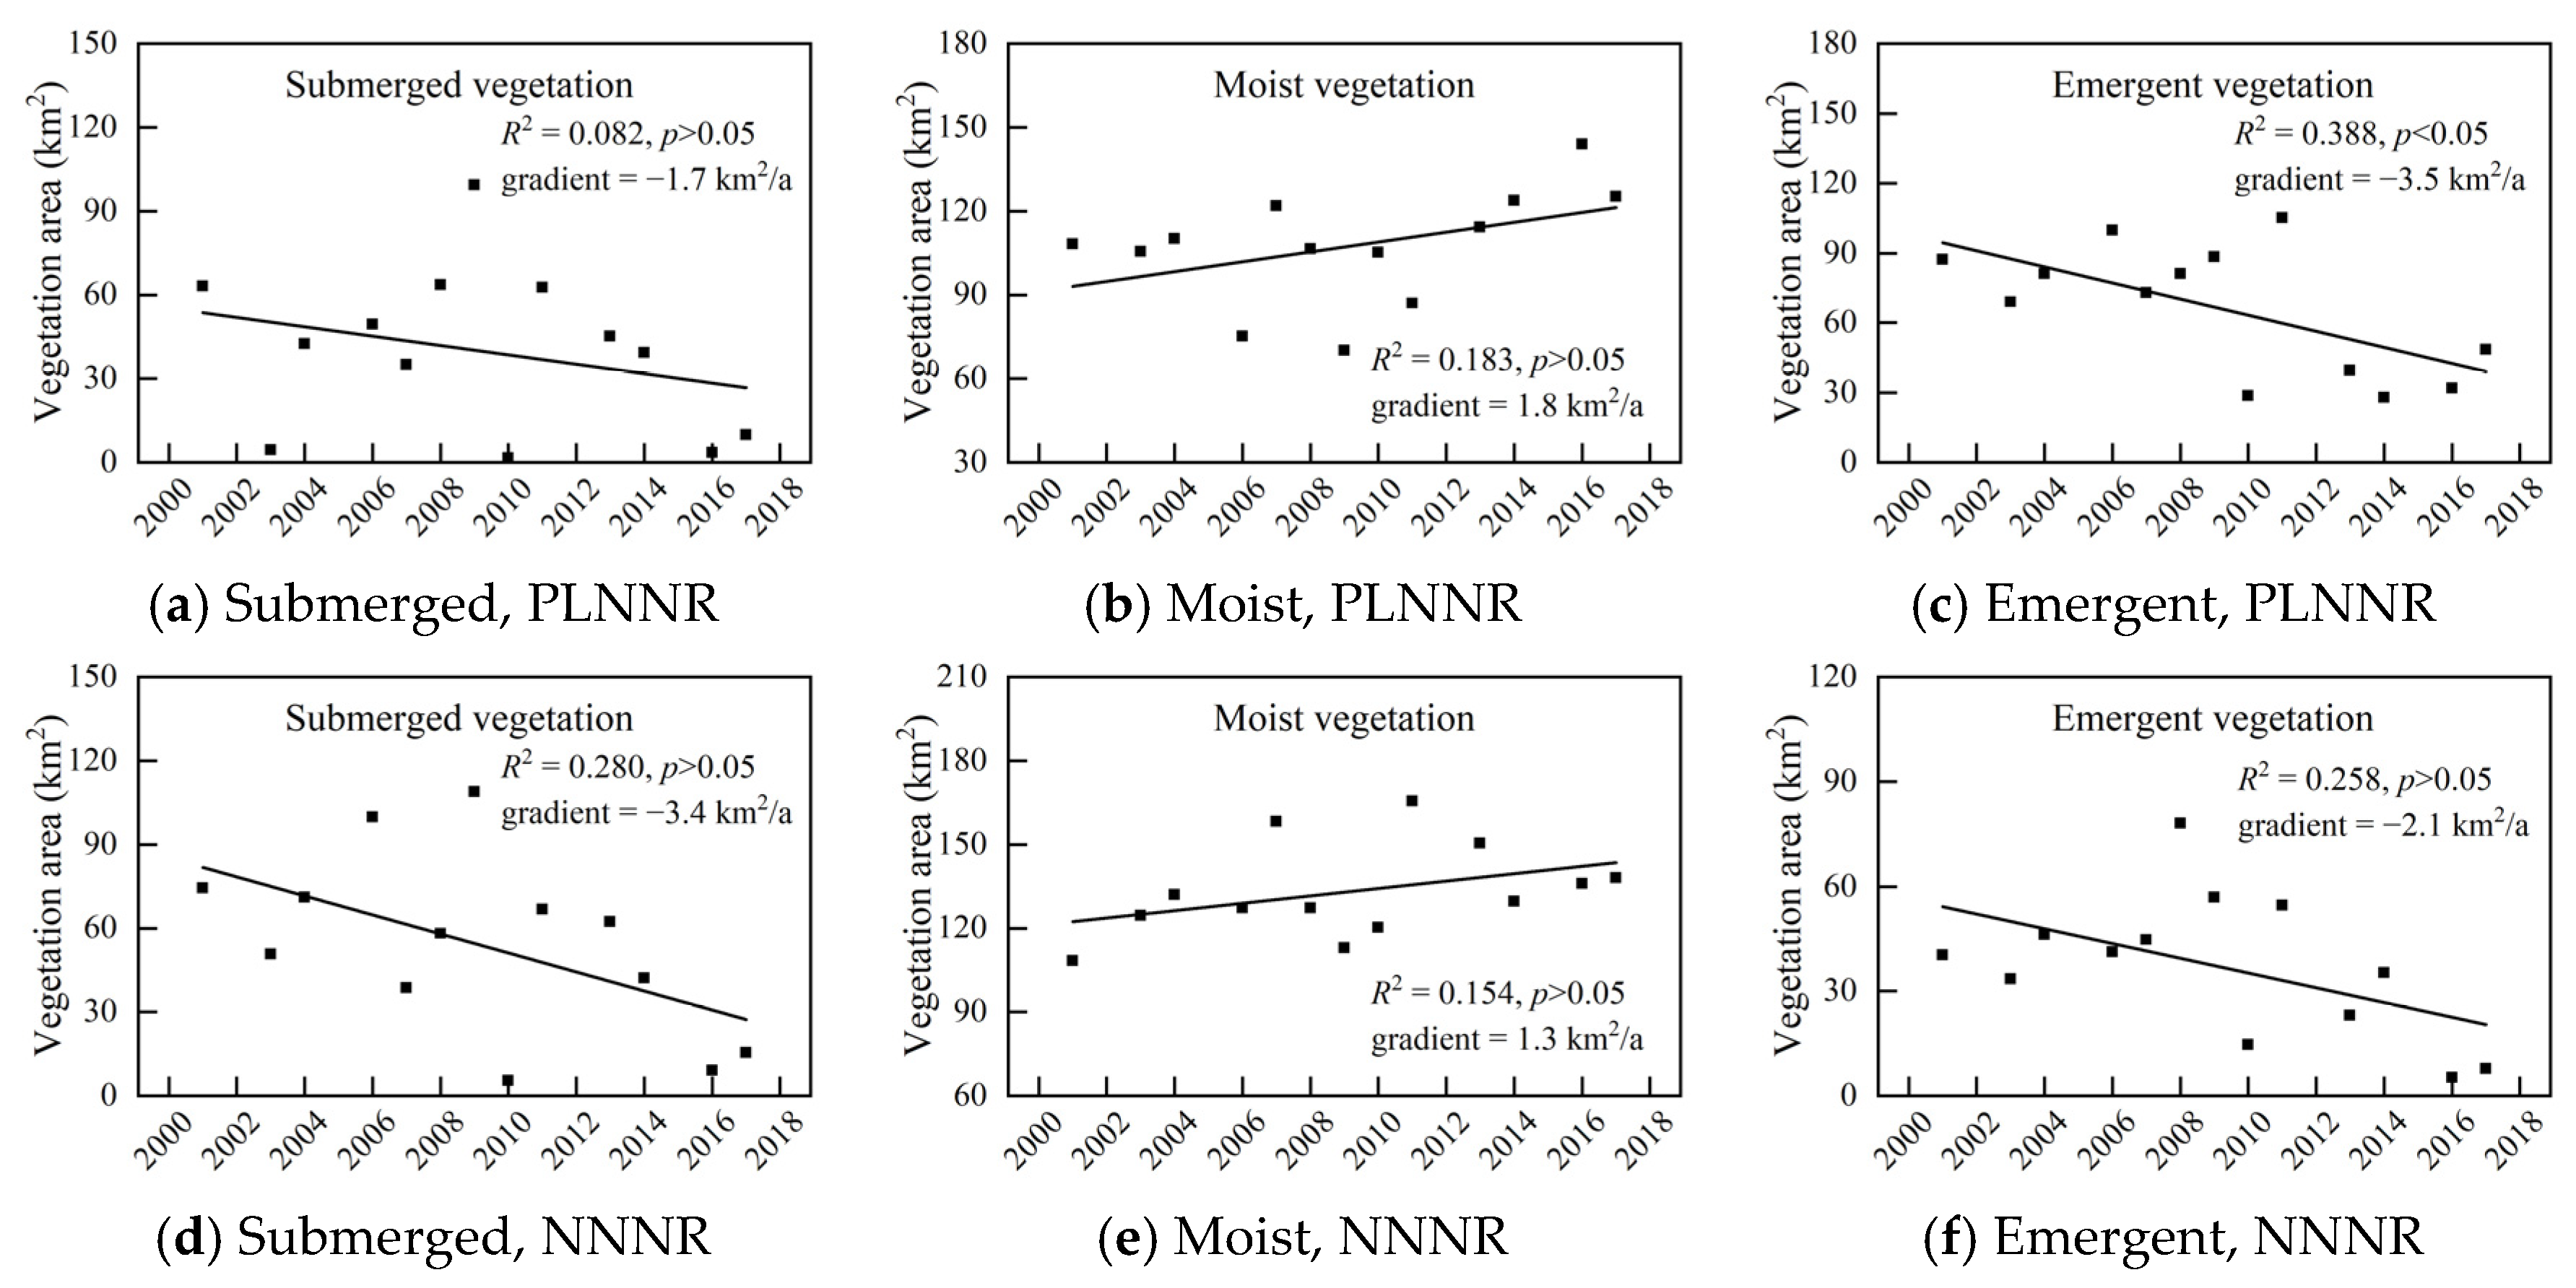
4.2. Annual Variation of Vegetation Communities in National Nature Reserves
4.3. Landscape Patterns of Different Vegetation Communities
4.4. Correlation Analysis between Vegetation Area and Hydrologic Processes
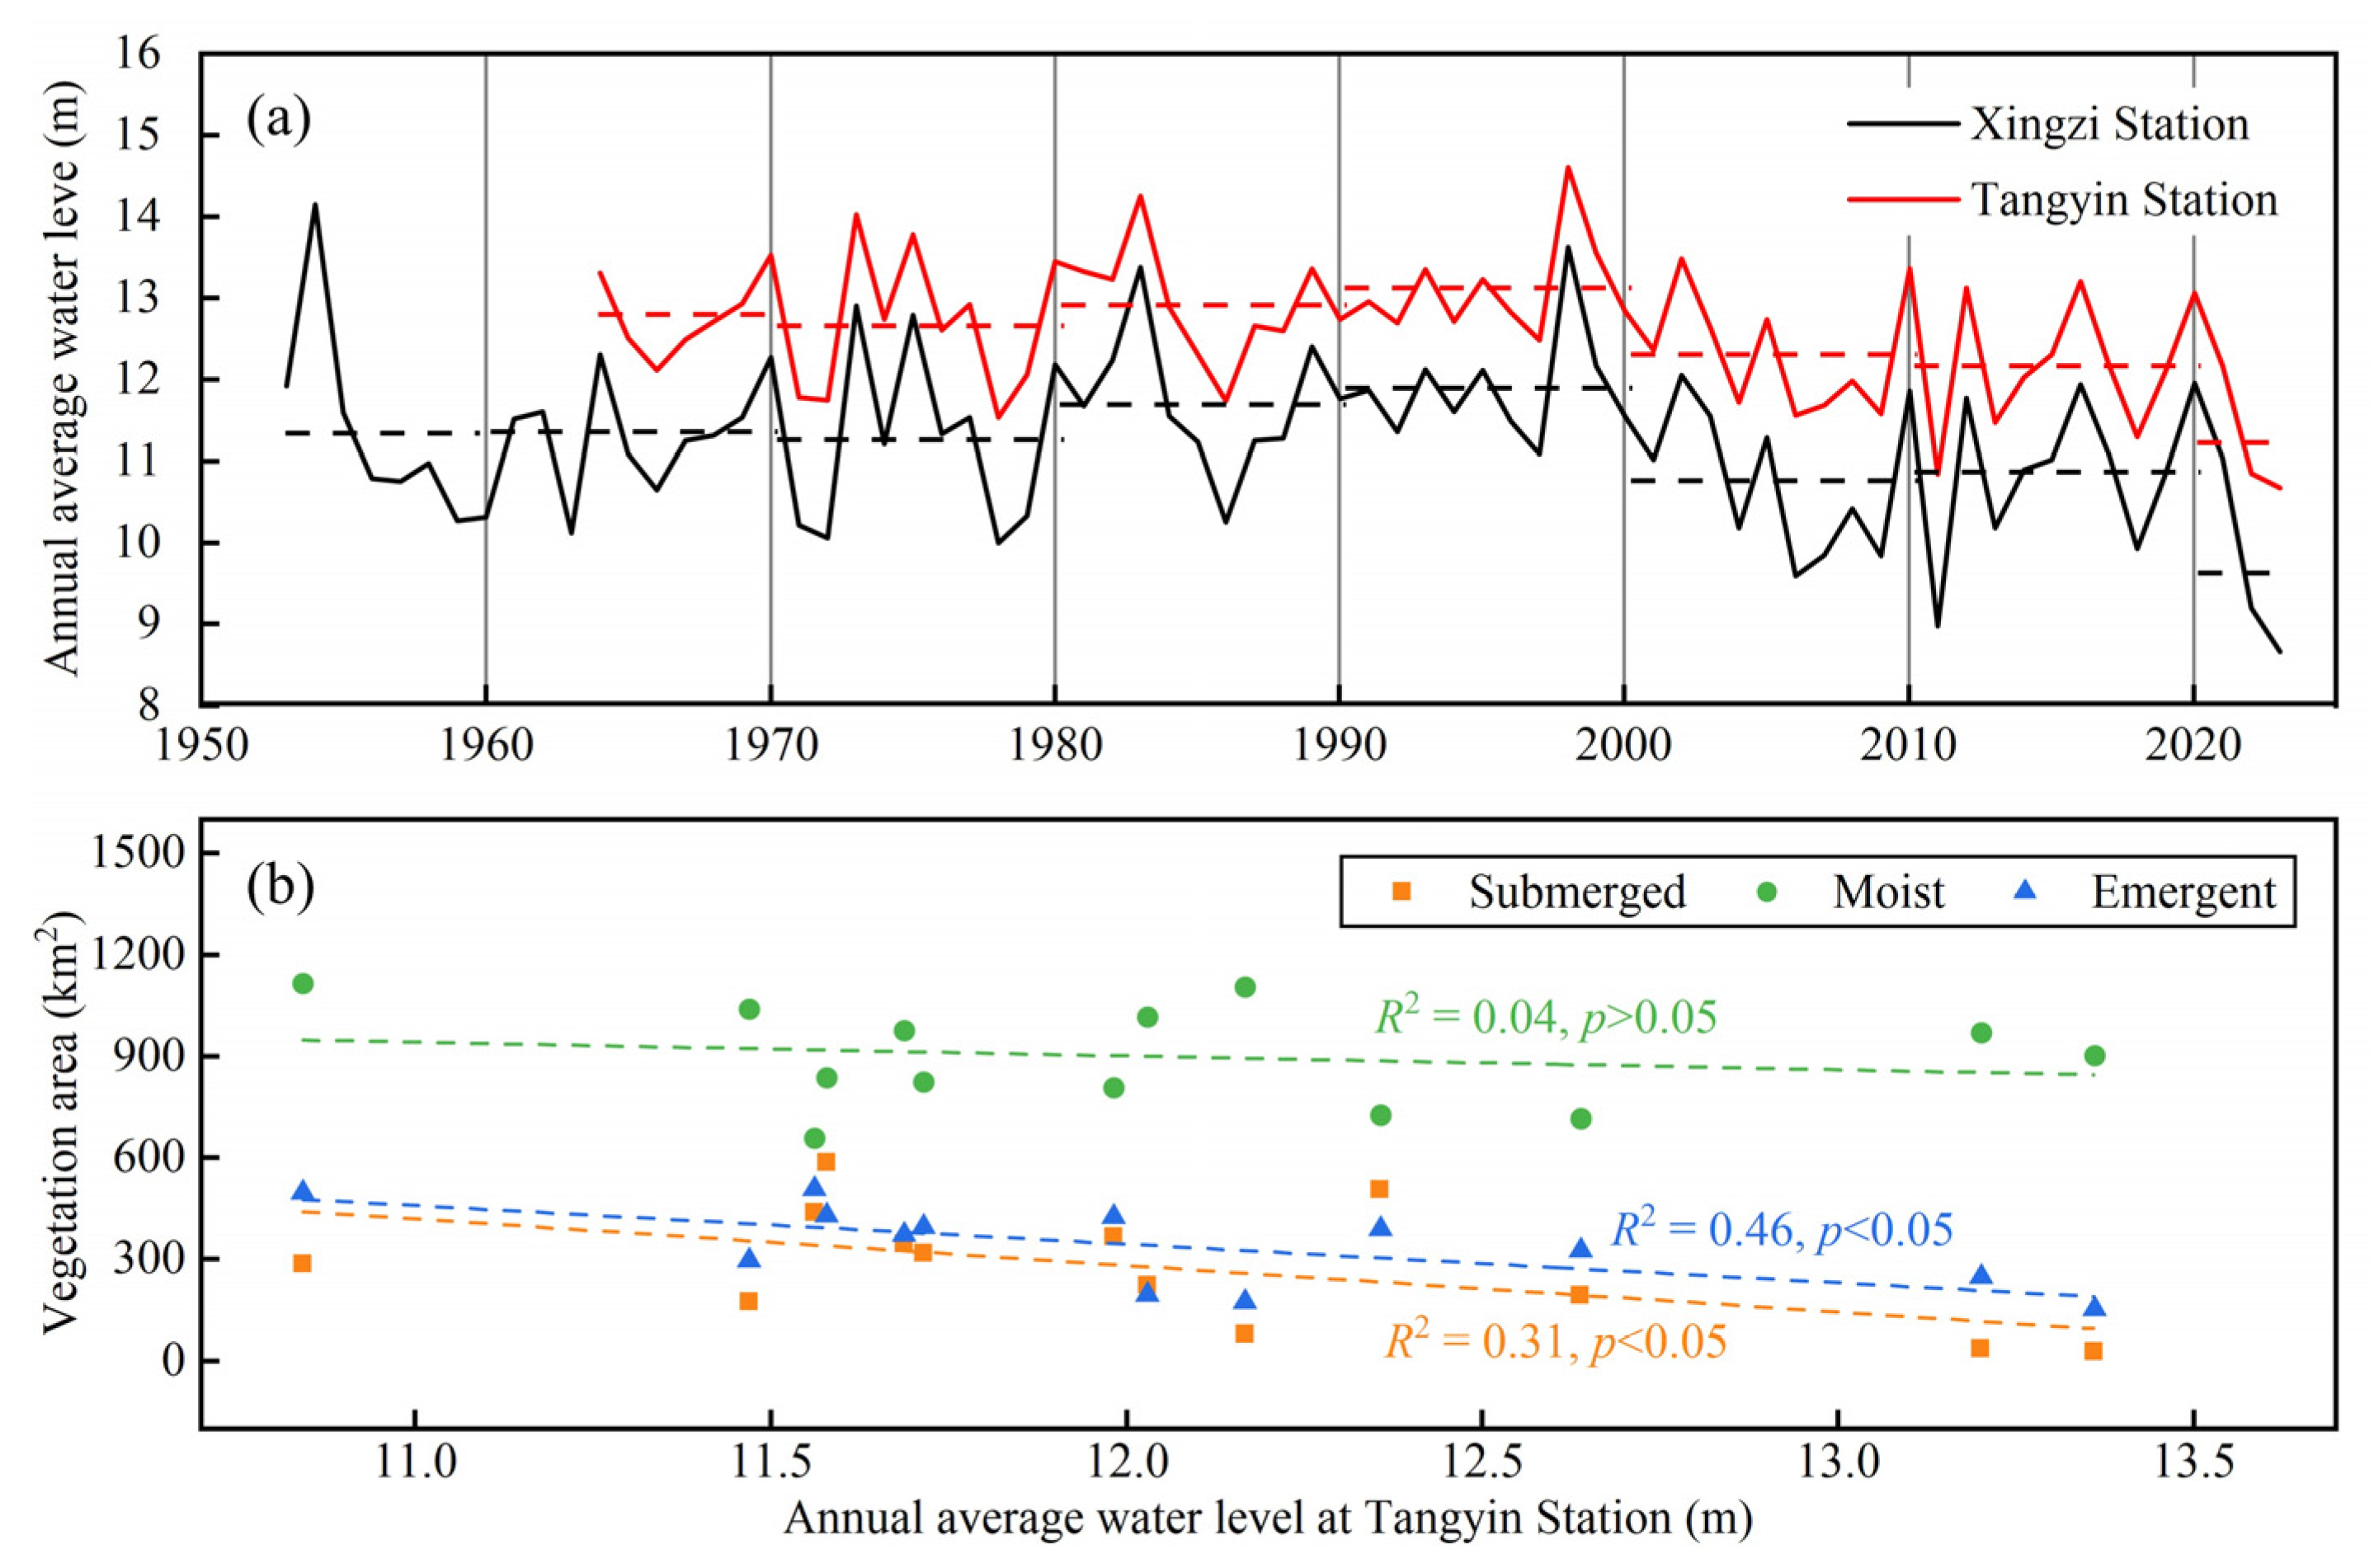
4.4.1. Hydrologic Factors
4.4.2. Regression Models between Vegetation Areas and Hydrologic Factors
5. Discussion
6. Conclusions
Author Contributions
Funding
Data Availability Statement
Conflicts of Interest
References
- Abe, K.; Kato, K.; Ozaki, Y. Vegetation-based wastewater treatment technologies for rural areas in Japan. Jpn. Agric. Res. Q. 2010, 44, 231–242. [Google Scholar] [CrossRef]
- Papastergiadou, E.; Stefanidis, K.; Dorflinger, G.; Giannouris, E.; Kostara, K.; Manolaki, P. Exploring biodiversity in riparian corridors of a Mediterranean island: Plant communities and environmental parameters in Cyprus rivers. Plant Biosyst. 2016, 150, 91–103. [Google Scholar] [CrossRef]
- Huai, W.; Zhang, J.; Katul, G.; Cheng, Y.; Tang, X.; Wang, W. The structure of turbulent flow through submerged flexible vegetation. J. Hydrodyn. 2019, 31, 274–292. [Google Scholar] [CrossRef]
- Huikkonen, I.; Helle, I.; Elo, M. Heterogenic aquatic vegetation promotes abundance and species richness of Odonata (Insecta) in constructed agricultural wetlands. Insect Conserv. Divers. 2020, 13, 374–383. [Google Scholar] [CrossRef]
- Huai, W.; Li, S.; Katul, G.; Liu, M.; Yang, Z. Flow dynamics and sediment transport in vegetated rivers: A review. J. Hydrodyn. 2021, 33, 400–420. [Google Scholar] [CrossRef]
- Zhu, Z.; Huai, W.; Yang, Z.; Li, D.; Wang, Y. Assessing habitat suitability and habitat fragmentation for endangered Siberian cranes in Poyang Lake region, China. Ecol. Indic. 2021, 125, 107594. [Google Scholar] [CrossRef]
- Yao, S.; Chen, C.; Chen, Q.; Cui, Z.; Zhang, J.; Zeng, Y. Impact of short-term hydrological components on landscape pattern of waterbird habitat in floodplain wetlands. Water Resour. Res. 2022, 58, e2021WR031822. [Google Scholar] [CrossRef]
- Swarth, C.; Delgado, P.; Whigham, D. Vegetation Dynamics in a Tidal Freshwater Wetland: A Long-Term Study at Differing Scales. Estuaries Coasts 2013, 36, 559–574. [Google Scholar] [CrossRef]
- Liu, X.; Zhou, W.; Bai, Z. Vegetation coverage change and stability in large open-pit coal mine dumps in China during 1990–2015. Ecol. Eng. 2016, 95, 447–451. [Google Scholar] [CrossRef]
- Grieger, R.; Capon, S.; Hadwen, W.; Mackey, B. Spatial variation and drivers of vegetation structure and composition in coastal freshwater wetlands of subtropical Australia. Mar. Freshw. Res. 2021, 72, 1746–1759. [Google Scholar] [CrossRef]
- Zhang, M.; Running, S. Drought-induced reduction in global terrestrial net primary production from 2000 through 2009. Science 2010, 329, 940–943. [Google Scholar] [CrossRef]
- Choo, Y.; Kim, H.; Nam, J.; Kim, J. Flooding effects on seed production of the amphicarpic plant Persicaria thunbergii. Aquat. Bot. 2014, 119, 15–19. [Google Scholar] [CrossRef]
- Huai, W.; Zeng, Y.; Xu, Z.; Yang, Z. Three-layer model for vertical velocity distribution in open channel flow with submerged rigid vegetation. Adv. Water Resour. 2009, 32, 487–492. [Google Scholar] [CrossRef]
- Yang, L.; Fang, H.; Yang, Z.; Huai, W. Longitudinal dispersive coefficient in channels with aquatic vegetation: A review. J. Hydrodyn. 2023, 35, 379–395. [Google Scholar] [CrossRef]
- Hu, Y.; Huang, J.; Du, Y.; Han, P.; Wang, J.; Huang, W. Monitoring wetland vegetation pattern response to water-level change resulting from the Three Gorges Project in the two largest freshwater lakes of China. Ecol. Eng. 2015, 74, 274–285. [Google Scholar] [CrossRef]
- Knorn, J.; Rabe, A.; Radeloff, V.; Kuemmerle, T.; Kozak, J.; Hostert, P. Land cover mapping of large areas using chain classification of neighboring Landsat satellite images. Remote Sens. Environ. 2009, 113, 957–964. [Google Scholar] [CrossRef]
- Toogood, S.; Joyce, C. Effects of raised water levels on wet grassland plant communities. Appl. Veg. Sci. 2009, 12, 283–294. [Google Scholar] [CrossRef]
- David, P. Changes in plant communities relative to hydrologic conditions in the Florida Everglandes. Wetlands 1996, 16, 15–23. [Google Scholar] [CrossRef]
- Guan, S.; Lang, Q.; Zhang, B. Aquatic vegetation of Poyang Lake. Acta Hydrobiol. Sin. 1987, 11, 9–21. (In Chinese) [Google Scholar]
- Hu, Z.; Ge, G.; Liu, C.; Chen, F.; Li, S. Structure of Poyang Lake Wetland plants ecosystem and influence of lake water level for the structure. Resour. Environ. Yangtze Basin 2010, 19, 597–605. (In Chinese) [Google Scholar]
- Hu, Z.; Lin, Y. Analysis of evolution process and driving factors for aquatic vegetations of Poyang Lake in 30 years. Resour. Environ. Yangtze Basin 2019, 28, 193–201. (In Chinese) [Google Scholar]
- Tan, Z.; Zhang, Q.; Li, Y.; Xu, X.; Jiang, J. Distribution of typical vegetation communities along elevation in Poyang Lake Wetlands. Wetl. Sci. 2016, 14, 506–515. (In Chinese) [Google Scholar]
- Lei, S.; Zhang, X.; Xu, X. Analysis on changes in wetland vegetation of Poyang Lake in autumn and winter by multi-source remote sensing data monitoring. Yangtze River 2011, 42, 64–67+110. (In Chinese) [Google Scholar]
- Mei, X.; Dai, Z.; Fagherazzi, S.; Chen, J. Dramatic variations in emergent wetland area in China’s largest freshwater lake, Poyang Lake. Adv. Water Resour. 2016, 96, 1–10. [Google Scholar] [CrossRef]
- Cai, Y.; Liu, S.; Lin, H. Monitoring the vegetation dynamics in the dongting lake wetland from 2000 to 2019 using the BEAST algorithm based on dense landsat time series. Appl. Sci. 2020, 10, 4209. [Google Scholar] [CrossRef]
- Han, X.; Chen, X.; Feng, L. Four decades of winter wetland changes in Poyang Lake based on Landsat observations between 1973 and 2013. Remote Sens. Environ. 2015, 156, 426–437. [Google Scholar] [CrossRef]
- Chen, L.; Jin, Z.; Michishita, R.; Cai, J.; Yue, T.; Chen, B.; Xu, B. Dynamic monitoring of wetland cover changes using time-series remote sensing imagery. Ecol. Inf. 2014, 24, 17–26. [Google Scholar] [CrossRef]
- Wan, R.; Wang, P.; Wang, X.; Yao, X.; Dai, X. Mapping Aboveground Biomass of Four Typical Vegetation Types in the Poyang Lake Wetlands Based on Random Forest Modelling and Landsat Images. Front. Plant Sci. 2019, 10, 1281. [Google Scholar] [CrossRef]
- Ye, C.; Wu, G.; Zhao, X.; Wang, X.; Liu, Y. Responses of wetland vegetation to droughts and its impact factors in Poyang Lake National Nature Reserve. J. Lake Sci. 2014, 26, 253–259. (In Chinese) [Google Scholar] [CrossRef]
- Zhou, Y.; Bai, X.; Ning, L. Landscape pattern changes of Carex and its response to water level in Lake Poyang Wetland. J. Lake Sci. 2017, 29, 870–879. (In Chinese) [Google Scholar] [CrossRef]
- Tan, Z.; Zhang, Q.; Li, M.; Li, Y.; Xu, X.; Jiang, J. A study of the relationship between wetland vegetation communities and water regimes using a combined remote sensing and hydraulic modeling approach. Hydrol. Res. 2016, 47, 278–292. [Google Scholar] [CrossRef]
- Sung, C. Simulation of crane habitat fragmentation in the North and South Korean border region after Korean reunification. Landsc. Urban. Plan. 2015, 134, 10–18. [Google Scholar] [CrossRef]
- Cao, M.; Liu, G. Habitat suitability change of red-crowned crane in Yellow River Delta Nature Reserve. J. For. Res. 2008, 19, 141–147. [Google Scholar] [CrossRef]
- Wang, J.; Ran, Y.; Zhang, Y.; Cao, X.; Yang, F. Land cover and landscape pattern changes in Poyang Lake region of China in 1998–2010. Chin. J. Appl. Ecol. 2013, 24, 1085–1093. (In Chinese) [Google Scholar]
- Cui, Y.; Dong, B.; Chen, L.; Gao, X.; Cui, Y. Study on habitat suitability of overwintering cranes based on landscape pattern change—A case study of typical lake wetlands in the middle and lower reaches of the Yangtze River. Environ. Sci. Pollut. Res. 2019, 26, 14962–14975. [Google Scholar] [CrossRef] [PubMed]
- Heuvelmans, G.; Muys, B.; Feyen, J. Regionalisation of the parameters of a hydrological model: Comparison of linear regression models with artificial neural nets. J. Hydrol. 2006, 319, 245–265. [Google Scholar] [CrossRef]
- Toogood, S.; Joyce, C.; Waite, S. Response of floodplain grassland plant communities to altered water regimes. Plant Ecol. 2008, 197, 285–298. [Google Scholar] [CrossRef]
- Wilcox, D.; Nichols, S. The effects of water-level fluctuations on vegetation in a Lake Huron wetland. Wetlands 2008, 28, 487–501. [Google Scholar] [CrossRef]
- Todd, J.; Muneepeerakul, R.; Pumo, D.; Azaele, S.; Miralles-Wilhelm, F.; Rinaldo, A.; Rodriguez-Iturbe, I. Hydrological drivers of wetland vegetation community distribution within Everglades National Park, Florida. Adv. Water Resour. 2010, 33, 1279–1289. [Google Scholar] [CrossRef]
- Craine, J.; Dybzinski, R. Mechanisms of plant competition for nutrients, water and light. Funct. Ecol. 2013, 27, 833–840. [Google Scholar] [CrossRef]
- Liang, D.; Lu, J.; Chen, X.; Liu, C.; Lin, J. An investigation of the hydrological influence on the distribution and transition of wetland cover in a complex lake–floodplain system using timeseries remote sensing and hydrodynamic simulation. J. Hydrol. 2020, 587, 125038. [Google Scholar] [CrossRef]
- Hui, F.; Xu, B.; Huang, H.; Yu, Q.; Gong, P. Modelling spatial-temporal change of Poyang Lake using multitemporal Landsat imagery. Int. J. Remote Sens. 2008, 29, 5767–5784. [Google Scholar] [CrossRef]
- Dronova, I.; Gong, P.; Wang, L. Object-based analysis and change detection of major wetland cover types and their classification uncertainty during the low water period at Poyang Lake, China. Remote Sens. Environ. 2011, 115, 3220–3236. [Google Scholar] [CrossRef]
- Wang, L.; Dronova, I.; Gong, P.; Yang, W.; Li, Y.; Liu, Q. A new time series vegetation–water index of phenological–hydrological trait across species and functional types for Poyang Lake wetland ecosystem. Remote Sens. Environ. 2012, 125, 49–63. [Google Scholar] [CrossRef]
- Guo, H.; Hu, Q.; Zhang, Q.; Feng, S. Effects of the Three Gorges Dam on Yangtze river flow and river interaction with Poyang Lake, China: 2003–2008. J. Hydrol. 2012, 416, 19–27. [Google Scholar] [CrossRef]


| Year | Date from Remote Sensing Images | Water Level at Tangyin Station (m) |
|---|---|---|
| 2001 | 2001293 1 (L5 2), 2001325 (L5) | 10.91 3 |
| 2003 | 2003299 (L5), 2003339 (L7) | 8.65 |
| 2004 | 2004286 (L5), 2004334 (L5) | 9.95 |
| 2006 | 2006267 (L7), 2006315 (L7) | 9.46 |
| 2007 | 2007278 (L5), 2007334 (L7) | 8.13 |
| 2008 | 2008289 (L7), 2008345 (L5) | 9.98 |
| 2009 | 2009275 (L7), 2009331 (L5) | 10.12 |
| 2010 | 2010278 (L7), 2010342 (L7) | 9.45 |
| 2011 | 2011281 (L7), 2011329 (L7) | 9.98 |
| 2013 | 2013278 (L8), 2013326 (L8) | 9.40 |
| 2014 | 2014297 (L8), 2014345 (L8) | 9.71 |
| 2016 | 2016271 (L8), 2016351 (L8) | 10.03 |
| 2017 | 2017281 (L7), 2017345 (L7) | 9.71 |
| Landscape Pattern Metrics 1 | Introduction | Ecological Significance |
|---|---|---|
| NP | Total number of patches of a certain land type (NP ≥ 1). | NP describes the heterogeneity of the overall landscape. |
| PD | Number of patches per unit area (PD > 0, number/km2). | PD generally has a good correlation with landscape fragmentation. |
| MPS | Area of a certain land type divided by the number of the patches (MPS > 0, hm2). | MPS reflects the fragmentation degree of different landscapes and indicates the differences among different types of landscapes. |
| LPI | Proportion of the largest patch of a certain land type in the whole landscape (0 < LPI ≤ 100, %). | LPI reflects the dominance of patches. |
| LSI | Deviation degree of a certain land type patch from the square of the same area (LSI ≥ 1). | LSI reflects the complexity of landscape shape. |
| AI | Number of like adjacencies involving the corresponding class, divided by the maximum possible number of like adjacencies involving the corresponding class (0 < AI ≤ 100, %). | AI reflects the connectivity and aggregation degree between landscape patches. A larger AI value means a higher aggregation degree. |
| Time Scale 1 | Notation | Definition |
|---|---|---|
| Whole year | Ymean, Ymax, Ymin, Ycv, Ya, Y≥10m, Y≥12m, Y≥14m, Y<14m, Y<13m, Y<12m, Y<11m | Y, D, R, W, and F are different time scales. The subscripts mean, max, min, cv, and a represent the average water level, maximum water level, minimum water level, coefficient of variation of water level, and maximum variation amplitude of water level, respectively. The subscript ≥ 10 m means the days with a water level higher than 10 m, and the subscript < 10 m means the time when the water level falls below 10 m. |
| Low-water period | Dmean, Dmax, Dmin, Dcv, Da, D≥10m | |
| Rising period | Rmean, Rmax, Rmin, Rcv, Ra, R≥10m, R≥12m | |
| High-water period | Wmean, Wmax, Wmin, Wcv, Wa, W≥12m, W≥14m | |
| Falling period | Fmean, Fmax, Fmin, Fcv, Fa, F≥10m, F≥12m |
| Vegetation | Regression Model | Key Hydrological Factors |
|---|---|---|
| Submerged vegetation | Ymax | |
| Moist vegetation | Rmin, Wmax, Y≥12m | |
| Emergent vegetation | W≥14m |
| Year | 2001 | ||||||
|---|---|---|---|---|---|---|---|
| Types | Water | Submerged | Moist | Mudflat | Emergent | Total | |
| 2017 | Water | 605.8 | 186.0 | 59.2 | 42.5 | 32.1 | 925.6 |
| Submerged | 14.6 | 19.2 | 19.7 | 11.4 | 11.7 | 76.6 | |
| Moist | 109.6 | 138.7 | 517.0 | 160.3 | 178.7 | 1104.3 | |
| Mudflat | 375.3 | 160.8 | 92.7 | 110.7 | 60.5 | 800 | |
| Emergent | 1.1 | 1.2 | 36.6 | 27.3 | 106.4 | 172.6 | |
| Total | 1106.4 | 505.9 | 725.2 | 352.2 | 389.4 | 3079.1 | |
| Changes from 2001 to 2017 | −180.8 | −429.3 | 379.1 | 447.8 | −216.8 | ||
Disclaimer/Publisher’s Note: The statements, opinions and data contained in all publications are solely those of the individual author(s) and contributor(s) and not of MDPI and/or the editor(s). MDPI and/or the editor(s) disclaim responsibility for any injury to people or property resulting from any ideas, methods, instructions or products referred to in the content. |
© 2024 by the authors. Licensee MDPI, Basel, Switzerland. This article is an open access article distributed under the terms and conditions of the Creative Commons Attribution (CC BY) license (https://creativecommons.org/licenses/by/4.0/).
Share and Cite
Zhu, Z.; Wang, H.; Yang, Z.; Huai, W.; Huang, D.; Chen, X. Landscape Pattern Changes of Aquatic Vegetation Communities and Their Response to Hydrological Processes in Poyang Lake, China. Water 2024, 16, 1482. https://doi.org/10.3390/w16111482
Zhu Z, Wang H, Yang Z, Huai W, Huang D, Chen X. Landscape Pattern Changes of Aquatic Vegetation Communities and Their Response to Hydrological Processes in Poyang Lake, China. Water. 2024; 16(11):1482. https://doi.org/10.3390/w16111482
Chicago/Turabian StyleZhu, Zhengtao, Huilin Wang, Zhonghua Yang, Wenxin Huai, Dong Huang, and Xiaohong Chen. 2024. "Landscape Pattern Changes of Aquatic Vegetation Communities and Their Response to Hydrological Processes in Poyang Lake, China" Water 16, no. 11: 1482. https://doi.org/10.3390/w16111482
APA StyleZhu, Z., Wang, H., Yang, Z., Huai, W., Huang, D., & Chen, X. (2024). Landscape Pattern Changes of Aquatic Vegetation Communities and Their Response to Hydrological Processes in Poyang Lake, China. Water, 16(11), 1482. https://doi.org/10.3390/w16111482