Article

3D CFD Study of Scour in Combined Wave–Current Flows around Rectangular Piles with Varying Aspect Ratios

1
Department of Civil Engineering, Indian Institute of Technology Kharagpur, Kharagpur 721302, India
2
Section of Offshore and Dredging Engineering, Faculty of Mechanical, Maritime and Materials Engineering, Delft University of Technology, 2628 CN Delft, The Netherlands
*
Author to whom correspondence should be addressed.
Water 2023, 15(8), 1541; https://doi.org/10.3390/w15081541
Submission received: 16 March 2023 / Revised: 4 April 2023 / Accepted: 10 April 2023 / Published: 14 April 2023

Abstract

:
This study utilizes three-dimensional simulations to investigate scour in combined wave–current flows around rectangular piles with various aspect ratios. The simulation model solves the Reynolds-averaged Navier–Stokes (RANS) equations using the k– ω turbulence model, and couples the Exner equation to compute bed elevation changes. The model also employs the level-set approach to realistically capture the free surface, and couples a hydrodynamic module with a morphological module to simulate the scour process. The morphological module employs a modified critical bed shear stress formula on a sloping bed and a sand-slide algorithm for erosion and deposition calculations in the sediment bed. To validate the numerical model, simulations are conducted in a truncated numerical wave tank with the Dirichlet boundary condition and active wave absorption method. After validation, the numerical model is used to investigate the effect of aspect ratio and the Keulegan–Carpenter ( K C ) number on scour depth in a combined wave–current environment. The study finds that the normalized scour depth is highest for a rectangular pile with an aspect ratio of 2:1 and lowest for an aspect ratio of 1:2. The maximum normalized scour depth (S/D) for aspect ratios of 2:1 are 0.151, 0.218, and 0.323 for K C numbers 3.9, 5.75, and 10, respectively, whereas the minimum normalized scour depth (S/D) for aspect ratios of 1:2 are 0.132, 0.172, and 0.279. Additionally, the research demonstrates that the normalized scour depth increases with an increase in the K C number for a fixed wave–current parameter ( U c w ).

1. Introduction

Coastal and marine environments are characterized by the coexistence of ocean waves and currents. The interplay between these two phenomena has garnered interest among coastal and marine engineers, because it largely influences sediment transport and seabed stability. The flow hydrodynamics around a pile creates a complicated phenomenon in an environment where waves and current act simultaneously, thus resulting in scour. The investigation of scour around piles in combined wave–current flows is important, since scour can lead to the destabilization of the pile foundation and ultimately compromise its structural integrity. When waves and currents combine, they can create more turbulence and erosion than either factor alone. This increased erosion can lead to deeper and wider scour holes around the pile foundation. Overall, understanding scour in combined wave–current flows is crucial for designing and maintaining rectangular piles that can withstand the forces of their environment. Therefore, measurements of scour around piles are required for the preventive action of the structure in combined wave–current conditions. Several researchers [1,2,3] have conducted experiments to study the scour phenomenon under the action of steady currents.
Recently, numerical studies have become increasingly popular due to their high level of precision and freedom from model scaling issues, as compared to experimental studies. In this respect, the phenomenon of scour around a single pile was investigated in unprecedented numerical studies by Richardson and Panchang [4] and Olsen and Kjellesvig [5], who are considered pioneers in this field. Later, several researchers [6,7,8] also conducted numerical investigations to study this phenomenon. The numerical techniques (level-set method against volume of fluid for free surface and topological representation) used in their numerical models to capture the phenomenon of flow-induced scour were the key difference between their studies. Kim et al. [9] used large eddy simulations (LES) along with a Smagorinsky subgrid model to numerically examine the scour around tandem and side-by-side pile configurations.
The formation of scour in coastal environments is significantly influenced by the interaction of waves and currents. The combined wave–current hydrodynamics has a complicated impact on scour, because the combined wave–current hydrodynamics is not just the combination of the linear components of waves and currents but their nonlinear interaction in many ways. Soulsby [10] explained the mechanism of formation of wave-induced currents. They pointed out that in a flow, where current and waves acts simultaneously, the phase speed and wavelength are modified by currents, leading to the refraction of waves. Moreover, in the wave boundary layer, the joint wave–current interaction increases the bed shear stress, resulting in the formation of wave-induced currents.
Typically, wave-induced vertical currents are responsible for the suspension of sediment particles [11]. wave–current interaction may vary the bottom’s water pressure and shear stress, influencing pore water pressure, effective stress, and soil displacement near the seabed [12]. Flow around multiple circular cylinders arranged in different configurations is critical for numerous engineering applications, and it has been the main focus of studies in recent years. In coastal contexts, new generation offshore structures with rectangular cross-sections appear next to those with circular cross-sections. The presence of a pile in an initially flat, erodible bed can result in scour due to the action of waves and currents. Understanding the scouring process is vital for ensuring the stability of maritime constructions such as subsea templates, bridges, and platforms. Furthermore, excessive scour can lead to geotechnical instability, including breaching events, which can occur when the sediment is dilative, and a slope steeper than the internal friction angle of the sediment is formed [13,14,15,16].
There are two primary causes of scour; firstly, the presence of a structure leads to restricted flow and subsequently an increase in flow velocity around it; secondly, the presence of the structure generates a local system of turbulent vortices that enhance the local transport capacity, comprising partially the horseshoe vortex and partially downstream vortex shedding. Numerous studies have examined the impact of wave and current flows on the scouring phenomenon around a pile. Prior studies, e.g., Whitehouse [2] and Sumer and Fredsøe [17], have analyzed various parameters, including the pile shape and configuration, sediment characteristics, and other flow parameters (shields parameter, θ , combined wave–current parameter, U c w , and Keulegan–Carpenter number, K C ) that can influence the scouring process.
Experimental investigations were carried out by Umeyama in multiple studies [18,19,20], focusing on wave–current hydrodynamics, Reynolds shear stress, surface profiles, and complex turbulent structures. Sumer and Fredsøe [17] observed that, for K C numbers below 100, even a slight addition of current to the flow in presence of waves can greatly increase the depth of the scour. The authors also found that, when U c w is less than 0.7, the current component dominates the scour depth due to the lee-wake vortices downstream of the pile. However, there is limited research in the literature investigating the effects of non-circular pile shapes on scour formation.
Sumer et al. [21], Diab et al. [22], Yao et al. [23], and Omara et al. [24] have all studied the development of scour on square cylinders using experiments. Ismael et al. [25] tested different orientation angles for scouring around an egg-shaped pile. The impact of different pile forms on the occurrence of local scour was evaluated experimentally by Al-Shukur and Obeid [26] and Mir et al. [27] (also carried out analytically by Gazi et al. [28]). These studies provided alternative equations for predicting scour evolution based on changes in the cross-section forms, while still acknowledging the significance of the piles’ cross-section shape for the generation of local scour patterns [29]. In [30], local scour was modeled using the conventional method in the clear water around circular, square, and rectangular piles. Resolution of the flow field was achieved using the k– ω turbulence model and the Unsteady Reynolds Averaged Navier–Stokes (URANS) equations.
The module used in the present study employs a semi-coupled three-phase (water, air, and sediments) solver in REEF3D [31,32] and utilizes the level-set approach to capture both the sediment bed and free surface in the vicinity of a rectangular pile by varying the aspect ratios and the K C number. We validate the numerical model used in this work using experimental results of scour around a pile under flow conditions where both the current and waves act simultaneously, which were reported in [33,34]. This study aims to examine the scouring process around a rectangular pile subjected to a joint action of waves and mild currents, taking into account a wide range of K C numbers and various aspect ratios of the pile. To the best of our knowledge, this work is the very first computational investigation of scouring around a rectangular cylinder in combined wave–current flows.

2. Numerical Model

The numerical model employed in this study is the same as developed in Gautam et al. [35] and, therefore, only the salient features of the model are described below.

2.1. Hydrodynamic Model

The continuity equation and incompressible RANS equations [32,35,36] are used to solve the flow hydrodynamics, as in Equations (1) and (2).
u i x i = 0 ,
u i t + u j u i x j = 1 ρ p x j + x j ( ν + ν t ) u i x j + u j x i + g i ,
where u i is the average velocity over time t, ρ is the density of the fluid, P is the pressure, ν t is turbulent eddy viscosity, ν is kinematic viscosity, and g i = (0,0,g) is the gravitational acceleration. High-order schemes are selected for the current study to avoid the unphysical damping of propagating waves. The convection term of the RANS equations is discretized with the Weighted Essentially Non-Oscillatory (WENO) scheme in the conservative finite difference version [37]. Here, a discretization stencil consists of three sub-stencils, which are weighted according to the local smoothness of the discretized function. The scheme achieves a minimum of 3rd-order accuracy for discontinuous solutions and up to 5th-order accuracy for a smooth solution. At the same time, very robust numerical stability is achieved without the negative side effects of numerical limiters. The conservative WENO scheme is used to treat the convective terms for the velocities u i , while a Hamilton–Jacobi version of Jiang and Peng [38] is used for the variables of the free surface algorithm. The Hamilton–Jacobi version approximates the spatial derivatives at integer grid points rather than at half-integer points in the conservative version and is more suitable for the approximation of the gradients in the level-set function.
The Reynolds stresses on the mean velocity gradients are calculated following the Boussinesq hypothesis for computing the turbulent kinetic energy k. Moreover, the specific dissipation rate ω is given as:
ν t = k ω .
The generation of vortices due to turbulence impacts the flow pattern, thus changing the hydrodynamic properties such as velocity and pressure. The changes in the flow pattern have an impact on the hydrodynamic properties of the flow. The RANS equation, in conjunction with the k– ω turbulence model [39], is used for the calculation of the eddy viscosity. The k– ω model is represented as:
k t + u j k x j = x j ν + ν t σ k + k x j + P k β k k ω ,
ω t + u j ω x j = x j ν + ν t σ ω + ω x j + ω k α P k β ω 2 .
P k is the turbulent production rate, and α = 5 9 , β k = 9 100 , β = 3 40 , σ k = 2 , σ ω = 2 are coefficients. We assume that in the near wall, the turbulent generation rate k is equivalent to the rate of dissipation ω [39]. Wall functions for k and ω are defined as follows:
k = u T β k , ω = k 1 / 2 β k 1 / 4 k y
where k is the von Kármán constant and u T is the friction velocity [39]. ω w a l l denotes the turbulent dissipation at the wall and is related to the distance from the cell wall to the cell center ( Δ y p ). ω w a l l reads as,
ω w a l l = c μ 3 / 4 k w 1 / 2 u w + Δ y p .
Equation (7) renders the value of ω w a l l directly. The TKE (k) at the wall is treated by integrating the source terms over the bed cells. Excess turbulence is generated due to high velocity gradients all over the free surface, which gives rise to the free surface’s artificial dampening [40,41]. As shown by Durbin [42], the eddy viscosity is limited. To circumvent this, the following techniques are utilized:
ν T = m i n k ω , 2 / 3 k | S |
where S represents strain derived from source variables in transport equations. The definition of the strain tensor is:
S i j = 1 2 u j x i + u i x j .
In close proximity to the free surface, the elements that are normal to the free surface are suppressed, and the parallel elements to the free surface are increased [40]. The CFD model precisely represents the ω s , which is shown below.
ω s = c μ 1 / 4 κ κ 1 / 2 1 y + 1 y ,
where c μ = 0.7 , κ = 0.40, y = 0.07 h , in which h is the water depth.
Calculations of the spatial derivatives are performed using an advanced finite difference approach. A Cartesian grid system is used for the mesh generation. The RANS equations’ convective part was discretized using a 5th-order WENO method [43]. The x-directional convective velocities read:
u i u i x i 1 Δ x u ˜ i + 1 / 2 u i + 1 / 2 u ˜ i 1 / 2 u i 1 / 2 ,
where u ˜ is the convective velocity. The free surface in the current numerical model is a highly complicated and dynamic problem. As a result, transient flow challenges require a numerical stability and a high precision. The current numerical model discretizes time using a Total Variation Diminishing (TVD) third-order Runge–Kutta explicit time scheme [44], which reflects a higher-order temporal precision. For excellent numerical consistency, the CFL number [45] is kept less than 1. The Chorin projection method [46] is used for pressure calculations.

2.2. Free Surface Model

The level-set method [47] is utilized in REEF3D to realistically represent the free surface of complex fluid motion. The zero level-set function ϕ ( x , t ) implicitly represents the location of the interface. This method utilizes the function that will provide the closest distance to the interface from any given position in the modelling domain. The principal benefit of using the LSM to compute the fluid interface is that ϕ ( x , t ) is smooth throughout the interface, making it differentiable at the interface and preventing numerical instabilities. The velocity field u j is used for computations at the interface. At the interface, the function is defined as zero, and in Phase 1, the function is defined as positive, and in Phase 2, the function is defined as negative. The spreading of level-set function is computed by solving the convection equation and represented as:
ϕ t + u j ϕ x j = 0 ,
where u j is defined as the fluid velocity obtained from the RANS equations. The function ϕ ( x , t ) is spatially discretized using the 5th-order WENO technique [38]. To discretize the time, the 3rd-order TVD Runge–Kutta [48] scheme is adopted. While the free surface keeps expanding, the signed distance property of the level-set function disappears. The re-initialization approach [49] is utilized to deal with this problem.
ϕ t + S ( ϕ ) | ϕ x j | 1 = 0 .
The numerical model utilizes the Cartesian grid for high-order discretization schemes. Moreover, given the shape of the numerical cells is elementary in this scenario, numerical algorithms are simple to construct. The use of the immersed boundary approach provides a solution to the issue of irregular and non-orthogonal solid boundaries. In this method, the solution is analytically continued through the solid boundary by updating imaginary ghost cells in the solid region by extrapolation. At the inlet of the numerical wave tank, the Dirichlet boundary condition is used, while at the exit, the active wave absorption method is used to absorb the waves.

2.3. Modelling of Sediment Transport

The sediment transport in the present CFD model is calculated based on the flow hydrodynamics model. Erosion and sediment suspension are governed by the process by which sediments are transported downstream (i.e., bed load or suspended load). These two modes are distinguished from one another through a proportional relationship between the critical bed shear stress [50] and the settling velocity. The dimensionless formulations of the bed shear stress are as follows:
τ = τ ρ s ρ g d i ,
τ c , i = τ c , i ρ s ρ g d i ,
q b , i = q b , i ( ρ s ρ ) g ρ d i ,
where ρ denotes the density of water and ρ s denotes sediment density, d i stands for the sediment particle size, τ c , i is referred to as the non-dimensional critical shear stress, and τ stands for the non-dimensional shear stress. In the present study, bed load transport formulation by [51], and [52] is used.
Formulas for determining the bed load transport rate may be found in several studies in the literature. The majority of the mathematical models in those studies relate the transport rate to the shear stress on the bed. Instead of using their absolute values, sediment transport rates and bed shear stresses are commonly expressed in dimensionless forms, which allows for a more meaningful comparison across different flow conditions and scales. Van Rijn [51] put forward the concept of the rate of the bed load transportation q b , i as:
q b , i d i 1.5 ρ s ρ · g ρ s = 0.053 · τ τ c , i τ c , i 2.1 d i ρ S / ( ρ 1 ) · g ν 2 1 / 3 0.3 ,
where ν is the kinematic viscosity of water. The critical bed shear stress τ c , i is calculated from the Shields diagram [53] and then multiplied by the reduction factor r in order to take the sloping bed into account as discussed below.

Suspended Sediment Load Transportation

The governing equation of the suspended sediment transport is formulated by the standard convection–diffusion formula, which reads:
c t + u j c x j + w S c z = x j Γ c x j ,
where the suspended load concentration is indicated by c. The value of the eddy viscosity [54] is regarded to be equivalent to the value of Γ . The value of the sediment concentration at the bed ( c b ) [51,55] can be determined as follows:
c b = 0.015 d 50 a T 1.5 D 0.3
where D represents the particle parameter:
D = d 50 ( s 1 ) g ν 2 1 / 3
In Equation (19), a represents the datum level [56] of the suspended sediment load. The datum level in the present study is k s = 3 d 50 . Shield’s diagram is used for the calculation of the critical bed shear stress τ 0 on the horizontal bed slope. For the calculation of the critical bed shear stress, the effect of a sloping bed is a key parameter that causes the incipient motion of sediment particles. The lesser critical shear stress ( τ c ) [57,58,59,60] is then determined by applying a correction factor. To obtain the modified critical shear stress τ c , the reduction factor is multiplied by the flat bed critical shear stress,
τ c = r · τ 0 .
In the present investigation, an analytical formulation [61] is included in the CFD model in order to calculate the correction factor (r), which reads:
r = 1 ( 1 η t a n ϕ ) t a n ϕ s i n θ + η t a n 2 ϕ cos 2 θ s i n 2 α + s i n θ + η t a n 2 ϕ c o s 2 θ s i n 2 α 2 + 1 η 2 t a n 2 ϕ c o s 2 θ t a n 2 ϕ s i n 2 α t a n 2 ϕ s i n 2 θ s i n 2 α 0.5 ,
where η denotes the ratio of the force exerted by the drag to the force exerted by the inertia. The sand-slide algorithm [62] is used as a modifier for the purpose of bed shear stress reduction during the process of erosion. This is done in order to prevent the surplus sediment from sliding downstream when the slope of the bed is greater than the angle of repose ( ϕ ). When the bed slope is greater than the angle of repose ( ϕ ), a slope adjustment of −2%, as proposed by Roulund et al. [63], is applied to the slope.
In order to provide a realistic depiction of the free surface of the mobile sediment bed, our numerical model makes use of the level-set technique. To represent the bed development, a zero level-set function is used. The driving force, F = z b t , is responsible for moving the interface in the vertical direction to depict the processes of erosion and deposition. Changes in local bed surface are shown here by the symbol z b . Bed load and suspended load transport mechanisms are used to estimate the bed surface velocity F. The Exner equation is used to solve for the bed elevation changes utilizing the values of erosion and sedimentation.

3. Model Validation

This section presents the validation of the CFD code for scouring caused by the combined effects of wave and current around a group of piles. In the simulations, waves and currents act in the same direction within the computational domain. The experimental results of Qi et al. [33] are utilized to validate the numerical model used in the present study. The flume experiment corresponding to α = 90 and G / D = 0 (Run No. 25) is used for model validation, which was conducted for scouring due to the combined wave–current effect around a twin pile. The experimental wave flume was 52 m long, 1 m wide, and 1.5 m deep, with a constant water depth of 0.50 m. In the experiment, a pair of twin piles with a diameter (D) of 8 cm was employed. In the wave flume, a sand layer of 30 cm deep is used. Other sediment parameters are shown in Table 1. The wave parameters were H = 0.14 m, T = 1.8 s. The K C number was set to 5.63, the pile Reynolds number ( R D = U m D ν ) based on U m ( = U c + U w m ) was set to 3.84 × 10 4 , and the pile Froude number ( F r = U c / g D ) was set to 0.434. The undisturbed current velocity was 0.23 m/s. As illustrated in Figure 1, the numerical results show the S / D over time, where S represents the depth of scour and D is the diameter of the pile. The numerical simulation was run for 2 h. It can manifestly be seen that the numerical results are in good agreement with the experimental results.
The numerical model’s accuracy (validation) is verified by comparing it to the experimental results of Qi and Gao [34], who conducted their experiment in a flume measuring 52 m in length, 1 m in width, and 1.5 m in height. To generate waves, a numerical setup employed a numerical wave tank (NWT) of reduced size. The NWT utilized the 2nd-order Stokes wave theory and had dimensions of 2.6 m in length, 1.0 m in width, and 0.7 m in height. Table 1 shows the sediment parameters used in the simulation.
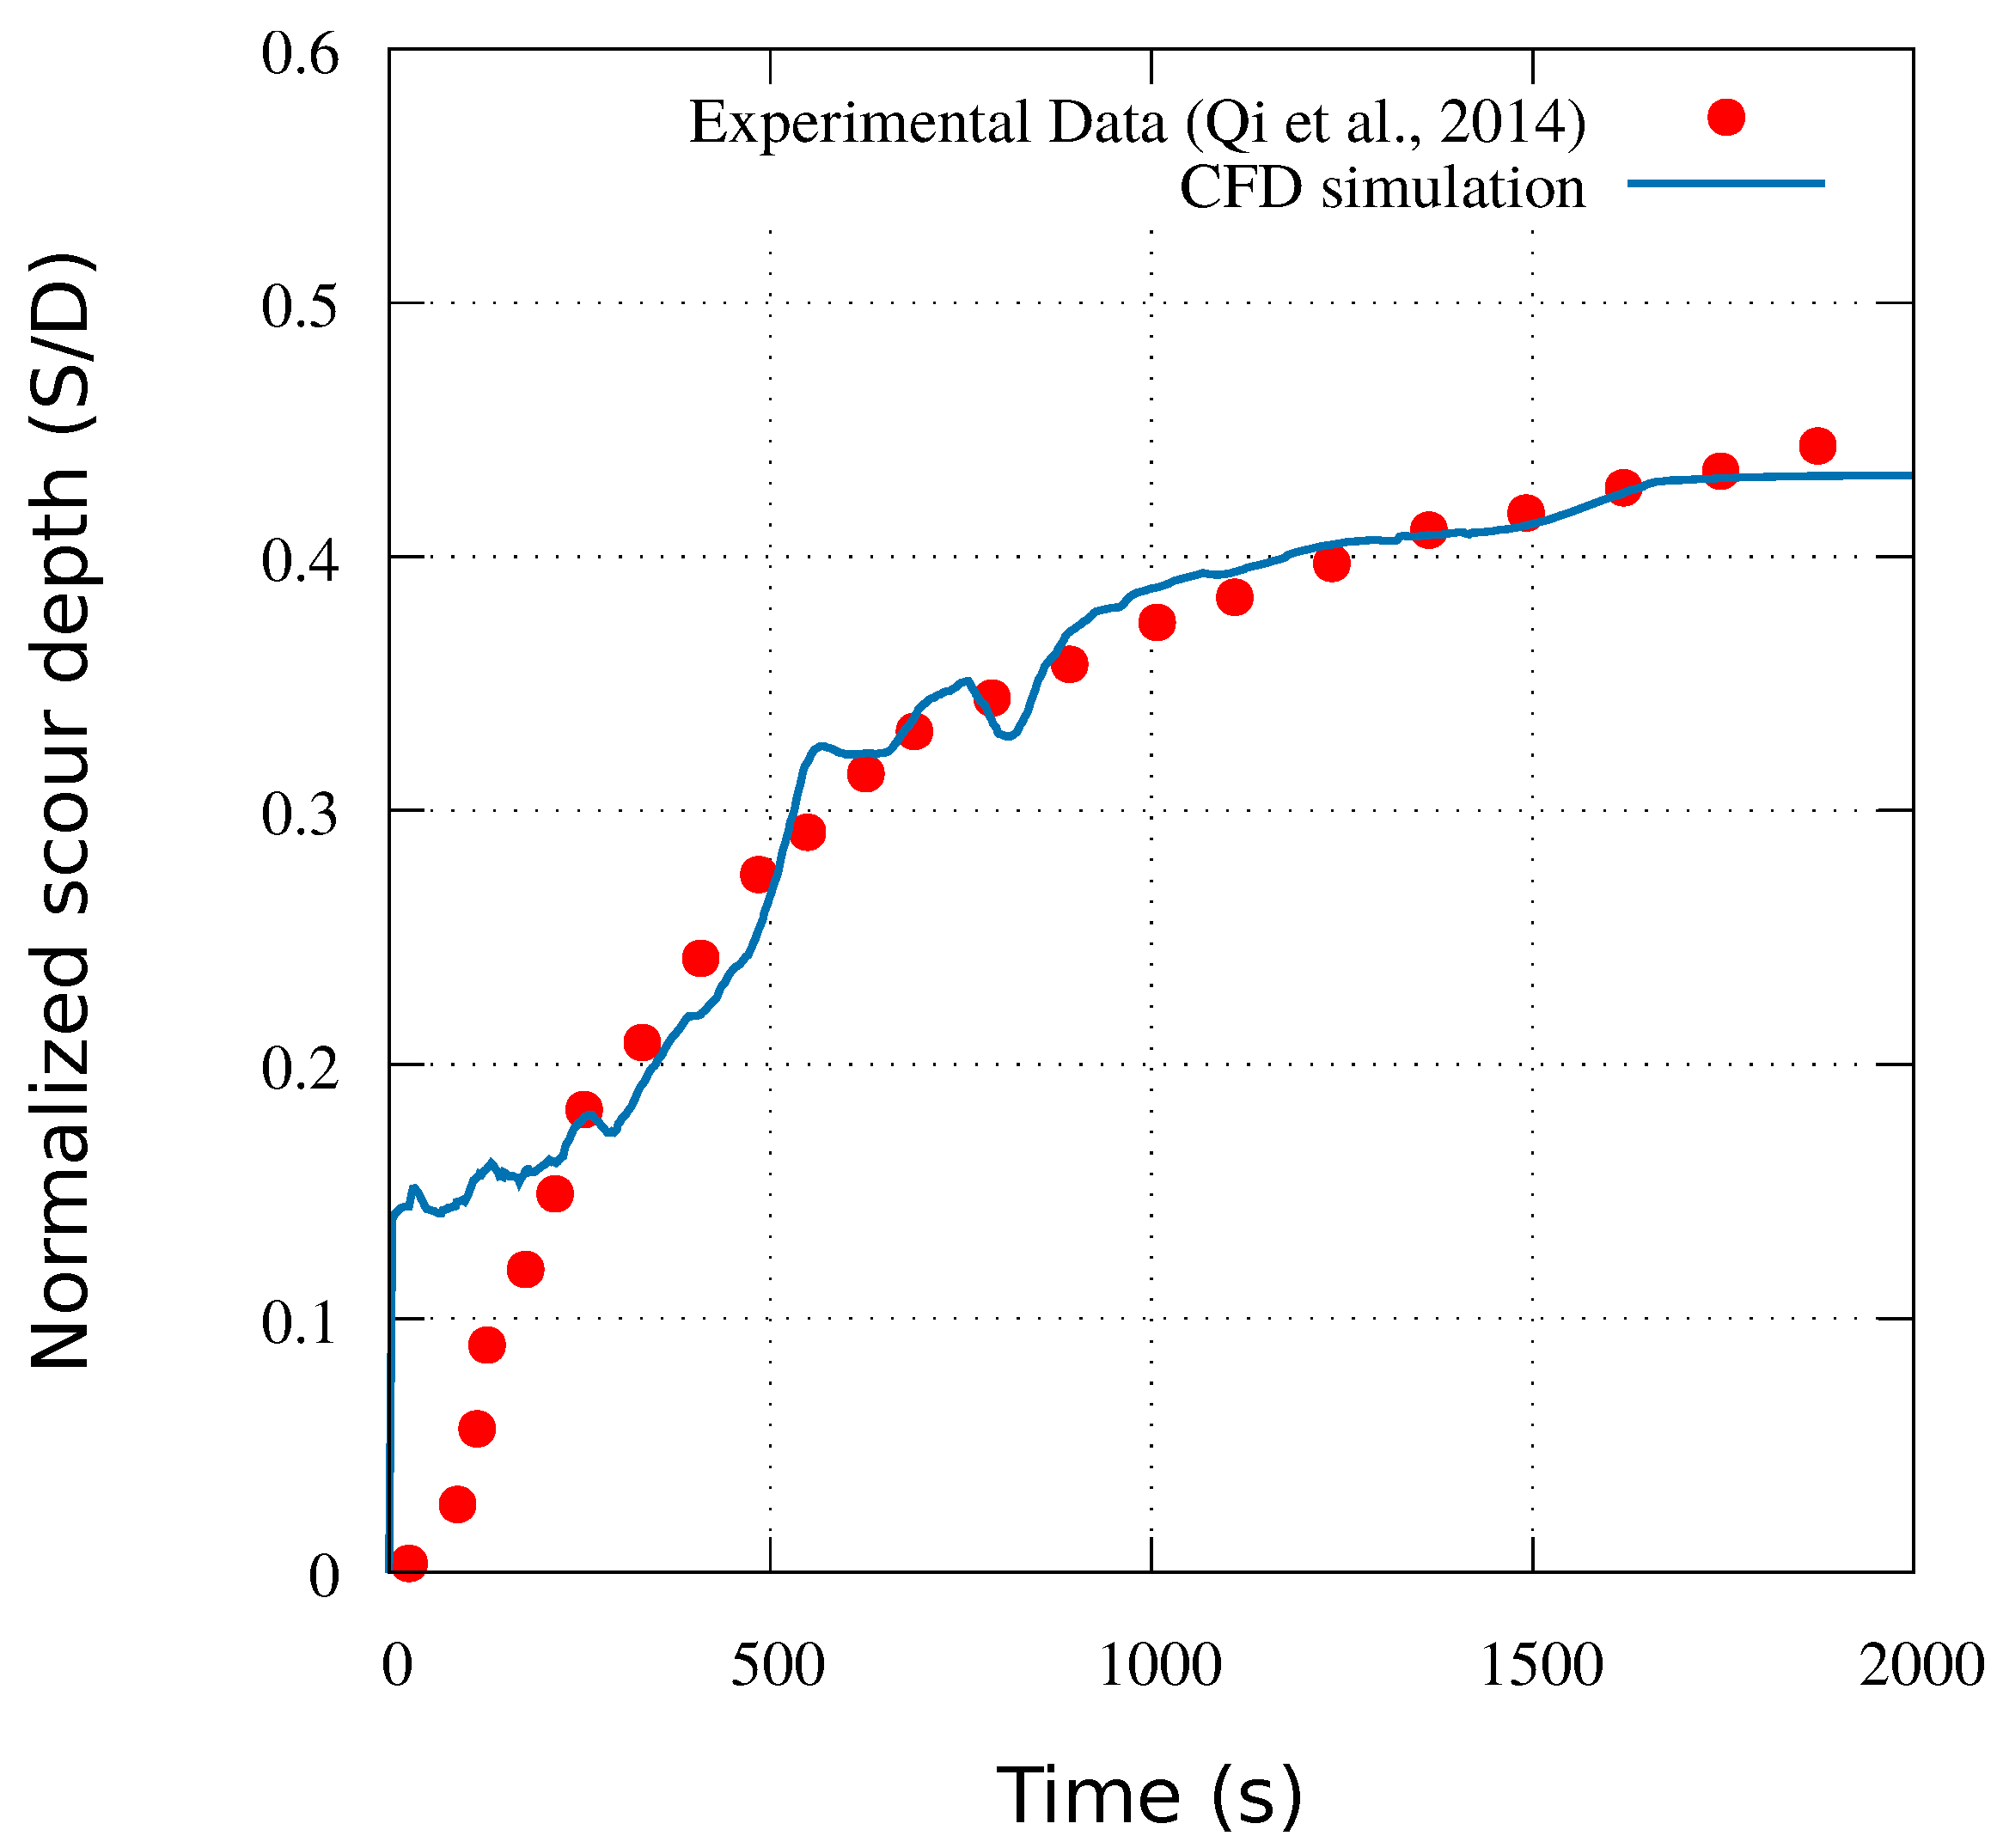
Figure 2 shows a comparison of the numerical results against the experiments of Qi and Gao [34]. Here, the simulations were conducted using a grid size of 2 cm. It can be seen that the S / D observed using the simulations is 0.43, which is the same as the one predicted by Qi and Gao [34], satisfactorily following the experimental value ( S / D = 0.44).
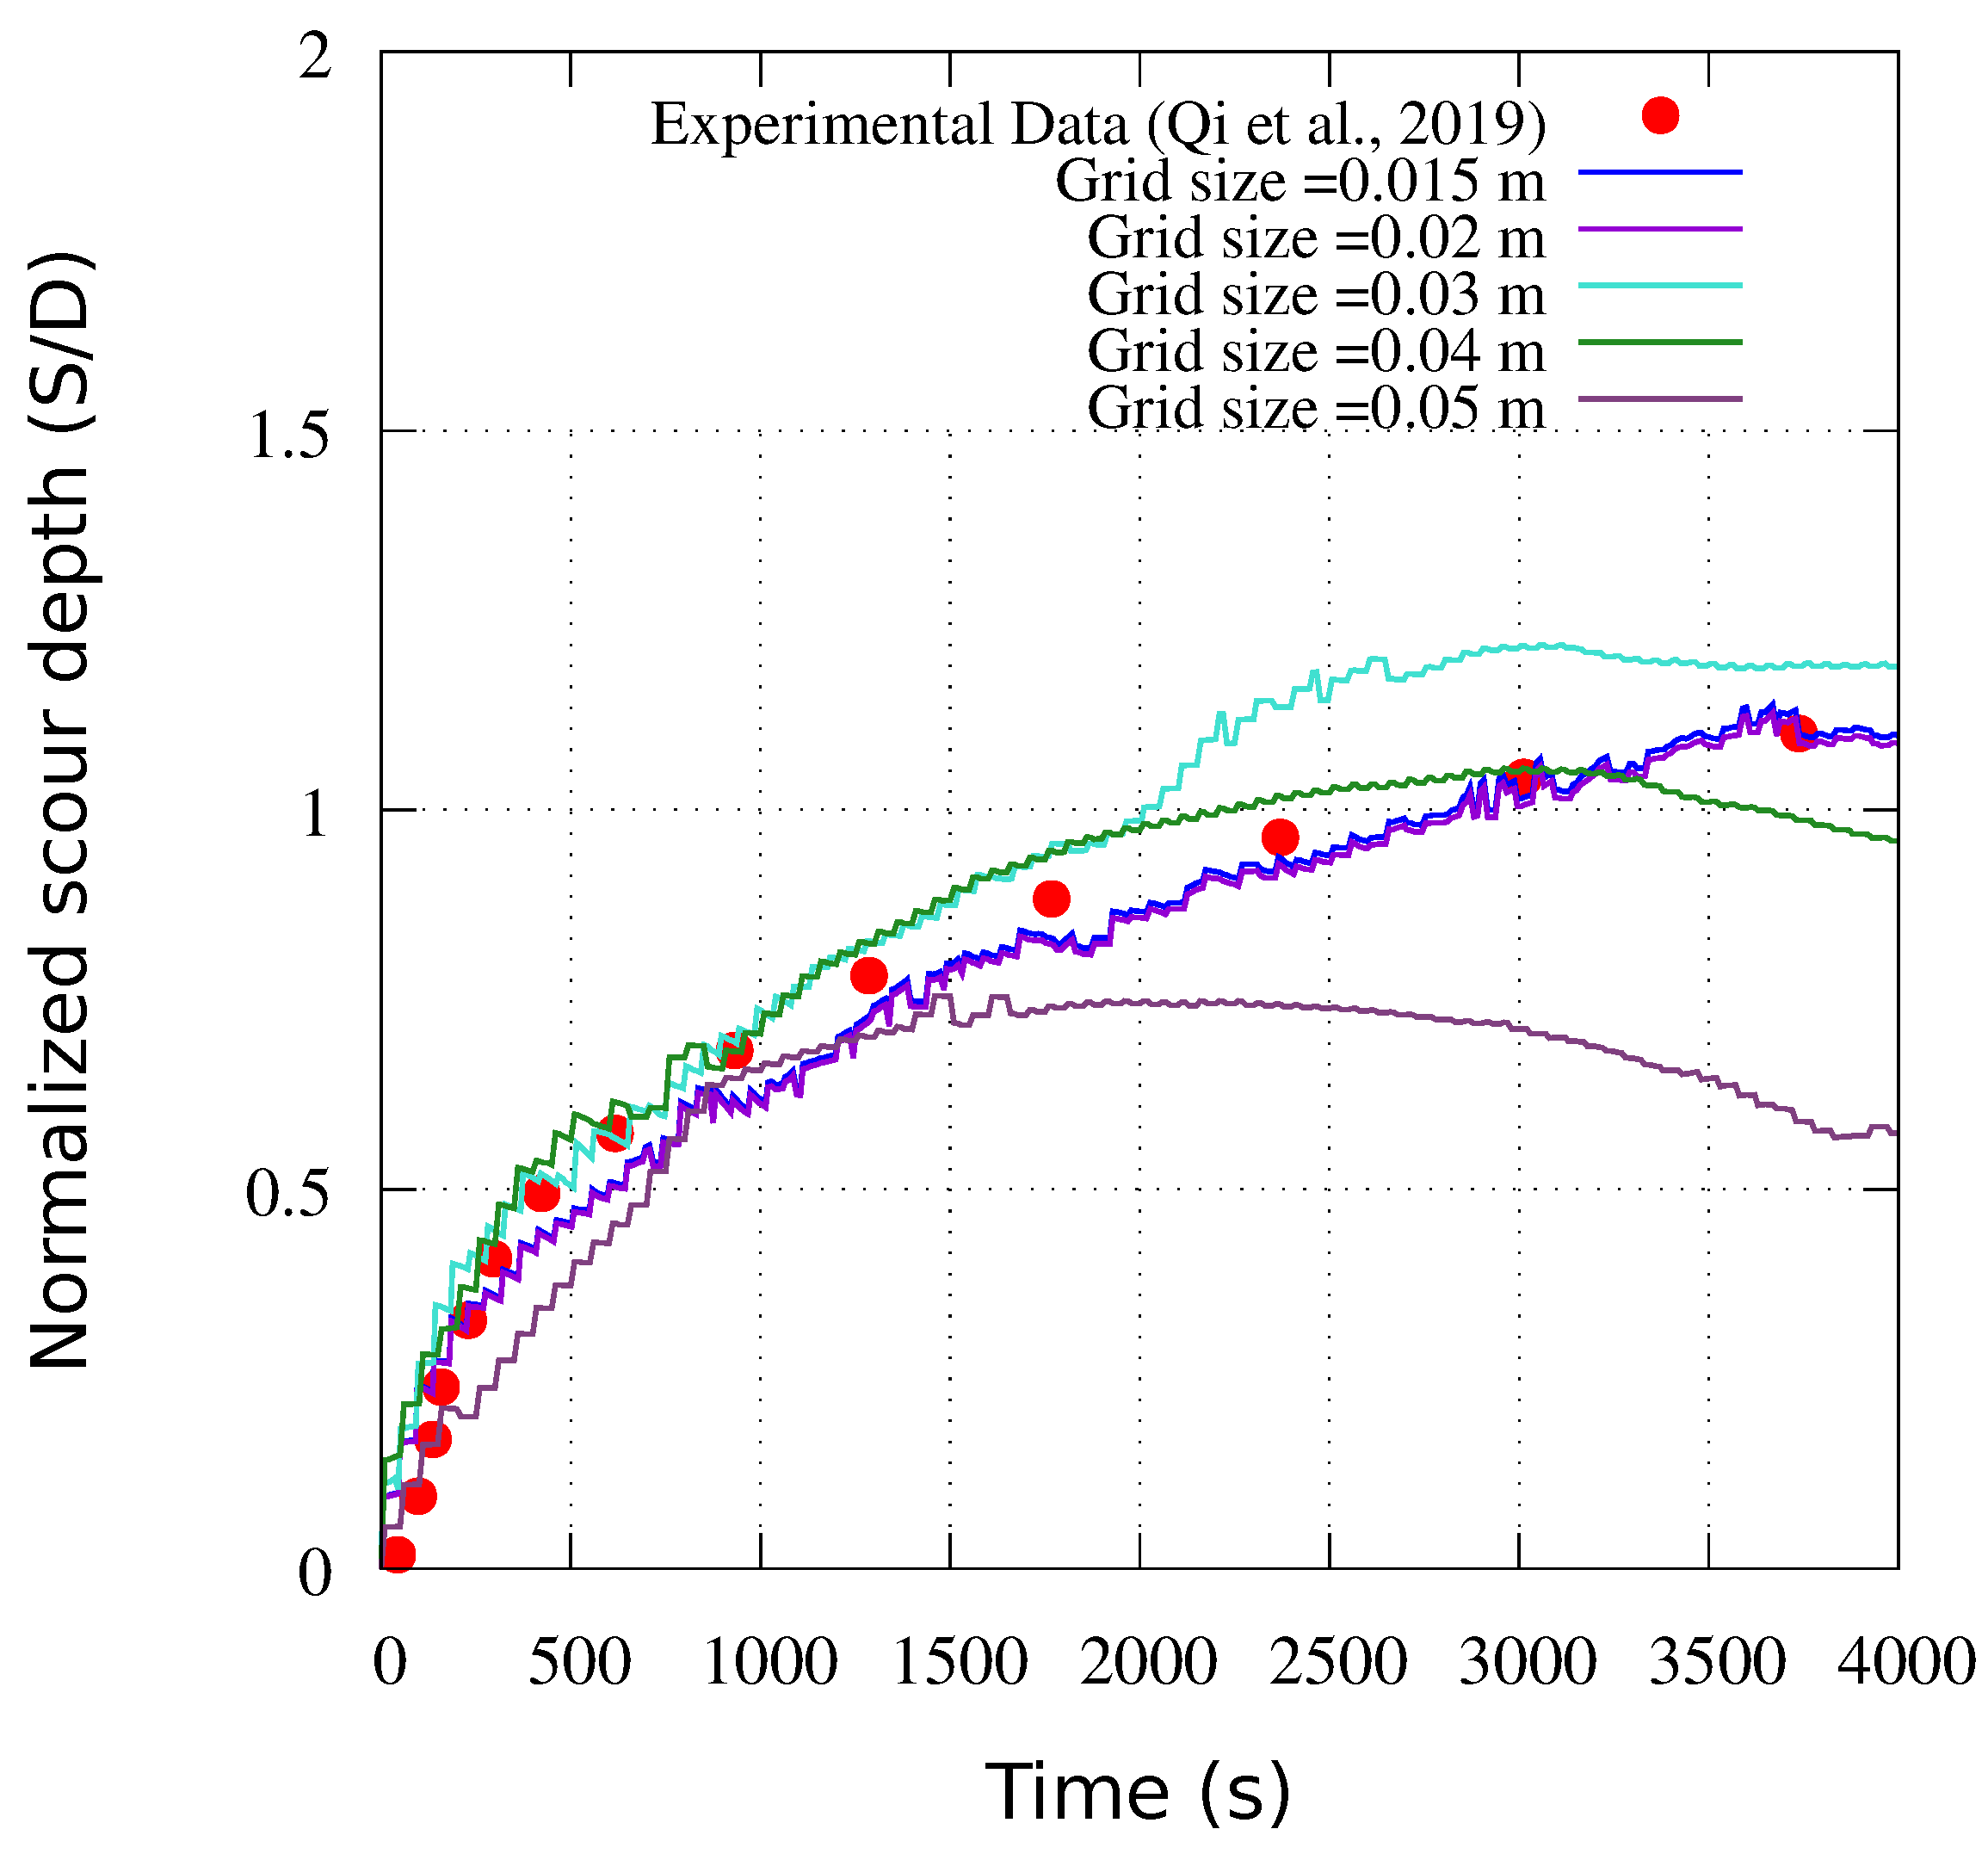
In Figure 3, the grid convergence and validation results are depicted for the time-varying normalized depth of scour ( S / D ). The discrete points are the experimental results of Qi et al. [33] (Run No. 27), and the solid red line represents the numerical results using the different grid sizes (5, 4, 3, 2, and 1.5 cm). It was observed from the experimental findings that the S / D was 1.1. CFD simulation results generated with coarse grid sizes of 5 cm and 4 cm, as shown in Figure 3, indicate substantial variations from the experimental data; yet the temporal development of normalized scour is improved by reducing the grid size. In order to obtain the most precise results, the grid size is decreased to 2 cm. No significant changes in the results of the study were observed upon reducing the grid size from 2 cm to 1.5 cm. As a result, a grid size of 2 cm was deemed optimal for further analysis. Additionally, the equilibrium scour depth was reached within 1 h for all cases. Therefore, for further analysis, the simulation period has been chosen to be 3600 s. The sediment size ( d 50 ) is kept at 0.0002 m for all simulations.

4. Results And Analysis

The numerical model, which has been extensively validated, as discussed earlier, is employed to examine the scouring that arises from the joint effects of waves and current, considering different combinations of K C number and aspect ratio of rectangular piles. Here, waves and current are collinear. Three different K C numbers (KC = 3.9, 5.75 and 10) and three different aspect ratios (1:1, 1:2, and 2:1) were used in the simulations. Sumer et al. [64] observed three distinct vortex flow regimes, each corresponding to a unique K C number: 3.90, 5.75, and 10. The description of the flow regimes is the same as discussed in Gautam et al. [35]. A combined wave–current parameter of U c w = 0.4 was considered for each of the K C numbers mentioned above, which indicates waves acting in combination with mild currents. The symbol T e represents the duration of the simulation, and in all simulations, the wave parameter k h is equal to 0.2247, where k corresponds to the wave number.
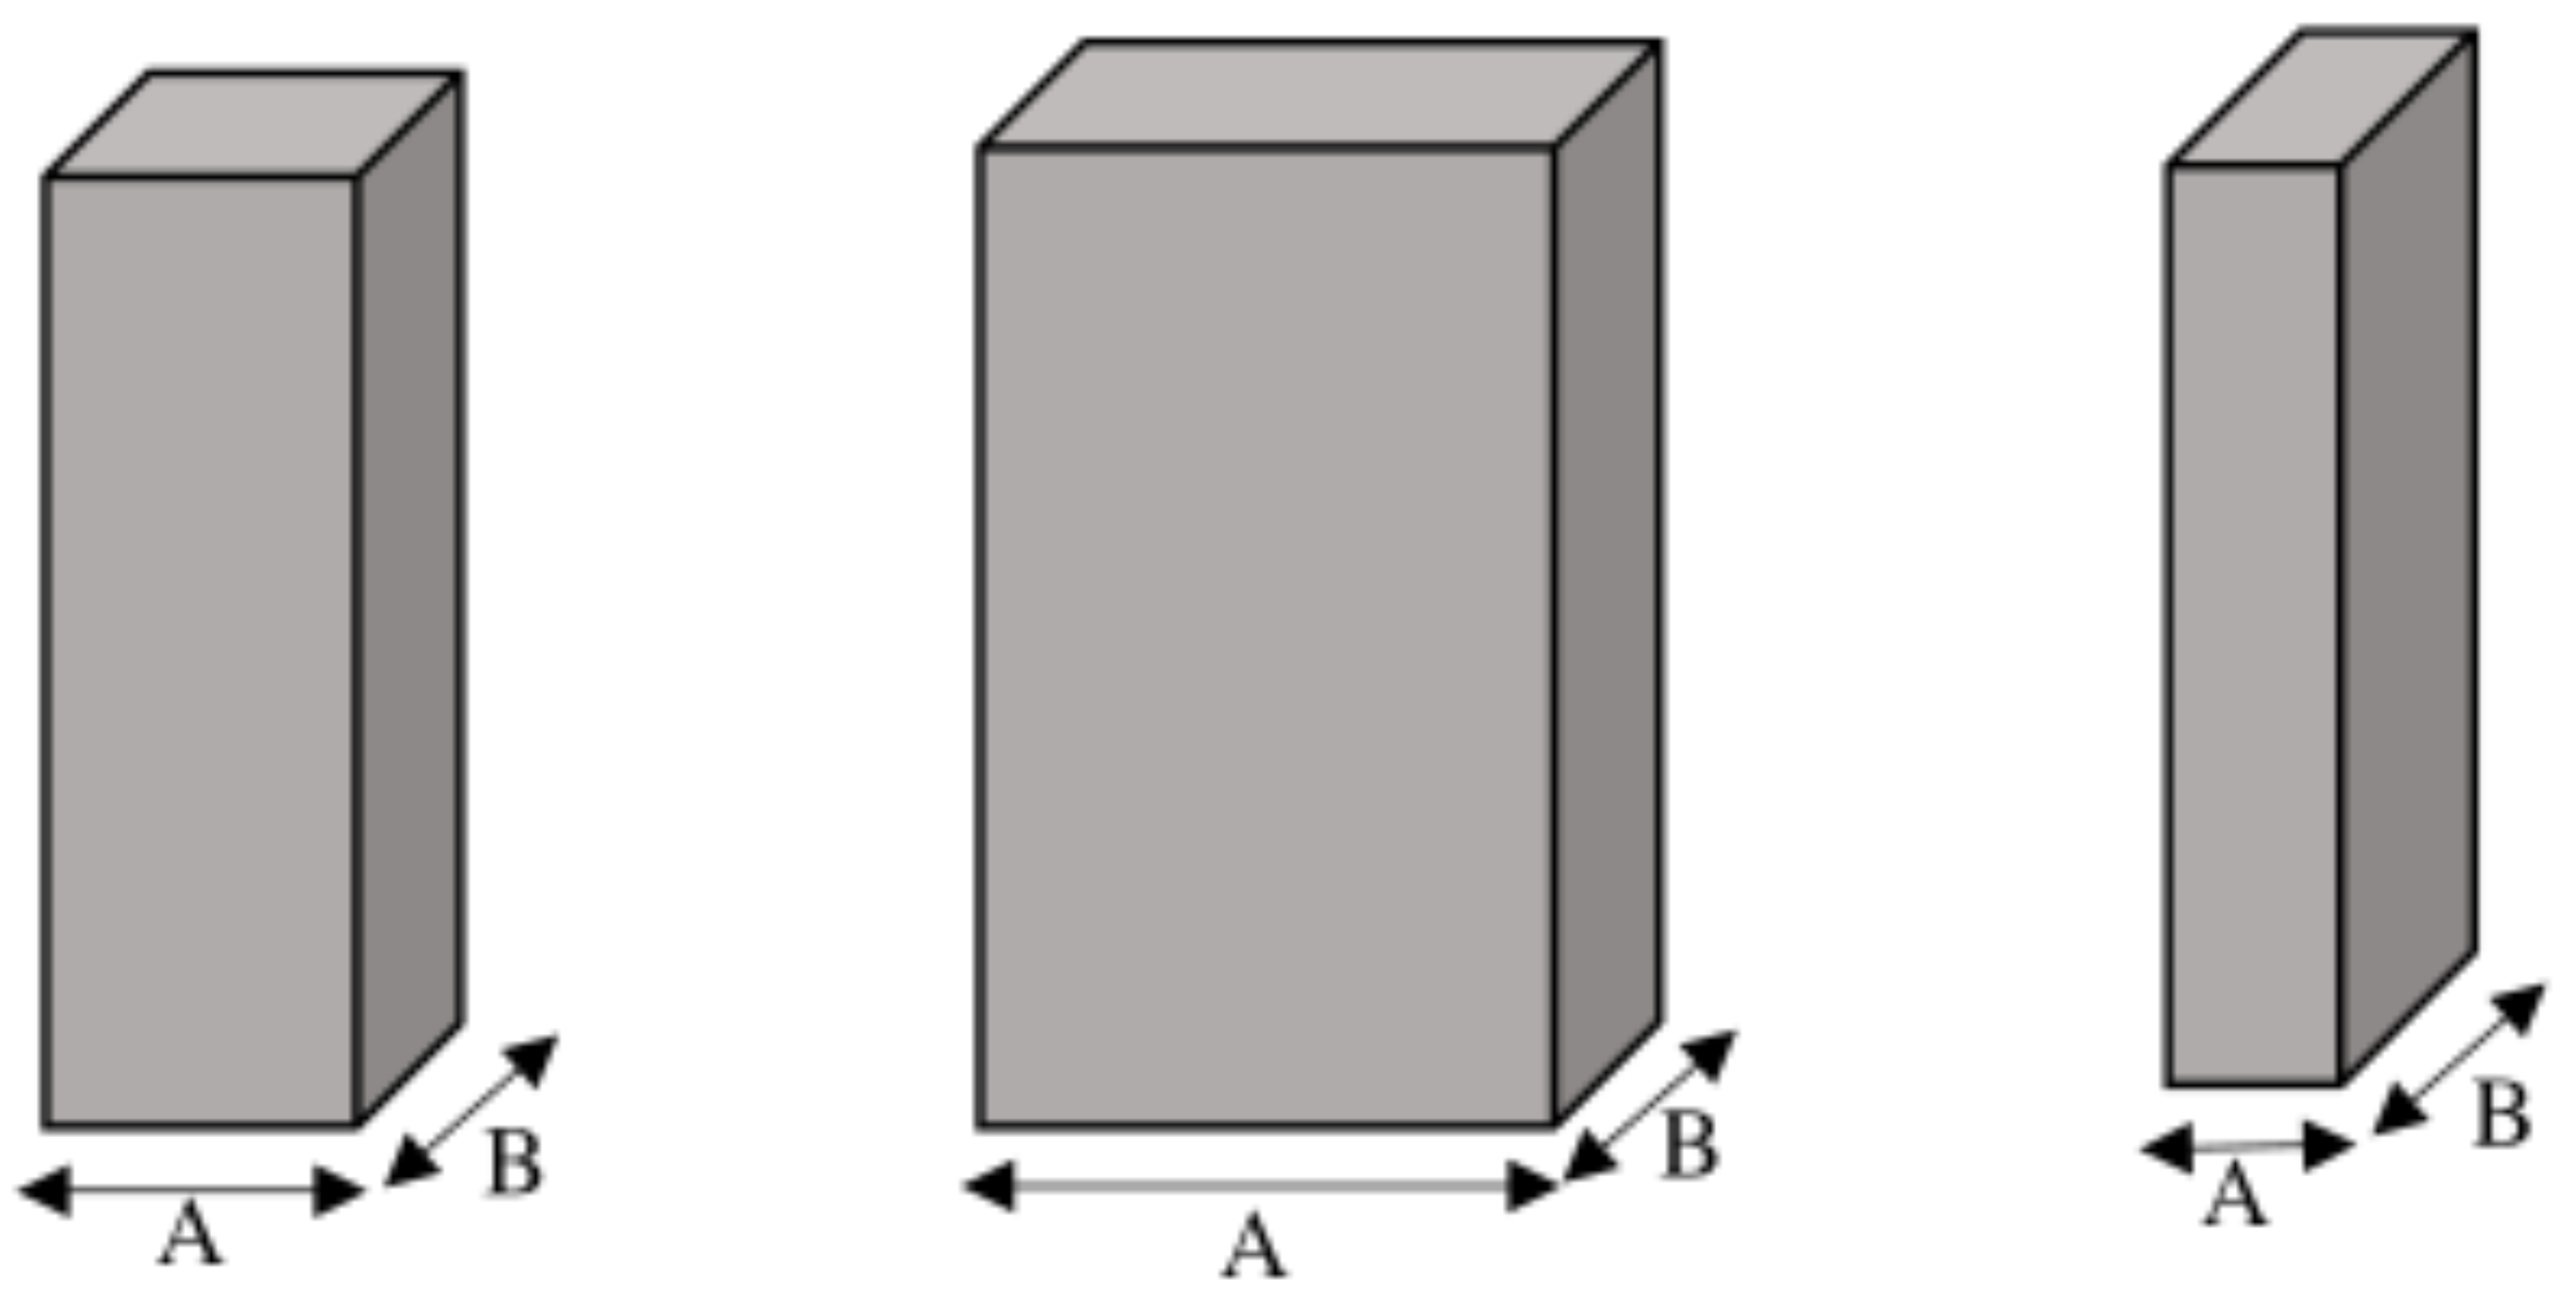
A schematic diagram indicating the rectangular piles with different aspect ratios ( B : A ) is shown in Figure 4 and Figure 5. The aspect ratios ( B : A ) between the piles are varied by (a) 1:1, (b) 1:2, and (c) 2:1 to analyze the scour around the pair of piles.
A total of 9 numerical simulations were conducted on a high-performance supercomputer at the Indian Institute of Technology with 2× Intel Xeon SKL G-6148 Cores of 40×8 login nodes (total = 15,360 CPU cores) and a 2.4 GHz processor. Each simulation simultaneously employs 256 CPU cores. Each simulation was conducted for 1 h simulation period. A workstation equipped with a 64-core AMD Epyc 7702 processor was used for visualizing and analyzing the results. The validation, grid convergence, and analysis of simulation results of the REEF3D model are summarized in Table 2.
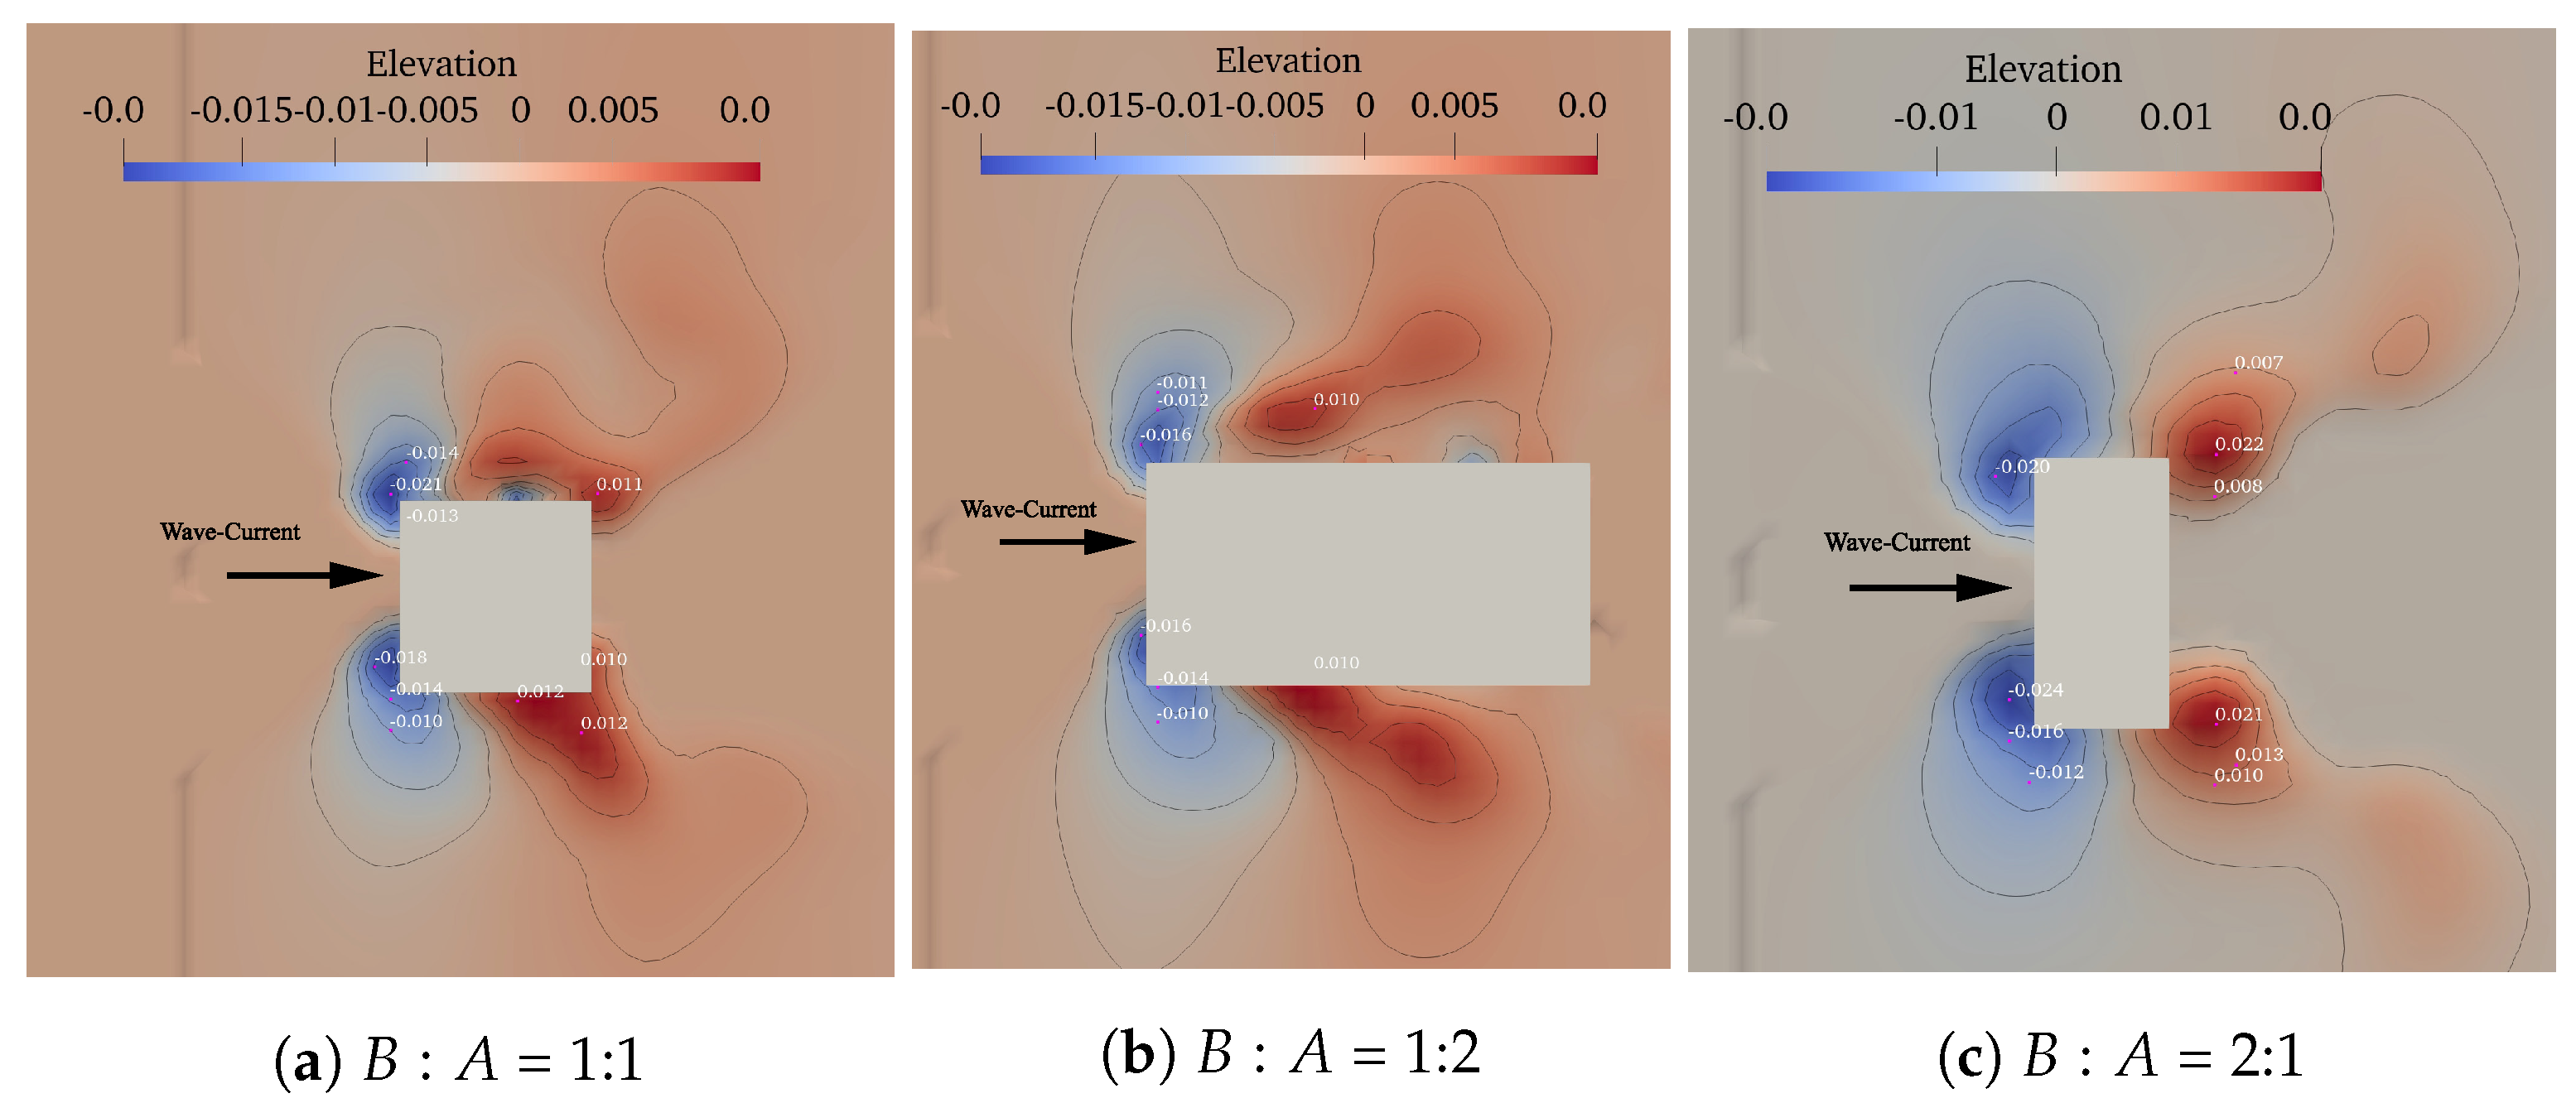
Figure 6 illustrates the topographic bed contours for the waves with moderate current ( U c w = 0.4) for the K C number 3.9 and the aspect ratios of 1:1, 1:2, and 2:1. The current velocity of the flow is 0.052 m/s, and the wave criterion H / L and a k are 0.0072 and 0.0228, respectively. The present run scenario indicates a live bed scour pattern, since the sediment bed’s θ is 0.093, and θ c r is 0.047. The maximum attainment of scour can be seen (in Figure 6) around the upstream nose of the square pile. The deepest visible scour contours of the sediment beds are −0.021 m, −0.016 m, and −0.024 m, shown in blue color for K C 3.9. The highest visible scour contours of the sediment beds are 0.013 m, 0.009 m, and 0.021 m, presented in red color, suggesting that deposition likewise decreases with increasing gap ratios. It can also be seen that the eroded sediments deposit downstream due to the shadow effect of the piles. Here, the velocity reduces and the deposition takes place. Maximum scour occurs between the two sides of the piles. It can also be seen that the maximum erosion of sediment occurs for the piles with aspect ratios of 2:1.
Figure 7 shows the normalized equilibrium scour depth ( S / D ) obtained from the numerical simulations against the normalized time ( t / T e ) for K C = 3.9 with different aspect ratios. All the plots show the achievement of the steady state of the scour process at the end of the simulation period. The maximum normalized scour depth is obtained for the aspect ratio of 2:1 with a value of 0.15. With a decrease in the aspect ratio, scour depth decreases. The normalized scour depth for the aspect ratios of 1:1 and 1:2 are 0.14 and 0.13, respectively, for the combined wave−current parameter U c w = 0.4.
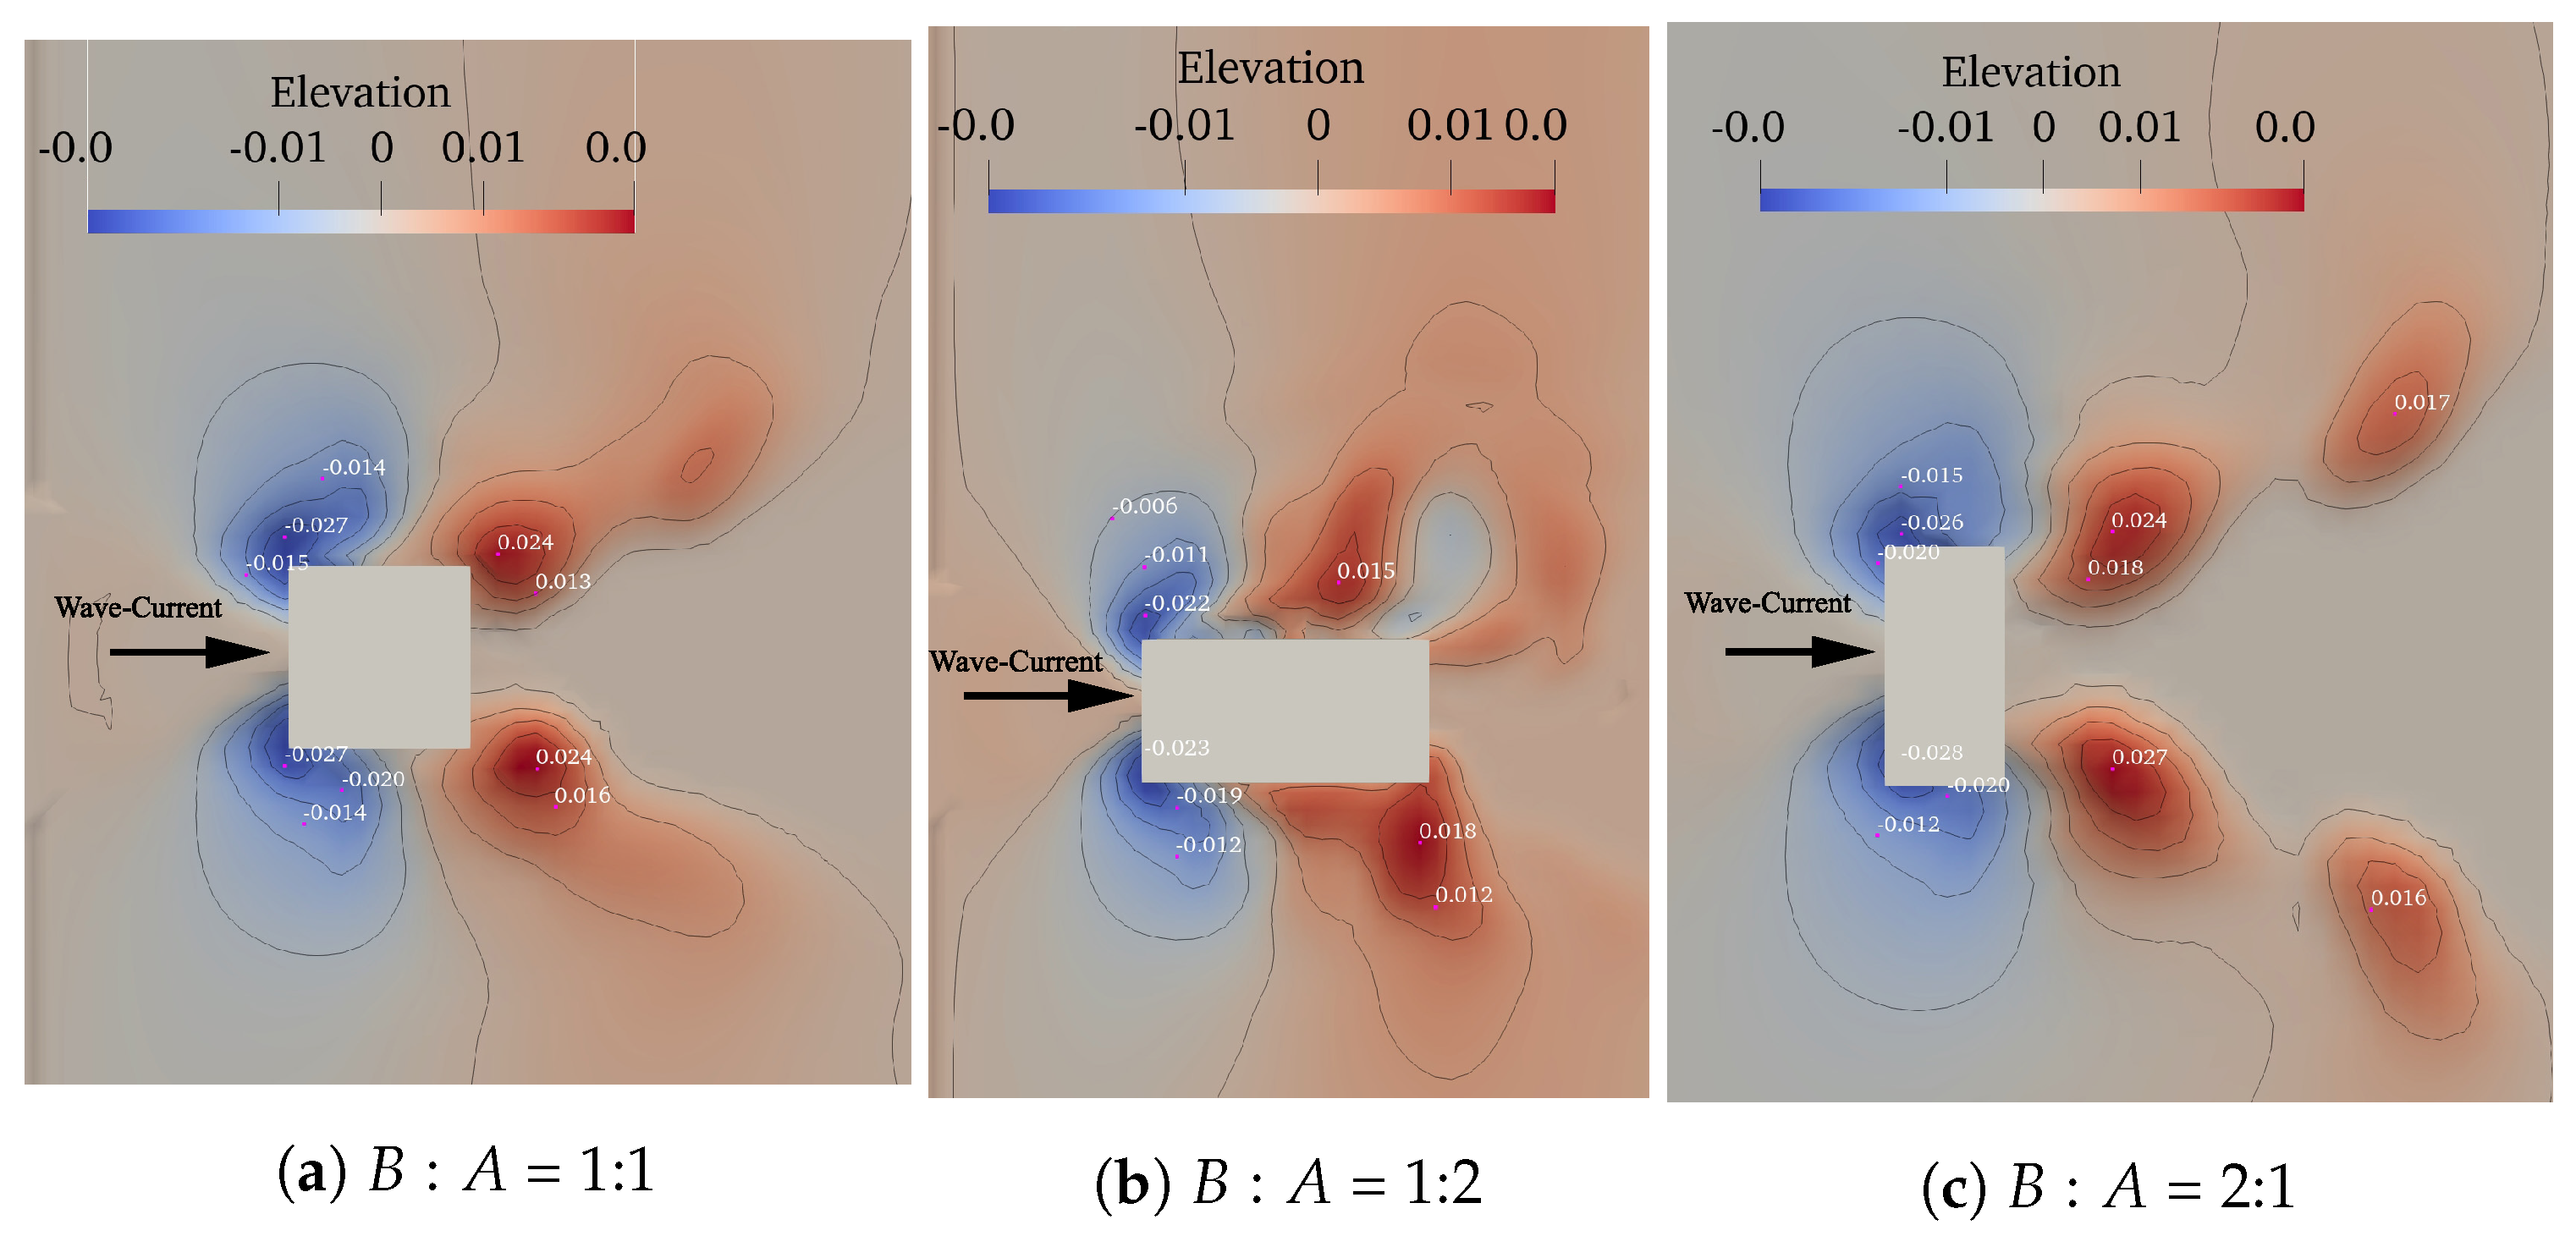
Figure 8 illustrates the topographic bed contours for the waves with moderate current ( U c w = 0.4) for the K C number 5.75 for the aspect ratios of 1:1, 1:2, and 2:1. The shields parameter ( θ ) in the current situation is 0.122, while the critical shields parameter ( θ c r ) is 0.047, indicating the live-bed scour condition. In contour plots, the blue color indicates erosion, and the red color indicates deposition. As observed in Figure 8, the maximum scour is generated for the pile with an aspect ratio of 2:1, whereas the scour decreases for the aspect ratios of 1:2 and 1:1. The scour becomes minimal for the aspect ratio of 1:2. The deepest visible contour (blue color denotes highest scour) for aspect ratio of 2:1 is −0.028 m and reduces as follows: −0.027 m for aspect ratio 1:1, and −0.0 24 m for aspect ratio 1:2. The largest visible contour (red color indicating maximal deposition) for aspect ratio 2:1 is 0.027 m and drops to 0.023 m for aspect ratio 1:1, and 0.016 m for aspect ratio 1:2, suggesting that the deposition decreases with decreasing aspect ratios.
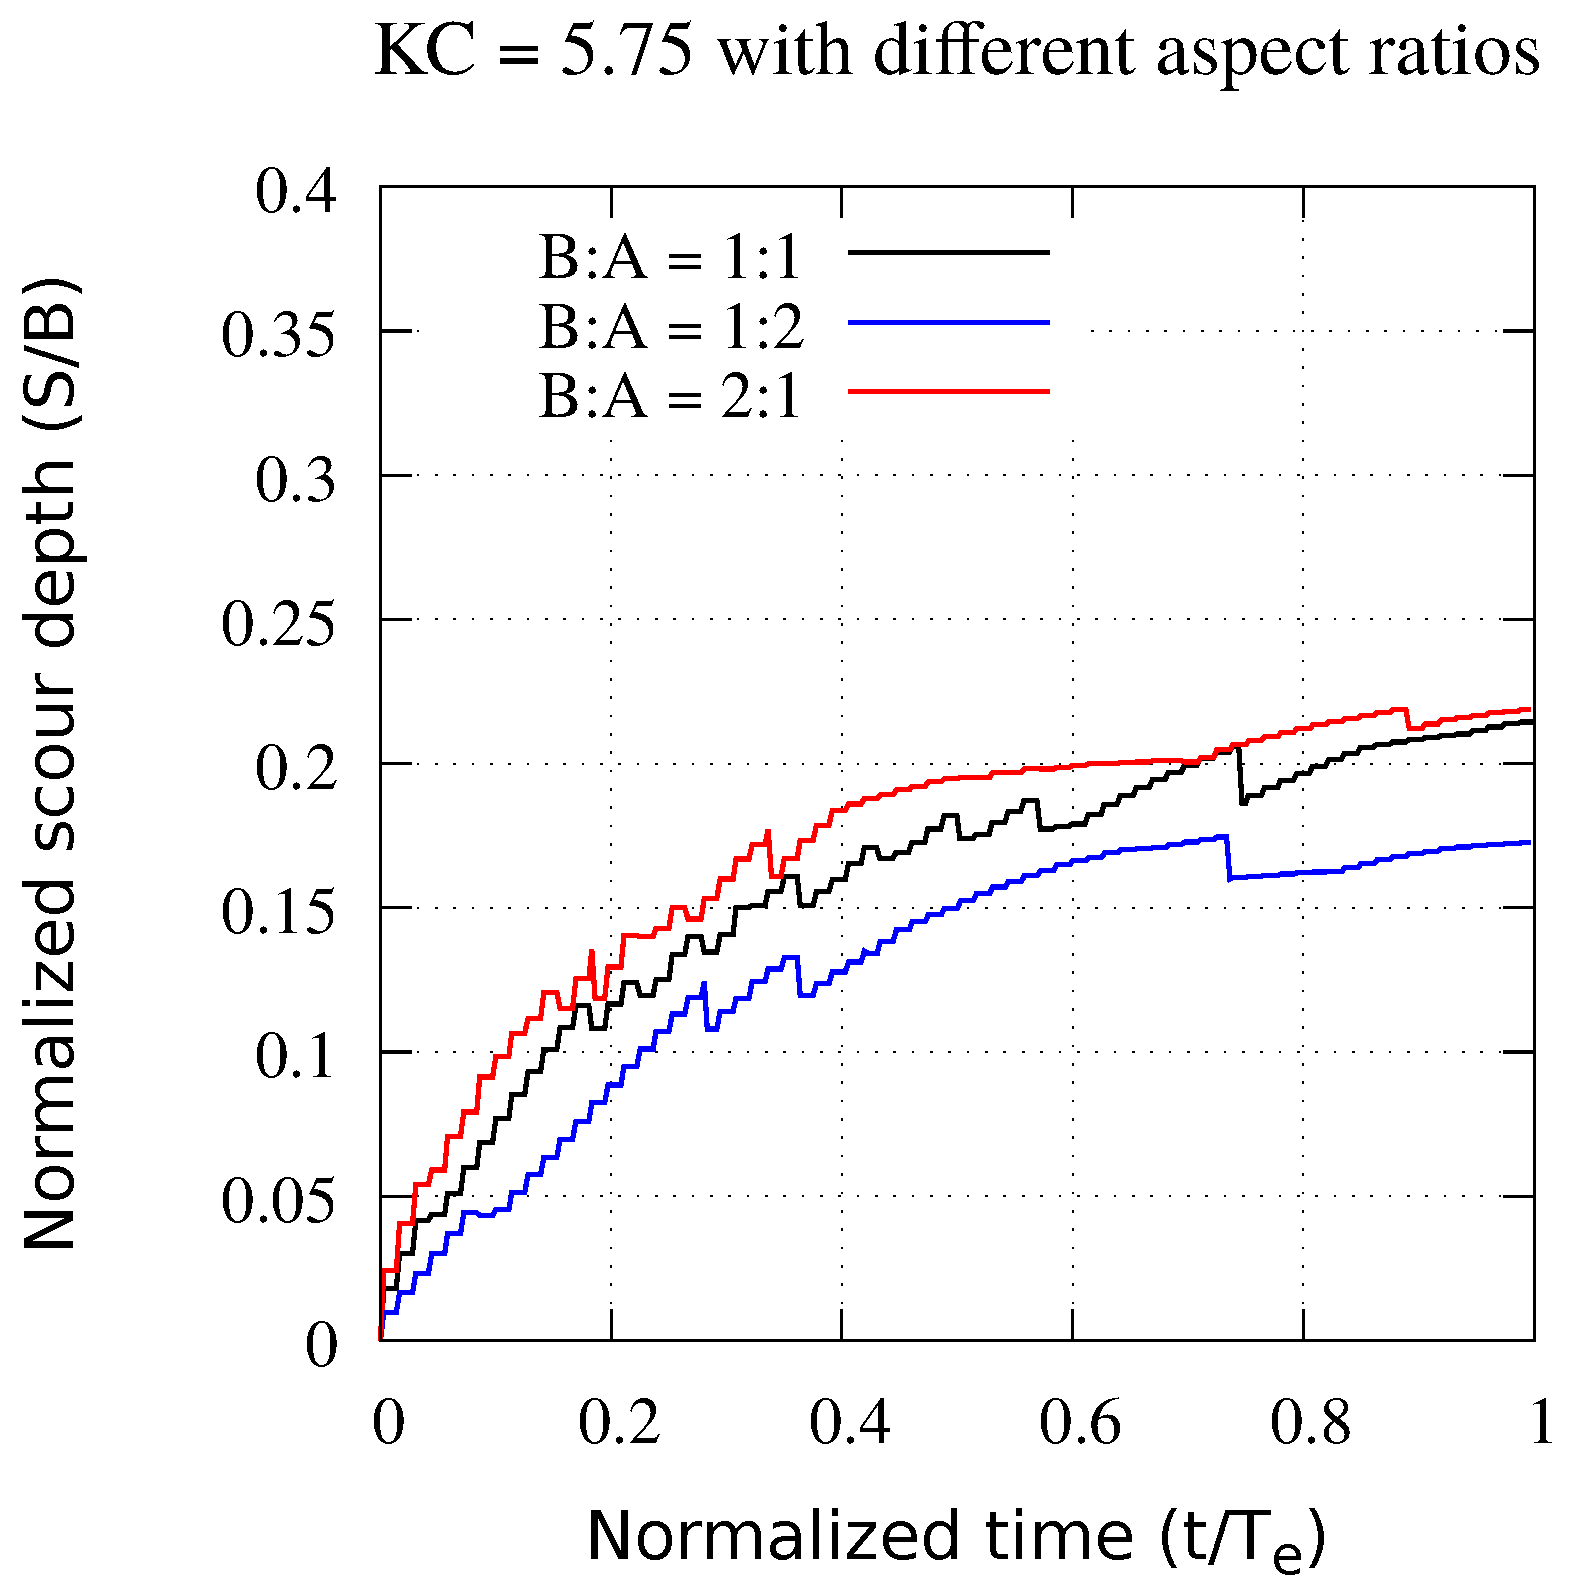
Figure 9 depicts S / D values against the normalized time ( t / T e ) for K C = 5.75 and U c w = 0.4. After the simulation time’s completion, the steady-state of the scour process is represented by all graphs. In Figure 9, the maximum normalized scour depth (0.22) is achieved when the aspect ratio is 2:1. As the aspect ratio changes, the scour depth changes rapidly. For the aspect ratio of 1:1 and 1:2, the normalized scour depth values are 0.213 and 0.172, respectively.
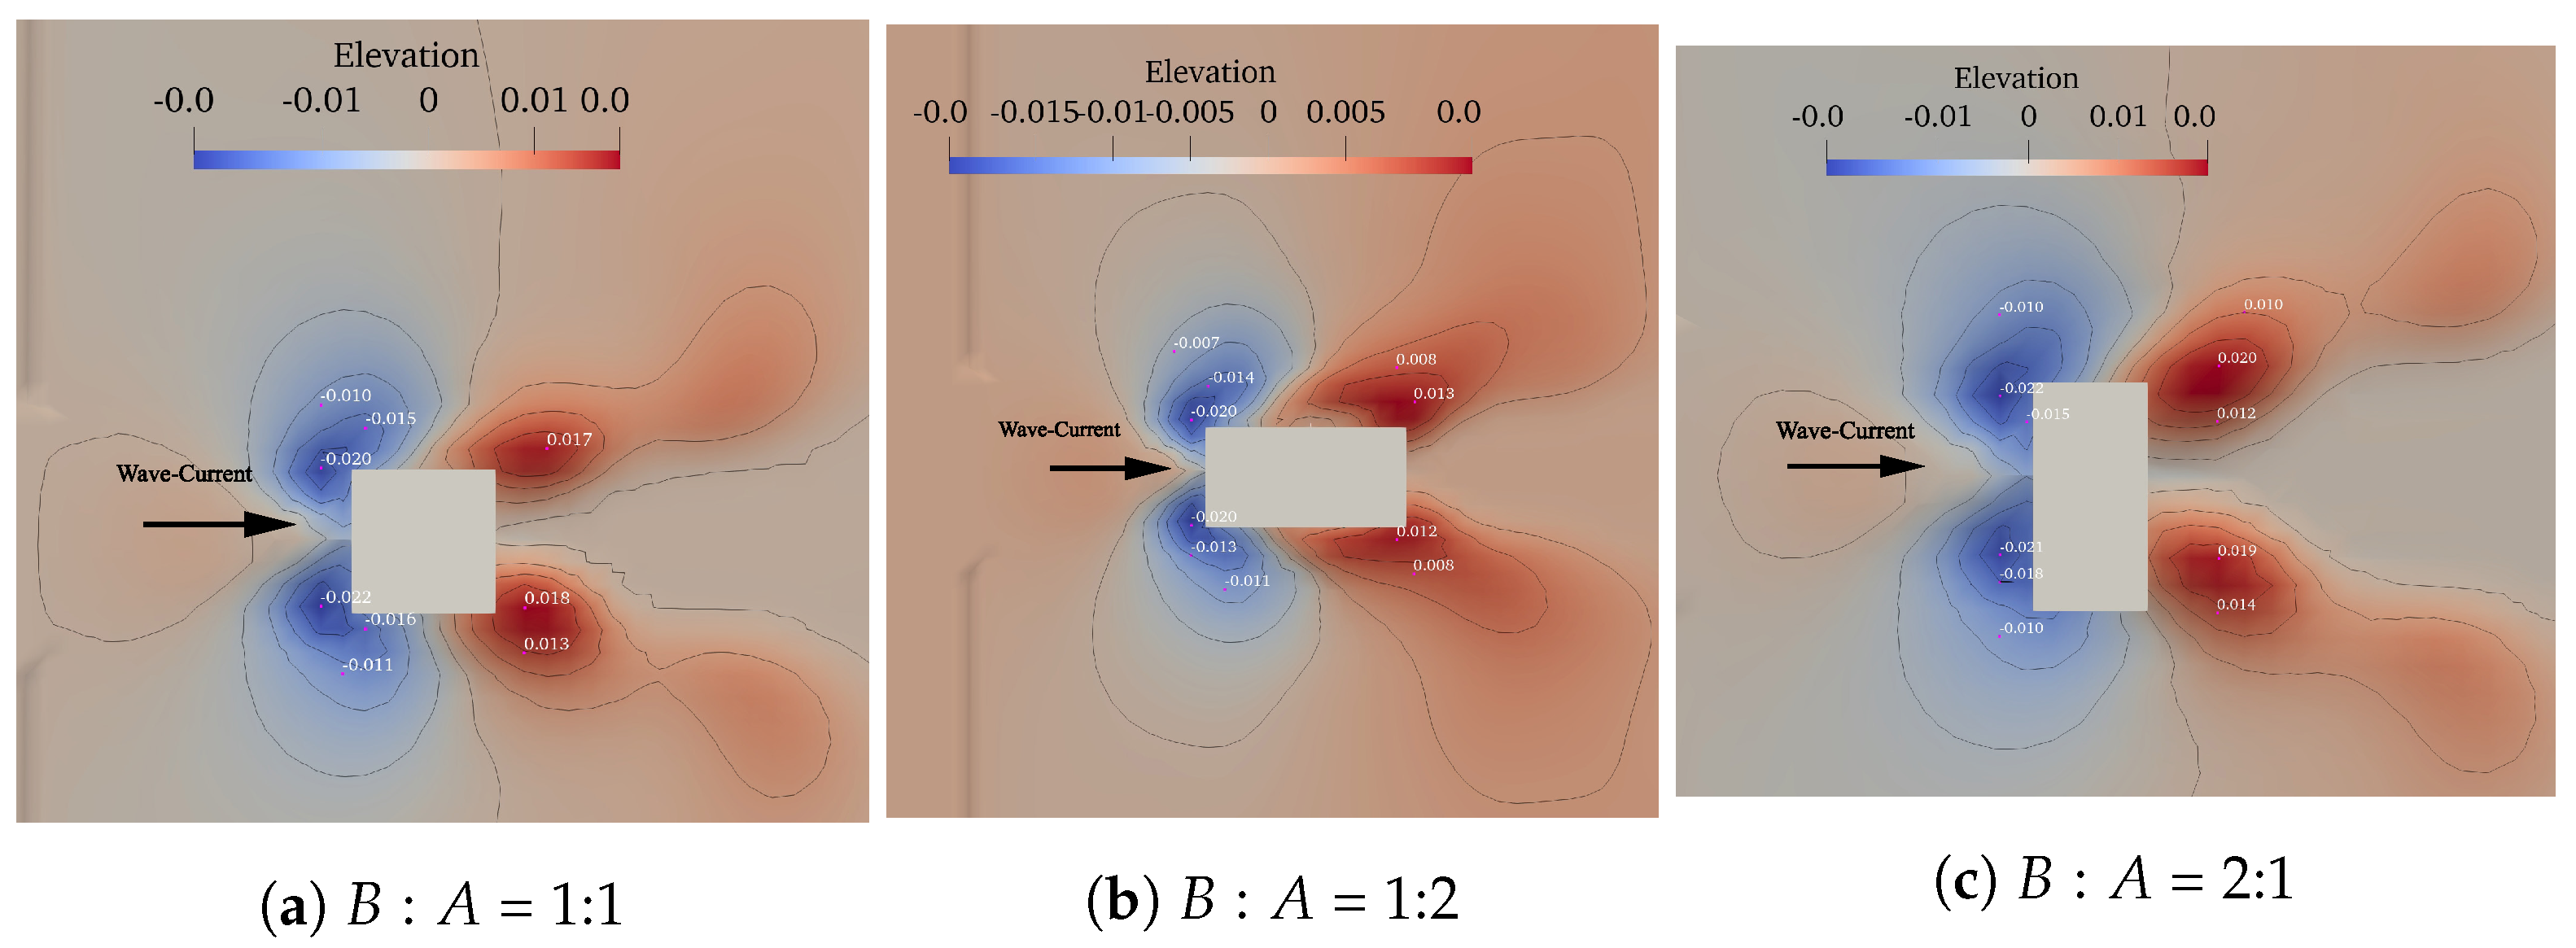
Figure 10 illustrates the topographic bed contours for the waves with moderate current ( U c w = 0.4) and K C number = 10 for the aspect ratios of 1:1, 1:2, and 2:1. The value of θ in the current situation is 0.121, while the value of θ c r is 0.047, indicating the live-bed scour condition. As observed in Figure 10, the maximum scour is generated for the pile with an aspect ratio of 2:1, whereas the scour decreases for the aspect ratio of 1:2 and 1:2. The scour becomes minimal for the aspect ratio of 1:2. The deepest visible contour (blue color denotes highest scour) for aspect ratio 2:1 is −0.022 m and reduces as follows: −0.021 m for aspect ratio 1:1, and −0.020 m for aspect ratio = 1:2. The largest visible contour (red color indicates maximal deposition) for aspect ratio of 2:1 is 0.020 m, drops to 0.018 m for aspect ratio 1:1 and to 0.013 m for aspect ratio 1:2. This suggests that deposition also decreases with decreasing aspect ratios, similar to the trend observed for erosion.
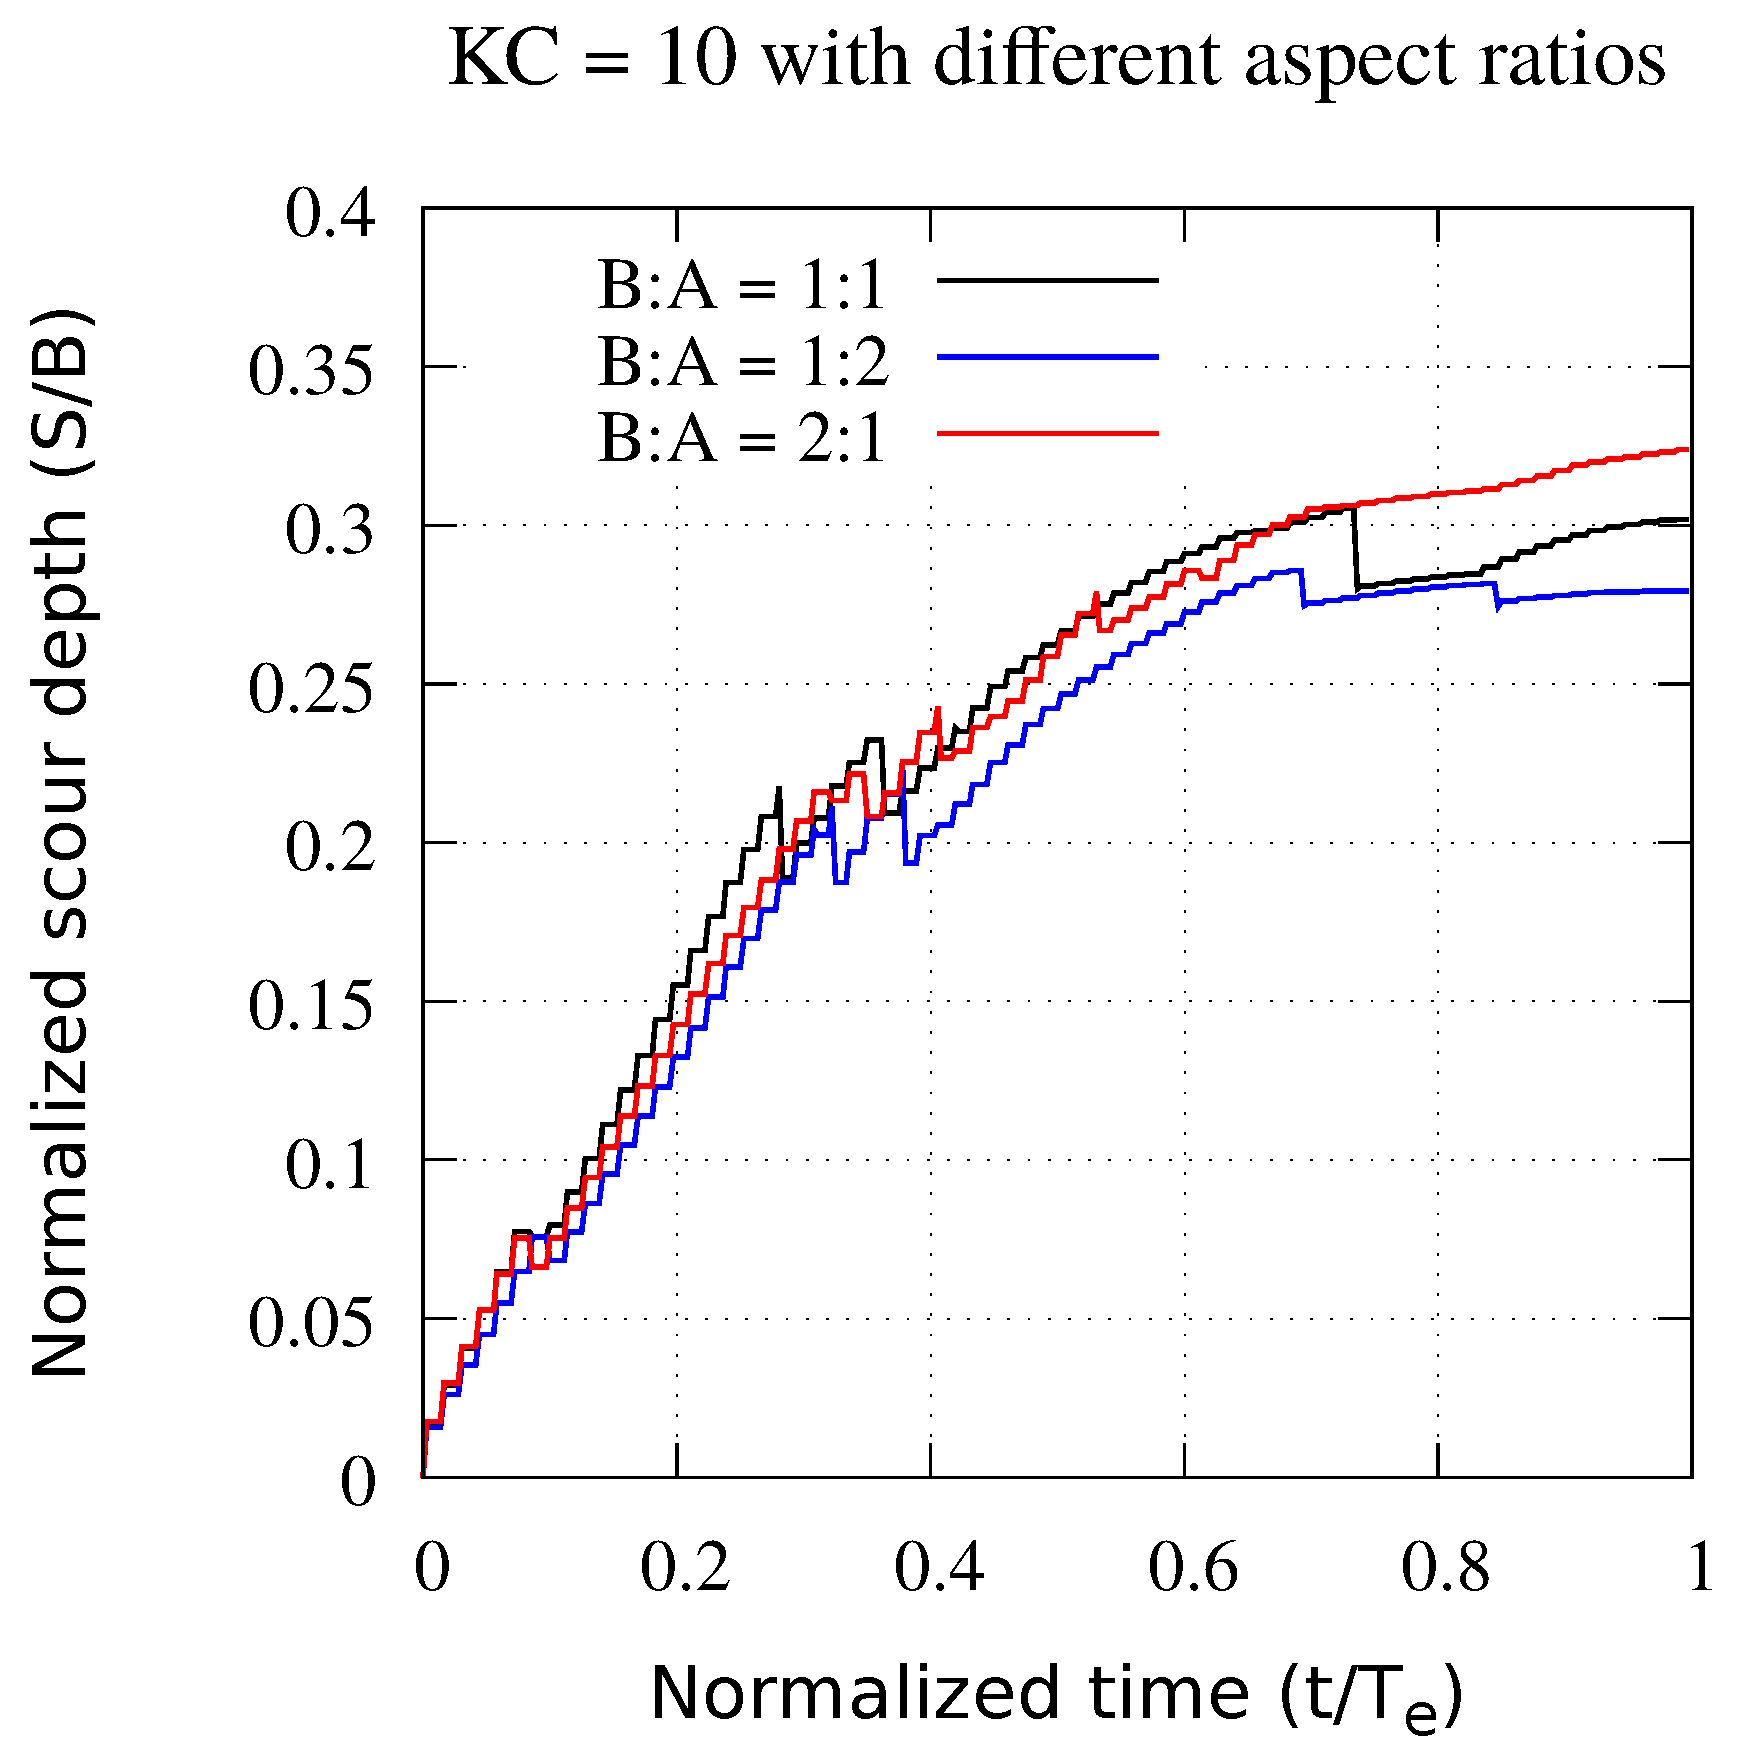
Figure 11 depicts S / B values against the normalized time ( t / T e ) for U c w = 0.4. All the graphs indicate that the equilibrium scour depth was reached. It can also be seen that the maximum normalized scour depth is achieved when the aspect ratio is 2:1, and the value is 0.323. As the aspect ratio changes, the scour depth changes rapidly. For the aspect ratio of 1:1 and 1:2, the normalized scour depth values are 0.301 and 0.279, respectively.
Figure 12, Figure 13 and Figure 14 illustrate the vorticity contours for rectangular piles with various aspect ratios in a 3D numerical wave tank (NWT) for K C numbers 3.9, 5.75, and 10, respectively. The illustration depicts negative vorticity using a blue color and positive vorticity using a red color. By examining the vorticity contours of varying ratios, it becomes apparent that the pile produces alternating vortices downstream. The positive and negative vortices created downstream of the cylinder have identical dimensions and intensities (see Figure 12, Figure 13 and Figure 14). The near wake displays the creation of a pair of vortices on the top and bottom sides of the cylinder for K C = 3.9 with an aspect ratio of 1:2. These pairs of positive and negative vortices are created underneath the larger vortices and are attached to the larger vortices in order to separate. Detachment of positive and negative vortices can be found for K C = 3.9, with an aspect ratio of 2:1. With the increase in the K C numbers, the intensity and the stretch of vortices increase, as shown in Figure 12, Figure 13 and Figure 14.
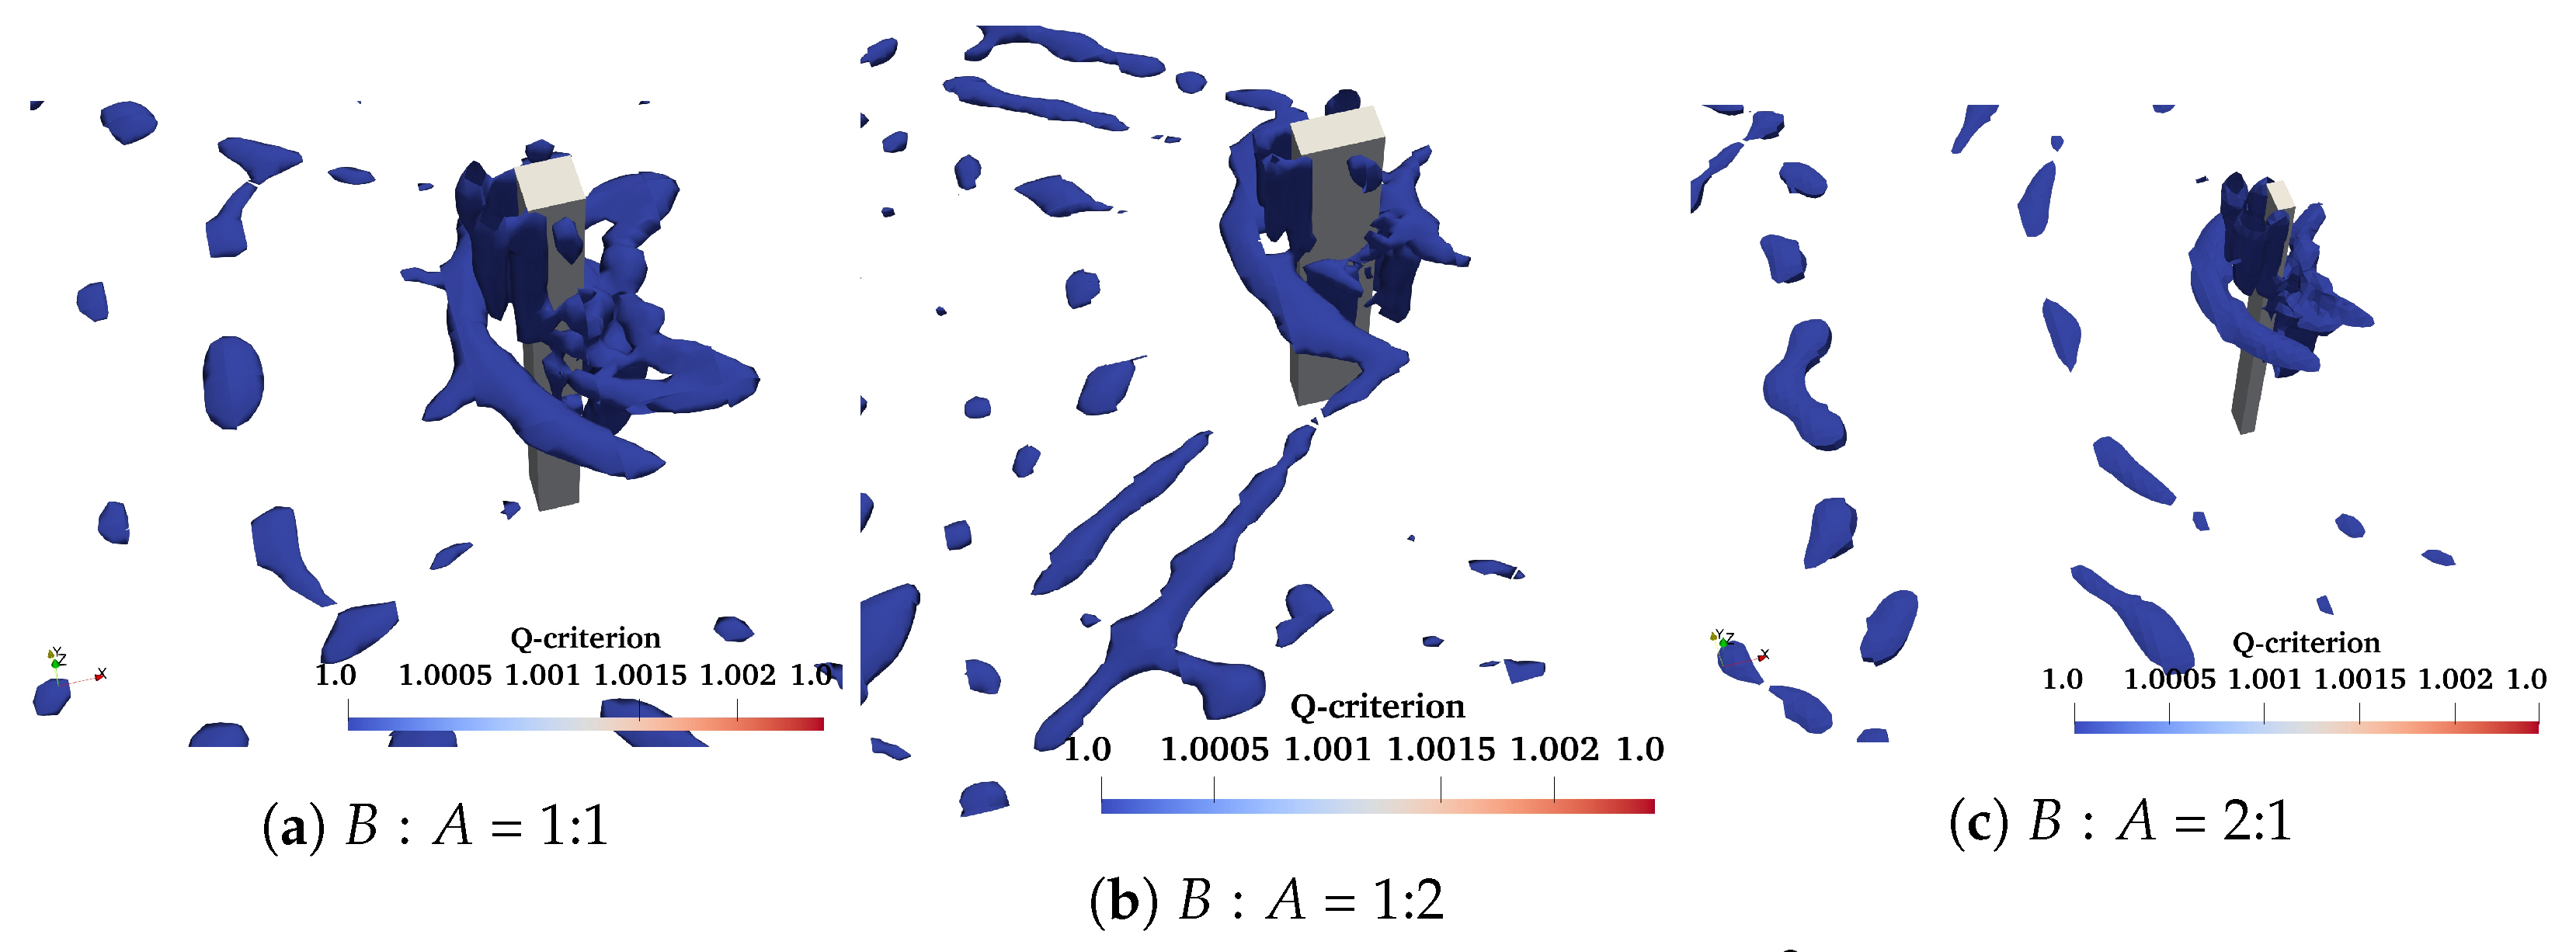
In order to explore the flow fields near the piles, the hydrodynamic model was solved for rectangular piles for the different aspect ratios in the sediment bed. Figure 15, Figure 16 and Figure 17 depict the horseshoe vortex and lee-wake vortex in the front and downstream side of the cylinders using iso-surfaces approaches for the Q-criterion concept [65]. The Q-criterion concept explains that vortices are “connected fluid regions with a positive second invariant of u”. We calculate the Q-isosurfaces for Q = 1 1 / s 2 in the fully developed flow. Downstream of the piles, reverse-vortex flows and quasi-periodic vortices are found to originate from the separated flows that occur at the front and side corners of the square and rectangular piles. For K C = 3.9 (Figure 15), it is also observed that the horseshoe vortex is formed for the aspect ratio (B: A) of 2:1, whereas the horseshoe vortex is not formed for the aspect ratio of 1:2, which indicates the lowest scour depth for smaller aspect ratios. Similar to the observations noted for KC = 3.9 in Figure 15, the strength of the horseshoe vortex, for both K C numbers of 5.75 (Figure 16) and 10 (Figure 17), is largest for the aspect ratio of 2:1, resulting in the largest scour depth in comparison with the aspect ratios of 1:1 and 1:2.
Figure 18 depicts the change in the value of S / B with K C values 3, 5.75, and 10 for all the cases considered in the present study. It shows a rapid rise of S / B value upon increasing the K C values. At K C = 10, a pronounced rise in S / B is reported for waves coupled with mild currents ( U c w = 0.4), but a relatively smaller increase in S / B is recorded for K C = 3.9 and 5.75 for rectangular piles with different aspect ratios. Similar to the findings of Sumer and Fredsøe [17] for the waves-only case, it is probable that this is due to the dominant horseshoe vortex system generated on higher K C number. It can also be seen from Figure 18 that for the same K C number, the value of S / B for a rectangular pile scour is much higher than compared to the circular pier scour [35]. S / B values have increased because of the creation of a robust horseshoe vortex and lee-wake vortex (as depicted in Figure 17) resulting from the development of a significant adverse pressure gradient. It can also be be seen that increasing K C values results in a drastic increase of the value of S / B for all the aspect ratios for the rectangular pile.
Several researchers [5,66,67] conducted experiments to study the effect of Froude number F r on scour depth under the action of steady currents. F r is another non-dimensional parameter that significantly affects the development of HSV and lee-wake vortices. In steady currents, the Froude number represents the flow gradient responsible for generating HSV that causes sediment particles to start moving around the pier. Furthermore, Ettema et al. [68] reported that F r also represents the scale of wake vortices, which is an essential factor in scour development. In addition, several techniques for scour depth prediction around piles as a function of F r were proposed under steady currents [5]. Similarly, in combined wave–current flows, the average-velocity-based pile Froude number ( F r a ) is a crucial dimensionless parameter that affects scour depth significantly [69]. Qi and Gao [69] observed that increased F r a leads to increased scour depth up to certain limits after which it becomes almost constant. Very few studies were conducted to explore the effect of F r a on scour depth in a combined wave–current environment effects. Qi and Gao [69] predicted the normalized scour depth based on F r a in combined wave–current conditions. Scouring in combined wave–current condition is likely caused by the flow structures, such as the horse-shoe vortex and the wake vortex, which is related to F r a . Under conditions with both waves and current, the normalized scour depth should have a strong dependence on F r [17,69,70]. The formula for calculating the average-velocity-based pile Froude number ( F r a ) reads:
F r a = U a g D ,
where U a is the average velocity of water particles throughout a quarter oscillation cycle, g represents the gravitational acceleration, and D denotes the pile diameter. Here, following Qi and Gao [69], U a is given by:
U a = 1 T / 4 0 T / 4 ( U c + U m s i n ( 2 π t / T ) ) d t = U c + 2 π U m ,
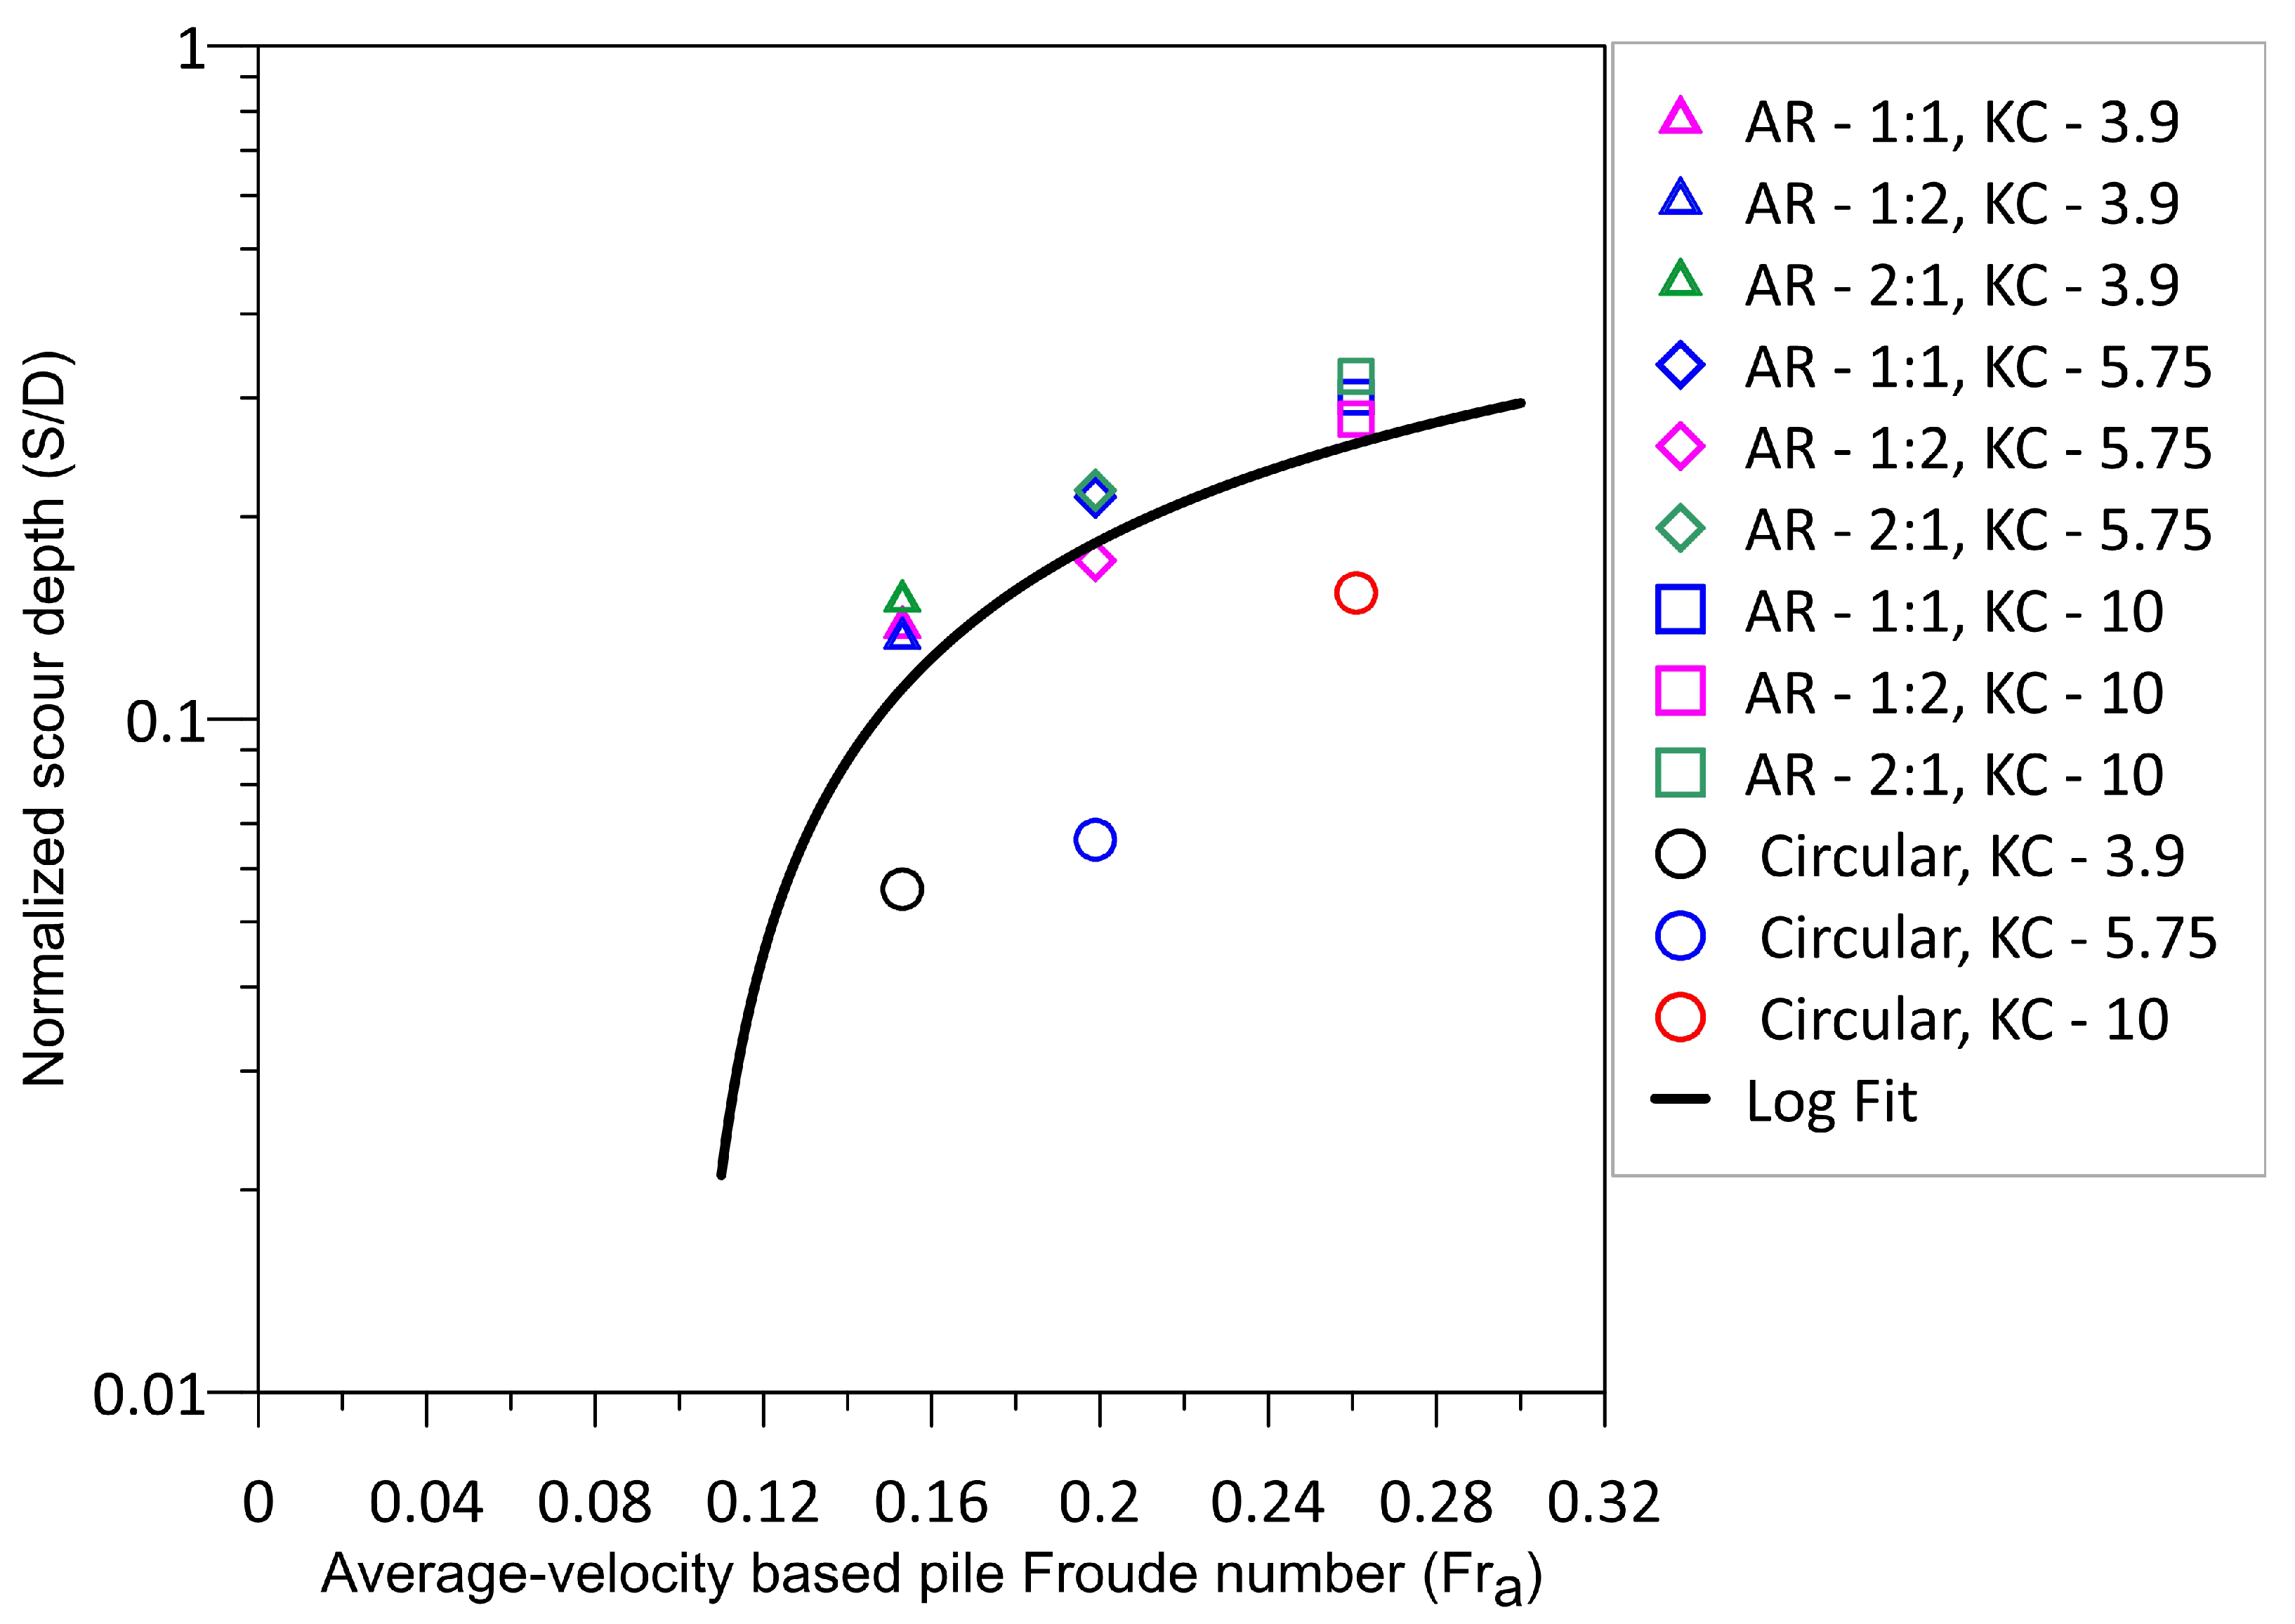
Figure 19 presents the normalized scour depth ( S / D ) plotted against the average-velocity-based pile Froude number ( F r a ) for K C numbers ranging from 3.9 to 10 and different aspect ratios ( B : A ). The figure displays points of different shapes for different aspect ratios for rectangular piles along with the results (circular piles) of Gautam et al. [35]. It is seen that the normalized scour depth ( S / D ) increases with an increase in the Froude number ( F r a ). The normalized scour depth data against F r a may be expressed using the following curve-fitting formula:
S / D = 0.3313 × l n ( F r a ) + 0.83774

5. Conclusions

A fully three-dimensional open source CFD code, REEF3D, is utilized to simulate the phenomenon of scour in combined wave–current flows around rectangular piles with varying K C numbers and different aspect ratios. In this study, a three-phase model is utilized, which incorporates the level-set method to effectively simulate the interaction between waves and currents with the free surface and sediment layer. The model is capable of predicting scour phenomena in such scenarios. The model employs the k– ω turbulence model to solve the Reynolds-averaged Navier–Stokes (RANS) equations and couples the Exner equation to compute changes in bed elevation. To accurately simulate erosion and deposition in sloping sediment beds, the morphological model uses a modified critical bed shear stress formula in combination with the sand-slide algorithm. The study utilized a truncated numerical wave tank with the Dirichlet boundary condition and active wave absorption (AWA) method to conduct numerical simulations. Initially, the model’s accuracy was confirmed by comparing its predictions with experimental results of pile scour under combined wave–current action, showing good agreement in terms of normalized scour depths. Subsequently, the validated numerical model was employed to investigate the influence of the aspect ratio of a rectangular pile and the Keulegan–Carpenter ( K C ) number in a combined wave–current environment. The salient findings of this study are summarized as follows. The normalized scour depth is maximum for the aspect ratio of 2:1 and minimum for the aspect ratio of 1:2 for a fixed K C number and wave–current parameter U c w . A larger K C number for a fixed aspect ratio and wave–current parameter U c w leads to a larger normalized scour depth. These findings were verified through the use of the Q-criterion. Analysis showed that, regardless of the K C number, the strength of the horseshoe vortex was greater for larger aspect ratios, indicating a positive correlation between the aspect ratio and scour depth. It was also found out that there is a positive correlation between K C number and the strength of the horseshoe vortex for a fixed aspect ratio, indicating that larger K C numbers result in greater scour depths. Furthermore, for a fixed K C number, the normalized scour depth ( S / D ) for a rectangular pile scour is much higher than S / D for a circular pile scour. The normalized scour depth ( S / D ) was found to increase with an increase in the Froude number ( F r a ). Finally, a new formula to predict the normalized scour depth based on F r a is proposed using the curve-fitting.

Author Contributions

Methodology: All authors; conceptualization and visualization: D.D. and M.S.A.; writing of original draft and software runs: M.S.A. and D.D.; reviewing and editing: M.S.A. and S.A. All authors have read and agreed to the published version of the manuscript.

Funding

This research was primarily conducted as part of a university strategic initiative known as the Core Research Grant Project proposal titled “Computational Fluid Dynamics modelling of hydrodynamics and scour around coastal structures”, funded by the Science and Engineering Research Board (SERB), Department of Science and Technology, India. Grant no: CRG/2022/002353.

Institutional Review Board Statement

Not applicable.

Informed Consent Statement

Not applicable.

Data Availability Statement

Data will be made available on request.

Acknowledgments

This research made use of the IIT Kharagpur Supercomputing facility, which was established under the National Supercomputing Mission (NSM) of the Indian government, with funding from the Centre for Development of Advanced Computing (CDAC) in Pune.

Conflicts of Interest

The authors declare no conflict of interest.

References

  1. Sumer, B.M. The Mechanics of Scour in the Marine Environment; World Scientific: Singapore, 2002. [Google Scholar]
  2. Whitehouse, R. Scour at Marine Structures: A Manual for Practical Applications; Thomas Telford: London, UK, 1998. [Google Scholar]
  3. Chiew, Y.M.; Melville, B.W. Local scour around bridge piers. J. Hydraul. Res. 1987, 25, 15–26. [Google Scholar] [CrossRef]
  4. Richardson, J.E.; Panchang, V.G. Three-dimensional simulation of scour-inducing flow at bridge piers. J. Hydraul. Eng. 1998, 124, 530–540. [Google Scholar] [CrossRef]
  5. Olsen, N.R.; Kjellesvig, H.M. Three-dimensional numerical flow modeling for estimation of maximum local scour depth. J. Hydraul. Res. 1998, 36, 579–590. [Google Scholar] [CrossRef]
  6. Liu, X.; García, M.H. Three-dimensional numerical model with free water surface and mesh deformation for local sediment scour. J. Waterw. Port Coast. Ocean. Eng. 2008, 134, 203–217. [Google Scholar] [CrossRef]
  7. Ahmad, N.; Afzal, S.; Bihs, H.; Arntsen, ØA. Three-dimensional numerical modeling of local scour around a non-slender cylinder under varying wave conditions. In Proceedings of the 36th IAHR World Congress, The Hague, The Netherlands, 28 June–3 July 2015. [Google Scholar]
  8. Saud Afzal, M.; Bihs, H.; Kamath, A.; Arntsen, ØA. Three-dimensional numerical modeling of pier scour under current and waves using level-set method. J. Offshore Mech. Arct. Eng. 2015, 137, 032001. [Google Scholar] [CrossRef]
  9. Kim, H.S.; Nabi, M.; Kimura, I.; Shimizu, Y. Numerical investigation of local scour at two adjacent cylinders. Adv. Water Resour. 2014, 70, 131–147. [Google Scholar] [CrossRef]
  10. Soulsby, R. Dynamics of marine sands: A manual for practical applications. Oceanogr. Lit. Rev. 1997, 9, 947. [Google Scholar]
  11. Van Rijn, L.C. Principles of Sediment Transport in Rivers, Estuaries and Coastal Seas; Aqua Publications: Amsterdam, The Netherlands, 1993. [Google Scholar]
  12. Zhang, Y.; Jeng, D.S.; Gao, F.; Zhang, J.S. An analytical solution for response of a porous seabed to combined wave and current loading. Ocean Eng. 2013, 57, 240–247. [Google Scholar] [CrossRef]
  13. Alhaddad, S.; Labeur, R.J.; Uijttewaal, W. Breaching flow slides and the associated turbidity current. J. Mar. Sci. Eng. 2020, 8, 67. [Google Scholar] [CrossRef]
  14. Alhaddad, S.; Labeur, R.J.; Uijttewaal, W. Large-scale Experiments on Breaching Flow Slides and the Associated Turbidity Current. J. Geophys. Res. Earth Surf. 2020, 125, e2020JF005582. [Google Scholar] [CrossRef]
  15. Alhaddad, S.; de Wit, L.; Labeur, R.J.; Uijttewaal, W. Modeling of Breaching-Generated Turbidity Currents Using Large Eddy Simulation. J. Mar. Sci. Eng. 2020, 8, 728. [Google Scholar] [CrossRef]
  16. Alhaddad, S.; Weij, D.; van Rhee, C.; Keetels, G. Stabilizing and Destabilizing Breaching Flow Slides. J. Mar. Sci. Eng. 2023, 11, 560. [Google Scholar] [CrossRef]
  17. Sumer, B.M.; Fredsøe, J. Scour around pile in combined waves and current. J. Hydraul. Eng. 2001, 127, 403–411. [Google Scholar] [CrossRef]
  18. Umeyama, M. Reynolds stresses and velocity distributions in a wave-current coexisting environment. J. Waterw. Port Coast. Ocean Eng. 2005, 131, 203–212. [Google Scholar] [CrossRef]
  19. Umeyama, M. Changes in turbulent flow structure under combined wave-current motions. J. Waterw. Port Coast. Ocean Eng. 2009, 135, 213–227. [Google Scholar] [CrossRef]
  20. Umeyama, M. Coupled PIV and PTV measurements of particle velocities and trajectories for surface waves following a steady current. J. Waterw. Port, Coast. Ocean Eng. 2011, 137, 85–94. [Google Scholar] [CrossRef]
  21. Sumer, B.; Christiansen, N.; Fredsøe, J. Influence of cross section on wave scour around piles. J. Waterw. Port Coast. Ocean Eng. 1993, 119, 477–495. [Google Scholar] [CrossRef]
  22. Diab, R.; Link, O.; Zanke, U. Geometry of developing and equilibrium scour holes at bridge piers in gravel. Can. J. Civ. Eng. 2010, 37, 544–552. [Google Scholar] [CrossRef]
  23. Yao, W.; An, H.; Draper, S.; Cheng, L.; Harris, J.M. Experimental investigation of local scour around submerged piles in steady current. Coast. Eng. 2018, 142, 27–41. [Google Scholar] [CrossRef]
  24. Omara, H.; Ookawara, S.; Nassar, K.A.; Masria, A.; Tawfik, A. Assessing local scour at rectangular bridge piers. Ocean Eng. 2022, 266, 112912. [Google Scholar] [CrossRef]
  25. Ismael, A.; Gunal, M.; Hussein, H. Effect of bridge pier position on scour reduction according to flow direction. Arab. J. Sci. Eng. 2015, 40, 1579–1590. [Google Scholar] [CrossRef]
  26. Al-Shukur, A.H.K.; Obeid, Z.H. Experimental study of bridge pier shape to minimize local scour. Int. J. Civ. Eng. Technol. 2016, 7, 162–171. [Google Scholar]
  27. Mir, B.H.; Lone, M.A.; Bhat, J.A.; Rather, N.A. Effect of gradation of bed material on local scour depth. Geotech. Geol. Eng. 2018, 36, 2505–2516. [Google Scholar] [CrossRef]
  28. Gazi, A.H.; Purkayastha, S.; Afzal, M.S. The Equilibrium Scour Depth around a Pier under the Action of Collinear Waves and Current. J. Mar. Sci. Eng. 2020, 8, 36. [Google Scholar] [CrossRef]
  29. Abbasnia, A.H.; Ghiassi, R. Improvements on bed-shear stress formulation for pier scour computation. Int. J. Numer. Methods Fluids 2011, 67, 383–402. [Google Scholar] [CrossRef]
  30. Ghiassi, R.; Abbasnia, A.H. Investigation of vorticity effects on local scouring. Arab. J. Sci. Eng. 2013, 38, 537–548. [Google Scholar] [CrossRef]
  31. Bihs, H.; Kamath, A.; Chella, M.A.; Aggarwal, A.; Arntsen, Ø.A. A new level set numerical wave tank with improved density interpolation for complex wave hydrodynamics. Comput. Fluids 2016, 140, 191–208. [Google Scholar] [CrossRef]
  32. Dutta, D.; Bihs, H.; Afzal, M.S. Computational Fluid Dynamics modelling of hydrodynamic characteristics of oscillatory flow past a square cylinder using the level set method. Ocean Eng. 2022, 253, 111211. [Google Scholar] [CrossRef]
  33. Qi, W.G.; Li, Y.X.; Xu, K.; Gao, F.P. Physical modelling of local scour at twin piles under combined waves and current. Coast. Eng. 2019, 143, 63–75. [Google Scholar] [CrossRef]
  34. Qi, W.G.; Gao, F.P. Physical modeling of local scour development around a large-diameter monopile in combined waves and current. Coast. Eng. 2014, 83, 72–81. [Google Scholar] [CrossRef]
  35. Gautam, S.; Dutta, D.; Bihs, H.; Afzal, M.S. Three-dimensional Computational Fluid Dynamics modelling of scour around a single pile due to combined action of the waves and current using Level-Set method. Coast. Eng. 2021, 170, 104002. [Google Scholar] [CrossRef]
  36. Afzal, M.S.; Bihs, H.; Kumar, L. Computational fluid dynamics modeling of abutment scour under steady current using the level set method. Int. J. Sediment Res. 2020, 35, 355–364. [Google Scholar] [CrossRef]
  37. Jiang, G.S.; Shu, C.W. Efficient implementation of weighted ENO schemes. J. Comput. Phys. 1996, 126, 202–228. [Google Scholar] [CrossRef]
  38. Jiang, G.S.; Peng, D. Weighted ENO schemes for Hamilton–Jacobi equations. SIAM J. Sci. Comput. 2000, 21, 2126–2143. [Google Scholar] [CrossRef]
  39. Wilcox, D. Turbulence Modelling for CFD; DCW Industries Inc.: La Canada, CA, USA, 1994. [Google Scholar]
  40. Naot, D.; Rodi, W. Calculation of secondary currents in channel flow. J. Hydraul. Div. 1982, 108, 948–968. [Google Scholar] [CrossRef]
  41. Larsen, B.E.; Fuhrman, D.R. On the over-production of turbulence beneath surface waves in Reynolds-averaged Navier–Stokes models. J. Fluid Mech. 2018, 853, 419–460. [Google Scholar] [CrossRef]
  42. Durbin, P. Limiters and wall treatments in applied turbulence modeling. Fluid Dyn. Res. 2009, 41, 012203. [Google Scholar] [CrossRef]
  43. Jiang, G.S. Efficient Implementation of Weighted ENO Schemes; Department of Mathematics, University of California: Los Angeles, CA, USA, 1995. [Google Scholar]
  44. Harten, A. High resolution schemes for hyperbolic conservation laws. J. Comput. Phys. 1983, 49, 357–393. [Google Scholar] [CrossRef]
  45. Griebel, M.; Dornseifer, T.; Neunhoeffer, T. Numerical Simulation in Fluid Dynamics: A Practical Introduction; Siam: Philadelphia, PA, USA, 1997; Volume 3. [Google Scholar]
  46. Chorin, A.J. Numerical solution of the Navier-Stokes equations. Math. Comput. 1968, 22, 745–762. [Google Scholar] [CrossRef]
  47. Osher, S.; Sethian, J.A. Fronts propagating with curvature-dependent speed: Algorithms based on Hamilton-Jacobi formulations. J. Comput. Phys. 1988, 79, 12–49. [Google Scholar] [CrossRef]
  48. Shu, C.W.; Osher, S. Efficient implementation of essentially non-oscillatory shock-capturing schemes. J. Comput. Phys. 1988, 77, 439–471. [Google Scholar] [CrossRef]
  49. Peng, D.; Merriman, B.; Osher, S.; Zhao, H.; Kang, M. A PDE-based fast local level set method. J. Comput. Phys. 1999, 155, 410–438. [Google Scholar] [CrossRef]
  50. Kraft, S.; Wang, Y.; Oberlack, M. Large eddy simulation of sediment deformation in a turbulent flow by means of level-set method. J. Hydraul. Eng. 2011, 137, 1394–1405. [Google Scholar] [CrossRef]
  51. Van Rijn, L.C. Sediment transport, part I: Bed load transport. J. Hydraul. Eng. 1984, 110, 1431–1456. [Google Scholar] [CrossRef]
  52. Engelund, F.; Fredsøe, J. A sediment transport model for straight alluvial channels. Hydrol. Res. 1976, 7, 293–306. [Google Scholar] [CrossRef]
  53. Shields, A. Anwendung der Aehnlichkeitsmechanik und der Turbulenzforschung auf die Geschiebebewegung. Ph.D. Thesis, Technical University, Berlin, Germany, 1936. [Google Scholar]
  54. Hunt, J. The turbulent transport of suspended sediment in open channels. Proc. R. Soc. London. Ser. A Math. Phys. Sci. 1954, 224, 322–335. [Google Scholar]
  55. Rijn, L.C.v. Sediment transport, part II: Suspended load transport. J. Hydraul. Eng. 1984, 110, 1613–1641. [Google Scholar] [CrossRef]
  56. Rouse, H. Modern conceptions of the mechanics of fluid turbulence. Trans. ASCE 1937, 102, 463–505. [Google Scholar] [CrossRef]
  57. Lane, E.W. Design of stable channels. Trans. Am. Soc. Civ. Eng. 1955, 120, 1234–1260. [Google Scholar] [CrossRef]
  58. Kovacs, A.; Parker, G. A new vectorial bedload formulation and its application to the time evolution of straight river channels. J. Fluid Mech. 1994, 267, 153–183. [Google Scholar] [CrossRef]
  59. Ikeda, S. Incipient motion of sand particles on side slopes. J. Hydraul. Div. 1982, 108, 95–114. [Google Scholar] [CrossRef]
  60. Dey, S. Experimental study on incipient motion of sediment particles on generalized sloping fluvial beds. Int. J. Sediment Res. 2001, 16, 391–398. [Google Scholar]
  61. Dey, S. Threshold of sediment motion on combined transverse and longitudinal sloping beds. J. Hydraul. Res. 2003, 41, 405–415. [Google Scholar] [CrossRef]
  62. Burkow, M.; Griebel, M. A full three dimensional numerical simulation of the sediment transport and the scouring at a rectangular obstacle. Comput. Fluids 2016, 125, 1–10. [Google Scholar] [CrossRef]
  63. Roulund, A.; Sumer, B.M.; Fredsøe, J.; Michelsen, J. Numerical and experimental investigation of flow and scour around a circular pile. J. Fluid Mech. 2005, 534, 351. [Google Scholar] [CrossRef]
  64. Sumer, B.M.; Christiansen, N.; Fredsøe, J. The horseshoe vortex and vortex shedding around a vertical wall-mounted cylinder exposed to waves. J. Fluid Mech. 1997, 332, 41–70. [Google Scholar] [CrossRef]
  65. Hunt, J.C.; Wray, A.A.; Moin, P. Eddies, Streams, and Convergence Zones in Turbulent Flows. 1988. Available online: https://ntrs.nasa.gov/citations/19890015184 (accessed on 15 March 2023).
  66. Ettema, R.; Melville, B.W.; Barkdoll, B. Scale effect in pier-scour experiments. J. Hydraul. Eng. 1998, 124, 639–642. [Google Scholar] [CrossRef]
  67. Faruque, M. Studying the Effect of Froude Number and Densimetric Froude Number on Local Scours around Circular Bridge Piers. Int. J. Archit. Civ. Constr. Sci. 2018, 11, 1–7. [Google Scholar]
  68. Ettema, R.; Kirkil, G.; Muste, M. Similitude of large-scale turbulence in experiments on local scour at cylinders. J. Hydraul. Eng. 2006, 132, 33–40. [Google Scholar] [CrossRef]
  69. Qi, W.; Gao, F. Equilibrium scour depth at offshore monopile foundation in combined waves and current. Sci. China Technol. Sci. 2014, 57, 1030–1039. [Google Scholar] [CrossRef]
  70. Sumer, B.M.; Petersen, T.U.; Locatelli, L.; Fredsøe, J.; Musumeci, R.E.; Foti, E. Backfilling of a scour hole around a pile in waves and current. J. Waterw. Port Coast. Ocean. Eng. 2013, 139, 9–23. [Google Scholar] [CrossRef]
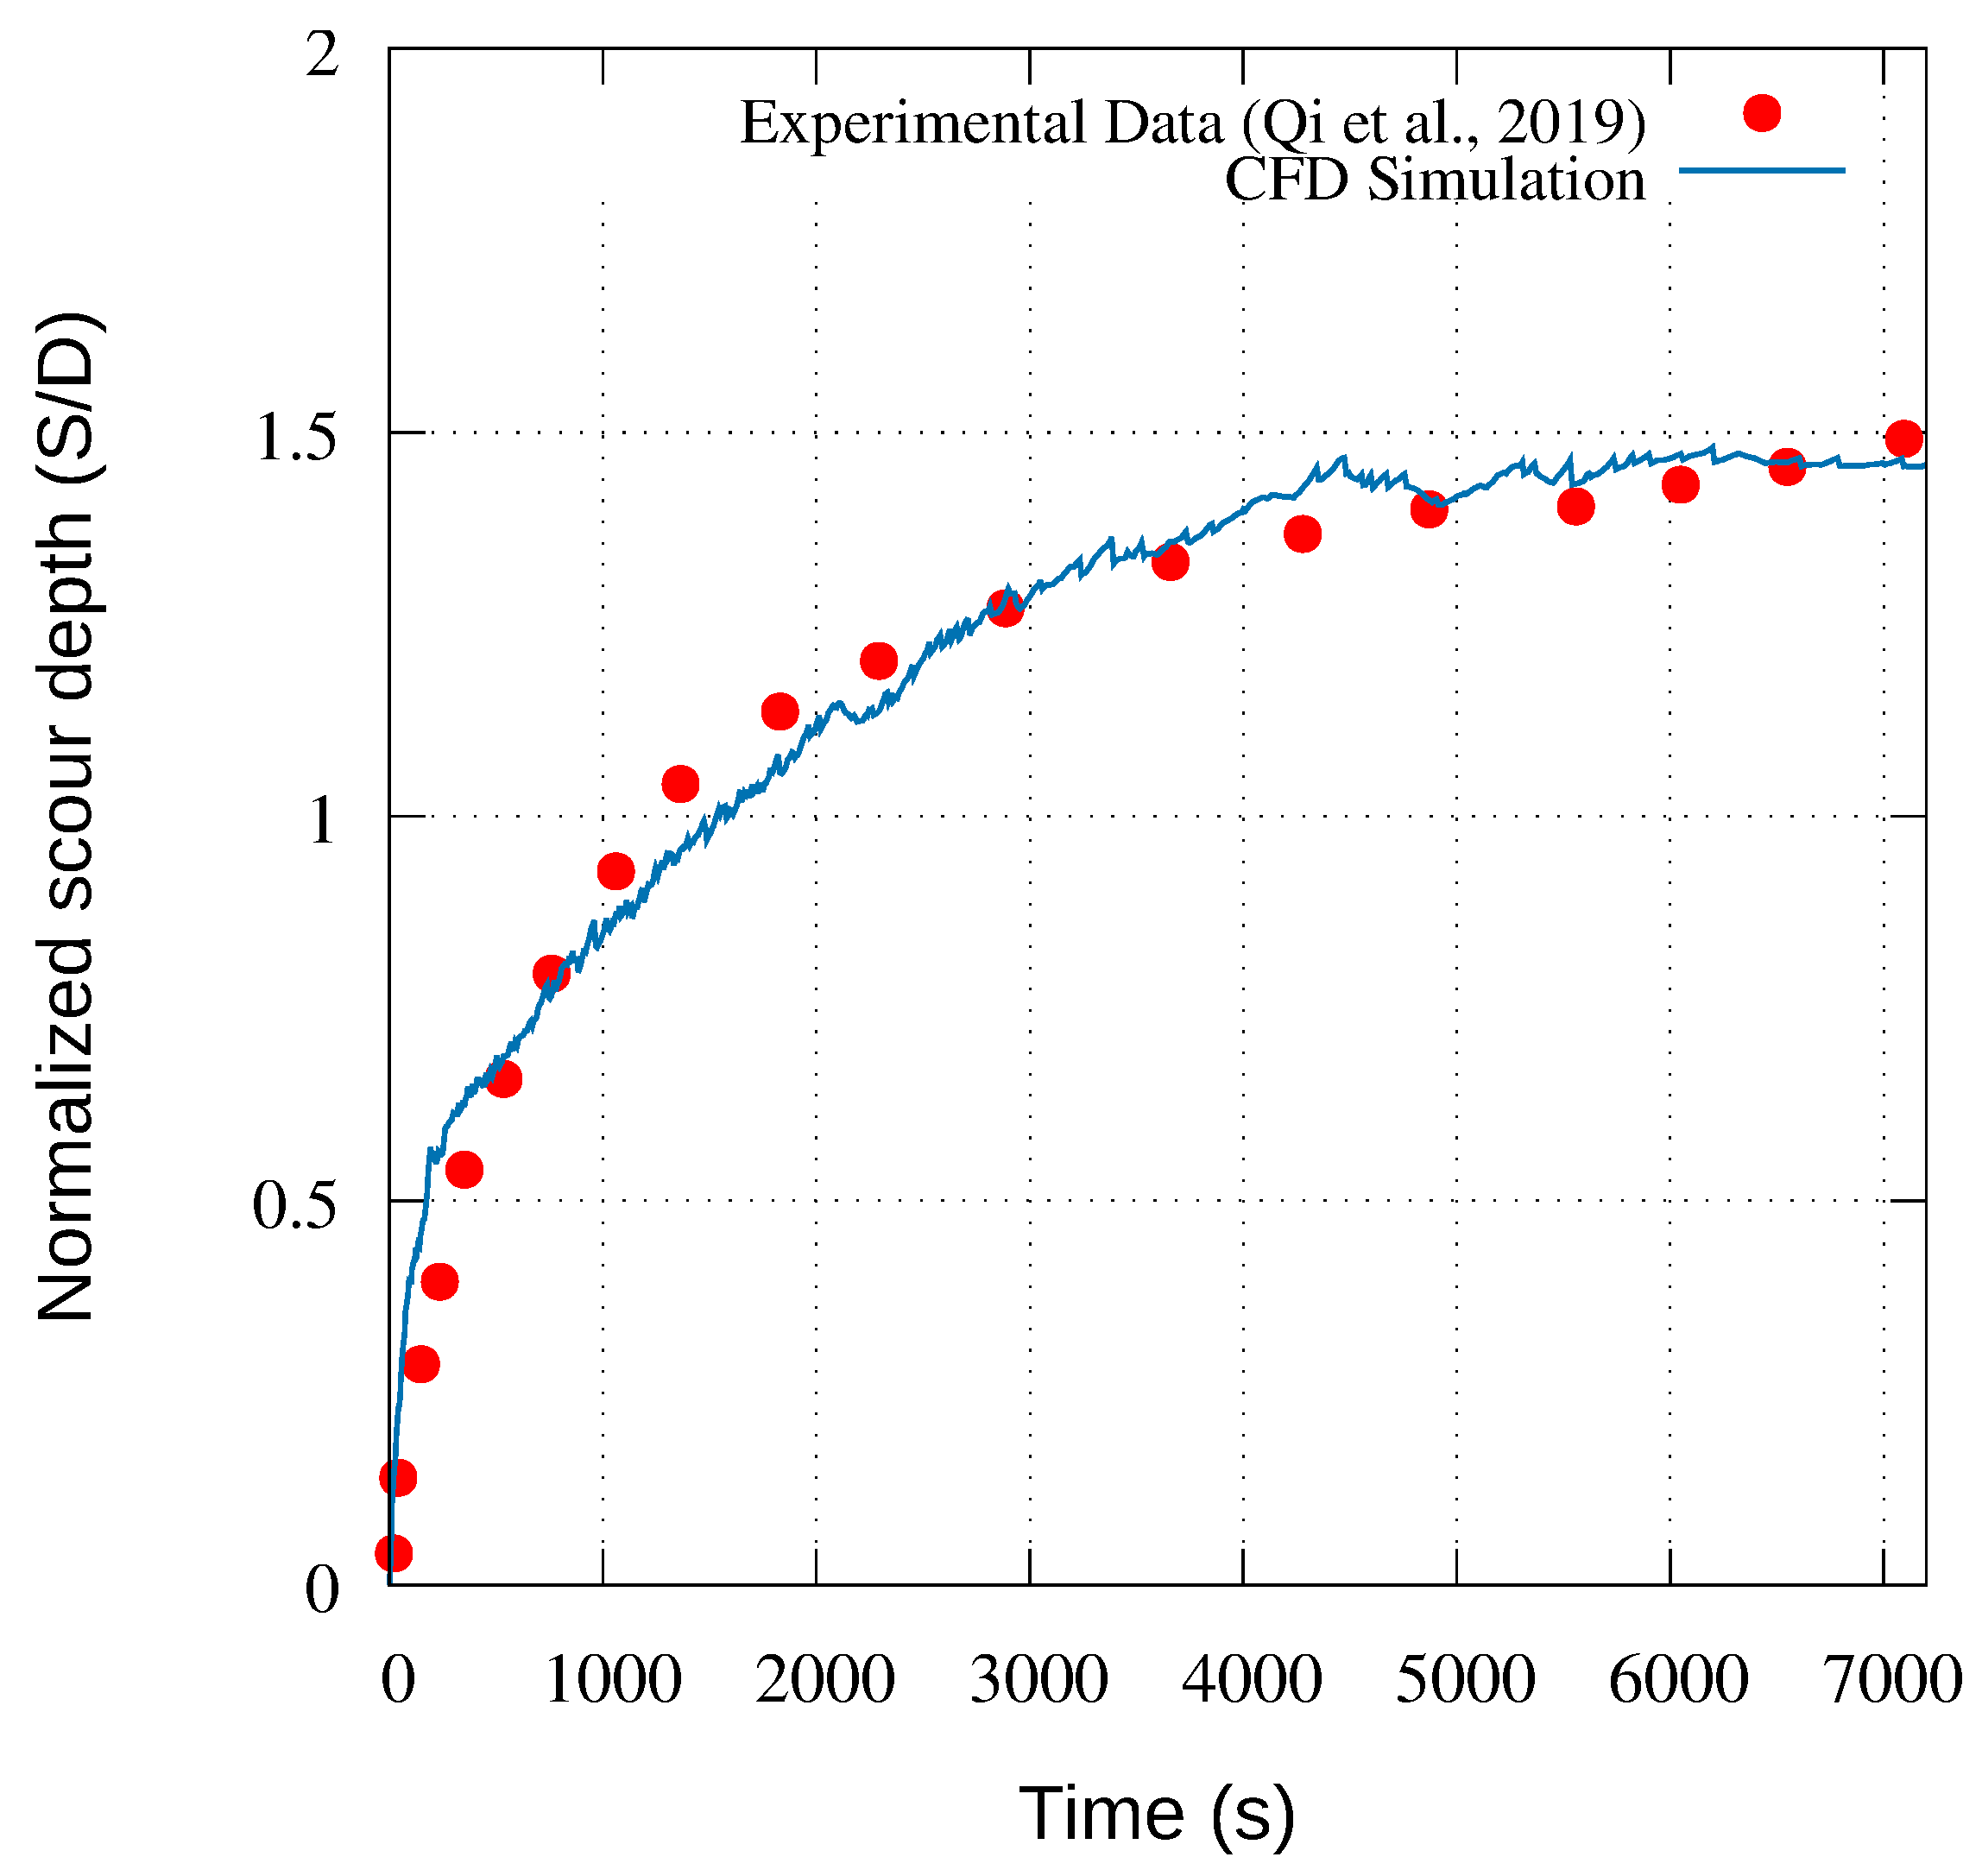
Figure 1. Results of the model validation for scour around a pile group caused by a combined wave–current effect Qi et al. [33].
Water 15 01541 g001
Figure 2. Comparison between the numerical simulations and experimental data obtained by Qi and Gao [34] for the phenomenon of scouring around a pile under the influence of waves and currents.
Water 15 01541 g002
Figure 3. Grid convergence study for the phenomenon of scour around a group of piles in an environment affected by both waves and currents. Red line represents the numerical results, while the discrete points represent the experimental results acquired by Qi et al. [33].
Water 15 01541 g003
Figure 4. The layout of the rectangular piles for CFD simulations with different aspect ratios ( B : A ) of 1:1 (left), 1:2 (middle), 2:1 (right). B is the length of rectangular piles and A is the breadth of the piles.
Water 15 01541 g004
Figure 5. 3D view of the rectangular piles for CFD simulations with different aspect ratios (B:A) of 1:1 (left), 1:2 (middle), and 2:1 (right). B is the length of rectangular piles and A is the width of the piles.
Water 15 01541 g005
Figure 6. Contours of bed topography for combined wave−current parameter U c w of 0.4 and K C = 3.9 for varying aspect ratios of the rectangular pile. The side (B) of the rectangular pile is 0.18 m and the period (T) of the wave is 4.5 s. Duration of the simulation run is 3600 s.
Water 15 01541 g006
Figure 7. Temporal variations of normalized scour depth versus normalized time for K C = 3.9 and combined wave–current parameter U c w = 0.40. The wave period (T) is 4.5 s.
Water 15 01541 g007
Figure 8. Contours at the end of the simulation period for combined wave−current ( U c w = 0.4) case for K C = 5.75 for varying aspect ratios of the rectangular pile. The side (B) of the rectangular pile is 0.14 m and the period (T) of the wave is 4.5 s. Duration of the simulation run is 3600 s.
Water 15 01541 g008
Figure 9. Temporal variations of normalized scour depth versus normalized time for K C = 5.75 for combined wave current parameter ( U c w ) of 0.4. The wave period (T) is 4.5 s.
Water 15 01541 g009
Figure 10. Contours of bed topography for combined wave−current ( U c w = 0.4) case for K C = 10 for varying aspect ratios of the rectangular pile. The side (B) of the rectangular pile is 0.08 m, and the period (T) of the wave is 4.5 s. Duration of the simulation run 3600 s.
Water 15 01541 g010
Figure 11. Temporal variations of normalized scour depth versus normalized time for K C = 10 in a wave and combined wave–current flows. The wave period (T) is 4.5 s.
Water 15 01541 g011
Figure 12. Vorticity contours for K C number = 3.9 and wave−current parameter ( U c w = 0.4) for varying aspect ratios of the rectangular pile.
Water 15 01541 g012
Figure 13. Vorticity contours for K C number = 5.75 for and wave−current parameter ( U c w = 0.4) for varying aspect ratios of the rectangular pile.
Water 15 01541 g013
Figure 14. Vorticity contours for K C number = 10 and wave−current parameter ( U c w = 0.4) for varying aspect ratios of the rectangular pile.
Water 15 01541 g014
Figure 15. Isosurfaces visualizing turbulent structures for Q = 1 s 2 , K C number = 3.9, and wave current parameter ( U c w ) = 0.4 for different aspect ratios of the rectangular pile.
Water 15 01541 g015
Figure 16. Isosurfaces visualizing turbulent structures for Q = 1 s 2 , K C number = 5.75, and wave current parameter ( U c w ) = 0.4 with different aspect ratios of the rectangular pile.
Water 15 01541 g016
Figure 17. Isosurfaces visualizing turbulent structures for Q = 1 s 2 , K C number = 10, and wave current parameter ( U c w ) = 0.4 with different aspect ratios of the rectangular pile.
Water 15 01541 g017
Figure 18. Normalized scour depth plotted against the K C number for different aspect ratios of the rectangular pile.
Water 15 01541 g018
Figure 19. Normalized equilibrium scour depth plotted against the velocity-based Froude number ( F r a ).
Water 15 01541 g019
Table 1. Summary of sediment parameters used for model validation. θ denotes shields paramter, d 50 denotes median grain size, η denotes porosity, D r denotes relative density, and γ denotes submerged unit weight.
Cases θ (-) d 50 (mm) η (-) D r (-) γ (KN/m 3 )
Validation 1 (Figure 1)0.4090.150.350.6210.65
Validation 2 (Figure 2)0.0450.380.4350.3529.03
Validation 3 (Figure 3)0.4090.150.350.6210.65
Table 2. Summary of the validation and analysis conditions employed in this study.
CasesRunTime Period (s) U m (m/s) U c (m/s) U cw KC S/D
ValidationW-C scour (Figure 1)1.80.250.230.485.631.5
W-C scour (Figure 2)1.40.3030.230.431.280.41
W-C scour (Figure 3)1.80.250.230.485.631.08
AnalysisW-C scour (Figure 6a)4.50.1560.1040.43.90.138
W-C scour (Figure 6b)4.50.1560.1040.43.90.132
W-C scour (Figure 6c)4.50.1560.1040.43.90.151
W-C scour (Figure 8)4.50.1790.1190.45.750.214
W-C scour (Figure 8b)4.50.1790.1190.45.750.172
W-C scour (Figure 8c)4.50.1790.1040.45.750.218
W-C scour (Figure 10a)4.50.1780.1180.4100.301
W-C scour (Figure 10b)4.50.1780.1180.4100.279
W-C scour (Figure 10c)4.50.1780.1180.4100.323
Disclaimer/Publisher’s Note: The statements, opinions and data contained in all publications are solely those of the individual author(s) and contributor(s) and not of MDPI and/or the editor(s). MDPI and/or the editor(s) disclaim responsibility for any injury to people or property resulting from any ideas, methods, instructions or products referred to in the content.