Article

Rare-Metal Mineralization in Salt Lakes and the Linkage with Composition of Granites: Evidence from Burabay Rock Mass (Eastern Kazakhstan)

1
Institute of Project Management, Satbayev University, Almaty 50013, Kazakhstan
2
School of Earth Sciences, D. Serikbayev East Kazakhstan Technical University, Ust-Kamenogorsk 70004, Kazakhstan
3
Department of Mining Engineering and Education, Dnipro University of Technology, 49005 Dnipro, Ukraine
4
Mining and Metallurgical Institute named after O.A. Baikonurov, Satbayev University, Almaty 50013, Kazakhstan
*
Author to whom correspondence should be addressed.
Water 2023, 15(7), 1386; https://doi.org/10.3390/w15071386
Submission received: 9 March 2023 / Revised: 28 March 2023 / Accepted: 1 April 2023 / Published: 3 April 2023
(This article belongs to the Special Issue Monitoring, Reclamation and Management of Salt-Affected Lands)

Abstract

:
This paper represents the results of a study of the chemical composition of salt lakes within the Burabay rock mass in eastern Kazakhstan. We sampled water and bottom deposits, geochemically analyzed the composition of the salt lakes, and performed aerial photography of the lakes to geometrize them. We studied the linkage between the rare-metal mineralization of granites of the Burabay rock mass and the salt lakes within the territory. Based on the obtained data, we identified the prospects of the survey area for rare metals. The surveys included 15 water samples and 15 bottom-deposit samples. To identify the source of salt in the lake water and deposits, the chemical composition of Burabay rocks was analyzed and seven samples of coarse-grained and porphyritic granites were selected. It was established that the water and bottom deposits accumulated elevated concentrations of valuable components (i.e., Sr, Rb, and U); this fact may be considered as an argument for conducting special surveys of small lakes in the region. The results obtained can be used for conducting further explorations and mining operations in the survey area in order to revive the rare-metal industry in the region, which will allow the development of new high-tech production and the creation of new jobs in this sphere.

1. Introduction

Currently, the behavior of such rare-earth elements (REEs) as Li, Sr, Rb, Th, W, and U in natural water is the subject of detailed studies [1,2]. The interest in REEs’ abundance in natural water is associated with their potential use as indicators of geochemical processes; this requires an understanding of the migration features and fractionation rules of certain rare-earth elements [3,4,5]. The unambiguous interpretation of REEs’ behavior in natural water is complicated by various processes involving the formation of water complexes, colloid transport, ion exchange, and adsorption, leading to the fractionation of the elements in aqueous solutions in comparison with the source rock [6,7,8,9,10].
Over the last years, the mineral stocks of large salt lakes have become objects of increased interest and intense study as sources of the commercial extraction of potassium salt, magnesium salt, soda, and sodium sulfate [11,12,13,14], as well as lithium compounds, bromine, potassium, boron, and rare elements. Salars in South America and salt lakes in China and Mongolia are the classic examples, since their reserves of valuable components (i.e., lithium, boron, bromine, etc.) amount to hundreds or thousands of tons [15,16].
The attractiveness of lake water’s use as a mineral stock depends upon the following factors: the availability of large renewable field reserves within large hydrogeological systems; environmental cleanliness in the context of extraction and production; the possibility of applying evaporative water concentration with the sequenced separation of valuable components; and the low cost of the products owing to the integrated use of hydro-mineral stocks [17].
Recently, the hydro-mineral resources of both large and smaller salt lakes, which occur widely in Central Asia, have attracted increasing attention [18,19]. This interest results from the gradual depletion of large lake basins on one hand and, on the other, the large number of small salt lakes with an extended spectrum of elements for potential raw-material recovery (i.e., uranium, lithium, and rare elements) [20,21]. Zadereev et al. [22] presented research reviewing the status, trends, and drivers of inland saline lakes in Europe and Central Asia, assessing the effects of direct drivers on ecosystem health and biodiversity and highlighting the need for improved water-management and conservation measures. In [23], the authors present a study on the extraction of lithium from salt-lake brines in China using a membrane process. Li et al. [24] investigated the origin and enrichment mechanisms of lithium in a lithium-rich salt lake in West Kunlun, Xinjiang, China, using hydrochemical and lithium-isotope analyses to uncover the genesis of brine-type lithium deposits and to contribute to a deeper understanding of lithium sources and their enrichment processes. Xu et al. [25] investigated the effects of salinity on the composition of dissolved organic matter in salt lakes at the molecular level. Specifically, their study focused on two salt lakes, Qinghai Lake and Daihai Lake, which have similar geographical and climatic conditions but differ in their salinity levels. The results showed that at higher salinity levels, the dissolved organic matter had a larger average molecular weight, a higher oxidation degree, and lower aromaticity. Additionally, the proportion of vulnerable dissolved organic-matter compounds reduced, while the proportion of refractory compounds increased.
The purpose of [26] was to comprehensively utilize magnesium and lithium resources in salt-lake brine for resource sustainability. The study reviewed the latest advances in magnesium/lithium separation and lithium recovery from salt-lake brines, including extraction, adsorption, membrane, and electrochemical methods, as well as reaction-coupled separation technology. The review also discusses the roles of various electrode materials in lithium recovery using electrochemical methods and the potential of reaction-coupled separation technology for highly efficient magnesium/lithium separation and the simultaneous preparation of high-value magnesium-based functional materials. Borzenko et al. [27] developed a new concept to explain the diverse geochemical types of salt lakes, with a particular focus on those in the Transbaikal region. The study uses hydrogeochemical-field data and thermodynamic calculations to demonstrate that in addition to evaporation, interactions with rocks play a significant role in the formation of salt-lake composition. The study provides evidence that such processes are most common in soda lakes, which have high pH values, carbonate-ion concentrations, and high precipitation of Ca, Mg, and Fe carbonates. Additionally, the study highlights the role of sulphate reduction in the formation of sulphate-type lakes and how the presence of an oxidizing environment and sulphides in rocks can provide additional sources for sulphates. Overall, the study presents a new understanding of how landscape–climatic and geological–geochemical conditions shape the chemical compositions of salt lakes.
The studies described above provide further insights into the potential uses of mineralized waters, the factors that contribute to their mineral content, and their environmental impact. This is why small salt lakes in Kazakhstan are of considerable interest. A significant part of the state’s territory has a dry and almost arid climate [28]. Brackish and salt lakes located in arheic basins are widespread within the land. The salt-clay rocks and brine from the Aral Sea, the brine from the solonchak and drying lakes of the Caspian Depression, and the territory of the Chu River basin and other regions of the Republic of Kazakhstan arouse considerable interest. The Zaisan depression in eastern Kazakhstan is one of these regions. The hydromineral resources of the objects are almost unexplored. Therefore, the purpose of this paper is to study the macro- and microcomponent composition of small salt lakes in eastern Kazakhstan [29,30,31,32].
The territory of Eastern Kazakhstan is part of the Late Paleozoic Altai collision system formed upon the collision of the Siberian and Kazakhstan continents [33]. The geological structure was shaped in the Late Carboniferous–Early Permian; it contains sedimentary formations and intrusions of granitoid composition. The largest intrusion is the Kalba–Narym batholiths, stretching from North-West to South-East for more than 300 km (Figure 1).
In Figure 1, the inset shows the position of batholith on a terranes map of the Late Paleozoic Altai collision system. The granitoids are from the early Permian age; they cut through Middle–Late Palaeozoic sedimentary and metamorphic rocks [18]. The formation of the Kalba batholith took place in the Early Permian (in the interval of 300–276 Ma), as follows: phase 1, biotite medium, coarse-grained porphyritic granites and, rarely, biotite granodiorites; phase 2, sub-phase 1, medium-grained, fine- and medium-grained biotite muscovitized granites; sub-phase 2, biotite and biotite-muscovite fine-grained granites; and phase 2, bastard granites, aplites, granitaplite, aplite-pegmatites, pegmatites, and quartz veins. The survey area in this paper is within the southern part of the Kalba–Narym batholith. A significant share of the territory is occupied by the Narym pluton, which combines several large granite-rock masses. The subject of our research is the territory of the Burabay rock mass located south of the Kurchum River (Figure 2).
According to the geological-mapping data [18], the Burabay rock mass has a concentric zonal structure. It is shape by rocks of the following three intrusive phases:
(1) biotite medium- and coarse-grained granites and granodiorites;
(2) biotite medium-grained granites; and
(3) biotite-muscovite fine-grained granites of granite-porphyry, aplite, and pegmatite veins.
Regarding the sedimentary rocks, the geological structure of the territory involves stratified Carboniferous stages. The rocks form an alternation of gray, medium- and fine-grained, quartz-feldspathic, polymictic, sometimes initially low-in-lime sandstones, and black carbonaceous–argillaceous siltstones.
The region relief is complex, spanning low-mountain and high-mountain terrain. The absolute elevation varies from 700–800 up to 1500 m. The planation surfaces within the relief are developed on granitoid intrusions. The true altitude falls in the range of 600–900 m; the relative altitude is 50–60 m (rarely achieving 100 m) [34]. Morphologically, the relief type is a more or less oriented system of slightly elongated, highly deplanated hills; less commonly, it is represented by ridges with smooth (5–80) bare slopes and degradations, with bottoms that are either occupied by lakes or covered with a layer of gruss–sand material. As a rule, the relative hill elevations are 20–30 m. Due to weathering, various bizarre forms are present on the hills, as well as niches and depressions of various sizes [35]. A satellite image of the research area is shown in Figure 2a; the layout of the drainless lakes on the geological map is shown in Figure 2b.
The area features a unique climate and relief, as well as a significant number of small lakes with various mineralization degrees, all of which make it an attractive location in which to study the processes of the formation of macro- and microcomponent compositions [36]. The conditions for the formation of the chemical compositions of water bodies depend on many natural factors (i.e., climate patterns, relief features, water-exchange intensity, the nature of the geochemical environment, etc.).
The region within the Burabay rock mass is characterized by a good and uniformly developed hydrographic system with numerous lakes and marshes. During field studies in 2020, the hydrochemical state of the water bodies was assessed. In the course of the research, 15 lakes were identified in the survey area. They were taken as the basis to analyze both the content and changes in the key parameters and components determining the geochemical outlook of the survey area. The formation of the hydrochemical composition of the surface water took place in the survey area under the influence of natural and climatic conditions [37].
A number of the features of the region’s hydrography should be mentioned. Watershed swampiness contributes to the accumulation of a wide range of organic substances in surface water, which are the products of the incomplete decomposition of plant litter. Therefore, the presence of intermediate decomposition products of plant biomass in the natural water determines a weak acid reaction of the environment, which bodes well for an increase in the mobility of a range of metals in the composition of organo-mineral complexes.
Our research purpose is to study the chemical composition of lake water and bottom deposits to identify the mineralization of rare metals, as well as other types of mineral. For this purpose, we carried out field studies to geometrize the lakes and obtained samples of the water and bottom deposits; we then performed a chemical analysis using high-resolution and supersensitive methods (inductively coupled plasma mass spectrometry). Finally, we tried to evaluate the possibility of using water and salt-brine development for the exploration of rare metals.

2. Materials and Methods

This paper is based on the results of hydrogeochemical sampling of small lakes in the area of Burabay rock mass (Figure 2a) conducted in 2020–2022. The sampling was carried out during the driest summer period, which helped exclude influence of dilution processes through atmospheric precipitation. The studies included selection of 15 water samples (1–15) and 15 bottom-deposit samples (B1–B15). To identify the source of salt in lake water and deposits, the chemical compositions of the rocks of Burabay rock mass were analyzed in similar ways. Figure 2b demonstrates position of the sampling points. Seven samples of coarse-grained and porphyritic granites were collected.
During the field studies, geographical reference of the sampling points was made by means of special software, FieldMove Clino.
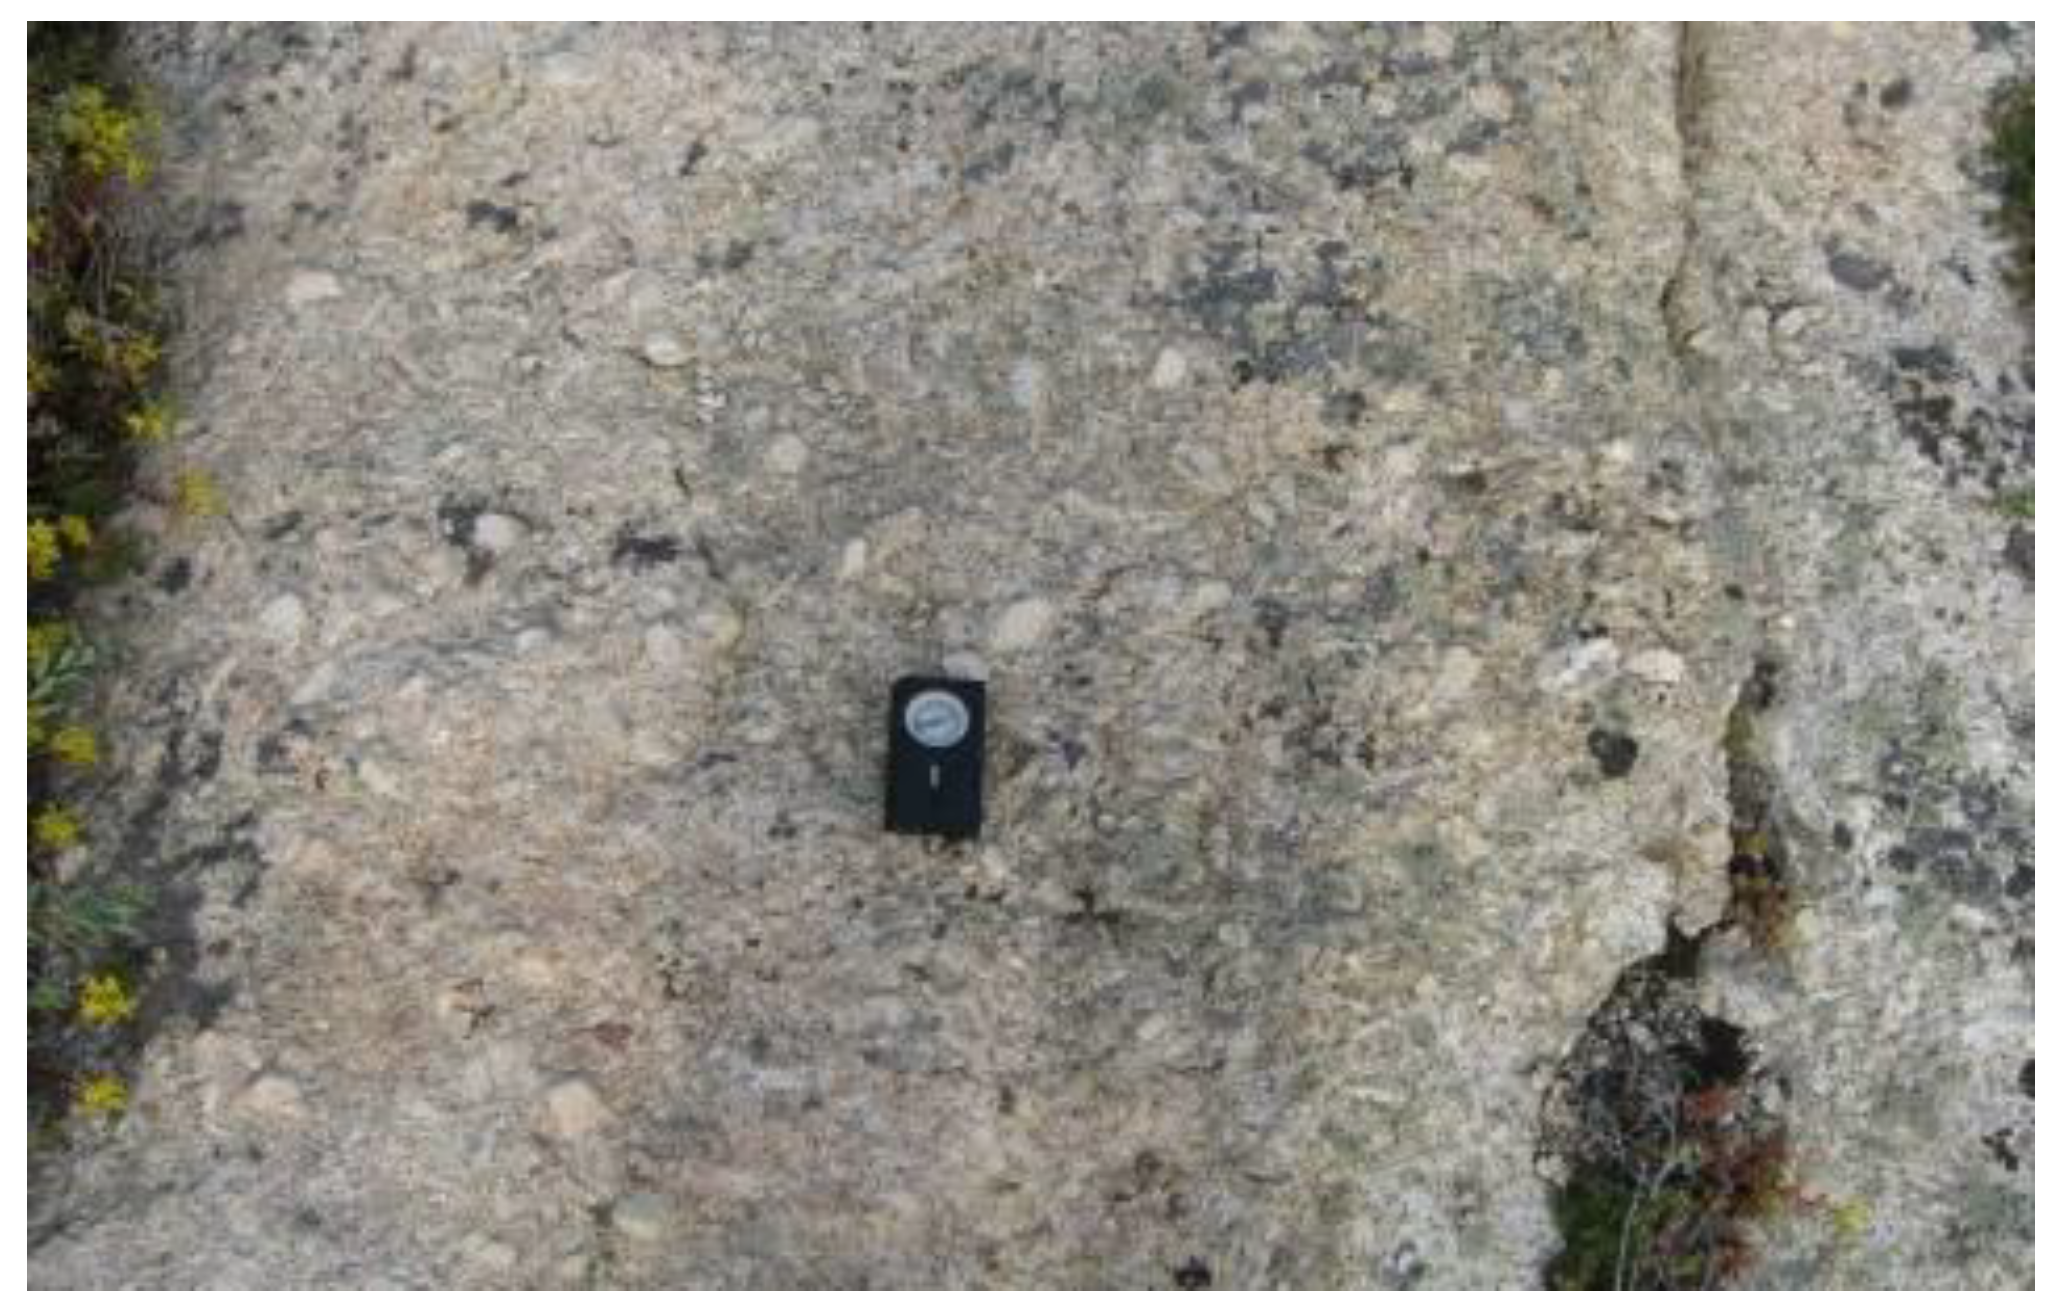
To geometrize lakes and determine water-surface area, the field studies involved aerial photography [38]. Unmanned aerial vehicle DJI Mavic was used for the purpose. The DJI Mavic quadcopter is a small but high-tech unmanned aerial vehicle with 24 high-capacity computing cores, state-of-the-art system of signal transmission for a distance of up to 7 km, five video transmitters, and 4K camera stabilized by a 3-axis mechanical gimbal. This made it possible to obtain geo-referenced high-quality aerial photographs. The georeferenced aerial photographs were taken using the Agisoft PhotoScan program.
The water was sampled according to the standard method [39]. Clean-polymer, single-use 1.5-L bottles were applied. Walls of the containers were previously moistened with a solution of nitric acid (10%) and left for 2 h, thoroughly washed with clean water, neutralized with a solution of sodium bicarbonate (2%) and, finally, washed with distilled water. Water for chemical analysis was sampled at depths of 30–50 cm at a distance from the lakeside with the help of a sterile 200-milliliter sampler. To prepare the selected sample for storage, we conserved water and loaded it into a cooling box to transport the samples. Water samples were delivered to the laboratory within 24 h [40,41].
The set of bottom-deposit samples obtained with a MPK G01 N 1/02 sampler contained a water-uptake tank, a load, and a cable. Bottom deposits were sampled at depths of 10–15 cm and weighed up to 2.0 kg; they involved the destructed soil composition. Excess water was drained; the samples were packed into plastic buckets and transported to the laboratory. After drying at a 23–25 °C temperature, the samples were quartered by standard methods.
The granite samples were prepared in the sample-preparation sector of the regional university’s engineering laboratory, ‘IRGETAS’, by means of a fine crushing area. The procedure featured two stages: a ShD 6 jaw-breaker crushed samples to 1-mm fractions, after which they were bucked down to 0.07 mm using vibratory pulverator IV-4.
Tests with water and bottom-deposit samples were carried out in the laboratory of the Engineering Center for Advanced Development, ‘VERITAS’, at D. Serikbayev East Kazakhstan Technical University. The ICP-MS spectrometry methods were applied. The samples were dried in a draft chamber and the sediment was ground. A 200-mg sub-sample was taken and dissolved in concentrated hydrofluoric, nitric, and hydrochloric acids. The resulting solution was analyzed by means of a mass spectrometer for following elements: Ag, As, Ba, Be, Bi, Cd, Co, Cr, Cu, Ga, Ge, In, La, Li, Mn, Mo, Nb, Ni, P, Pb, Sb, Sc, Sn, Sr, Ta, Te, Ti, Tl, V, W, Zn, Zr. The minimum detectable concentration of elements was up to 10−9 g/dm3 in liquid objects and up to 1 ppb in solids.

3. Results

3.1. Digital Relief Model

In order to obtain the most detailed information about the relief of the survey area, a digital relief model was needed. Based on the georeferenced aerial photographs, a digital relief model was developed and an altitude map was constructed using the Agisoft Metashape Professional software product. Georeferenced dense clouds of points, textured polygonal and tile models, digital relief models, and orthophotomaps were created based on overlapping digital images and information about geographic coordinates. Based on the calculated image positions, a depth map was compiled. Using the developed 3D polygonal model, we managed to obtain a color reproduction of the graphic properties of objects in the form of a raster with a set resolution. From a dense cloud of points, depth maps and a polygonal model, a digital relief model was constructed. This was a surface model in the form of a regular grid of height values. Table 1 shows the data from the wells of the Burabay granitoid-rock mass.
For the photofixation and determination of the survey-site location with the use of the aforementioned Agisoft PhotoScan program and the application of georeferenced point clouds from the photographs obtained through the UAV, digital relief models of the lakes in Burabay District were developed. It was possible to obtain a relief profile using the features of the Agisoft PhotoScan program (Figure 3).
The study objects within Burabay District were classified, with small lakes being the most numerous forms of negative surface relief. The digital model and the obtained lake relief profile helped to study the redistribution and allocation of the bottom-forming material. The model analysis helped us to establish that the maximum concentration of bottom-forming material was at the lowest levels of the water collection. However, it is not possible to suggest regular patterns of the element-concentration distribution due to the insufficient study of the seasonal changes in chemical composition of the water while considering the changes in the levels of the water collection.
The study of the distribution and deposition of bottom-forming materials in small lakes can have a range of practical applications. For example, understanding how sediments are distributed within lakes can help manage water quality or restore degraded ecosystems. Additionally, understanding the formation and characteristics of small lakes in a region can provide valuable information for land-use planning and management. At the same time, it is important to understand the distribution of bottom-forming material in water bodies, as it can affect water quality and ecosystem health. In this specific case, the study suggests that the maximum concentration of such materials was found at the lowest water-collection levels. However, the lack of studies on seasonal changes in water-chemical composition and water-collection levels made it difficult to determine regular patterns in the distribution of this material. Further research in this area may be required to gain a more comprehensive understanding of how these factors influence the bottom-forming-material distribution.

3.2. Geochemical Characteristics of Burabay Granites

The Burabay rock mass is located in the southern part of the Kalba–Narum batholiths (see Figure 1). In the course of field works in the Burabay rock mass, seven samples of medium-grained porphyric granites from the first phase of the Kalba complex (Figure 4) were selected. Table 2 demonstrates data on the composition of the granites.
Phase 1 is represented by medium-grained porphyric granites (Figure 4). There are gradations among them. With some minor exceptions, the granitoids always contained xenoliths from the granitized sedimentary rocks, varying from a millionth of a centimeter up to 10 × 15 cm, with rare examples measuring up to 30 × 50 cm. The xenoliths were of a discoid–ellipsoid shape. In terms of their composition, they were composed of 20–40% plagioclase; 15–37% opotash feldspar; 30–35% quartz; 7–11 (up to 12–15)% biotite; and 1–1.9% accessory minerals. The plagioclase included three generations: zonal, knotty and zonal, and polysynthetically twinned nonzonal one. The quartz took the form of isometric xenomorphic grains or, sometimes, idiomorphic crystals. The biotite is distributed evenly within the rock; occasionally, it formed clusters. The muscovite, clinkstone, and epidote were accessory minerals.
The obtained data on the chemical composition helped to draw the conclusion that he formations of phase 1 of the Kalbinsk complex belonged to potassium–sodium granite series, i.e., rather highly aluminous acid plutonic rocks, normally of an alkaline suborder. The conclusion was made on the basis of determining the specific types and characteristics of the studied rocks in terms of their chemical composition.
The hydrochemical water composition was determined in terms of more than 20 key indicators, including: pH; mineralization; the content of potassium, sodium, magnesium, ammonium ions, nitrites, nitrates, phosphates, silicon, aluminum, copper, iron, lead, zinc, nickel, cadmium, and manganese; and rare metals [42]. Relying upon data from [42], relevant indicators were selected to identify the hydrogeochemical water composition. Table 3 represents the results.
According to the classification in [43], there were four water groups:
(1) fresh water with total dissolved solids (TDSs) < 1 g/L;
(2) 1–10 g/L brackish water;
(3) 10–50 g/L saline water;
(4) >50 g/L brine water.
Accordingly, according to the total dissolved solids, the studied lakes can be divided into two groups: fresh-water lakes (## 1–3, 7, 11) and brackish-water lakes (## 4–6, 8–10, 12–15) (Table 3). The lakes are located in an arid zone, where, due to the prevalence of evaporation over precipitation, Ca is deposited in the form of minerals in the bottom sediment, while Mg remains in solution (calcite, dolomite, gypsum), similar to the Khakassi salt lakes [44].
In terms of the pH level, the water can be divided into several types, depending upon acid-base conditions [45]. The water in lakes 2, 3, 7, and 11 was weakly alkaline; and the water in lakes 1, 4–6, 10, and 12–15 was alkaline. The minimum pH level was 8.14, in lake 3, and the maximum pH level was 9.24, in lake 14. Table 4 a, b explains the chemical composition of the water and bottom deposits from the lakes within the Burabay rock mass.
The ion composition of the studied lakes varied greatly. Lakes 1–5, 7, and 11 were of the hydrocarbonate type. Lakes 6 and 8–10 were of the hydrocarbonate-sulfate type; however, they differed in their cationic composition, in which sodium prevailed. The sulfate type included lakes 12–15. They were also notable for their increased water mineralization (Table 5).
The increased mineralization in the analyzed lakes changed the share of the basic ions. If mineralization was low, then hydrocarbonate ions predominated over anions. Along with the increase in mineralization, the sulfate-ion fraction increased. It should be mentioned that in the majority of the lakes, Na+ was the prevailing cation, except for in lake 10. The lowest mineralization level was in lake 1 (0.51 g/L); the highest level was in lake 15 (9.0 g/L). The fresh water was in the fresh lakes (#1–3, 7, and 11); the water-mineralization range was 0.5–0.7 g/L. The brackish lakes demonstrated 1.4–9.0 g/L of mineralization, and the pH value was 8.14 up to 9.08.
On a logarithmic scale, the graphs of microcomponent-content distribution within the water and bottom deposits of the studied lakes clearly displayed maximal Cu, Pb, Zn, Ba, Sr, Mn, Ti, and P, and minimal Ag, As, W, Cd, Tl, and In (Figure 5a,b).
Higher levels of some microcomponents in the lake water and bottom deposits were noted. These included Cu (97.85–3668.00 ppm; 278–1015.0 ppm); Pb (52.87–259.2; 65.4–102.3 ppm); Zn (35.21–368.4; 95.87–287.8 ppm); Ba (133.9–191.5; 164.2–217.8 ppm); Sr (51.36–215.9; 76.46–203.9 ppm); Mn (196.0–836.0; 112.6–1574.0 ppm); Ti (969.0–3809.6; 1126.5–7380 ppm); P (644.0–1398.0; 931.0–1496 ppm); and Li (8.5–16.1; 12.6–21.5).
The graph of the distribution of elements in the granitoids in the Burabay rock mass (Figure 5c) demonstrate the following microcomponent contents (ppm): Cu (4.0–4.6); Pb (2.8–5.6); Zn (4.0–8.5); Ba (18.0–30.0); Sr (18.0–20.0); Mn (10.0–49.5); Ti (25.0–260.0); P (50.0–60.0); and Li (0.98).
Recently, increased interest has been expressed in the analysis of the behavior of rare-earth elements in lake water. Due to their significantly reduced migration abilities and coordinated chemical behavior, REEs are widely used while studying geological processes (the study of the genesis of igneous rocks and evolution of the Earth’s crust and magma). The interest in the behavior of the elements in natural surface water results from their potential use as indicators of geochemical processes, as well as from the determination of the migration features and fractionation laws of certain rare-earth elements.
The amount of REEs in lake water ranged from 79.16 to 197.92 ppm; the average value was 128.18 ppm (Table 6). The maximum amounts of REEs in lakes 2, 3, and 15 were 168.4 and 197.92 ppm, respectively. At the same time, the concentration of light REEs was several times higher than the concentration of heavy REEs, which is coherent with the nature of their distribution in the geosphere in general. The hydrospheric comparison of the REE content with the Clarke content in the lakes showed that the former were slightly higher than the sea- and fresh-water Clarke number. Nevertheless, the geochemical-environment standard for lake water (i.e., alkaline pH value and high mineralization) is unfavorable for REE accumulation and migration in water [46,47,48,49,50,51].
Figure 6, Figure 7 and Figure 8 show the distribution graphs of the REEs in the lake water within the Burabay District (the chondrite is normalized according to [52]), the distribution profile of the rare-earth elements in the lake water within the Burabay rock mass (the river-water Clarke is normalized according to [53]), and the distribution profile of the rare-earth elements in the lake water within the Burabay rock mass.
The concentrations of commercial microelements (i.e., Li, Sr, Rb, B, U) in the lake water and bottom deposits were analyzed (Table 7). Higher B and U contents in the lake bottom deposit (2.2–12.7·10-3 and 0.2–0.5·10-3) were also noted in comparison to the Clarke numbers of the elements in the sea water (0.4–0.46·10-3 and 0.2–0.3·10-6).

4. Discussion

Over the past decades, Kalba–Narym batholith granites were studied by many researchers [54,55,56,57,58,59,60,61]. Their interest was mainly caused by the availability of large granite-pegmatite deposits with Li, Ta, Cs, Nb, and Be mineralization in the northern and central parts of the batholith [62,63]. In the southern part of the batholiths, Cherdoyak deposits associated with granitoids from the Narym Sn-W rock mass are present [64,65,66,67,68].
The Kalba–Narym batholith is mainly composed of Kalba-complex granites. According to the data from previous geochemical studies [60,61], the granitoids in the Kalba complex contain 63–77% wt of SiO and 2–7% wt of K2O; in addition, they belong to high-potassium calcium–alkali series. Furthermore, LREEs prevail over HREEs; in the majority of the analyzed samples, there was a negative Eu anomaly (Eu/Eu* from 0.7 to 0.3). The multielement diagrams showed negative Ba, Sr, Eu, and Ti anomalies, as well as positive Th and P anomalies with multidirectional U and Ta behavior. The set of petrogeochemical data allows the suggestion that Kalba-complex granitoids are similar to S-granites.
The geochemical characteristics of the Burabay rock-mass granites corresponded to those of the Kalba-complex granites. The behavior of the rare-earth and rare elements was also similar to that of Kalyubin granites. The four analyses of the granites in terms of the behavior of the rare-earth elements showed that these were fully consistent with those of Kalba granites. Two analyses of granites (#3 and #6 in Table 2) showed reduced concentrations of LREEs. In analysis #3, the HREE concentrations were also reduced. This phenomenon can be explained by local manifestations of the post-magmatic alteration of granites.
Compared to Central Kalba, the granitoid mass within the Narym ore district was formed under Quarternary tectonic conditions, which resulted in the lesser development of intra-intrusive fractures, fault structures, and vein fields, a weaker manifestation of metasomatic processes, pegmatite veins with simpler compositions, and lower ore contents. Separate ore manifestations of block microcline and quartz–albite–muscovite pegmatites with no practical significance were established in the study area [69,70,71,72].
A geological survey within Burabay rock mass identified rare-metal specialization, including three complex halos. The largest of these, with an area of about 20 km2 [61], is located in the central part of the rock mass. The rocks are characterized by lithium content of 0.3–0.9 ppm. Two other complex halos, with 0.5 ppm of tin content, 4 ppm of copper content, less than 0.5 ppm of molybdenum content, and 0.1 ppm of silver content, of smaller sizes (up to 1 km2), are located in the eastern part of the studied area.
According to the data from another geological survey [1], two complex rare-metal anomalies were found in the territory of the Burabay rock mass: one northern (about 12 km2) and one southern (about 5 km2). The former is characterized by 0.0008–0.002% niobium content, 0.0002–0.0005% bismuth content, 0.0005–0.0008% beryllium content, 0.0015–0.002% lithium content, and 0.001–0.0015% tin content. The latter consists of three local halos, containing 0.0005% beryllium, 0.001–0.0012% tin, and 0.002–0.008% lithium; they are united by a 0.0003–0.0004% beryllium halo [73].
Considering the findings of previous studies [1], which include the rather significant saturation of the area with small (but low-in-contrast) halos, as well as its localization within a field with several points of tantalite–columbite, tin ore, and beryl (Pridorozhny section) mineralization, in addition to the proximity of Cherdoyak tin–tungsten deposits, the study of the chemical lake composition is of practical interest [74].
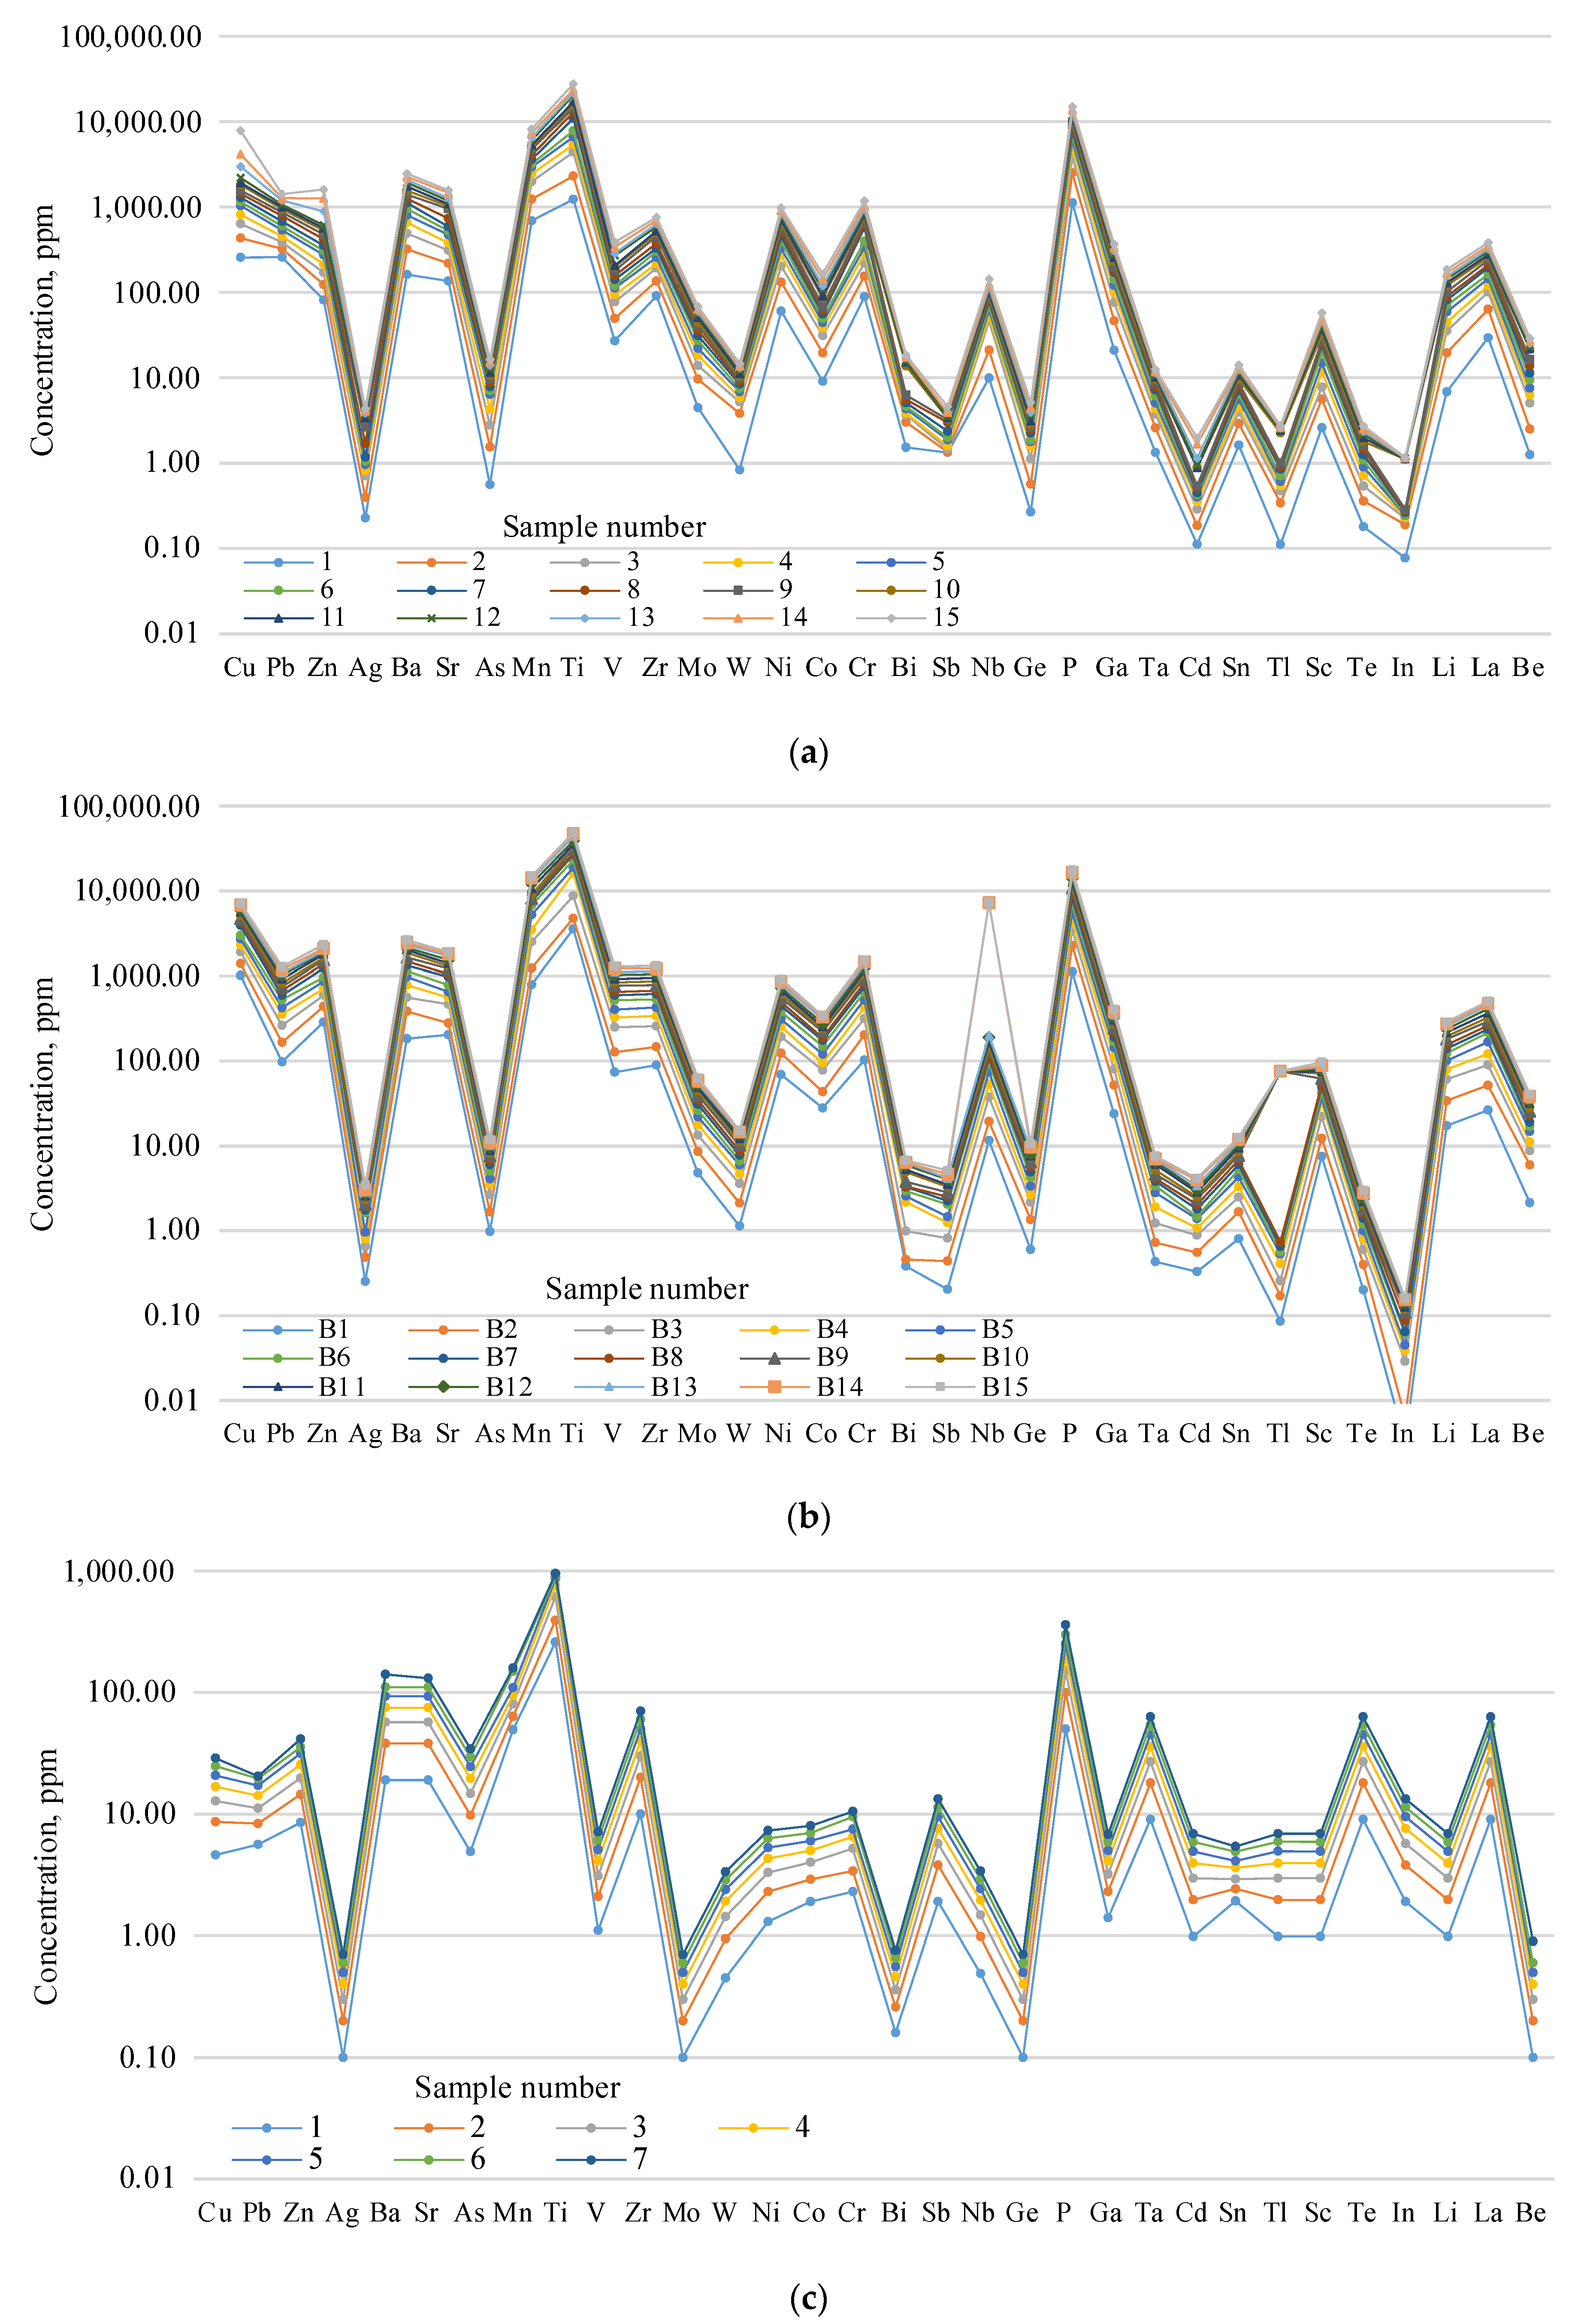
A comparison of the graphs concerning the distribution of the microcomponents in the lake water and bottom deposits within the bedrock of the Burabay rock mass (Table 2, Table 3 and Table 4; Figure 5, Figure 6, Figure 7 and Figure 8) showed that the general tendency is preserved in their content by the main maxima and minima. Along with this similar general tendency in the content according to the graphs, there were certain differences in the nature of the microcomponents. For example, the following were higher in the bottom deposits (bottom deposits; water, ppm): V (up to 120.4; up to 64.17); Ti (up to 4597.3; 3800.6); Ge (up to 0.82; up to 0.6); Ta (up to 0.90; up to 1.3); Cd (0.551); and Co (35.68 23. 88). However, the following substances were significantly (i.e., up to the first tens) reduced (bottom deposit; water, ppm): In (0.02; 0.8) and Sb (0.54; 1.3).
It can be concluded from the analysis of the graphs in Figure 5a–c that the contents of the microcomponents in the lake water and bottom deposits were tens and hundreds of times higher than those in the bedrock (except for Ti and P, which were almost equal). On the other hand, the aqueous solutions and bottom deposits have sharply reduced Ta, Cd, Sn, and In contents. This can be explained by the different solubility levels of the microcomponents in different types of water, as well as by the different sedimentation rates in the lakes.
The elevated REE concentrations in the lake waters may have resulted from the presence of erosion and the passage of the migration flow in the zone of influence of the geochemical anomalies established by [72]. This scientific source proposes many possible reasons for the occurrence of anomalies in various rare-earth elements.
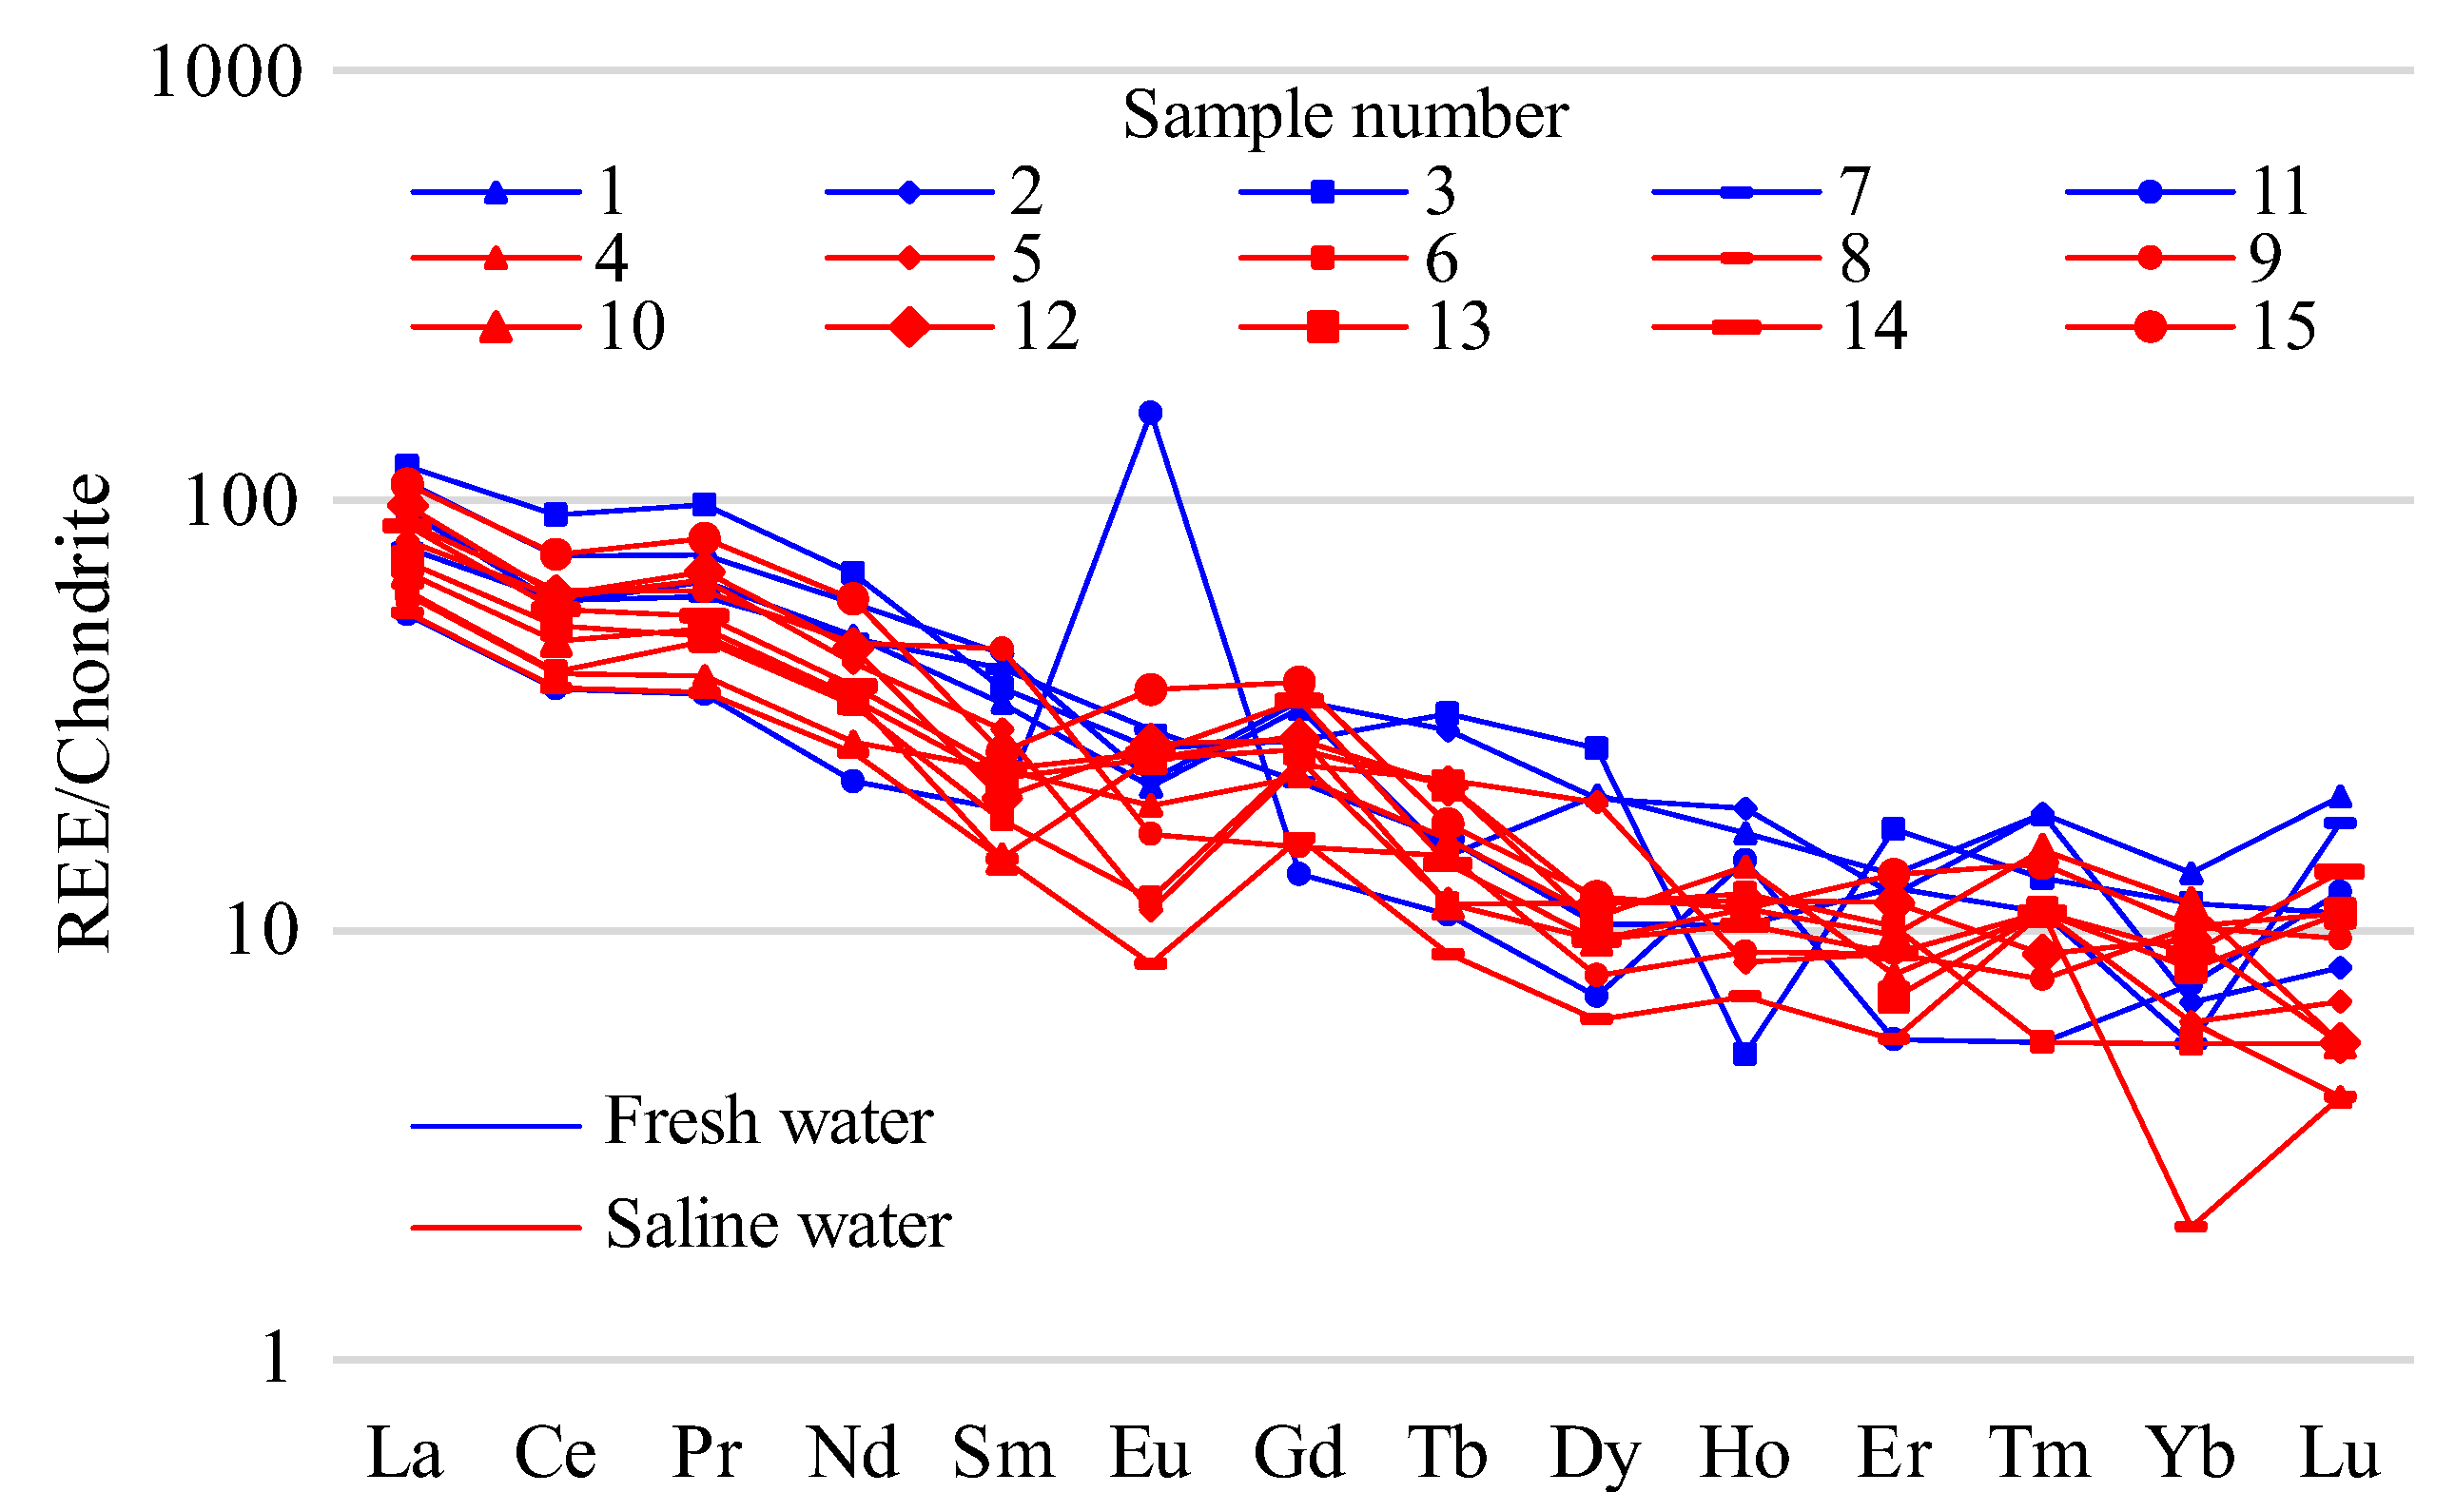
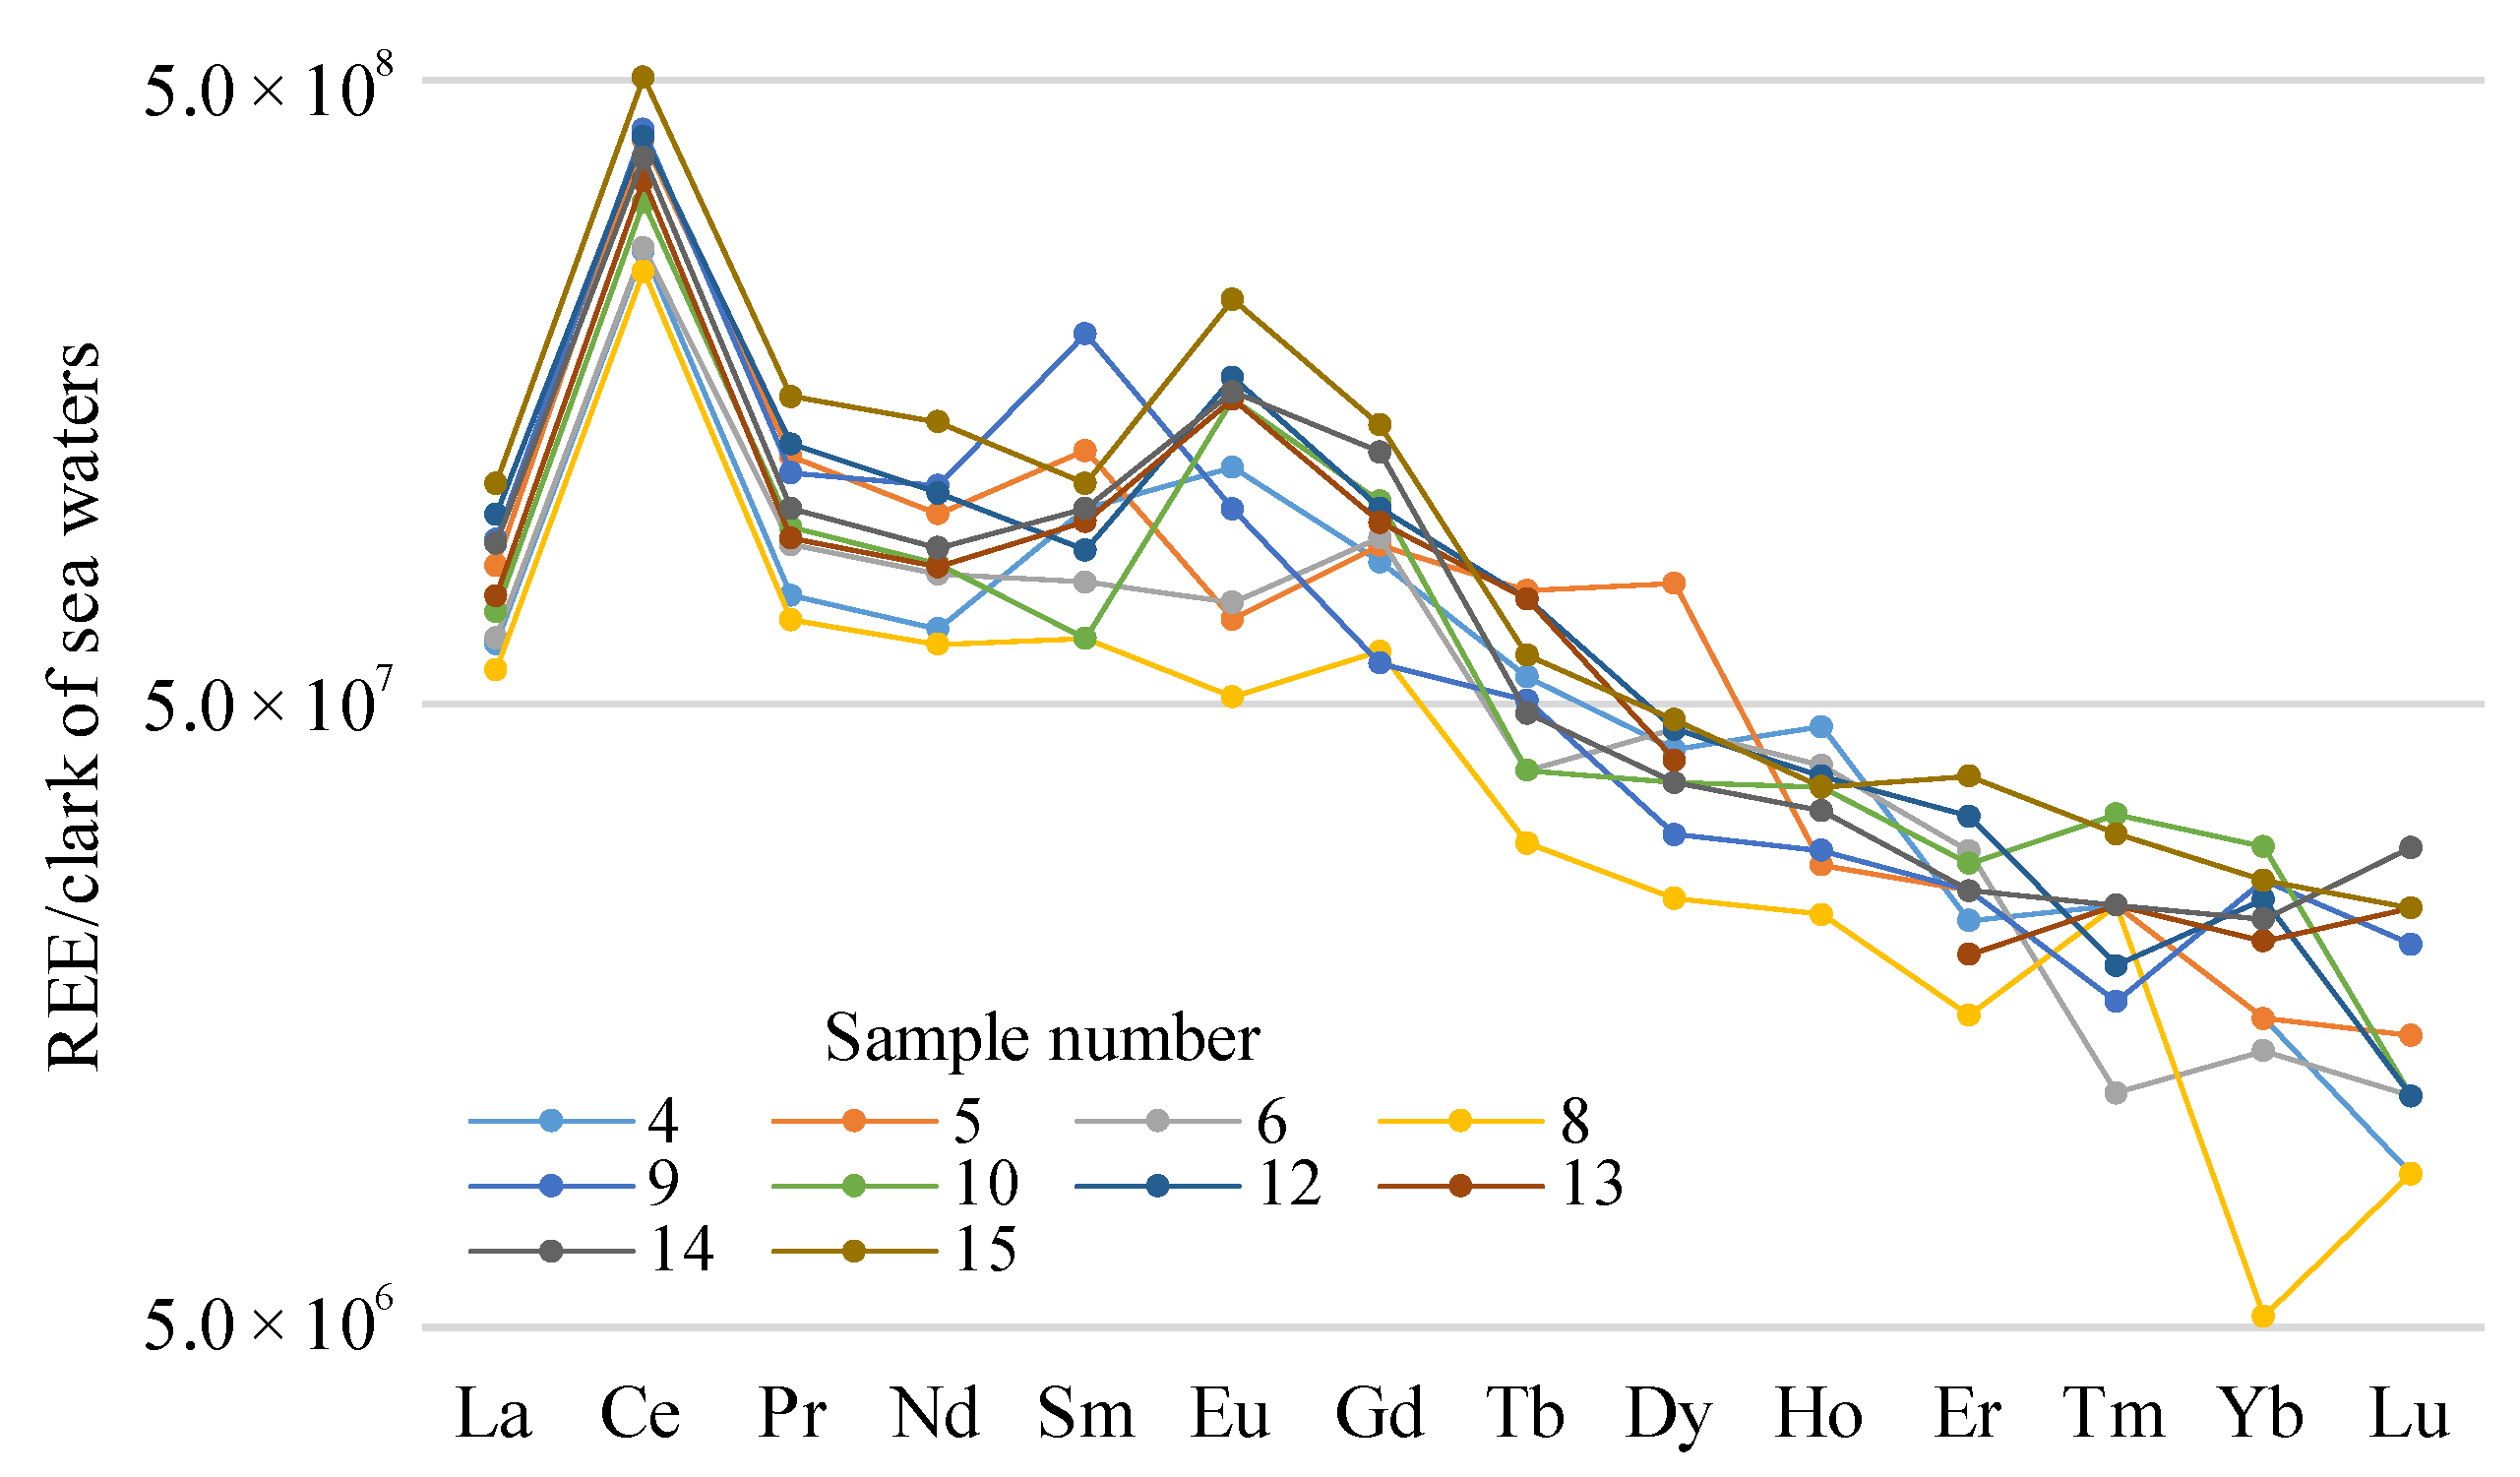
To study the behavior of the rare-earth elements, distribution graphs of rare-earth elements in the analyzed water were constructed, with chondrite-content specification in terms of the rock standards (
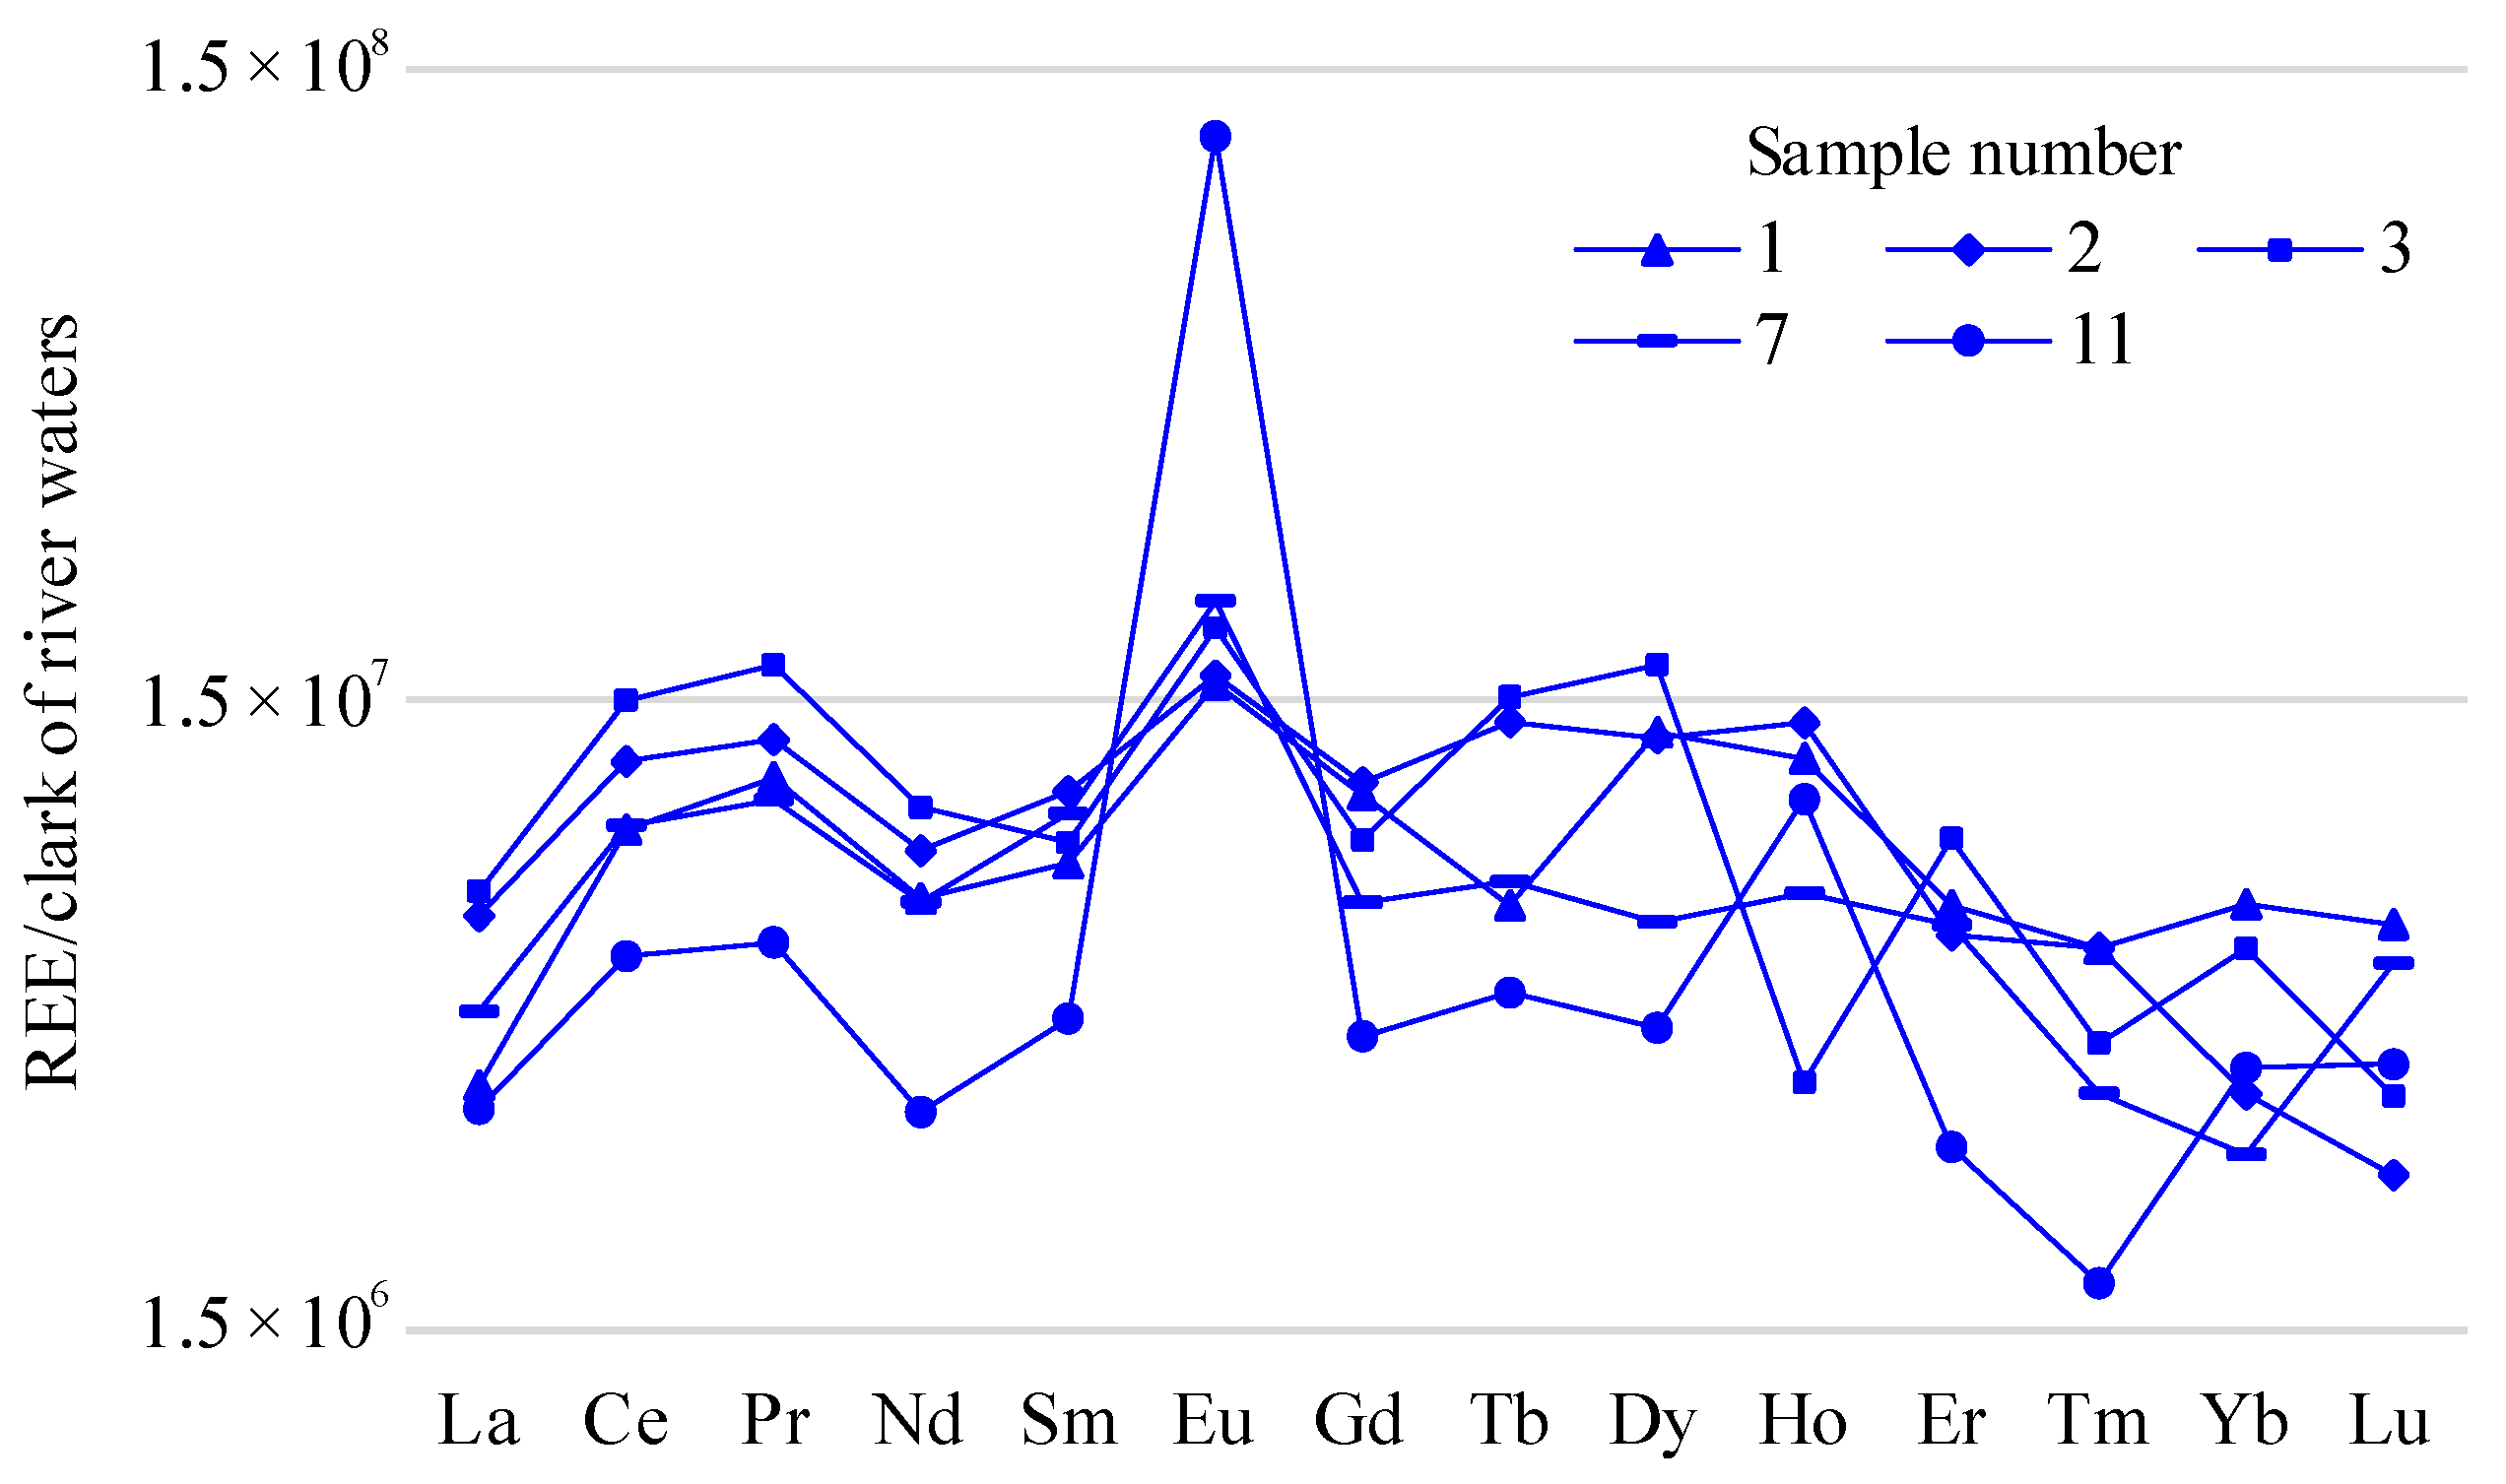
Figure 6). To take into consideration behavioral features of the elements in the solutions, the REE content in the fresh water was specified for lakes 1, 2, 3, 7, and 11 (river-water Clarke) (Figure 7). In the salt water (lakes 4–6, 8–10, and 12–15), the sea-water Clarke was used as the gauge (Figure 8) [53].
The graphs of the REE distribution standardized by the chondrite (Figure 6), as well as by the sea-water Clarkes (Figure 8), demonstrate clearly that the content of the light REEs prevailed over that of the heavy REEs. For the fresh water, the distribution of HREE and LREE was roughly the same. In the salt-lake water, prominent Ce maxima were seen; in the fresh water, prominent positive La, Ce, and Pr anomalies were seen. At the same time, the content value of the elements in the fresh water was dozens of times lower. In the graphs of the REE content in the salt water, slightly positive Sm anomalies were shown. There was a clear positive europium anomaly in both the fresh and the salt water; this was especially apparent in the fresh alkaline water from lake 11.
The study of the chemical compositions of the samples showed that the Li contents in the lake-bottom deposits were 1.7–2.7 10−3 wt%, and they were 0.6 to 1.9 10−3 wt% in the lake water. The obtained values are comparable to the Li content the in sea water (1.5–2.0 10−3), or slightly higher; nevertheless, they were lower than the Li Clarke in the sedimentary rocks (7.0–7.4 10−3). The proportions of Sr and Rb in the bottom deposits were −7.7–20.6 10−3 and 15.7–22.4 10−3 wt%, respectively, exceeding the Clarkes of the elements in the sedimentary rocks (7.5–15.3 10−3) and sea water (0.7–8.4 10−3). Similar shares were seen in the lake water for the Sr (10.7–13.6 10−3) and Rb (9.5–19.6 10−3 wt%).
The comparison of the REE contents in the lakes with the Clarke contents in the hydrosphere (Figure 6) demonstrated that they were slightly higher than the Clarkes of the sea and fresh water, although the geochemical-environment standard for lake water (alkaline pH value, and high mineralization) is unfavorable for REE accumulation and migration in water [46,47,49,51,75,76,77,78].
It should be noted that interpretation of the REE behavior in natural water is complicated by such processes as the generation conditions and the hydrodynamic regime of water complexes, the prevailing form of element migration in water, ion exchange, and adsorption by host-rock complexes which, apparently, leads to the fractionation of these elements in aqueous solutions compared to source rocks. However, the data in this study are very important for identifying the direction of migration flows and determining the areas of microelement subtraction. The possibility of using the lake water within the Burabay rock mass as a source of hydromineral resources has been defined (Table 7). The Sr, Rb, Th, and U contents are tens or even hundreds times higher (Th, U) than their respective Clarke contents in seawater and sedimentary rocks.
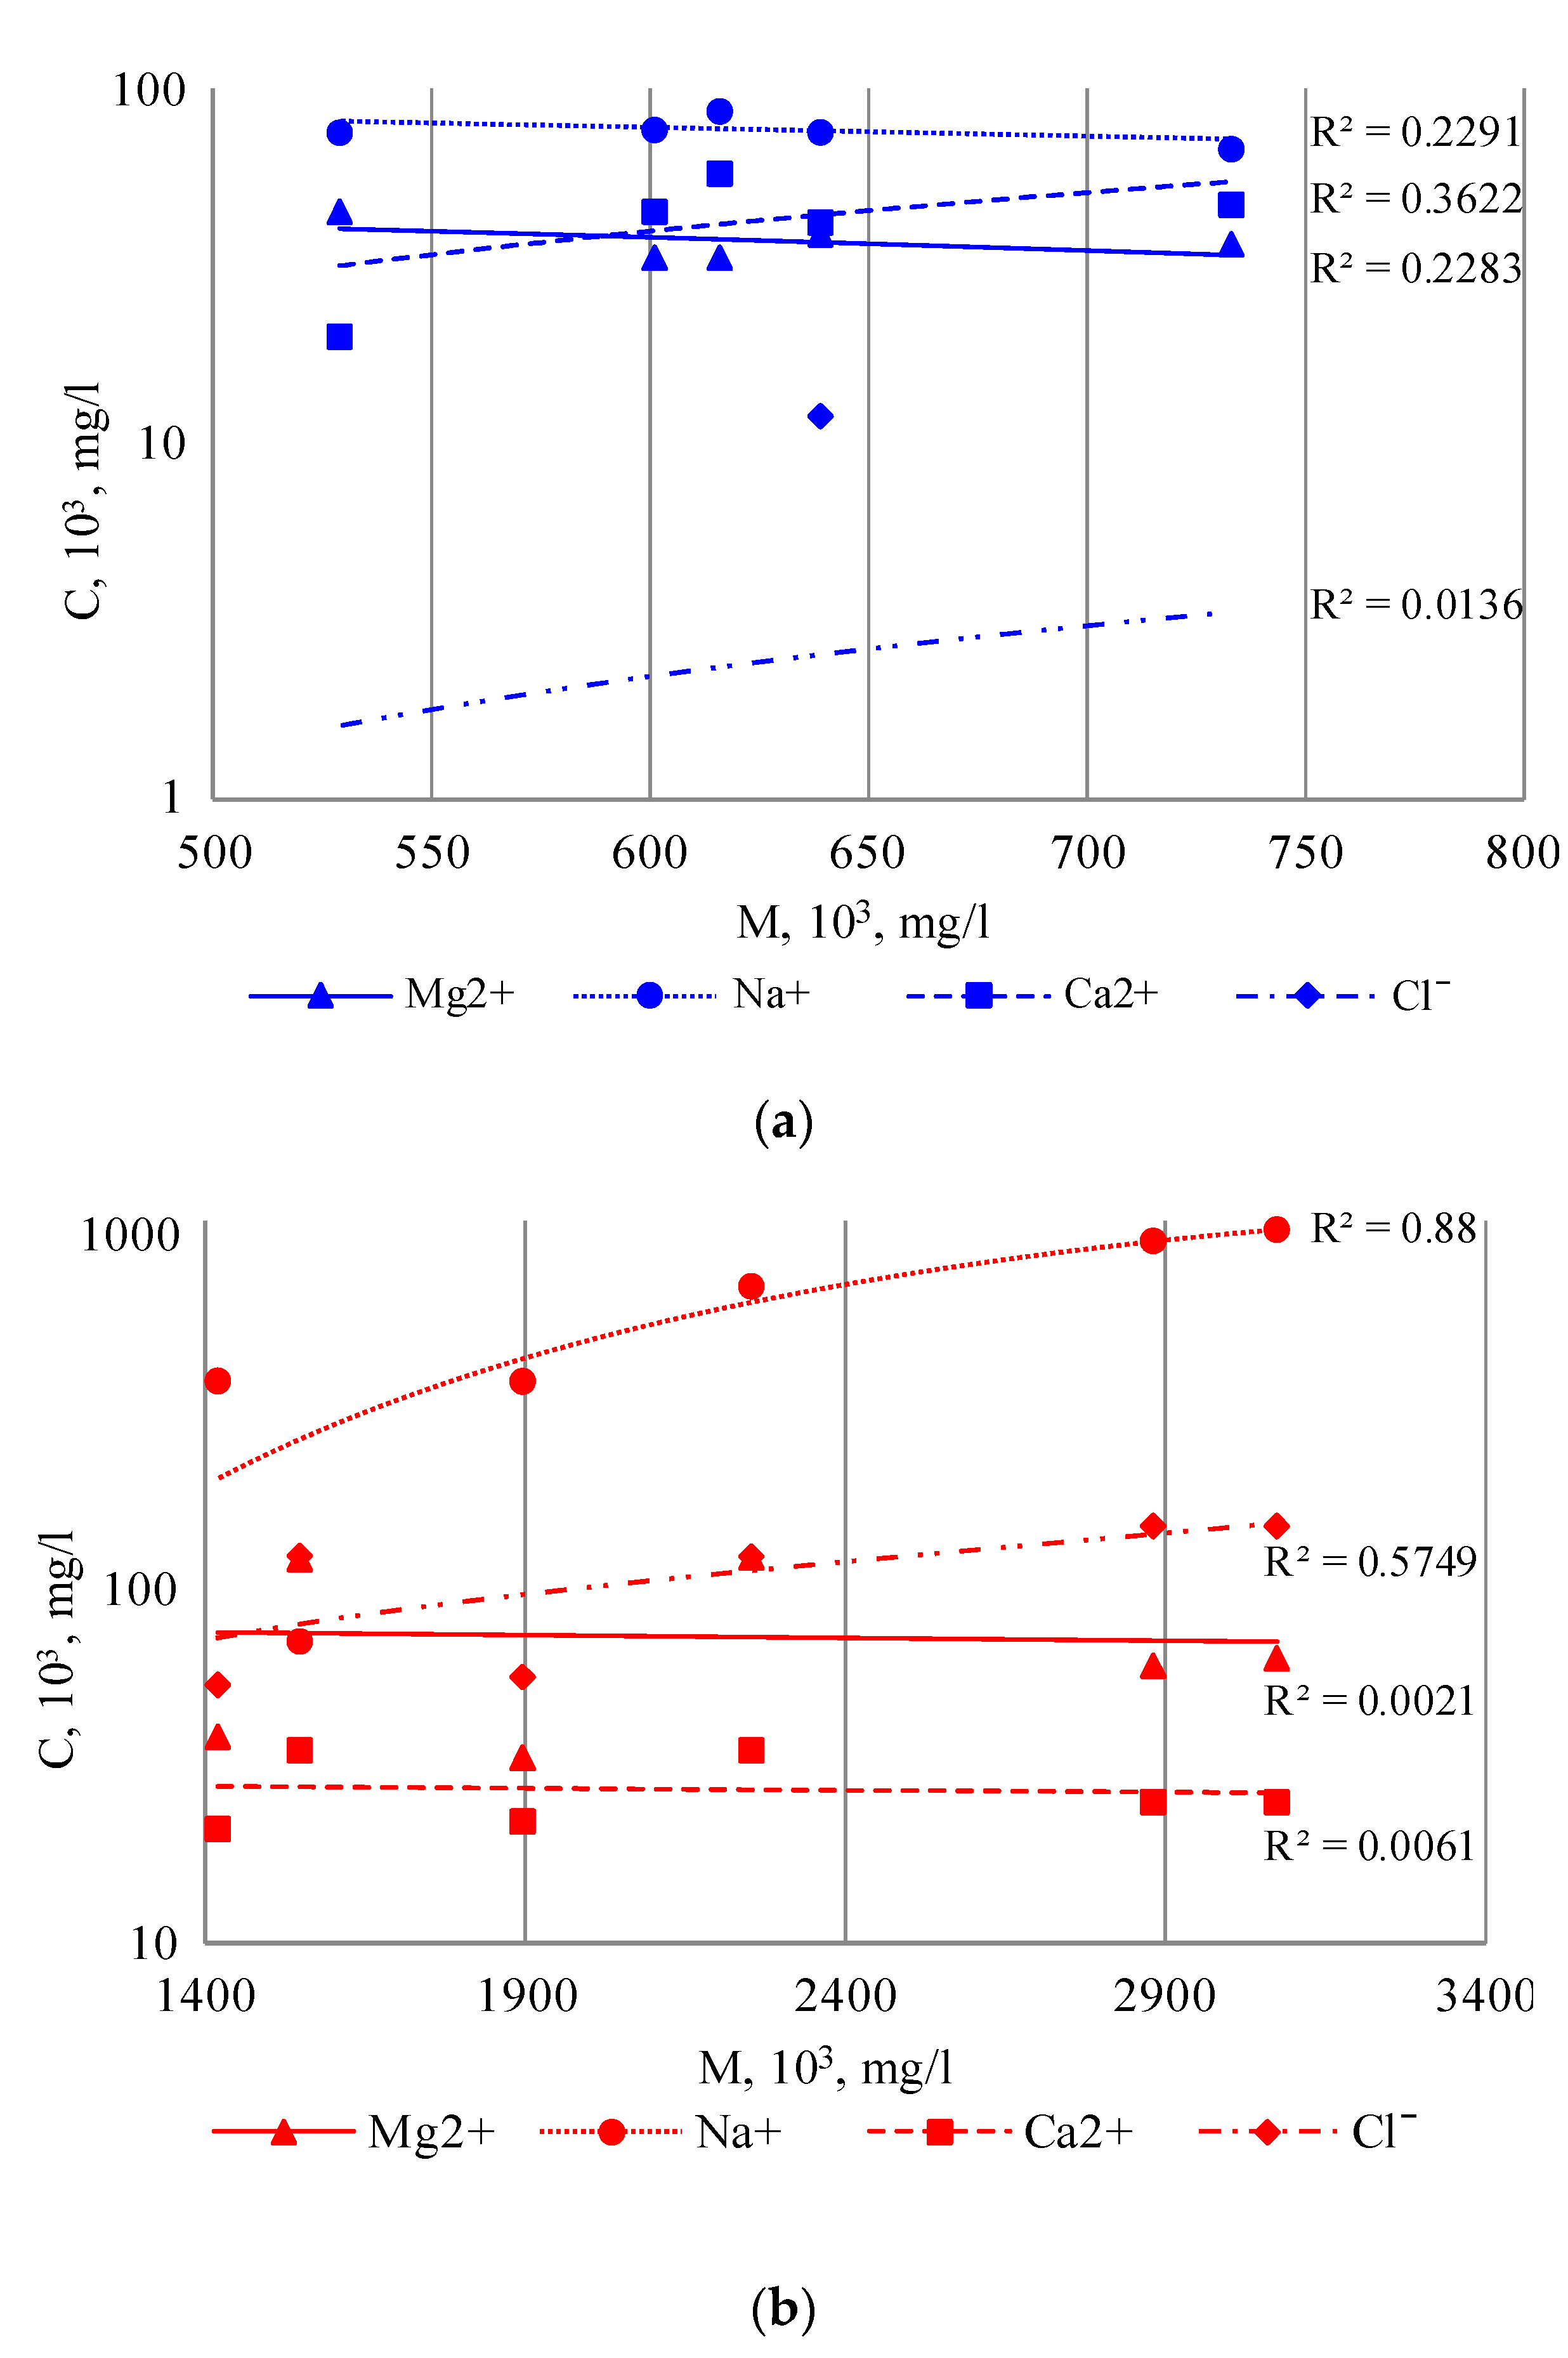
The results of the comparative analysis of the mineralization and macro-component composition of the lake water of the Burabay rock mass for fresh and salty water showed different correlations between the mineralization indicators and the levels of Na, Mg, Ca, and Cl accumulation. There was practically no correlation with fresh water (Figure 9a). As expected, the Na content increased for the salty water, along with an increase in the mineralization indicator (Figure 9b).
The Cl content showed a weak correlation with the mineralization; in turn, the Ca and Mg demonstrated no correlation. The fact that the correlation was high for the Na and medium for the Cl supports the idea that the Na originated from the surface-water runoff. The Na also potentially originated from the alkaline granites of the Burabay granitic rock mass, as their most soluble component.
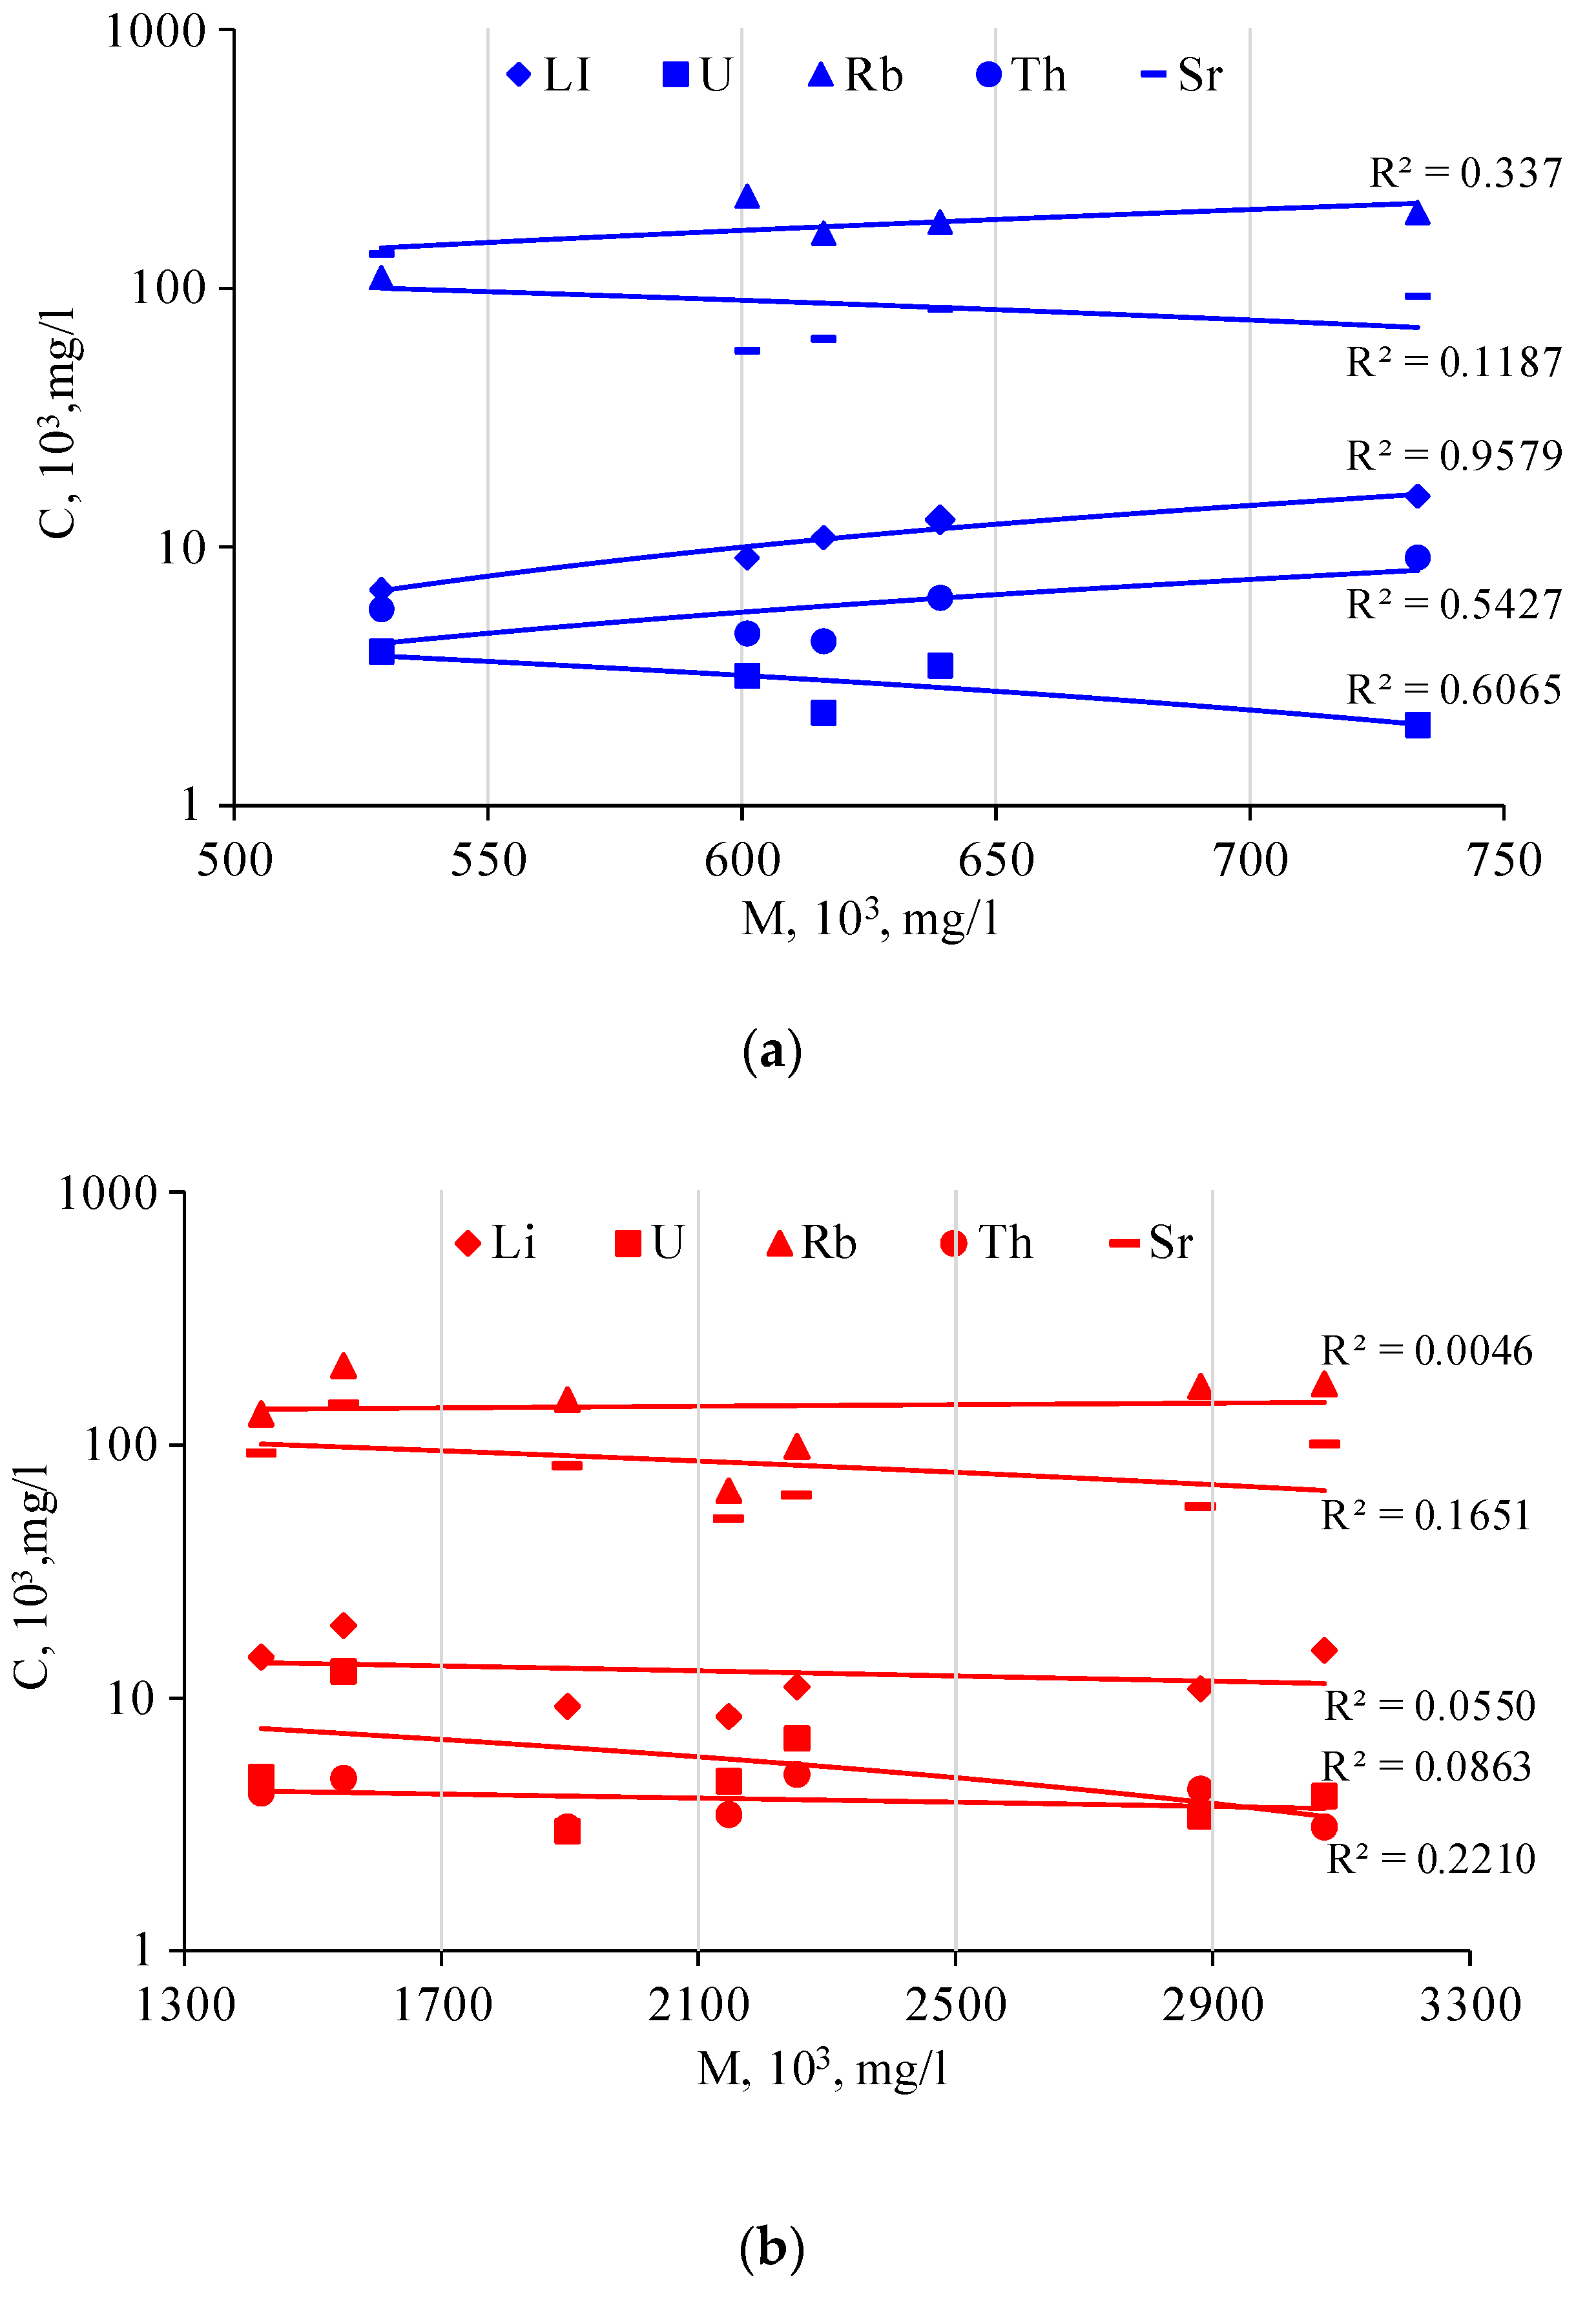
A positive correlation was also established between the water mineralization and the contents of some of the rare elements. In the fresh lakes of the Burabay rock mass, the Li shows a high correlation (R2 = 0.957), the Th showed a moderate correlation (R2 = 0.543), and the Rb showed a rather poor positive correlation (R2 = 0.337). There was a negative content correlation for U (R2 = 0.607), and there was no correlation for Sr (R2 = 0.12) (Figure 10a). These correlations were not expressed in the salty lakes (Figure 10b). It is quite possible that the Li and Na were leached from the same mineral within the surrounding granitic rocks. The area is also of interest owing to the demonstrated correlation between the parent rocks of the enclosing formation and the lake-water composition.
The interpretation of the analytical data from within the area helped to establish the relationship between the water mineralization and the weathering products of the parent rock mass; moreover, the influence on the ultimate composition of the studied lake water was observed. This may have resulted from areal losses.
It was identified that the lake water accumulated elevated concentrations of commercial components (Sr, Rb, and U), which may become the basis for specific studies of the small lakes within the area. It is possible to apply the findings of this study for future geological prospecting activities and operations within the promising sites identified.
The main sources of rare-alkaline elements are rare-metal and rare-earth-mineral occurrences, which are associated with Permian granites in the eastern Kazakhstan region. During the orogenic (post-collisional) stage of the Hercynian cycle, the survey area experienced extremely high mobility, which is reflected in the occurrence of powerful granite magmatism. In this regard, the following promising survey areas are distinguished, In these areas, we plan to conduct further research on the chemical composition of the lake waters, salt brines, and bittern and bottom sediments to identify the mineralization of rare metals and other types of mineral:
(1) Delbegeteysky area (the lakes in the north-west of the Delbegeteysky massif);
(2) Shagan–Charyn area (between the Shagan and Charyn rivers);
(3) Kaskabulak area (near the Maksut field), where there is a fault zone in which an intrusion and a Suurly tungsten deposit are known to the south of the lakes.
Large-scale granite outcrops on the daylight surface of the Kalba complex (P1) were noted in the identified survey areas. These are genetically related to the rare-metal type of mineralization. Quartz-veined-greisen and quartz-veined tin, tin–tungsten, and tungsten formations are also widely evident. Given the intense geochemical migration ability of rare-alkaline elements in the thickness of loose deposits as a result of intense geodynamic processes in the eastern Kazakhstan region, we can assume the possibility of their migration to the upper horizons and their accumulation in salt lakes localized within the area of the development of Permian granite intrusions and associated deep tectonic faults.
The planned scientific research makes a certain scientific contribution to the problem of modeling rare-metal ore-forming systems and improving prediction methods in order to create a modern scientific base for the further development of the mineral and raw-materials sector in the world economy.

5. Conclusions

The results of the study of the granitoid rocks, bottom sediments, and water in small lakes within the Burabay granitoid-rock mass showed a specific relationship between the concentrations of macro- and microcomponents, as well as rare elements in the water and bottom sediments of 15 lakes at the Burabay site, and the composition of the granitoids in the Burabay rock mass.
The study of the macro- and microcomponent composition of the water and bottom sediment of the lakes at the Burabay site showed that the sharply continental arid climate of the territory, the hydrodynamic regime of permanent and temporary surface watercourses, the terrain, and the presence of drainage basins all played leading roles in their formation. The source of the substances entering these lakes as a result of the flushing of the products of physical and chemical weathering are granitoids in the Burabay rock mass from the Permian age, as well as soils with elevated contents of a number of elements within the identified geochemical anomalies in the area of the Burabay granitoid-rock mass.
It was established that high concentrations of useful components (Sr, Rb, U, and Th) accumulate in the water and bottom sediments of the lakes, and that the U and Th contents are hundreds of times higher than their Clarke values in the sea water and comparable to their contents in the igneous rocks. This may be considered as the basis for the specialized study of the small lakes in the region. The use of modern technologies to extract radioactive elements from water sources, as well as from a large number of lakes, significantly increase the region’s prospects for hydromineral-raw-material extraction.

Author Contributions

Conceptualization, B.A. (Bakytzhan Amralinova); methodology, O.F. and I.M.; software, B.A. (Bakytzhan Amralinova) and I.M.; validation, B.A. (Bakytzhan Amralinova); formal analysis, B.A. (Bakytgul Agaliyeva) and O.F.; investigation, B.A. (Bakytzhan Amralinova), B.A. (Bakytgul Agaliyeva), O.F. and I.M.; resources, K.R. and M.M.; data curation, B.A. (Bakytzhan Amralinova), B.A. (Bakytgul Agaliyeva), O.F. and I.M.; writing—original draft preparation, B.A. (Bakytgul Agaliyeva), O.F. and I.M.; writing—review and editing, V.L., K.R. and M.M.; visualization, B.A. (Bakytgul Agaliyeva) and V.L.; supervision, B.A. (Bakytzhan Amralinova) and K.R.; project administration, B.A. (Bakytgul Agaliyeva); funding acquisition, B.A. (Bakytzhan Amralinova). All authors have read and agreed to the published version of the manuscript.

Funding

This research received no external funding.

Data Availability Statement

Data is contained within the article.

Acknowledgments

The authors would like to thank the anonymous reviewers and editor for their valuable comments and recommendations concerning the improvement of the paper.

Conflicts of Interest

The authors declare no conflict of interest.

References

  1. Wysocka, I. Determination of rare earth elements concentrations in natural waters–A review of ICP-MS measurement approaches. Talanta 2021, 221, 121636. [Google Scholar] [CrossRef] [PubMed]
  2. Liu, W.S.; Guo, M.N.; Liu, C.; Yuan, M.; Chen, X.T.; Huot, H.; Qiu, R.L. Water, sediment and agricultural soil contamination from an ion-adsorption rare earth mining area. Chemosphere 2019, 216, 75–83. [Google Scholar] [CrossRef] [PubMed]
  3. Noack, C.W.; Dzombak, D.A.; Karamalidis, A.K. Rare earth element distributions and trends in natural waters with a focus on groundwater. Environ. Sci. Technol. 2014, 48, 4317–4326. [Google Scholar] [CrossRef] [PubMed]
  4. Koltun, P.; Klymenko, V. Cradle-to-gate life cycle assessment of the production of separated mix of rare earth oxides based on Australian production route. Min. Miner. Depos. 2020, 14, 1–15. [Google Scholar] [CrossRef]
  5. Åström, M. Abundance and fractionation patterns of rare earth elements in streams affected by acid sulphate soils. Chem. Geol. 2021, 175, 249–258. [Google Scholar] [CrossRef]
  6. Arienzo, M.; Ferrara, L.; Trifuoggi, M.; Toscanesi, M. Advances in the Fate of Rare Earth Elements, REE, in Transitional Environments: Coasts and Estuaries. Water 2022, 14, 401. [Google Scholar] [CrossRef]
  7. Santana, I.V.; Botelho, N.F. REE residence, behaviour and recovery from a weathering profile related to the Serra Dourada Granite, Goiás/Tocantins States, Brazil. Ore Geol. Rev. 2022, 143, 104751. [Google Scholar] [CrossRef]
  8. Dib, I.; Khedidja, A.; Chattah, W.; Hadji, R. Multivariate statistical-based approach to the physical-chemical behavior of shallow groundwater in a semiarid dry climate: The case study of the Gadaïne-Ain Yaghout plain NE Algeria. Min. Miner. Depos. 2022, 16, 38–47. [Google Scholar] [CrossRef]
  9. Bazaluk, O.; Petlovanyi, M.; Lozynskyi, V.; Zubko, S.; Sai, K.; Saik, P. Sustainable Underground Iron Ore Mining in Ukraine with Backfilling Worked-Out Area. Sustainability 2021, 13, 834. [Google Scholar] [CrossRef]
  10. Atakoglu, O.O.; Yalcin, M.G. Geochemical characterization of the Sutlegen bauxite deposit, SW Antalya. Min. Miner. Depos. 2021, 15, 108–121. [Google Scholar] [CrossRef]
  11. Kunasz, I.A. Industrial Minerals and Rocks: Commodities, Markets and Uses, 7th ed.; Society for Mining, Metallurgy and Exploration Inc.: Littleton, MA, USA, 2006; 1548p. [Google Scholar]
  12. Volkova, N.I.; Vladimirov, A.G.; Isupov, V.P.; Moroz, E.N. Lithium salt lakes of South America and Central Asia. Chem. Interests Sustain. Dev. 2012, 20, 21–26. Available online: http://vital.lib.tsu.ru/vital/access/manager/Repository/vtls:000447544 (accessed on 23 January 2023).
  13. Bazaluk, O.; Sadovenko, I.; Zahrytsenko, A.; Saik, P.; Lozynskyi, V.; Dychkovskyi, R. Forecasting Underground Water Dynamics within the Technogenic Environment of a Mine Field. Case Study. Sustainability 2021, 13, 7161. [Google Scholar] [CrossRef]
  14. Markevych, K.; Maistro, S.; Koval, V.; Paliukh, V. Mining sustainability and circular economy in the context of economic security in Ukraine. Min. Miner. Depos. 2022, 16, 101–113. [Google Scholar] [CrossRef]
  15. Garrett, D. Handbook of Lithium and Natural Calcium Chloride: Their Deposits, Processing, Uses and Properties; Elsevier: Amsterdam, The Netherlands, 2004; 457р. [Google Scholar]
  16. Baikadamova, A.M.; Sagin, J. Survey of the well of the zharkent deposit termalny underground water (well 3-t). Eng. J. Satbayev Univ. 2021, 143, 12–18. [Google Scholar] [CrossRef]
  17. Plichko, L.V.; Zatserkovnyi, V.I.; Khilchevskyi, V.K.; Mizernaya, M.; Bakytzhan, A. Assessment of changes a number of surface water bodies within the sub-basin of the Desna River using remote sensing materials. Geoinformatics Theor. Appl. Asp. 2020, 1, 1–5. [Google Scholar] [CrossRef]
  18. Chudaev, O.V.; Chudaeva, V.A. Trace Elements and Elements of the Rare Earth Group in the Mineral Waters of Primorye: Geology and Mining in Primorye, Past, Present and Future; Dalnauka: Vladivostok, Russia, 2000; pp. 93–96. [Google Scholar]
  19. Barmakova, D.; Shakibayev, I.; Zavaley, V. Study of hydrogeological and reclamation processes for improving the reclamation condition of irrigated lands of the Karatal massif. Eng. J. Satbayev Univ. 2021, 143, 1924. [Google Scholar] [CrossRef]
  20. Dyachkov, B.A.; Aitbayeva, S.S.; Mizernaya, M.A.; Amralinova, B.B.; Bissatova, A.E. New data on non-traditional types of East Kazakhstan rare metal ore. Nauk. Visnyk Natsionalnoho Hirnychoho Universytetu 2020, 4, 11–16. [Google Scholar] [CrossRef]
  21. El-Shafei, S.; Ramadan, F.; Essawy, M.; Henaish, A.; Nabawy, B. Geology, mineralogy and geochemistry of manganese ore deposits of the Um Bogma Formation, south-western Sinai, Egypt: Genesis implications. Min. Miner. Depos. 2022, 16, 86–95. [Google Scholar] [CrossRef]
  22. Zadereev, E.; Lipka, O.; Karimov, B.; Krylenko, M.; Elias, V.; Pinto, I.S.; Fischer, M. Overview of past, current, and future ecosystem and biodiversity trends of inland saline lakes of Europe and Central Asia. Inland Waters 2020, 10, 438–452. [Google Scholar] [CrossRef]
  23. Xu, S.; Song, J.; Bi, Q.; Chen, Q.; Zhang, W.M.; Qian, Z.; He, T. Extraction of lithium from Chinese salt-lake brines by membranes: Design and practice. J. Membr. Sci. 2021, 635, 119441. [Google Scholar] [CrossRef]
  24. Li, Y.L.; Miao, W.L.; He, M.Y.; Li, C.Z.; Gu, H.E.; Zhang, X.Y. Origin of lithium-rich salt lakes on the western Kunlun Mountains of the Tibetan Plateau: Evidence from hydrogeochemistry and lithium isotopes. Ore Geol. Rev. 2023, 155, 105356. [Google Scholar] [CrossRef]
  25. Xu, W.; Gao, Q.; He, C.; Shi, Q.; Hou, Z.Q.; Zhao, H.Z. Using ESI FT-ICR MS to characterize dissolved organic matter in salt lakes with different salinity. Environ. Sci. Technol. 2020, 54, 12929–12937. [Google Scholar] [CrossRef] [PubMed]
  26. Sun, Y.; Wang, Q.; Wang, Y.; Yun, R.; Xiang, X. Recent advances in magnesium/lithium separation and lithium extraction technologies from salt lake brine. Sep. Purif. Technol. 2021, 256, 117807. [Google Scholar] [CrossRef]
  27. Borzenko, S.V.; Shvartsev, S.L. Chemical composition of salt lakes in East Transbaikalia. Appl. Geochem. 2019, 103, 72–84. [Google Scholar] [CrossRef]
  28. Umarbekova, Z.T.; Zholtayev, G.Z.; Zholtayev, G.Z.; Amralinova, B.B.; Mataibaeva, I.E. Silver Halides in the Hypergene Zone of the Arkharly Gold Deposit as Indicators of their Formation in Dry and Hot Climate (Dzungar Alatau, Kazakhstan). Int. J. Eng. Res. Technol. 2020, 13, 181–190. [Google Scholar] [CrossRef]
  29. Kolpakova, M.N.; Gaskova, O.L.; Naymushina, O.S.; Karpov, A.V.; Vladimirov, A.G.; Krivonogov, S. Saline lakes of Northern Kazakhstan: Geochemical correlations of elements and controls on their accumulation in water and bottom sediments. Appl. Geochem. 2019, 107, 8–18. [Google Scholar] [CrossRef]
  30. Samarkhanov, T.N.; Myrzagaliyeva, A.B.; Chlachula, J.; Kushnikova, L.B.; Czerniawska, J.; Nigmetzhanov, S.B. Geoenvironmental Implications and Biocenosis of Freshwater Lakes in the Arid Zone of East Kazakhstan. Sustainability 2021, 13, 5756. [Google Scholar] [CrossRef]
  31. Yensepbayev, T.; Cathelineau, M.; Baymaganbetov, B.; Nurmaganbetova, L. Thermobaric characteristics of fluid inclusions in subsalt rocks of the East of Precaspian syneclise and the Pre-Ural of Aktobe. Eng. J. Satbayev Univ. 2022, 144, 28–33. [Google Scholar] [CrossRef]
  32. Abuduwaili, J.; Issanova, G.; Saparov, G.; Abuduwaili, J.; Issanova, G.; Saparov, G. Water balance and physical and chemical properties of water in lakes of Kazakhstan. Hydrol. Limnol. Cent. Asia 2018, 1, 213–220. [Google Scholar] [CrossRef]
  33. Zeylik, B.; Arshamov, Y.; Baratov, R.; Bekbotayeva, A. New technology for mineral deposits prediction to identify prospective areas in the Zhezkazgan ore region. Min. Miner. Depos. 2021, 15, 134–142. [Google Scholar] [CrossRef]
  34. Issayeva, L.; Togizov, K.; Duczmal-Czernikiewicz, A.; Kurmangazhina, M.; Muratkhanov, D. Ore-controlling factors as the basis for singling out the prospective areas within the Syrymbet rare-metal deposit, Northern Kazakhstan. Min. Miner. Depos. 2022, 16, 14–21. [Google Scholar] [CrossRef]
  35. Dyachkov, B.A.; Amralinova, B.B.; Mataybaeva, I.E.; Dolgopolova, A.V.; Mizerny, A.I.; Miroshnikova, A.P. Laws of formation and criteria for predicting nickel content in weathering crusts of east Kazakhstan. J. Geol. Soc. India 2017, 89, 605–609. [Google Scholar] [CrossRef]
  36. Amralinova, B.B.; Frolova, O.V.; Mataibaeva, I.E.; Agaliyeva, B.B.; Khromykh, S.V. Mineralization of rare metals in the lakes of East Kazakhstan. Nauk. Visnyk Natsionalnoho Hirnychoho Universytetu 2021, 5, 16–21. [Google Scholar] [CrossRef]
  37. Kryakina, A.A. Report on the Object “Search and Evaluation Work to Provide Groundwater Reserves for 12 Villages of the Eastern Region, East Kazakhstan Region, V.T.ch in Zyryanovsky District of Zharasu, Coastal, Nikolsk, Kurchum District, Saryolen, Barak-Batyr, Maraldy, Burabai... etc.”, Text-1- the Book.
  38. Isupov, V.P.; Vladimirov, A.G.; Shvartsev, S.L.; Lyakhov, N.Z.; Shatskaya, S.S.; Chupakhina, L.E.; Kuibina, L.V.; Kolpakova, M.N.; Sodov, A.; Krivonogov, S.K. Chemical composition and hydromineral resources of salt lakes of the North-West Mongolia. Chem. Sustain. Dev. 2011, 19, 141–150. [Google Scholar]
  39. Madrid, Y.; Zayas, Z.P. Water sampling: Traditional methods and new approaches in water sampling strategy. TrAC, Trends Anal. Chem. 2007, 26, 293–299. [Google Scholar] [CrossRef]
  40. ISO 17.1.5.05-85; Nature Protection. Hydrosphere. General Requirements for Sampling Surface and Sea Waters, Ice and Precipitation. International Organization for Standardization: London, UK, 2018.
  41. ISO 5667-3:2018; Water Quality. Sampling. Part 3. Guidelines for the Storage and Handling of Water Samples. International Organization for Standardization: London, UK, 2018.
  42. Solyanik, V.P.; Karavaeva, G.S.; Alekseev, V.V. Report on the Results of the Geological Survey of the Zaisan Series—GDP200 on Sheets M-45-XXV, XXXI” East Kazakhstan Region, in 2014–2016. Book 2.
  43. Vernadsky, V.I. Chemical Structure of the Earth’s Biosphere and Its Environment; Nauka: Moscow, Russia, 1965; 374p. [Google Scholar]
  44. Khrushcheva, M.O.; Dutova, E.M.; Tishin, P.A.; Nikitenkov, A.N.; Chernyshov, A.I.; Arkhipov, A.L. Mineralogical characteristics of Uskol Lake sediments (Republic of Khakassia). Geosfernye Issled. 2021, 2, 29–43. [Google Scholar] [CrossRef]
  45. Geological evolution of the interaction of water with rocks. In Proceedings of the Third All-russian Scientific Conference with International Participation, Vladivostok, Russia, 2–4 October 2018. 479p.
  46. Ronnback, R.; Astrom, M.; Gustafsson, J.P. Comparison of the behaviour of rare earth elements in surface waters, overburden groundwaters and bedrock groundwaters in two granitoidic settings, Eastern Sweden. Appl. Geochem. 2008, 23, 1862–1880. [Google Scholar] [CrossRef]
  47. Chunye, L.; Mengchang, H.; Yanxia, L.; Linsheng, Y.; Ruimin, L.; Zhifeng, Y. Rare earth element content in the SPM of Daliao river system and its comparison with that in the sediments, loess and soils in China. J. Rare Earths 2008, 3, 414–420. [Google Scholar]
  48. Qian, Y.; Zheng, L.; Jiang, C.; Chen, X.; Chen, Y.; Xu, Y.; Chen, Y. Environmental geochemical characteristics of rare-earth elements in surface waters in the Huainan coal mining area, Anhui Province, China. Environ. Geochem. Health 2022, 44, 3527–3539. [Google Scholar] [CrossRef]
  49. Sultan, K.; Shazili, N.A. Rare earth elements in tropical surface water, soil and sediments of the Terengganu River Basin, Malaysia. J. Rare Earths 2009, 27, 1072–1085. [Google Scholar] [CrossRef]
  50. Strakhovenko, V.; Belkina, N.; Subetto, D.; Rybalko, A.; Efremenko, N.; Kulik, N.; Ludikova, A. Distribution of rare earth elements and yttrium in water, suspended matter and bottom sediments in Lake Onego: Evidence of the watershed transformation in the Late Pleistocene. Quat. Int. 2023, 644, 120–133. [Google Scholar] [CrossRef]
  51. Steinmann, M.; Stille, P. Controls on transport and fractionation of the rare earth elements in stream water of a mixed basaltic-granitic catchment basin (Rock mass Central, France). Chem. Geol. 2008, 254, 1–18. [Google Scholar] [CrossRef]
  52. Boynton, W.V. Cosmochemistry of the rare earth elements: Meteorite studies. In Rare Earth Element Geochemistry; Henderson, P., Ed.; Elsevier: Amsterdam, The Netherlands, 1984; pp. 63–114. [Google Scholar]
  53. Barash, I.G.; Bulanov, V.A.; Gladkochub, D.P.; Donskaya, T.V.; Ivanov, A.V.; Letnikova, E.F.; Mironov, A.G.; Sizykh, A.I.; Sklyarov, E.V. Interpretation of Geochemical Data; UDC: 551.1/4(07); Intermetengineering: Moscow, Russia, 2001; 288p, ISBN 5-89594-063-3. [Google Scholar]
  54. Dyachkov, B.A. Intrusive Magmatism and Metallogeny of the Eastern Kalba; Nauka: Moscow, Russia, 1972; 212p. [Google Scholar]
  55. Dyachkov, B.A.; Mayorov, A.N.P.; Shcherba, G.N.; Abdrakhmanov, K.A. Granitoid and Ore Formations of the Kalba-Narym Belt (Ore Altai); Gylym: Almaty, Kazakhstan, 1994; 208p. [Google Scholar]
  56. Shcherba, G.N.; Dyachkov, B.A.; Stuchevsky, N.I.; Nakhtigal, G.P.; Antonenko, A.N.; Lyubetsky, V.N. Bolshoy Altai (Geology and Metallogeny)/Book 1. Geological Structure; Gylym: Almaty, Kazakhstan, 1998; 304p. [Google Scholar]
  57. Navozov, O.V.; Solyanik, V.P.; Klepikov, N.A.; Karavaeva, G.S. Unresolved issues of spatial and genetic connection of some types of minerals with intrusions of the Kalba-Narym and West Kalba zones of the Greater Altai. Geol. Prot. Miner. Resour. 2011, 4, 66–72. [Google Scholar]
  58. Sokolova, E.N.; Smirnov, S.Z.; Khromykh, S.V. Conditions of crystallization, composition, and sources of rare-metal magmas forming ongonites in the Kalba—Narym zone, Eastern Kazakhstan. Petrology 2016, 24, 153–177. [Google Scholar] [CrossRef]
  59. Khromykh, S.V.; Tsygankov, A.A.; Kotler, P.D.; Navozov, O.V.; Kruk, N.N.; Vladimirov, A.G.; Travin, A.V.; Yudin, D.S.; Burmakina, G.N.; Khubanov, V.B.; et al. Late Paleozoic granitoid magmatism of East Kazakhstan and Western Transbaikalia: Testing the plume model. Geol. Geophys. 2016, 57, 983–1004. [Google Scholar] [CrossRef]
  60. Kotler, P.D.; Khromykh, S.V.; Kruk, N.N.; Sun, M.; Li, P.; Khubanov, V.B.; Semenova, D.V.; Vladimirov, A.G. Granitoids of the Kalba batholith, Eastern Kazakhstan: U–Pb zircon age, petrogenesis and tectonic implications. Lithos 2021, 388–389, 106056. [Google Scholar] [CrossRef]
  61. Oitseva, T.A.; D’yachkov, B.A.; Vladimirov, A.G.; Kuzmina, O.N.; Ageeva, O.V. New data on the substantial composition of Kalba rare metal deposits. IOP Conf. Ser. Earth Environ. Sci. 2017, 110, 012018. [Google Scholar] [CrossRef] [Green Version]
  62. Khromykh, S.V.; Oitseva, T.A.; Kotler, P.D.; D’yachkov, B.A.; Smirnov, S.Z.; Travin, A.V.; Vladimirov, A.G.; Sokolova, E.N.; Kuzmina, O.N.; Mizernaya, M.A.; et al. Rare-metal pegmatite deposits of the Kalba region, Eastern Kazakhstan: Age, composition and petrogenetic implications. Minerals 2020, 10, 1017. [Google Scholar] [CrossRef]
  63. Shcherba, G.N. Geology of the Narym Rock mass of granitoids in the Southern Altai. Izv. Acad. Sci. Kazakh SSR. Ser. Geol. 1957, 27, 1–18. [Google Scholar]
  64. Rudenko, B.M. Regularities of placement and prospects of rare-metal and sulfide mineralization in the south-western contact of the Narym granite Rock mass (Altai). Izv. Acad. Sci. Kazakh SSR Ser. Geol. 1978, 58, 1–24. [Google Scholar]
  65. Vladimirov, A.G.; Kruk, N.N.; Khromykh, S.V.; Polyansky, O.P.; Chervov, V.V.; Vladimirov, V.G.; Travin, A.V.; Babin, G.A.; Kuibida, M.L.; Khomyakov, V.D. Permian magmatism and lithospheric deformation in the Altai caused by crustal and mantle thermal processes. Russ. Geol. Geophys. 2008, 49, 468–479. [Google Scholar] [CrossRef]
  66. Khromykh, S.V.; Kotler, P.D.; Izokh, A.E.; Kruk, N.N. A review of Early Permian (300–270 Ma) magmatism in Eastern Kazakhstan and implications for plate tectonics and plume interplay. Geodyn. Tectonophys. 2019, 10, 79–99. [Google Scholar] [CrossRef] [Green Version]
  67. Kotler, P.D.; Khromykh, S.V.; Vladimirov, A.G.; Travin, A.V.; Kruk, N.N.; Murzintsev, N.G.; Navozov, O.V.; Karavaeva, G.S. New data on the age and geodynamic interpretation of the Kalba-Narym granitic batholith, Eastern Kazakhstan. Dokl. Earth Sci. 2015, 462, 565–569. [Google Scholar] [CrossRef]
  68. Dyachkov, B.; Zimanovskaya, N.; Mataibayeva, I. Rare metal deposits of East Kazakhstan: Geologic position and prognostic criteria. Open J. Geol. 2013, 3, 404–409. [Google Scholar] [CrossRef] [Green Version]
  69. D’yachkov, B.A.; Mizernaya, M.A.; Khromykh, S.V.; Bissatova, A.Y.; Oitseva, T.A.; Miroshnikova, A.P.; Frolova, O.V.; Kuzmina, O.N.; Zimanovskaya, N.A.; Pyatkova, A.P.; et al. Geological History of the Great Altai: Implications for Mineral Exploration. Minerals 2022, 12, 744. [Google Scholar] [CrossRef]
  70. Dyachkov, B.A.; Bissatova, A.Y.; Mizernaya, M.A.; Zimanovskaya, N.A.; Oitseva, T.A.; Amralinova, B.B.; Aitbaeva, S.S.; Kuzmina, O.N.; Orazbekova, G.B. Specific Features of Geotectonic Development and Ore Potential in Southern Altai (Eastern Kazakhstan). Geol. Ore Depos. 2021, 63, 383–408. [Google Scholar] [CrossRef]
  71. D’yachkov, B.A.; Bissatova, A.Y.; Mizernaya, M.A.; Khromykh, S.V.; Oitseva, T.A.; Kuzmina, O.N.; Zimanovskaya, N.A.; Aitbayeva, S.S. Mineralogical Tracers of Gold and Rare-Metal Mineralization in Eastern Kazakhstan. Minerals 2021, 11, 253. [Google Scholar] [CrossRef]
  72. Chertko, N.K. Geochemistry: Studies. Manual; BSU: Bemidji, MN, USA, 2008; 170p. [Google Scholar]
  73. Petina, M.A.; Chernomorets, A.A.; Petina, V.I.; Kovalenko, A.N. Development of methods for acquisition and processing of knowledge about the formation of a new hydrogeological environment. Ekonom. Inform. 2016, 23, 141–147. [Google Scholar]
  74. Davranche, M.; Pourret, O.; Gruau, G.; Dia, A.; Jin, D.; Gaertner, D. Competitive binding of REE to humic acid and manganese oxide: Impact of reaction kinetics on development of cerium anomaly and REE adsorption. Chem. Geol. 2008, 247, 154–170. [Google Scholar] [CrossRef]
  75. Shvartsev, S.L.; Kolpakova, M.N.; Isupov, V.P.; Vladimirov, A.G.; Ariunbileg, S. Geochemistry and chemical evolution of saline lakes of western mongolia. Geochem. Int. 2014, 52, 388–403. [Google Scholar] [CrossRef]
  76. Zamana, L.V.; Vakhnina, I.L. Hydrochemistry of salt lakes of Southeastern Transbaikalia in the phase of climate aridization at the beginning of the XXI century. Int. J. Fundam. Appl. Res. 2014, 11, 608–612. [Google Scholar] [CrossRef]
  77. Malanchuk, Y.; Moshynskyi, V.; Denisyuk, P.; Malanchuk, Z.; Khrystyuk, A.; Korniienko, V.; Martyniuk, P. Regularities in the distribution of granulometric composition of tuff while crushing. Min. Miner. Depos. 2021, 15, 66–74. [Google Scholar] [CrossRef]
  78. Makarenko, N.A.; Arkhipov, A.L. Rare metal potential of salts of the Thawed Lake tract (Republic of Khakassia). Bull. Tomsk Polytech. Univ. Geo Assets Eng. 2008, 307, 172–1741. [Google Scholar]
Figure 1. Geological map of the Kalba–Narym batholith in eastern Kazakhstan.
Water 15 01386 g001
Figure 2. Burabay rock-mass district: (a)—relief and location of the analyzed lakes; (b)—geologic map (according to V.P. Solyannik).
Water 15 01386 g002
Figure 3. Relief profile using the Agisoft PhotoScan program.
Water 15 01386 g003
Figure 4. Porphyric granites from phase 1 of Kalba complex (sample #3 of coarse-grained and porphyritic granites).
Water 15 01386 g004
Figure 5. Distribution of microcomponents within Burabay rock mass: (a)—in water (15 samples, lakes); (b)—in the bottom sediments (15 samples, B1–B15); (c)—in granites (7 samples).
Water 15 01386 g005
Figure 6. Spectra of REEs in lake water within Burabay District (chondrite is normalized).
Water 15 01386 g006
Figure 7. Distribution profile of rare-earth elements in lake water within Burabay rock mass (river-water Clarke is normalized).
Water 15 01386 g007
Figure 8. Distribution profile of rare-earth elements in lake water within Burabay rock mass (sea water Clarke is normalized).
Water 15 01386 g008
Figure 9. Correlation between mineralization (M) and concentration of macrocomponents (Na, Mg, Ca, and Cl) in lake water of Burabay rock mass: (a)—fresh water; and (b)—salty water.
Water 15 01386 g009
Figure 10. Graphs with relationship between mineralization (M) and concentration (C) of microcomponents (Li, Sr, Rb, Th, and U) in lake water of Burabay rock mass: (a)—fresh water; and (b)—salty water.
Water 15 01386 g010
Table 1. Summary on the wells of Burabay granitoid-rock mass.
Lake NumberCoordinatesAltitude, mWater-Surface Area, km2
148°34′1.03″ 84°1′36.61″4880.37
248°34′48.32″ 84°2′42.98″4980.6
348°34′12.76″ 84°6′56.38″5190.36
448°34′5.53″ 84°12′31.52″6411.83
548°32′9.19″ 84°13′22.77″6570.26
648°32′1.54″ 84°14′21.84″6590.12
748°32′0.39″ 84°17′35.76″6601.05
848°31′1.67″ 84°18′40.04″6790.43
948°32′48.29″ 84°17′58.01″6880.05
1048°32′24.49″ 84°22′12.29″6860.17
1148°36′5.56″ 84° 4′40.95″5341.5
1248°36′24.53″ 84°27′39.28″8512.07
1348°37′50.81″ 84°24′2.92″9140.25
1448°37′31.03″ 84°28′39.29″8670.26
1548°37′47.23″ 84°29′7.39″8690.46
Table 2. Summary of the wells of Burabay granitoid-rock mass (wt%).
Sample1234567
SiO269.5467.3270.8065.1862.2974.7468.15
TiO20.500.830.250.680.930.100.48
Al2O315.2214.8415.2816.5216.7113.8813.79
Fe2O33.265.592.685.536.461.933.01
MnO0.040.080.030.070.100.070.05
MgO0.681.500.691.561.870.210.75
CaO1.191.842.342.753.070.582.37
Na2O3.243.554.503.433.573.633.24
K2O4.623.171.393.333.484.374.25
P2O50.210.170.090.180.230.220.35
Rb149101439613616593
Sr13734844526321472264
Y17.1315.3564414.732
Zr23941710531838941197
Nb14.110.92.112.616.610.213.2
Cs4.33.71.387.113.914.28.4
Ba535900233655469219216
La44449.728497.036
Ce909018.7589614.787
Pr12.211.82.57.612.61.8511.8
Nd44428.328466.624
Sm8.37.21.446.08.91.702.56
Eu1.091.760.491.251.090.330.25
Gd6.36.41.276.88.41.697.32
Tb0.860.950.181.271.300.351.34
Dy3.44.80.847.97.12.26.58
Ho0.480.970.141.721.370.431.12
Er1.202.60.424.93.91.204.2
Tm0.160.420.0600.770.620.190.57
Yb1.022.60.394.63.91.183.38
Lu0.160.400.0580.700.580.180.49
Hf6.710.02.98.410.61.519.78
Ta1.070.750.210.871.381.731.32
Th16.39.82.38.9213.211.2
U3.92.61.002.52.61.841.95
Table 3. Content of macrocomponents and mineralization (M) of lakes within Burabay rock mass.
Sample123456789101112131415
pH9.088.178.148.938.939.098.149.249.249.238.219.19.239.258.74
HCO3mg-equ/L4.16.26.414.712.720.66.410.6119.96.419.49.311.11.9
% equ63797984794194484945934031352
mg/L250.1378.2390.4896.7774.71256.6390.4646.6671603.9390.41183.4567.3677.1115.9
CO3ˉmg-equ/L0.60.120.120.491.242.860.122.492.242.870.123.362.242.410.99
% equ7112651981015661
mg/L296623.9559.8137.96120108138616210811647.6
SO4mg-equ/L2.111.771.791.941.8624.550.249.559.579.620.3124.4820.6120.6499.79
% equ26181799393343435440555192
mg/L101.885.386.193.589.51180.511.6459.5460.5462.615.11177.3990.9992.44797.9
Clˉmg-equ/L43.383.7215.915.14128.561.7435.134.8835.082.31128.1642.4942.5265.87
% equ42355151999215884
mg/L14.21213.256.453.7455.96.2124.5123.7124.48.2454.5150.7150.8233.6
Ca2+mg-equ/L0.992.092.341.091.041.042.871.51.741.742.241.041.241.249.49
% equ132630441283415241225
mg/L20.0442.0847.0922.0421.0421.0457.6230.135.0735.0745.0921.0425.0525.05190.38
Mg2+mg-equ/L3.693.192.992.743.143.592.7410.7310.119.982.743.644.995.2424.96
% equ30242378216141251181558
mg/L44.9638.8836.4533.4138.2743.7433.41130.61123.02121.533.4144.3560.7563.79303.75
Na+mg-equ/L3.263.272.9416.816.8786.763.7427.5431.233.093.32117.9141.945.14139.53
% equ504743797892427072304190828383
mg/L75.1475.2267.6386.4387.981994.6686.19633.12718.0871.2176.372710.62963.321037.713207.61
K+mg-equ/L0.280.140.141.261.292.530.722.922.950.240.776.433.043.14.445696
% equ73410105141312416810104
mg/L11.15.55.5549.3950.4499.1628.31114.23115.379.6330.12251.45119.04121.1173.66
Mmg/L5296397331896142050596162.147225315486015849288130749023
Table 4. (a). Chemical composition of lake water within Burabay Rock mass (ppm). (b) Chemical composition of bottom deposits from the lakes within Burabay Rock mass (ppm).
(a)
Sample123456789101112131415
Ag0.2280.1680.3130.1080.1380.0960.120.5250.9440.6490.090.3130.1440.3070.162
As0.560.991.231.452.110.690.780.950.920.960.941.021.361.251.11
Ba162.2158.5170165145.3149.5170.3133.9145.5153.2191.5174.1163.5179.4183.6
Be1.261.262.511.261.261.891.892.512.515.030.630.632.511.891.66
Bi1.521.490.690.150.460.30.50.420.767.431.410.341.720.190.95
Cd0.1130.0720.1050.0640.0480.0240.0240.0560.0320.3460.10.0560.2010.530.297
Co9.0610.511.586.966.184.867.145.287.1417.584.1416.5611.5223.8822.32
Cr89.2365.4365.9663.0652.6658.91176.648.3854.1671.557.2167.2366.7496.72134.8
Cu256.8174.6204.7173.4220.3120140.3146.6122.9259.397.85276.4767.811723668
Ga20.9525.3529.7623.0821.6120.8128.9612.415.3430.5626.5624.4225.3528.5632.31
Ge0.270.30.550.450.20.080.40.180.180.20.280.530.30.530.65
In0.080.110.040.010.0100.020.010.010.830.010.020.010.010.01
La29.3834.1237.2618.724.9819.1330.1416.9827.4621.0816.8324.0222.327.0833.81
Li6.8412.6815.79.2614.4911.4710.878.4511.0719.329.0613.2810.8715.416.1
Mn690546742455.3501.5262.1411.85439.1706334.05196758455.05836814
Mo4.475.144.264.453.765.143.974.724.9345.554.774.223.655.07
Nb9.8811.1925.365.939.317.029.134.246.466.654.068.786.5311.3816.97
Ni60.0371.6971.5769.6355.5565.9454.6859.8766.3856.3871.3771.6164.6757.0577.6
P1121139813511070104681388488182386775987064412121121
Pb259.264.8562.6365.548260.9583.92108.480.9678.0152.8760.76128.8882.16149.36
Sb1.330.030.10.130.280.130.350.640.230.10.070.090.420.030.63
Sc2.63.042.143.973.164.84.011.71.834.664.53.8553.458.67
Sn1.631.281.080.611.010.810.690.790.870.921.030.741.010.610.99
Sr135.682.9393.0368.2995.0251.3663.6145.4215.969.8657.23100.781.49208.796.11
Ta1.331.261.150.580.711.091.080.671.020.660.630.470.630.430.77
Te0.180.180.180.180.180.180.180.180.180.180.180.180.180.180.18
Ti123010692096.7969123011893112.92031141013261269340212562115.43809.6
Tl0.1120.230.1320.0720.0660.0990.1450.0530.0921.2570.1710.0460.0990.0590.092
V26.9422.5727.7616.3818.327.2721.6215.5323.2920.314.9264.1716.3853.9748.06
W0.832.991.360.680.980.610.980.570.680.760.641.020.910.570.95
Zn81.1741.4448.5742.396132.4245.863.7760.2750.835.2147.91277.9368.4344.3
Zr91.3444.2457.322.9841.6847.0424.9447.0877.139.828.1869.54162.1663.14
(b)
SampleB1B2B3B4B5B6B7B8B9B10B11B12B13B14B15
Ag0.2530.2340.1680.1380.1680.6610.1520.1410.1590.2480.2570.1290.1370.1580.449
As0.980.680.990.870.580.960.890.650.890.740.480.940.450.950.82
Ba182.9201.5178.8217.8198.4169.6126.8154.3169.3211.7154.8179.2158.5164.2172.6
Be416712928128157146422526342767452323183724139124511978445232424011902544958
Bi0.380.080.53431010.380.380.650.050.45452610.350.350.450.040.42
Cd0.3300.2250.3300.1930.3050.0880.1950.2240.3360.1590.3250.3320.3360.5510.225
Co27.915.4834.3217.3425.0828.7423.3512.6135.2615.8915.6225.6435.6815.4811.38
Cr10399.7112.7113.397.4119.894.6295.23110.25100.496.12100.13114.5100.392.13
Cu1015374.7533.1387.6413.6278.1378.1375433387513.6915387.6513.9285.3
Ga23.9028.3028.4430.7830.914504224.6525.6227.4529.9828.7522.9221.3528.8727.58
Ge0.600.750.820.480.690.940.650.740.810.750.350.620.890.540.98
In0.000.000.020.010.010.020.020.020.020.010.010.000.010.010.01
La26.3925.4738.2530.8346.9047.4345.2624.5632.5629.8542.3822.3641.2321.3530.21
Li17.2116.814513418.5221.3322.7421.3615.2625.3615.1720.3616.2521.5815.6421520
Mn790.5443.21277.59501753.515741468.2445.2112.6875.91654.3769.31462.1658.2652.1
Mo4.813.774.784.534.084.234.283.754.754.6744.852.163.854.69
Nb196643122918.274509320.7820.6921.343594717.254515321.3113119127247059.0016.57
Ni69.15570.159.15867.9559.4845.8562.3554.6859.5468.265.2862.1361.25
P1117115512499311100149615011152132593611011116121411541025
Pb97.3668.3497.1293.5268.79101.7695.389.369.275.998.6565.465.8102.398.55
Sb0.200.230.380.420.220.580.540.260.320.450.210.210.120.480.49
Sc191763004228369452091214546174234983256829068422481649719876461433619231229
Sn0.810.860.820.82449270.940.990.850.820.790.980.750.780.740.65
Sr203.976.46186.195.1190.42129.8132.574.65168.1284.696.5195.6187.289.297.6
Ta0.430.290.510.670.900.570.480.280.520.590.850.450.390.120.48
Te0.20.20.20.20.20.20.20.20.20.20.20.20.20.20.2
Ti3553.412053975.67380.1275942303568.71126.53598.72351.21596.43659.14597.33698.41158.5
Tl0.0860.0860.0860.1510.1250.0330.0340.08575.0000.1480.1120.0870.0870.0820.025
V74.0153.61122.8274.0178117.18110.254.06120.475.279.575.0278.6114.769.2
W1.130.981.481.061.290.721.280.951.451.031.051.120.750.280.58
Zn287.8153.7155.1118.5153.5104.998.96154.2146.3110.4147.3259.1495.87114.2239.58
Zr89.357.76110.4882.1887.48103.6899.8756.68111.9883.2585.6984.281.2985.4695.23
Table 5. Hydrochemical classes of lakes of Burabay District.
SampleIon Composition of Lake, g/LHydrochemical Class of Lake
1M 0.5Hydrocarbonate class of sodium–magnesium group
2M 0.6Hydrocarbonate class of sodium–calcium group
3M 0.7Hydrocarbonate class of sodium–calcium group
4M 1.9Hydrocarbonate class of sodium group
5M 1.4Hydrocarbonate class of sodium group
6M 5.0Hydrocarbonate-sulfate class of sodium group
7M 0.6Hydrocarbonate class of sodium–calcium group
8M 2.1Hydrocarbonate-sulfate class of sodium group
9M 2.3Hydrocarbonate-sulfate class of sodium group
10M 1.5Hydrocarbonate-sulfate class of magnesium–sodium group
11M 0.6Hydrocarbonate class of sodium–calcium group
12M 5.8Hydrocarbonate-sulfate class of sodium group
13M 2.9Sulfate class of sodium group
14M 3.1Sulfate class of sodium group
15M 9.0Sulfate class of sodium group
Table 6. Contents of rare-earth elements in lake water of Burabay District.
Type of REE123456789101112131415
LaLight rare-earth elements (µg/L)29.3834.1237.2618.724.9819.1330.1416.9827.4621.0816.8324.0222.327.0833.81
Ce46.7159.9174.7631.9648.132.2748.6529.5649.9838.129.447.341.4445.0760.51
Pr7.99.0911.924.777.975.758.344.367.496.134.327.295.896.579.95
Nd29.0434.640.5216.4625.1620.1627.215.5327.9420.9113.3228.6720.7222.1935.33
Sm6.68.597.134.625.723.523.962.868.812.863.747.934.44.625.06
EuHeavy rare earth elements (µg/L)1.591.641.951.430.820.8720.611.231.8511.742.151.851.92.66
Gd8.498.867.185.916.276.467.24.244.067.383.515.726.838.869.78
Tb0.711.381.510.771.060.551.030.420.710.550.510.771.030.680.84
Dy6.666.528.523.466.393.733.7322.533.062.263.333.333.063.86
Ho1.211.380.371.010.610.870.840.50.640.811.040.7400.740.81
Er2.832.543.611.661.852.152.441.171.852.051.172.641.461.852.83
Tm0.610.610.430.360.360.180.290.360.250.50.180.360.360.360.46
Yb2.841.422.421.281.281.141.990.432.132.421.571.141.711.852.13
Lu0.660.260.350.130.220.180.180.130.310.180.40.570.350.440.35
∑REE µg/L145.23170.92197.9292.52130.7896.96137.9979.16135.38107.8689.99132.62111.66125.28168.4
Table 7. Results of study of the composition of lake water and bottom deposits in Burabay rock mass, depending upon the content of commercial microelements (mg/kg).
Rare ElementsLake WatersBottom DepositClarkes of Elements in Sea WatersClarkes of Elements in Sedimentary RocksClarkes of Elements in Granites
Li0.6–1.9·10−31.7–2.7·10−31.5–2·10−37.8–7.4·10−33.7·10−3
Sr13.56·10−37.6–20.3·10−30.8·10−32–4·10−315·10−3
Rb19.6·10−315.7–22.4·10−30.012·10−35–15·10−318·10−3
B0.5–0.9·10−39.2–12.7·10−346·10−310–25·10−3-
U0.1–0.3·10−30.2–0.48·10−30.0003·10−30.13–0.37·10−30.39·10−3
Th0.4–0.9·10−30.3–0.7·10−30.7·10−71.2·10−31.8·10−3
Disclaimer/Publisher’s Note: The statements, opinions and data contained in all publications are solely those of the individual author(s) and contributor(s) and not of MDPI and/or the editor(s). MDPI and/or the editor(s) disclaim responsibility for any injury to people or property resulting from any ideas, methods, instructions or products referred to in the content.

