Article

Characteristics of Malaysian Crude Oils and Measurement of ASP Flooded Water in Oil Emulsion Stability and Viscosity in Primary Separator

by
Muhammad Irfan
1,
Javed Akbar Khan
2,*,
Hussain H. Al-Kayiem
3,
Sharjeel Waqas
4,
Waqas Aleem
5,*,
Nor Erniza Mohammad Rozali
4,
Sabih Qamar
6,
Abdulnour Ali Jazem Ghanim
7,
Dobrochna Ginter-Kramarczyk
8,
Stanislaw Legutko
9,
Izabela Kruszelnicka
8 and
Saifur Rahman
1
1
Electrical Engineering Department, College of Engineering, Najran University, Najran 61441, Saudi Arabia
2
Key Laboratory of Unconventional Oil and Gas Development, China University of Petroleum, Qingdao 266580, China
3
Mechanical Engineering Department, University of Technology Baghdad, Baghdad 10066, Iraq
4
Chemical Engineering Department, Universiti Teknologi PETRONAS, Bandar Seri Iskandar 32610, Malaysia
5
Department of Chemical, Petroleum and Petrochemical Technology, Mir Chakar Khan Rind University of Technology, Dera Ghazi Khan 32200, Pakistan
6
Department of Chemical Engineering, Muhammad Nawaz Sharif University of Engineering & Technology, Multan 60000, Pakistan
7
Civil Engineering Department, College of Engineering, Najran University, Najran 61441, Saudi Arabia
8
Faculty of Environmental Engineering and Energy, Department of Water Supply and Bioeconomy, Poznan University of Technology, 60-965 Poznan, Poland
9
Faculty of Mechanical Engineering, Poznan University of Technology, 60-965 Poznan, Poland
*
Authors to whom correspondence should be addressed.
Water 2023, 15(7), 1290; https://doi.org/10.3390/w15071290
Submission received: 14 February 2023 / Revised: 19 March 2023 / Accepted: 21 March 2023 / Published: 24 March 2023

Abstract

:
With the application of chemical enhanced oil recovery methods, water separation is a major issue in a production facility. Oil/water separation is suppressed with a stable emulsion. The present study evaluated the impact of different emulsifiers in enhanced oil recovery. The effectiveness of each additive such as an alkali, surfactant, or polymer on the stability of the emulsion was anticipated using laser scattering to measure the emulsion’s stability. An artificial neural network was applied to predict the effectiveness of the additives on stabilization/destabilization and to assess how alkali/surfactants, surfactant/polymers, and polymer/surfactants affect the separation profiles. Measurements of the viscosity and zeta potential of residual emulsion clarify that the increase in surfactant makes the emulsion stable and became unstable with the increase in the alkali and polymer. The droplet zeta potential was within −i9~−i5 mV. The absolute value of the zeta potential decreased at a high polymer concentration with a low surfactant concentration resulting in fast flocculence phenomena. With an increase in the surfactant concentration and the presence of high alkali, the droplet’s absolute zeta potential demonstrated an increase in the repulsion force in the emulsions. The study also focuses on the carbon number distribution, wax appearance temperature (WAT) and wax content of four crude oil samples from different field locations (Miri, Angsi, Penara and Dulang). Findings show that crude oil samples with higher mol percent of carbon distribution from C20 to C40 (paraffinic composition) contains higher wax content, wt% and subsequently results in higher wax appearance temperature (WAT). This is obviously shown by the crude oil sample from Penara field. Further similar investigation on other field locations will assist in characterizing the paraffinic composition in Malaysian oil basins.

1. Introduction

Emulsions in enhanced oil recovery (EOR) are regular; the functioning criteria of the alkali, surfactant, and polymer (ASP) injection relate to emulsion generation [1,2]. Different customary techniques for treating unrefined petroleum emulsions are accessible. However, the injection of ASP into the produced emulsion and its impacts on the phase separation has not been entirely explored [3]. Through experimental investigation, the present study means to evaluate the comprehension of the separation procedure requirements and to ease the arrangement of suitable developments in the ASP application.
Numerous factors influence the stability of such emulsions [4,5,6]. (1) Oil composition, which includes the presence of asphaltene and oil phase polarity. Waxes and resins can also contribute to stability. (2) Drop size, size distribution, and hydrophobicity enhance stabilization. The oil-in-water (O/W) emulsion problem in oil-producing wells eventually becomes worse as the water cut rises [7,8]. Because of the variety in these variables, the features of the produced emulsion fluctuate with time [9]. In the presence of a surfactant in an oil/water system, the produced micro-emulsions showed a different behavior in phases with other parameters such as the temperature, pressure, and salinity [10]. The models developed for separation prediction are valid only for an oil and pure water system [11,12,13]. The addition of emulsifying agents tends to increase the crude oil recovery. However, the presence of these emulsifiers suppresses the coalescence, creaming, flocculation, and oil sedimentation and water phases. The phase inversion yields a stable interfacial film surrounding the dispersed droplets. These films are sorted into two based on their mobilities: oil/liquid and rigid/solid films [14,15]. These rigid films hinder the coalescence of droplets and result in a decrease in phase separation. Emulsion stabilization is not in thermodynamic equilibrium compared to micro-emulsions, which cause EOR flooding [16,17,18].
The presence of an external emulsifier can form a rag layer of stable emulsion. There is a need to characterize these emulsions to understand the rag layer growth under various concentrations of EOR chemicals [19,20]. This study is concerned with discussing results through experimental measurement on the effect of the ASP for EOR application in relation with the composition, water cut, separation time, and the separation process temperature. Research was conducted in the current study to determine how water separates from oil emulsions and how to stabilize it at various ASP concentrations for a known oil field in Malaysia. This work will support the separation process in fields where EOR is being executed [21]. The experimental emulsion stability test uses laser transmission and scattering techniques. The influence of different percentages of ASP injection on separation and stabilization was measured and presented in terms of the water percentage at different time intervals. Moreover, the drop in the zeta potential and viscosity of the residual emulsion were measured to evaluate the impact of ASP on the emulsion stability.

2. Materials and Methods

2.1. Crude Oils

Generally, crude oils contain a mixture of light and heavy hydrocarbons that can be classified as paraffin, naphthene, and aromatics. The lighter parts of the oils keep the more extreme elements (wax and asphaltene) in the solution. Light ends to increase the solubility of wax in crude oils, aside from depending on the pressure, temperature, and composition of the oil. The wax in crude oils is a mixture of normal hydrocarbons with different carbon number distributions, which can be identified using gas chromatography-mass spectrometry (GCMS). There are two types of wax commonly found in crude oils: macrocrystalline wax (from C18 to C36) and microcrystalline wax (from C30 to C60), which are made up of aligned paraffinic and naphthenic molecules. Paraffin waxes, also known as macrocrystalline waxes, are mainly straight-chain paraffin (n-alkanes) with varying chain lengths. In contrast, microcrystalline or amorphous waxes contain a high portion of isoparaffins (cycloalkanes) and naphthenes. The presence of these solid particles causes the change in flow behavior from Newtonian to non-Newtonian, especially paraffin waxes, which respond quickly to changes in temperature due to their straight-chain structure.

2.2. Malaysian Crude Oils

Crude oils in Malaysia have been found to contain significant quantities of wax, whereas those with high paraffin and pour point are generally classified as waxy crude. In subsea completion (where flowlines on the ocean floor range about 1.5 °C to 5 °C), each wax component becomes less soluble until the higher molecular weight components solidify. The onset of crystallization is known as the cloud point or WAT. The DSC experimental measurement shows that the WAT and wax content of the crude oil samples can be identified as presented in Table 1.
As the waxy crudes continue to cool to the temperature below WAT, the crude’s flow properties change from a simple Newtonian fluid to a two-phase dispersion non-Newtonian fluid. This results in the gelation of crudes and the loss of flowability. A total of four crude oil samples were tested from different field locations in Malaysia, namely, Miri, Penara, Angsi, and Dulang. Crude oil samples from the field locations of Penara and Dulang had a higher percentage of paraffin wax than from the field locations of Miri and Angsi. It will also directly affect the WAT as paraffin waxes react and respond quickly to temperature changes due to the linear chain structure. The higher the mol per cent of paraffin wax in a crude oil sample, the higher the WAT will be as the wax content of the crude oil samples will be indirectly affected and appear higher. Compared to the experimental measurements obtained from GCMS, the crude oil sample from Penara was proven to have the highest WAT. Due to the high mol per cent of paraffin wax, which reacts easily to temperature changes, the crude oil sample from Penara also revealed the characteristic of having the lowest crystallization temperature, followed by the crude oil sample from Dulang. Baseline computation was established to determine the total thermal effect of the wax precipitation in the crude oil samples. Using the suggested empirical formula, which shows the relationship between the heat released and the wax content, the wax content prediction from the total heat measure was obtained. The results of the wax content (wt%) for each sample are shown in Table 2.
Hence, the characterization of the paraffinic composition in crude oil samples from Miri, Angsi, Penara, and Dulang were investigated and established to assist in predicting wax precipitation at the respective field locations. The work can also be further expanded and developed to analyze more waxy crude samples from different field locations in Malaysia to assist in a deeper understanding of the behavior of the crudes and subsequently establish the most economical and practical solutions to counter the wax deposition in wells. The data of the four crude oil samples of cumulative mol percent (from C20 to C40) are shown in Table 3.

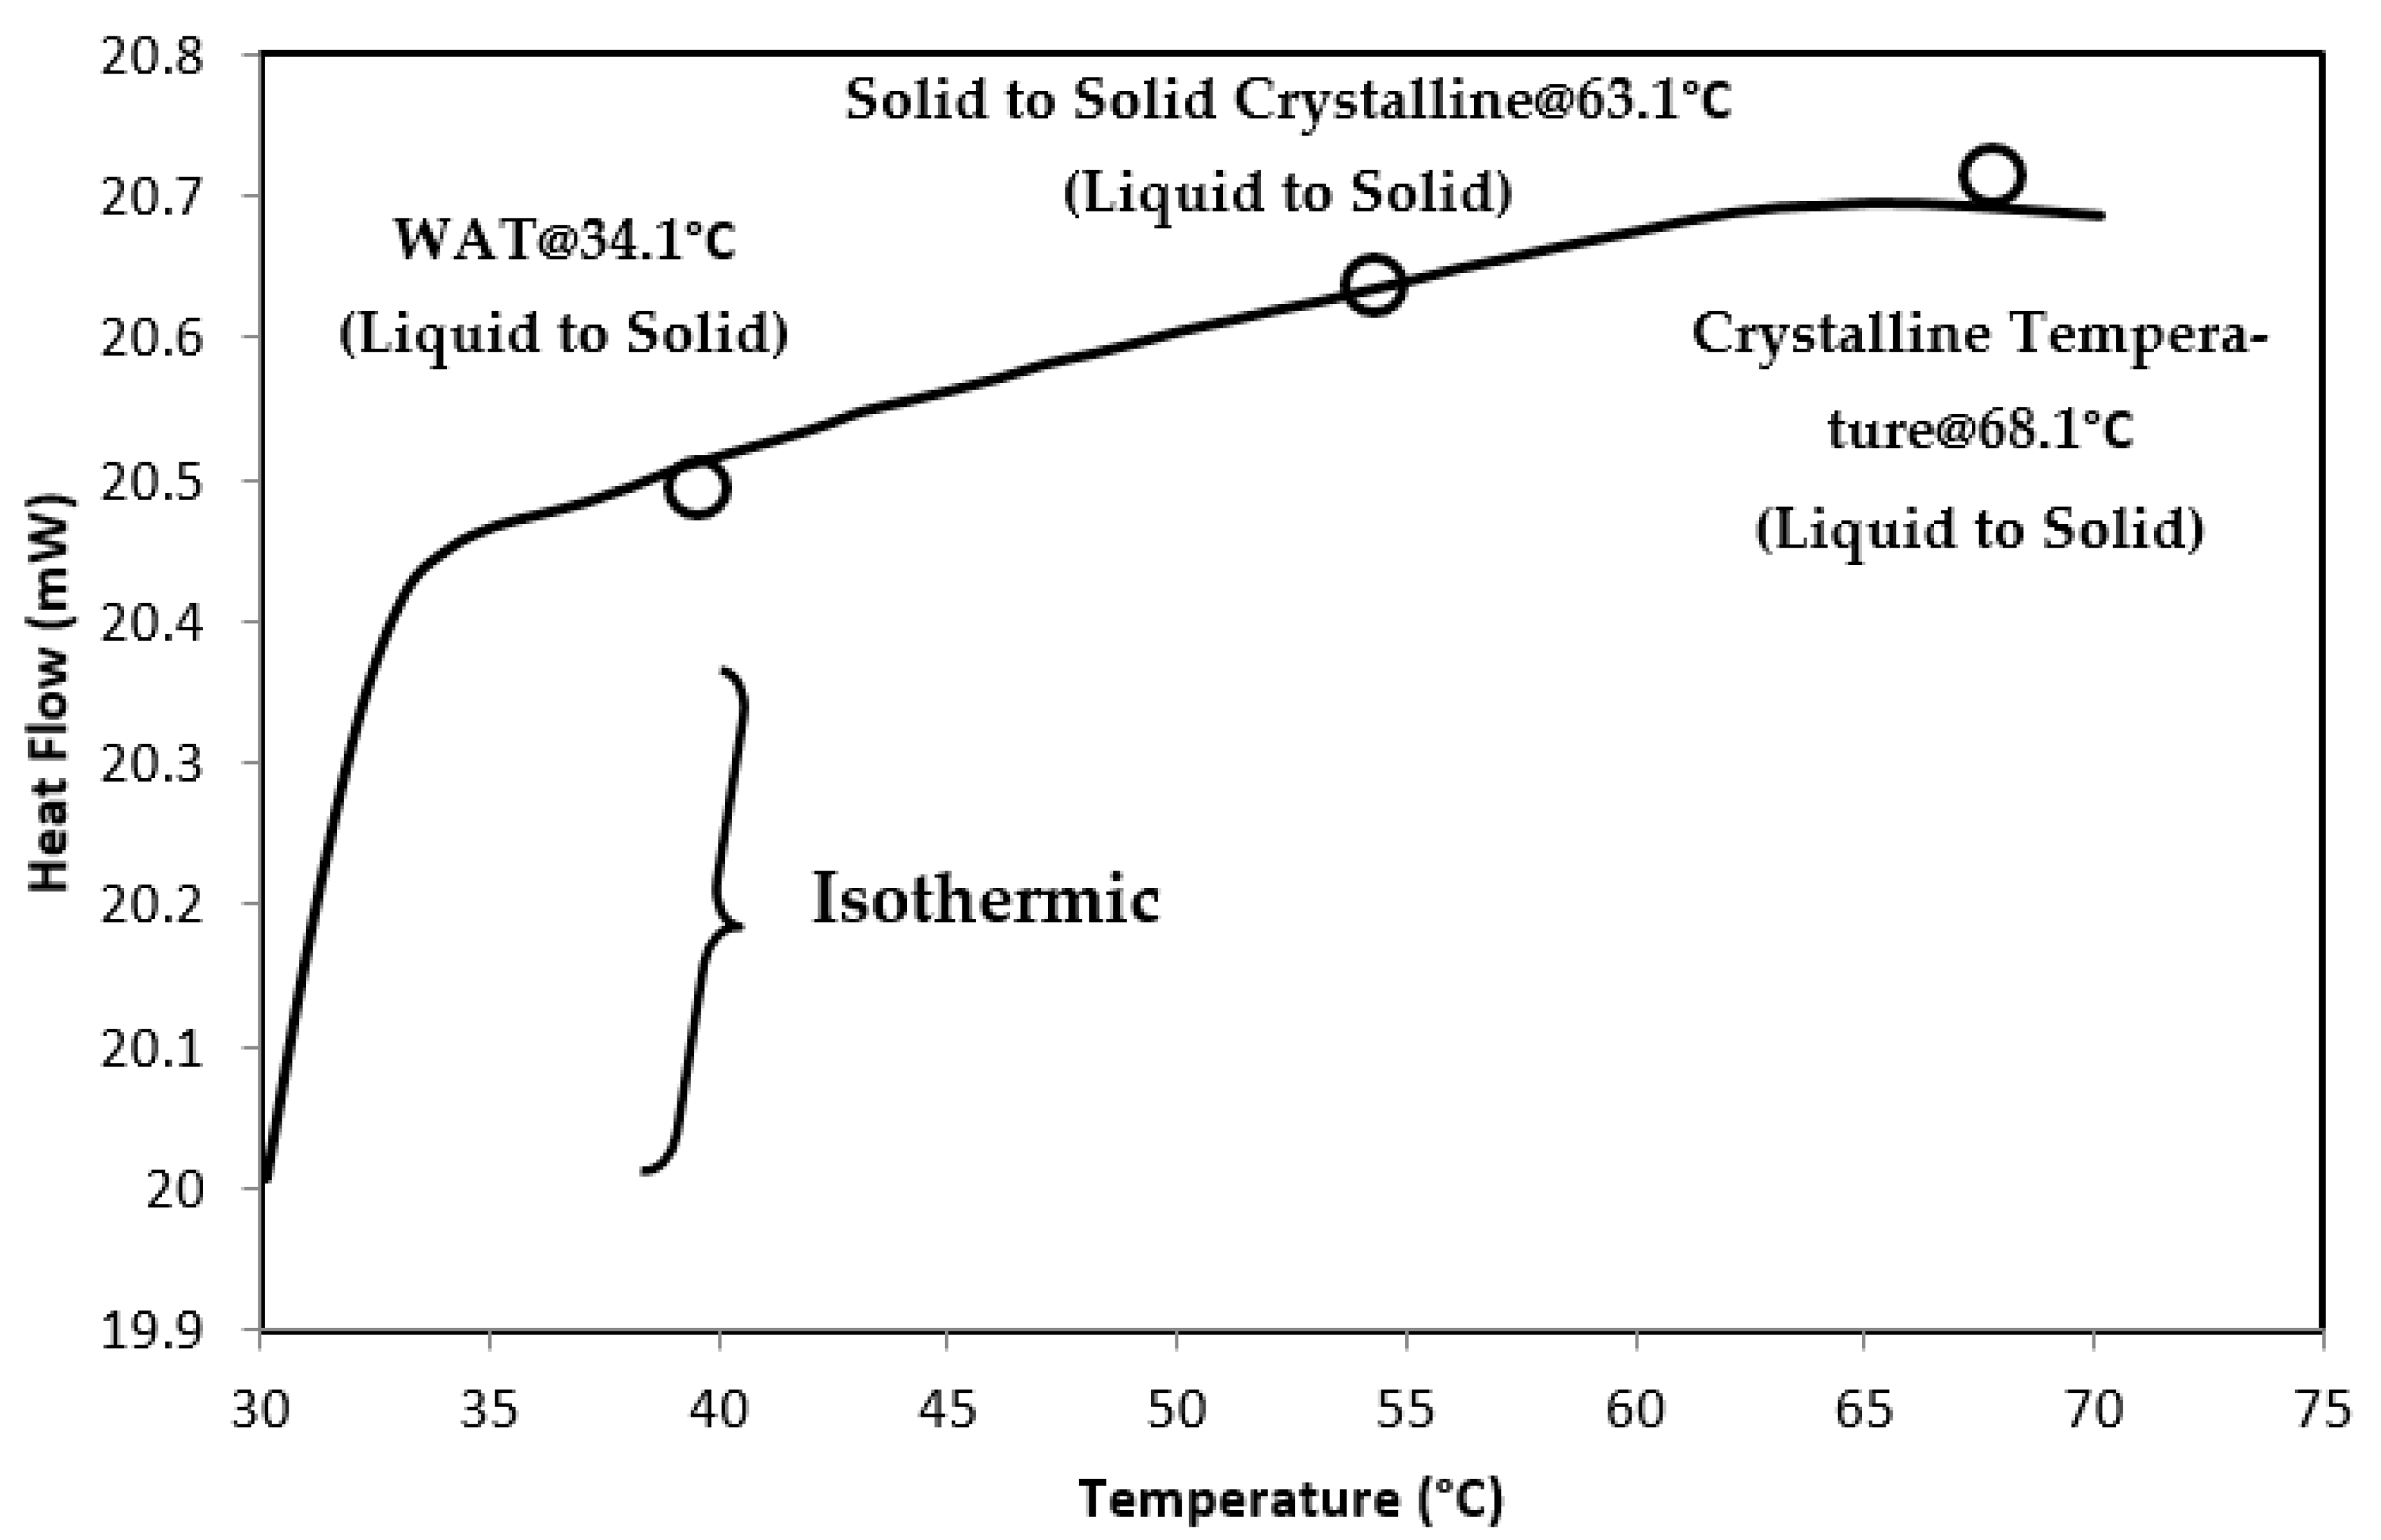
2.3. Characteristics of Angsi Crude Oil Used for Emulsion

Differential scanning calorimetry (DSC) was performed for the wax appearance temperature (WAT), and the wax content of the Angsi crude oil. Data on the wax appearance temperature, solid–solid crystalline temperature, and crystalline temperature for the crude oil samples are presented in Figure 1.
For this study, crude oil and reservoir brine were obtained from an identified field in Malaysia where water flooding was performed. Crude oil has a high wax and density of 42 API with a live oil viscosity of 0.4 cP. The properties and mole in each carbon number in Angsi crude oil are listed in Table 4 and Table 5.

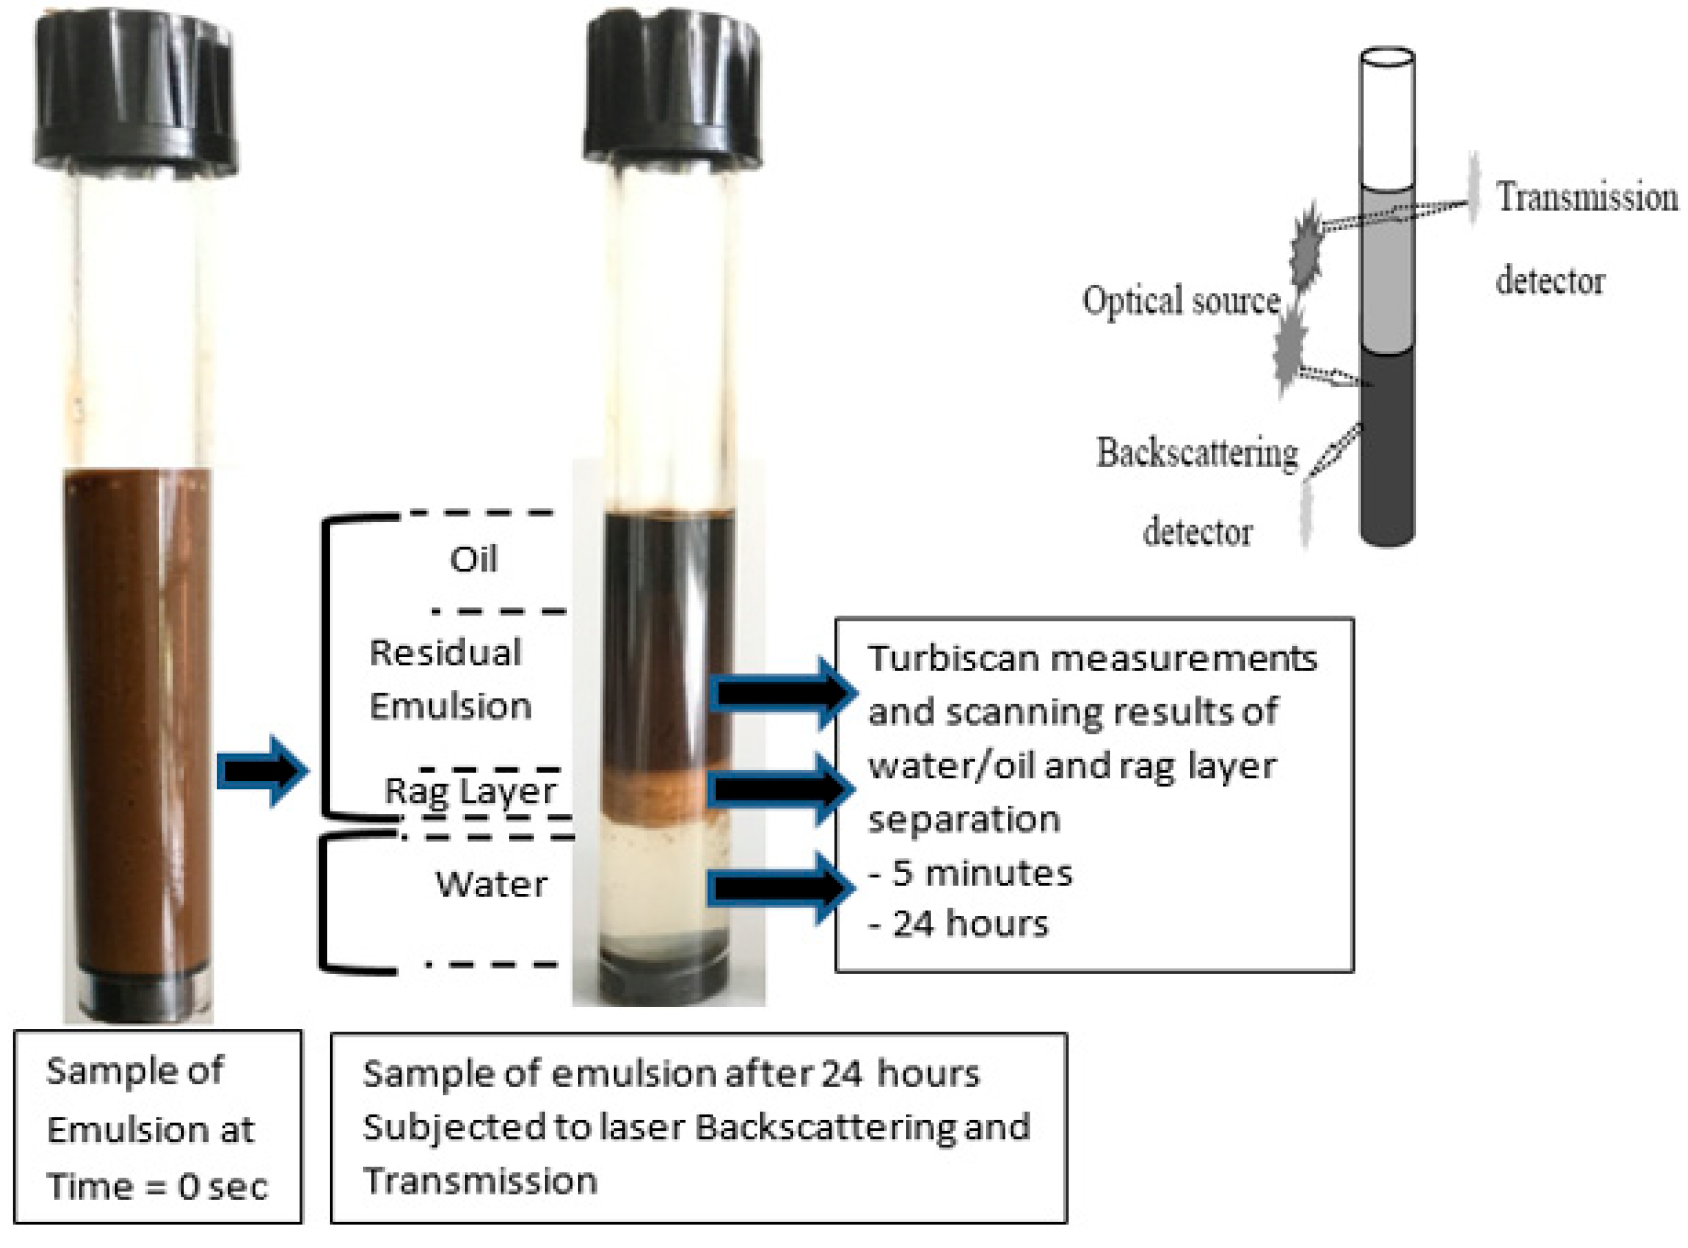
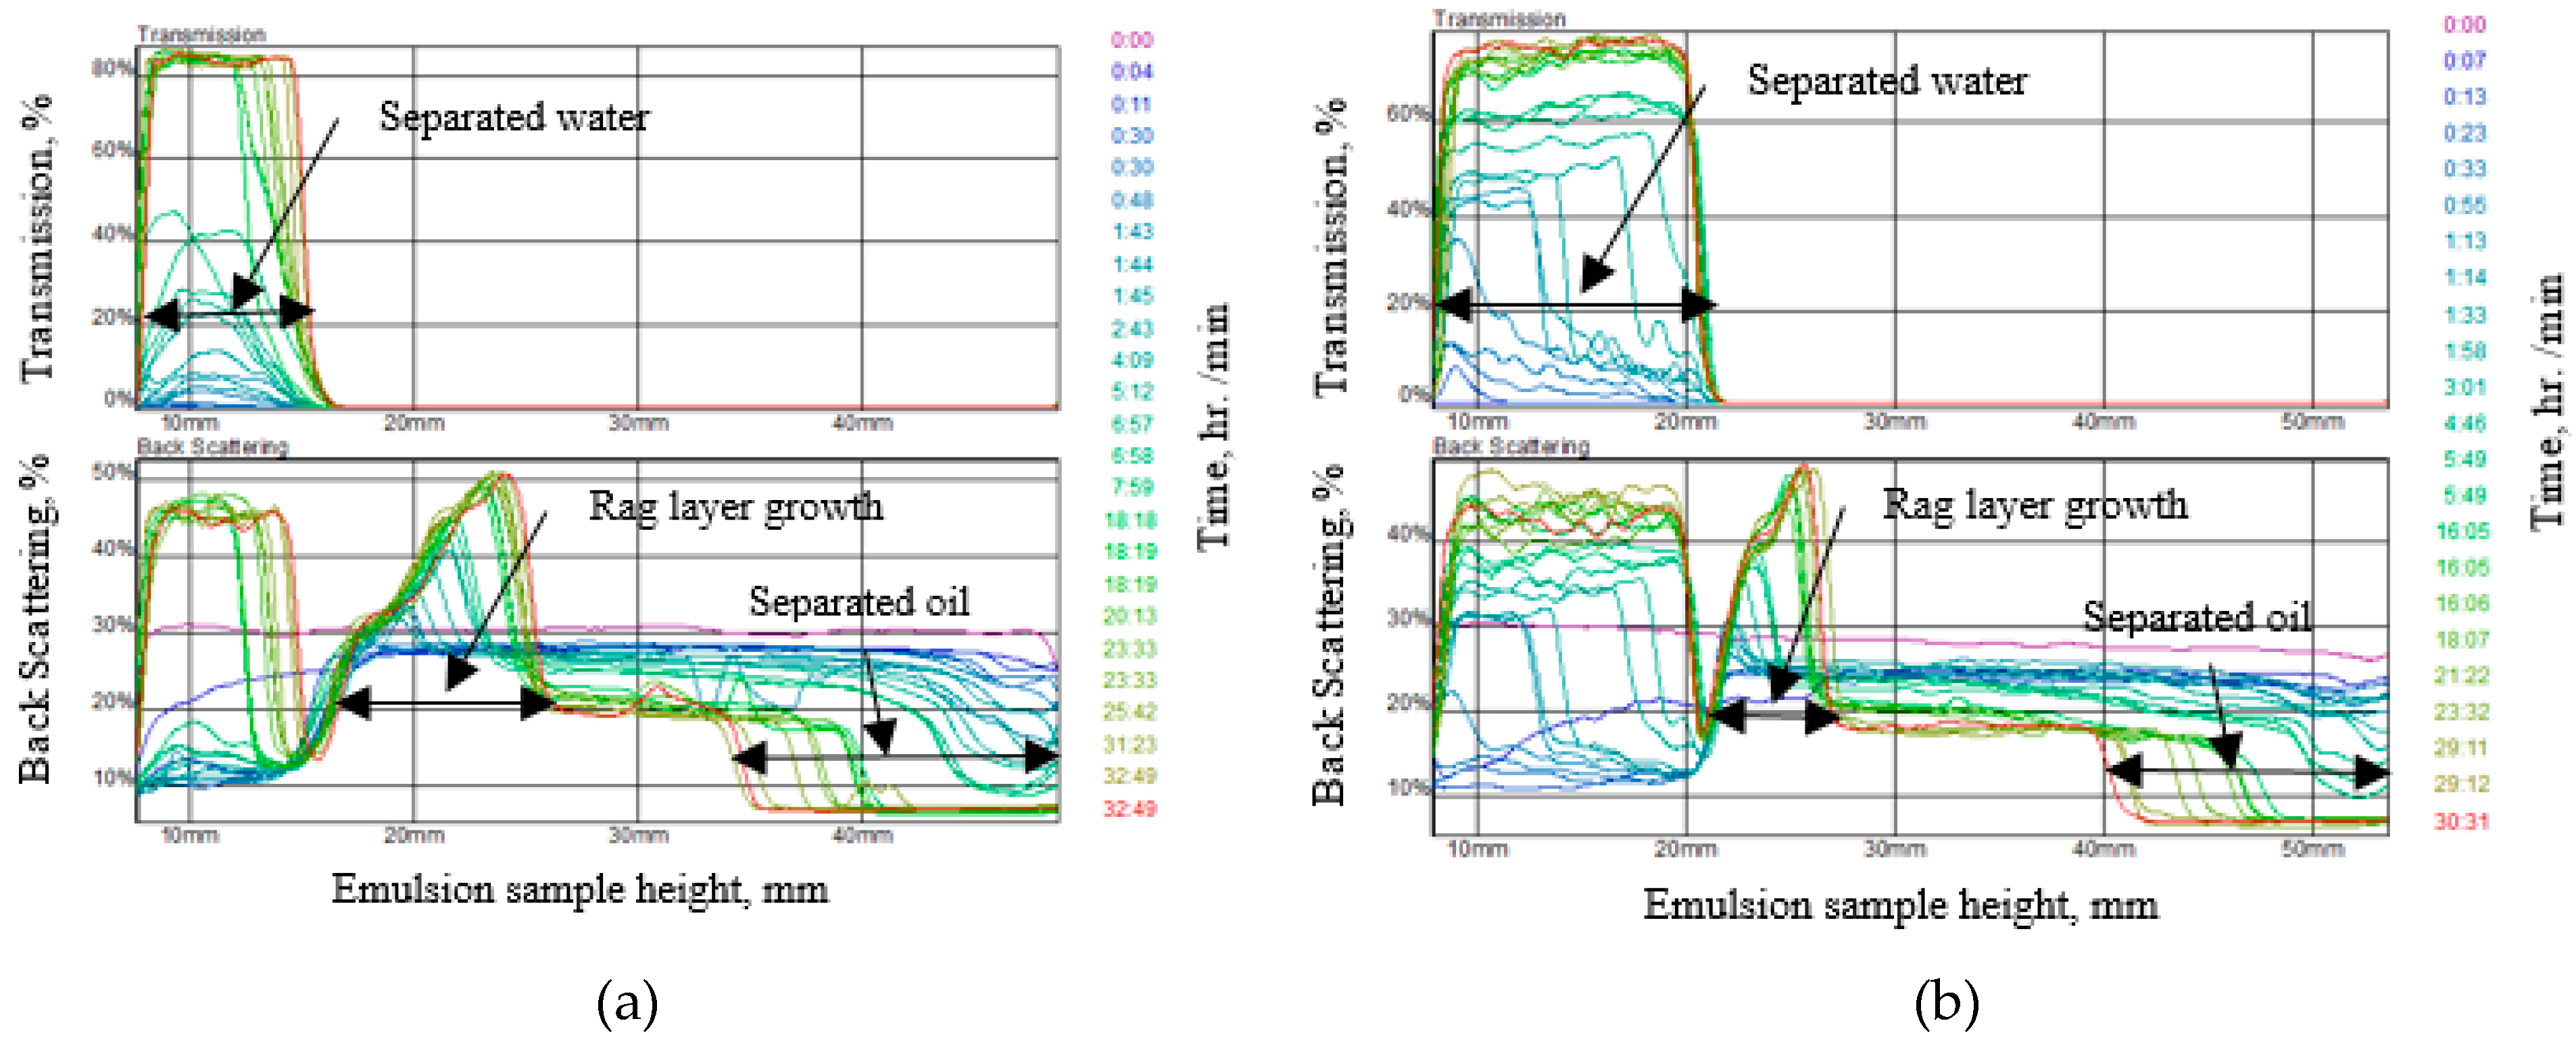
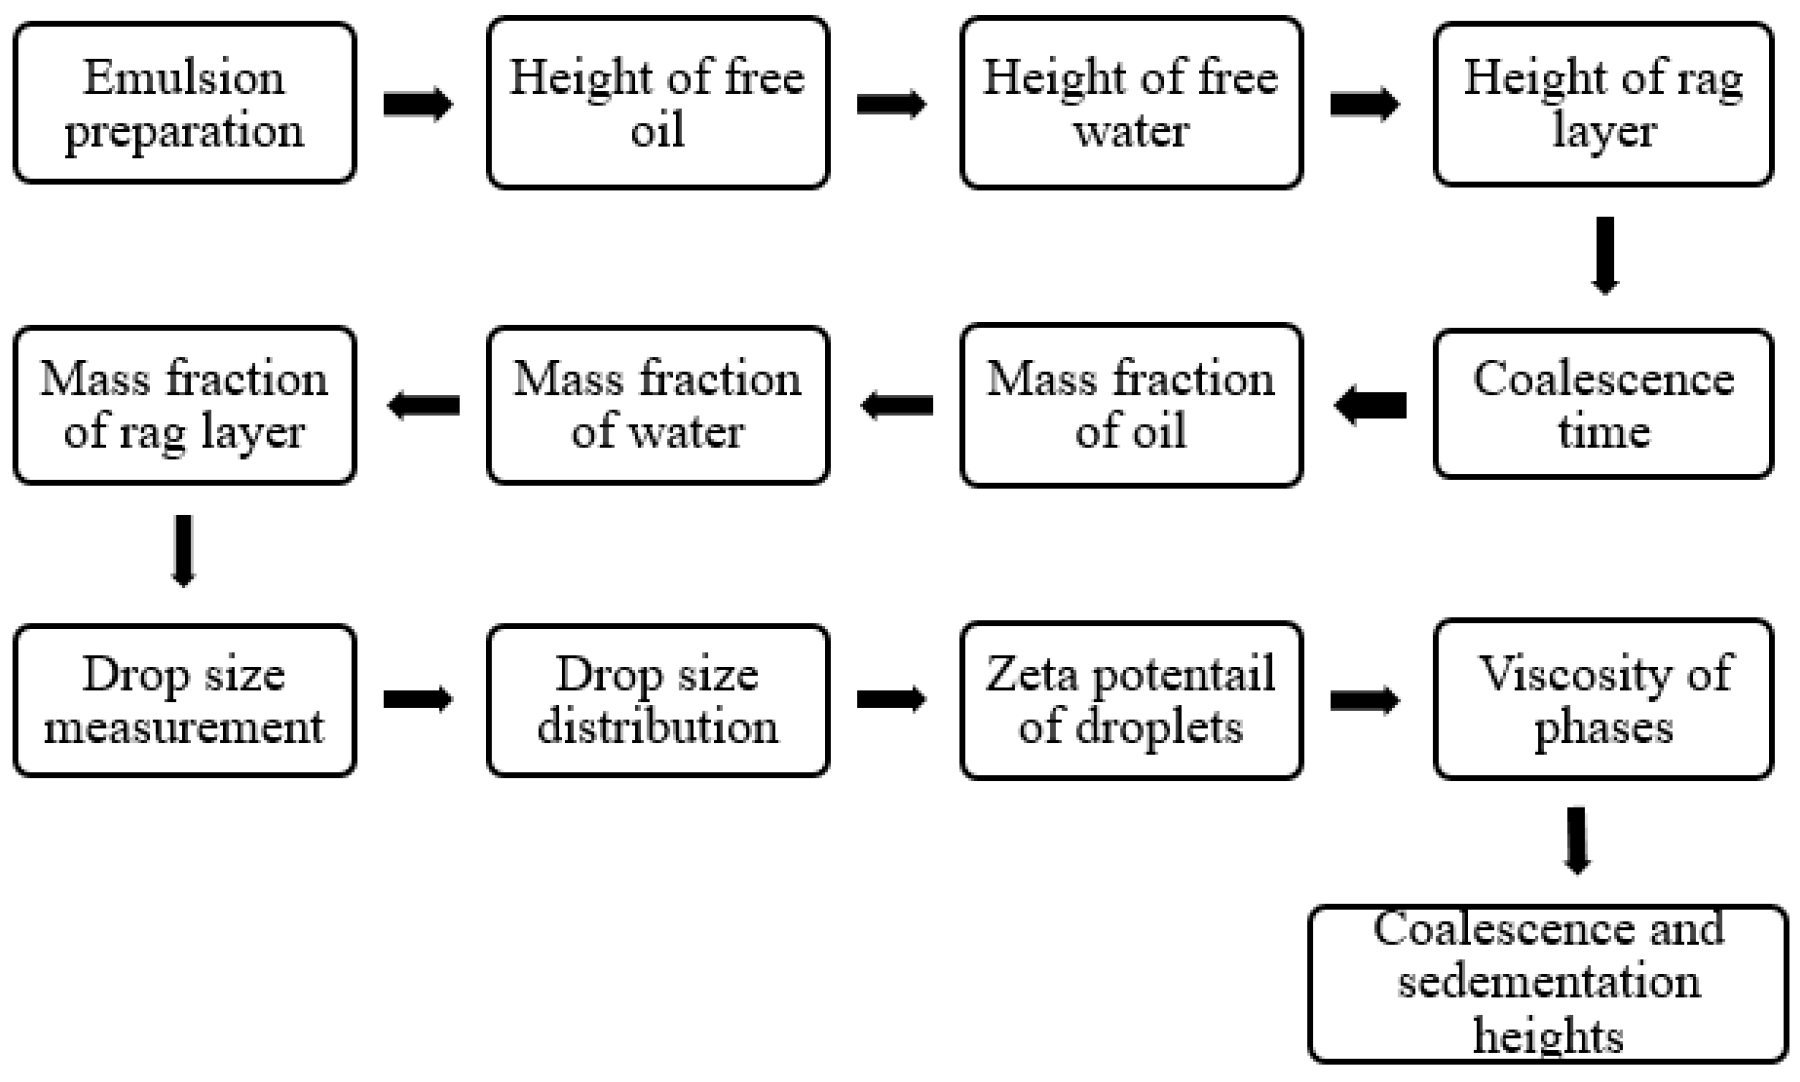
2.4. Emulsion Stability Test

The Turbiscan method was used in the current work to measure the stability of the emulsion utilizing a laser transmission and backscattering methodology. The procedure of emulsion preparation was adopted from a previous study using 12,000 rpm for 2 min at the total ASP injections in the separator, as shown in Table 6 [22,23].
A laser transmission and backscattering technique was used, which can precisely measure the amount of dispersed phase. This method has been recently used for the characterization of the stability of the emulsion [22,23,24]. Figure 2 shows the principle of laser light scattering and transmission to measure the sedimentation and coalescence heights from the emulsion samples. Once the homogeneous emulsion was prepared, the stability was measured, as described in Figure 3.
Figure 3 depicts the method for measuring the coalescence and sedimentation in an emulsion sample.

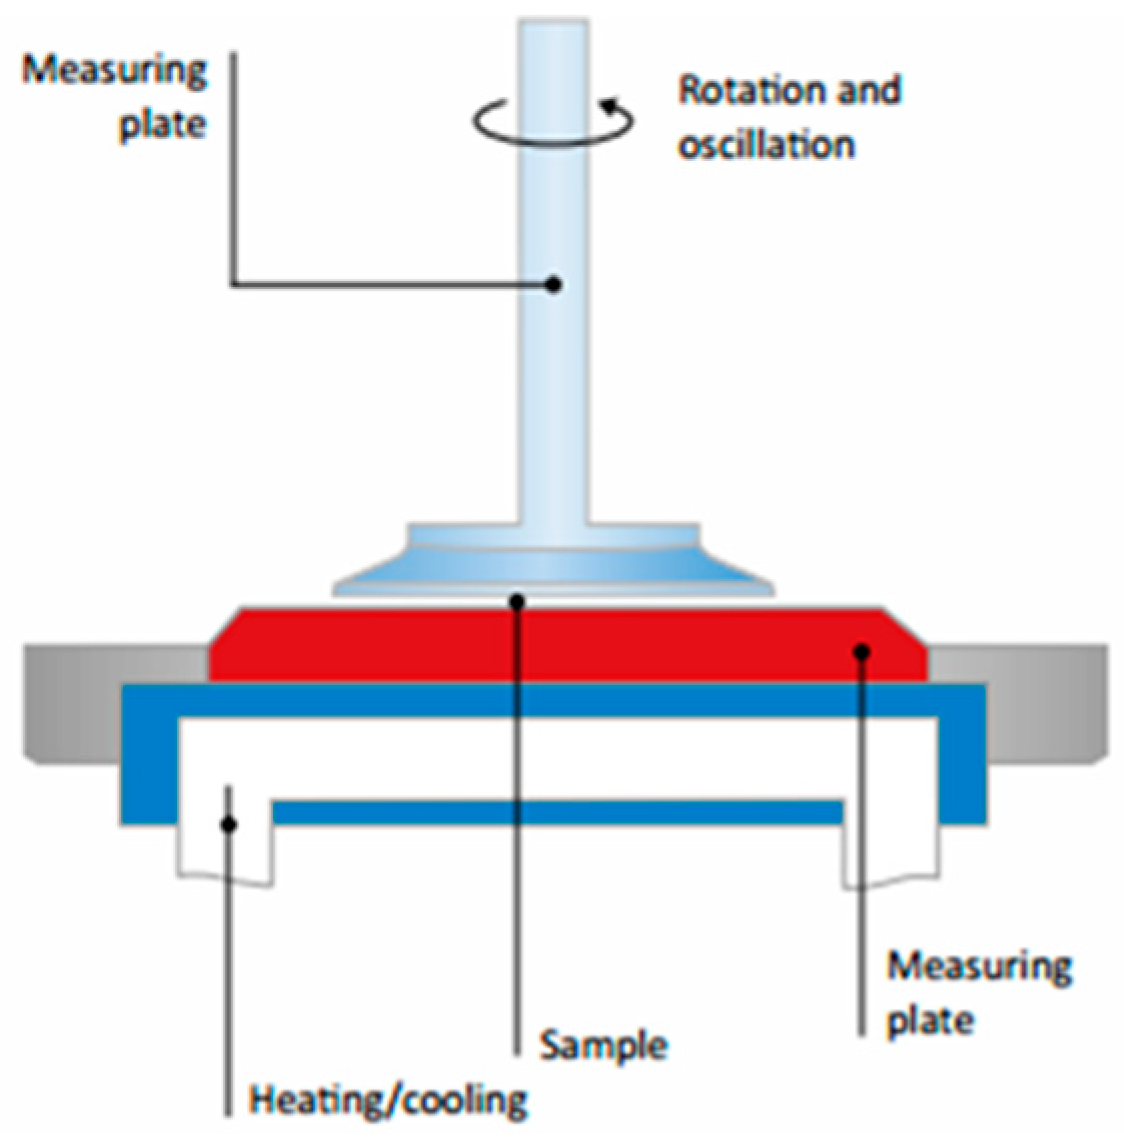
2.5. Rheology Measurement

Studies on the rheological behavior of water-in-oil emulsions include the relationship between the dynamic viscosity and the shear rate at different temperatures and ASP concentrations. The dynamic viscosity of the emulsions was measured using a rotational and oscillatory rheometer (Anton Paar, MCR 302) at different shear rates (0–100 S−1) and temperatures (60 °C). The plate geometry was used for all emulsion samples, as shown in Figure 4.

2.6. Zeta Potential Measurement

A Malvern Zetasizer was used to measure the zeta charges of the dispersed droplets in the emulsion. A capillary tube was filled with the residual emulsion sample and inserted in the Zetasizer to measure the surface charge on the droplets, as shown in Figure 5. The zeta potential is a tool to measure the disperse phase stability in an emulsion. The greater the zeta potential, more stable the emulsion. When the potential of droplets in the emulsion is greater than or around ±30 mV, the droplets become stabilized and avoid phase separation. Presence of an electric field in the capillary tube and computing the velocity of charged droplets and by means of ultrasound waves, the motion of the droplet is created and then the potential of the moving droplets was measured in the ways carried out in zeta potential analyzers.

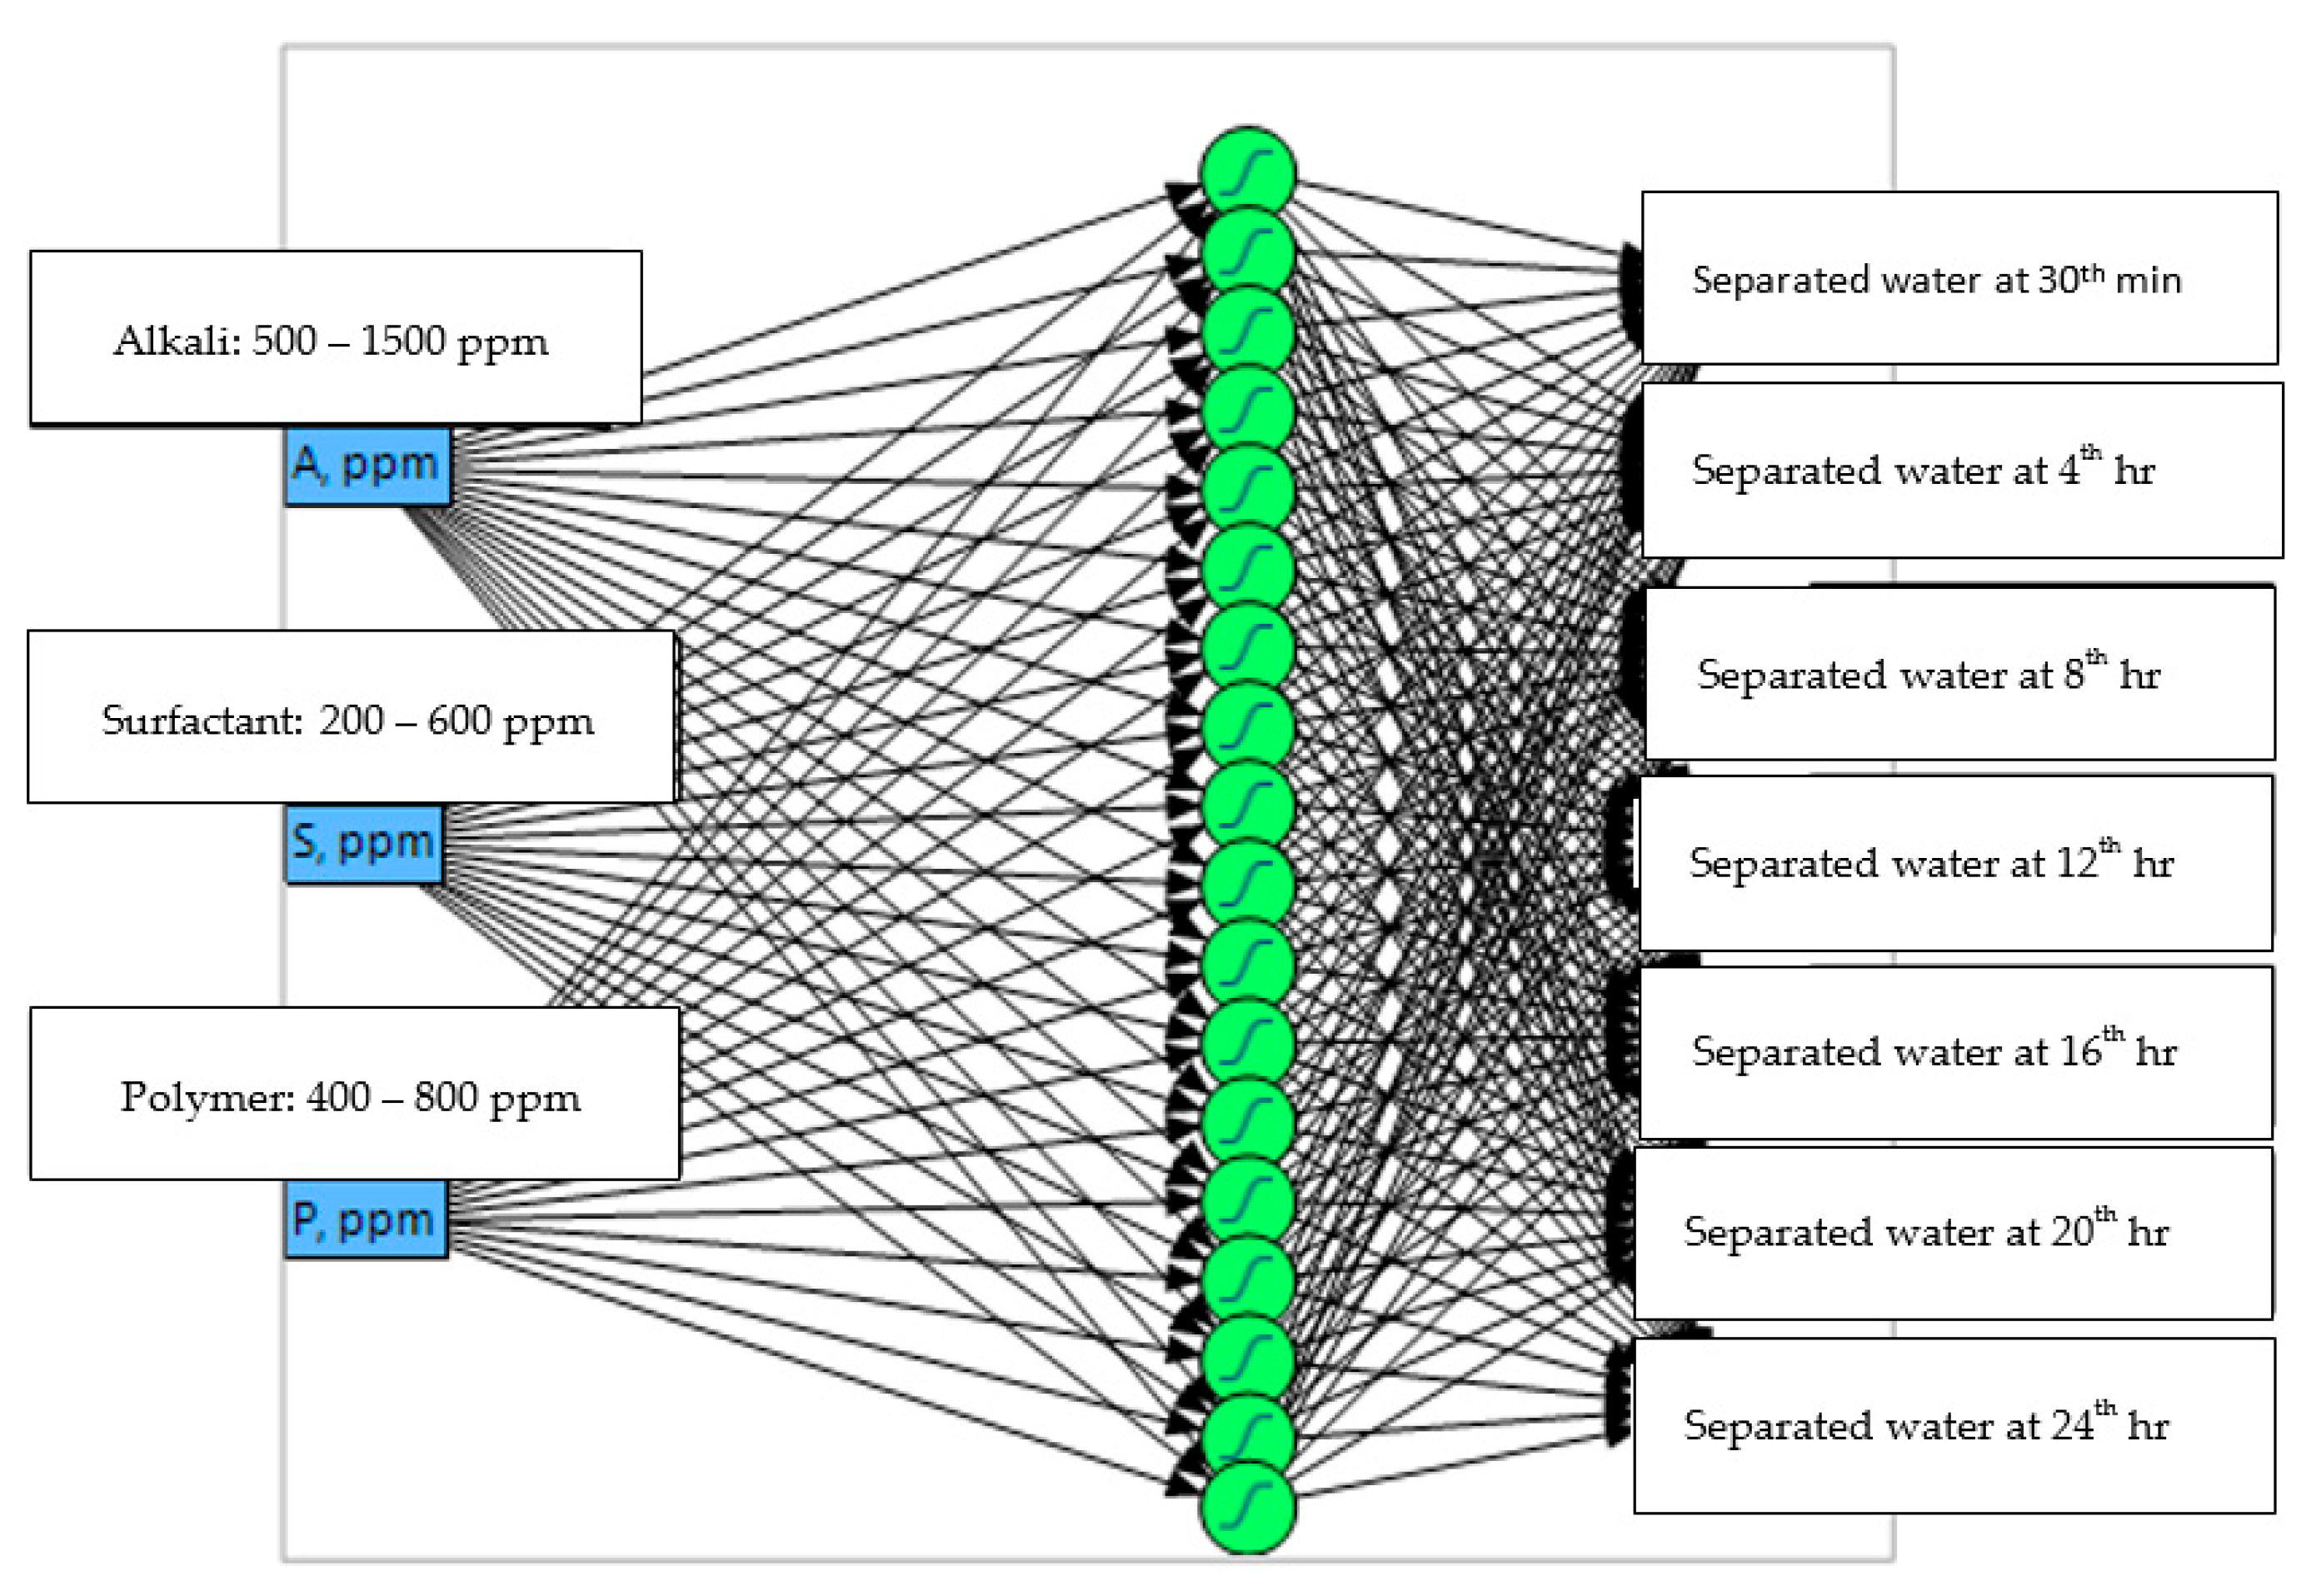
2.7. Artificial Neural Network Methodology

This prediction technique was carried out to model a separation process in which computational methods are expensive. Hence, the objective of this work was to present the results of separation prediction using the artificial neural network (ANN) model. ANN programming was carried out to predict the effectiveness of the ASP in the separation/stabilization of water from the emulsion. The experimental data confirm the model’s prediction capability with the training and validation.

2.8. Procedure for Artificial Neural Network Model

The main focus of the present study was to propose a method to predict the effectiveness of each factor on separation at various concentrations of each additive found in the breakthrough of the separator. This predictive study was based on the numerical technique of the separation process by an ANN. Various network topologies were used to find the best network for the effectiveness of ASP on separation. The model predictions were then compared with the separation prediction profiles of the correlations and actual data obtained from the statistical model. Numerous artificial neural network formations were deliberated with a hidden layer of varying activation functions and nodes to find the best model for predicting the water separation in the primary separator. The neural network training was carried out using the experimental data of water separation with laser transmission and backscattering through the emulsion samples. Both linear and nonlinear activation functions were used in the models, and higher accuracy was achieved for the nonlinear function in separation prediction. Moreover, one hidden layer with 18 nodes on the hidden layer provided the most accurate fitness. The model predicted an average separation of 48% at the 24-h interval with the existence of alkali, surfactant, and polymer ranges (500–1500 ppm, 200–600 ppm, and 400–800 ppm). The developed correlations had a good prediction of water separation as the coefficient of variation and corresponding significance of the model were R2 = 0.88 and p = 0.03, respectively.

2.9. Development of Artificial Neural Networks Model

For the ANN model development, three process parameters including the alkali concentration (500–1500 ppm), surfactant concentration (200–600 ppm), and polymer concentration (400–800 ppm) were considered as inputs. Water separation was measured at 30 min to 24 h. In the results and discussion, separation at 24 h is presented as the aquarium state of separation in 24 h, and it also shows the final effectiveness of the ASP. The boosted neural network is shown in Figure 6.

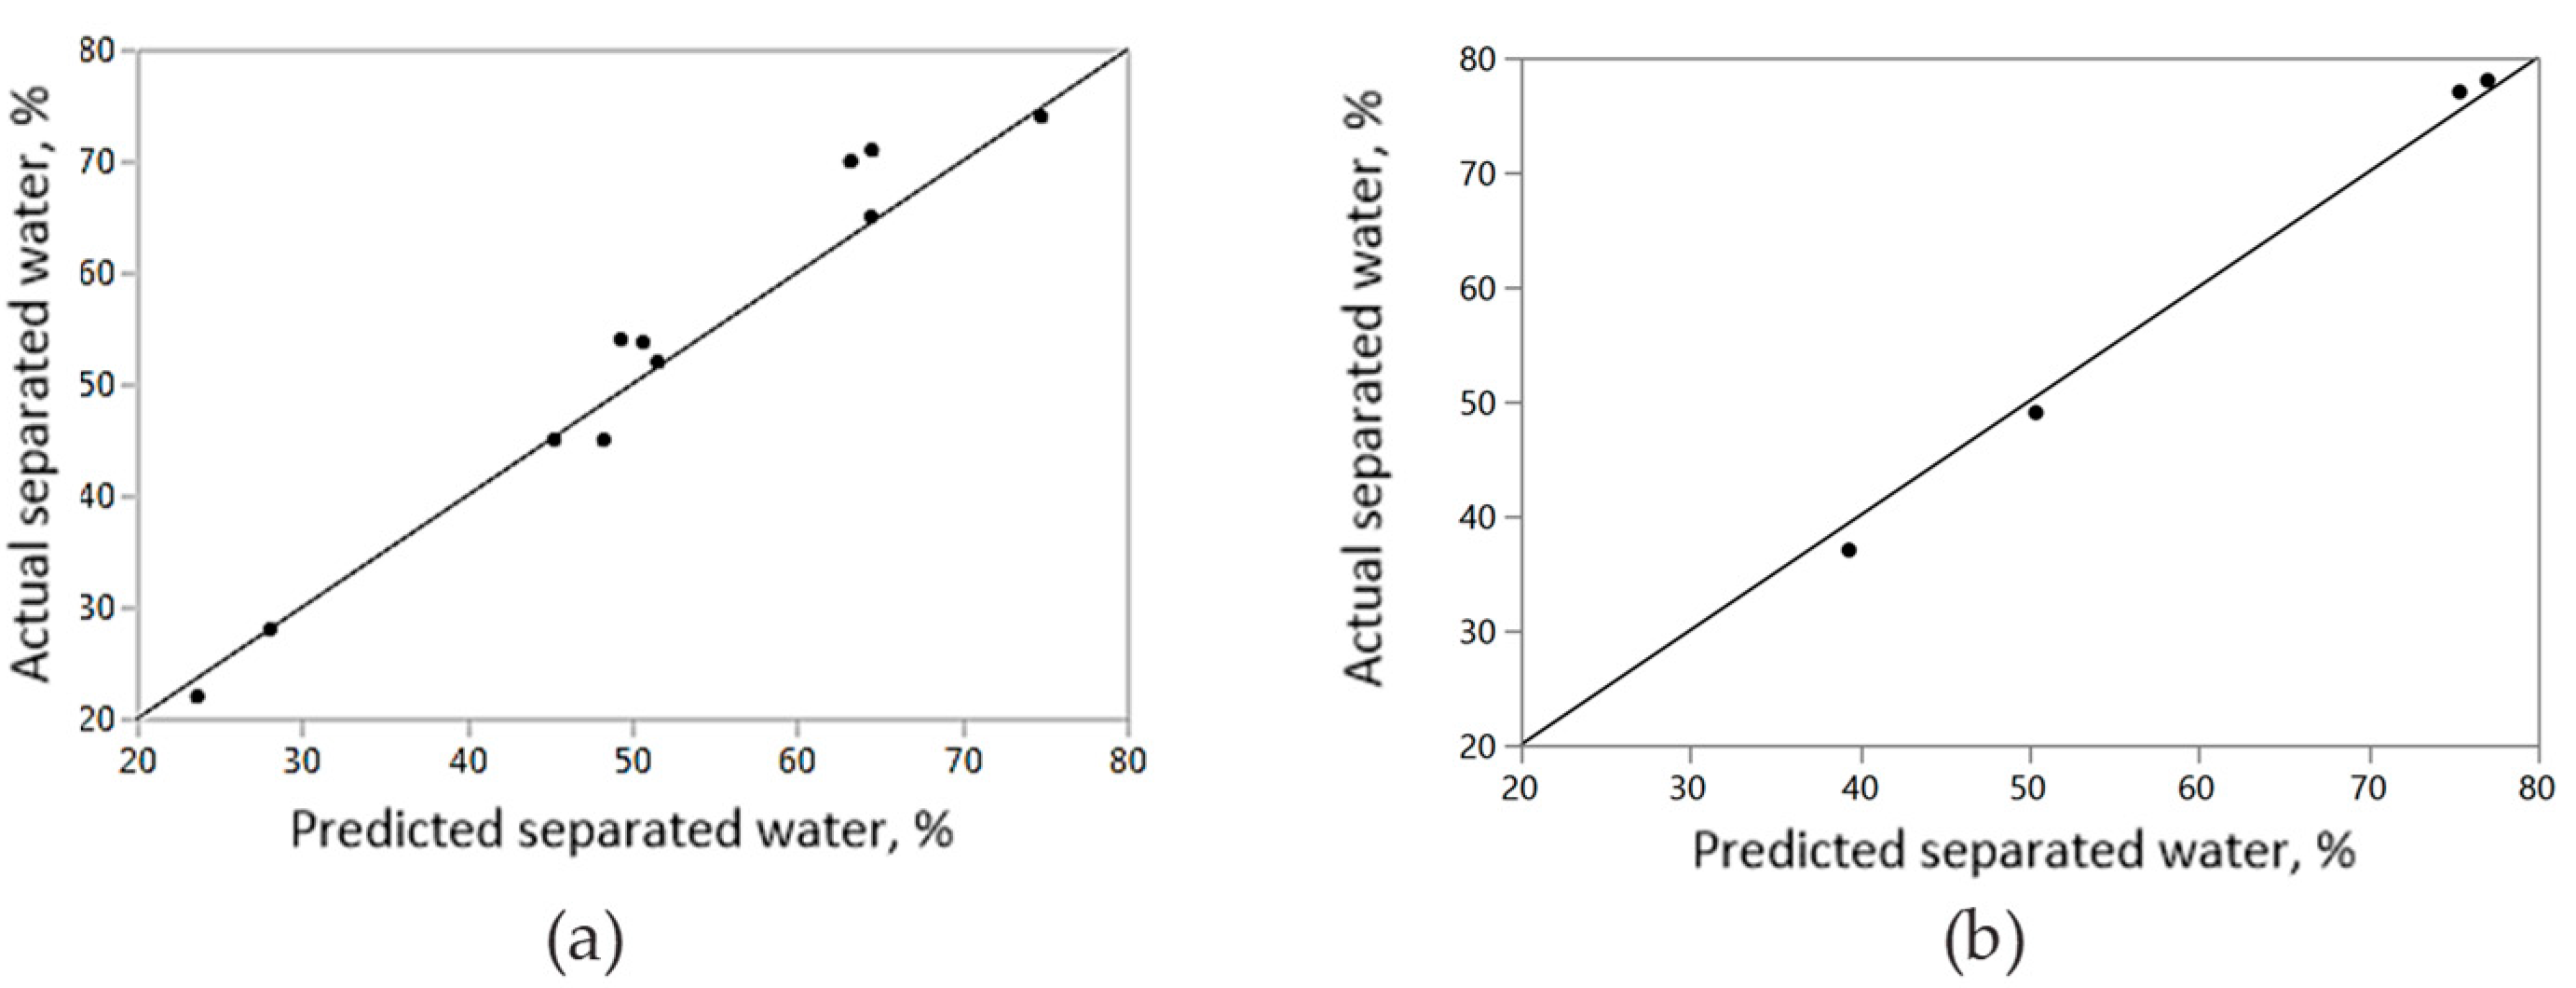
2.10. Determination of Hidden Layers, Nodes, and Validation

One hidden layer and eighteen nodes were used to develop the ANN model. An activation function was essential for the hidden layer to estimate the response value. The activation function was applied at each hidden layer node. In the present work, linear and nonlinear activation functions were considered. The linear combination of input variables was not required to transform, whereas for the nonlinear combination, the transformation was carried out by the hyperbolic tangent function (Tan H) as follows [25].
f ( x ) = T a n H ( x ) = 2 1 + e 2 x 1
where x is a linear combination of inputs up to two nodes considered for a hidden layer.
The residuals of fittings for training and validation are shown in Figure 7a,b. The established ANN can predict the impact of various parameters on the separation/stabilization of water from the emulsion with high accuracy.
Table 7 shows the parameters of the fitting training and validation of the ANN model. The ANN model had an acceptable prediction of water separation as it had a coefficient of variation R2 = 0.95 and R2 = 0.99 for training and validation, respectively.

3. Results and Discussion

3.1. Emulsion Stability with Alkali

The effectiveness of the alkali at constant concentrations of surfactant and polymer is presented in this section. Figure 8 illustrates the emulsion kinetic curves of the water droplet sedimentation and oil droplet coalescence. The fraction of light transmitted and backscattered was used to calculate the separated water, oil separated, and rag layer growth. Figure 8a,b shows that the emulsion was found to be stable at low alkali concentrations as there was no transmission of light within 10 min. The percentage of light transmission (clarity of separated water) was found to be 63% and 50% in the presence of low and high alkali, respectively. The increase in the light transmission value shows that there were high coalescence phenomena at a high alkali concentration. For instance, an increase in alkali started the reaction with the oil, which led to an increase in the coalescence of the droplets. Separated water calculated from the light of transmission was 22% and 33% at a low and high concentration of alkali, respectively, at 24 h. The interaction effect of a very high alkali concentration with a surfactant of the same type was studied. It was noticed that IFT was reduced significantly, resulting in a much-stabilized emulsion [26,27].
The backscatter in the middle of the samples in Figure 7a,b showed that the growth height of the rag layer was 17.8 mm and 16.3 mm at low and high alkaline concentrations, respectively.

3.2. Emulsion Stability with Surfactant

Laser scan measurements of the emulsion sample over 24 h are shown in Figure 9. Light transmission shows that the low and high surfactants separated 61% and 35% of the water, respectively. With increasing surfactant, the separation had a negative impact. The separated water clarity was about 80% for both compositions. The separation measurements showed that the oil/water separation was significantly reduced with the increase in the surfactant. Hirasaki et al. [28] explained the reason why the surfactant stabilized the emulsion: at a higher surfactant concentration, the solubilization of oil and water form type III, which is suitable for increasing the oil recovery. However, a high concentration of surfactant is required. Shupe [29] showed that anionic surfactants stabilized the emulsion for numerous crude oils in reservoir conditions, though was not as stable and effective at high alkali concentrations.
Low backscatter measurements showed that oil droplet creaming was higher at low surfactant concentrations than at high surfactant concentrations. Therefore, the formation of the rag layer was also high with an increasing surfactant concentration, which was 7.1 mm and 11 mm at the low and λ surfactant concentrations, respectively.

3.3. Emulsion Stability with Polymer

In this section, the effectiveness of the polymer was studied at fixed concentrations of surfactant and alkali. The impact of the polymer on the emulsion and rag layer is revealed in Figure 10. The emulsion was not stable without ASP, and was characterized as a medium emulsion according to the literature review of the emulsion study [3]. Separation occurred significantly in the first 4 h, around 55% in both cases. After 24 h, 73% and 76% water were separated at 60 °C and 70 °C, respectively.
The separated percentages of water from the emulsion after an equilibrium time of separation (24 h) are shown in Table 8. Regarding real applications in the field, a response surface was considered to optimize the alkali and surfactant concentrations in the clastic reservoir of the Angsi field in the Malay basin, as described in the published works of Ghadami et al. [27]. In addition, the experimental results were compared with the existing analytical model [30]. It can be seen that as the coalescence was reduced, the time of separation was significantly increased, and sedimentation of ASP-produced emulsions showed agreement with the existing model. In this study, various trends for different ASP concentrations were recorded and compared with Jeelani and Hartland [11]. Significant differences in the experimental data and model were recorded in the coalescence and sedimentation profiles at various ASP concentrations. Through a comparison of both profiles, constants for coalescence and sedimentation were recorded, which fit the data with the model. In addition, the capability of the statistical model to predict constants for the coalescence and sedimentation of the oil-in-water emulsion in the presence of ASP was explored. Next, a correlation was generated by incorporating all of the experimental results, which could estimate the constants for coalescence and sedimentation [14,31].

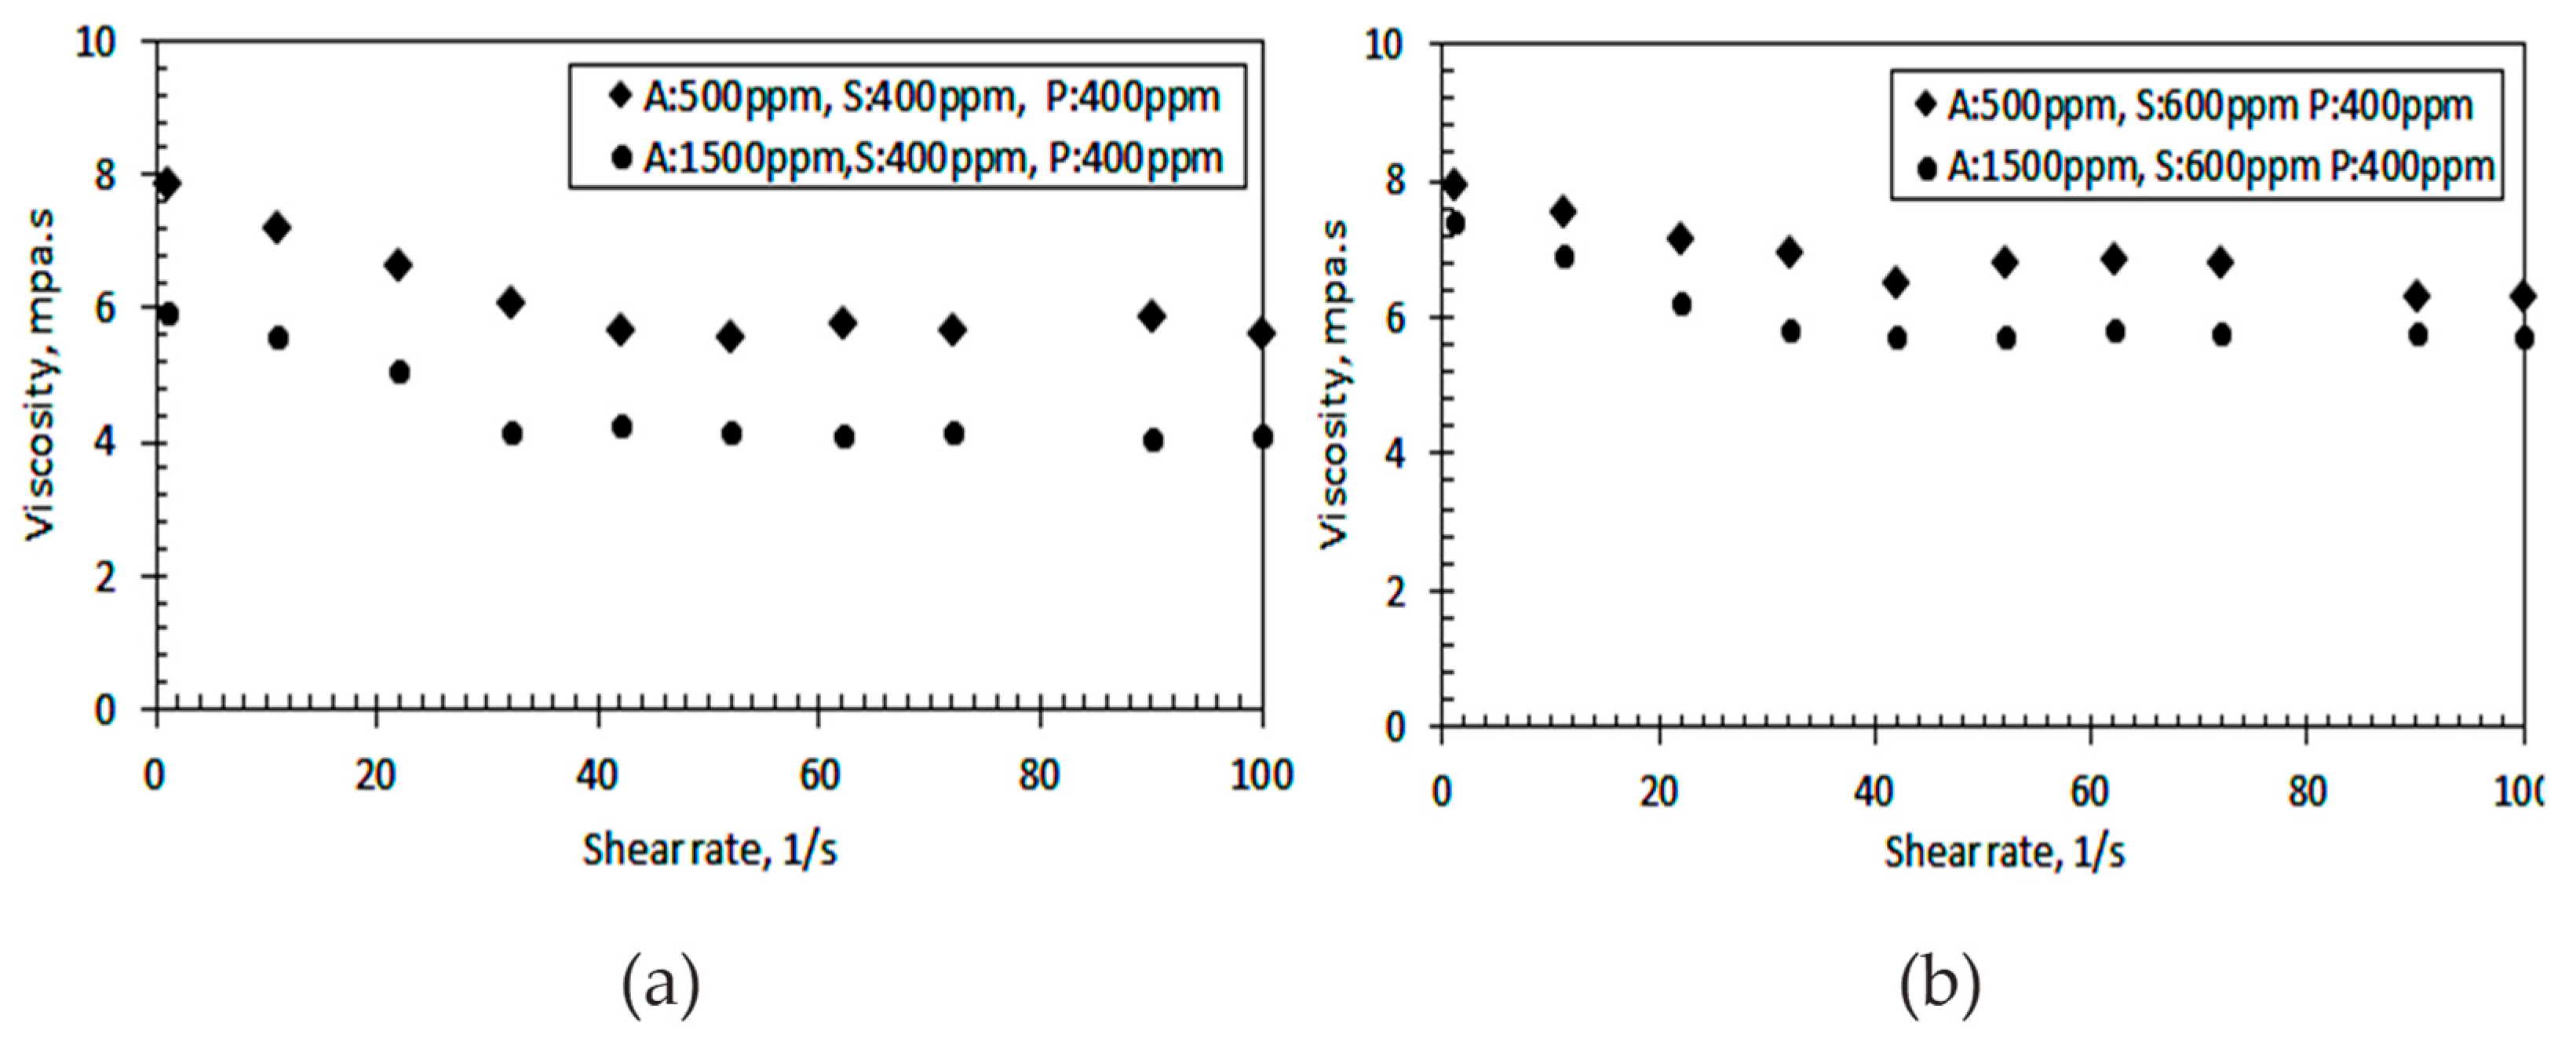
3.4. Viscosities of Residual Emulsion

Figure 11 shows the variation in the residual emulsion viscosity at the various components of ASP at a temperature of 60 °C and 40% water cut. It was found that the viscosity of the residual emulsion decreased with the alkali, as presented in Figure 11a,b. A decrease in the viscosity at high alkali concentration correlated with the Turbiscan test; a higher separation was observed in the presence of high alkali. Viscosity measurements showed an increase in viscosity at high surfactant concentrations. Therefore, water separation was suppressed with the increase in surfactant concentration. There was a slight shear thinning behavior of the emulsion with an increase in the shear rate. The decrease in the viscosity of the emulsion, however, was insignificant, with the increase in the shear rate ranging from 40 s−1 to 100 s−1.
The results showed viscosity as a function of shear rate in various ASP compositions (Table 9 and Table 10). The viscosities were measured at the shear rate of 1–100 s−1 and a constant temperature of 60 °C. Viscosity measurements were 7.9 mPa-S and 6.0 mPa-S with increasing alkali. Next, the viscosities were 8.0 mPa-S and 7.4 mPa-S at 500 ppm alkali and 1500 ppm alkali, respectively, in the presence of a surfactant concentration of 600 ppm. Alkali revealed a reduction in the viscosity of emulsions in the presence of low and high concentrations of surfactants at 400 ppm and 600 ppm, respectively. Compared to alkali, the surfactant showed a stabilizing effect on the emulsion. Viscosity measurements were 6.0 mPa-S and 7.4 mPa-S in the presence of 400 ppm and 600 ppm of the surfactant, respectively, at a higher alkali concentration of 1500 ppm. At a high surfactant concentration, a strong micro-emulsion was produced, hence, viscosity was increased and showed significant results in emulsion stability.

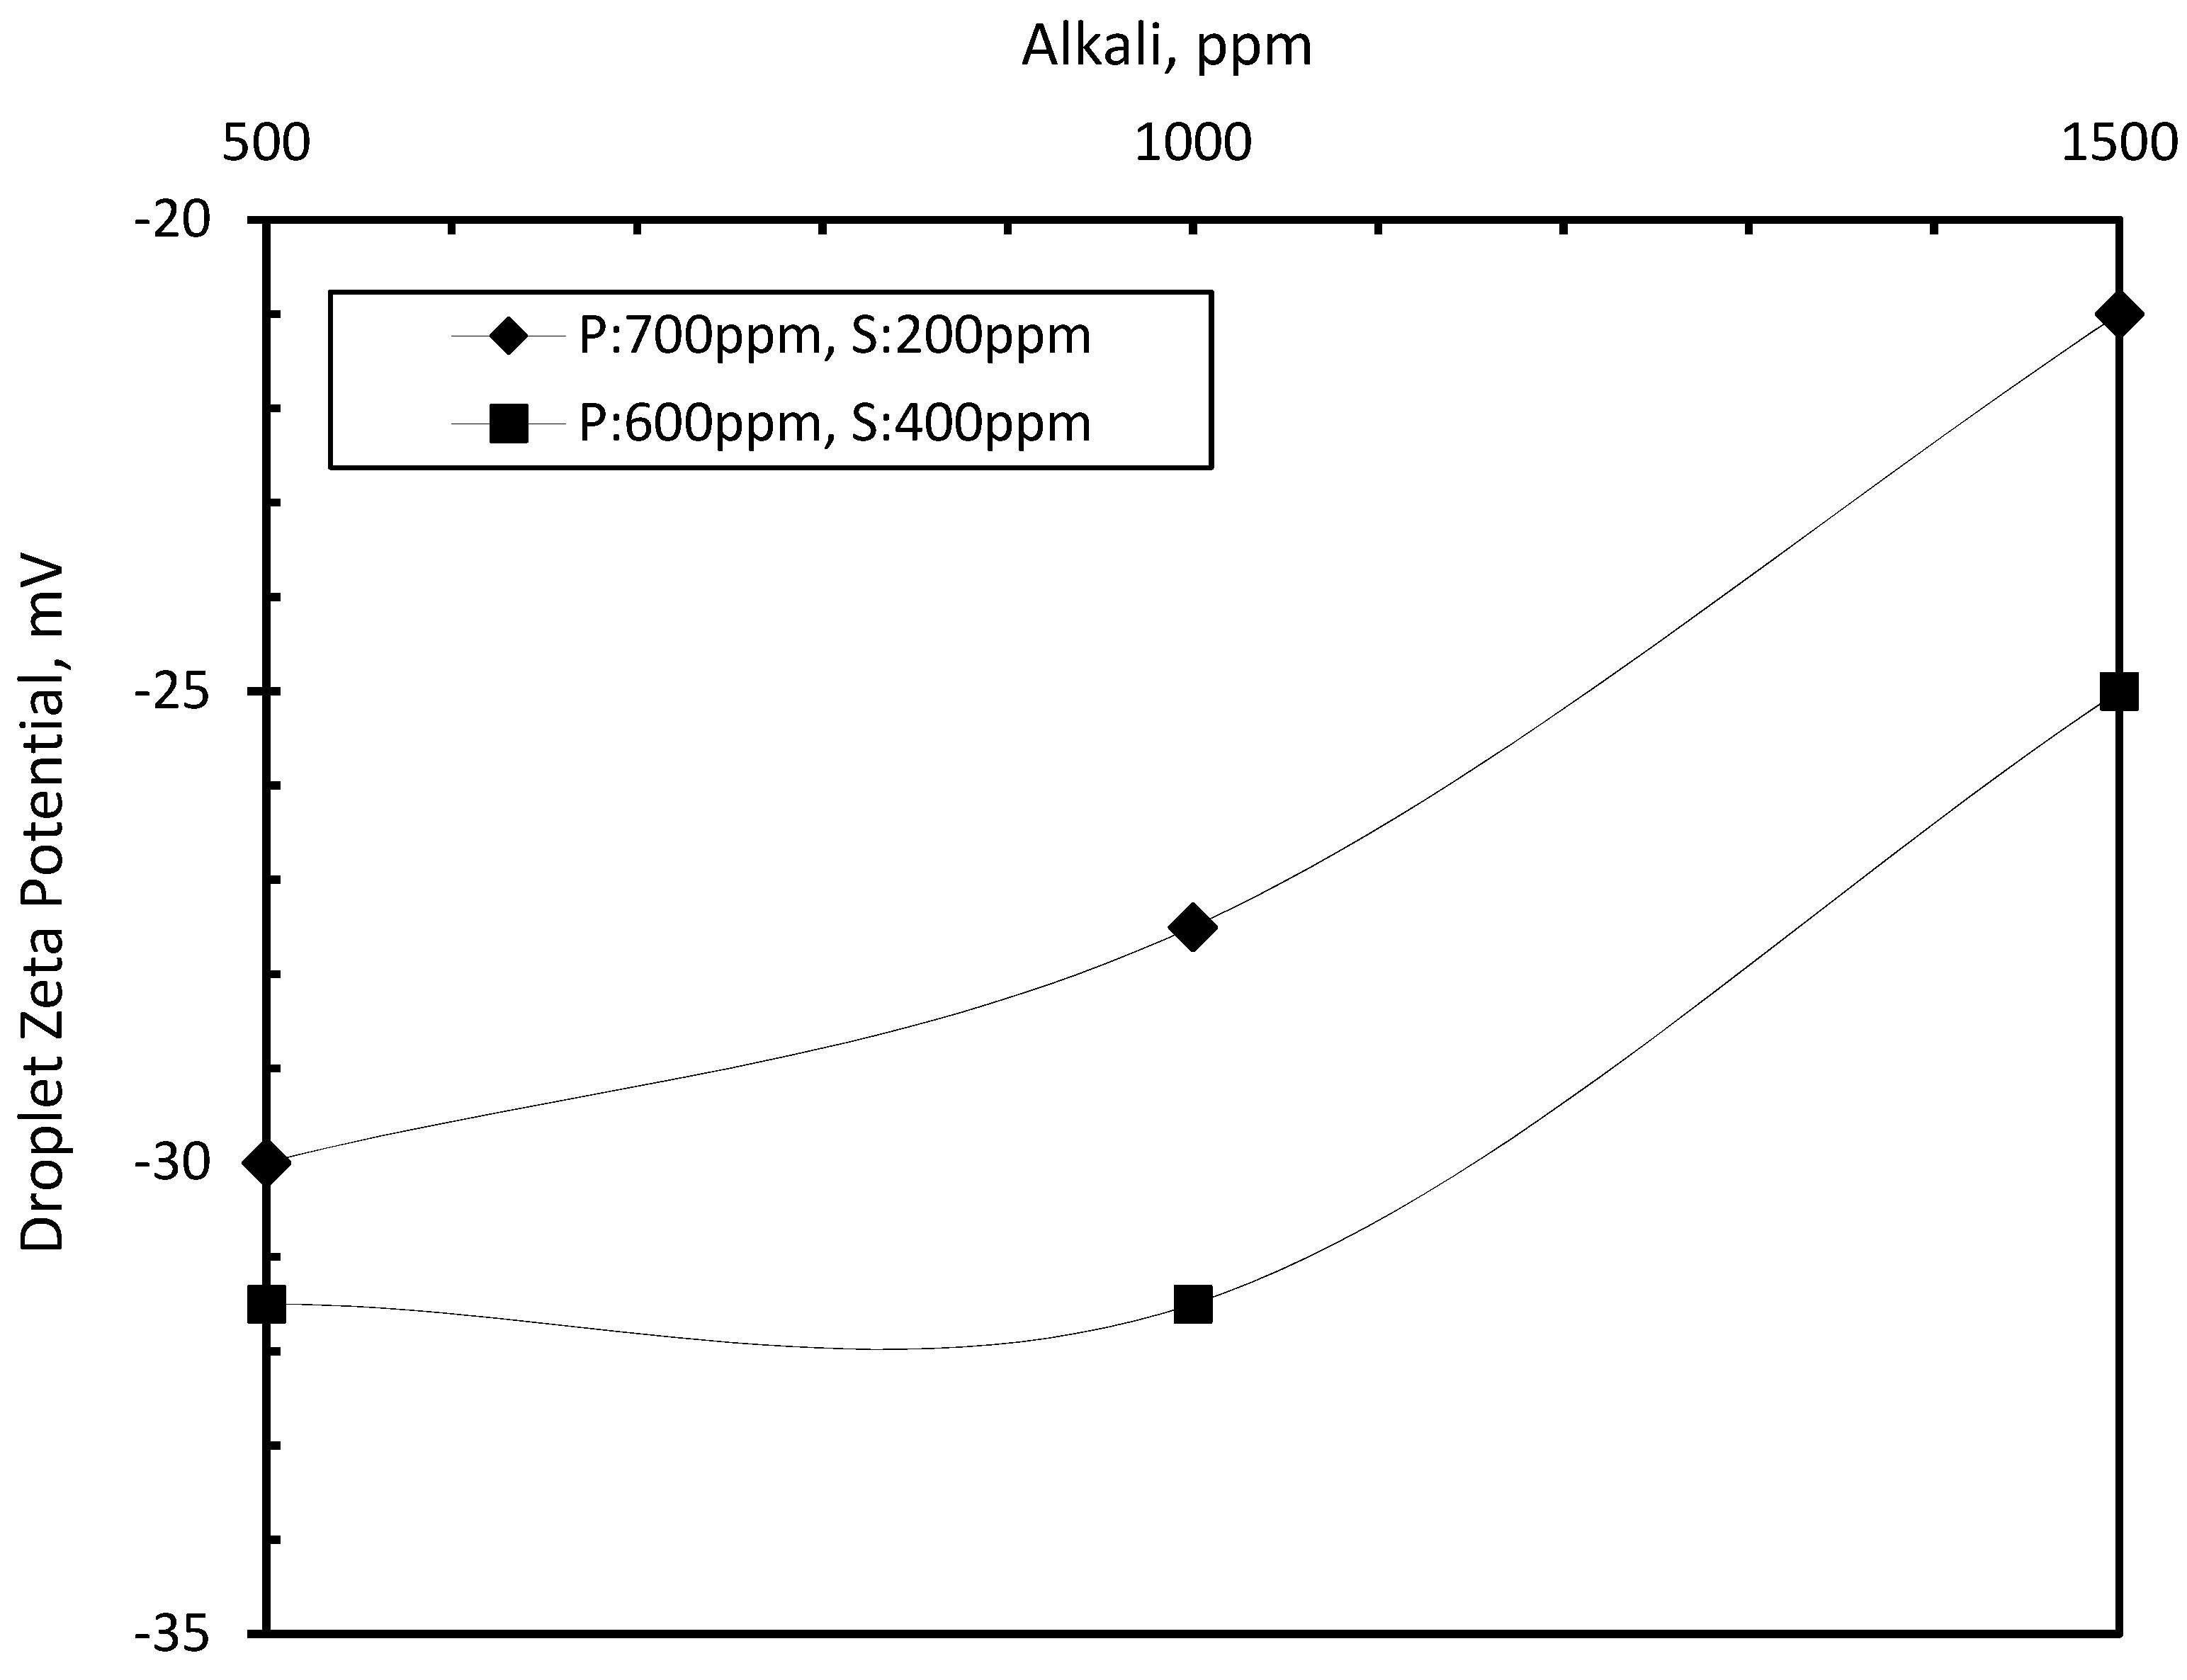
3.5. Effect of ASP on Zeta Potential of Droplets

Figure 12 shows the zeta potential of an emulsion with low and high surfactant and polymer concentrations at various alkali concentrations. Emulsions containing the 700 ppm high polymer achieved −30 to −19.5 zeta potential values at 500 ppm and 1500 ppm alkali, respectively, with a low surfactant concentration. When the concentration of the polymer decreased to 600 ppm and the surfactant concentration increased to 400 ppm, the surface charge was −31.5 to −25 at 500 ppm and 1500 ppm of alkali, respectively. These variations imply a particular way that ASP components interact with one another. Surfactants, however, are crucial to the stability of the emulsion. The results of the zeta potential experiment demonstrate that the force of repulsion between the droplets is reduced as the polymer concentration is increased, leading to the phenomena of flocculence, which causes an improvement in the separation.
The zeta potential of the water-in-oil emulsions was also determined at 60 °C to investigate the stability without ASP, as mentioned in Table 11. The zeta potential value was recorded at −13.66 mV in the absence of ASP. In comparison, a significant difference in the zeta potential was observed in the droplets with the presence of the ASP.

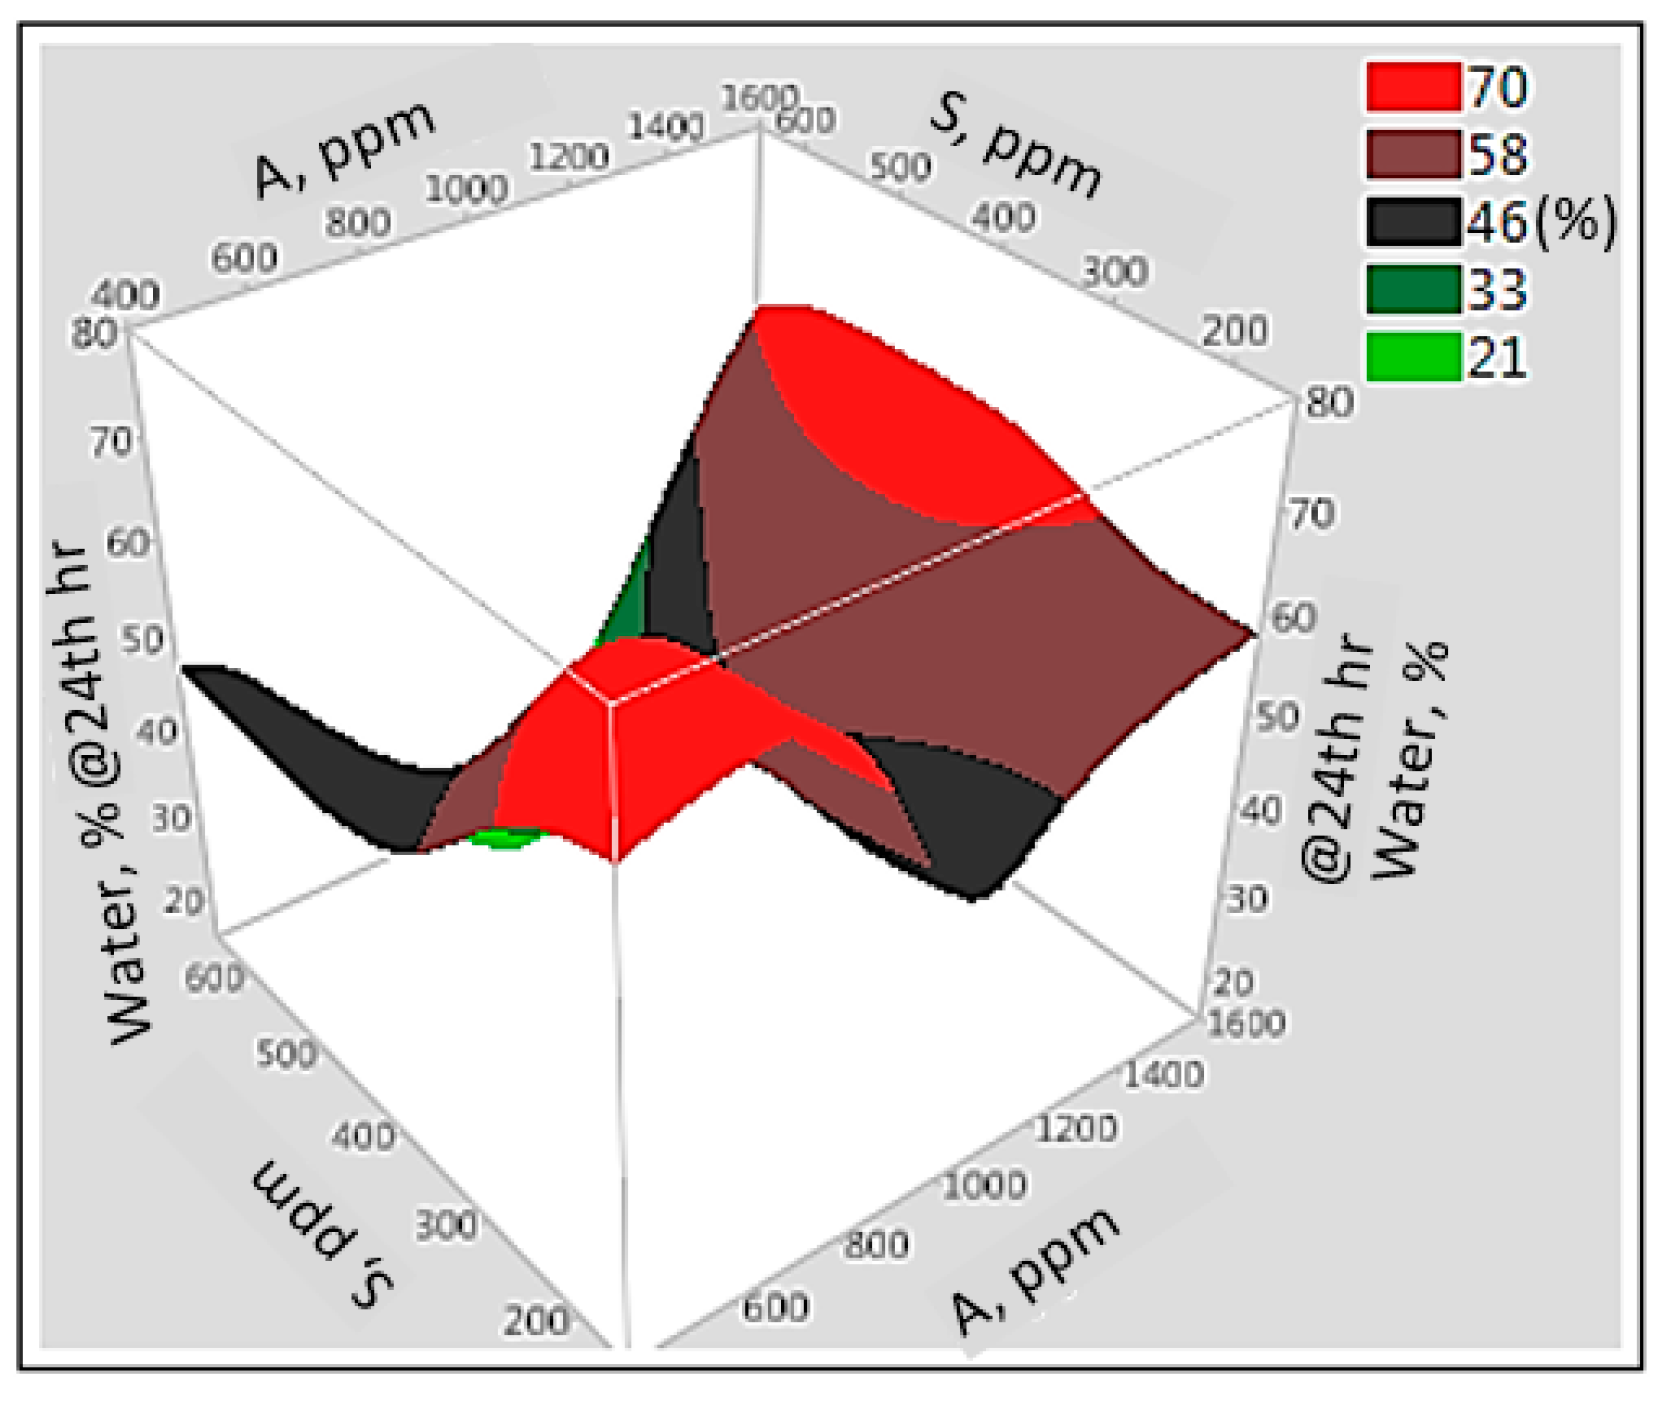
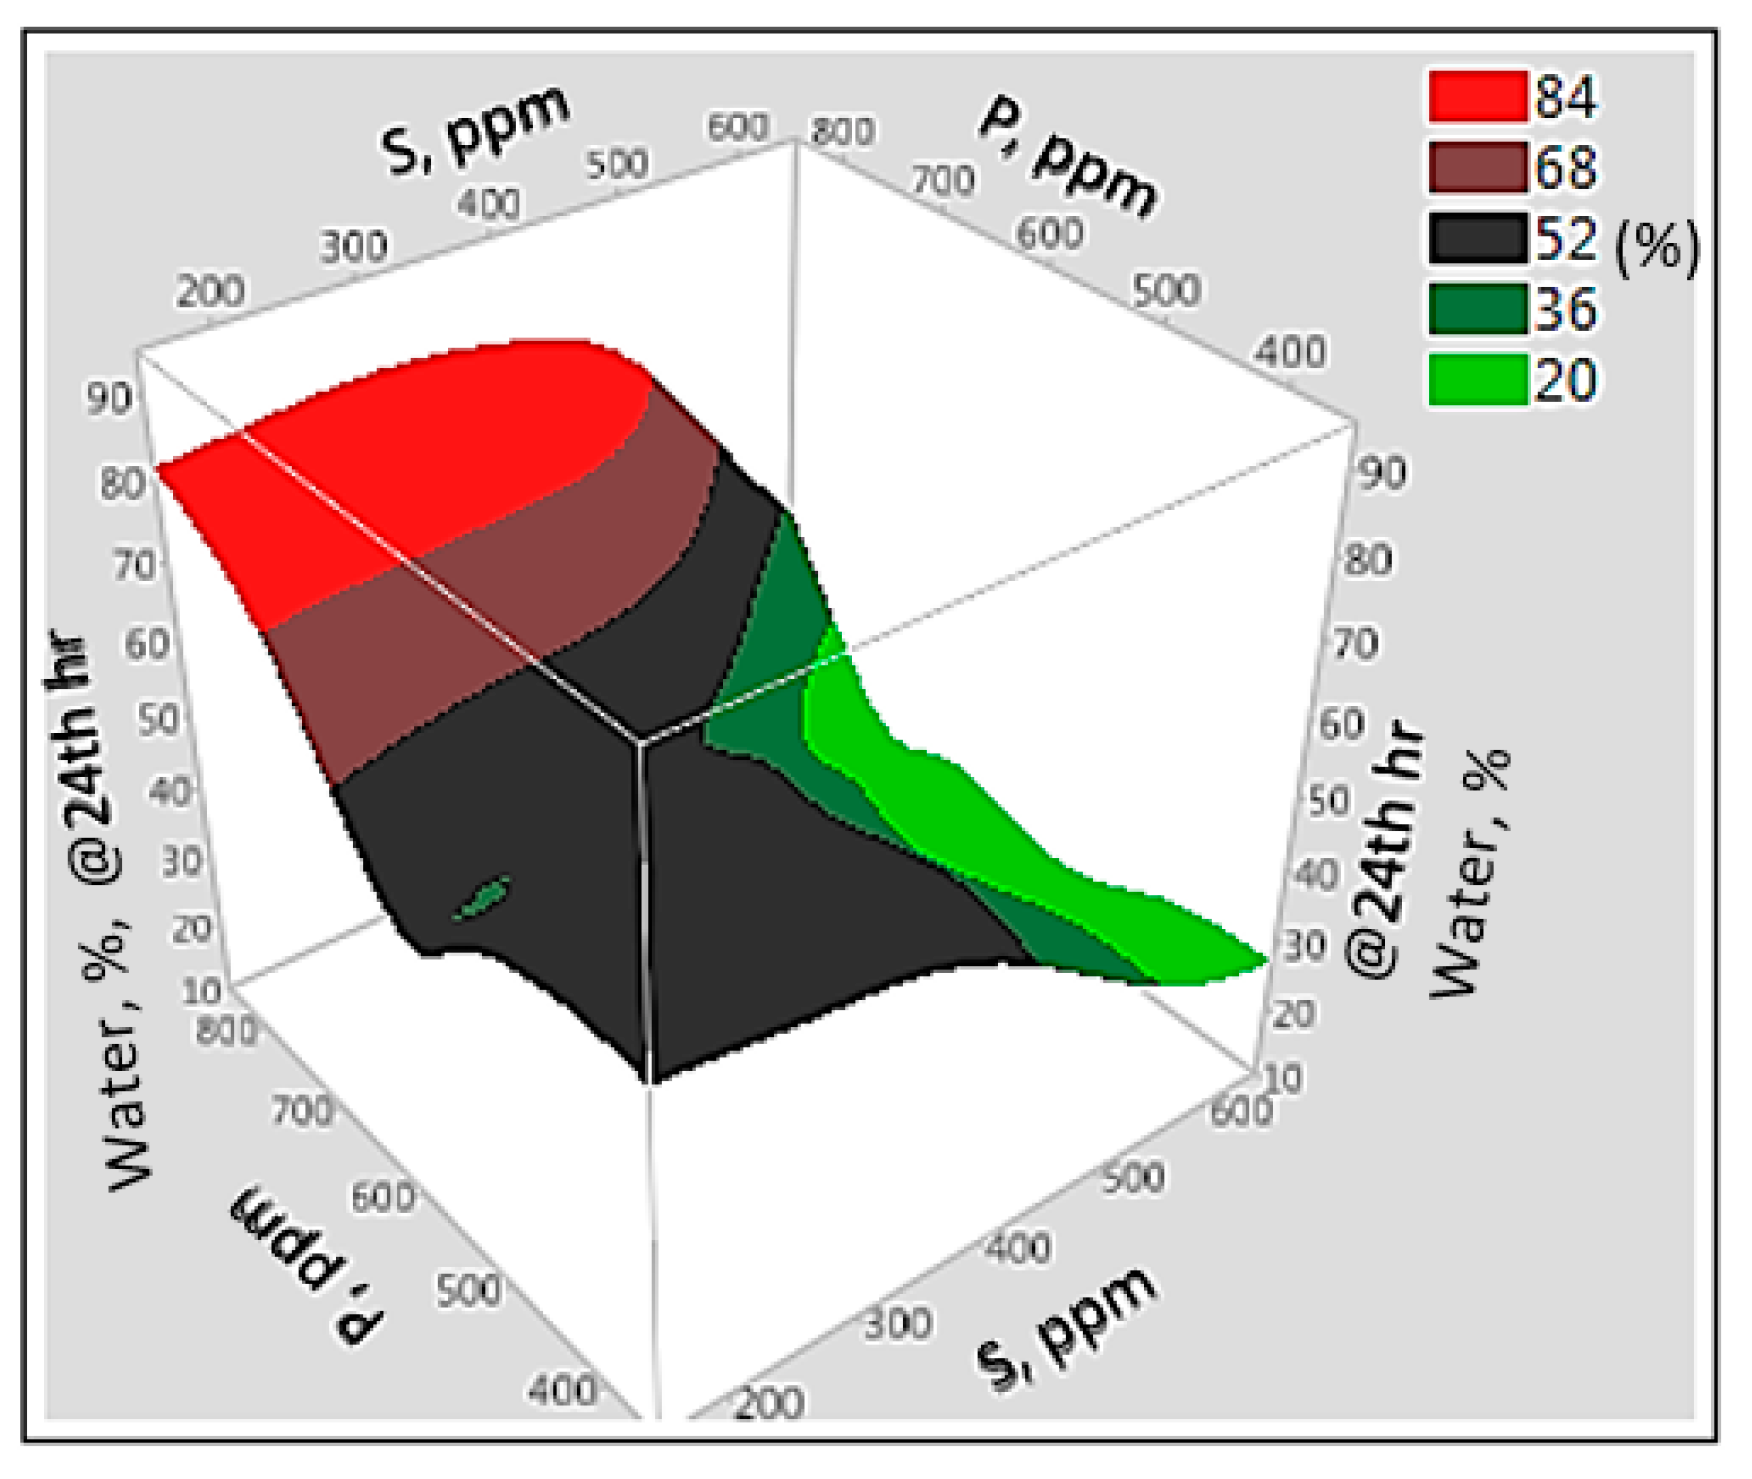
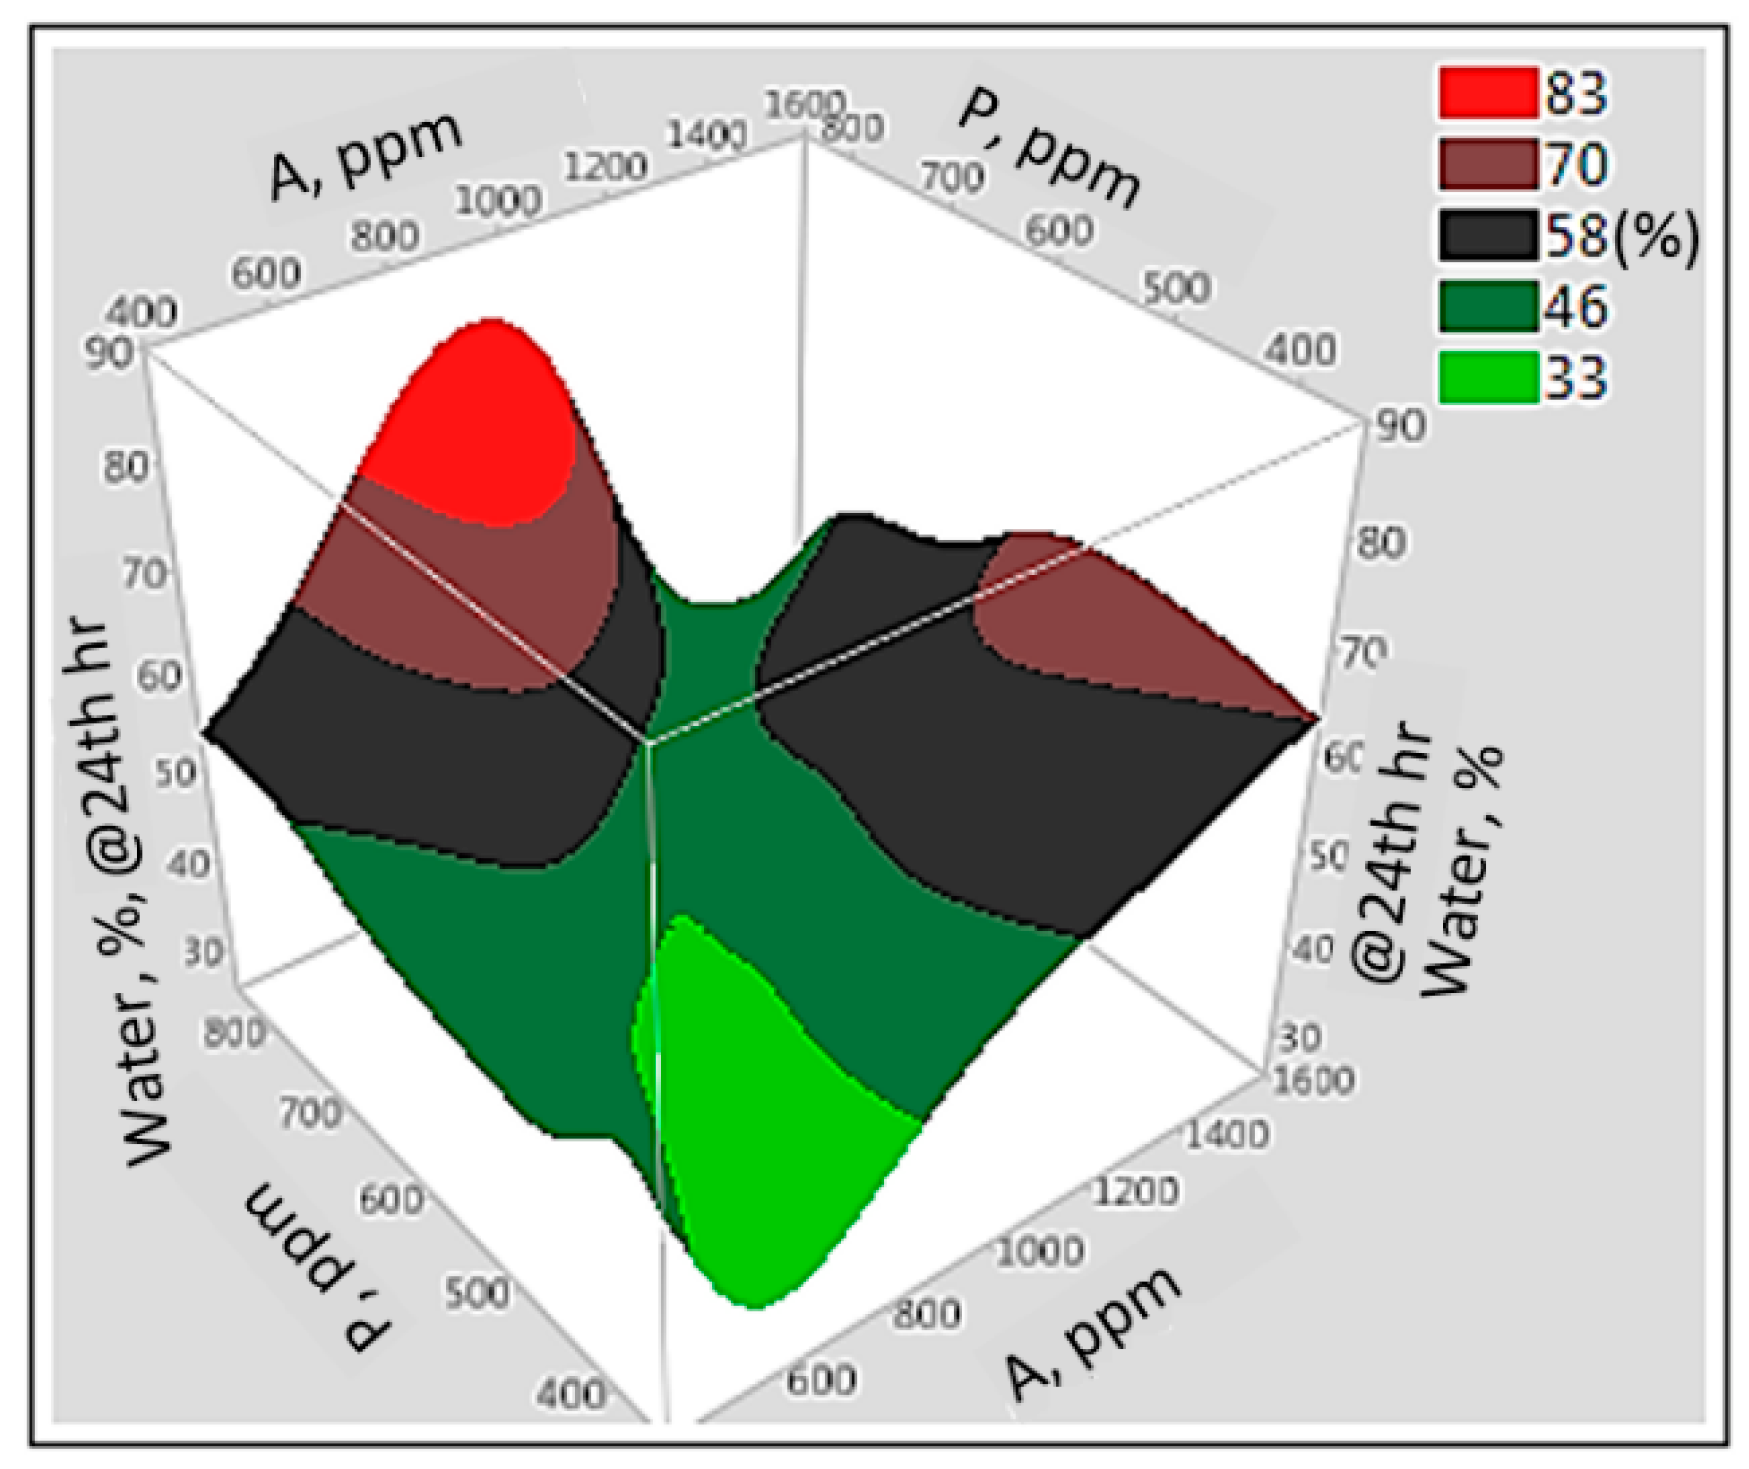
3.6. Interaction Effect of Parameters with Artificial Neural Network

Once the ANN model was validated, it was used to evaluate the process parameters on the separation/stabilization. The effect of the process parameters on separation and stabilization is illustrated in Figure 13, Figure 14 and Figure 15. The results are presented as the contour of water separation (response) as a function of the surfactant and alkali concentrations. The interaction of the surfactant and alkali was significant in emulsion stability. With the interaction of the alkali and surfactant, a maximum separation of 70% was achieved. Alkali (A) and polymer (P) alone had an insignificant effect on the separation rate. In the past, it was also found that Na2CO3 alone did not affect the emulsion stability [32]. The increase in the polymer caused the stabilization of the water-in-oil emulsion at 600 ppm, even in the presence of a low surfactant concentration. A similar effect of the polymer to stabilize the emulsion in the presence of low surfactant concentrations was also found in the literature [22]. The effectiveness of the alkali was positive on the separation in the presence of a high surfactant at low and high polymer concentrations.
The interaction of the polymer with a high concentration of surfactant stabilized the emulsion, and the separation was around 20%. The interaction of the surfactant and alkali stabilized the emulsion (see Figure 12). Therefore, the surfactant plays a vital role in stabilizing the emulsion. The alkali–polymer interaction reduced the separation to 33%. The 83% separation increase was achieved in the presence of 500 to 1000 ppm alkali and high polymer concentrations. It was observed that the polymer had a positive effect on the separation. The increase in the polymer at low alkali had a positive effect on the water separation in oil emulsion. The polymer only showed a negative result in the separation at low and high alkali/surfactant concentrations. The impact of the polymer to stabilize the emulsion was also found in the literature [14]. The effect of the alkali was to destabilize the emulsion in the presence of a high surfactant for both concentrations of the polymer, respectively, at 400 ppm and 800 ppm. The polymer effect was positive for separation at the 600–800 ppm concentrations. However, the interaction effects between the surfactant at low alkali concentrations significantly reduced the separation to 21%. The interaction of the polymer and alkali showed that the emulsion stabilization and water separation were reduced by 33%. The effect of all polymer concentrations had a remarkable effect on increasing the separation to 84% in the presence of a low surfactant concentration. In comparison, the separation was reduced to 20% due to a high concentration of the surfactant.

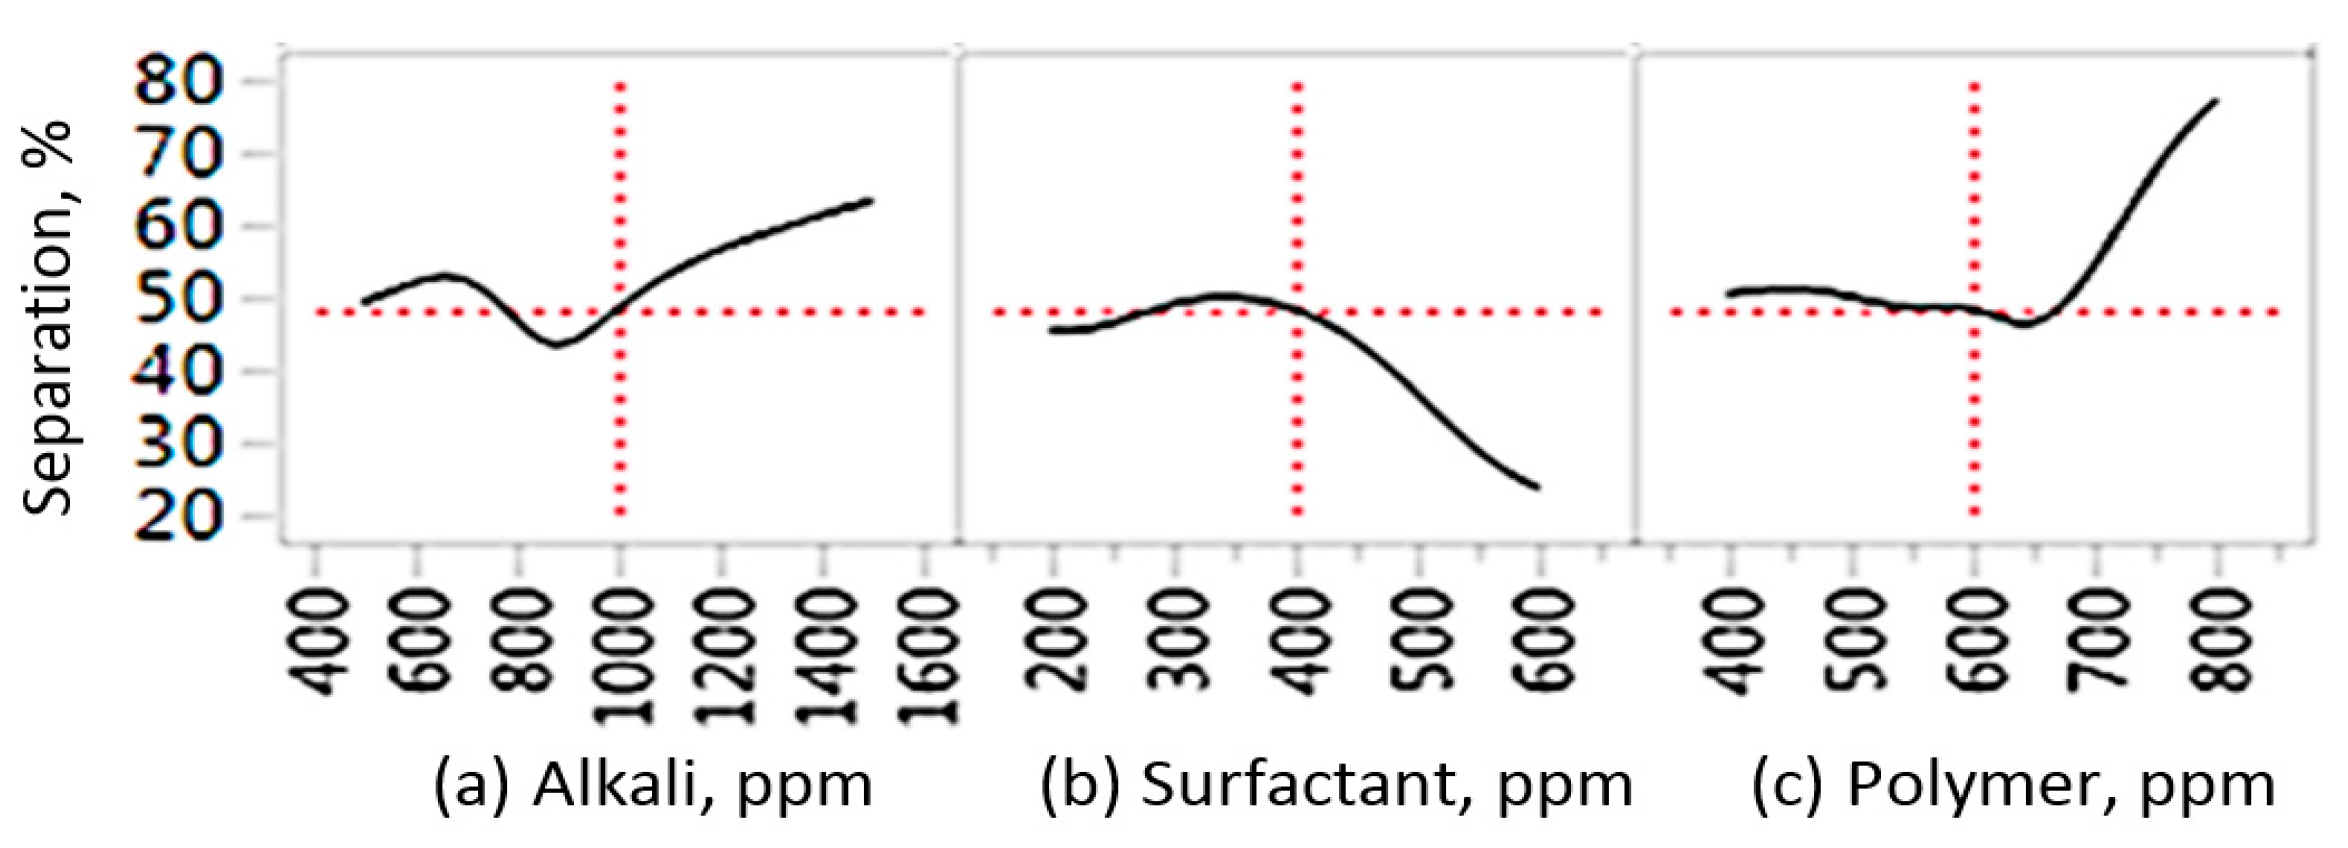
3.7. Prediction Profiles of ASP

Figure 16 shows the average separation of 48.26% at the 24 h interval in the ASP ranges (500–1500 ppm, 200–600 ppm, 400–800 ppm). The profile shows that the separation rate was not significantly affected in the range (500–1000) ppm; the alkali started the destabilization of the emulsion at 1500 ppm, as shown in Figure 16a. Figure 16b shows that a small quantity of surfactant added to the emulsion increased the stability of the emulsion. The profile indicates that the separation rate was not significantly affected in the polymer concentration range of 400–600 ppm. In comparison, it destabilized the emulsion at 800 ppm, as shown in Figure 16c. As in the present study, Na2CO3 was utilized, which is considered as a weak alkali because the carbonate ions can obtain protons from water droplets. Therefore, the amount of hydroxide ions increased, and consequently, the pH of the solutions became higher. The presence of a weak alkali is less problematic in separation compared to a strong alkali [32].

4. Conclusions

The characterization of the paraffinic composition in crude oil samples from Miri, Angsi, Penara and Dulang is investigated in order to assist the prediction of wax precipitation in respective field locations. The work also can be further expanded and developed to investigate more waxy crude samples from other different field locations in Malaysia to assist in deeper understanding of the crudes’ behaviour and subsequently establish the most economical and effective solutions to counter the wax deposition in wells. In order to achieve higher accuracy, more approaches can be utilized for data comparison. For example, to determine the WAT, Cross Polar Microscopy (CPM) and viscometer can be used for data comparison with those generated from DSC. Analysis of carbon number distribution also can be determined by simulated distillation (SIMDIS) using both GCMS and supercritical fluid chromatography (SFC). Both methods are within normal experimental scatter but a significantly larger fraction of oil analysis elutes in SFC analysis. Besides, internal standard analysis can be eliminated from SIMDIS without loss of accuracy. There is also no risk of hydrocarbon decomposition at high temperature.
The Turbiscan test, viscosity, and zeta potential measurements clarified that the emulsion was stable with increasing surfactant concentration. The test showed that increasing the concentration of the weak alkali in the range of 500–1500 ppm slightly decreased the emulsion stability. The absolute value of the zeta potential decreased at a high polymer concentration with a low surfactant concentration. The zeta potential of the droplets was between −19 and −25 mV. The absolute value of the zeta potential showed an increased repulsion force at the emulsion level with an increasing surfactant concentration. Therefore, we recommend perform a weak alkali injection as it did not demonstrate significant stabilization at the low water content of the emulsion. The research presented experimental results of industrial problems raised in the gravity separator after using alkali/surfactant/polymer (ASP) in the reservoir to enhance the oil recovery in one of Malaysia’s fields. Various combinations of ASP have been studied to identify the separation and stabilization of the water-in-oil emulsion. Further study is needed for oil-in-water emulsions.

Author Contributions

Experiments, simulations, data collection, conceptualization, software, analysis, algorithm creation, and manuscript writing were all carried out by S.W., H.H.A.-K., W.A. and J.A.K. Analysis, visualization, conceptual design, review, formulation, algorithm troubleshooting software, resources, management, investigation, and significant editing were carried out by M.I., A.A.J.G. and S.R. Conceptualization, technical editing, project management, and resource management were handled by M.I., S.L., I.K., S.Q., N.E.M.R. and D.G.-K. All authors have read and agreed to the published version of the manuscript.

Funding

The APC was Financed by the Ministry of Education and Science in Poland.

Data Availability Statement

The data could be available on request and by approval from the relevant authority of our university.

Acknowledgments

Authors would like to acknowledge the support of the Deputy for Research and Innovation Ministry of Education, Kingdom of Saudi Arabia for this research through grant (NU/IFC/02//SERC/-/017) under the Institutional Funding Committee at Najran University, Kingdom of Saudi Arabia. The authors also acknowledge the support of the Center of Research in Enhanced Oil Recovery at the Universiti Teknologi PETRONAS (COREOR, UTP) for providing the experiment’s raw materials as well as all of the technical support.

Conflicts of Interest

The authors declare no conflict of interest.

References

  1. Madhu, G.M.; Kumar, S.M.; Lourdu Antony Raj, M.A. Studies on Separation of Liquid-Liquid Dispersions: Diesel-Water System in Batch Settler. J. Dispers. Sci. Technol. 2007, 28, 1123–1131. [Google Scholar] [CrossRef]
  2. Noïk, C.; Palermo, T.; Dalmazzone, C. Modeling of liquid/liquid phase separation: Application to petroleum emulsions. J. Dispers. Sci. Technol. 2013, 34, 1029–1042. [Google Scholar] [CrossRef]
  3. Kokal, S.L. Crude oil emulsions: A state-of-the-art review. SPE Prod. Facil. 2002, 20, 5–13. [Google Scholar] [CrossRef]
  4. Hunter, T.N.; Pugh, R.J.; Franks, G.V.; Jameson, G.J. The role of particles in stabilising foams and emulsions. Adv. Colloid. Interface Sci. 2008, 137, 57–81. [Google Scholar] [CrossRef] [PubMed]
  5. Sztukowski, D.M.; Yarranton, H.W. Oilfield solids and water-in-oil emulsion stability. J. Colloid. Interface Sci. 2005, 285, 821–833. [Google Scholar] [CrossRef]
  6. Aleem, W.; Mellon, N. Experimental Study on the Effect of Parameters on Sedimentation and Coalescing Profiles in Liquid-liquid Batch Settler. Procedia Eng. 2016, 148, 887–895. [Google Scholar] [CrossRef] [Green Version]
  7. Janssen, P.H.; Van Den Broek, W.M.G.T.; Harris, C.K. Laboratory study investigating emulsion formation in the near-wellbore region of a high water-cut oil well. SPE J. 2001, 6, 71–79. [Google Scholar] [CrossRef]
  8. Yan, N.; Masliyah, J.H. Effect of pH on adsorption and desorption of clay particles at oil–water interface. J. Colloid. Interface Sci. 1996, 181, 20–27. [Google Scholar] [CrossRef]
  9. Zerpa, L.E.; Queipo, N.V.; Pintos, S.; Salager, J.L. An optimization methodology of alkaline–surfactant–polymer flooding processes using field scale numerical simulation and multiple surrogates. J. Pet. Sci. Eng. 2005, 47, 197–208. [Google Scholar] [CrossRef]
  10. Bera, A.; Kumar, S.; Mandal, A. Temperature-dependent phase behavior, particle size, and conductivity of middle-phase microemulsions stabilized by ethoxylated nonionic surfactants. J. Chem. Eng. Data 2012, 57, 3617–3623. [Google Scholar] [CrossRef]
  11. Jeelani, S.A.; Hartland, S. Effect of dispersion properties on the separation of batch liquid—liquid dispersions. Ind. Eng. Chem. Res. 1998, 37, 547–554. [Google Scholar] [CrossRef]
  12. Aleem, W.; Mellon, N. Model for the prediction of separation profile of oil-in-water emulsion. J. Dispers. Sci. Technol. 2018, 39, 8–17. [Google Scholar] [CrossRef]
  13. Frising, T.; Noïk, C.; Dalmazzone, C. The liquid/liquid sedimentation process: From droplet coalescence to technologically enhanced water/oil emulsion gravity separators: A review. J. Dispers. Sci. Technol. 2006, 27, 1035–1057. [Google Scholar] [CrossRef]
  14. Khan, J.A.; Al-Kayiem, H.H.; Aleem, W.; Saad, A.B. Influence of alkali-surfactant-polymer flooding on the coalescence and sedimentation of oil/water emulsion in gravity separation. J. Pet. Sci. Eng. 2019, 173, 640–649. [Google Scholar] [CrossRef]
  15. Nedjhioui, M.; Moulai-Mostefa, N.; Morsli, A.; Bensmaili, A. Combined effects of polymer/surfactant/oil/alkali on physical chemical properties. Desalination 2005, 185, 543–550. [Google Scholar] [CrossRef]
  16. Hirasaki, G.J.; Miller, C.A.; Raney, O.G.; Poindexter, M.K.; Nguyen, D.T.; Hera, J. Separation of Produced Emulsions from Surfactant Enhanced Oil Recovery Processes. Energy Fuels. 2010, 25, 555–561. [Google Scholar] [CrossRef]
  17. Tan, X.; Fenniri, H.; Gray, M.R. Water enhances the aggregation of model asphaltenes in solution via hydrogen bonding. Energy Fuels. 2009, 23, 3687–3693. [Google Scholar] [CrossRef]
  18. Arhuoma, M.; Daoyong, Y.; Mingzhe, D.; Heng, L.; Idem, R. Numerical simulation of displacement mechanisms for enhancing heavy oil recovery during alkaline flooding. Energy Fuels. 2009, 23, 5995–6002. [Google Scholar] [CrossRef]
  19. Kokal, S.; Wingrove, M. Emulsion separation index: From laboratory to field case studies. In Proceedings of the SPE Annual Technical Conference and Exhibition, SPE-63165-MS. Dallas, TX, USA, 1–4 October 2000. [Google Scholar]
  20. Zhang, F.; Liu, G.; Ma, J.; Ouyang, J.; Yi, X.; Su, H. Main challenges in demulsifier research and application. In IOP Conference Series: Materials Science and Engineering; IOP Publishing: Bristol, UK, 2017; Volume 167, p. 012068. [Google Scholar]
  21. Othman, M.; Chong, M.B.O.; Sai, R.M.; Zainal, S.; Yaacob, A.A.; Zakaria, M.S. Meeting the challenges in alkaline surfactant pilot project implementation at Angsi field, offshore Malaysia. In Proceedings of the SPE Offshore Europe Oil and Gas Conference and Exhibition, Society of Petroleum Engineers. Aberdeen, UK, 4–7 September 2007. [Google Scholar]
  22. Khan, J.A.; Al-Kayiem, H.H.; Aris, M.S. Stabilization of Produced Crude Oil Emulsion in the Presence of ASP. In Proceedings of the SPE Asia Pacific Enhanced Oil Recovery Conference, Kuala Lumpur, Malaysia, 11–13 August 2015; p. SPE-174671-MS. [Google Scholar]
  23. Aleem, W.; Mellon, N.; Khan, J.A.; Al-Kayiem, H.H. Experimental investigation and mathematical modeling of oil/water emulsion separation effectiveness containing alkali-surfactant-polymer. J. Dispers. Sci. Technol. 2021, 42, 1286–1298. [Google Scholar] [CrossRef]
  24. Al-Kayiem, H.H.; Khan, J.A. Evaluation of Alkali/Surfactant/Polymer Flooding on Separation and Stabilization of Water/Oil Emulsion by Statistical Modeling. Energy Fuels 2017, 31, 9290–9301. [Google Scholar] [CrossRef]
  25. Hajduk, Z. High accuracy FPGA activation function implementation for neural networks. Neurocomputing 2017, 247, 59–61. [Google Scholar] [CrossRef]
  26. Ibrahim, Z.B.; Manap, A.A.A.; Hamid, P.A.; Yee, V.H.; Hong, L.P.; Wyatt, K. Laboratory aspect of chemical EOR processes evaluation for Malaysian oilfields. In Proceedings of the SPE Asia Pacific Oil & Gas Conference and Exhibition, Adelaide, Australia, 11–13 September 2006. [Google Scholar]
  27. Ghadami, N.; Das, A.K.; Tunio, K.H.; Sabzabadi, A. Sensitivity analysis and optimization of alkaline-surfactant flooding in a thin clastic reservoir. In Proceedings of the International Petroleum Technology Conference, Doha, Qatar, 6–9 December 2015. [Google Scholar]
  28. Hirasaki, G.J.; Miller, C.A.; Puerto, M. Recent advances in surfactant EOR. In Proceedings of the SPE Annual Technical Conference and Exhibition, Denver, CO, USA, 21–24 September 2008. [Google Scholar]
  29. Shupe, R.D. Surfactant Oil Recovery Process Usable in High Temperature Formations Containing High Salinity Water. U.S. Patent 4,088,189, 9 May 1978. [Google Scholar]
  30. Hartland, S.; Jeelani, S. Prediction of sedimentation and coalescence profiles in a decaying batch dispersion. Chem. Eng. Sci. 1988, 43, 2421–2429. [Google Scholar] [CrossRef]
  31. Khan, M.K.; Khan, J.A.; Ullah, H.; Al-Kayiem, H.H.; Irawan, S.; Irfan, M.; Glowacz, A.; Liu, H.; Glowacz, W.; Rahman, S. De-emulsification and gravity separation of micro-emulsion produced with enhanced oil recovery chemicals flooding. Energies 2021, 14, 2249. [Google Scholar] [CrossRef]
  32. Guo, H.; Li, Y.; Wang, F.; Gu, Y. Comparison of Strong-Alkali and Weak-Alkali ASP-Flooding Field Tests in Daqing Oilfield. SPE Prod. Oper. 2017, 33, 353–362. [Google Scholar]
Figure 1. Heat flow at various temperatures for Angsi crude.
Water 15 01290 g001
Figure 2. Measuring principle of Turbiscan or experimental measurement of separation from the emulsion sample by sedimentation (back scattering) and coalescence (light transmission).
Water 15 01290 g002
Figure 3. Procedure of the sedimentation and coalescence measurements.
Water 15 01290 g003
Figure 4. Parallel-plate measuring system in the rotational and oscillatory rheometer.
Water 15 01290 g004
Figure 5. Zeta potential measurement with a Malvern Zetasizer Nano ZS: Residual emulsion in the capillary cell.
Water 15 01290 g005
Figure 6. Topology of the boosted ANN.
Water 15 01290 g006
Figure 7. Experimental versus the predicted water separation. (a) Training, (b) validation.
Water 15 01290 g007
Figure 8. Emulsion stability as a function of the alkali. (a) Low alkali; ASP (ppm) = 500, 400, 600. (b) High alkali; ASP (ppm) = 1500, 400, 600. The dark and light blue color lines shows the initial measurement of emulsion stability values; red & yellow color lines shows final stability measurement values.
Water 15 01290 g008
Figure 9. Emulsion as a function of the surfactant. (a) Low surfactant; ASP (ppm) = 1000, 200, 600. (b) High surfactant; ASP (ppm) = 1000, 600, 600. The dark and light blue color lines shows the initial measurement of emulsion stability values; red & yellow color lines shows final stability measurement values.
Water 15 01290 g009
Figure 10. Emulsion as a function of the polymer. (a) Low polymer; ASP (ppm) = 1000, 400, 400. (b) High polymer; ASP (ppm) = 1000, 400, 600. The dark and light blue color lines shows the initial measurement of emulsion stability values; red & yellow color lines shows final stability measurement values.
Water 15 01290 g010
Figure 11. Viscosity variation in the residual emulsion with a low and high composition of alkali in the presence of constant polymer at a temperature of 60 °C: (a) S = 400 ppm and (b) S = 600 ppm.
Water 15 01290 g011
Figure 12. Zeta potential of the droplets with a Malvern particle analyzer.
Water 15 01290 g012
Figure 13. Effect of the alkali–surfactant on separation.
Water 15 01290 g013
Figure 14. Effect of the surfactant–polymer on separation.
Water 15 01290 g014
Figure 15. Effect of the alkali–polymer on separation.
Water 15 01290 g015
Figure 16. Effect of the process parameters on separation calculated by the developed ANN. (a) Alkali separation profile, (b) surfactant separation profile, (c) polymer profile.
Water 15 01290 g016
Table 1. WAT, solid-to-solid crystalline, and crystallization temperatures for different crude oils.
SamplesMiriAngsiPenaraDulang
Wax Appearance Temperature (°C)36.134.13734.1
Solid-to-Solid Crystalline (°C)5963.14750
Crystallization Temperature (°C)63.168.151.155
Table 2. Wax content for each sample.
SamplesMiriAngsiPenaraDulang
Wax Content (wt%)28.9025.8333.6527.35
Table 3. Cumulative mol percent from (C20 to C40) for each sample.
SamplesMiriAngsiPenaraDulang
Cumulative Mol Percent
(from C20 to C40)
16.8315.2126.7425.86
Table 4. Oil and brine composition.
Crude OilReservoir Brine
PropertyValueChemicalsg/L
Density, g/cc @ 60 °C0.79CaCl2(H2O)20.8153
Viscosity, cP @60 °C0.4MgCl2(H2O)60.7517
API42NaCl9.2734
TAN, mg KOH g−10.19SrCl2·6H2O0.0296
Asphaltenes Content (wt%)0.1KCl0.4238
Wax Content (wt%)25.83NaHCO37.1593
Table 5. Properties of the alkali/surfactant/polymer used in the emulsion study.
ChemicalPropertySpecification/Value
AlkaliNameSodium carbonate
FormulaNa2CO3
Chemical structureWater 15 01290 i001
Molar mass106.0 g/mol
Density2.54 g/mL
Melting point851 °C
SurfactantNameAlpha Olefin Sulfonate
Structural formulaRCH (OH) (CH2)n-SO3Na
Active Matter Content (%)92
PH Value (1% aq. solution)9.5–11.5
Density2.54 g/mL
AppearanceClear and Bright
PolymerNameHydrolyzed Polyacrylicamide (HPAM)
Structural formulaWater 15 01290 i002
Hydrolysis in mole,%25–30
Molecular weight (million Dalton)16
Density1.189 g/mL at 25 °C
Water SolubilitySOLUBLE
Viscosity (mPa-S), at concentration, 1000 mg/L, at 60 ℃10.5
Table 6. Breakthrough of the alkali-surfactant-polymer concentration in the primary separator.
EOR ChemicalsBreakthrough in SeparatorReservoir Brine, Vol%Crude Oil, Vol%
Alkali, Vol%5–15%40%60%
Surfactant, Vol%20–40%
Polymer, Vol%60–70%
Table 7. Sensitivity of the training and validation parameters.
TrainingValidation
MeasuresValueMeasuresValue
R20.95R20.99
RMSE3.39RMSE1.66
Mean Abs Dev.2.51Mean Abs Dev.1.585
Log Likelihood31.71Log Likelihood7.71
SSE138.66SSE11.09
Sum Freq.11Sum Freq.4
Table 8. Alkali–surfactant–polymer concentration for Turbiscan test/stability test.
SampleAlkali, ppmSurfactant, ppmPolymer, ppmSeparated Water, %
Effect of the alkali50040060022
1500 33
Effect of the surfactant100020060061
600 35
Effect of the polymer100040040039
60066
Table 9. Viscosity of the emulsion at alkali, 500 ppm, and 1500 ppm, surfactant 400 ppm, polymer 600 ppm.
Meas. Pts.Shear RateViscosity at Low Alkali,
A = 500 ppm
Viscosity at High Alkali,
A = 1500 ppm
[1/s][mPa-s][mPa-s]
117.906.00
2117.205.60
3226.705.10
4326.104.20
5425.704.30
6525.604.20
7625.804.10
8725.704.20
9905.904.10
101005.604.10
Table 10. Viscosity of the emulsion at alkali, 500 ppm, 1500 ppm, surfactant 600 ppm, polymer 600 ppm.
Meas. Pts.Shear RateViscosity
A = 500 ppm
Viscosity
A = 1500 ppm
[1/s][mPa-s][mPa-s]
118.007.40
2117.606.90
3227.206.20
4327.005.80
5426.505.70
6526.805.80
7626.905.80
8726.805.80
9906.305.80
101006.305.70
Table 11. Zeta potential of dispersed droplets with and without ASP injection.
ASP Sample,
ppm
Zeta Potential,
mV
ASP Sample,
ppm
Zeta Potential,
mV
ASP Sample,
ppm
Zeta Potential,
mV
A = 500−30A = 500−31.5A = 500(Emulsion without ASP)
−13.66
S = 200S = 400S = 200
P = 700P = 600P = 700
A = 1000−27.5A = 1000−31.5A = 1000
S = 200,S = 400S = 200
P = 700P = 600P = 700
A = 1500−21A = 1500−25A = 1500
S = 200S = 400S = 200
P = 700P = 600P = 700
Disclaimer/Publisher’s Note: The statements, opinions and data contained in all publications are solely those of the individual author(s) and contributor(s) and not of MDPI and/or the editor(s). MDPI and/or the editor(s) disclaim responsibility for any injury to people or property resulting from any ideas, methods, instructions or products referred to in the content.

