Article

Development and Application of a Methodology for the Identification of Potential Groundwater Recharge Zones: A Case Study in the Virvini Micro-Basin, Tiraque, Bolivia

by
Inti E. Rodriguez-Levy
1,2,*,
Miguel A. Centellas-Levy
3,
Wanderley J. Ferreira
1,
Syed Md Touhidul Mustafa
4,
Lilian Rivera-Rodriguez
1,
Andres Gonzales Amaya
5 and
Marijke Huysmans
2,6
1
Centro de Investigación en Ciencias e Ingeniería (CICEI), Departamento de Ciencias Exactas e Ingeniería, Universidad Católica Boliviana San Pablo, Unidad Académica de Cochabamba, c. Márquez esq. Plaza Trigo, Cochabamba, Bolivia
2
Department of Hydrology and Hydraulic Engineering, Vrije Universiteit Brussel, Pleinlaan 2, 1050 Brussels, Belgium
3
Fundación Abril, Calle Innominada, Colcapirhua, Bolivia
4
Hydrology and Quantitative Water Management Group, Wageningen University & Research, 6708 PB Wageningen, The Netherlands
5
Laboratorio de Hidráulica, Universidad Mayor de San Simón, Av. Petrolera km 4.2, Cochabamba, Bolivia
6
Department of Earth and Environmental Sciences, KU Leuven, Celestijnenlaan 200E, 3001 Leuven, Belgium
*
Author to whom correspondence should be addressed.
Water 2023, 15(7), 1268; https://doi.org/10.3390/w15071268
Submission received: 28 February 2023 / Revised: 15 March 2023 / Accepted: 21 March 2023 / Published: 23 March 2023
(This article belongs to the Section Hydrogeology)

Abstract

:
Groundwater plays a vital role in human consumption and irrigation in many parts of Bolivia; yet, the absence of policies to regulate its extraction and protect groundwater recharge areas has led to a decline in water tables and threatened food security. Some municipal initiatives have been implemented to develop regulations, but the lack of reliable hydrogeological data (such as aquifer geometry, groundwater level data, location of potential groundwater recharge zones, and flow dynamics) hinders their effective implementation. The case study presented herein focuses on a municipal policy in Tiraque, Bolivia, aimed at protecting groundwater recharge zones, in addition to the need for a reliable methodology for their technical identification. The EARLI approach (an acronym for “Enhanced Algorithm for Recharge based on the Rainfall and Land cover Inclusion”) is suggested as a participatory-simplified multi-criteria decision method to address the absence of hydrogeological data. This approach was adjusted to the basin’s specific conditions, including local vegetation communities and their influence on infiltration, and was applied as a pilot study in the Virvini micro-basin. The EARLI model emphasizes the spatial distribution of rainfall as an input indicator for potential recharge in addition to the biophysical characteristics of the catchment area. The methodology successfully mapped the degree of groundwater recharge potential and was validated by traditional hydrogeological models, field infiltration measurements, and the local community’s application of the tool. Therefore, the results of this study provide the necessary technical bases for groundwater-integrated management in Tiraque.

Graphical Abstract

1. Introduction

The demand for water in Bolivia, destined almost exclusively for agricultural use (86%) and human consumption (11%) [1,2], has increased steeply in recent years due to population growth, agricultural expansion, and climate variability [3,4,5], which is expected to result in a 12-fold increase in demand and a 30% decrease in supply by the end of the century [6,7]. This situation compromises entire ecosystems, public health, water, and food security [8,9], and is exacerbated by a lack of comprehensive hydrological data. To achieve adequate water security, regulatory policies should be implemented to protect all water sources [10,11], including groundwater. Until a few years ago, its importance was underestimated by decision makers, but it has slowly been overcoming its status as a “hidden resource” in recent times [12,13,14,15]. Groundwater is a fragile reservoir which is usually overexploited, especially in arid zones [8,16,17,18], and vulnerable to external pressures associated with land use changes and pollution processes [19,20,21], particularly if recharge areas are not identified nor protected [8,22,23]. When water is extracted from aquifers more quickly than it can be replenished, the groundwater resources are depleted [15,18]. This groundwater depletion can reduce water availability and quality and, thus, agricultural productivity and food security [15,24,25]. Groundwater depletion is not limited to Bolivia alone, but is a widespread global problem [15,26]. A notable example of this can be seen in the United States, where the High Plains aquifer system has experienced a depletion of water resources, resulting in decreased agricultural productivity and heightened energy expenses incurred due to the need to pump water from deeper wells [27,28,29]. Similarly, India and Iran in Asia have also encountered comparable challenges. India’s severe water scarcity can largely be attributed to excessive groundwater withdrawal for agriculture, resulting in depleted groundwater reserves and the need for deeper drilling [30,31,32]. Conversely, Iran is among the world’s top countries facing groundwater depletion, leading to several complications which are accentuated in groundwater settings with high salt concentrations [18,33]. Under these scenarios, the potential for social conflicts increases [34,35], as has occurred in the Valle Alto basin in central Bolivia, whose inhabitants have faced several conflicts in recent decades related to competition for water use (in the upper basin) and the lowering of the water table (in the lower basin) [34,36,37].
To deal with these adverse circumstances and adopt a more progressive attitude towards the integrated management of water resources, the municipality of Tiraque (in the northeast of the Valle Alto basin) has been trying unsuccessfully to implement a public policy aiming to protect groundwater recharge zones and water sources. The policy was initially rejected due to discrepancies between local stakeholders [38] and the lack of a technical hydrogeological component to fulfill its objective of identifying potential groundwater recharge zones as a primary and fundamental step to protecting them [16]. This aspect is especially relevant considering that, unlike most of the municipalities in the Valle Alto basin, the hydrological context of Tiraque (located in the upper basin) has necessitated a greater focus on exploiting water through springs and superficial sources [39,40,41]. As a result of this lack of dependence on groundwater, few efforts have been made to study hydrogeological processes, and factors controlling groundwater in this region are unclear.
Various quantitative and qualitative approaches are available for identifying groundwater recharge zones [42,43], including water balance modeling and isotopic analysis [11,21,44,45]. However, these methods often require too many input variables and can be restrictive for their use in developing countries. Matus et al. [46] suggested a participatory approach for identifying these zones, which is helpful for basins where reliable information is unavailable. Nevertheless, the exclusion of meteorological criteria and the lack of specificity in the land cover characterization could limit its optimal use to the latitudes at which it was initially developed (Central America).
This research aims to develop an accessible, affordable, and dependable methodology for identifying potential groundwater recharge zones in the Virvini micro-basin, as well as to test its accuracy and applicability through various means, including (i) in situ measurements, (ii) simulated recharge through the WetSpass-M model, and (iii) stakeholder workshops. The methodology incorporates scientific and local knowledge to empower rural communities to govern their water resources, and aligns with the Sustainable Development Goals [47,48]. The results demonstrate that this approach is able to successfully identify groundwater recharge areas in the study region, providing a solid foundation for future hydrogeological management in the Tiraque municipality.

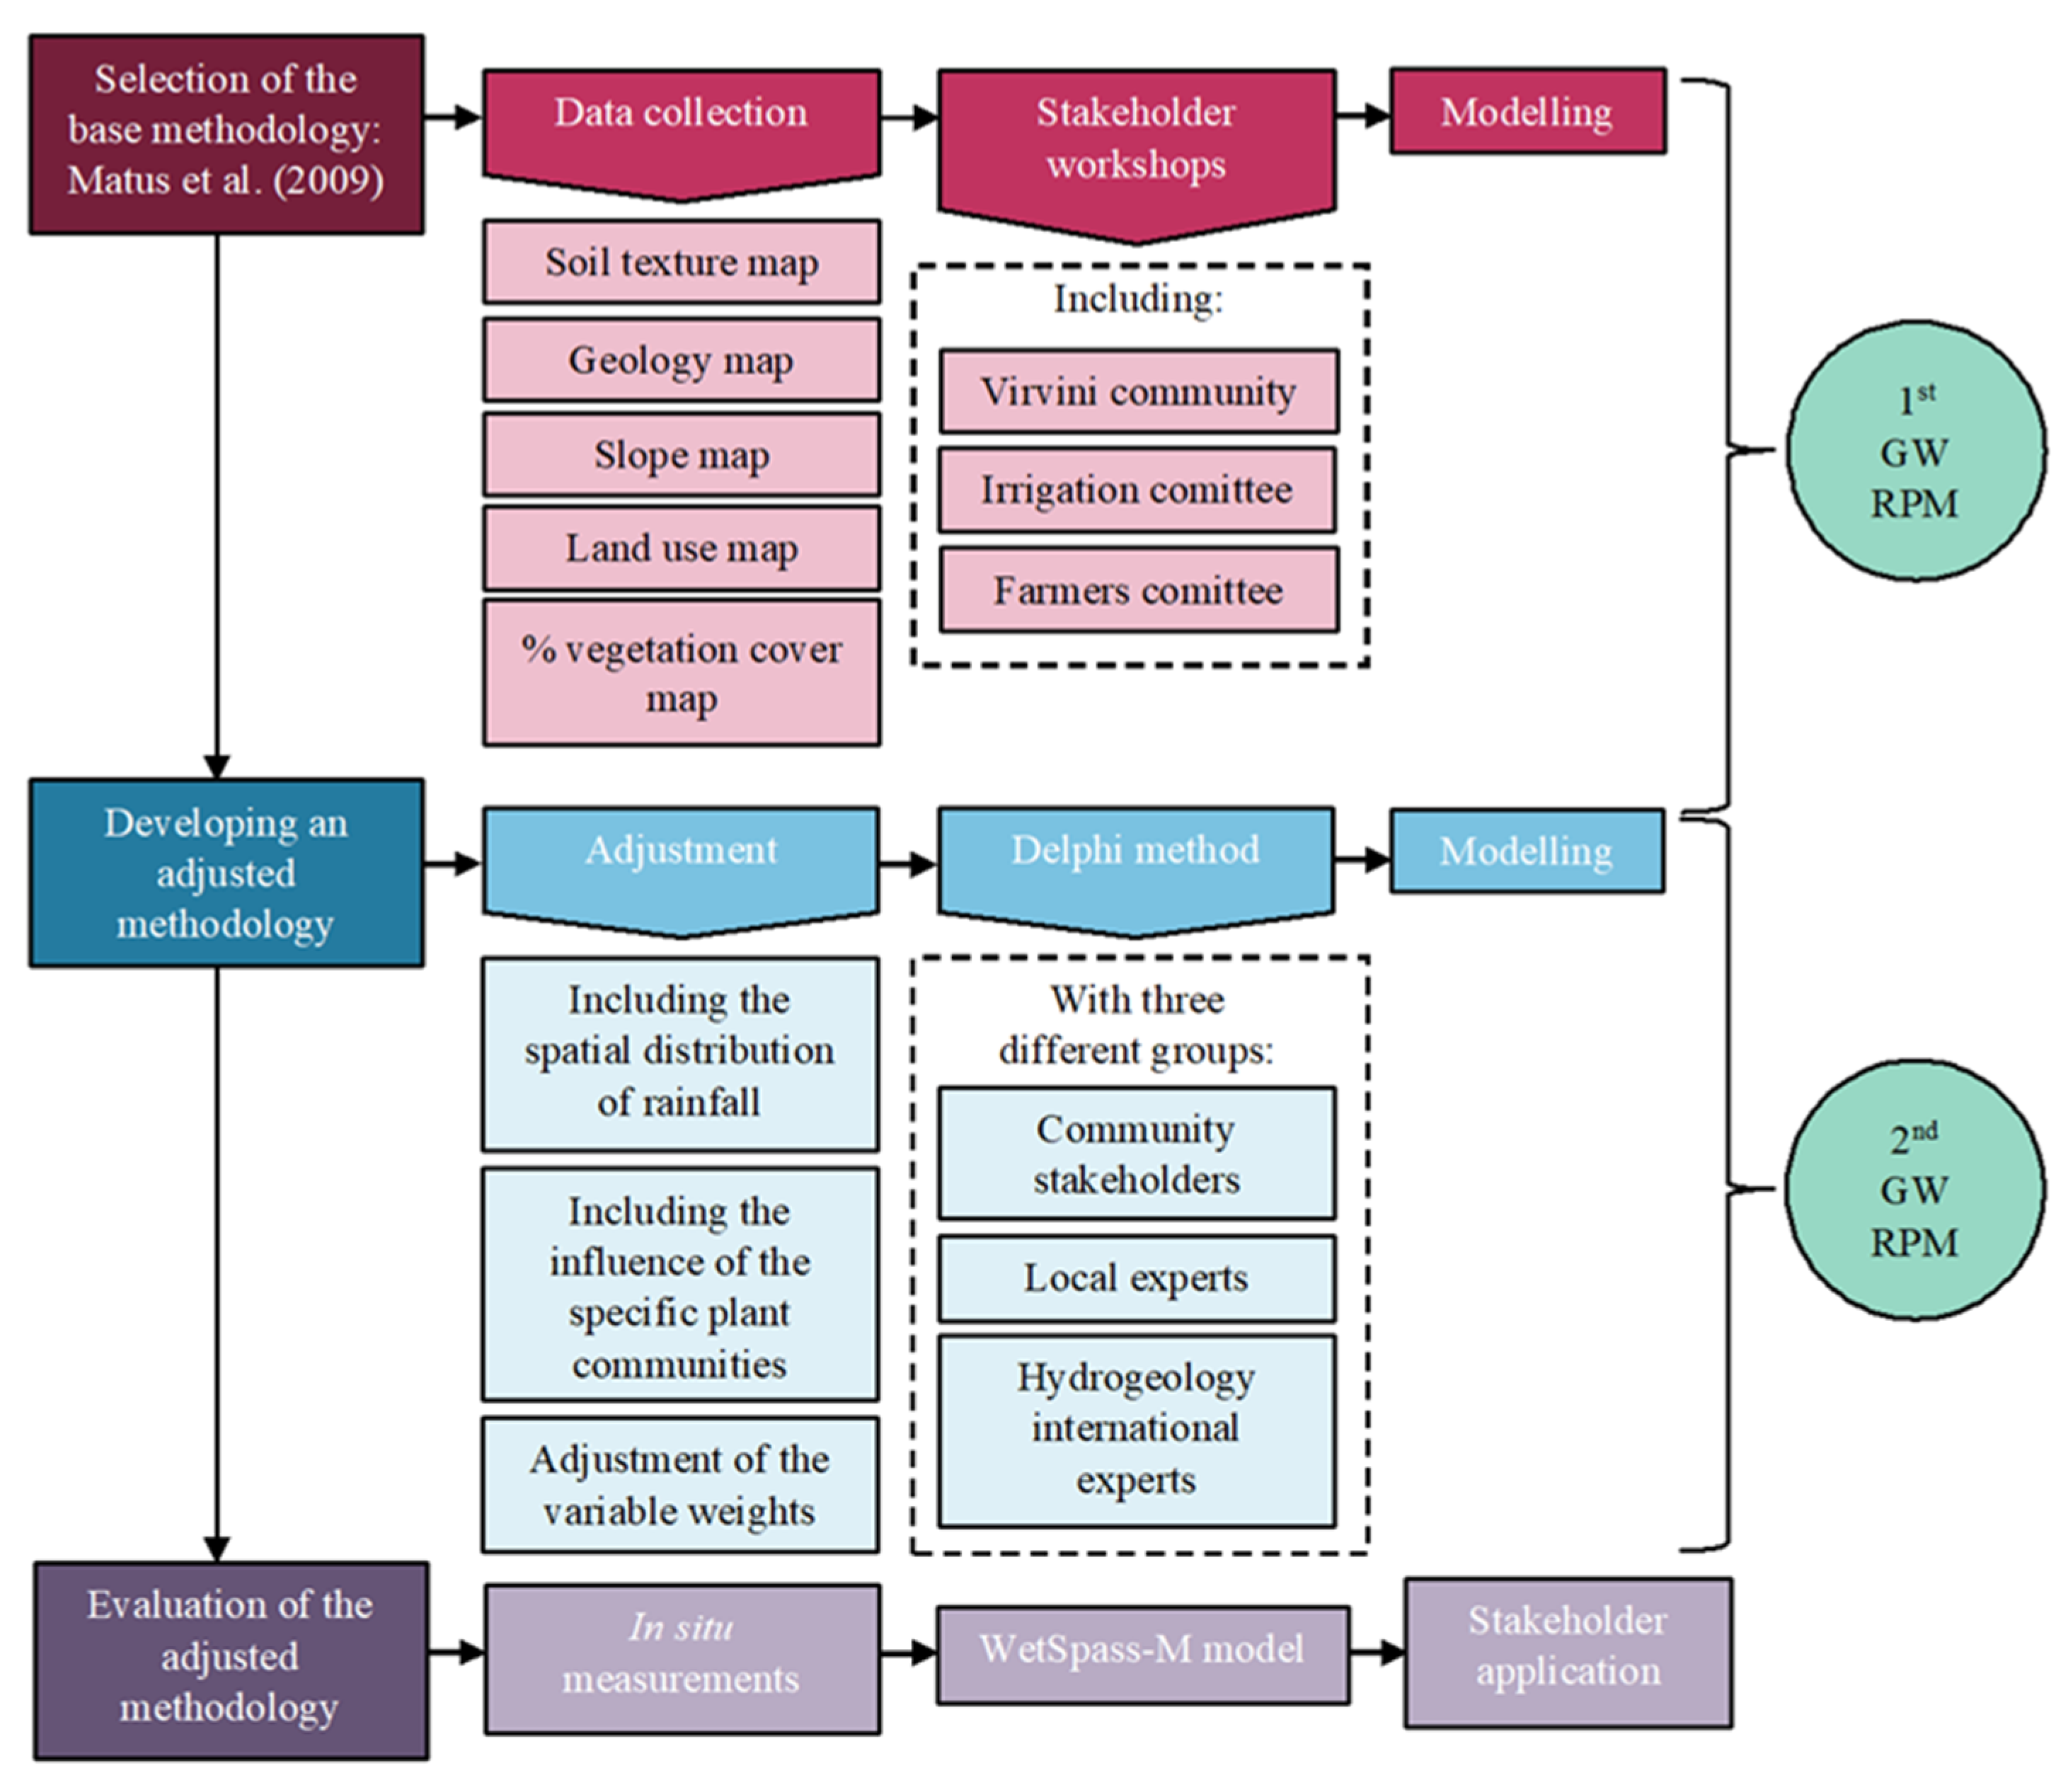
2. Materials and Methods
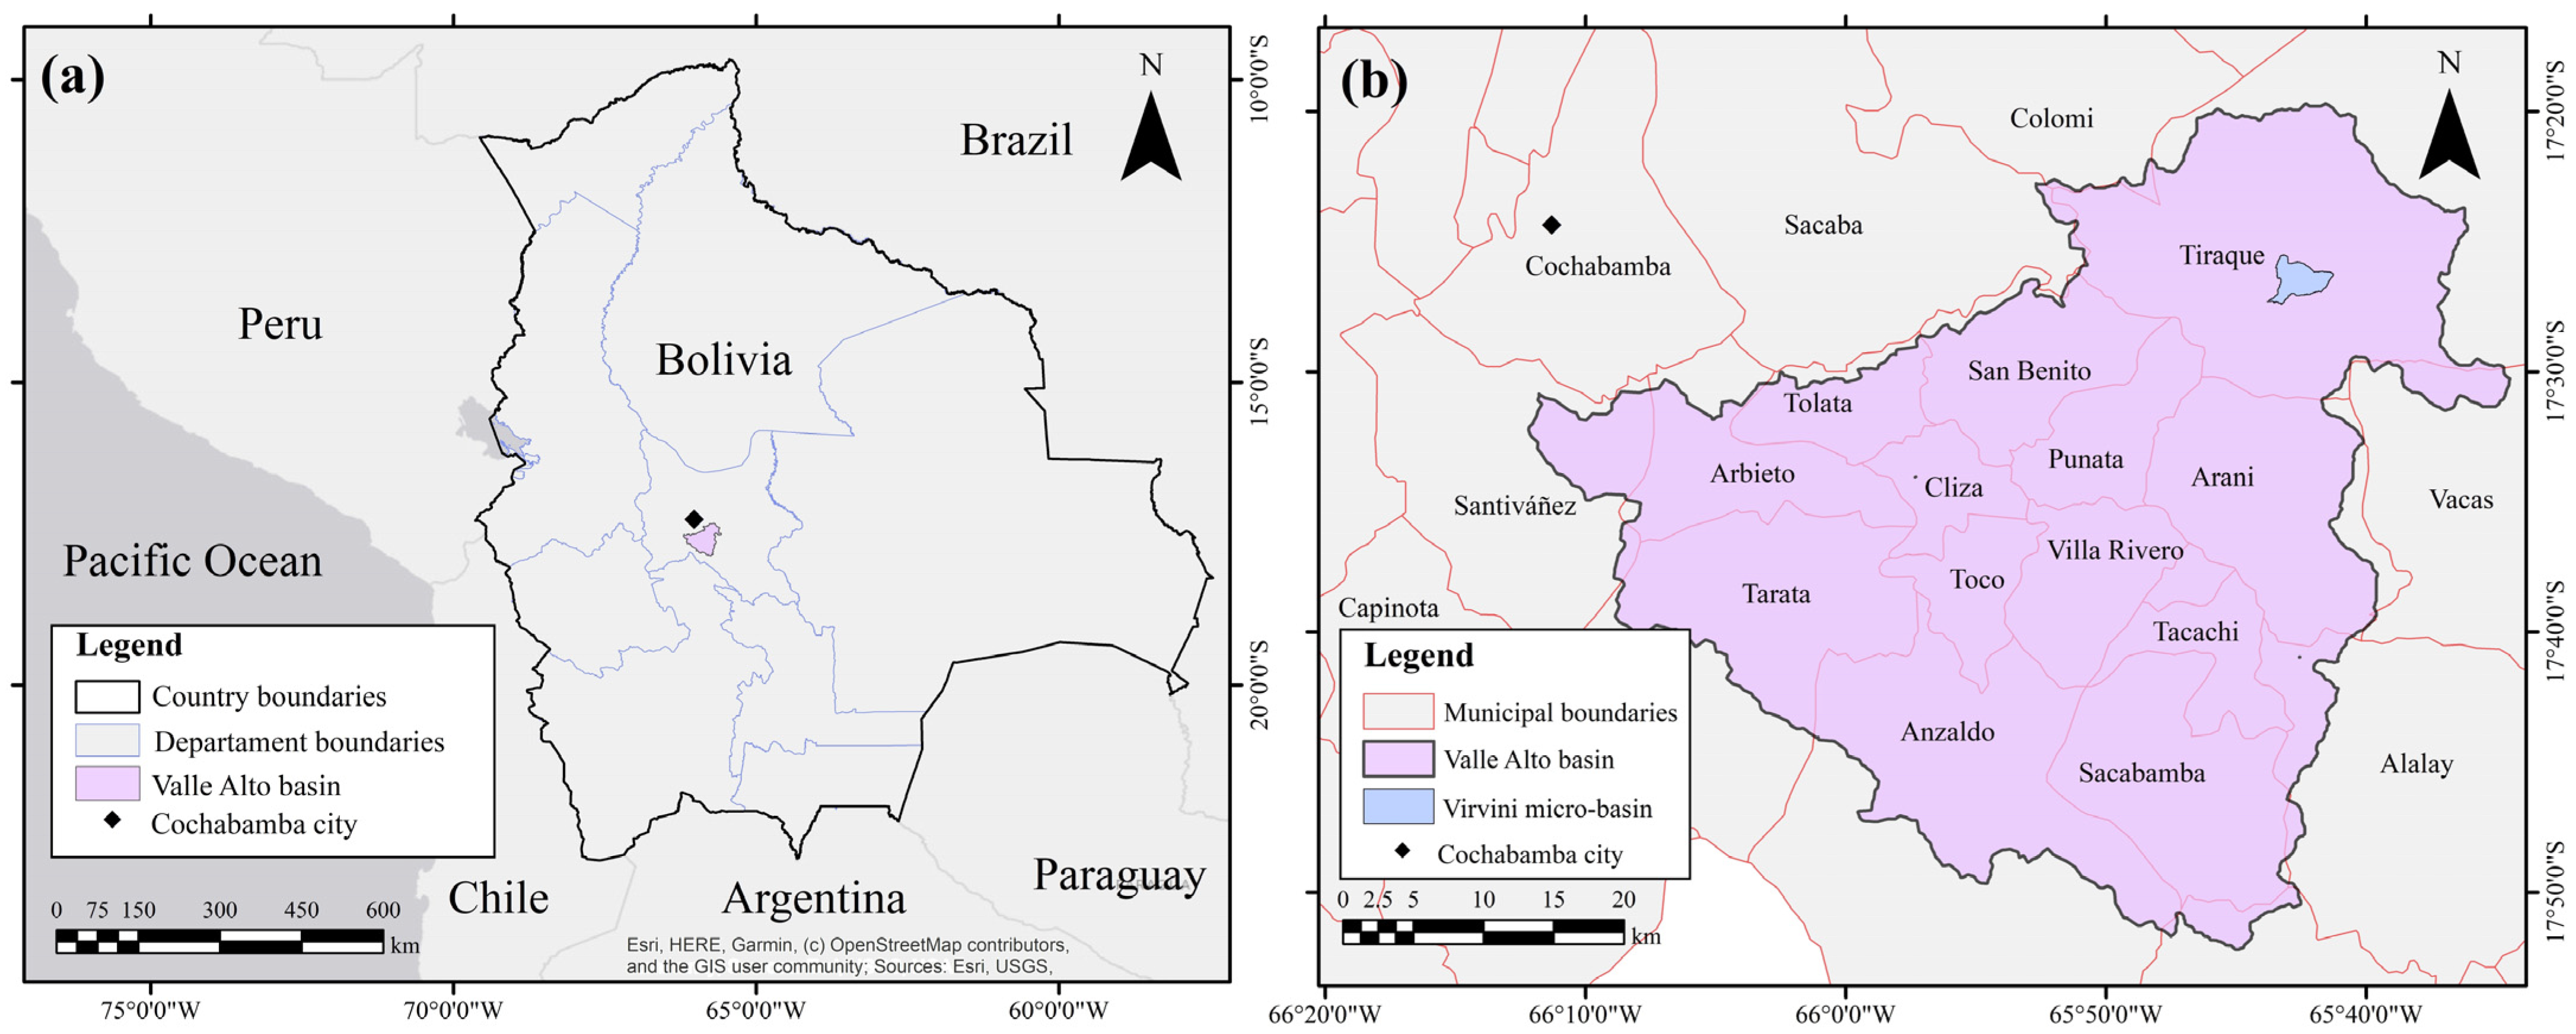
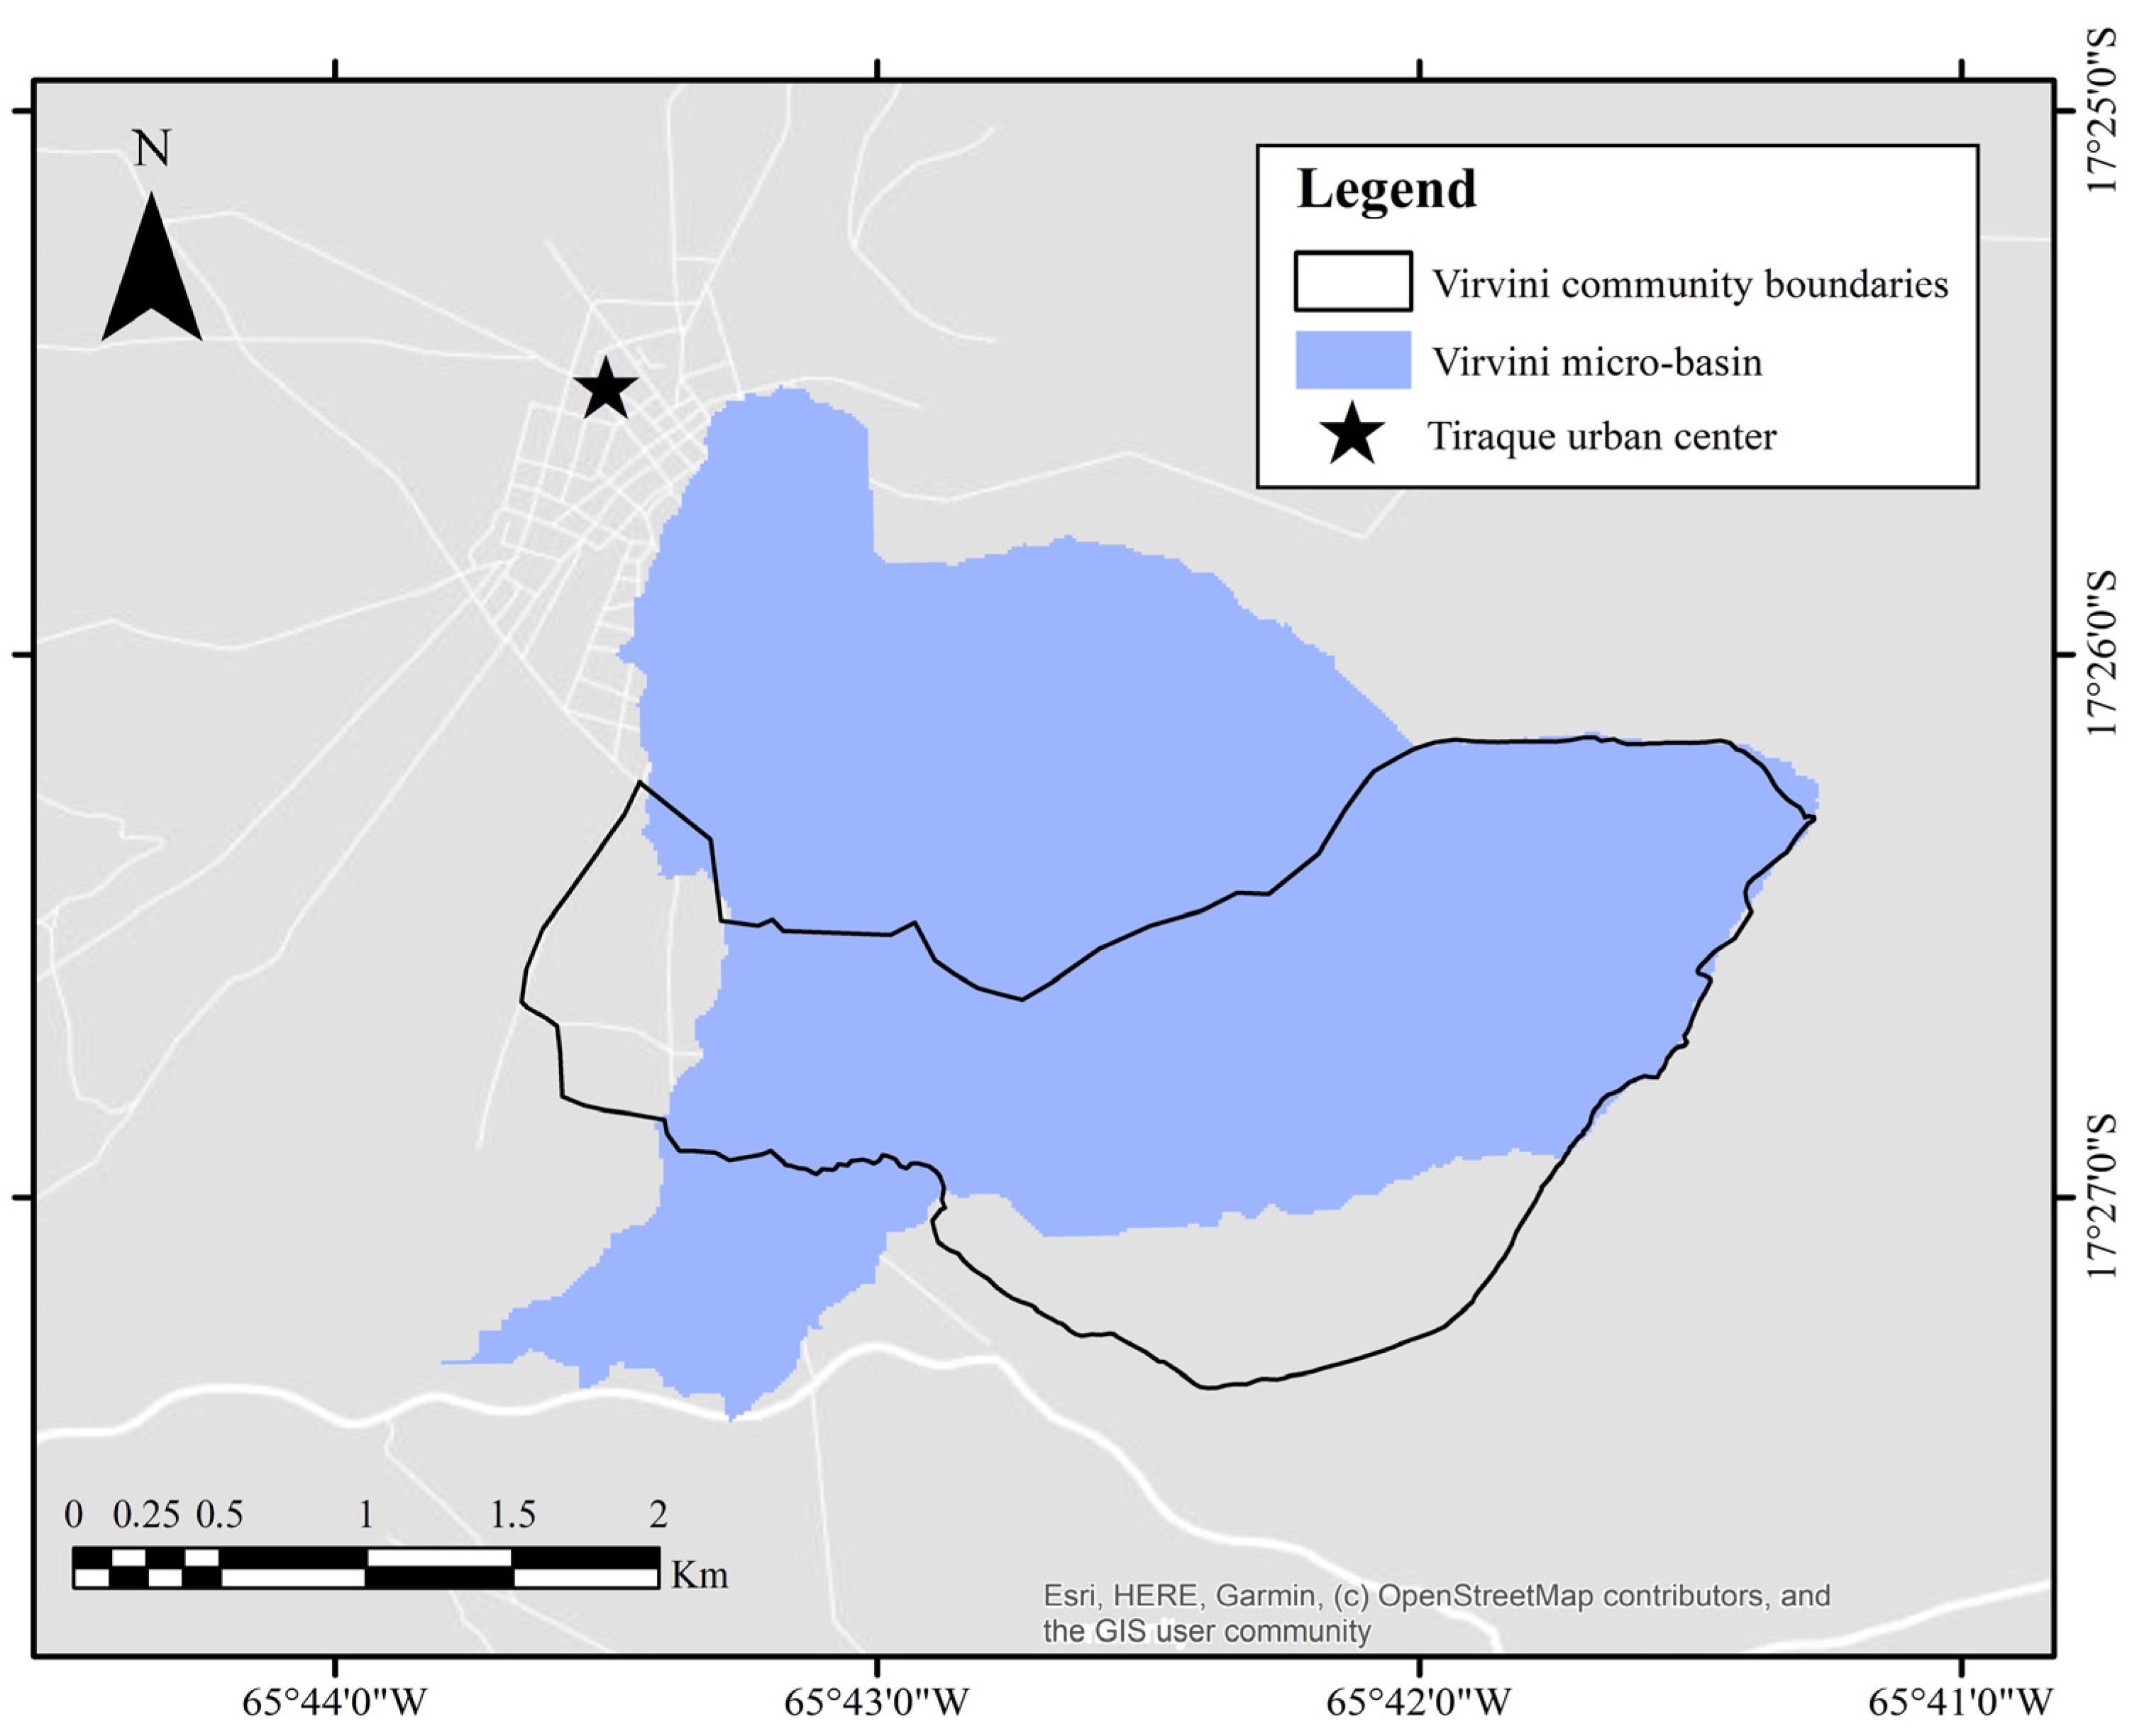
2.1. Study Area

This study was carried out in the Virvini micro-basin in the municipality of Tiraque. Geographically, this micro-basin is located between south latitudes 17°25′ to 17°28′ and west longitudes 65°41′ to 65°44′, northeast of the Valle Alto basin and 60 km east of the municipality of Cochabamba, capital of the department of the same name (Figure 1). The study area is characterized by annual precipitation of up to 1000 mm [49,50]. The hydrological cycle in the region commences in October and persists until February, while the dry season endures from May through September [50]. The annual relative humidity is approximately 40%, with a relative humidity of 30% in dry periods and the wettest period, spanning from September to February, reaching a relative humidity of 70% [50]. The average temperature in the basin is registered at 15 °C, with the highest temperatures observed during the rainy season at 25 °C and the lowest during the dry season at 0 °C [49,50]. The Millu Mayu River is recognized as the most significant surface water body in the micro-basin, accompanied by seven springs primarily located in the lower section towards the western region of the basin [49].
The selection of this 7 km2 micro-basin as a case study is a response to the sociopolitical particularities of the region; even though the proposed policy was at the municipal level, the different rural communities of Tiraque showed different levels of openness to allowing scientific research within their administrative limits. Therefore, after several workshops and meetings with community leaders, the Virvini community agreed to collaborate with the study and was selected as the pilot territory for this research. Consequently, the study micro-basin was delimited so that it fitted as closely as possible to the administrative limits of the Virvini community. To do this, the Pfafstetter tool for the ArcGIS 10.8.2 software was used [51], obtaining the delimitation in Figure 2.
The Virvini micro-basin consists mainly of mountain ranges and plains (alluvial Altiplano or high plateau) formed by thick fluvial glacial sediments with fine alluvial dispositions [49]. On the other hand, horizontal alluvial formations with peat beds can be found around the northern part of the basin, as well as wavy terraces among several plains to the south [50,52]. This micro-basin is located between three different altitudinal belts: the head of the valleys, between 3100 and 3350 m.a.s.l.; transition areas, from 3500 to 3650 m.a.s.l.; and, finally, puna areas, ranging from 3650 to 4500 m.a.s.l. [50].
According to the International Terrestrial Ecological Systems Classification (ITESC), the potential (or ideal) vegetation in the study basin consists of a matrix dominated by hygrophytic shrubby grasslands of variable density, often combined with forest vegetation (mainly Polylepis yungueño forests, with series of Styloceras columnare and Polylepis lanata) [53]. As an important feature, the Virvini micro-basin contains important forest areas for introduced species such as Eucalyptus spp., and, to a lesser extent, Pinus spp., mainly in privately owned forests used for logging purposes [49,50]. However, during recent decades, vegetation cover has decreased due to the expansion of urban areas, lack of soil conservation management, and inappropriate activities related to agriculture, such as overgrazing and monocultures [49].

2.2. Data Collection and Procedures

As seen in the methodology flowchart (Figure 3), a review of the literature was conducted to select the appropriate methodology for the case study. As a result, a GIS-based Analytic Hierarchy Process (AHP) proposed by Matus et al. [46] was chosen as the base approach due to its particular usefulness in scenarios of little available data and because it offers the possibility of incorporating the knowledge and participation of local stakeholders. Additionally, many case studies in Latin America have successfully applied this method [13,35,42,54].
Then, following the guide provided by Matus et al. [46], a series of thematic maps of the study basin (with a spatial resolution of 15 × 15 m) were collected and developed, corresponding to the five variables that this methodology considers for the identification of groundwater recharge zones (Figure 4):
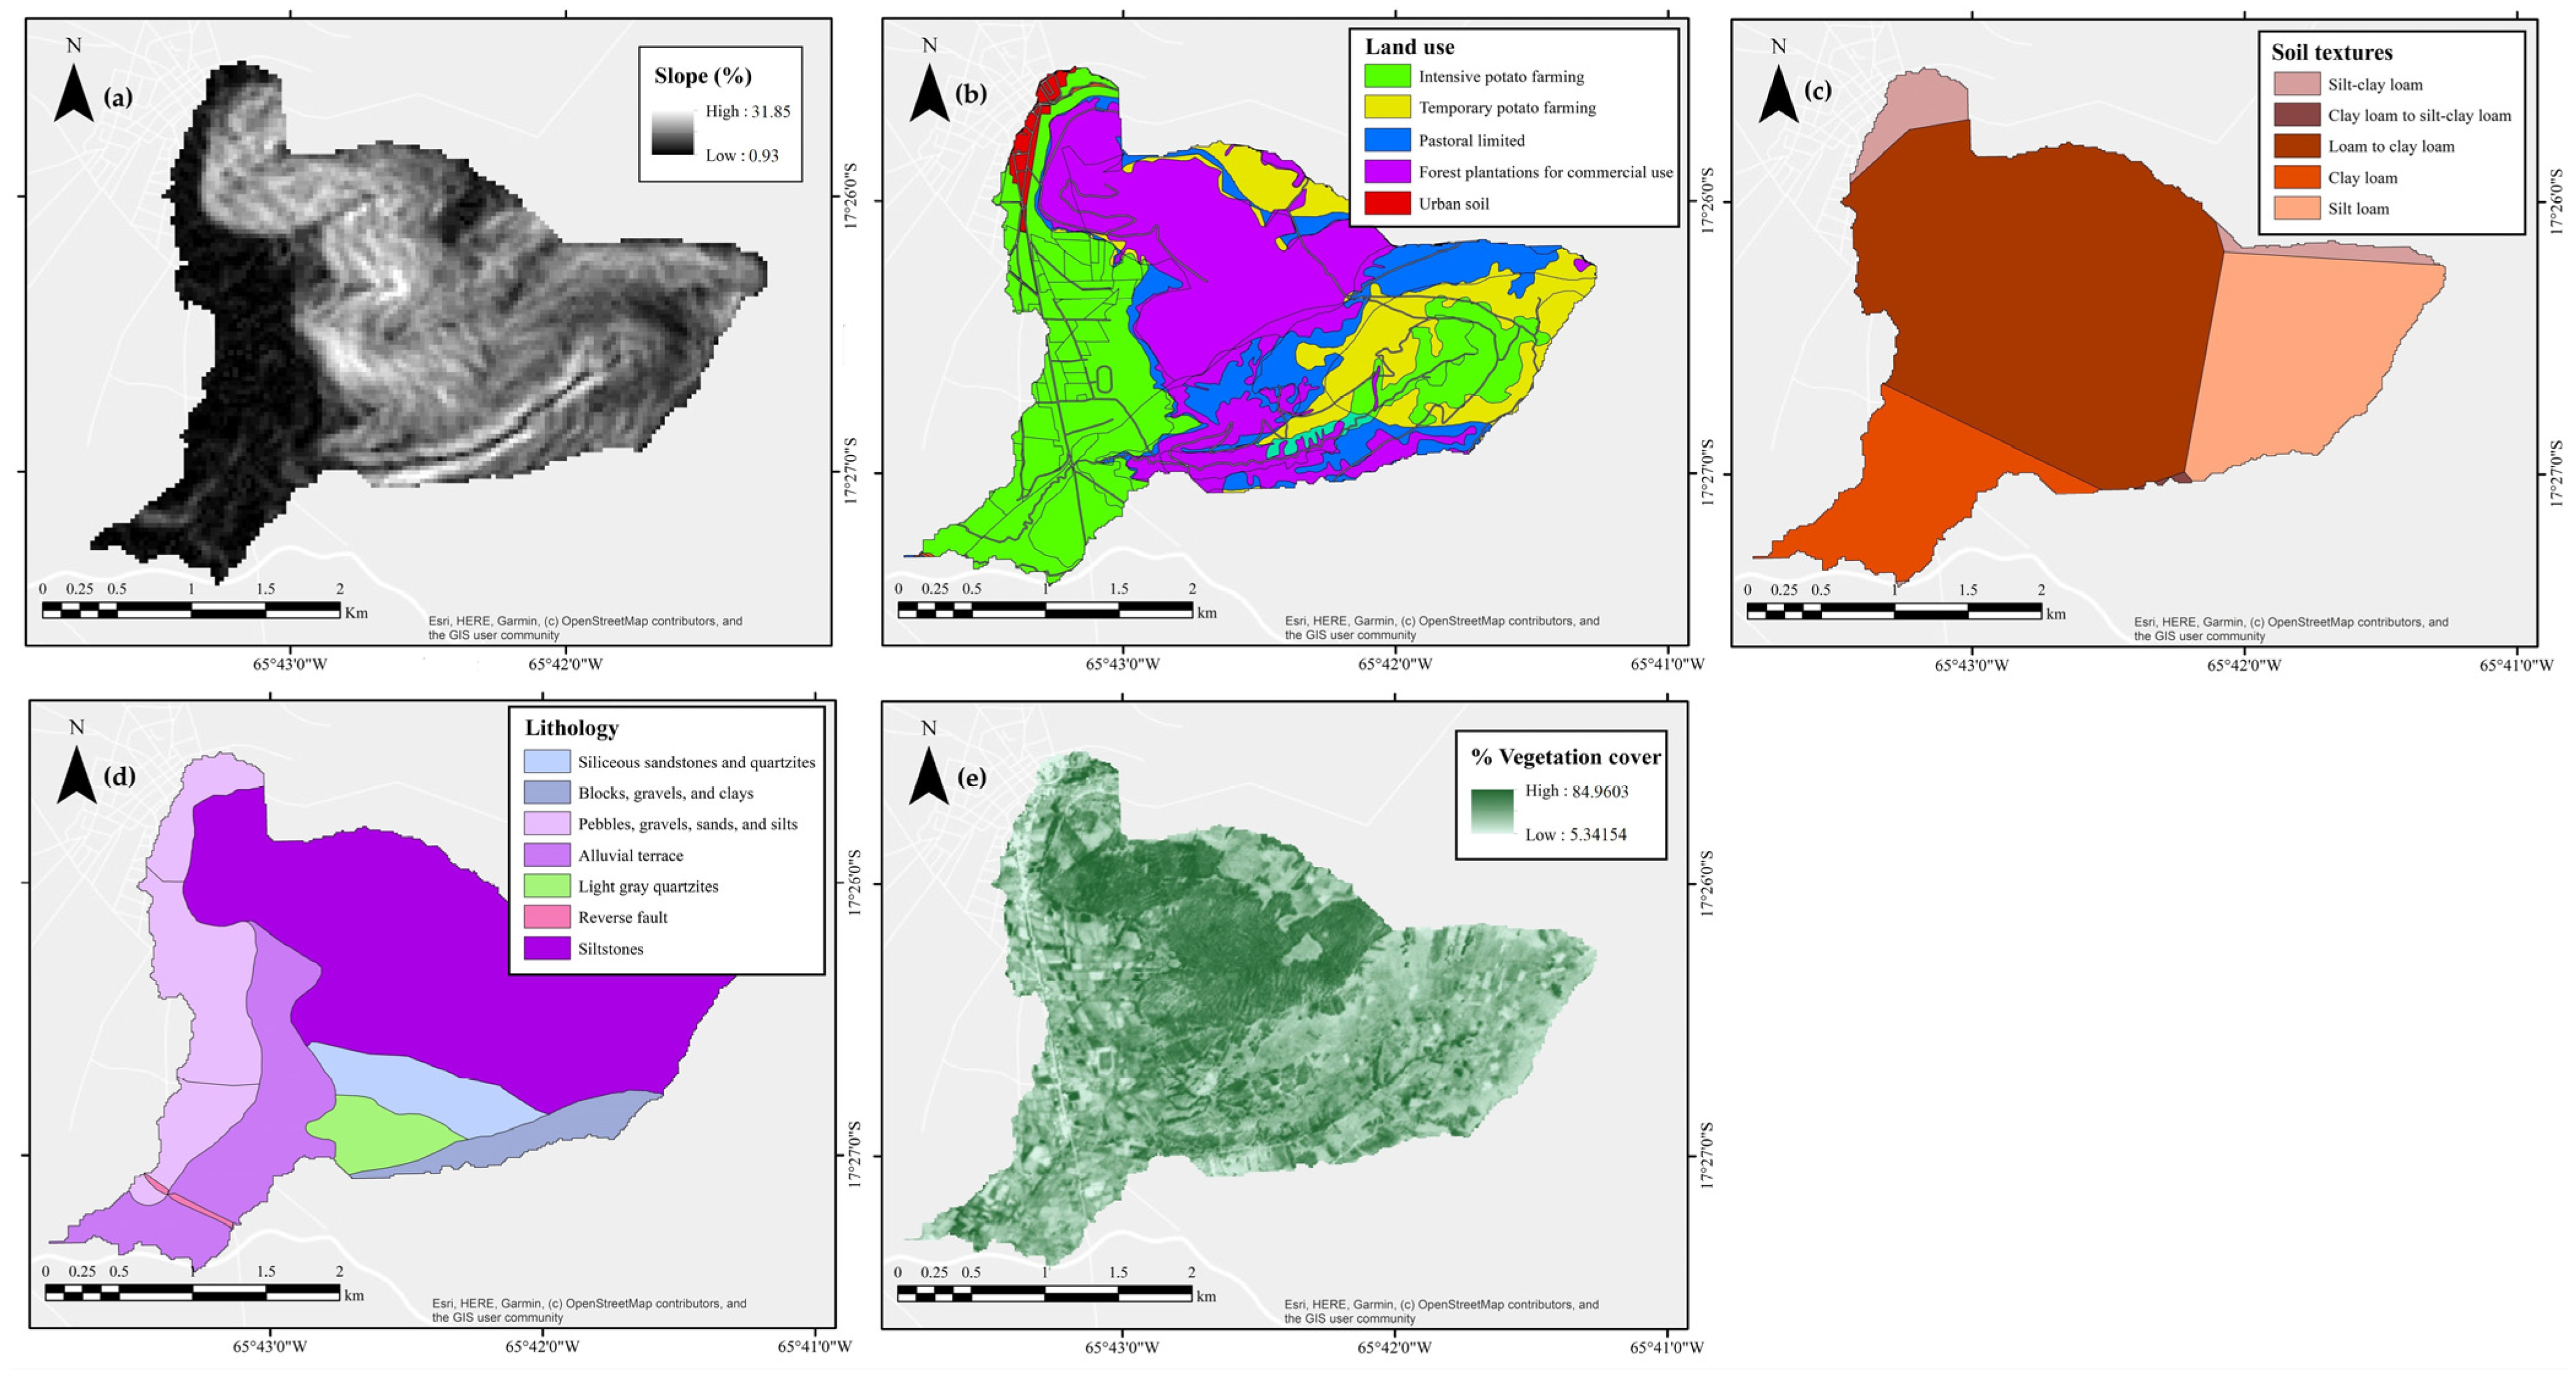
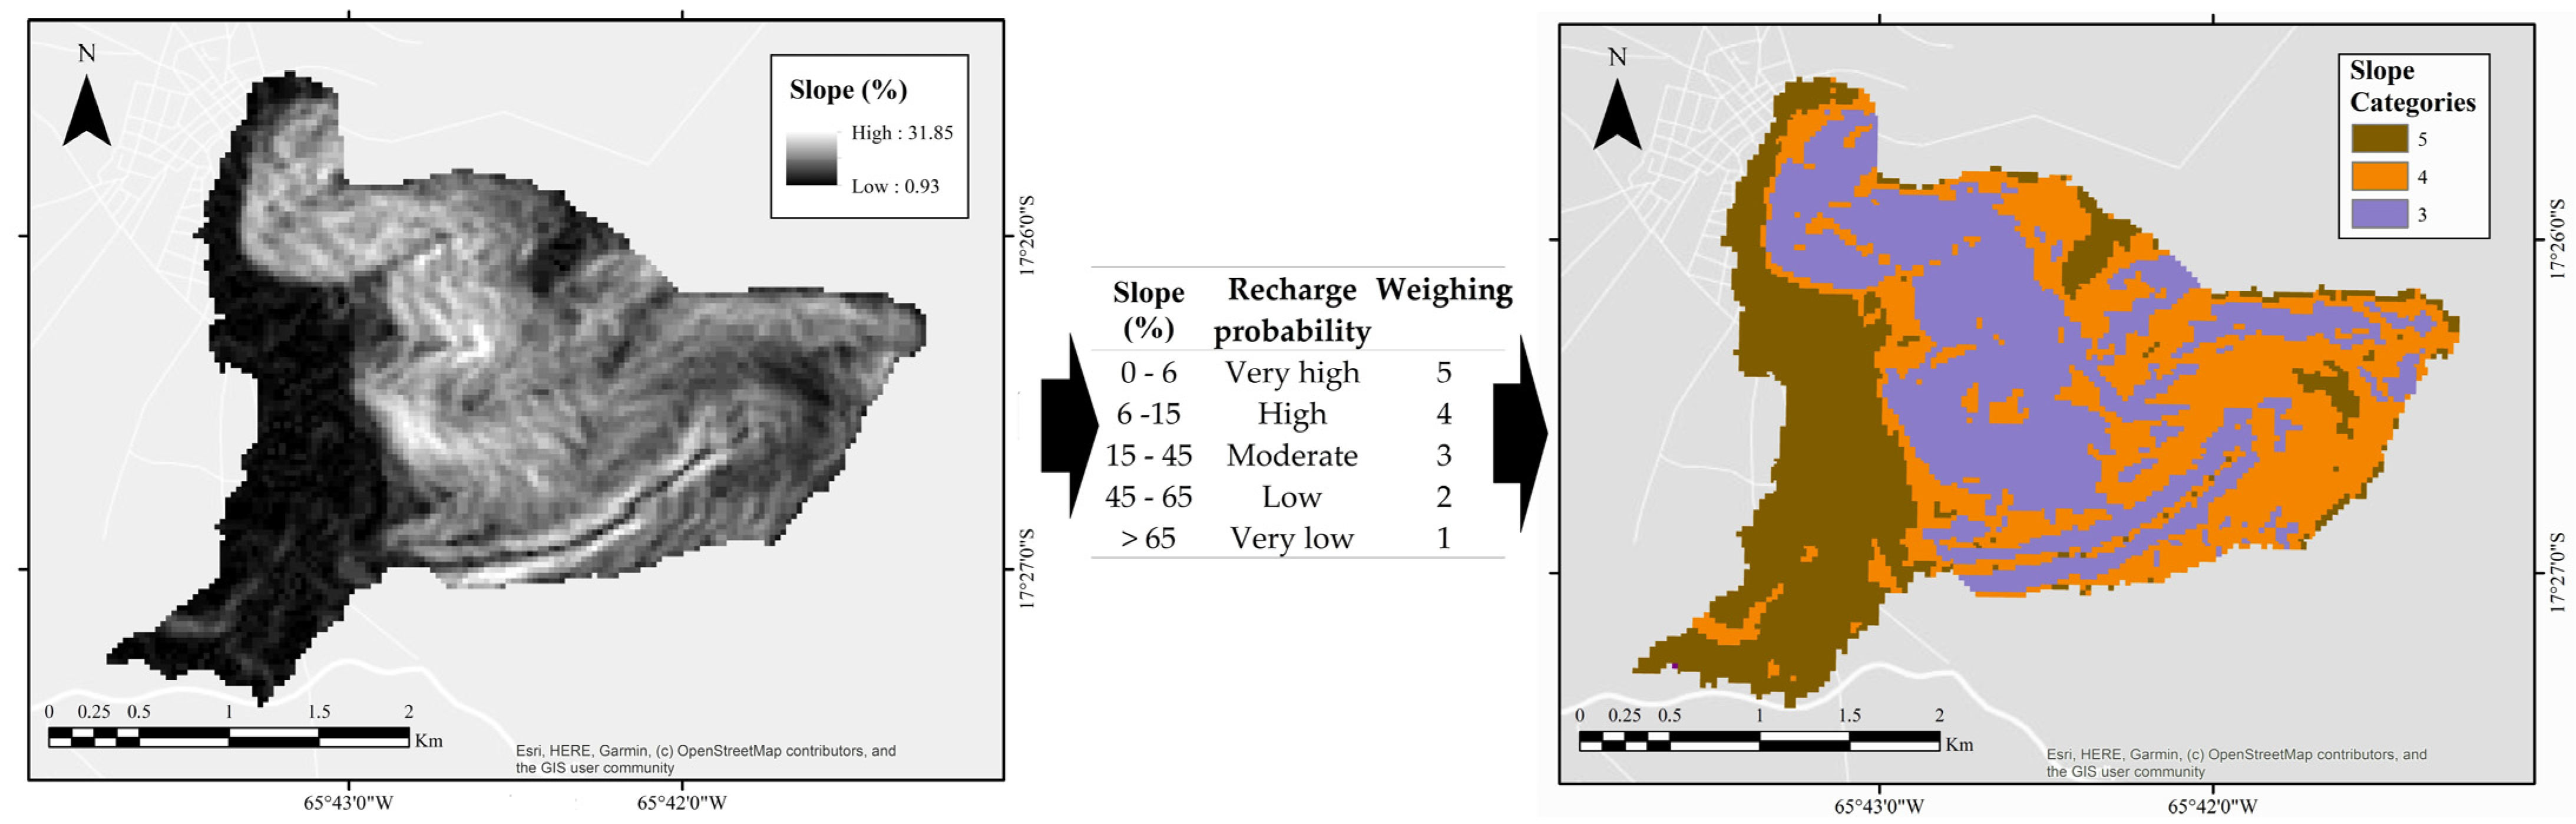
  • A slope map created from the digital elevation model (DEM) downloaded from the Shuttle Radar Topography Mission, NASA [55];
  • A land use map [56];
  • A soil textural map [56];
  • A lithological map [56];
  • A map of the percentage of vegetation cover. To obtain this input, the normalized difference vegetation index (NDVI, from the Sentinel-2 satellite) was used to derive the fraction of vegetation coverage (FVC) using the relationship proposed by Carlson and Ripley [57]:
F V C = ( N D V I N D V I bare N D V I veg N D V I bare ) 2
NDVIbare and NDVIveg are values obtained from field observations of the NDVI patterns. In this sense, NDVIbare represents the NDVI threshold value for completely raw pixels, while NDVIveg is the minimum value for fully vegetated pixels.
Subsequently, the input maps were rasterized using the ArcGIS 10.8.2 software, also recategorizing their attributes (with values from 1 to 5) according to the classification criteria proposed by Matus et al. [46] based on their aptitudes regarding water infiltration (Figure 5).
Once the input maps were set up, a map algebra process was executed using Equation (2) as the base algorithm [46], where each assigned cell value of each input map was multiplied by its corresponding weight factor according to the methodology proposed by Matus [8,46]. Finally, the elements were summed:
R P = [ 0.27 ( S ) + 0.23 ( T ) + 0.12 ( R ) + 0.25 ( C V ) + 0.13 ( L U ) ]
where:
  • RP = groundwater recharge score
  • S = slope
  • T = soil texture
  • R = rock type (from the lithological map)
  • CV = % of vegetation cover
  • LU = land use
Lastly, the map obtained from this process was then classified within the range of groundwater recharge probability proposed by Matus et al. [46], as detailed in Table 1:
To better understand the local water-related context, participatory workshops were carried out with the participation of local stakeholders, represented mainly by the committee leaders in irrigation and farming. The workshop outlined basic concepts about groundwater recharge zones and some elements to be used to identify said zones. In addition, the water springs in the basin were identified, georeferenced, and stored on a database.

2.2.1. Adjustment of the Initial Methodology to Local Conditions

This study will present a detailed explanation of the modifications made to the proposed Matus et al. [46] approach to better conform with the distinct local conditions of the Virvini micro-basin in Section 3.2 and Section 3.3 of the results and discussion section. Specifically, the land use variable was expanded to incorporate particular plant communities within the basin, creating a more comprehensive land use and land cover (LULC) map. Additionally, the study basin’s differing latitudinal location and precipitation patterns from the Caribbean basins in which the Matus model was developed prompted the inclusion of a spatial rainfall distribution variable in the proposed model. Data related to these two elements were collected to improve the model. Therefore, the specific plant communities in Virvini were described during field surveys performed at ten points within the micro-basin, located in differentiated patches of vegetation, and chosen based on previous observations and the information provided by local stakeholders and satellite images (Figure 6a). Regarding the meteorological information, the average yearly precipitation data were obtained from the National Meteorological Service database of six nearby stations for ten years (2010–2019) [58]. These stations included: Arani (2749 m.a.s.l.), Colomi (3309 m.a.s.l.), Kaspi Kancha (3915 m.a.s.l.), Koari (3704 m.a.s.l.), San Benito (2710 m.a.s.l.), and Tiraque (3304 m.a.s.l.) (Figure 6b).
To fill the gaps in the meteorological data, a multiple linear regression calculation was performed using the HEC-4 2.3 software [59]. This statistical method, widely validated and more sophisticated than a simple interpolation, generates more accurate estimates of missing data even when the missing station is not closely aligned with the neighboring stations [60,61]. To achieve this, it was first verified that the conditions the World Meteorological Organization recommended were met, including (a) having at least 80% of the annual records and (b) not having more than three consecutive years of missing data [62].
In this sense, rainfall data were used as input to develop a spatial distribution map for the precipitation. In the corresponding literature, different authors propose several different methodologies for data interpolation of the unsampled locations in the basin, the simplest one being to use the data from the nearest meteorological station [63,64]. Even though, in this case, the closest meteorological station was less than one kilometer from the study basin (Tiraque station, Figure 6b), the local altitude gradient of more than 500 m within the study basin required a more realistic representation of the rainfall distribution. It is essential to consider that terrain’s effects on rain distribution, such as altitude or the obstruction and uplift of flow patterns by the topography, necessitate a three-dimensional approach when interpolating data [63]. Considering these aspects, a raster map corresponding to this meteorological variable was generated using a very straightforward interpolation approach, which was derived from a linear regression between the DEM and the yearly average precipitation. This methodology is endorsed in low-density networks of rain gages with correlations greater than 0.75, such as the case of the present study [63].

2.2.2. Incorporating Academic and Non-Academic Knowledge through the Delphi Method

Since the original methodology proposed by Matus et al. [46] was adjusted for this study by adding a new variable to the equation, the weighting of the variables in Equation (2) had to be redistributed for the adjusted approach. In addition, the upgrade and inclusion of new specific categories of LULC have implied new recategorization of the corresponding evaluation tables. To achieve these adjustments to the original methodology, it was decided to integrate the knowledge of several groups of experts through the Delphi method [65,66]. This method aimed to achieve a consensus based on discussion among the experts through an interactive process consisting of questionnaires and interviews related to groundwater recharge. The decision to use this tool was based on its usefulness in complex problems with high levels of uncertainty and subjectivity [67,68]. By soliciting feedback from multiple experts, the Delphi method can capture diverse perspectives and insights which may not be apparent from a single individual’s viewpoint [69,70,71]. This approach provides a more objective and systematic approach to assigning weights to variables, leveraging the expertise of multiple participants and ensuring a rigorous and objective process [68,69,70]. In this case, the consultation was carried out with three different groups: ten Bolivian experts with vast experience in the study area, eight international hydrogeology experts who provided their general knowledge on recharge processes, and, finally, five members of the Virvini community who were consulted so that local ancestral knowledge was also considered. The first two groups included scientists and technicians specialized in hydrology, hydrogeology, geology, ecology, agronomy, environmental engineering, and civil engineering. The survey included questions about the influence of land use and vegetation cover on the recharge process, the weighting of the categories of those two variables concerning their effect on infiltration, and the weighing of the six variables to be included in the proposed adjusted algorithm.
Once the interviews were carried out, contingency tables were prepared for each group to determine whether there were significant differences between their answers. In the analysis, the non-parametric statistic Kruskal–Wallis test was used on the XLSTAT extension for Microsoft Excel, with a significance level of 95%. Frequency tables were generated for every consulted group to determine the opinion frequency for each variable, category, and consulted group. For this, a null hypothesis (H0) and an alternative hypothesis (H1) were proposed:
H0. 
There are no significant differences between the criteria of the three consulted groups.
H1. 
There is a significant difference between the criteria of the three consulted groups.

2.2.3. Application of the Adjusted Approach for the Identification of Groundwater Recharge Zones

Once it was statistically demonstrated that the three groups shared all the adjustment criteria, a new process of modeling was carried out. Using this method, potential groundwater recharge zones were determined again by following the distribution of the new weights for the variables and categories in the adjusted approach. Once this was complete, considering the results of the previous calculation, both procedures and their results were compared.

2.2.4. Validation of the Adjusted Approach

Several procedures were applied to validate the results obtained by applying the newly adjusted algorithm in the Virvini micro-basin to overcome subjectivity related to the attribution of weights through the Delphi method. In this sense, the results were evaluated in three different ways: (i) using in situ measurements; (ii) using simulated recharge of a widely used, spatially distributed water balance model; and (iii) through stakeholder workshops. This multi-aspect evaluation increased the reliability of the results obtained through the adjusted method.
The in situ observations were made using a double-ring infiltrometer to measure the infiltration curves and base infiltration rates in the areas of interest. These measurements were taken during the dry season (August) to avoid water-saturated soils. The diameters of the rings were based on the specifications suggested by Soilmoisture Equipment [72]: 0.28 m for the inner ring and 0.52 m for the outer one. The sampling points were selected based on the recharge probability categories obtained for the Virvini micro-basin with both methodologies, choosing areas where the two procedures coincided (as a control) and areas where they did not, in order to compare them.
Additionally, a conventional hydrogeological methodology was applied in the study basin to validate the performance of the adjusted model. A semi-physically based, spatially distributed water balance model, WetSpass-M [73,74], was used to simulate, once again, the spatially distributed monthly groundwater recharge in the Virvini micro-basin. The WetSpass-M model estimates the groundwater recharge as a residual of the water balance, splitting each raster cell into four different fractions—impervious, vegetated, open-water, and bare soil—to allow land cover heterogeneity [75]. The model’s input includes spatially distributed maps of land cover, soil texture, topography, climatic data (rainfall, wind speed, temperature, evapotranspiration, and the number of rainy days), and groundwater depth. A reference value of 20 m was used as a constant for the last input due to the lack of current groundwater depth information in the Virvini micro-basin. The characteristics of the model inputs are summarized in the study conducted by Mustafa et al. [75].
Finally, the Virvini community validated the proposed method through a series of workshops in which the participants were asked to illustrate the characteristics and ratings of the basin on maps based on the model. The maps obtained for the six variables were digitized and rasterized to apply the adjusted method based on local perception. It is important to acknowledge that the inputs used to validate the methodology were solely based on the community’s perception of their territory, which may not always be accurate.

3. Results and Discussion

3.1. Initial Identification of Groundwater Recharge Zones

Figure 7 illustrates the initial results obtained by applying the Matus equation to the Virvini basin. The figure shows that potential groundwater recharge zones are mainly located in the basin’s flat, highly vegetated areas. These results are reasonable, since the variables that best explain water infiltration according to this method are, precisely, low slopes and high vegetation cover. In contrast, the areas classified with low recharge probability values mostly coincide with steep slopes, poor vegetation cover, and unfavorable land uses.
Although the Matus et al. [46] model has already provided us some insights into the dynamics of groundwater recharge in the basin, specific observations can be made on the proposed model, especially by reviewing other studies on the subject.

3.2. Inclusion of a Meteorological Variable in the Adjusted Approach

Much of the current literature on the delimitation of potential groundwater recharge zones pays particular attention to meteorological variables to more accurately design models that represent reality [45,73]. Usually, the meteorological variables primarily used in this topic include evapotranspiration, radiation, relative humidity, and precipitation [76,77,78]. The number of such variables can be quite significant, depending on how precise the modeling process and the data availability for the study zone are desired to be. Considering that the methodology proposed by Matus was developed for a primarily permanent thermal summer (Costa Rica), it is reasonable that climatic conditions have not been considered as a determining factor for prioritizing recharge zones. However, the Bolivian inter-Andean high valleys (where the Virvini sub-basin is located) are characterized by a pluvioseasonal climate determined spatially by orography and altitude gradients [79]. Therefore, to represent the conditions of the study basin more accurately, a climatic variable was included in the algorithm. However, considering that this study aims to develop an accessible methodology for rural stakeholders, the selected variable was the spatial distribution of rainfall. Considering the premise, this variable is ideal, as it is relatively easy to characterize and qualify even by non-specialists. Moreover, the differences in the spatial distribution of precipitation between one point and another can be a crucial factor, especially when prioritizing potential groundwater recharge zones for their protection.
Regarding the availability of meteorological data for the study area, only two of the six selected stations presented a complete annual precipitation series for the study period. The series of all four remaining stations required completion using HEC-4 software, with the Kaspi Kancha station being the one with the most presented gaps (30 missing months in total). Under this premise, only Colomi and Tiraque stations had complete annual records, followed by Arani and San Benito stations, with fewer than three missing months each.
While performing a linear regression between the elevation and yearly average rainfall values corresponding to the six stations, the statistical R2 yielded a value of 0.896. This value shows a significant correlation between both variables, as precipitation increases linearly with increasing elevation. According to the literature, the correlation occurs because the air is vertically lifted due to the orographic effect of mountainous terrain, and the following condensation process is caused by adiabatic cooling [63].
This elevation and average rainfall trend is typical of mountainous zones [80,81], and can be significant, especially in arid, semi-arid, and sub-humid zones such as the study basin [21]. Past studies in the Valle Alto basin have detected the same trend as that observed in this research (Figure 8), where precipitation increases continuously in the northeast direction of the Valle Alto basin, where the Virvini micro-basin is located [52,82,83,84].
Once the interpolation map for the rainfall distribution had been developed, the criteria to classify the values in ranges congruent with the proposed methodology was established. In this sense, the thresholds for the classification categories are based on the typical annual precipitation values for the inter-Andean dry valleys, whose precipitation values range between 50 and 700 mm per year−1 [53]. As shown in Figure 8, 4 rainfall categories were bounded, considering the following values: 450–500 mm = 3; 500–550 mm = 3.5; 551–600 mm = 4; and >600 mm = 4.5.

3.3. Considerations Regarding the Vegetation Cover and Its Influence on the Recharge Process

Returning to Figure 7, an in-depth analysis of the study area based on field observations revealed that most of the potential groundwater recharge zones, according to the Matus et al. [46] methodology, were located in plots of introduced forest species of the genus Eucalyptus. Afforestation using introduced species is a common practice of land use change applied in different ecosystems worldwide, aiming to improve environmental services such as erosion control and flood regulation [85,86]. As in the case of the study basin, these practices often prioritize the use of fast-growing timber species with high commercial value [86], such as Eucalyptus and, on a smaller scale, pine trees [50].
However, several authors have warned about the possible adverse effects of these practices (especially in the case of Eucalyptus trees), which are related, among other effects, to water losses in the water balance of a basin [85,86,87]. Other adverse effects of Eucalyptus trees may include water repellency, which affects the hydraulic properties of the soil [88] and water losses in the system due to evapotranspiration [85,89]. In addition, due to the depth of their roots, these species can reduce groundwater recharge and river discharge rates compared to grasslands and crops [90,91,92].
Thus, the application of the Matus equation under the specific conditions of the study area could be overestimating the infiltration capacity by simplifying the influence of the vegetation cover to only the percentage of covered surface, leaving aside the different characteristics of the existing plant communities, which, in this case, are dominated by Eucalyptus plantations. Indeed, this overestimation based on only a few variables can be explained, since this methodology primarily exists as a simple procedure by which local stakeholders can carry out the integral management of the basin. However, the oversimplification of the effect of plant communities on infiltration in the study area can lead to misinterpreting the variables and, therefore, to incorrect water management in the basin.
It is important to note that the controversy surrounding vegetation’s influence on groundwater recharge is not only limited to a single species or genus. Vegetation cover is probably the most debated variable regarding groundwater recharge, as studies worldwide have not agreed on the benefits or harms that this variable can exert. The corresponding paradigm seems to have been shifting from one extreme to the other. There are several examples of the benefits of floristic characteristics on the storage and infiltration of water [23,86,93,94], but more recently, a more critical vision has been adopted in which various elements of the vegetation cover are considered factors to the detriment of groundwater recharge (trade-off theory) [85,87,95].
Due to all the points discussed, it was evident and necessary to update these aspects in the adjusted method to reflect the effect of vegetation on groundwater recharge more realistically. Therefore, the next section of the paper (Section 3.4) discusses how these modifications were included in the proposed methodology.

3.4. Results of the Recategorization and Reweighing of the Algorithm’s Variables through the Delphi Method

By applying the Delphi method, it was possible to review the original methodology proposed by Matus et al. [46] so it could be made congruent with the local characteristics. These adjustments necessitated the reweighing of the algorithm coefficients, considering that a new variable was included, and the reclassification of the land use and percentage of vegetation cover categories were also altered based on their influence on the infiltration process.
In this sense, the results obtained from applying the Delphi interviews determined the reclassification of the vegetation cover categories, revealing a slight variation from the original classification and granting a greater quality of infiltration to areas moderately covered by vegetation (Table 2). This modification is likely because the original categories proposed by Matus et al. [46] do not entirely coincide with what has been found in the most recent literature. Nowadays, experts seem more inclined towards the optimal tree cover theory, especially in tropical areas with a dry season [95]. This theory assumes that the potential groundwater recharge is enhanced in situations of intermediate vegetation cover, as opposed to entirely open land or areas covered by canopies of trees. As can be seen in Table 2, the consulted experts in this study seem to agree with this theory, since they suggest that scenarios with 70 to 80% vegetation cover constitute the most favorable situation for groundwater recharge (Figure 9a).
Additionally, considering the remarks regarding the potential impact of specific types of plant communities on infiltration, the Delphi method allowed us to establish that the variable defined as “land use” appeared to be limited. Therefore, the need to add the term “land cover”, referring to the observed (bio) physical coverage on the surface of the earth, became evident [96]. Although, in some cases, the literature on this topic tends to classify land cover into general categories that can be identified from satellite images (e.g., forests, agriculture, wetlands) [97], several authors include specific vegetation and floral characteristics in their definition [96,98] as is the case in this study. Thus, the term “land use and land cover (LULC)” seemed to be adequate to include the nature of the basin surface, and, in this way, the apparent deficiency in the original model could be remedied (Figure 9b).
Regarding LULC, the most representative plant communities in the study area mainly included homogeneous or heterogeneous Eucalyptus plantations, as previously explained. However, it was also possible to identify some reduced patches of endemic plant communities in the area, which had not yet been replaced by for human-related land uses activities. These small patches of native vegetation were, therefore, differentiated and reclassified based on their influence on water infiltration.
Some of these plant communities found in Virvini consist of successional shrublands of the Kewiña forest (Polylepis spp.), considered one of the most endangered ecosystems in the region [99]. These patches of native vegetation also include deciduous species such as Schinus andinus, allowing soil horizon A to be rich in organic matter, thus contributing to water infiltration [10]. The interviewed experts agreed to qualify this type of land cover as an ideal category for groundwater recharge (Table 3).
Regarding the general algorithm, the answers to the Delphi interviews determined the following updated weights:
R P = [ 0.17 ( S ) + 0.18 ( T ) + 0.10 ( R ) + 0.17 ( C V ) + 0.16 ( L U L C ) + 0.22   ( P ) ]
In contrast to the original algorithm, the weights of the variables in the adjusted equation are much more balanced, since the slope, vegetation cover, LULC, and soil texture present similar values. Variables with less similar weights are the rock type and the spatial distribution of precipitation (symbolized as P in Equation (3)). Regarding the geological variable, the proposed methodology also includes an area of influence around geological faults of a 50 m radius within the category of “Very high recharge probability” due to their importance as groundwater recharge channels [8]. According to the Delphi results, the newly included variable (P) had the highest weight and, therefore, was the most decisive for delimiting recharge zones. This qualification is logical since precipitation is the initial input on which groundwater recharge depends, which will eventually be determined by local characteristics [22,102]. In the case of Virvini, this should be more evident because rainfall in this basin is generally weak but continuous, factors that favor the infiltration process [21]. Consequently, due to the modifications described above, the model presented in this investigation was denoted as the EARLI approach, an acronym for “Enhanced Algorithm for Recharge based on the Rainfall and Land cover Inclusion”.
Finally, the weighting of the variable’s categories showed congruence between the three interviewed groups. The p-values from the Kruskal–Wallis bi-lateral non-parametric analysis were more significant than the significance level alpha = 0.05, so the null hypothesis (H0) could not be rejected. Therefore, it is safe to state that there were no significant differences between the criteria of the three consulted groups, meaning that it was safe to apply the adjustments to the model.

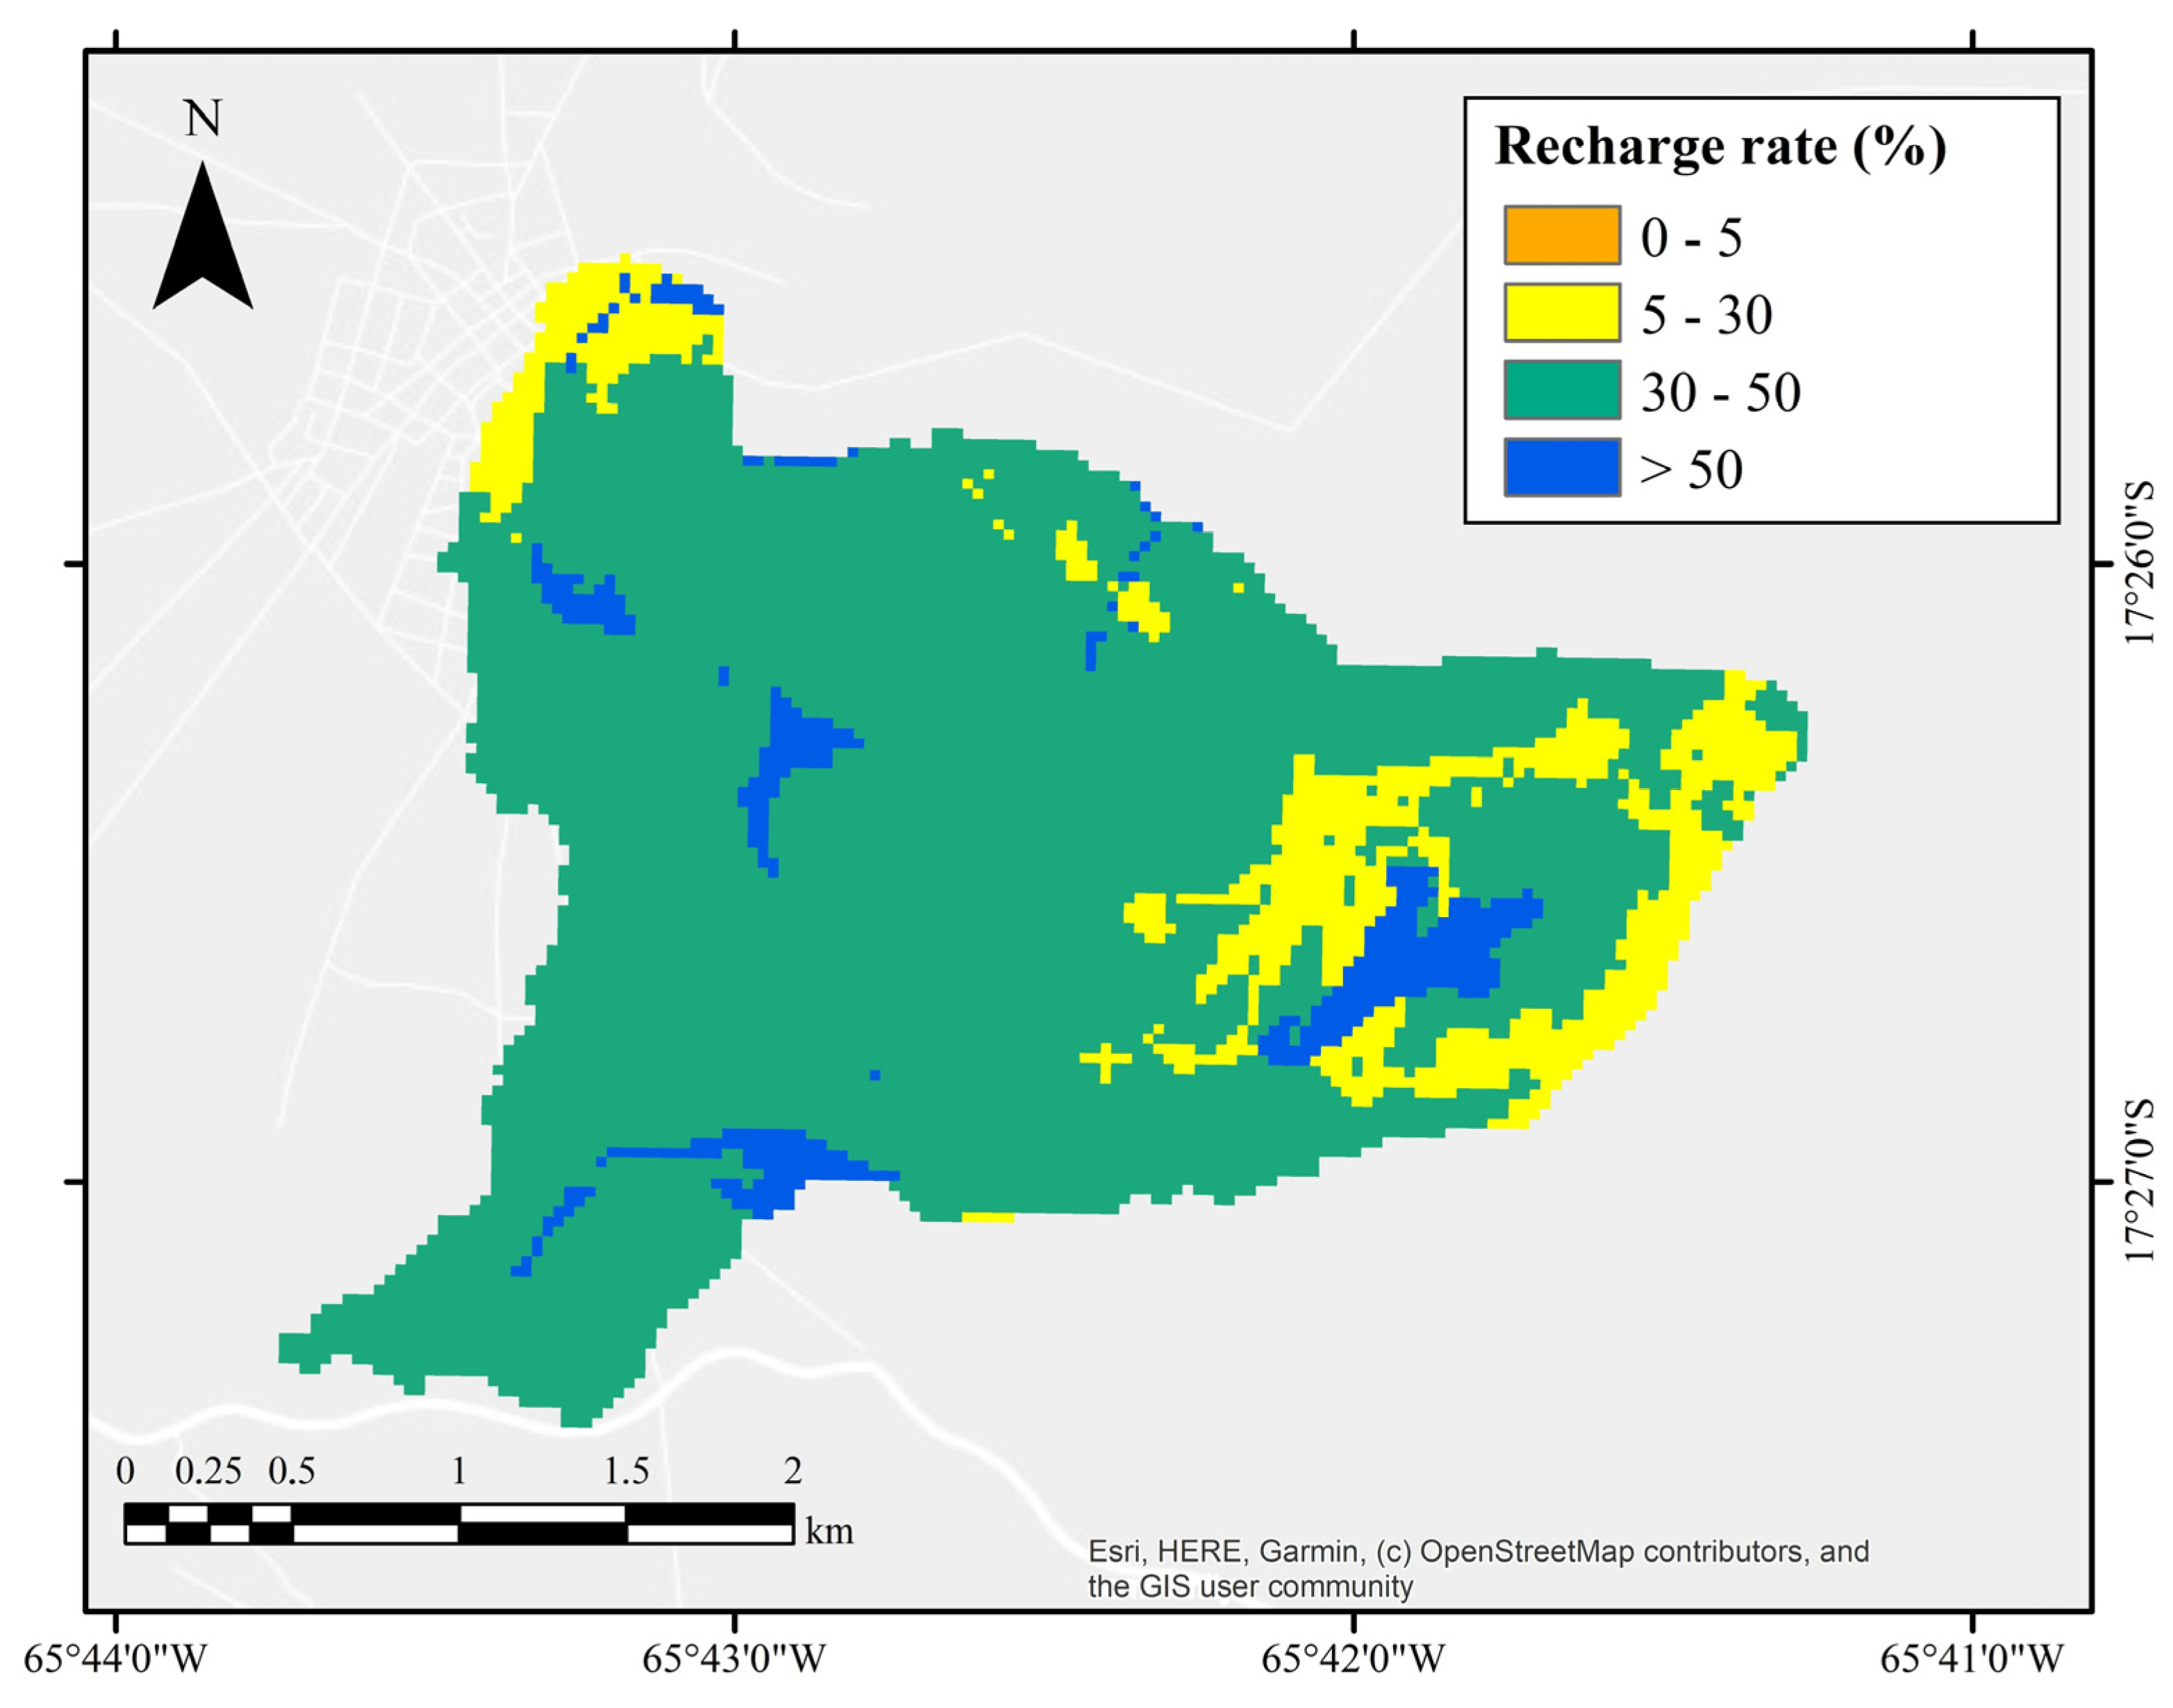
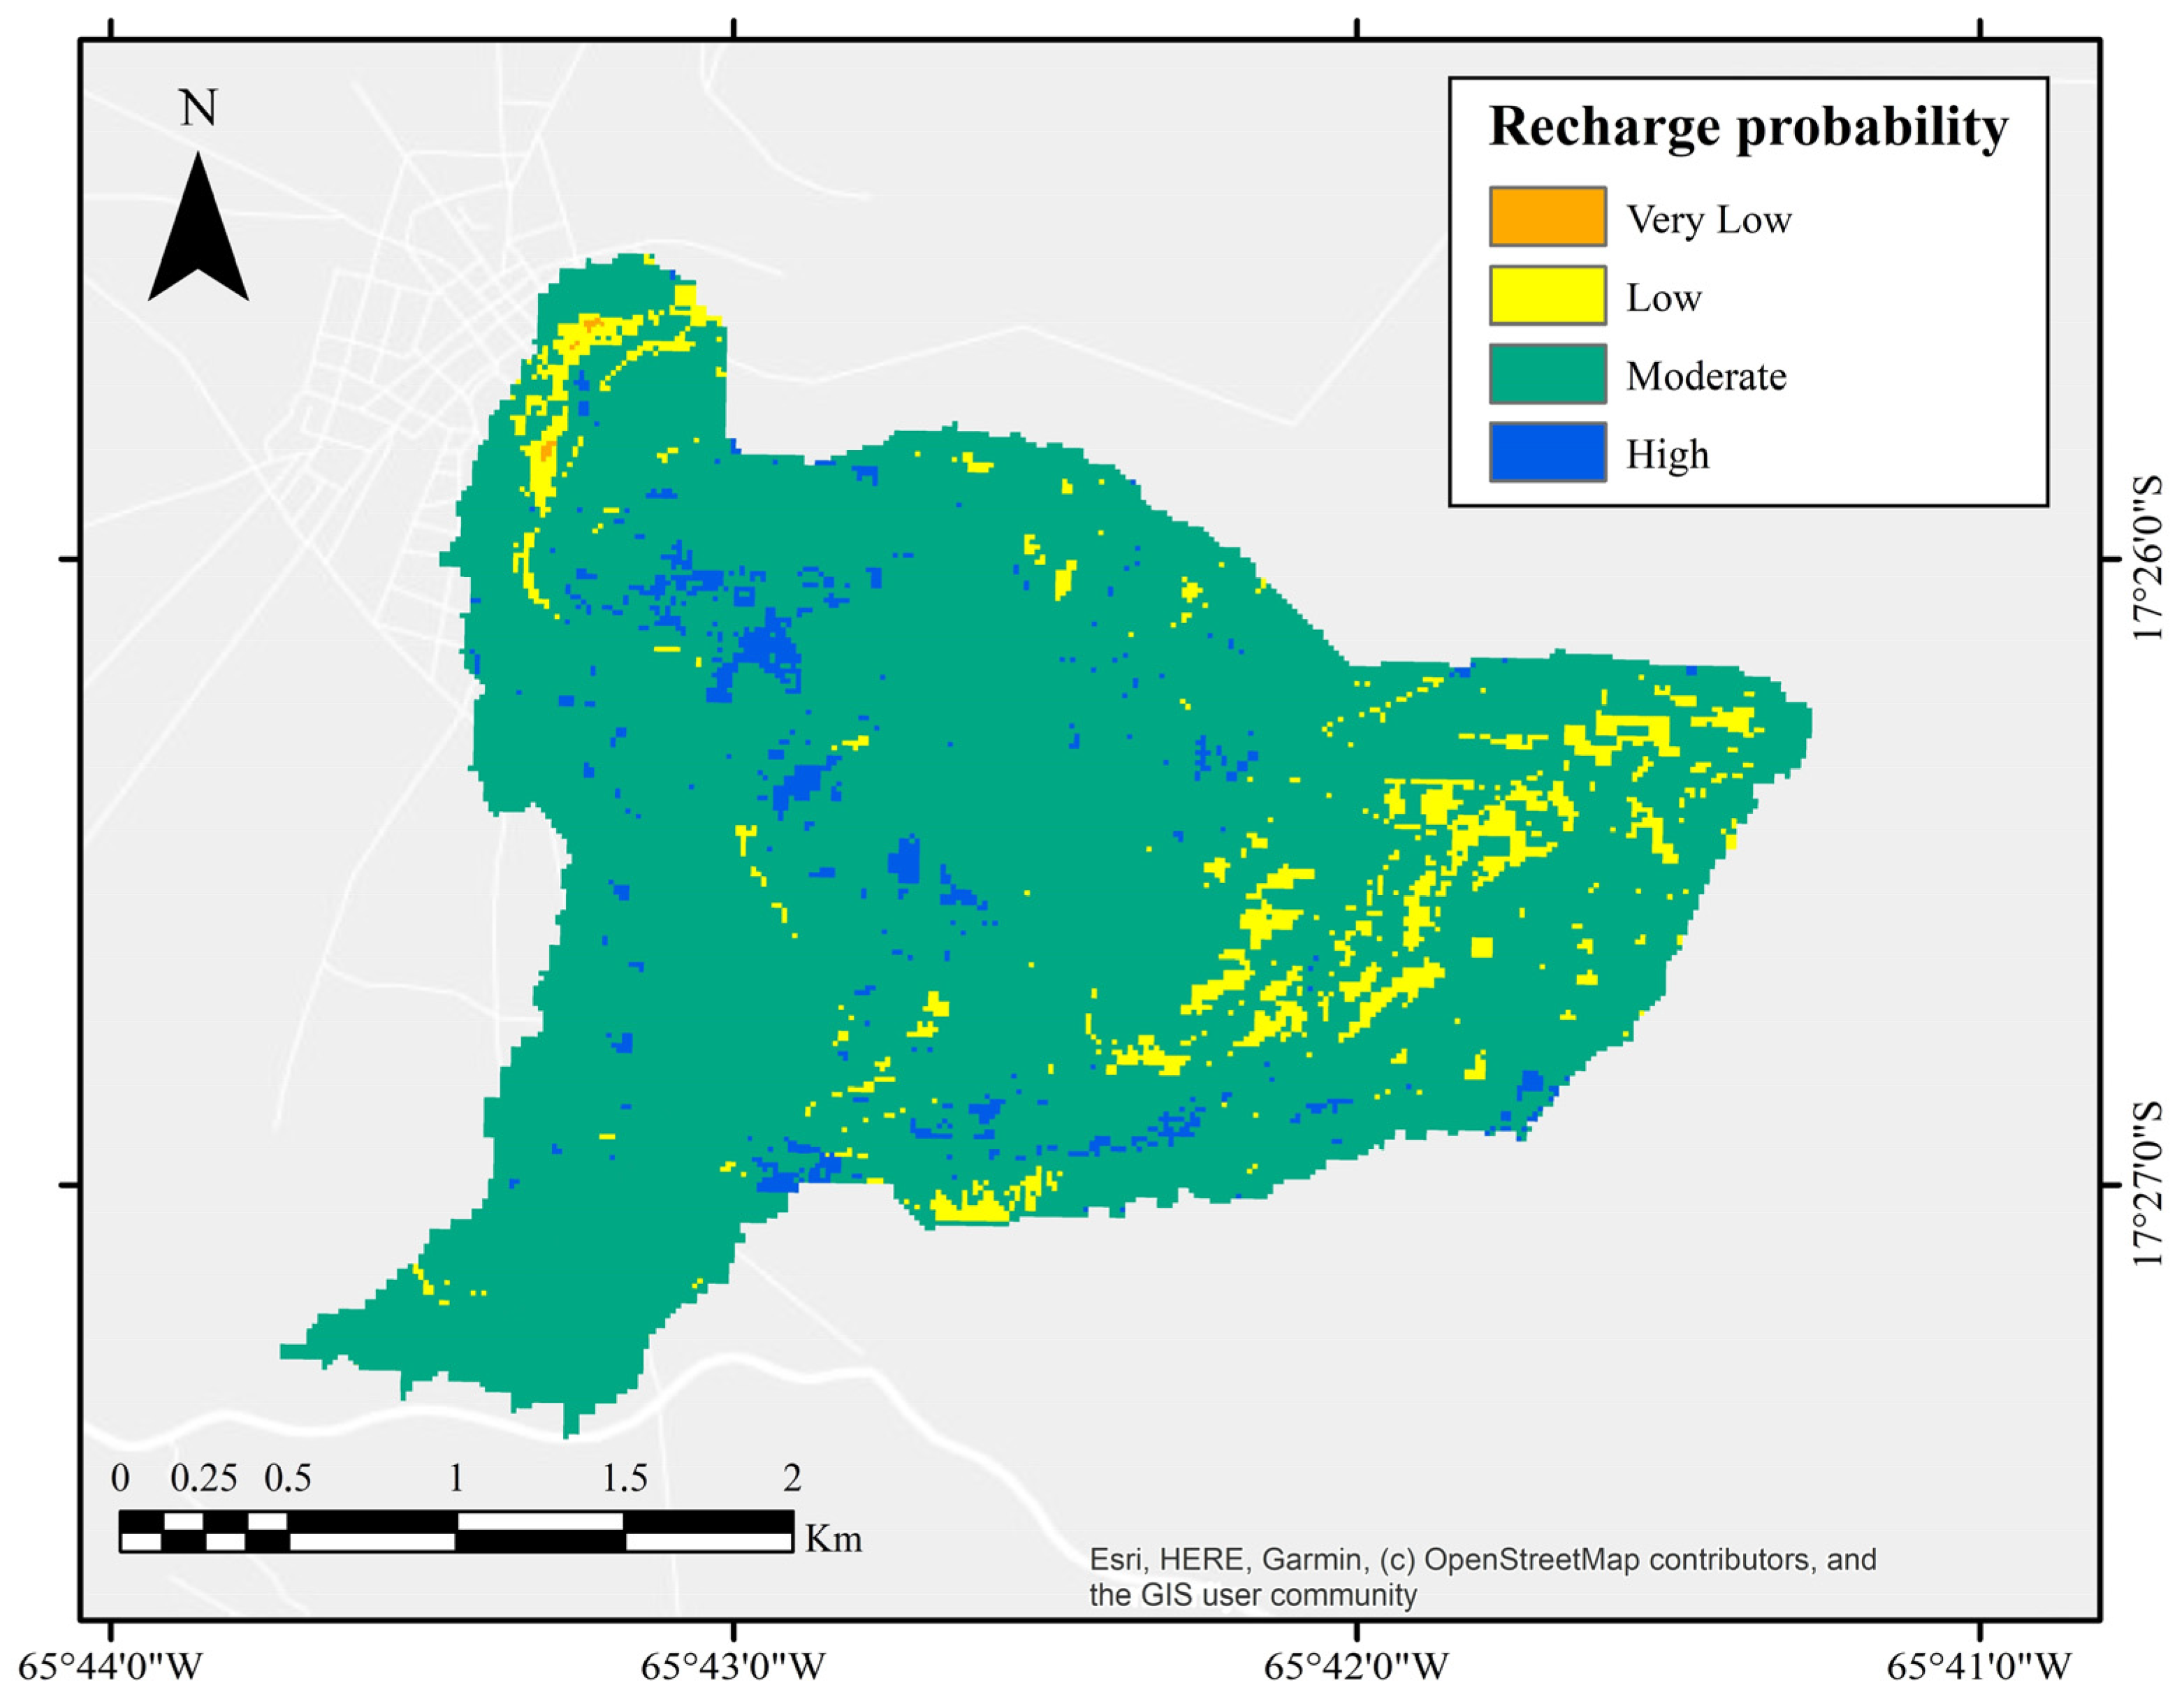
3.5. Application of the EARLI Model to the Virvini Micro-Basin

Once the adjusted algorithm was applied using the new inputs for the study basin, the map in Figure 10a was obtained. At first glance, it is possible to appreciate that, in general, the Virvini micro-basin seems to be dominated by zones of at least a moderate level of groundwater recharge probability (87% of the total area). It is also possible to find zones with a high probability of recharge occurrence (6%), low probability zones (5.5%), and very low probability zones (1.5%). Therefore, the whole study basin could be classified as a favorable area for groundwater infiltration and recharge considering its physical characteristics, since 93% of the total area is located within the categories of moderate and high possibility of occurrence of water recharge.
In that regard, when comparing the resulting maps for Virvini by using both the Matus model and the EARLI one, it is possible to observe that the latter appears to be much more conservative (6% of the total basin surface in the adjusted model against 12% in the Matus model for a high probability of recharge), with fewer and more focused high-probability groundwater recharge zones. In this sense, the relative balance between the new weights and the reclassifications of the variables probably determined that the extreme values decreased considerably compared to the results obtained while using the Matus algorithm. Consequently, in several areas of the basin, attributes strongly favorable for infiltration and groundwater recharge are counterweighted by negative attributes. This is especially the case in the southwest area of the basin, where the low slope and advantageous geological characteristics are counteracted by average rainfall values and less propitious LULC categories for groundwater recharge.
Precisely, one of the aspects that may contribute the most to the updated distribution of groundwater recharge is the reclassification of LULC categories and the higher weight assigned to this variable in the adjusted algorithm. In this sense, several authors mainly interested in the influence of this variable on groundwater recharge have concluded that land use and land cover are so relevant to this process that changes in them may be considered the most pertinent driving force influencing the fluctuations in groundwater levels in several regions of the world [103,104,105,106].
In general, the reclassification of land use and land cover has been less propitious for recharge since several categories, previously considered positive for infiltration, were reclassified as unfavorable. This is especially true for the Eucalyptus plantations in most of the study area. In contrast, the more detailed identification of plant communities has also allowed for the recognition of vegetation patches, the characteristics of which have led to a positive reclassification in their contribution to groundwater recharge. Most areas of high recharge probability are located in plots of highly qualified native plant communities, coinciding with other propitious characteristics such as the percentage of adequate vegetation cover.
Regarding the practical aspect of applying the results of this study, although almost the entire basin would have at least a moderate capacity for infiltration, the conservative results of the EARLI method may imply an advantage when proposing protection measures for groundwater recharging zones in Virvini. This can be explained because most of the territory of Tiraque is considered private land, resulting from the dynamics by which colonial properties have been inherited and transferred over time [107]. This situation has made it challenging to conserve natural spaces in the municipality, since farmers will always choose to obtain the most economic benefit from their land [108,109]. Thus, having fewer high-potential groundwater recharge areas that could be prioritized for protection within a policy framework makes conserving such sites more feasible (Figure 10b).
Concerning the discharge (springs) and recharge system in the basin, there seem to be some connections between both components, although this should be appropriately determined by subsequent analysis. As there is at least a moderate infiltration and recharge probability according to the EARLI approach, each spring in Virvini may be fed by the surrounding elevated areas, possibly with a higher probability in the blue regions of the map. In any case, to be sure, these results should be complemented later with flow path analysis through chemical and isotopic analysis of the water, for example, or through the use of geophysical methods to obtain a better understanding of the processes of the groundwater system.

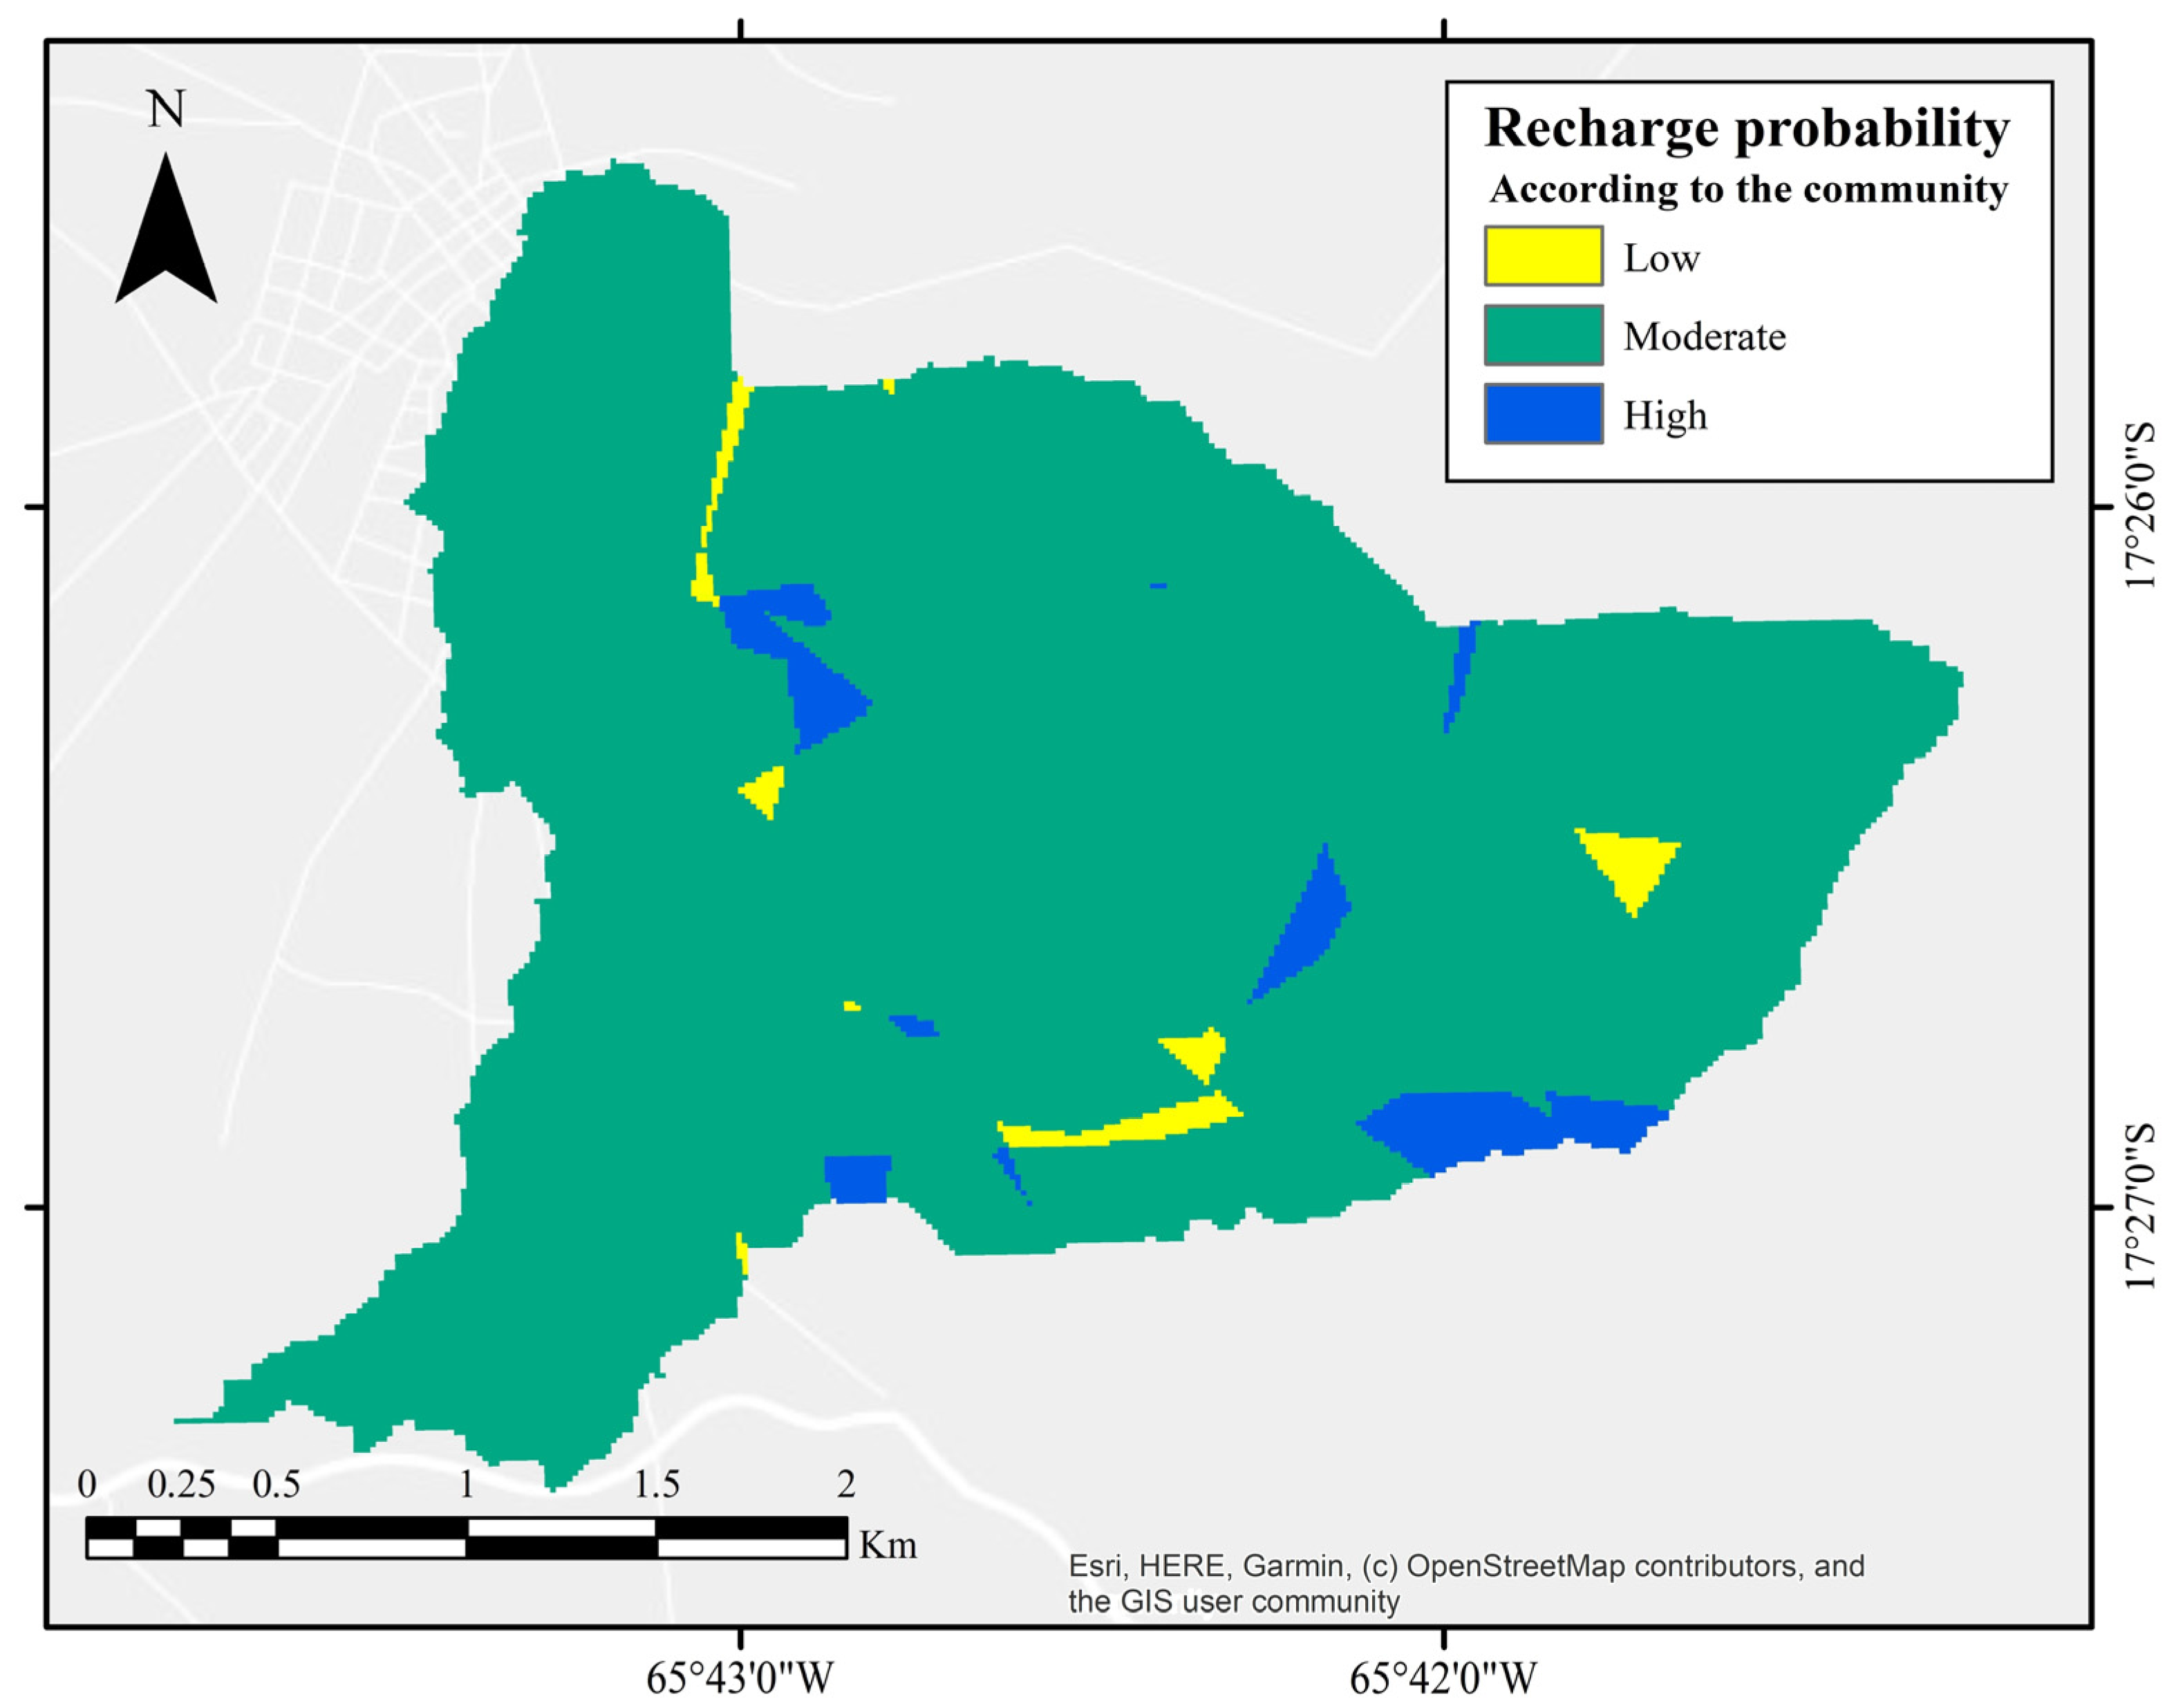
3.6. Validation of the EARLI Model

In general, the application of the EARLI algorithm seems to be validated by the results of the double-ring tests, showing better performance than the results from the Matus model. According to the revised methodology, the highest base infiltration rates coincided with sampling points in areas with a high recharge probability (47.58 mm h−1, 63.47 mm h−1, 88.77 mm h−1, and 140.94 mm h−1). Similarly, areas in which the EARLI method predicted a low probability of groundwater recharge showed base infiltration values of 21.37 mm h−1 and 8.67 mm h−1. Moreover, this last measurement was taken at a point in the basin at which the Matus model predicted a high recharge probability, demonstrating, once again, better accuracy in the results of the EARLI model.
Another interesting result from the in situ validation stage corresponds to the Eucalyptus plantation area, for which the original methodology predicted a high probability of groundwater recharge. However, the value obtained from the base infiltration rate (14.13 mm h−1) seemed more congruent with the EARLI approach that projected only an intermediate recharge probability. This situation shows that, despite the organic matter that a Eucalyptus forest contributes to the soil, its other floristic characteristics seem to damage the infiltration process. In this sense, studies carried out in the Páramo (high-altitude ecosystems in the Andes) have also shown that afforestation with introduced forest species can sometimes limit infiltration capacity, at least initially, and even decrease water yield by up to 50% in comparison of those areas in which the heterogeneous matrix of native vegetation (of Polylepis spp., as in the case of Virvini) is conserved [110,111].
Nonetheless, it can be argued that despite being an excellent initial approximation, the infiltration rate measurement does not directly consider essential aspects for determining groundwater recharge zones, such as soil heterogeneity, the spatial distribution of rainfall, and evapotranspiration (ET), for example. Therefore, to complement these measurements, the results obtained from validation through the WetSpass-M model are presented below.
Figure 11 shows some significant similarities in terms of recharge potentiality when results from the EARLI method (Figure 10a) and the WetSpass-M model are compared. The result indicates that the WetSpass-M model and the proposed methodology agree when detecting high-potential recharge zones. However, the WetSpass-M model overestimates the low recharge potential areas compared to EARLI. Nonetheless, the rock properties have not been considered in the WetSpass-M simulation, nor has the input from local stakeholders regarding the basin-specific characteristics. This might be the reason for the overestimation by the WesSpass-M model.
Further, it seems that the considerations made by the WetSpass-M model correspond to the adjusted model criteria, especially when considering the influence of the LULC categories, as, once again, patches of native vegetation stand out from the rest of the micro-basin. Moreover, the results of the WetSpass-M model further confirm the high recharge potential of the Virvini sub-basin, quantifying average annual values of up to 373 mm in some areas of the basin (implying 50% of total rainfall). In general, the estimated groundwater recharge rate for Virvini coincides with what has been calculated for some other sub-humid basins, as the studies of Scanlon et al. [112] and Lorenz and Delin [113], where recharge rates reached more than 35% and 40%, respectively.
More specifically, concerning the study area, the results of the only similar study in the Valle Alto basin [82] agree that the most critical recharge zones are concentrated in the sub-basins belonging to the municipality of Tiraque. More precisely, in the Virvini micro-basin, said authors found mean annual potential recharge values primarily qualified as “intermediate” and “high” (80–150 mm year−1) in the context of the whole basin, which is consistent with the primarily intermediate recharge probability found in this study.
Turning to the application of the EARLI model while using the community inputs, the results are shown in Figure 12. Once again, most of the basin presented intermediate recharge values, with a few points with high and low probabilities of groundwater recharge, similar to the results obtained in previous tests. More specifically, what was obtained by the community seems to show a more significant similarity with the results obtained by applying the Matus model than the adjusted model. This is especially evident in the basin’s central, eastern, and southeastern areas, where both the high- and low-probability areas for groundwater recharge appear to coincide roughly on both maps. On the other hand, concerning the EARLI model, the community map coincides with fewer sectors with high and low recharge probabilities, mainly in the south–central part of the basin.
The coincidences between the community input and the Matus model may be due to several factors. On the one hand, it is necessary to note that specific categories related to the Matus model are sometimes very general and do not entirely fit Virvini’s reality (which is why it was decided to adjust the model). In this sense, even though the community’s knowledge remarkably coincided with maps of soil texture, LULC, slopes, and rainfall, for example, there have been cases in which the characterization of certain variables has also been too general. This is the case for the geological variable, undoubtedly because the characteristics of the local geology are relatively unknown to the community compared to other variables. Similarly, the members of the Virvini community have generally associated areas with little or medium vegetation cover as ideal for groundwater recharge, in discrepancy with what is proposed by the adjusted model. This situation demonstrates that, when collaborating with rural communities, it is necessary to better engage in in-depth discussions of complex concepts and dynamics to facilitate their integration into the community’s knowledge, despite their existing familiarity with the biophysical characteristics of their basins.
Nonetheless, the community’s application of the EARLI model has generally presented positive initial results similar to those obtained using cartographic maps. Additionally, despite not having been a social mapping process per se, the methodology developed for the community was established in a participatory and collaborative way, allowing for the design of an integrated water management tool that the community could directly apply. In that sense, several authors have highlighted the usefulness of methodologies such as the one utilized herein as valid alternatives to systematize representations and local knowledge, especially in managing natural resources [114,115,116].

4. Conclusions

This study aimed to develop a methodology for identifying potential groundwater recharge zones in the Virvini micro-basin and to evaluate its performance as a participatory tool. The initial results showed that specific parameters proposed by the method were unsuitable for the Virvini micro-basin. They were adjusted using the Delphi method with input from international and local experts, including the local knowledge of rural communities about their territory. The revised model, called the EARLI approach, showed a better balance when weighting analyzed variables and highlighted the importance of considering the spatial distribution of rainfall.
The study also emphasized the need to analyze the influence of land cover, specifically vegetation cover, on groundwater recharge. Reclassifying land use/land cover categories could be a decisive factor in delineating potential recharge zones. Field tests and comparisons with traditional hydrogeological tools validated the EARLI approach, and communal application allowed for collective reflection. However, limitations exist, and this study suggests that further analyses be conducted, including on isotopes and geophysics.
Finally, the findings of this study have several significant and immediate practical implications. They establish the first critical technical bases for constructing a future policy to ensure protection of groundwater recharge zones for the municipality of Tiraque. Therefore, it is understood that the obtained results can be taken as the first steps toward the long-term management of groundwater recourses in this region.

Author Contributions

Conceptualization, I.E.R.-L.; methodology, I.E.R.-L., M.A.C.-L. and W.J.F.; software, I.E.R.-L., M.A.C.-L., S.M.T.M. and L.R.-R.; validation, I.E.R.-L., S.M.T.M. and L.R.-R.; formal analysis, I.E.R.-L., M.A.C.-L. and W.J.F.; investigation, I.E.R.-L. and M.A.C.-L.; resources, I.E.R.-L.; data curation, I.E.R.-L., M.A.C.-L. and W.J.F.; writing—original draft preparation, I.E.R.-L.; writing—review and editing, I.E.R.-L., M.A.C.-L., A.G.A. and M.H.; supervision, A.G.A. and M.H.; project administration, I.E.R.-L. All authors have read and agreed to the published version of the manuscript.

Funding

This research was funded by VLIR UOS IUC Phase II Partnership Project for the Institutional University Cooperation with Universidad Católica Boliviana San Pablo, BO2022IUC034A105.

Data Availability Statement

The data presented in this study are available on request from the corresponding author. The data are not publicly available due to the privacy regulations of the lead author’s institution.

Acknowledgments

The authors are grateful for the collaboration of the interviewed experts who contributed with their experience and knowledge during the Delphi workshop phase. Similarly, the contribution of the UCB students (led by Andrea Vargas) was decisive in carrying out the fieldwork, especially under SARS-CoV-2 pandemic scenarios, when traveling was complicated. The initial outreach to the local communities was achieved thanks to the logistical collaboration of allied institutions INCCA and Solidagro. Regarding the technical aspects of the research, the authors would like to thank Nelly de La Barra, who was in charge of the identification and characterization of the plant species and communities in the basin, which allowed us to develop an updated LULC map. Finally, the authors thank the Virvini community, represented by its leader Olegario Cossío, for allowing us to work in their territory and believing in scientific research as a valuable tool to achieve the integrated management of their water resources.

Conflicts of Interest

The authors declare no conflict of interest.

References

  1. Viceministerio de Riego, V. Plan Nacional de Desarrollo del Riego “Para Vivir Bien” 2007–2011; Dirección General de Riego: La Paz, Bolivia, 2007. [Google Scholar]
  2. Viceministro de Recursos Hídricos y Riego(VEHR). Agenda del Riego 2025: Contribución a la Agenda Patriótica del Bicentenario; Agenda del Riego: La Paz, Bolivia, 2013. [Google Scholar]
  3. Bradley, R.S.; Vuille, M.; Diaz, H.F.; Vergara, W. Threats to Water Supplies in the Tropical Andes. Science 2006, 312, 1755–1756. [Google Scholar] [CrossRef]
  4. Kinouchi, T.; Nakajima, T.; Mendoza, J.; Fuchs, P.; Asaoka, Y. Water security in high mountain cities of the Andes under a growing population and climate change: A case study of La Paz and El Alto, Bolivia. Water Secur. 2019, 6, 100025. [Google Scholar] [CrossRef]
  5. Kruse, T. “Guerra Del Agua” En Cochabamba, Bolivia: Terrenos Complejos, Convergencias Nuevas. In Sindicatos y Nuevos Movimientos Sociales en América Latina; Enrique de la Garza Toledo: Buenos Aires, Argentina, 2005; pp. 121–161. Available online: http://bibliotecavirtual.clacso.org.ar/ar/libros/grupos/sindi/kruse.pdf (accessed on 3 November 2022).
  6. Andrade, M.F. La Economía del Cambio Climático en Bolivia: Validación de Modelos Climáticos; Banco Interamericano de Desarrollo: Washington, DC, USA, 2014. [Google Scholar]
  7. Calvo Cárdenas, N. La Economía del Cambio Climático en Bolivia: Cambios en La Demanda Hídrica; Banco Interamericano de Desarrollo: Washington, DC, USA, 2014. [Google Scholar]
  8. Matus, O. Elaboración Participativa de Una Metodología para la Identificación de Zonas Potenciales de Recarga Hídrica en Subcuencas Hidrográficas, Aplicada a la Subcuenca del Río Jucuapa, Matagalpa Nicaragua; Centro Agronómico Tropical de Investigación y Enseñanza: Turrialba, Costa Rica, 2007; Volume Magister S. [Google Scholar]
  9. Wheeler, T.; Von Braun, J. Climate Change Impacts on Global Food Security. Science 2013, 341, 508–511. [Google Scholar] [CrossRef]
  10. Jakeman, A.J.; Barreteau, O.; Hunt, R.J.; Rinaudo, J.-D.; Ross, A.; Arshad, M.; Hamilton, S. Integrated Groundwater Management: An Overview of Concepts and Challenges. In Integrated Groundwater Management; Jakeman, A.J., Ed.; Spinger: Cham, Switzerland, 2016; pp. 3–20. [Google Scholar]
  11. Mora-Jiménez, L.D.; Ruiz-Valverde, J. Determinación de Áreas de Recarga Hídrica En Las Subcuencas de Los Ríos Frijoles y Guacalito, Upala, Costa Rica. Repert. Científico 2018, 21, 23–36. [Google Scholar] [CrossRef]
  12. Helvetas, S.I. Valoración de Efectos e Impactos de Intervenciones de Gestión, Manejo y Protección de Áreas de Recarga Hídrica; HELVETAS Swiss Intercooperation: Zürich, Switzerland, 2014. [Google Scholar]
  13. Sáenz-López, Á.A.; Bravo-Peña, L.C.; Torres-Olave, M.E.; Alatorre-Cejudo, C. Localización de Zonas Con Potencial Natural de Recarga Hídrica: Ensayo de Enfoque Multiescalar En El Acuífero Cuauhtémoc. In Proceedings of the Memorias de Resúmenes en Extenso SELPER-XXI-México-UACJ-2015, Ciudad Juárez, Mexico, 12–16 October 2015. [Google Scholar]
  14. Smith, M.; Cross, K.; Paden, M.; Laban, P. Acuíferos: Gestión Sostenible de Aguas Subterraneas; UICN ORMACC: San Jose, Costa Rica, 2016; ISBN 978-2-8317-2083-8. [Google Scholar]
  15. United Nations. Groundwater: Making the Invisible Visible; United Nations: Paris, France, 2022. [Google Scholar]
  16. McCaffrey, S.C. The International Law Commission Adopts Draft Articles on International Watercourses. Am. J. Int. Law 1995, 89, 395. [Google Scholar] [CrossRef] [Green Version]
  17. Mustafa, S.M.T.; Hasan, M.M.; Saha, A.K.; Rannu, R.P.; Van Uytven, E.; Willems, P.; Huysmans, M. Multi-model approach to quantify groundwater-level prediction uncertainty using an ensemble of global climate models and multiple abstraction scenarios. Hydrol. Earth Syst. Sci. 2019, 23, 2279–2303. [Google Scholar] [CrossRef] [Green Version]
  18. Noori, R.; Maghrebi, M.; Mirchi, A.; Tang, Q.; Bhattarai, R.; Sadegh, M.; Noury, M.; Haghighi, A.T.; Kløve, B.; Madani, K. Anthropogenic depletion of Iran’s aquifers. Proc. Natl. Acad. Sci. USA 2021, 118, e2024221118. [Google Scholar] [CrossRef]
  19. Fares, A. Emerging Issues in Groundwater Resources; Springer: Cham, Switzerland, 2016; ISBN 9783319320069. [Google Scholar]
  20. Peñuela-Arévalo, L.A.; Carrillo-Rivera, J.J. Discharge areas as a useful tool for understanding recharge areas, study case: Mexico Catchment. Environ. Earth Sci. 2013, 68, 999–1013. [Google Scholar] [CrossRef]
  21. Seiler, K.-P.; Gat, J.R. Groundwater Recharge from Run-off, Infiltration and Percolation; Springer International Publishing: Dordrecht, The Netherlands, 2007; ISBN 978-0-306-48065-2. [Google Scholar]
  22. Pineda, F. Propuesta Metodológica Para la Identificación, Delimitación y Preservación de Zonas de Recarga Hídrica de Acuíferos; Universidad Libre: Bogotá, Colombia, 2011. [Google Scholar]
  23. Ramírez, E.J.; Sánchez, C.; Enríquez, M.; Gutiérrez, M. Identificación de Sitios Potenciales de Recarga de Acuíferos Mediante Uso de Vehículos Aéreos No Tripulados En La Universidad Del Mar Campus Puerto Ángel. Cienc. Mar 2018, 21, 13–18. [Google Scholar]
  24. Bierkens, M.F.P.; Wada, Y. Non-renewable groundwater use and groundwater depletion: A review. Environ. Res. Lett. 2019, 14, 063002. [Google Scholar] [CrossRef]
  25. Bierkens, M.F.P. Global hydrology 2015: State, Trends, and Directions. Water Resour. Res. 2015, 51, 4923–4947. [Google Scholar] [CrossRef]
  26. Konikow, L.F.; Kendy, E. Groundwater Depletion: A Global Problem. Hydrogeol. J. 2005, 13, 317–320. [Google Scholar] [CrossRef]
  27. Konikow, L.F. Long-Term Groundwater Depletion in the United States. Groundwater 2015, 53, 2–9. [Google Scholar] [CrossRef] [PubMed]
  28. Steward, D.R.; Allen, A.J. Peak Groundwater Depletion in the High Plains Aquifer, Projections from 1930 to 2110. Agric. Water Manag. 2016, 170, 36–48. [Google Scholar] [CrossRef] [Green Version]
  29. Kollet, S.J.; Zlotnik, V.A. Stream Depletion Predictions Using Pumping Test Data from a Heterogeneous Stream–Aquifer System (a case study from the Great Plains, USA). J. Hydrol. 2003, 281, 96–114. [Google Scholar] [CrossRef]
  30. Dangar, S.; Asoka, A.; Mishra, V. Causes and Implications of Groundwater Depletion in India: A Review. J. Hydrol. 2021, 596, 126103. [Google Scholar] [CrossRef]
  31. Long, D.; Chen, X.; Scanlon, B.R.; Wada, Y.; Hong, Y.; Singh, V.P.; Chen, Y.; Wang, C.; Han, Z.; Yang, W. Have GRACE Satellites Overestimated Groundwater Depletion in the Northwest India Aquifer? Sci. Rep. 2016, 6, 24398. [Google Scholar] [CrossRef] [Green Version]
  32. Rodell, M.; Velicogna, I.; Famiglietti, J.S. Satellite-Based Estimates of Groundwater Depletion in India. Nature 2009, 460, 999–1002. [Google Scholar] [CrossRef] [Green Version]
  33. Maghrebi, M.; Noori, R.; Partani, S.; Araghi, A.; Barati, R.; Farnoush, H.; Haghighi, A.T. Iran’s Groundwater Hydrochemistry. Earth Space Sci. 2021, 8, e2021EA001793. [Google Scholar] [CrossRef]
  34. Cossío, V.; Wilk, J. A Paradigm Confronting Reality: The River Basin Approach and Local Water Management Spaces in the Pucara Basin, Bolivia. Water Altern. 2017, 10, 181–194. Available online: https://www.water-alternatives.org/index.php/alldoc/articles/vol10/v10issue1/348-a10-1-10/file?auid=913 (accessed on 3 November 2022).
  35. Figueredo, J.L. Metodología para Determinar Zonas de Recarga Hídrica en Municipios o Comunidades con Recursos Financieros Limitados. Ph.D. Thesis, Universidad Militar Nueva Granada, Bogotá, Colombia, 2019. [Google Scholar]
  36. Amaya, A.G.; Ortiz, J.; Durán, A.; Villazon, M. Hydrogeophysical methods and hydrogeological models: Basis for groundwater sustainable management in Valle Alto (Bolivia). Sustain. Water Resour. Manag. 2019, 5, 1179–1188. [Google Scholar] [CrossRef] [Green Version]
  37. Saldias, C. Revelando la Distribución del Agua: Abanico Punata, Área de Influencia de la Cuenca Pucara, Bolivia. Master’s Thesis, Wageningen University, Wageningen, The Netherlands, 2009. [Google Scholar]
  38. Helga, G.; Joost, D.; Paul, B.J.; Marijke, D. Power relations in the co-creation of water policy in Bolivia: Beyond the tyranny of participation. Water Policy 2022, 24, 569–587. [Google Scholar] [CrossRef]
  39. Huarita, M. Recarga del Sistema Acuífero de Cliza: Cochabamba-Bolivia. Master’s Thesis, Universidad Mayor, Real y Pontificia De San Francisco Xavier De Chuquisaca Vicerrectorado, Sucre, Bolivia, 2015. [Google Scholar]
  40. Mayta, A.; Felipe, M.; Pereyra, C. Disponibilidad de Agua Subterranea en el Municipio de Cliza; University of Calgary: Calgary, Canada, 2016. [Google Scholar]
  41. Zapata, S. Potencial de Explotación de Agua Subterránea en Cliza—Cochabamba. Master’s Thesis, Universidad Mayor, Real y Pontificia de San Francisco Xavier de Chuquisaca, Bogotá, Colombia, 2015. [Google Scholar]
  42. Barreno, I. Comparación de Metodologías para Identificación de Zonas Potrnciales de Recarga Hídrica en la Microcuenca del Río Agua Tibia, Zona 24, Guatemala. Ph.D. Thesis, Universidad de San Carlos de Guatemala, Guatemala City, Guatemala, 2016. [Google Scholar]
  43. Sutton, J.C. Groundwater Recharge Areas: Identification and Protection within the Central Coast Regional Water Quality Control Board Jurisdiction. Master’s Thesis, California Polytechnic State University, San Luis Obispo, CA, USA, 2011. [Google Scholar]
  44. Gonzales, A.; Barmen, G.; Muñoz, G. A Multidisciplinary Approach for Clarifying the Recharge Processes and Origin of Saline Water in the Semi-Arid Punata Alluvial Fan in Bolivia. Water 2018, 10, 946. [Google Scholar] [CrossRef] [Green Version]
  45. Schosinsky, G. Cálculo de La Recarga Potencial de Acuíferos Mediante Un Balance Hídrico de Suelos. Rev. Geol. Am. Cent. 2006, 34–35, 13–30. [Google Scholar] [CrossRef] [Green Version]
  46. Matus, O.; Faustino, J.; Jiménez, F. Guía para la Identificación Participativa de Zonas con Potencial de Recarga Hídrica [Guide for the Participatory Identification of Areas with Potential for Water Recharge]; Centro Agronómico Tropical de Investigación y Enseñanza: Turrialba, Costa Rica, 2009. [Google Scholar]
  47. Lu, Y.; Nakicenovic, N.; Visbeck, M.; Stevance, A.-S. Five Priorities for the UN Sustainable Development Goals. Nature 2015, 520, 7–8. [Google Scholar] [CrossRef] [Green Version]
  48. United Nation. SDG 6 Synthesis Report 2018 on Water and Sanitation; United Nation: Geneva, Switzerland, 2018; ISBN 9789213626740. [Google Scholar]
  49. Orellana, R. Plan de Gestón Integral de los Recursos Hídricos de la Comunidad de Virvini del Municipio de Tiraque. Master’s Thesis, Universidad Mayor de San Simón, Cochabamba, Bolivia, 2019. [Google Scholar]
  50. Gobierno Autonomo Municipal de Tiraque. Plan Territorial de Desarrollo Integral Tiraque 2016–2020; Gobierno Autonomo Municipal de Tiraque: Tiraque, Bolivia, 2016. [Google Scholar]
  51. Stein, J.L. An Enhanced Pfafstetter Catchment Reference System. Water Resour. Res. 2018, 54, 9951–9963. [Google Scholar] [CrossRef] [Green Version]
  52. Cruz, R. Estudio Hidrologico de la Micro Region Tiraque-Valle; Asignación del Agua en la Microregión Tiraque: Cochabamba, Bolivia, 2009. [Google Scholar]
  53. Navarro, G.; Ferreira, W. Mapa de Vegetación de Bolivia [CD-ROM Interactivo]; The Nature Conservancy/Rumbo: Cochabamba, Bolivia, 2007. [Google Scholar]
  54. Carrasco, W.D.C. Manejo y Protección de Zonas de Recarga Hídrica y Fuentes de Agua para Consumo Humano en la Subcuenca del Río Zaratí, Panamá; Centro Agronómico Tropical de Investigación y Enseñanza: Turrialba, Costa Rica, 2011. [Google Scholar]
  55. NASA. Shuttle Radar Topography Mission; NASA: Washington, DC, USA, 2013. [Google Scholar]
  56. Servicio Departamental de Cuencas, Gobierno Autonomo Departamental de Cochabamba, Bolivia. Estudio Información Cartográfica y Evaluación de Tierras Del Valle Alto; Autonomous Departmental Government of Cochabamba: Cochabamba, Bolivia, 2018. [Google Scholar]
  57. Carlson, T.N.; Ripley, D.A. On the relation between NDVI, fractional vegetation cover, and leaf area index. Remote. Sens. Environ. 1997, 62, 241–252. [Google Scholar] [CrossRef]
  58. SENAMHI. Sistema de Procesamiento de Datos Meteorológicos; SENAMHI: Lima, Perú, 2020. [Google Scholar]
  59. United States Army Corps of Engineers. HEC-4: Monthly Streamflow Simulation—User’s Manual; United States Army Corps of Engineers: Washington, DC, USA, 1971. [Google Scholar]
  60. Sveinsson, O.G.; Salas, J.D. Progress in Stochastic Analysis Modeling and Simulation: SAMS-2003. Ph.D. Thesis, Colorado State University, Fort Collins, CO, USA, 2003; pp. 165–175. [Google Scholar]
  61. Vogel, R.M. Stochastic watershed models for hydrologic risk management. Water Secur. 2017, 1, 28–35. [Google Scholar] [CrossRef]
  62. WMO. Guide to Climatological Practices 2018 Edition; WMO: Geneva, Switzerland, 2018; ISBN 9789263101006. [Google Scholar]
  63. Daly, C.; Michael, H.; Smith, J.I.; Gibson, W.P.; Doggett, M.K.; Taylor, G.H.; Curtisb, J.; Pasterisb, P.P. Physiographically Sensitive Mapping of Climatological Temperature and Precipitation across the Conterminous United States. Int. J. Climatol. 2008, 2029, 2011–2029. [Google Scholar] [CrossRef]
  64. Goovaerts, P. Geostatistical Approaches for Incorporating Elevation into the Spatial Interpolation of Rainfall. J. Hydrol. 2000, 228, 113–129. [Google Scholar] [CrossRef]
  65. Astigarraga, E. El Metodo Delphi; University of Deusto: Bilbao, Spain, 2003. [Google Scholar]
  66. Linstone, H.; Turoff, M. The Delphi Method: Techniques and Applications; Addison-Wesley: Boston, MA, USA, 2002. [Google Scholar]
  67. Gordon, T.J. The Delphi Method. Future Res. Methodol. 1994, 2, 29–31. [Google Scholar]
  68. Megan, M.G.; George, W. Delphi Method. Wiley StatsRef Stat. Ref. Online 2016, 1–6. [Google Scholar] [CrossRef]
  69. Hasson, F.; Keeney, S. Enhancing rigour in the Delphi technique research. Technol. Forecast. Soc. Chang. 2011, 78, 1695–1704. [Google Scholar] [CrossRef]
  70. Valdés, M.G.; Marín, M.S. Delphi Method for the Expert Consultation in the Scientific Research. Rev. Cuba. Salud Publica 2013, 39, 253–267. [Google Scholar]
  71. Ameyaw, E.E.; Hu, Y.; Shan, M.; Chan, A.P.C.; Le, Y. Application of Delphi Method in Construction Engineering and Management Research: A Quantitative Perspective. J. Civ. Eng. Manag. 2016, 22, 991–1000. [Google Scholar] [CrossRef] [Green Version]
  72. Soilmoisture Equipment Corp. 2830K1 Double Ring Infiltrometer Kit, Operating Instructions; Soilmoisture Equipment Corp.: Santa Barbara, CA, USA, 2009. [Google Scholar]
  73. Batelaan, O.; De Smedt, F. GIS-based recharge estimation by coupling surface–subsurface water balances. J. Hydrol. 2007, 337, 337–355. [Google Scholar] [CrossRef]
  74. Abdollahi, K.; Bashir, I.; Verbeiren, B.; Harouna, M.R.; Van Griensven, A.; Huysmans, M.; Batelaan, O. A distributed monthly water balance model: Formulation and application on Black Volta Basin. Environ. Earth Sci. 2017, 76, 198. [Google Scholar] [CrossRef]
  75. Mustafa, S.M.T.; Abdollahi, K.; Verbeiren, B.; Huysmans, M. Identification of the influencing factors on groundwater drought and depletion in north-western Bangladesh. Hydrogeol. J. 2017, 25, 1357–1375. [Google Scholar] [CrossRef]
  76. Alcalá, F.J. Recarga a los Acuíferos Españoles Mediante Balance Hidrogeoquímico; Universitat Politecnica de Catalanya: Barcelona, Spain, 2005. [Google Scholar]
  77. Teklebirhan, A.; Dessie, N.; Tesfamichael, G. Groundwater Recharge, Evapotranspiration and Surface Runoff Estimation Using WetSpass Modeling Method in Illala Catchment, Northern Ethiopia. Momona Ethiop. J. Sci. 2012, 4, 96. [Google Scholar] [CrossRef] [Green Version]
  78. Xu, C.Y.; Chen, D. Comparison of Seven Models for Estimation of Evapotranspiration and Groundwater Recharge Using Lysimeter Measurement Data in Germany. Hydrol. Process. 2005, 19, 3717–3734. [Google Scholar] [CrossRef]
  79. Navarro, G.; Maldonado, M. Ecología de Bolivia. Vegetación y Ambientes Acuáticos; Editorial Centro de Ecología Simón Patiño: Cochabamba, Bolivia, 2002. [Google Scholar]
  80. Feki, H.; Slimani, M.; Cudennec, C. Incorporating Elevation in Rainfall Interpolation in Tunisia Using Geostatistical Methods. Hydrol. Sci. J. 2012, 57, 1294–1314. [Google Scholar] [CrossRef]
  81. Song, L.; Chen, M.; Gao, F.; Cheng, C.; Chen, M.; Yang, L.; Wang, Y. Elevation Influence on Rainfall and a Parameterization Algorithm in the Beijing Area. J. Meteorol. Res. 2019, 33, 1143–1156. [Google Scholar] [CrossRef]
  82. Apaza-Coria, C.J.; Rodriguez-Levy, I.E.; Soruco, M.D.; Huysmans, M. Determination of the natural potential groundwater recharge in the Valle Alto basin, Bolivia, through a soil water balance. Hydrogeol. J. 2022, 30, 2341–2357. [Google Scholar] [CrossRef]
  83. Paredes, W.R. Relación Entre Altura y Precipitación Mensual, Datos Medidos por el Sensor TRMM y Estaciones Pluviométricas, en la Cuenca Pucara; Universidad Mayor de San Simón: Cochabamba, Bolivia, 2009. [Google Scholar]
  84. SEI. Atlas Geografico de la Formulación y Actualización del Plan Director de la Cuenca del Río Rocha, Bajo un Enfoque de Adaptación Al Cambio Climático; Universidad Mayor de San Simón: Cochabamba, Bolivia, 2018. [Google Scholar]
  85. Blanco, J.A. Bosques, Suelo y Agua: Explorando Sus Interacciones. Ecosistemas 2017, 26, 1–9. [Google Scholar] [CrossRef]
  86. Bonnesoeur, V.; Locatelli, B.; Ochoa-Tocachi, B.F. Impactos de la Forestación en el Agua y los Suelos de los Andes: Qué Sabemos? Resumen de Políticas; Proyecto “Infraestructura Natural Para La Seguridad Hídrica” (INSH); Condesan: Lima, Perú, 2019. [Google Scholar]
  87. Acharya, B.S.; Kharel, G.; Zou, C.B.; Wilcox, B.P.; Halihan, T. Woody Plant Encroachment Impacts on Groundwater Recharge: A Review. Water 2018, 10, 1466. [Google Scholar] [CrossRef] [Green Version]
  88. Piyaruwan, H.I.G.S.; Jayasinghe, P.K.S.C.; Leelamanie, D.A.L. Water Repellency in Eucalyptus and Pine Plantation Forest Soils and Its Relation to Groundwater Levels Estimated with Multi-Temporal Modeling. J. Hydrol. Hydromech. 2020, 68, 382–391. [Google Scholar] [CrossRef]
  89. Enku, T.; Melesse, A.M.; Ayana, E.K.; Tilahun, S.A.; Abate, M.; Steenhuis, T.S. Groundwater Use of a Small Eucalyptus Patch during the Dry Monsoon Phase. Biologia 2020, 75, 853–864. [Google Scholar] [CrossRef]
  90. Mattos, T.S.; de Oliveira, P.T.S.; Lucas, M.C.; Wendland, E. Groundwater Recharge Decrease Replacing Pasture by Eucalyptus Plantation. Water 2019, 11, 1213. [Google Scholar] [CrossRef] [Green Version]
  91. Oliveira, F.R.; Menegasse, L.N.; Duarte, U. Impacto Ambiental Do Eucalipto Na Recarga de Água Subterrânea Em Área de Cerrado, No Médio Vale Do Jequitinhonha, Minas Gerais. In Proceedings of the 2002: SUPPLEMENT—Proceedings of the XII Brazilian Congress on Groundwater, Natal, Brazil, 7–11 October 2002; pp. 1–10. [Google Scholar]
  92. van Dijk, A.I.; Hairsine, P.B.; Arancibia, J.P.; Dowling, T.I. Reforestation, water availability and stream salinity: A multi-scale analysis in the Murray-Darling Basin, Australia. For. Ecol. Manag. 2007, 251, 94–109. [Google Scholar] [CrossRef]
  93. Ellison, D.; Morris, C.E.; Locatelli, B.; Sheil, D.; Cohen, J.; Murdiyarso, D.; Gutierrez, V.; van Noordwijk, M.; Creed, I.F.; Pokorny, J.; et al. Trees, forests and water: Cool insights for a hot world. Glob. Environ. Chang. 2017, 43, 51–61. [Google Scholar] [CrossRef]
  94. Le Maitre, D.C.; Scott, D.F.; Colvin, C. A Review of Information on Interactions between Vegetation and Groundwater. Water SA 1999, 25, 137–152. [Google Scholar]
  95. Ilstedt, U.; Bargués Tobella, A.; Bazié, H.R.; Bayala, J.; Verbeeten, E.; Nyberg, G.; Sanou, J.; Benegas, L.; Murdiyarso, D.; Laudon, H.; et al. Intermediate Tree Cover Can Maximize Groundwater Recharge in the Seasonally Dry Tropics. Sci. Rep. 2016, 6, 21930. [Google Scholar] [CrossRef] [PubMed] [Green Version]
  96. Comber, A.; Wadsworth, R.; Fisher, P. Using Semantics to Clarify the Conceptual Confusion between Land Cover and Land Use: The Example of “Forest. ” J. Land Use Sci. 2008, 3, 185–198. [Google Scholar] [CrossRef] [Green Version]
  97. Rogan, J.; Chen, D.M. Remote Sensing Technology for Mapping and Monitoring Land-Cover and Land-Use Change. Prog. Plan. 2004, 61, 301–325. [Google Scholar] [CrossRef]
  98. Swift, J. Editorial: Land Use or Land Cover. J. Land Use Sci. 2008, 3, 199–201. [Google Scholar] [CrossRef]
  99. Navarro, G.; Molina, J.A.; De La Barra, N. Classification of the High-Andean Polylepis Forests in Bolivia. Plant Ecol. 2005, 176, 113–130. [Google Scholar] [CrossRef]
  100. Kosztra, B.; Büttner, G.; Hazeu, G.; Arnold, S. Updated CLC Illustrated Nomenclature Guidelines; Final Report; European Environment Agency: Wien, Austria, 2017. [Google Scholar]
  101. IDEAM. Leyenda Nacional de Coberturas de la Tierra. Metodología CORINE Land Cover Adaptada para Colombia Escala 1:100.000; Instituto de Hidrología, Meteorología y Estudios Ambientales: Bogotá, Colombia, 2010. [Google Scholar]
  102. Noriega, J.P. Determinación de las Áreas Principales de Recarga Hídrica Natural en la Microcuenca del Río Sibacá, Chinique, Quiché; Universidad de San Carlos de Guatemala: Guatemala City, Guatemala, 2005. [Google Scholar]
  103. Anuraga, T.S.; Ruiz, L.; Kumar, M.S.M.; Sekhar, M.; Leijnse, A. Estimating Groundwater Recharge Using Land Use and Soil Data: A Case Study in South India. Agric. Water Manag. 2006, 84, 65–76. [Google Scholar] [CrossRef]
  104. Moreno, A.M. Efectos del Cambio de Uso de Suelo en la Capacidad de Recarga de Agua Subterránea en la Cuenca del Río Teusacá, Subcuenca Hidrográfica del Río Bogotá; Universidad de los Andes: Bogotá, Colombia, 2019. [Google Scholar]
  105. Owuor, S.O.; Butterbach-Bahl, K.; Guzha, A.C.; Rufino, M.C.; Pelster, D.E.; Díaz-Pinés, E.; Breuer, L. Groundwater Recharge Rates and Surface Runoff Response to Land Use and Land Cover Changes in Semi-Arid Environments. Ecol. Process. 2016, 5, 16. [Google Scholar] [CrossRef] [Green Version]
  106. Scanlon, B.R.; Reedy, R.C.; Stonestrom, D.A.; Prudic, D.E.; Dennehy, K.F. Impact of Land Use and Land Cover Change on Groundwater Recharge and Quality in the Southwestern US. Glob. Chang. Biol. 2005, 11, 1577–1593. [Google Scholar] [CrossRef]
  107. Bustamante, R.; Antequera, N.; Galindo, G. Comprendiendo La Relación Con El Clima En La Zona de Tiraque. Resultados Del Proyecto Concepción Andina Del Clima. In Visiones Sobre el Clima y Gestión del Riesgo Climático. Estudios y Propuestas de Estrategias de Adaptación al Cambio Climático; Departamental del Libro de La Paz: La Paz, Bolivia, 2019; p. 260. ISBN 9788578110796. [Google Scholar]
  108. Cruz, R. Modelo de Gestión del Agua de la Cuenca Pucara; Cochabamba, Bolivia, 2011. [Google Scholar]
  109. Gutiérrez, Z.; Claure, W. El Proceso Social en la Definición de la Distribución del Agua de La Represa de Totora Khocha en la Zona de Riego Punata; Wageningen Agricultural University: Wageningen, The Netherlands, 1995. [Google Scholar]
  110. Buytaert, W.; Iñiguez, V.; Bièvre, B. De The Effects of Afforestation and Cultivation on Water Yield in the Andean Páramo. For. Ecol. Manag. 2007, 251, 22–30. [Google Scholar] [CrossRef]
  111. Suárez, E.; Arcos, E.; Moreno, C.; Encalada, A.; Álvarez, M. Influence of Vegetation Types and Ground Cover on Soil Water Infiltration Capacity in a High-Altitude Páramo Ecosystem. Av. Cienc. Ing. 2013, 5, B14–B21. [Google Scholar]
  112. Scanlon, B.R.; Keese, K.E.; Flint, A.L.; Flint, L.E.; Gaye, C.B.; Edmunds, W.M.; Simmers, I. Global Synthesis of Groundwater Recharge in Semiarid and Arid Regions. Hydrol. Process. 2006, 3370, 3335–3370. [Google Scholar] [CrossRef]
  113. Lorenz, D.L.; Delin, G.N. A Regression Model to Estimate Regional Ground Water Recharge. Ground Water 2007, 45, 196–208. [Google Scholar] [CrossRef] [PubMed] [Green Version]
  114. Bouwen, R.; Taillieu, T. Multi-Party Collaboration as Social Learning for Interdependence: Developing Relational Knowing for Sustainable Natural Resource Management. J. Community Appl. Soc. Psychol. 2004, 14, 137–153. [Google Scholar] [CrossRef]
  115. Varela, D.; Vélez, I.; Rátiva, S. Tierra y Derechos en Aguas Turbulentas. Aportes Metodológicos para la Construcción de Cartografías Sociales; Universidad Nacional de Colombia: Bogotá, Colombia, 2011. [Google Scholar]
  116. Velez, I.; Rátiva, S.; Varela, D. Cartografía Social Como Metodología Participativa y Colaborativa de Investigación En El Territorio Afrodescendiente de La Cuenca Alta Del Río Cauca. Cuad. Geogr. Rev. Colomb. Geogr. 2012, 21, 59–73. [Google Scholar] [CrossRef] [Green Version]
Figure 1. Location of the study area. (a) The Valle Alto basin, located in the Cochabamba Department in the central part of Bolivia; (b) The Virvini micro-basin, situated northeast of the Valle Alto basin within Tiraque Municipality.
Water 15 01268 g001
Figure 2. The delimitation of the Virvini micro-basin, based on the administrative limits of the Virvini community.
Water 15 01268 g002
Figure 3. Methodology flowchart with all the steps to develop a groundwater recharge probability map (GWRPM) [46].
Water 15 01268 g003
Figure 4. Input maps utilized for applying the Matus et al. [46] model: (a) slope map, (b) land use map, (c) soil textural map, (d) lithological map, (e) map of % of vegetation cover.
Water 15 01268 g004
Figure 5. Example of the recategorization process used on each input map to calculate the potential groundwater recharge, according to the evaluation tables proposed by Matus et al. [46]. In this case, the slope map of the Virvini micro-basin is shown to be recategorized.
Water 15 01268 g005
Figure 6. (a) Location of the ten survey points for identifying plant communities within the limits of the Virvini micro-basin; and (b) location of the meteorological stations near the Virvini micro-basin.
Water 15 01268 g006
Figure 7. Map of the groundwater recharge probability for the Virvini micro-basin, according to the Matus et al. [46] equation.
Water 15 01268 g007
Figure 8. Reclassified map of rainfall distribution for the Virvini basin.
Water 15 01268 g008
Figure 9. Reclassified maps of (a) the percentage of vegetation coverage in the Virvini basin and (b) land use and land cover categories.
Water 15 01268 g009
Figure 10. (a) Map of groundwater recharge probability for the Virvini sub-basin, according to the EARLI equation (Equation (3)); and (b) proposed priority protection zones based on their groundwater recharge potential.
Water 15 01268 g010
Figure 11. Long-term (5 years) spatially distributed groundwater recharge rate (in percentage) of the Virvini micro-basin, according to the WetSpass-M model.
Water 15 01268 g011
Figure 12. Groundwater recharge probability according to the community members of Virvini.
Water 15 01268 g012
Table 1. Potential for groundwater recharge according to the numerical results of the proposed model.
Groundwater Recharge ProbabilityRange
Very high4.1–5
High3.5–4.09
Moderate2.6–3.49
Low2–2.59
Very low1–1.99
Table 2. Adjusted weighting and probability of groundwater recharge according to the percentage of permanent vegetation cover.
Permanent Vegetation Cover (Percentage)Recharge ProbabilityWeighting
70–80Very high5
>80High4
50–70Moderate3
30–50Low2
<30Very low1
Table 3. Adjusted weighting and the probability of groundwater recharge according to specific land use and land cover categories found in the Virvini basin.
LULC CategoriesRecharge ProbabilityWeightingCORINE Land Cover Classes 1
Successional shrubland of the Kewiña forest (Polylepis spp., native species)Very high53.2.3 Sclerophyllous vegetation
Successional scrubs of riparian speciesHigh43.2.1.1.2.2 Dense grassland flooded with trees
Temporary potato farming;
Pastoral use;
Land without a current use
Kewiña successional shrubs interspersed with Eucalyptus plantations (Eucalyptus spp.)
Plantations of exotic species (Pinus spp.)
Open successional scrub/grassland of Tola (Baccharis tola, native species)
2.1.5.1 Potato farming
Moderate32.3.1 Pastures, meadows, and other permanent grasslands under agricultural use
3.3.3 Sparsely vegetated areas
3.1.3 Mixed forest
3.1.5.1 Coniferous forest
3.2.1 Natural grassland
Plantations of exotic species (Eucalyptus)
Open successional scrub/scrubland of Tola interspersed with Eucalyptus plantations
Intensive potato farming
Low23.1.1.1.1 Tall, dense mainland forest
3.1.3 Mixed forest
2.4.1 Crop mosaic
Urban groundVery low11.1.2 Discontinuous urban fabric
Note: 1 Based on Kosztra et al. [100] and IDEAM [101].
Disclaimer/Publisher’s Note: The statements, opinions and data contained in all publications are solely those of the individual author(s) and contributor(s) and not of MDPI and/or the editor(s). MDPI and/or the editor(s) disclaim responsibility for any injury to people or property resulting from any ideas, methods, instructions or products referred to in the content.

