Article

Influence of Design Variables on the Financial Feasibility of Rainwater Harvesting Systems

by
Rodrigo Novais Istchuk
* and
Enedir Ghisi
Department of Civil Engineering, Laboratory of Energy Efficiency in Buildings, Federal University of Santa Catarina, Florianópolis 88040-900, Brazil
*
Author to whom correspondence should be addressed.
Water 2023, 15(6), 1112; https://doi.org/10.3390/w15061112
Submission received: 19 January 2023 / Revised: 3 March 2023 / Accepted: 13 March 2023 / Published: 14 March 2023
(This article belongs to the Special Issue Rainwater Harvesting and Treatment)

Abstract

:
Extensive implementation of rainwater harvesting (RWH) systems can promote substantial improvement in urban water resource management. Therefore, establishing the financial feasibility of RWH systems is imperative for their dissemination. This study evaluated the influence of rainfall time series indicators (average annual rainfall, seasonality index and behaviour of periods without precipitation) and design variables (catchment area, rainwater demand, number of inhabitants, potable water demand and rainwater tank size) on the financial feasibility of RWH systems in eight Brazilian cities. Correlations between rainfall indicators and financial feasibility were introduced, along with sensitivity analysis of design variables. Financial feasibility was obtained in 30% to 70% of the simulated scenarios. Initial investment and operating costs varied significantly among the eight cities according to local prices. Systems with a catchment area of 200 m2 were capable of supplying, on average, 90.5% of the maximum rainwater consumption observed in this study. Local variation of potable water tariff schemes affected the financial feasibility of RWH systems. The number of inhabitants was the most influential design variable on the financial feasibility of RWH systems, followed by the rainwater tank size. Places with lower rainfall seasonality indexes and lower incidence and duration of dry periods are likely to lead to greater financial feasibility.

Graphical Abstract

1. Introduction

In Latin America, access to clean water is still an everyday problem for millions of people [1]. In terms of water availability, Brazil ranks among the biggest countries globally; however, when economic and demographic factors are considered, water scarcity is also a reality in some areas [2]. Ghisi [3] points out that, as of 2050, the northeast and southeast regions of Brazil will have water availability of less than 2000 m3 per capita per year, which is classified as very low by the UNEP [4]. However, if the widespread implementation of residential rainwater harvesting (RWH) is considered in these regions, water availability will remain above the precarious threshold in the following decades.
Traditional approaches to urban water supply prioritise centralised facilities that seek water resources in increasingly distant locations, as potable water demand increases in the city scale [5]. In this sense, RWH systems aim to reduce potable water demand from centralised distribution systems. Ghisi [3] estimated the potential for potable water savings to be between 48% and 100%, employing RWH systems in the residential sector of five Brazilian regions. However, high payback often deems most residential RWH systems as financially unfeasible [6]. In Brazil, payback periods for such systems can be as short as 1.5 years but more often range from 20.1 to 25 years [7]. Costs of RWH are characterised by high initial outlays, followed by low operational costs throughout their service life [8]. The high cost of such a solution is still a limiting factor for its implementation, and it is recommended that public authorities provide incentives to encourage the population to adopt it [5]. In addition, developing more cost-effective design solutions and innovations is also necessary for improving the financial appeal of RWH systems [6].
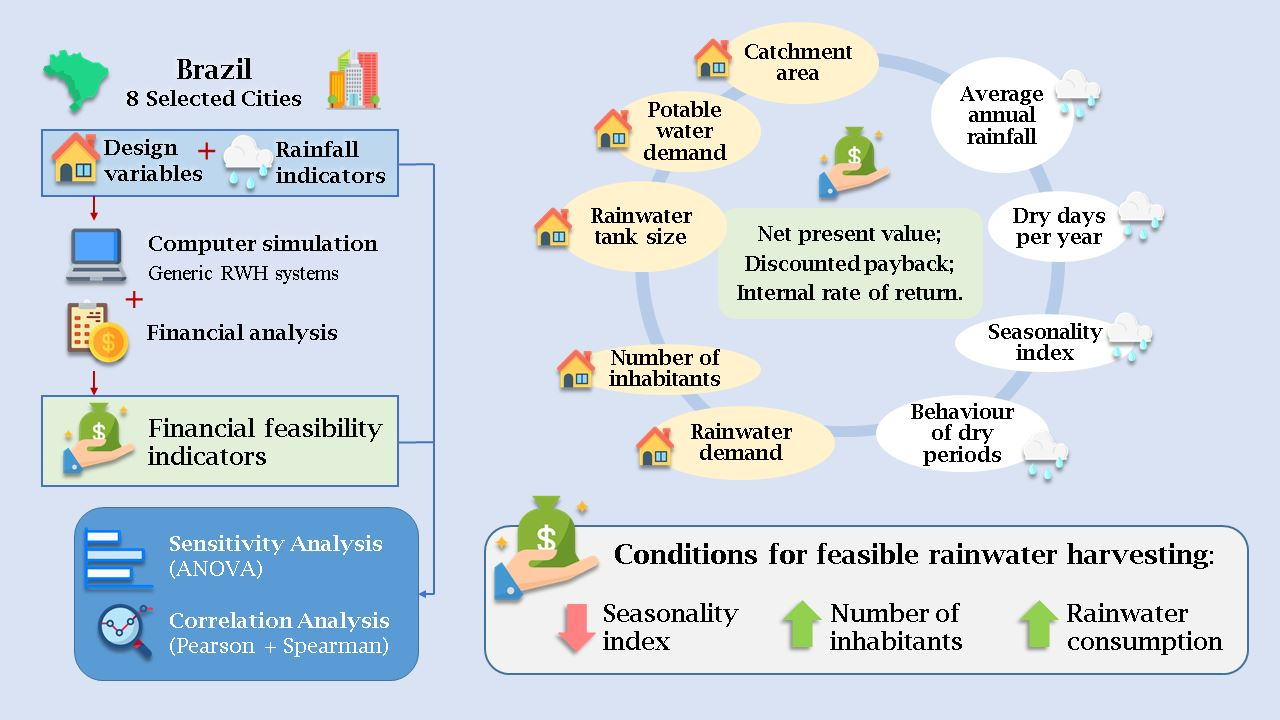
Usually, rainwater distribution to the water appliances can be done directly or indirectly. In systems with indirect distribution, a motor pump pumps rainwater from the primary storage tank at ground level to an upper rainwater tank [6]. From the upper tank, rainwater is distributed to the water appliances by gravity. As an alternative, rainwater distribution can be done from the lower tank by directly pressurising the distribution system to the water appliances. In this study, systems with both direct and indirect rainwater distribution schemes were evaluated. Direct rainwater distribution tends to be more financially feasible when compared to indirect rainwater distribution in single-family RWH systems [9]. However, as Vieira et al. [10] pointed out, the direct configuration consumes more energy than systems with indirect rainwater distribution.
The dissemination of RWH systems depends greatly on their financial feasibility, which is often neglected by residential users [11]. This study determines the costs and benefits of residential RWH systems in eight Brazilian cities with different rainfall patterns, aiming to demonstrate the conditions for financial return. The net present value, internal rate of return and payback were used as feasibility indicators, as this is a common practice in the literature [12,13].
Comparison of results from studies that investigate the financial feasibility of RWH systems is generally difficult. As Amos et al. [13] point out, this is because such studies usually employ significantly different building and design conventions for determining initial outlays. In this sense, Teston et al. [7] indicate that the tank sizing method commonly differs among studies and directly influences the potential for potable water savings and the financial feasibility of RWH systems. Correspondingly, Ward et al. [14] compared simple design methods with continuous simulation methods for RWH system designs. Methods based on continuous simulation resulted in smaller tank sizes, thus positively impacting the systems’ installation costs and financial feasibility. Furthermore, it was found that RWH systems tend to be more feasible for large commercial buildings than for domestic and more compact systems.
Installation costs of RWH systems can vary greatly, primarily depending on the tank size. Teston et al. [7] observed a wide range of paybacks (0.5 to more than 25 years) for residential RWH among six Brazilian studies. According to Li et al. [15], rainwater tanks are the most expensive components of the RWH systems, corresponding to 50–70% of their total cost in domestic settings. Similarly, Gómez and Teixeira [12] obtained tank cost corresponding to 68% of the total outlay in Belém, northern Brazil. The underground installation of rainwater tanks tends to be more expensive than the installation on the surface [15]. In this sense, for a city in southern Brazil, Istchuk and Ghisi [16] observed tank costs corresponding to 23% of the initial outlay of single-family houses. In this case, a thorough item-by-item cost survey procedure was performed.
Several Brazilian studies [12,17,18] found that the rainwater demand directly influences the financial feasibility of single-family RWH systems. Ghisi and Schondermark [17] observed that the systems are feasible (paybacks between 1.5–10 years) in most cases. Berwanger and Ghisi [18] observed feasible systems with rainwater demand above 18 m3/month. Severis et al. [9] conducted financial analyses on residential RWH systems comparing three different system typologies: direct distribution, indirect distribution and a simpler system with a single rainwater tank. The system with direct rainwater distribution proved to be the most feasible, with an internal rate of return of 6.85% per year.
The potable water tariff schemes practised by local water utilities are also influential for the feasibility of domestic RWH systems. Liang and Van Dijk [19] observed that, in Beijing, China, the financial feasibility of RWH systems depends largely on potable water tariffs. In this sense, Li et al. [15] point out that paybacks tend to increase in the future for these systems, given the upward trend in water costs and the current lack of government incentives in the country for RWH. Gómez and Teixeira [12] studied the financial feasibility of twelve houses in northern Brazil. Similarly, as observed in other works [18], the tariff scheme of the local water utility makes it unfeasible to use rainwater in homes that pay a fixed rate for consumption up to a certain threshold. This observation reinforces the importance of reviewing the tariff scheme practised in some locations and establishing government incentive policies that encourage implementing RWH systems.
Large-scale implementation of RWH systems could be financially beneficial for water companies. Cureau and Ghisi [20] evaluated the possible financial impacts of different water-saving strategies on public administration in the city of Joinville, southern Brazil. When considering the extensive implementation of RWH systems in the city, annual savings of up to five million Brazilian reais (BRL) could be achieved by reducing the need to expand centralised supply systems. The study concludes that the utility would not fail to profit and would obtain total financial gains between 13 and 45 million BRL annually by adopting the use of rainwater at the scale of the city.
In Brazil, the technical standard NBR 15527 specifies RWH requirements for non-potable uses [21]. According to Teston et al. [7] non-potable uses correspond to about 50% of residential water use nationally. The Brazilian technical standard [21] states that the RWH systems design must consider several variables, including the local rainfall characteristics, the catchment area and rainwater demand. To assess the influence of these variables on the model outputs, sensitivity analysis methods are practical and widely used tools [22,23,24].
According to Saltelli and Marivoet [25], sensitivity analysis techniques are fundamental for understanding complex models, especially when they involve many input variables. For instance, Jin et al. [26] employed a sensitivity analysis to determine the relative importance of uncertain parameters such as inflation and discount rates on financial support programs to promote installation of RWH systems in South Korea. The net present value was deemed as an appropriate indicator to estimate the financial feasibility of RWH systems. Moreover, funding programs and financial support policies were recommended to increase financial feasibility of RWH systems. Conversely, Severis et al. [9] employed a sensitivity analysis to assess the financial feasibility of RWH systems in Lages, southern Brazil. Systems with direct and indirect rainwater distribution were analysed, and the potable water tariff was pointed out as the variable with the most significant influence on the system’s financial feasibility.
Silva and Ghisi [24] also used a sensitivity analysis to determine the influence of design variables on RWH systems’ performance in eight Brazilian cities. Rainwater demand was the most important parameter affecting most cities’ potential for potable water savings. Considering the diversity of input variables involved in the design of RWH systems, sensitivity analysis is a valuable tool for designers, customers and decision-makers to make their choices towards implementing this technology more broadly.
Not many studies can be found in the literature on the influence of rainfall characteristics on the performance of RWH systems. Pacheco et al. [27] evaluated the influence of different rainfall patterns on the financial feasibility of 1000 RWH system design scenarios in the same location in central Brazil. The number of days without precipitation was deemed an essential parameter for the feasibility of RWH systems. Similarly, Geraldi and Ghisi [28] found that short-term rainfall time series can be used instead of long-term time series for simulating RWH with similar results. The main condition for this is that the average number of dry days per year should be similar for both series, thus pointing to this indicator as an important parameter for RWH design.
Considering the water scarcity perspective due to urbanisation and climate change, the current water and sanitation model must undergo structural changes, aiming toward more decentralised water supply strategies [29]. In this sense, the broad adoption of RWH systems contributes to the water security of cities, delaying the need to build or expand centralised water treatment units [30]. In addition, it is also important to highlight other benefits of RWH systems, such as the reduction in energy consumption linked to the treatment and distribution of potable water, reduction in the emission of greenhouse gases and mitigation of urban flooding during intense precipitation events [6].
For a more complete and realistic analysis of the financial feasibility of RWH systems, it is important to consider their indirect benefits. Despite this, most approaches used in research are simplistic because they do not consider the full benefits of this type of technology [6]. Considering this, government support through policies and incentives designed to encompass the socio-environmental benefits of RWH systems are essential to disseminate their use on a wider scale [5,12,31,32].
Reliable information regarding the financial feasibility of RWH systems is imperative for the development of accurate incentive schemes for its promotion. Conversely, most research about the topic employs different approaches, making it difficult to equitably analyse their results. Considering the knowledge gap regarding the financial feasibility of residential RWH systems in the literature [33] and the great diversity observed in design conventions for RWH systems [13], this study aims to provide relevant information for potential investors or policymakers through presenting a comparable financial feasibility analysis among cities with different rainfall characteristics. Moreover, the study classifies the initial outlays of RWH systems of varied sizes into relevant categories for RWH design, thus providing a reference for further studies or other locations.
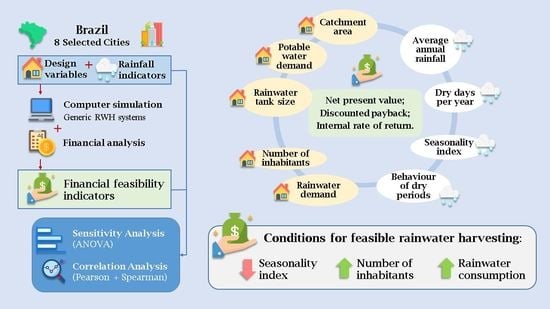
The main output of this study consists in evaluating the influence of rainfall time series indicators (average annual rainfall, average number of dry days per year, seasonality index, average duration, standard deviation, coefficient of variation and maximum duration of dry periods) and design variables (catchment area, rainwater demand, number of inhabitants, potable water demand and rainwater tank size) on the financial feasibility of RWH systems. For this, this study introduces two novel approaches: sensitivity analysis of design variables over the net present value and correlation analysis between rainfall characteristics and the financial feasibility of RWH systems.

2. Method

Rainfall time series from eight Brazilian cities were obtained and characterised with RWH-oriented indicators. Two rainwater distribution schemes were considered for the financial analysis: direct (via pressuriser) and indirect (via gravity, with two tanks). Single-family RWH systems were designed considering materials and labour for obtaining installation costs in new buildings, following the recommendations from the Brazilian standard NBR 15227 [21]. Computer simulations were used to determine ideal tank sizes, potable water savings and energy consumption of the RWH systems based on a range of generic design variables. The initial cost survey comprised costs from local tank suppliers and a federal budget composition database [34]. Combined results from the computer simulations, literature conventions and local energy tariffs were used to obtain operational costs.
Financial analysis of the RWH systems rendered three indicators: payback, internal rate of return and net present value. Sensitivity analysis (ANOVA) was employed to determine the influence of design variables on the financial feasibility of RWH. Finally, correlation analysis (Pearson and Spearman) was used to determine the influence of rainfall indicators on the feasibility of RWH systems.

2.1. Rainfall Data

Eight representative cities were selected among the 27 Brazilian capitals following the cluster analysis method described by Istchuk and Ghisi [35]. The selection sought to contemplate the different rainfall characteristics in Brazil.
Precipitation data for each city were obtained via the National Institute of Meteorology of Brazil and characterised through RWH-oriented indicators which are commonly used by other researchers.
Geraldi and Ghisi’s [28] three indicators to describe rainfall for RWH design: average annual precipitation, the average number of dry days per year and the seasonality index. The average annual precipitation was calculated using Equation (1).
R = i = 1 n ( T i ) n
where: R is the average annual precipitation (mm), Ti is the total precipitation for each year i (mm/year) and n is the historical time series duration (years).
The average number of dry days per year was calculated using Equation (2).
D = i = 1 n ( d i ) n
where: D is the average number of dry days per year (days), di is the total number of dry days for each year i (mm/year) and n is the historical time series duration (years).
The seasonality index was calculated using Equation (3) [36]. The higher it is, the higher the seasonal rainfall variation.
S = 1 A i × i = 1 12 | M i A i 12 |
where: S is the seasonality index (non-dimensional), Ai is the yearly precipitation (mm) and Mi is the average monthly precipitation (mm).
In addition, four statistical indicators for dry periods were also obtained, in accordance to what was done by Silva and Ghisi [24]. First, each dry period in the precipitation series was identified. Any day with no precipitation record (0 mm) preceded by a day with a precipitation record (>0 mm) was regarded as the beginning of a dry period. For each dry period, the number of consecutive days with no precipitation records was obtained. Additionally, the average duration, standard deviation, coefficient of variation and maximum duration of dry periods were obtained for each rainfall time series by means of MS Excel functions.

2.2. Rainwater Distribution Schemes

The first RWH scheme, with indirect rainwater distribution, contemplates two rainwater tanks. Collected rainwater flows by gravity to a lower tank, from which it is pumped to an upper tank, where again, by gravity, it is distributed to the water appliances. In the second scheme, collected rainwater is stored in the lower tank and distributed directly to the water appliances through a pressuriser. Details about the two configurations are shown in Figure 1.

2.3. Initial Outlay

The design used for the cost outlay was defined following NBR 15227 [21]. Table 1 shows the design conventions adopted.
Tank costs were collected for each city via telephone, e-mail or online consultation with local suppliers. At least three different suppliers were consulted, and the lowest price found was used in the analysis. A national budget composition database [34] was used to obtain the costs of all remaining items according to each location. Labour costs were embedded in all items according to the national SINAPI cost database.

2.4. Computer Simulation of RWH Systems

Generic RWH systems were simulated for each location based on local rainfall time series. The Netuno computer programme, version 4, was used to perform the simulations [37]. A daily water balance model considered building features related to RWH (catchment area, first-flush discharge, runoff coefficient) and water demand information (total water demand, number of occupants and rainwater demand as a percentage of total water demand). The main outputs are the potential for potable water savings and the ideal rainwater tank size. The detailed simulation procedure is available in Netuno’s user manual [38].
Ideal tank sizes were used to compose the list of materials for the systems, and potentials for potable water savings were used to determine the operational costs. Other input variables were selected to represent a single-family dwelling compatible with the cities studied, occupied by four people. The total water demand was considered as 165 L/inhab.day, corresponding to the average consumption observed among the eight representative cities. To simplify the simulations, no upper rainwater tank was considered. The runoff coefficient was adopted as 0.8 to favour safety and allow compatibility with similar studies that involved simulating generic residential RWH systems [24,27,39,40]. First-flush discharge was defined as 2 mm according to the previous version of the Brazilian technical standard NBR 15527 [41]. Table 1 shows the input variables used in the computer simulations. Table 2 shows the input values used in the computer simulations.

2.5. Operational Cost

Operation and maintenance costs considered a typical RWH system that distributes rainwater in the building via motor pump or pressurizer. Electricity tariffs were considered according to the current value of each location [42]. According to Vieira et al. [10], 0.80 kWh/m3 was used as a reference for the RWH systems with indirect rainwater distribution and 0.60 kWh/m3 was assumed for all direct RWH systems. Maintenance costs were considered as 1.00% of the initial outlay yearly [9].

2.6. Lifespan

The lifespan of 30 years was considered for the RWH systems according to Sant’Ana et al. [43], and it corresponds to the total extent of the feasibility analysis. Inflation was considered to be 0.40% per month [44]. According to such an index, the system’s cash flow was corrected yearly.

2.7. Financial Benefit

Potable water savings by means of rainwater use were used to calculate the financial benefits generated by the RWH systems. Table 3 shows the list of water utility companies consulted to obtain water tariffs in each city. Sewage treatment costs were included in the analysis according to the rules of each local water utility.
The financial benefit was calculated monthly by comparing water tariffs obtained after the installation of the RWH system with the value that would be paid originally. The monthly water consumption used to obtain the initial water tariff was obtained according to Equation (4).
W 0 = n   ×   Q   ×   d
where: W0 is the initial monthly water consumption (litres/month); n is the number of dwellers (people); Q is the potable water demand (litres/dweller.day) and d is the number of days in the month (days).
Similarly, the monthly water consumption used to obtain the water tariff after implementing the RWH system in the building was calculated using Equations (5) and (6).
W r = W 0   ×   P w s
where: Wr is the monthly rainwater consumption (litres/month); W0 is the initial monthly potable water consumption (litres/month) and Pws is the potential for potable water savings obtained in the computer simulations (%).
W 1 = W 0   W r
where: W1 is the potable water consumption after the implementation of the RWH system (litres/month); W0 is the initial monthly potable water consumption (litres/month) and Wr is the monthly rainwater consumption (litres/month).
The monthly financial benefit generated by the RWH system was determined with Equation (7).
B = C W 0 C W 1
where: B is the financial benefit generated by the RWH system (BRL/month); CW0 is the water cost before installation of the RWH system (BRL/month) and CW1 is the water cost after the installation of the RWH system (BRL/month).

2.8. Financial Feasibility Analysis

Financial feasibility was described by three indicators. The analysis was performed via the built-in calculator of the Netuno computer programme [37].
The first feasibility indicator is the discounted payback. It indicates the time required so that the investment generates enough financial benefit to pay for itself. Investments are more feasible as shorter paybacks are observed, and paybacks longer than the system’s lifespan are unfeasible. Discounted payback periods were calculated using Equation (8).
t = 1 360 B t C t ( 1 + i ) t   K
where: Bt is the total benefit in the month of analysis (BRL), Ct is the total cost at the month of analysis (BRL), i is the interest rate (% per month), t is the time step count (months) and K is the initial cost of the investment (BRL).
The net present value was used to calculate the total financial benefit generated by the RWH system for 30 years using Equation (9).
NPV = K + t = 0 360 B t C t ( 1 + i ) t
where: NPV is the net present value (BRL), K is the initial cost of the investment (BRL), Bt is the total benefit at month t (BRL/month), Ct is the total cost at month t (BRL/month), i is the interest rate (% per month) and t is the time step count (months).
According to Ghisi and Cordova [38], the internal rate of return is the rate that equals the present value of total benefits and costs at a certain point in time. The minimum acceptable rate of return was defined as 0.50% per month, commonly found in investments in Brazil. The internal rate of return is the value that satisfies Equation (10).
NPV = 0 = K + t = 1 360 B t C t ( 1 + IRR ) t
where: NPV is the net present value (BRL), K is the initial cost of the investment (BRL), Bt is the total benefit at month t (BRL/month), Ct is the total cost at month t (BRL/month), IRR is the internal rate of return (% per month), and t is the time step count (months).

2.9. Sensitivity Analysis

Sensitivity analysis was used to determine the influence of RWH systems’ design variables (Section 3.4) over the net present value obtained in the financial analysis. The influence of the variables was determined up to the second-order effects by means of a complete factorial experiment based on variance analysis (linear ANOVA) [53]. The sensitivity analysis was performed using the Minitab® 18 Statistical Software. The indicator used for the sensitivity analysis was the F-value, calculated using Equation (11) for the first and second-order effects.
F ( A ) = M Q ( A ) M Q ( Error )
where: MQ(A) is the mean square of A variable (analogously for B variable); F(A) is the F-value of A variable (analogously for B variable); MQ(Error) is the mean square of the non-computed variances, i.e., the variances above third order effects.
The F-values underwent linear normalisation using the highest value observed in each set as a reference (assumed = 1.0). This procedure allows to compare the results directly with F-values sourced from other studies.

2.10. Correlation Analysis

Correlation analysis was performed to examine the relationship between rainfall characteristics and the financial feasibility of RWH systems for different Brazilian rainfall patterns. Pearson and Spearman correlation coefficients were obtained between the rainfall indicators in Section 3.1 and the net present value obtained in the financial analysis. The distribution type affects the correlation analysis. Therefore, the Pearson correlation was used to assess the linear relationship between two continuous variables; and the Spearman correlation was used to assess the monotonic relationship between two continuous or ordinal variables. Median and average net present values were assessed in the correlation analysis.

3. Results

Based on the cluster analysis method described in the work by Istchuk and Ghisi [35], the representative cities chosen for this study are Belém, Recife, Campo Grande, Salvador, Brasília, Florianópolis, Belo Horizonte, and São Paulo. Table 4 shows the rainfall indicators obtained for the cities analysed.
A total of 432 scenarios were simulated (54 for each city) to obtain financial feasibility indicators. All costs correspond to March 2021. Results from other studies were also corrected to March 2021, according to Brazil’s National Index of Civil Construction [54].

3.1. Initial Outlay

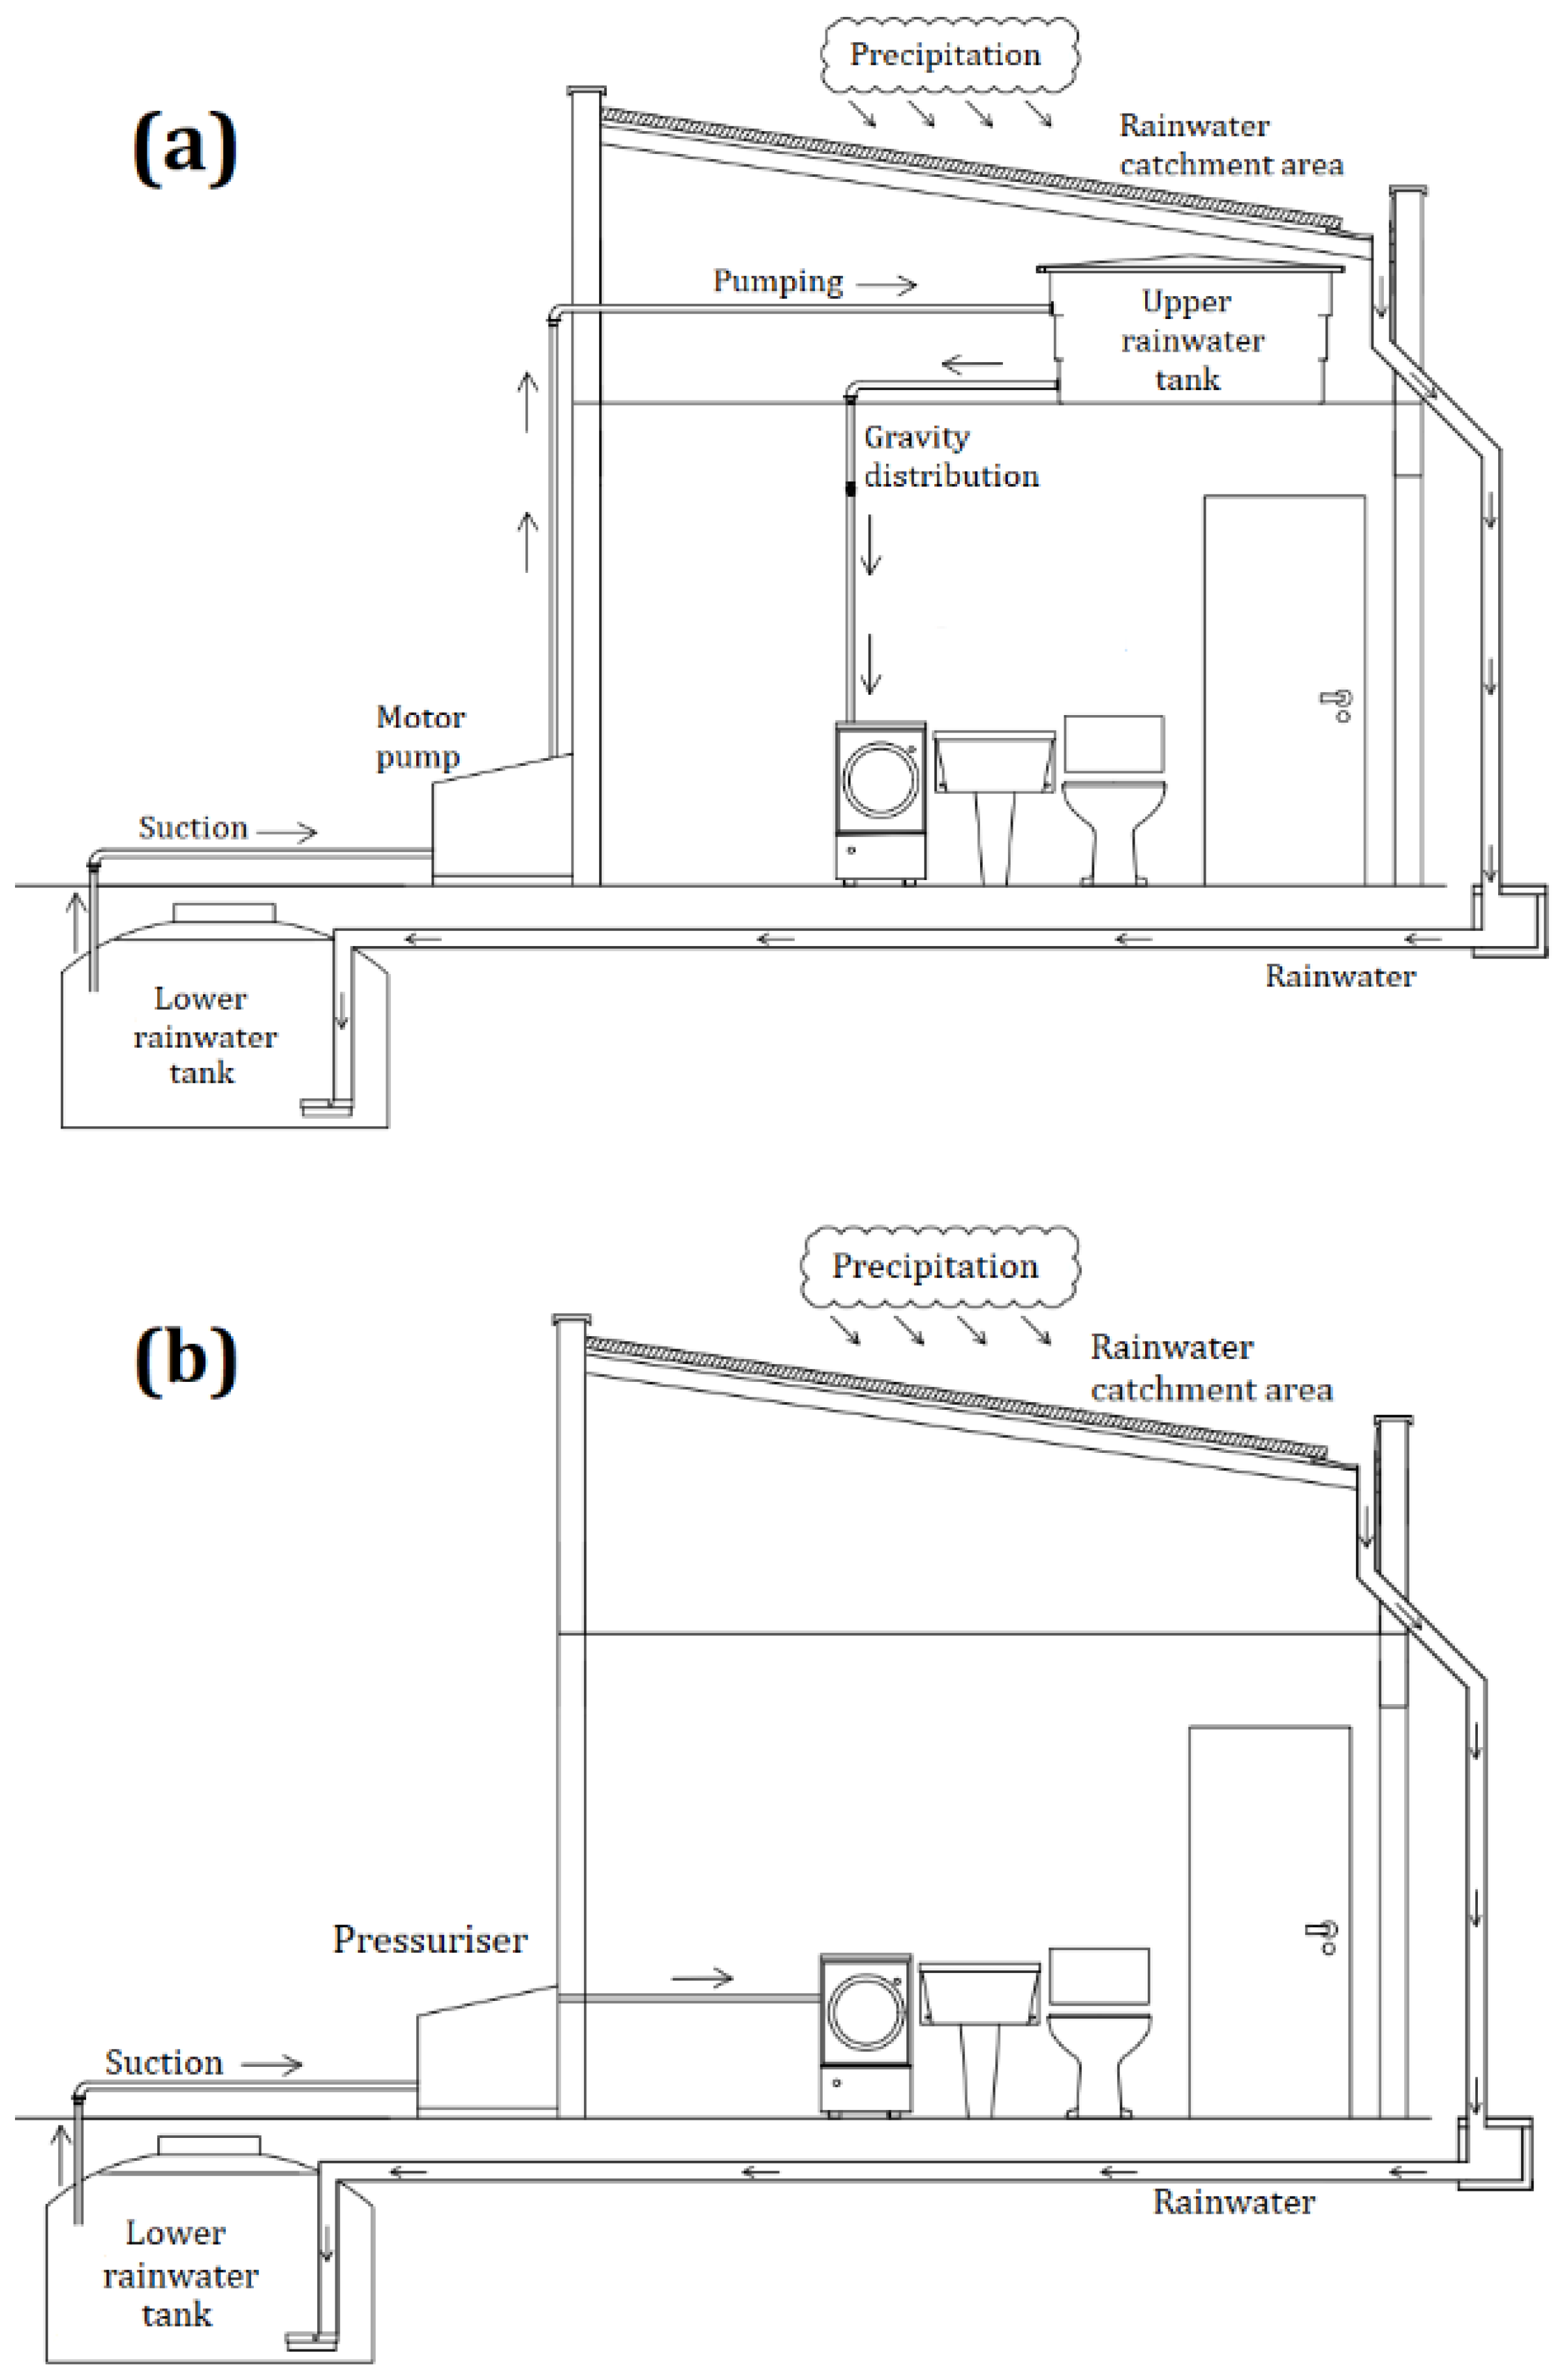
Figure 2 shows the average initial investment values for each city, considering RWH systems with direct and indirect rainwater distribution.
Initial outlays presented slight variations among the cities surveyed. The highest average initial cost among the cities was obtained for the city of São Paulo (BRL 15,785.17 and BRL 15,360.22 for systems with indirect and direct rainwater distribution, respectively). The lowest cost was observed in Belém (similarly, BRL 12,094.61 and BRL 11,904.50). Systems with direct rainwater distribution presented initial outlays between 0.30% (Salvador) and 2.69% (São Paulo), below the outlays of systems with indirect rainwater distribution. RWH systems with direct distribution tend to have lower initial costs due to the absence of an upper rainwater tank. However, higher costs for pressurisation equipment tend to make such savings less significant. Table 5 shows the average initial outlays among all cities for both rainwater distribution schemes evaluated herein.
Ghisi and Oliveira [55] evaluated initial outlays of RWH systems with indirect distribution in two single-storey houses in Palhoça, Santa Catarina and obtained costs that correspond from 44.3% to 55.2% of the outlays obtained herein in similar systems in Florianópolis. Similarly, Carvalho [56] estimated an initial cost of BRL 7199.29, corresponding to 52.9% of the cost taken as a reference in this analysis.
Both in this work and in the literature cited herein, materials and labour were considered in the outlays. However, as Teston et al. [7] pointed out, the significant difference observed among works is related to different design conventions adopted. Higher initial costs indicate that a more comprehensive list of items has been considered herein when compared to results obtained by Ghisi and Oliveira [55] and Carvalho [56].
Severis et al. [9] evaluated larger systems and indirect rainwater distribution. The authors obtained an initial cost that corresponds to 88.9% of the average cost obtained herein for a similar system. Considering the greater proximity between the costs compared, it can be assumed that the authors considered a similar level of detail in the cost surveys.
Initial outlays were also distributed into categories representing different component groups of RWH systems. Table 6 shows the average results among all cities. Systems with a catchment area of 200 m2 were taken as a reference.
As tank size increases, costs relative to tanks and civil works also increase. In this study, most civil works correspond to the underground tank installation. For the other items, the representative cost decreases as the capacity of the tanks increases. Despite having similar outlays, indirect and direct rainwater distribution systems presented different cost distributions. Although systems with direct distribution require less investment for tanks, the costs of electrical installations tend to be higher due to the considerable cost difference observed between the pressurizer and the motor pump.

3.2. Operational Cost

On average, the operating costs obtained for systems with direct rainwater distribution were only 3.08% lower than those obtained for indirect rainwater distribution, mainly due to the lower electricity costs attributed to the pressuriser. Table 7 shows the average operational costs obtained in each city, considering both rainwater distribution schemes evaluated herein. Average operational costs were obtained per cubic meter of consumed rainwater for both feasible and unfeasible systems.

3.3. Financial Feasibility

Systems with paybacks under 30 years, positive net present values and internal rates of return above 0.50% per month were considered financially feasible. 
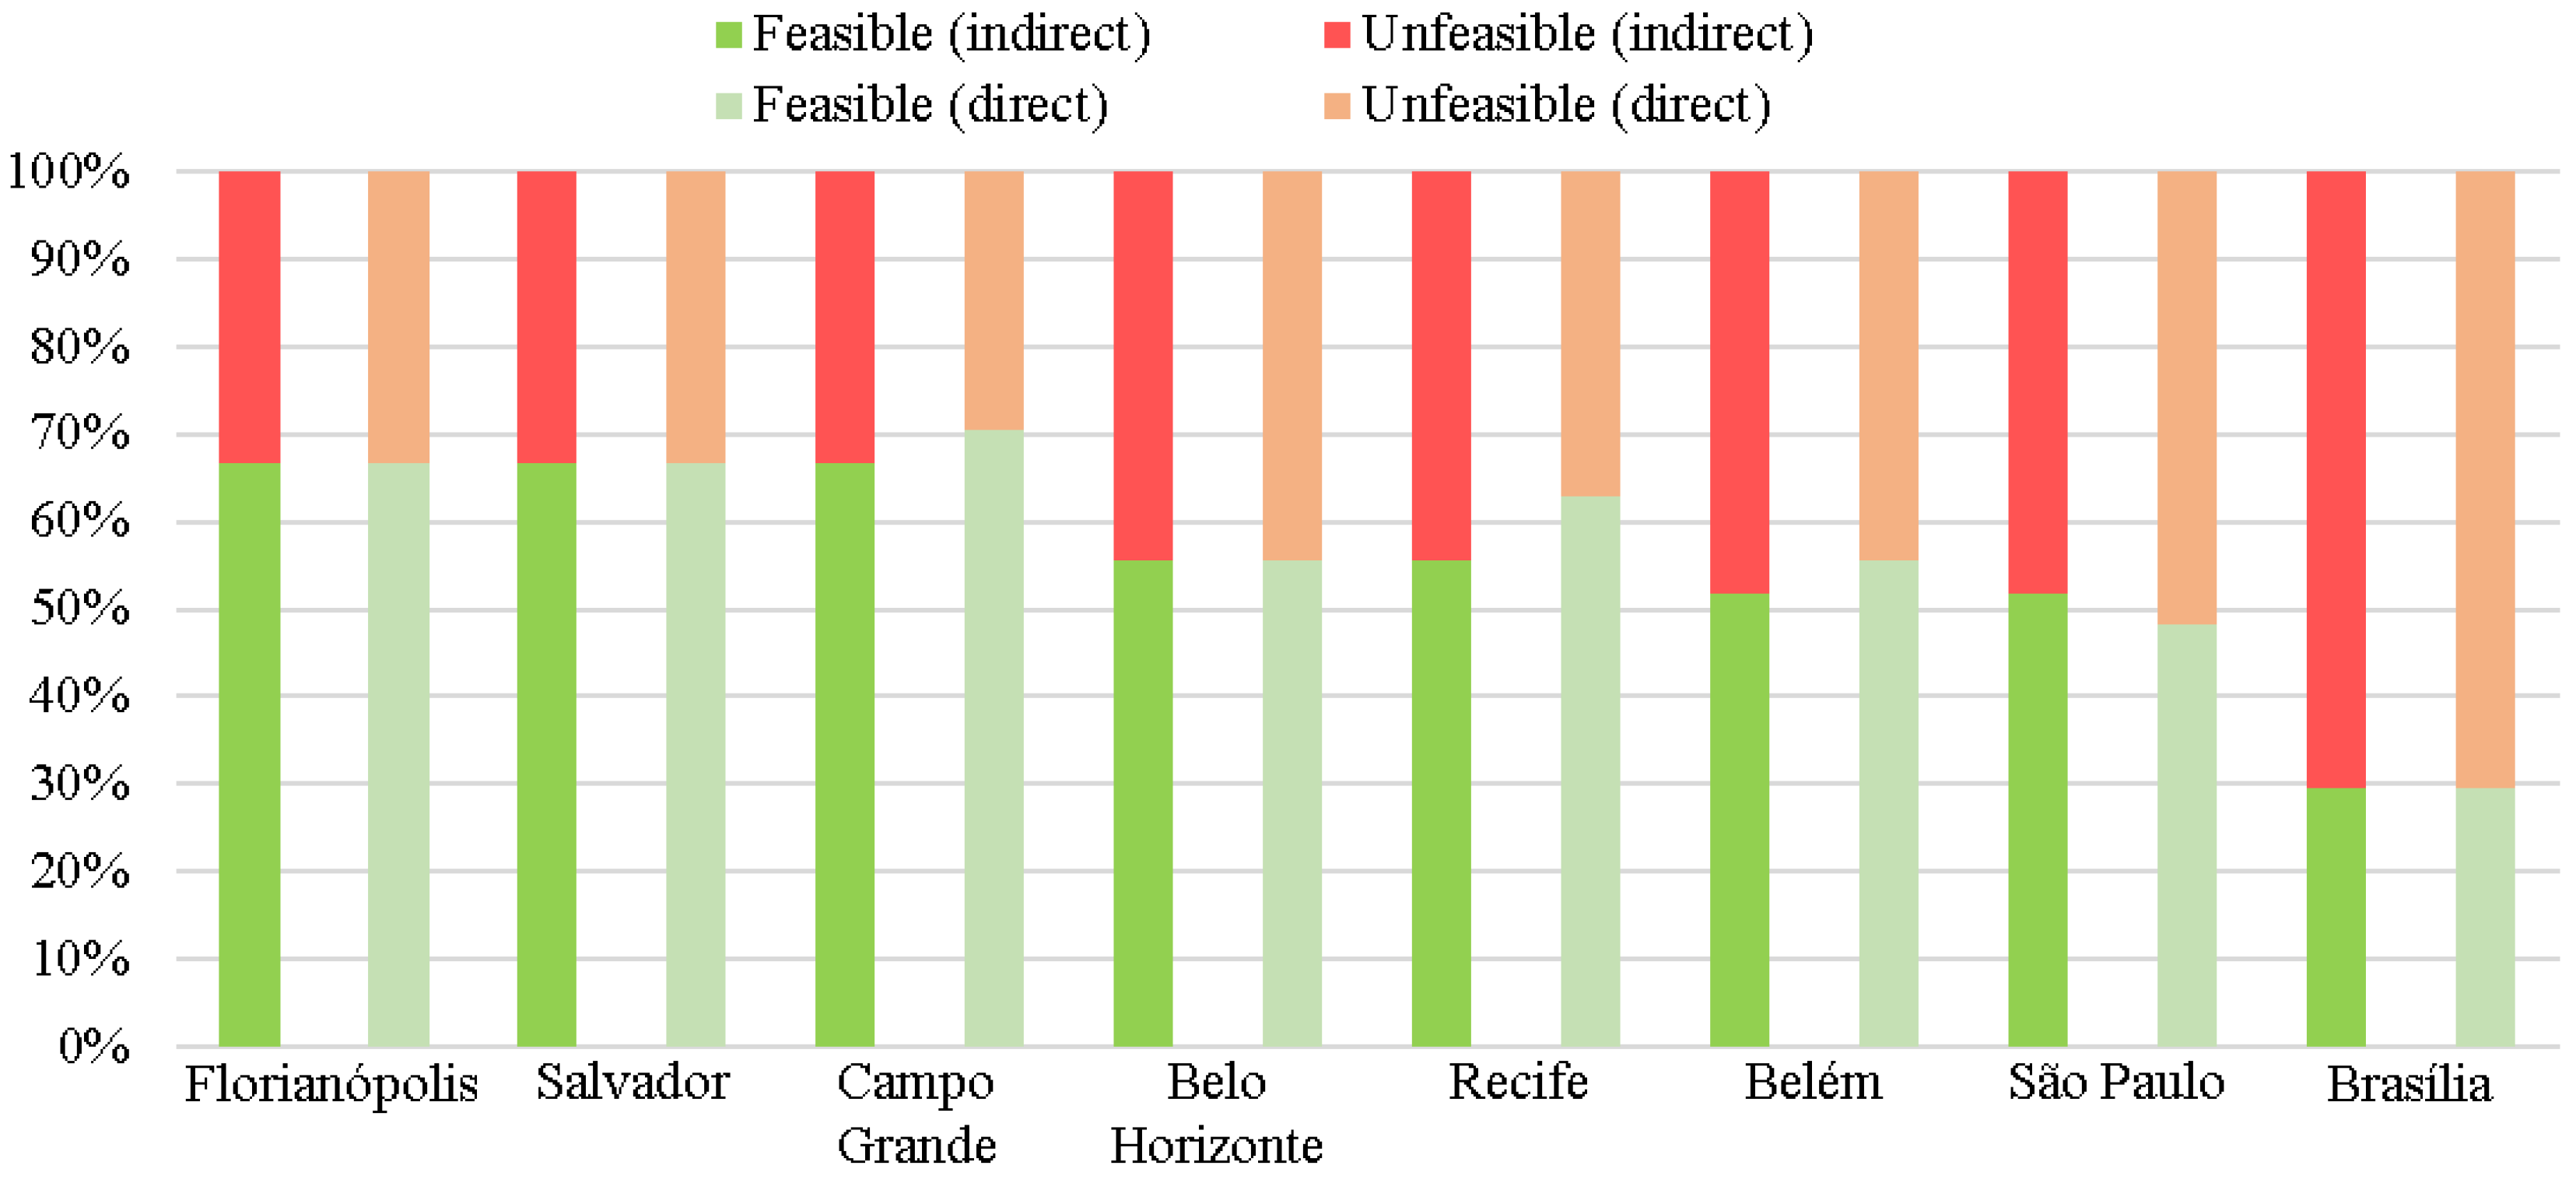
Figure 3 shows the financial feasibility of the eight cities studied herein for RWH systems with direct and indirect rainwater distribution.
Florianópolis, Salvador and Campo Grande performed best in terms of financial feasibility. Despite presenting similar feasibility results, it is interesting to point out the significant differences among their rainfall indicators. Campo Grande, for instance, is much drier (1479 mm/year) than Florianópolis and Salvador (1857 and 1754 mm/year, respectively). Campo Grande and Salvador have similar seasonality indexes (0.47 and 0.48, respectively), while Florianópolis stands out for its excellent rainfall distribution throughout the year (S = 0.22).
Campo Grande, Recife, Belém performed best in terms of feasibility for direct systems when compared to indirect systems. Severis et al. [9], in this sense, found that systems with direct rainwater distribution tend to be more financially feasible than those with indirect rainwater distribution.
Belo Horizonte stands out for presenting a feasibility percentage of 56%, even with a seasonality index equal to that of Brasília (0.74) and an average of 263 dry days per year, the highest among the cities studied. The different tariff structures practised in the eight cities can explain such a difference. Figure S1, in the Supplementary Materials, shows the water tariff schemes practised in each city.
Belém stands out as the city with the highest rainfall availability (2998 mm/year) and a seasonality index similar to Campo Grande and Salvador (0.46). With an average of only 98 dry days per year, the feasibility of RWH systems in Belém was compromised by the water pricing scheme practised there.
Water tariffs in Belém, despite being lower than the national average, do not produce significant savings on the water bill from potable water savings. On the other hand, Campo Grande benefited in this sense by implementing a water tariff structure that favours the financial benefit of RWH systems.
Berwanger and Ghisi [18] evaluated residential RWH systems in the city of Itapiranga, southern Brazil. They pointed out that no financial feasibility is possible in systems with water consumption below 10 m3/month due to the fixed tariff practised by the local water utility. In this research, the same can be observed in Belém, Recife and São Paulo. Salvador and Belo Horizonte also have fixed tariffs for monthly water consumption lower than a water consumption threshold. Campo Grande, Brasília and Florianópolis do not adopt fixed tariffs.
In this sense, Ghisi and Oliveira [55] highlight the importance of reviewing Brazilian legislation regarding water tariff schemes to stimulate potable water savings. Based on a case study in Belém, Gómez and Teixeira [12] also mention the tariff structure practised and suggest adjustments so that more significant financial benefit can be obtained from potable water savings.
Financial feasibility indicators did not vary significantly for RWH systems with direct or indirect rainwater distribution. Table 8 shows the average results among all simulated scenarios for both rainwater distribution schemes evaluated herein.
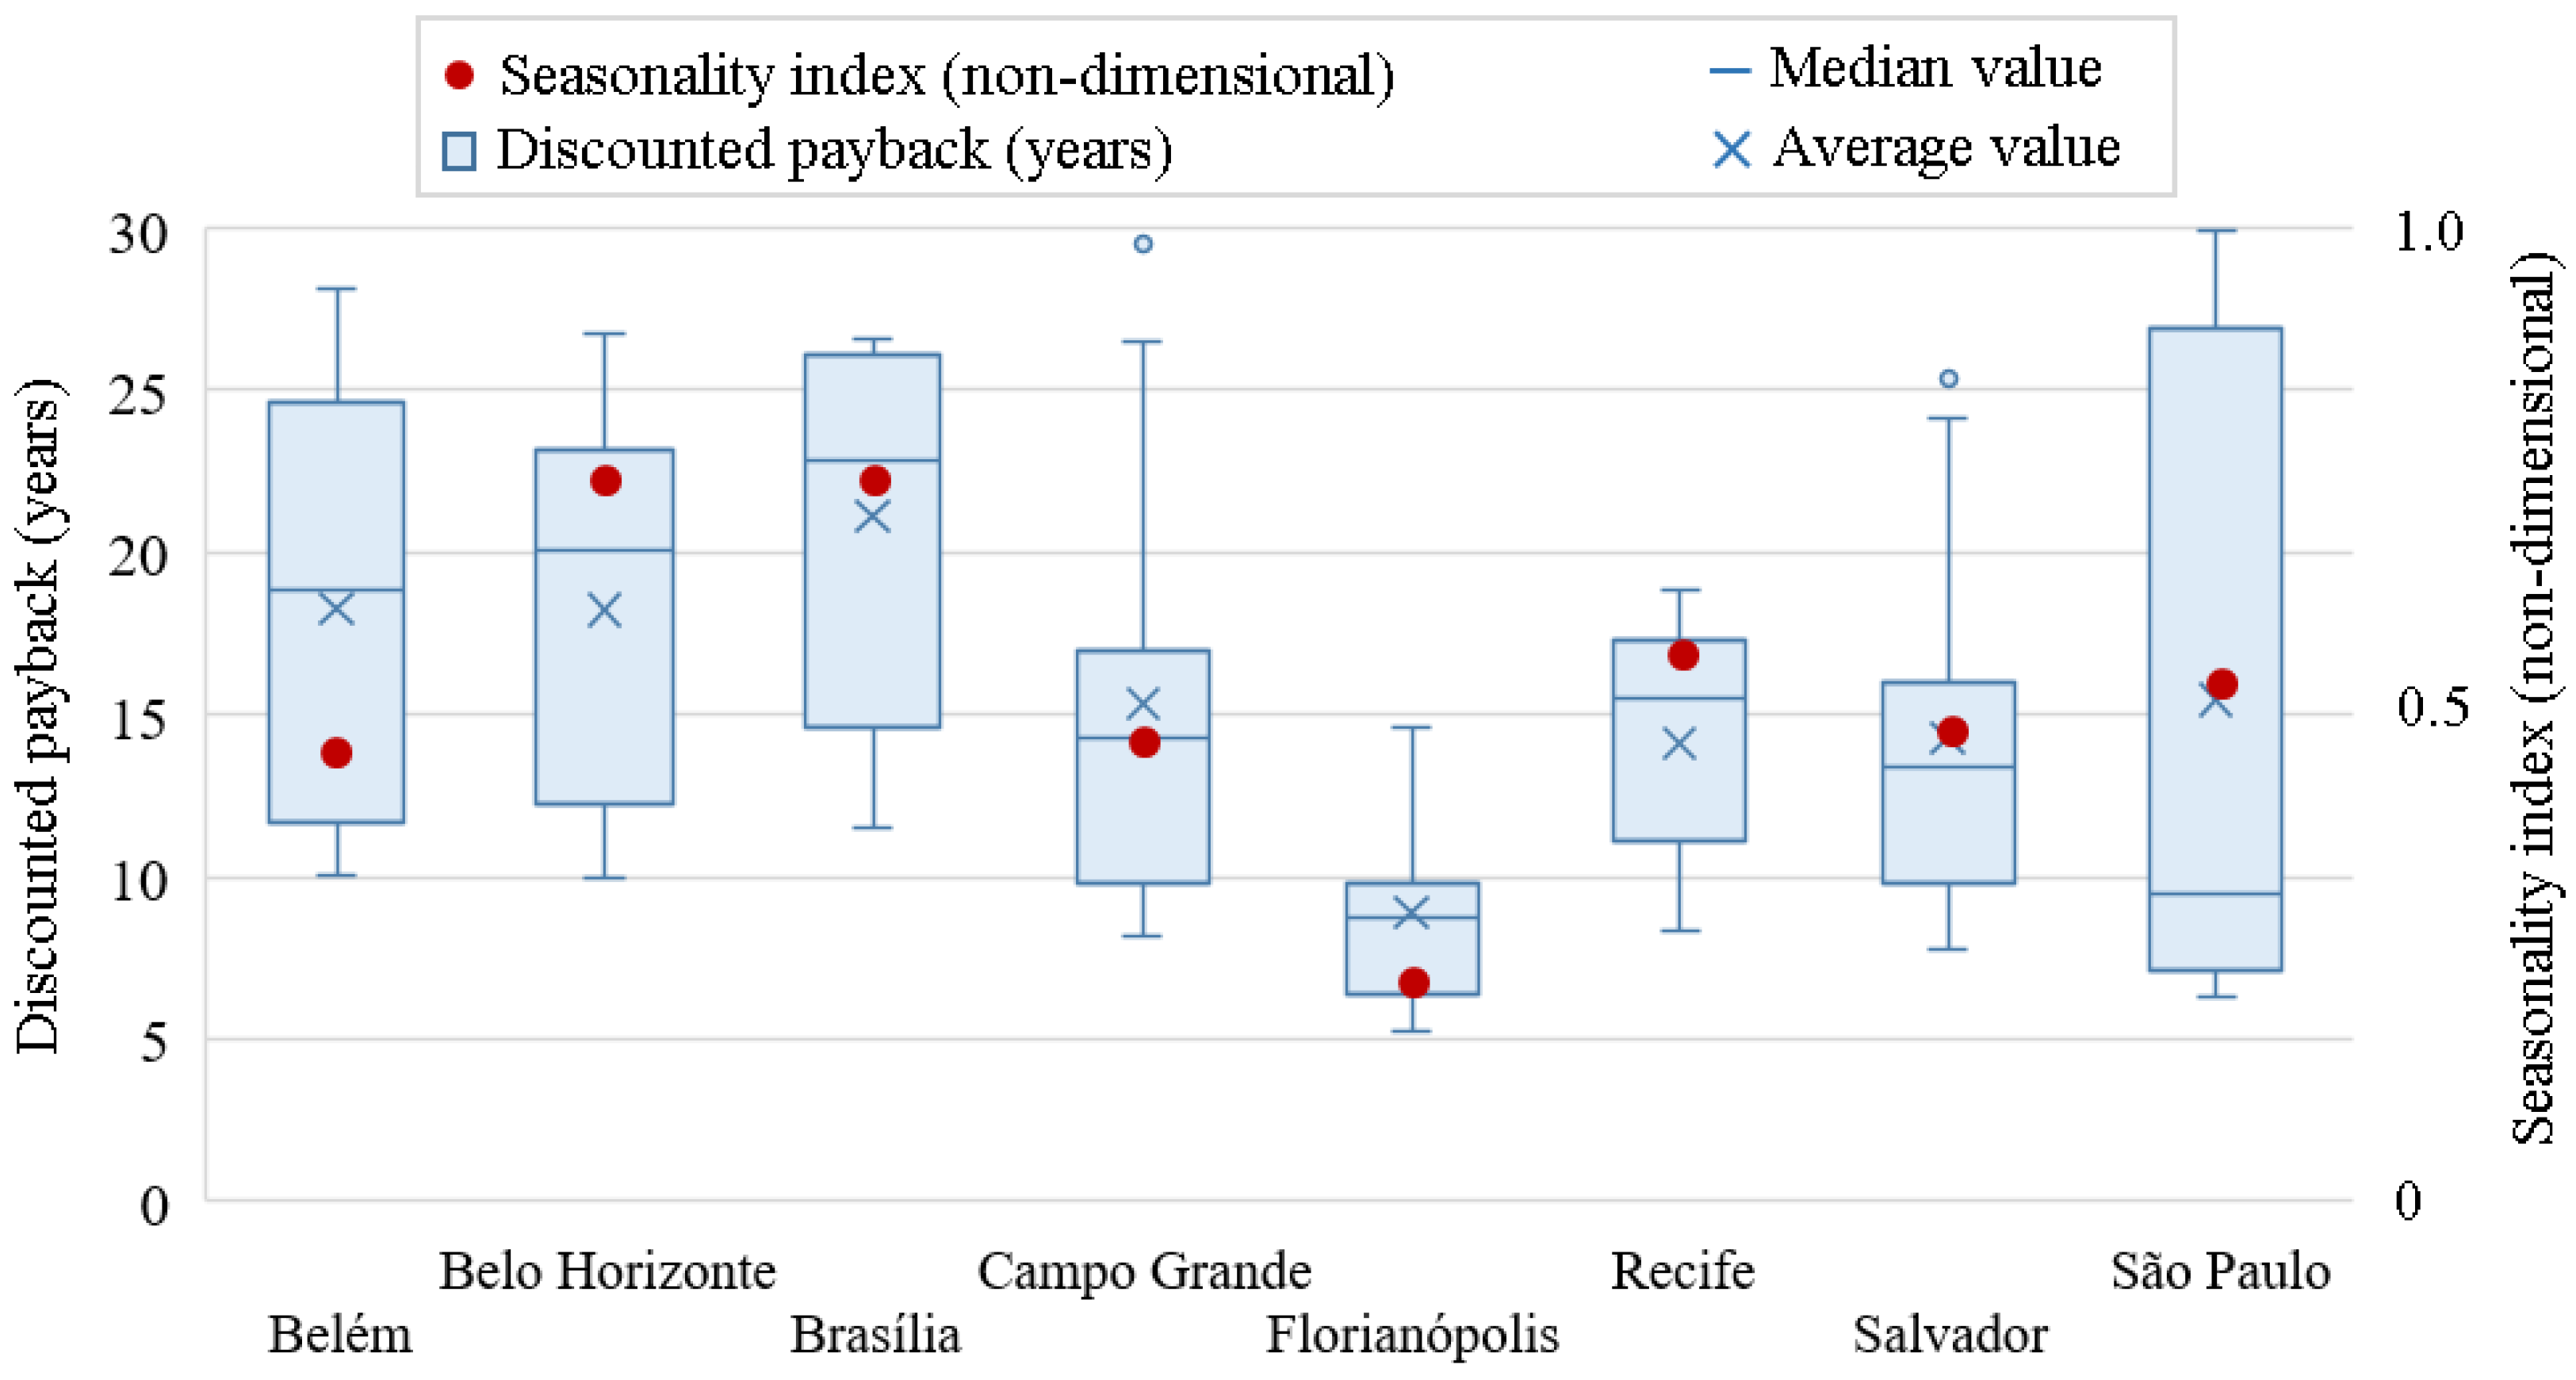
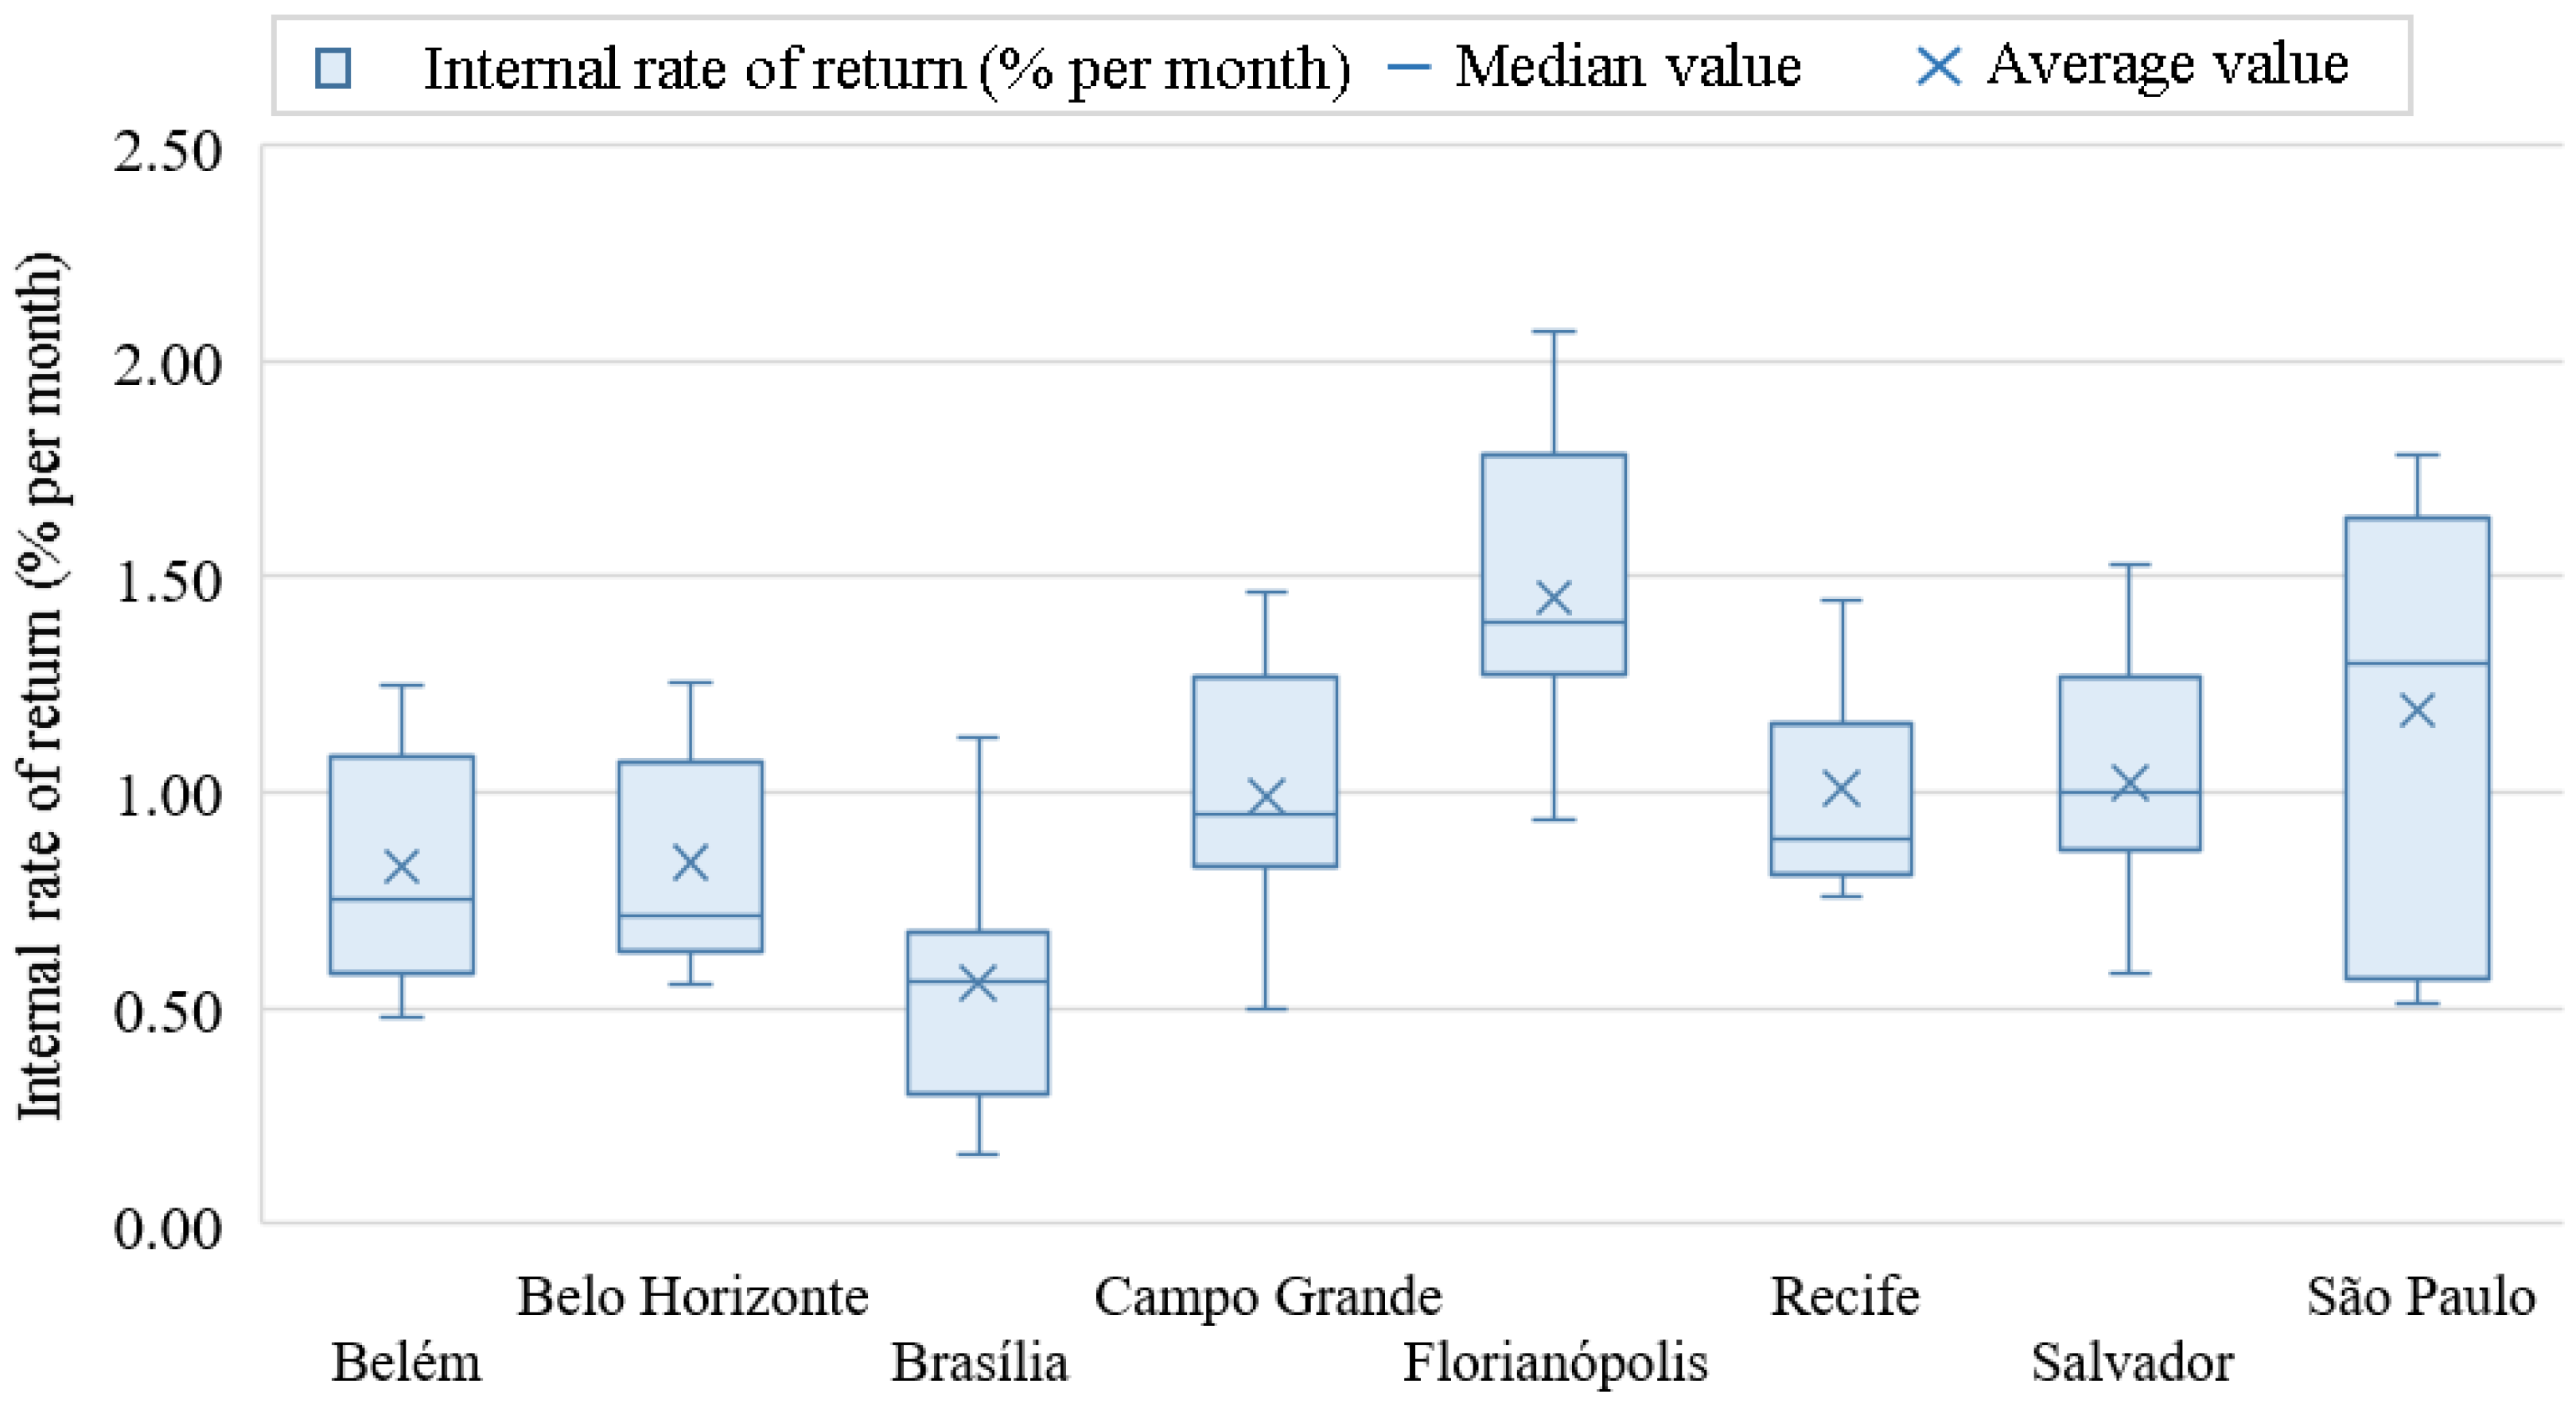
Figure 4, Figure 5 and Figure 6 show the financial feasibility indicators obtained for systems with indirect rainwater distribution.
Shorter paybacks can be expected as lower seasonality indexes are observed. The best financial feasibility of RWH systems was observed in Florianópolis. Abundant (1857 mm/year) and well-distributed (0.22) rainfall contribute to these results, in addition to water tariffs that benefit financial savings from using rainwater. Recife (2360 mm/year), Salvador (1754 mm/year) and Campo Grande (1479 mm/year) presented intermediate results. Despite being a drier location, Campo Grande obtained better financial feasibility due to the water tariff scheme adopted by the local water utility. Systems simulated in Brasília (1449 mm/year), Belo Horizonte (1486 mm/year) and Belém (2998 mm/year) had low financial feasibility indexes. Despite the high rainfall, the financial feasibility of RWH systems in Belém was hindered by its water tariff scheme. São Paulo (1658 mm/year) presented average results similar to those of Recife, Salvador and Campo Grande.
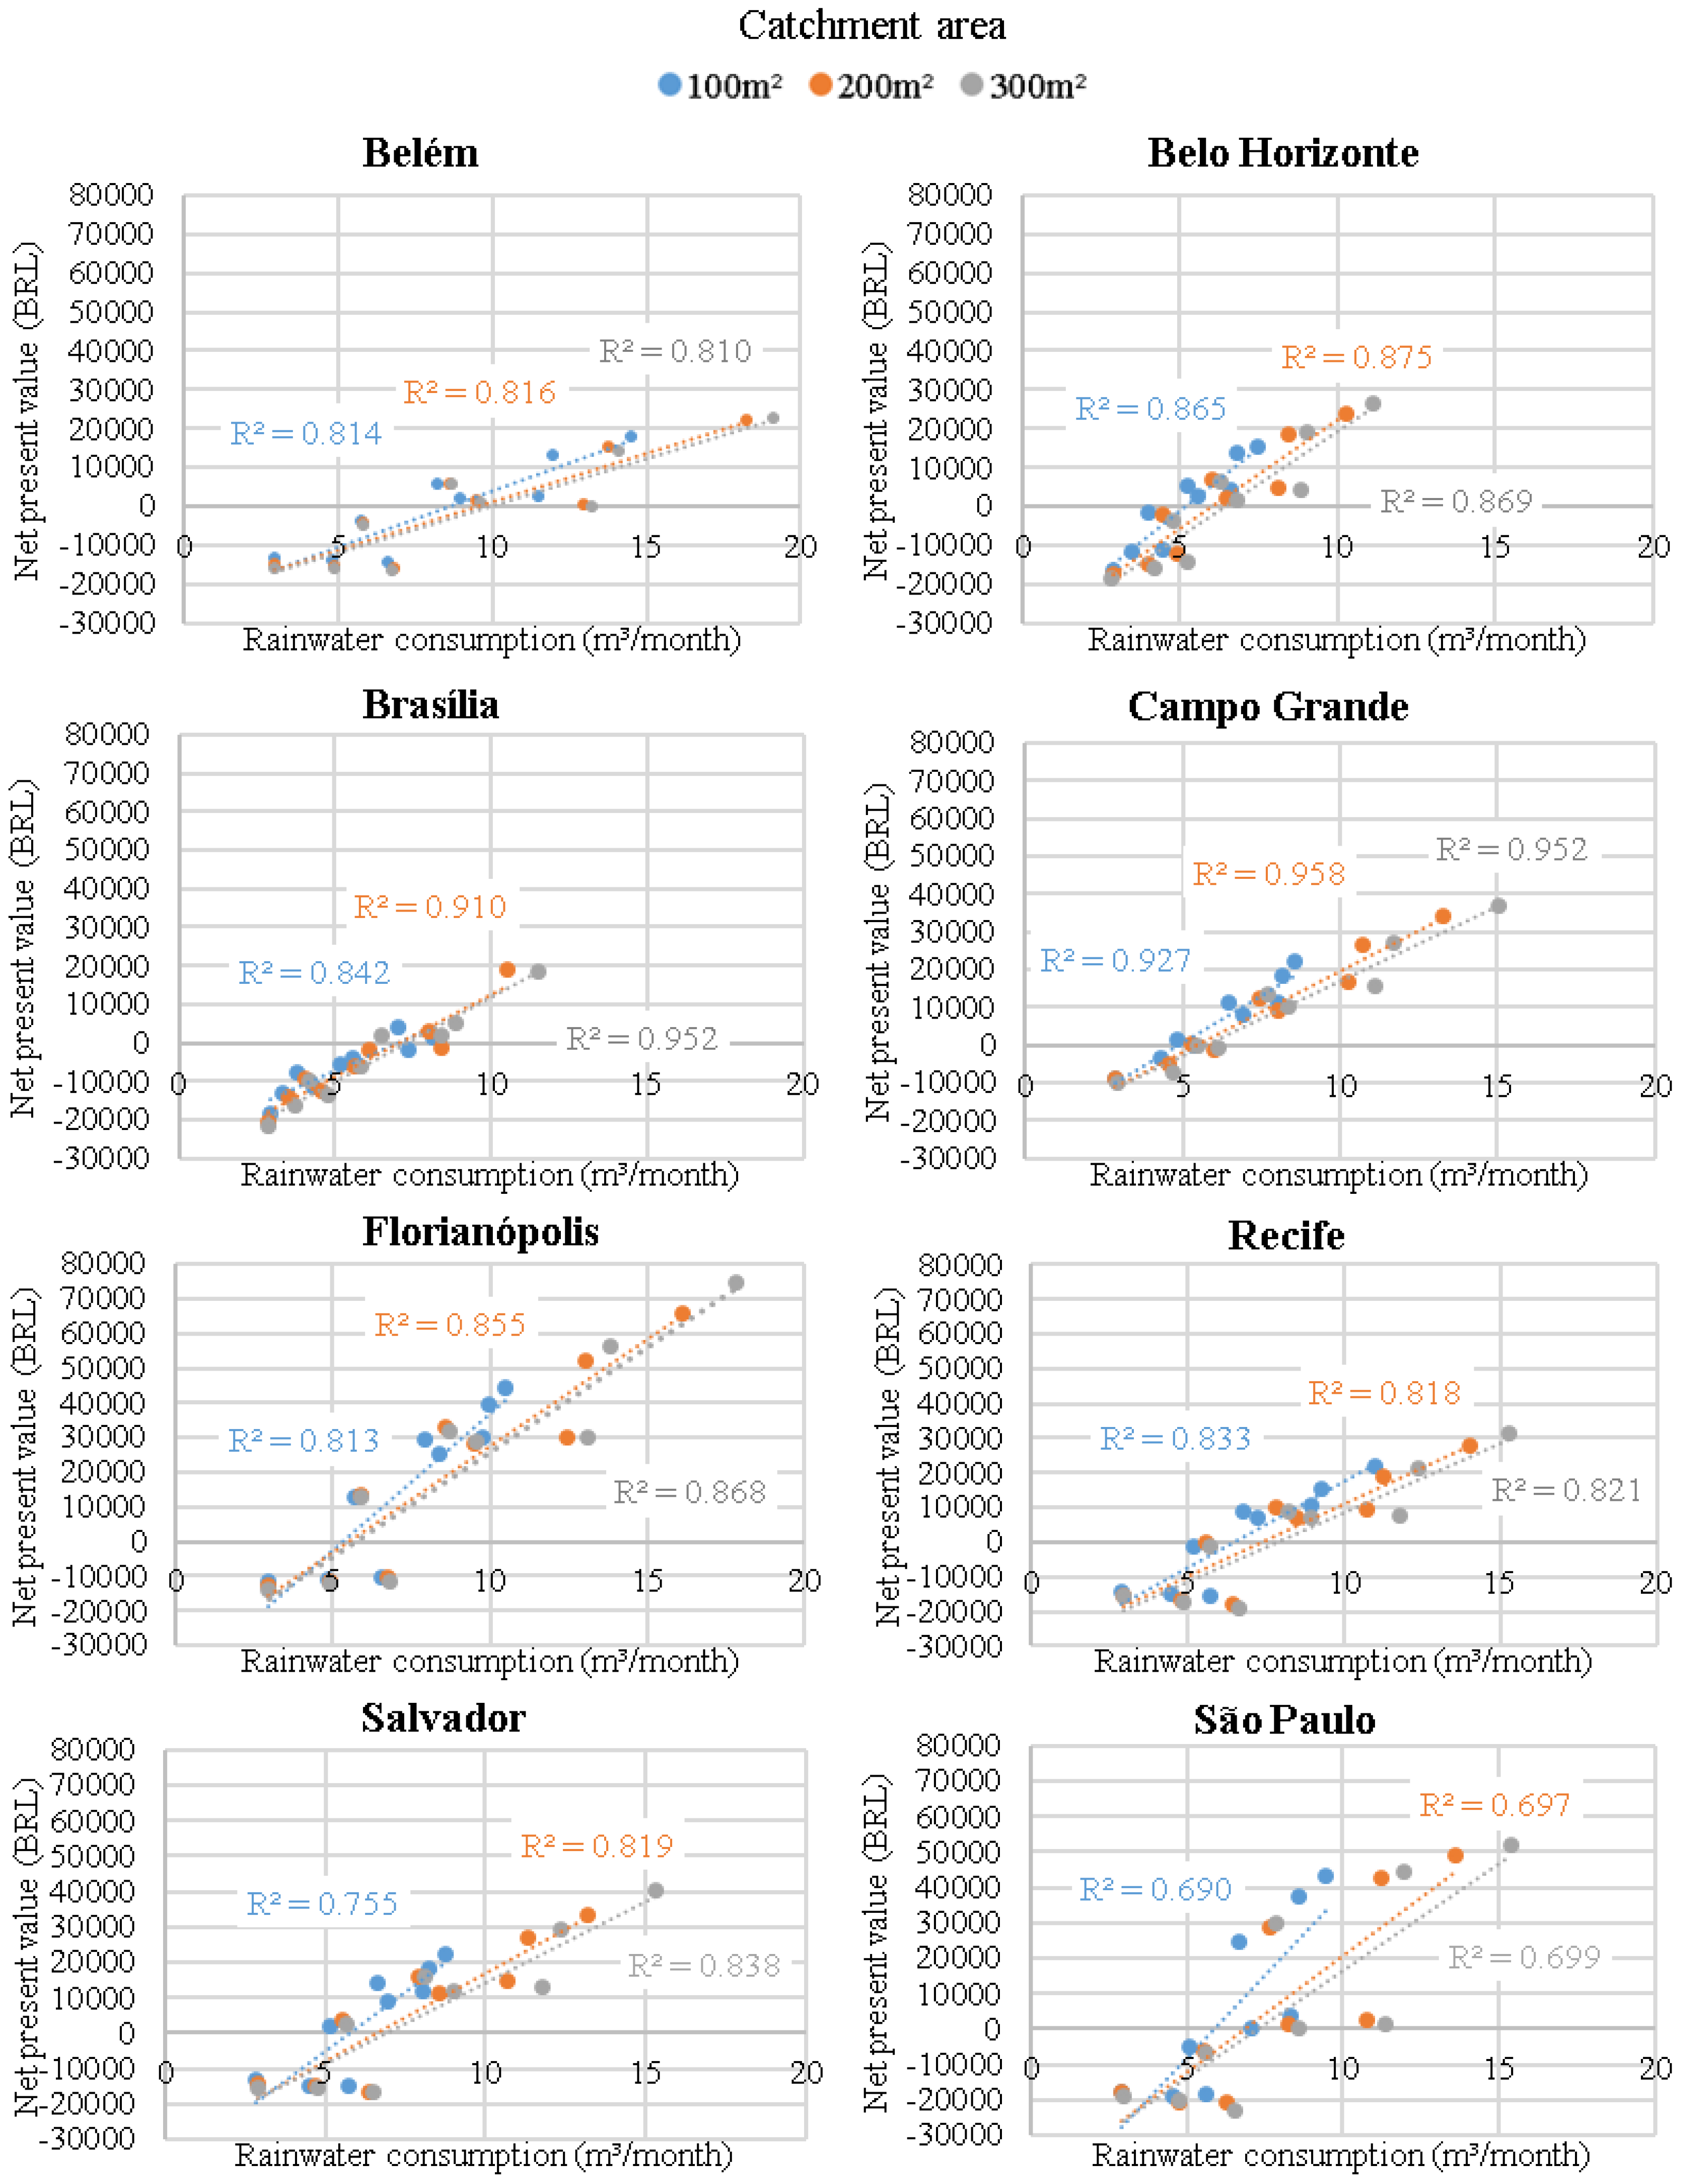
In every city, the net present value was correlated with the rainwater consumption, and Figure 7 shows such correlations for systems with indirect rainwater distribution. The graphs also show the minimum and maximum rainwater consumptions that the rainfall regime of each city was capable of supplying according to the design conventions adopted in this study.
The rainfall regime in Belém (2998 mm/year) supplied a maximum rainwater consumption of 14.5 m3/month of rainwater for systems with a catchment area of 100 m2, 18.2 m3/month for systems with a catchment area of 200 m2 and of 19.1 m3/month for systems with 300 m2 according to the design variables used in this simulation. Systems with indirect distribution of rainwater and rainwater consumption below 9 m3/month did not reach financial feasibility. No scenario with two inhabitants in the household was considered financially feasible, while all simulated scenarios with six inhabitants were considered feasible.
Rainfall in Belo Horizonte (1486 mm/year) provided significantly less rainwater than in Belém, with a maximum of 7.4 m3/month for systems with catchment areas of 100 m2, 10.3 m3/month for catchment areas of 200 m2 and 11.2 m3/month for catchment areas of 300 m2. Systems with a catchment area of 100 m2 showed financial feasibility with rainwater consumption above 5.6 m3/month. In systems with a catchment area of 200 m2 and 300 m2, feasibility was achieved with rainwater consumptions above 6.5 m3/month and 6.8 m3/month, respectively. Only systems with four or more inhabitants achieved financial feasibility.
For both rainwater distribution schemes, Brasília presented financial feasibility in only 30% of the scenarios. The low rainfall availability (1499 mm/year) and a water tariff scheme that does not favour financial savings due to the potable water savings contributed to this result. The maximum rainwater consumption in Brasília is similar to that of Belo Horizonte—between 8 m3/month and 12 m3/month in feasible systems, depending on the catchment area and other design variables.
Despite having similar rainfall availability to Brasília (1479 mm/year), the water tariff scheme practised in Campo Grande helped this city to achieve superior financial feasibility results. Conversely, even though the rainfall regime of Florianópolis (1857 mm/year) is not as high as in Belém, this city obtained very similar rainwater consumptions. The excellent annual rainfall uniformity explains this in Florianópolis (0.22).
Recife’s rainfall regime was able to supply a rainwater consumption similar to what was found for Campo Grande. In Recife, rainfall availability is higher (2360 mm/year), the periods without precipitation are shorter (average duration = 2.58 days), but rainfall is less evenly distributed throughout the year (S = 0.56). Like in Campo Grande, RWH systems in Recife were feasible in 67% of the scenarios with indirect rainwater distribution.
Salvador’s rainfall regime supplied rainwater consumption between 5.2 m3/month and 15.3 m3/month, as observed in Campo Grande, Recife and São Paulo. São Paulo and Salvador have relatively similar rainfall regimes based on the indicators used in this research. In this case, the difference in financial feasibility is related to the different potable water tariff schemes between the two cities. São Paulo also has the highest installation costs among the studied locations and operating costs among the highest.
It is interesting to highlight the relationship between the maximum rainwater consumption and the system’s catchment areas. Such a difference between systems with a catchment area of 200 m2 and 300 m2 varied only 1.4 m3/month compared to 3.9 m3/month obtained between 100 m2 and 200 m2. This means that increasing catchment areas from 200 m2 to 300 m2 does not imply an increase in rainwater availability in the same proportion as an increase from 100 m2 to 200 m2. The average maximum consumption of rainwater observed for all cities was 15.1 m3/month. Thus, the systems with a catchment area of 200 m2 could supply, on average, 90.5% of the rainwater consumption simulated in this research among the rainfall regimes studied. Complete financial feasibility results can be found in Tables S1–S16 in the Supplementary Materials.

3.4. Sensitivity Analysis

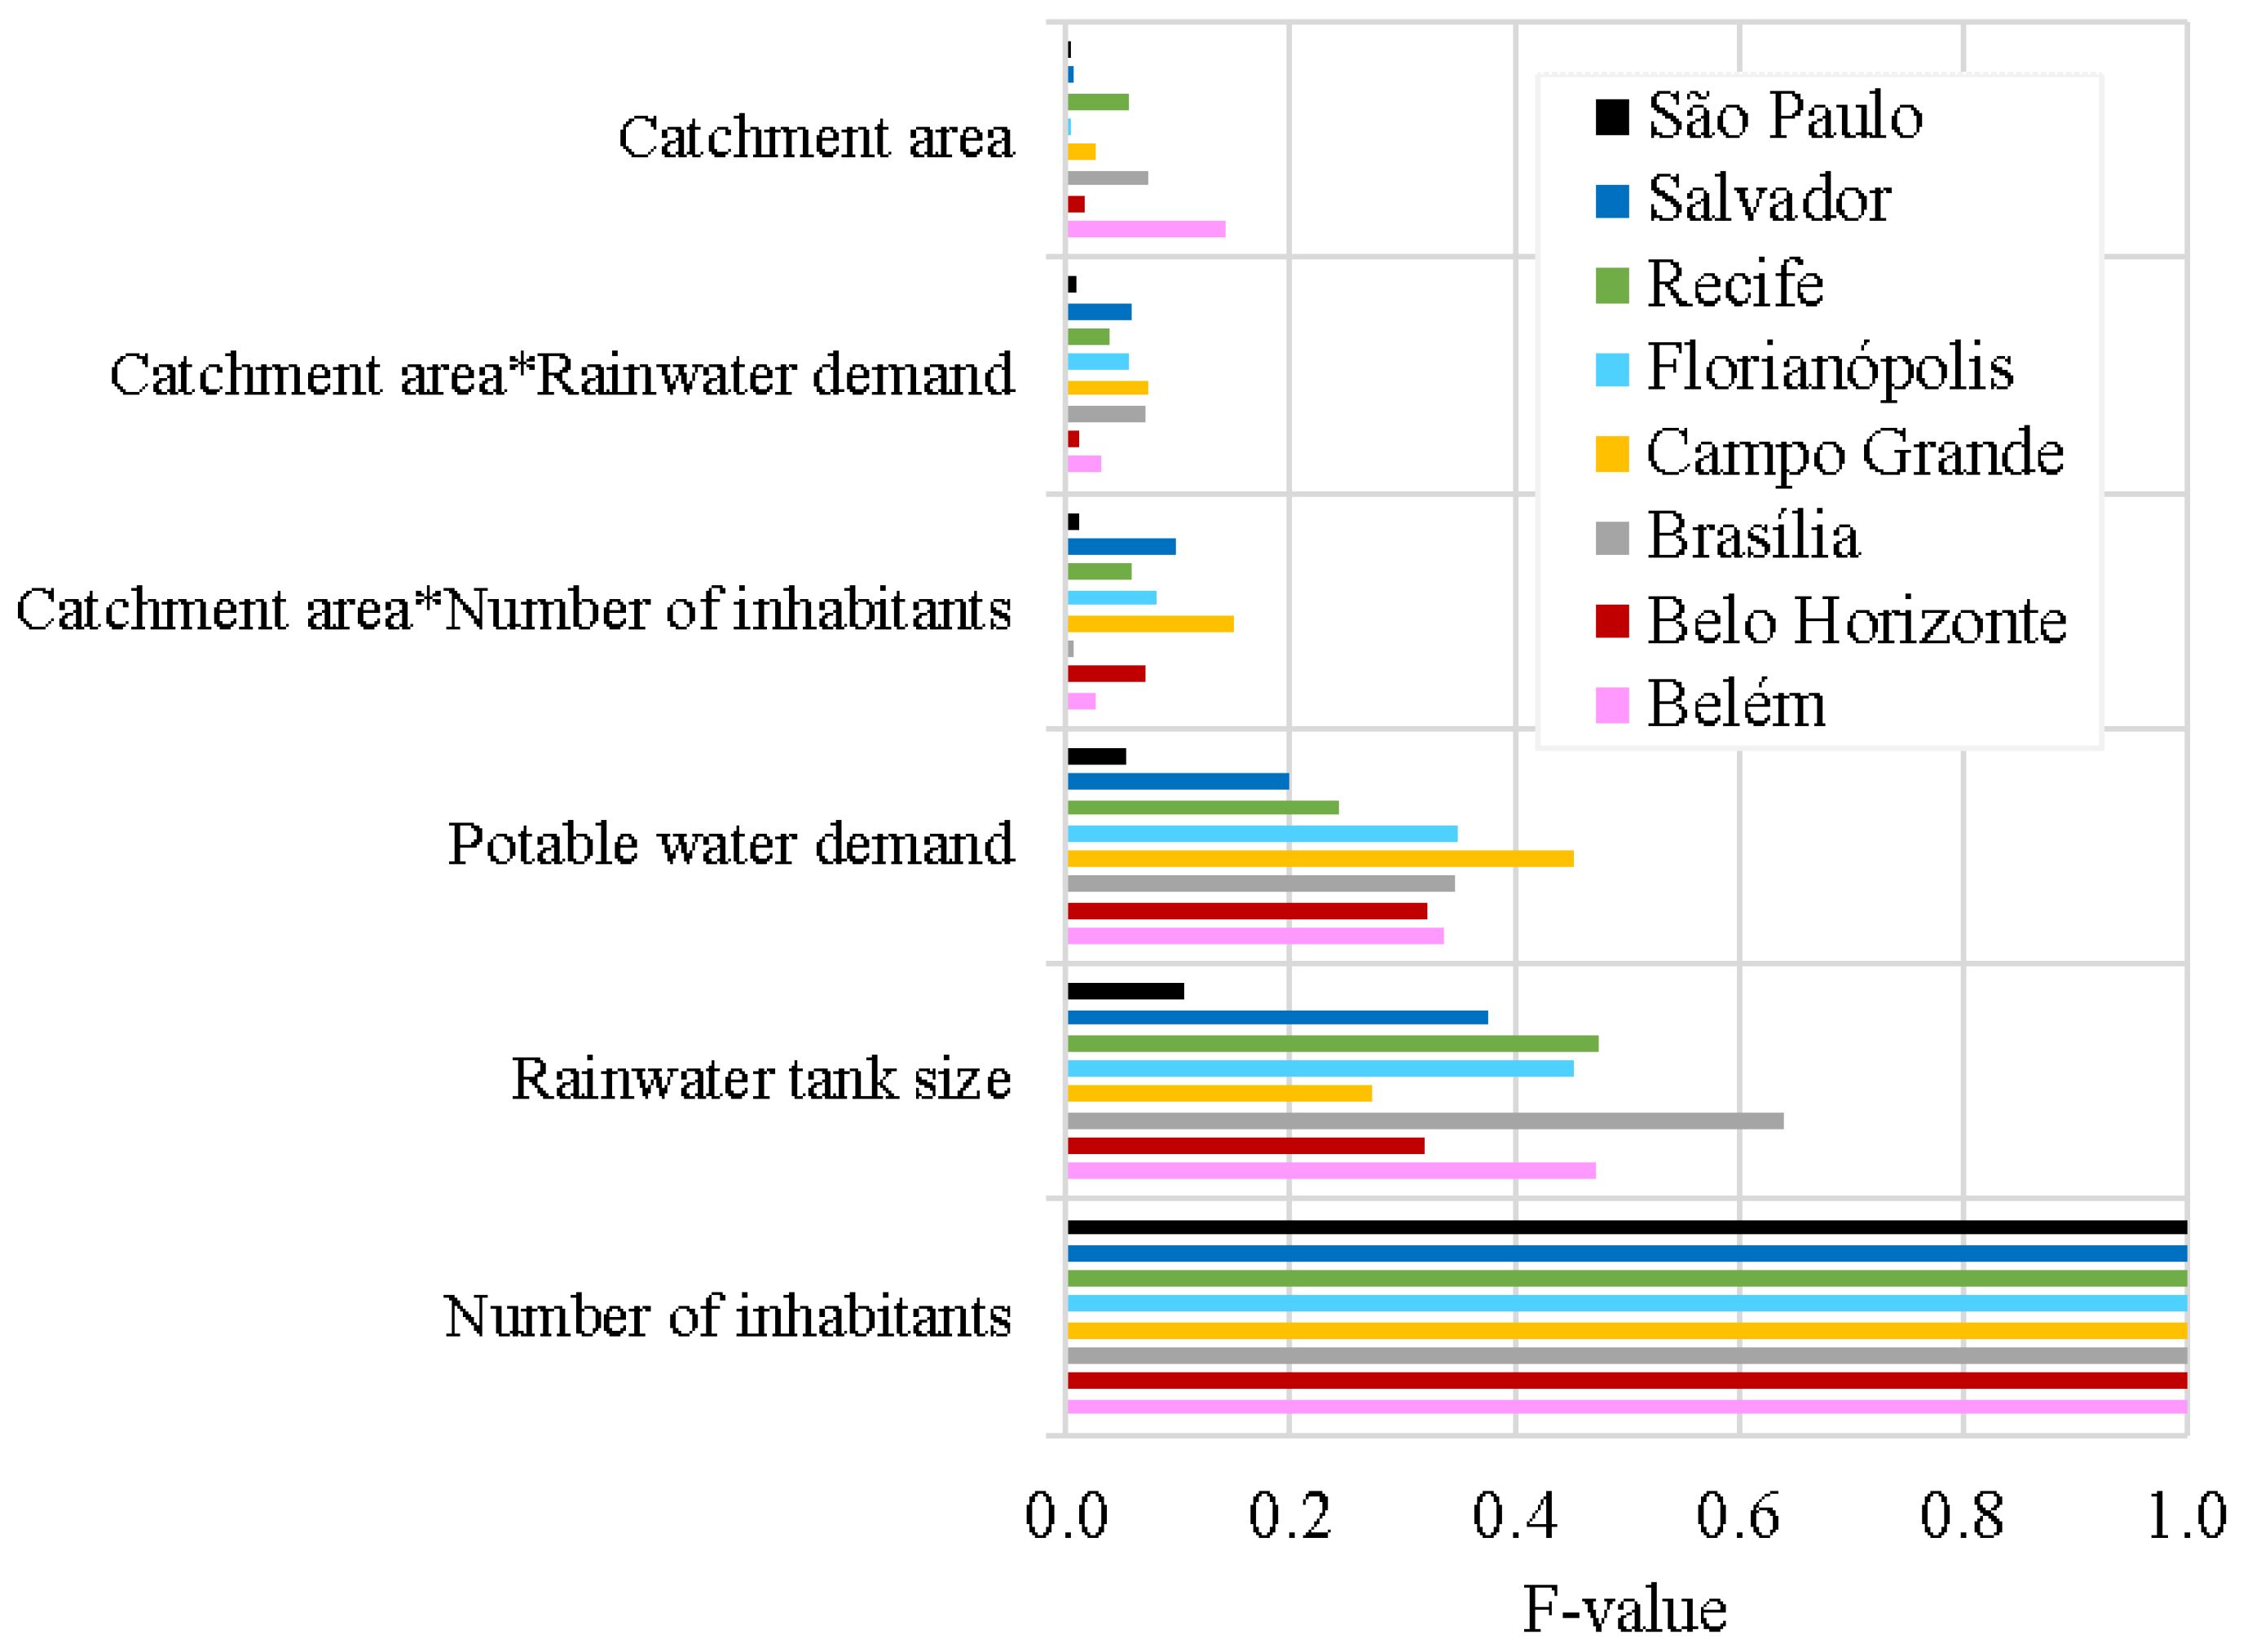
Figure 8 shows the influence of design variables on the net present value of the RWH systems in each of the cities evaluated in this study.
In Figure 8, F = 1 represents the design variable with the most influence on the net present value, whereas F = 0 represents the least influence. The number of inhabitants was the most influential design variable on the net present value. This variable directly impacts the rainwater consumption in the house and directly influences rainwater savings. This result is in agreement with other studies that, by employing other methods, established a direct relationship between rainwater demand and the financial feasibility of the RWH systems [9,12,17,18].
Despite being related to rainwater supply, the catchment area was the design variable that exerted the least influence on the net present value of residential RWH systems. This is because the catchment area is not directly linked to the generation of financial benefit throughout the RWH system’s lifespan.
In Brasília, the rainwater tank size significantly influenced the net present value more than observed in the other cities. This is related to the presence of long periods without precipitation in the rainfall regime of this location (maximum duration of 128 days and seasonality equal to 0.74), which requires the installation of larger rainwater tanks and results in a lower potential for potable water savings.
As shown in Section 3.3, RWH systems in São Paulo are more susceptible to design variables because they present a significant difference between the best and worst feasibility results. In São Paulo, the number of inhabitants resulted in F-values much greater than that observed for other variables. Therefore, potable water demand is of great importance in establishing financially feasible systems in this location.

3.5. Correlation Analysis

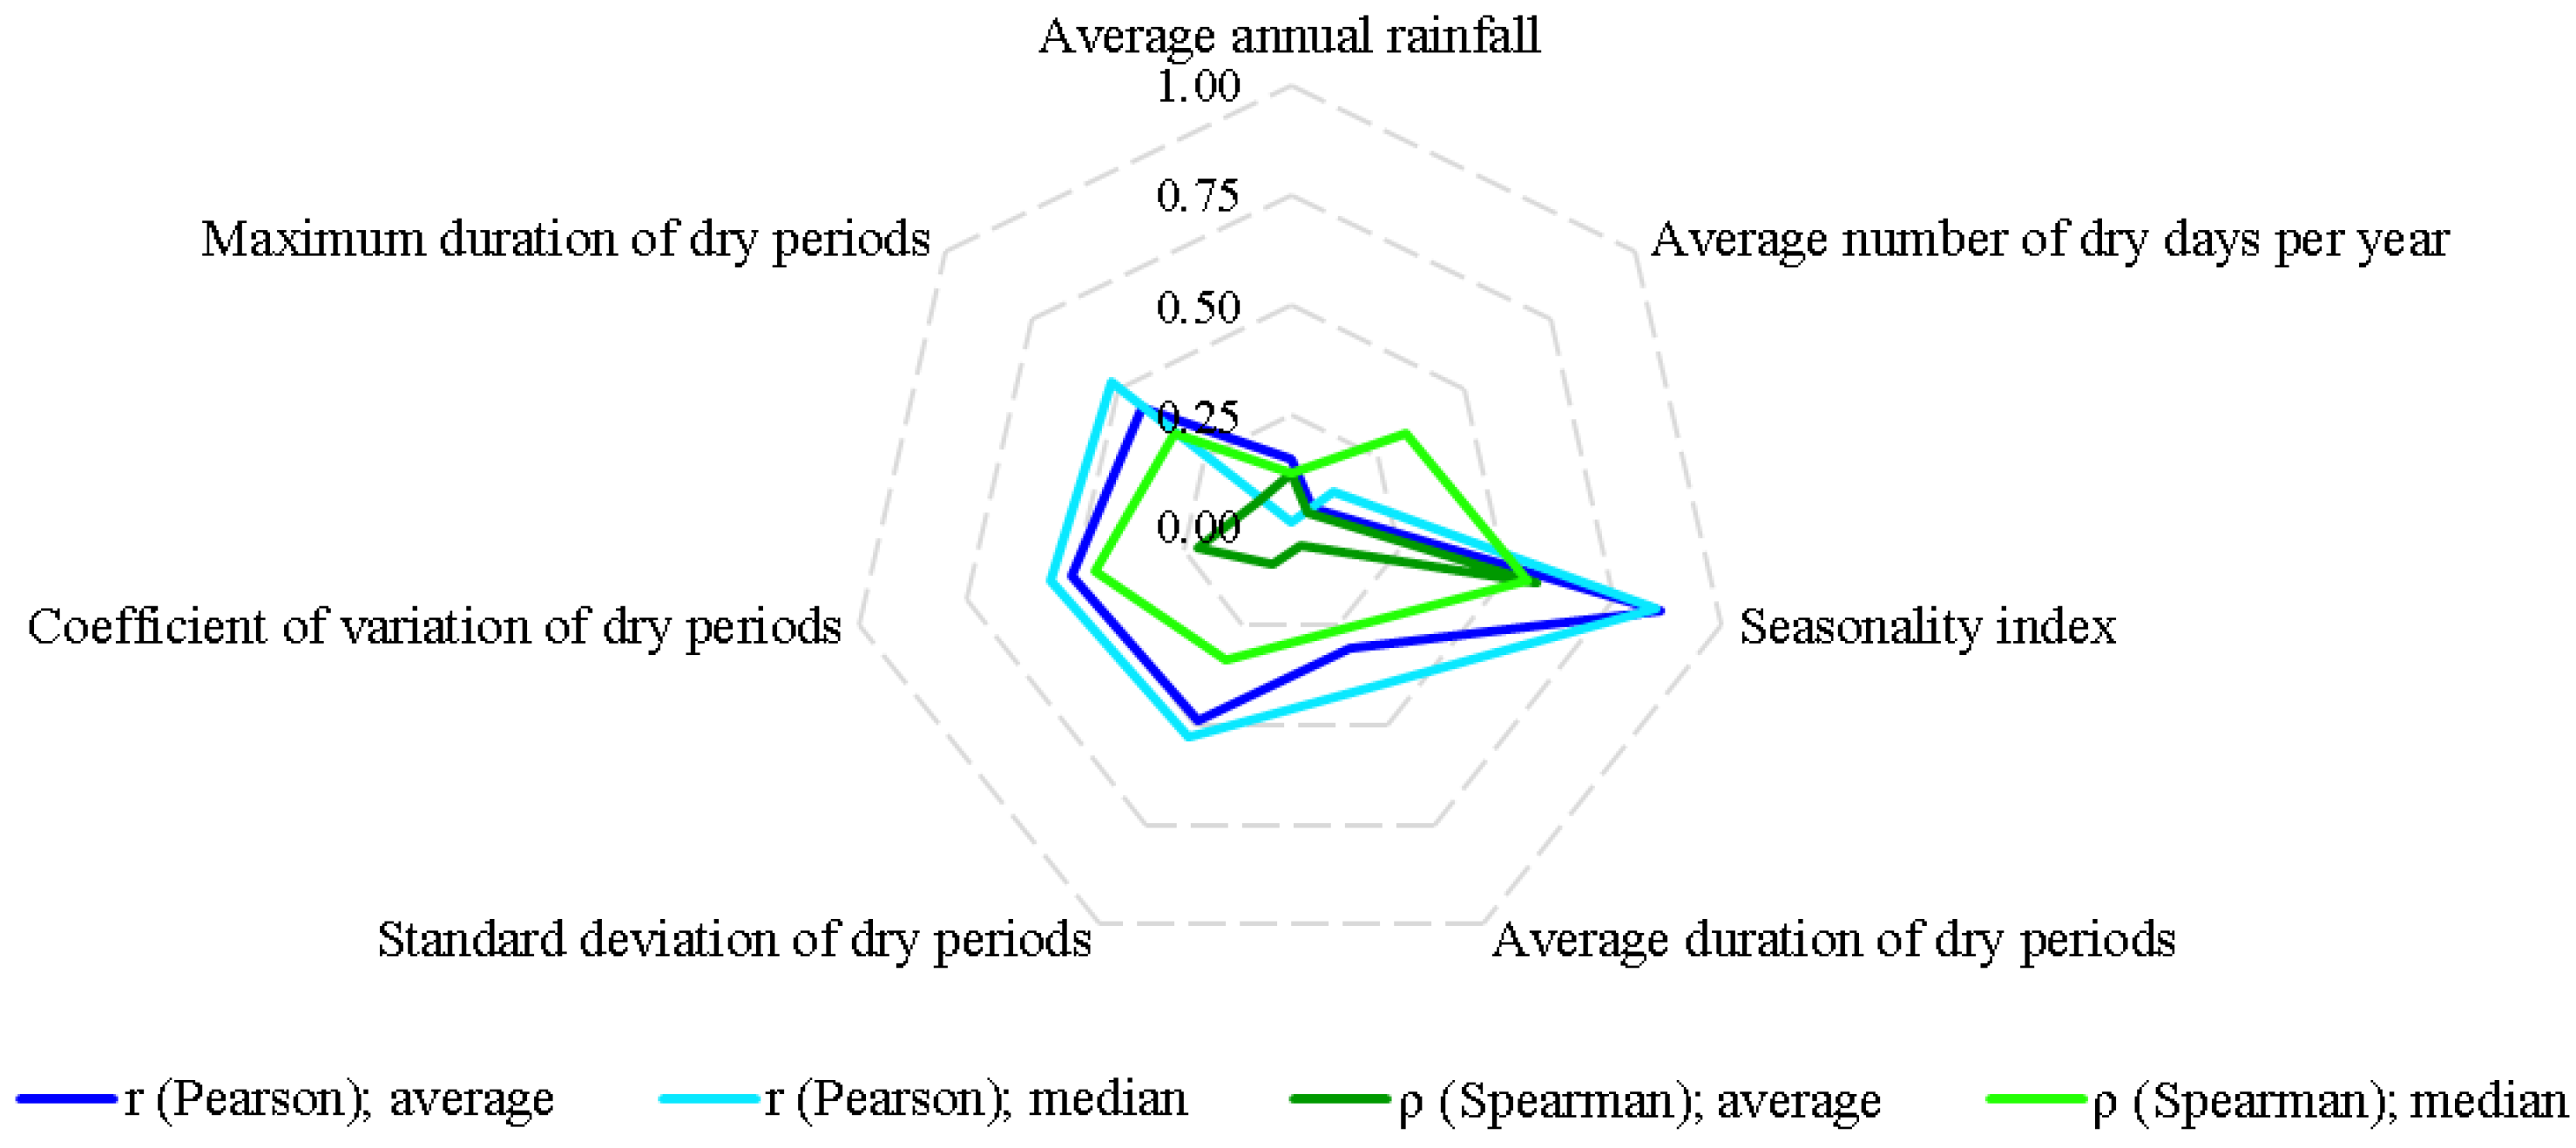
Figure 9 shows the coefficients of correlation between the rainfall indicators and the net present values obtained for residential RWH systems in eight Brazilian cities. All coefficients of correlation can be found in Table S17 in the Supplementary Materials.
The seasonality index was the rainfall indicator that presented the highest correlation with the net present value of RWH systems, thus linking the financial feasibility of these systems with the uniformity of rainwater distribution throughout the year. Geraldi and Ghisi [40] also pointed out that the rainfall distribution within the year should be incorporated in future works about RWH design, given its important influence in simulation outcomes. 
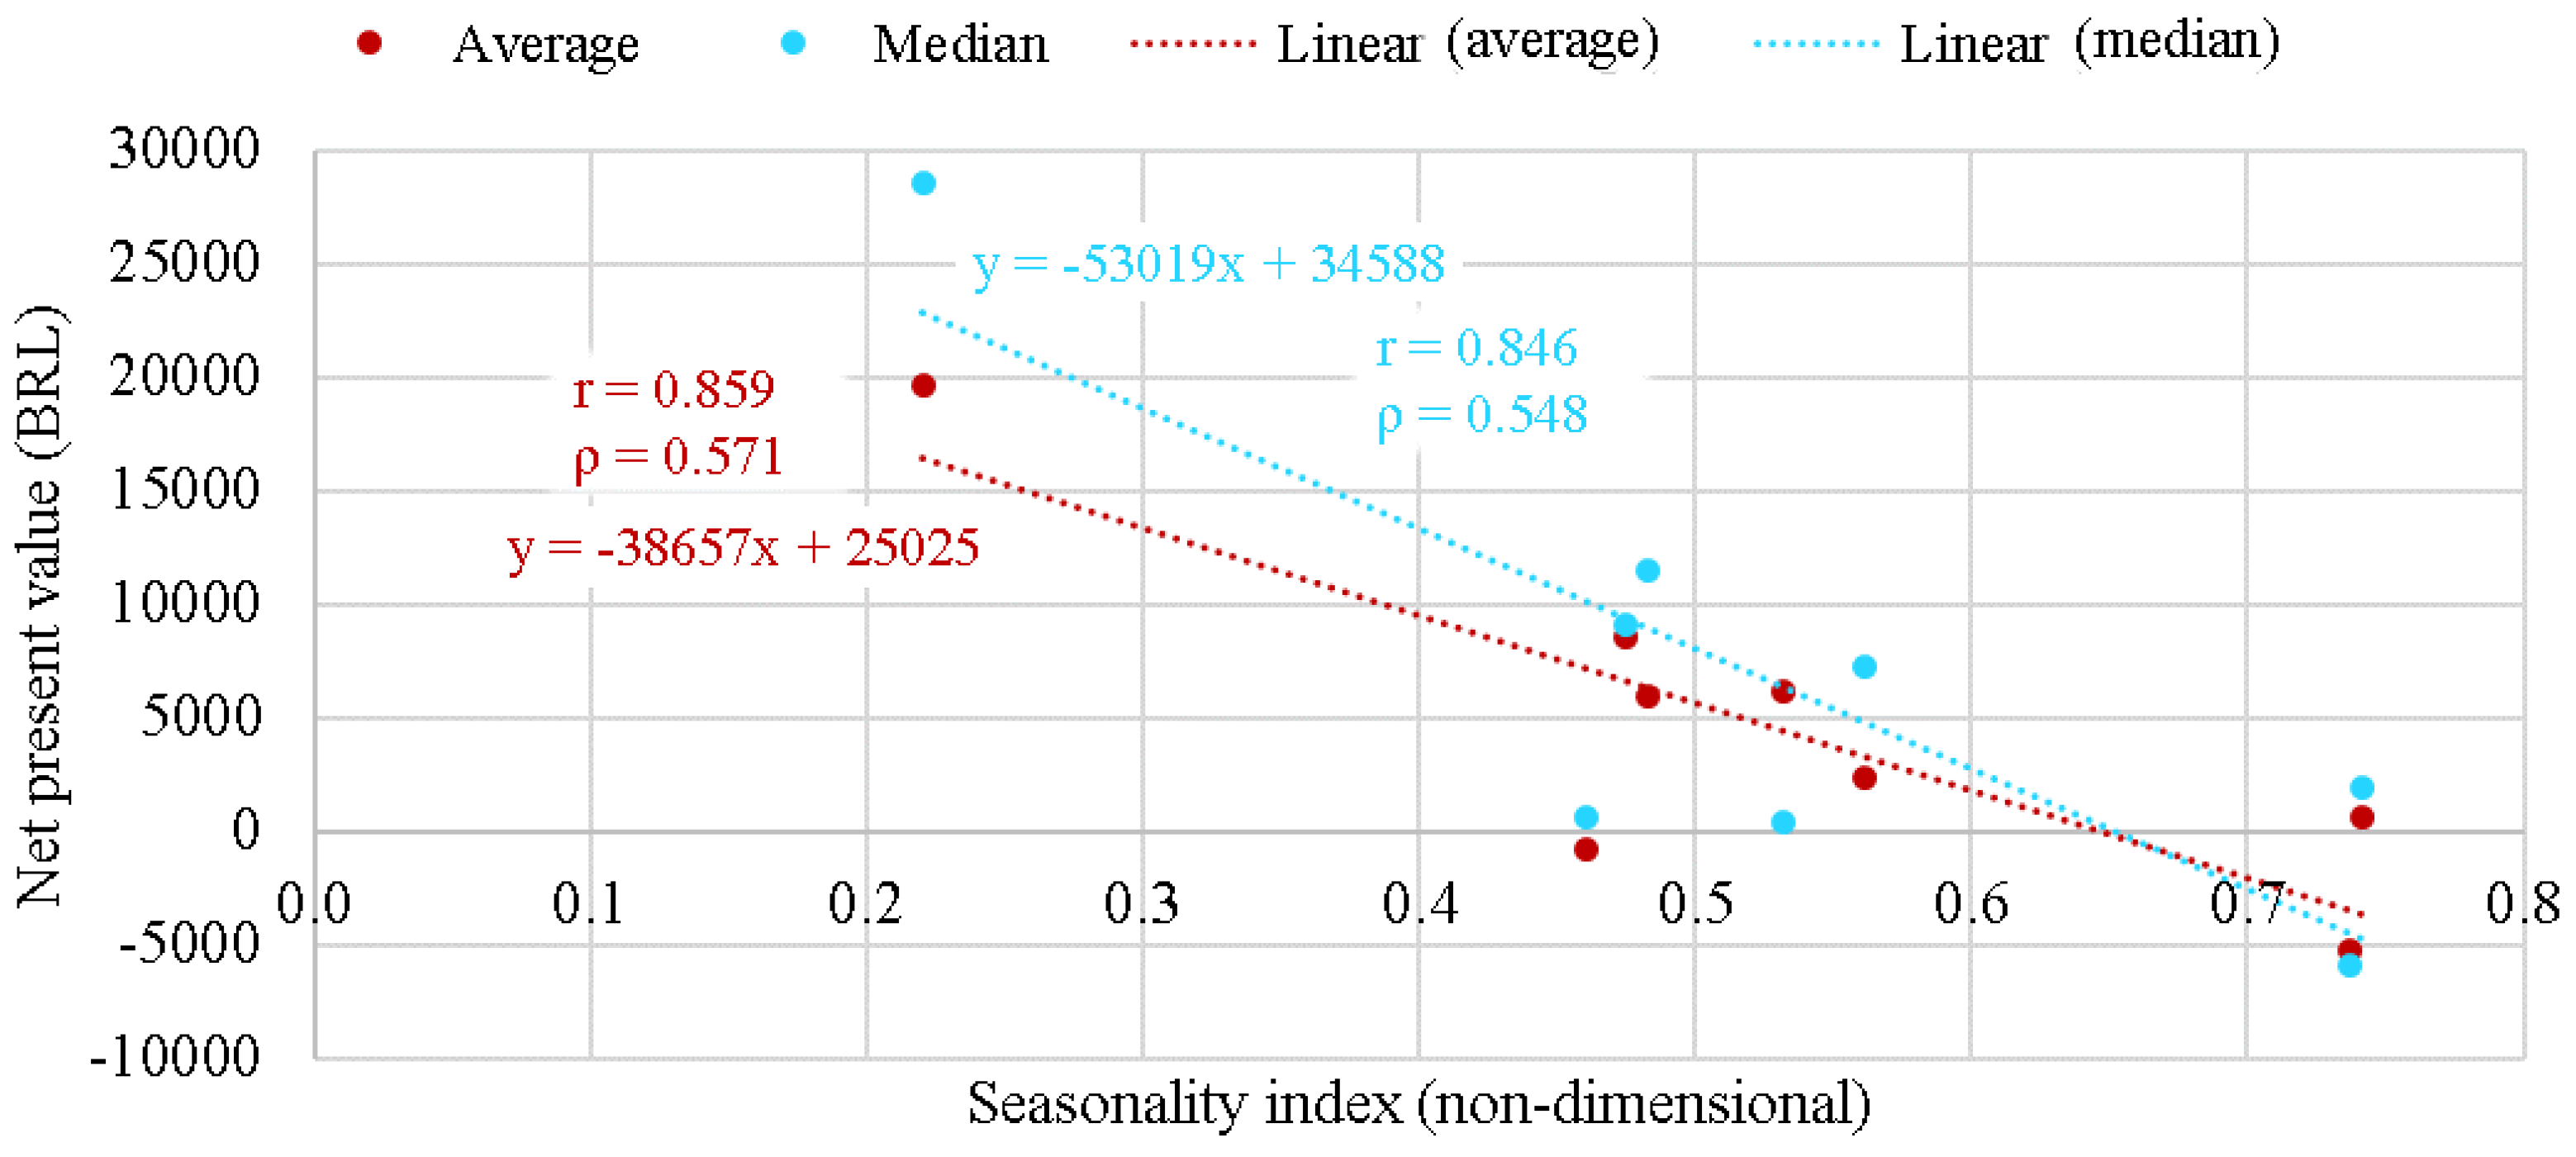
Figure 10 shows the correlation between the seasonality index and the net present value.
Considering that the initial outlays and operational costs of the systems presented coefficients of variation of 24% and 40%, variations extrinsic to the interactions between rainfall and financial feasibility are present in this analysis. In this sense, more direct correlations between rainfall indicators and financial feasibility could be obtained if the financial analysis used the same costs in all cities.
The analysis performed by Geraldi and Ghisi [28] showed that the average number of dry days per year had major relevance for short-term instead of long-term time series representativeness for RWH systems design. In this sense, the maximum duration, variation coefficient, and standard deviation of the periods without precipitation correlated better with the net present value than those observed for the average annual rainfall. Results corresponding to other rainfall indicators can be found in Figures S2–S7 in the Supplementary Materials.

4. Conclusions

This study investigated the conditions and compared the financial feasibility of residential RWH systems in eight Brazilian cities. For this, a comprehensible outlay procedure was performed using local-specific costs and tariffs. The study was based on an equivalent RWH system design among all scenarios with two design configurations (direct and indirect rainwater distribution). Rainfall time series indicators were correlated with the financial feasibility of the systems, and sensitivity analysis was used to point the most significant design variables.
The selected cities presented financial feasibility indexes between 30% and 70% of the simulated scenarios, thus presenting a diverse panorama for Brazilian RWH systems. In Florianópolis, the systems presented the best financial feasibility, thus pointing at this city as one of the most favourable cities for financially feasible RWH systems. Recife, Salvador, São Paulo and Campo Grande presented intermediate feasibility results. Correspondingly, the seasonality index was the rainfall indicator that presented the highest correlation with the net present value of the RWH systems, which are clearly benefitted from more uniform rainwater distributions throughout the year.
Despite being drier than most other locations studied, Campo Grande obtained better financial feasibility due to the water tariff scheme adopted by the local water utility. Belém, on the other hand, was negatively influenced by potable water pricing policy. RWH systems in Belém, Brasília, Belo Horizonte yielded the lowest financial feasibility rates. Despite a significant influence of potable water tariff schemes on the financial feasibility of RWH systems was identified, this was not evaluated quantitatively. In this sense, obtaining this correlation would allow comparing this influence with other design variables and rainfall characteristics.
Considering all rainfall patterns studied, RWH systems with a catchment area of 200 m2 were able to supply, on average, 90.5% of the rainwater consumption. In this sense, it can be said that catchment areas above 200 m2 tend to be unnecessary for dwellings of up to six inhabitants in Brazil.
On average, systems with direct rainwater distribution presented initial outlays 1.4% lower than systems with indirect rainwater distribution. In such cases, the higher cost of the pressurising equipment is equivalent to the savings obtained by not using the upper rainwater tank and the necessary complements for its operation. In this sense, it would be interesting to consider solutions that result in initial investment costs that are more different from each other to assess the impact of this difference on the financial feasibility of the systems more comprehensively. In this study, the direct rainwater distribution scheme positively influenced the financial feasibility indexes in four of the eight cities.
The average initial costs of indirect RWH systems varied between BRL 10,999.18 and BRL 18,061.37, depending on the catchment area and tank size. The greater the tank capacity used in the system, the greater its cost relative to the total investment. Among the eight cities, the average operating costs for systems with indirect rainwater distribution varied between BRL 4.31/month and BRL 5.32/month. On average, systems with direct rainwater distribution presented operating costs 3.08% lower than systems with indirect rainwater distribution.
A low correlation was observed between the rainfall indicators and the net present value of the systems. This result is also related to the presence of extrinsic factors in the interactions between rainfall and the financial feasibility of RWH systems. Initial investment costs of RWH systems resulted in a coefficient of variation of 24% among all cities and simulated scenarios. Similarly, operational costs presented a coefficient of variation of 40%. This variation is due to differences in the initial outlays of the systems and the different water and energy pricing schemes practised locally. In this sense, a new financial analysis is suggested by considering a common cost base among the cities evaluated. Thus, more relevant correlations can be obtained between rainfall characteristics and the financial feasibility of generic RWH systems.
Sensitivity analysis pointed to the number of inhabitants as the most influential variable on the financial feasibility of RWH systems. This variable is directly related to the rainwater consumption in the building, often associated to the feasibility of RWH systems in the literature.
The results obtained in this study provide reliable information regarding the costs of installing and operating RWH systems in Brazil. Moreover, the selection of eight representative cities allows direct comparisons, thus covering an important knowledge gap in the field. Considering the relevance of financial feasibility to promote the adoption of RWH systems at a broader scale, the information generated herein can contribute to the elaboration of more assertive public policies and incentive schemes. Finally, the novel approach of evaluating the influence of rainfall indicators over the financial feasibility of RWH systems produced additional insight on which conditions should be verified in the design stage when aiming towards more efficient RWH.

Supplementary Materials

The following supporting information can be downloaded at: https://www.mdpi.com/article/10.3390/w15061112/s1, Figure S1: Water tariff scheme practiced in each city by the local water utility; Figure S2: Correlation between the average annual rainfall and the average and median net present value of the RWH systems; Figure S3: Correlation between the average number of dry days per year and the average and median net present value of the RWH systems; Figure S4: Correlation between the average duration of dry periods and the average and median net present value of the RWH systems; Figure S5: Correlation between the standard deviation of dry periods and the average and median net present value of the RWH systems; Figure S6: Correlation between the coefficient of variation of dry periods and the average and median net present value of the RWH systems; Figure S7: Correlation between the maximum duration of dry periods and the average and median net present value of the RWH systems; Table S1: Financial analysis results for RWH systems with indirect distribution in Belém; Table S2: Financial analysis results for RWH systems with direct distribution in Belém; Table S3: Financial analysis results for RWH systems with indirect distribution in Belo Horizonte; Table S4: Financial analysis results for RWH systems with direct distribution in Belo Horizonte; Table S5: Financial analysis results for RWH systems with indirect distribution in Brasília; Table S6: Financial analysis results for RWH systems with direct distribution in Brasília; Table S7: Financial analysis results for RWH systems with indirect distribution in Campo Grande; Table S8: Financial analysis results for RWH systems with direct distribution in Campo Grande; Table S9: Financial analysis results for RWH systems with indirect distribution in Florianópolis; Table S10: Financial analysis results for RWH systems with direct distribution in Florianópolis; Table S11: Financial analysis results for RWH systems with indirect distribution in Recife; Table S12: Financial analysis results for RWH systems with direct distribution in Recife; Table S13: Financial analysis results for RWH systems with indirect distribution in Salvador; Table S14: Financial analysis results for RWH systems with direct distribution in Salvador; Table S15: Financial analysis results for RWH systems with indirect distribution in São Paulo; Table S16: Financial analysis results for RWH systems with direct distribution in São Paulo; Table S17: Correlation between rainfall indicators and the average and median net present value obtained in the financial analysis.

Author Contributions

Conceptualisation, R.N.I. and E.G.; methodology, R.N.I. and E.G.; software, E.G.; validation, R.N.I. and E.G.; formal analysis, R.N.I.; investigation, R.N.I.; resources, R.N.I.; data curation, R.N.I.; writing—original draft preparation, R.N.I.; writing—review and editing, R.N.I. and E.G.; visualisation, R.N.I. and E.G.; supervision, E.G.; project administration, R.N.I. and E.G. All authors have read and agreed to the published version of the manuscript.

Funding

This research received no external funding.

Data Availability Statement

Not applicable.

Acknowledgments

The authors would like to thank CAPES—“Fundação Coordenação de Aperfeiçoamento de Pessoal de Nível Superior”, the Brazilian governmental agency that enabled the development of this research.

Conflicts of Interest

The authors declare no conflict of interest.

References

  1. WWAP—World Water Assessment Programme. The United Nations World Water Development Report 2019: Leaving no One Behind; United Nations Educational, Scientific and Cultural Organization: Paris, France, 2019; p. 201. Available online: https://unesdoc.unesco.org/ark:/48223/pf0000367306 (accessed on 5 February 2020). (In Portuguese)
  2. Distefano, T.; Kelly, S. Are we in deep water? Water scarcity and its limits to economic growth. Ecol. Econ. 2017, 142, 130–147. [Google Scholar] [CrossRef]
  3. Ghisi, E. Potential for potable water savings by using rainwater in the residential sector of Brazil. Build. Environ. 2006, 41, 1544–1550. [Google Scholar] [CrossRef]
  4. UNEP—United Nations Environment Programme. Global Environment Outlook 3: Past, Presente and Future Perspectives; Earthscan Publications Ltd.: London, UK, 2002; 466p. [Google Scholar]
  5. Cáceres, P.S.; Ramos, S.R.; Sant’ana, D.R. Potencial de redução da exploração dos recursos hídricos locais pelo aproveitamento de água pluvial em residências no Distrito Federal. Paranoá Cad. Arquitetura Urban. 2019, 23, 11–19. (In Portuguese) [Google Scholar] [CrossRef]
  6. Campisano, A.; Butler, D.; Ward, S.; Burns, M.J.; Friedler, E.; Debusk, K.; Fisher-Jeffes, L.N.; Ghisi, E.; Rahman, A.; Furumai, H.; et al. Urban rainwater harvesting systems: Research, implementation and future perspectives. Water Res. 2017, 115, 195–209. [Google Scholar] [CrossRef]
  7. Teston, A.; Geraldi, M.; Colasio, B.M.; Ghisi, E. rainwater harvesting in buildings in Brazil: A literature review. Water 2018, 10, 471. [Google Scholar] [CrossRef] [Green Version]
  8. DTU—Development Technology Unit. Recommendations for Designing Rainwater Harvesting System Tanks; O-DEV Contract No. ERB IC18 CT98 027 Milestone A6: Report A4; School of Engineering, University of Warwick: Coventry, UK, 2001. [Google Scholar]
  9. Severis, R.M.; Silva, F.A.; Wahrlich, J.; Skoronski, E. Economic analysis and risk-based assessment of the financial losses of domestic rainwater harvesting systems. Resour. Conserv. Recycl. 2019, 146, 206–217. [Google Scholar] [CrossRef]
  10. Vieira, A.S.; Beal, C.D.; Ghisi, E.; Stewart, R.A. Energy intensity of rainwater harvesting systems: A review. Renew. Sust. Energ. Rev. 2014, 34, 225–242. [Google Scholar] [CrossRef] [Green Version]
  11. Imteaz, M.A.; Bayatvarkeshi, M.; Karim, M.R. Developing generalised equation for the calculation of payback period for rainwater harvesting systems. Sustainability 2021, 13, 4266. [Google Scholar] [CrossRef]
  12. Gómez, Y.D.; Teixeira, L.G. Residential rainwater harvesting: Effects of incentive policies and water consumption over economic feasibility. Resour. Conserv. Recycl. 2017, 127, 56–67. [Google Scholar] [CrossRef]
  13. Amos, C.C.; Rahman, A.; Gathenya, J.M. Economic analysis and feasibility of rainwater harvesting systems in urban and peri-urban environments: A review of the global situation with a special focus on Australia and Kenya. Water 2016, 8, 149. [Google Scholar] [CrossRef]
  14. Ward, S.; Memon, F.A.; Butler, D. Performance of a large building rainwater harvesting system. Water Res. 2012, 46, 5127–5134. [Google Scholar] [CrossRef] [PubMed]
  15. Li, Z.; Boyle, F.; Reynolds, A. Rainwater harvesting and greywater treatment systems for domestic application in Ireland. Desalination 2010, 260, 1–8. [Google Scholar] [CrossRef] [Green Version]
  16. Istchuk, R.N.; Ghisi, E. Financial Feasibility Analysis of Residential Rainwater Harvesting in Maringá, Brazil. Sustainability 2022, 14, 12859. [Google Scholar] [CrossRef]
  17. Ghisi, E.; Schondermark, P.N. Investment feasibility analysis of rainwater use in residences. Water Resour. Manag. 2013, 27, 2555–2576. [Google Scholar] [CrossRef]
  18. Berwanger, H.; Ghisi, E. Investment feasibility analysis of rainwater harvesting in the city of Itapiranga, Brazil. Int. J. Sustain. Hum. Dev. 2014, 2, 104–114. [Google Scholar]
  19. Liang, X.; Van Dijk, M.P. Economic and financial analysis on rainwater harvesting for agricultural irrigation in the rural areas of Beijing. Resour. Conserv. Recycl. 2011, 55, 1100–1108. [Google Scholar] [CrossRef]
  20. Cureau, R.J.; Ghisi, E. Electricity savings by reducing water consumption in a whole city: A case study in Joinville, Southern Brazil. J. Clean. Prod. 2020, 261, 121194. [Google Scholar] [CrossRef]
  21. ABNT—Associação Brasileira de Normas Técnicas. NBR 15527: Aproveitamento de Água de Chuva de Coberturas Para Fins Não Potáveis—Requisitos; 2019; 10p. (In Portuguese) [Google Scholar]
  22. Heiselberg, P.; Brohus, H.; Hesselholt, A.; Rasmussen, H.; Seinre, E.; Thomas, S. Application of sensitivity analysis in design of sustainable buildings. Renew. Energy 2009, 34, 2030–2036. [Google Scholar] [CrossRef] [Green Version]
  23. Mun, J.S.; Han, M.Y. Design and operational parameters of a rooftop rainwater harvesting system: Definition, sensitivity and verification. J. Environ. Manag. 2012, 93, 147–153. [Google Scholar] [CrossRef]
  24. Silva, A.S.; Ghisi, E. Uncertainty analysis of daily potable water demand on the performance evaluation of rainwater harvesting systems in residential buildings. J. Environ. Manag. 2016, 180, 82–93. [Google Scholar] [CrossRef]
  25. Saltelli, A.; Marivoet, J. Non-parametric statistics in sensitivity analysis for model output: A comparison of selected techniques. Reliab. Eng. Syst. Saf. 1990, 28, 229–253. [Google Scholar] [CrossRef]
  26. Jin, Y.; Lee, S.; Kang, T.; Park, J.; Kim, Y. Capacity Optimization of Rainwater Harvesting Systems Based on a Cost–Benefit Analysis: A Financial Support Program Review and Parametric Sensitivity Analysis. Water 2023, 15, 186. [Google Scholar] [CrossRef]
  27. Pacheco, G.C.R.; Alves, C.M.A.; França, G.S. Impacto do regime pluviométrico na eficiência e na viabilidade econômica de sistemas de aproveitamento de água pluvial. In Proceedings of the XXIV SBRH—Simpósio Brasileiro de Recursos Hídricos, Belo Horizonte, Brazil, 21–26 November 2021. (In Portuguese). [Google Scholar]
  28. Geraldi, M.S.; Ghisi, E. Short-term instead of long-term rainfall time series in rainwater harvesting simulation in houses: An assessment using Bayesian Network. Resour. Conserv. Recycl. 2019, 144, 1–12. [Google Scholar] [CrossRef]
  29. Marlow, D.R.; Moglia, M.; Cook, S.; Beale, D.J. Towards sustainable urban water management: A critical reassessment. Water Res. 2013, 47, 7150–7161. [Google Scholar] [CrossRef]
  30. Steffen, J.; Jensen, M.; Pomeruy, C.A.; Burian, S.J. Water supply and stormwater management benefits of residential rainwater harvesting in US cities. J. Am. Water Resour. Assoc. 2013, 49, 810–824. [Google Scholar] [CrossRef]
  31. Godyń, I. Economic Incentives in Stormwater Management: A Study of Practice Gaps in Poland. Water 2022, 14, 3817. [Google Scholar] [CrossRef]
  32. Partzch, L. Smart regulation for water innovation-the case of decentralised rainwater technology. J. Clean. Prod. 2009, 17, 985–991. [Google Scholar] [CrossRef]
  33. Nandi, S.; Gonela, V. Rainwater harvesting for domestic use: A systematic review and outlook from the utility policy and management perspectives. Util. Policy 2022, 77, 10138. [Google Scholar] [CrossRef]
  34. SINAPI. National System for Research on Civil Construction Costs and Indexes; Federal Government: Brasília, Brazil, 2020. Available online: http://www.caixa.gov.br/poder-publico/apoio-poder-publico/sinapi/referencias-precos-insumos/Paginas/default.aspx (accessed on 25 September 2020). (In Portuguese)
  35. Istchuk, R.N.; Ghisi, E. Influence of rainfall time series indicators on the performance of residential rainwater harvesting systems. J. Environ. Manag. 2022, 323, 116163. [Google Scholar] [CrossRef]
  36. Walsh, R.P.D.; Lawler, D.M. Rainfall seasonality: Description, spatial patterns and change through time. Weather 1981, 36, 201–208. [Google Scholar] [CrossRef]
  37. Ghisi, E.; Cordova, M.M. Netuno 4. Computer Programme; Federal University of Santa Catarina: Florianópolis, Brazil, 2014; Available online: http://www.labeee.ufsc.br/downloads/softwares/netuno (accessed on 21 January 2021). (In Portuguese)
  38. Ghisi, E.; Cordova, M.M. Netuno 4: User Manual; Department of Civil Engineering, Universidade Federal de Santa Catarina: Florianópolis, Brazil, 2014; Available online: http://www.labeee.ufsc.br/downloads/softwares/netuno (accessed on 21 January 2021). (In Portuguese)
  39. Geraldi, M.S.; Ghisi, E. Influence of the length of rainfall time series on rainwater harvesting systems: A case study in Berlin. Resour. Conserv. Recycl. 2017, 125, 169–180. [Google Scholar] [CrossRef]
  40. Geraldi, M.S.; Ghisi, E. Assessment of the length of rainfall time series for rainwater harvesting in buildings. Resour. Conserv. Recycl. 2018, 133, 231–241. [Google Scholar] [CrossRef]
  41. ABNT—Associação Brasileira de Normas Técnicas. NBR 15527: Água de Chuva—Aproveitamento de Coberturas em Áreas Urbanas Para Fins Não Potáveis—Requisitos; ABNT—Associação Brasileira de Normas Técnicas: Rio de Janeiro, Brazil, 2007; 8p. (In Portuguese) [Google Scholar]
  42. ANEEL—Agência Nacional De Energia Elétrica. Ranking das Tarifas; Agência Nacional de Energia Elétrica: Brasília, Brazil, 2021. Available online: https://www.aneel.gov.br/ranking-das-tarifas (accessed on 27 May 2021). (In Portuguese)
  43. Sant’Ana, D.; Boeger, L.; Monteiro, L. Aproveitamento de águas pluviais e o reúso de águas cinzas em edifícios residenciais de Brasília-parte 2: Viabilidade técnica e econômica. Paranoá Cad. Arquitetura Urban. 2013, 10, 85–94. (In Portuguese) [Google Scholar] [CrossRef]
  44. BCB—Central Bank of Brazil. Relatório de Inflação; Número 1; BCB—Central Bank of Brazil: Brasília, Brazil, March 2020; Volume 22. Available online: https://www.bcb.gov.br/content/ri/relatorioinflacao/202003/ri202003p.pdf (accessed on 27 May 2021). (In Portuguese)
  45. CONSANPA—Companhia de Saneamento do Pará. Tariff Tables; Belém, Brazil, December 2019. Available online: http://www.cosanpa.pa.gov.br/wp-content/uploads/2018/05/Tarifas-Cosanpa-atual_dez2019-2.pdf. (In Portuguese)
  46. ARSAE—Agência Reguladora de Serviços de Abastecimento de Água e de Esgotamento Sanitário do Estado de Minas Gerais. Tabelas Tarifárias da COPASA-MG; Belo Horizonte, Brazil, November 2020. Available online: http://www.arsae.mg.gov.br/politica-de-privacidade/page/262-tarifas-copasa.pdf (accessed on 30 April 2021). (In Portuguese)
  47. CAESB—Companhia de Saneamento do Distrito Federal. Tariffs and Prices; Brasília, Brazil, June 2020. Available online: https://www.caesb.df.gov.br/tarifas-e-precos.html (accessed on 30 April 2021). (In Portuguese)
  48. AEGEA—Águas Guariroba. Legislation and Tariffs; Campo Grande, Brazil, 2021; Available online: https://www.aguasguariroba.com.br/legislacao-e-tarifas/ (accessed on 13 July 2021). (In Portuguese)
  49. CASAN—Companhia Catarinense de Águas e Saneamento. Tarifa residencial “B”—Normal; Florianópolis, Brazil, 2021; Available online: https://www.casan.com.br/menu-conteudo/index/url/residencial#0 (accessed on 30 April 2021). (In Portuguese)
  50. COMPESA—Companhia Pernambucana de Saneamento. Estrutura Tarifária; Recife, Brazil, January 2021; Available online: https://lojavirtual.compesa.com.br:8443/gsan/exibirConsultarEstruturaTarifariaPortalAction.doc (accessed on 30 April 2021). (In Portuguese)
  51. EMBASA—Empresa Baiana de Água e Saneamento S.A. Tariffs; Salvador, Brazil, June 2019. Available online: http://old.embasa.ba.gov.br/centralservicos/index.php/tarifas?informacoes=sim (accessed on 30 April 2021). (In Portuguese)
  52. SABESP—Companhia de Saneamento Básico do Estado de São Paulo. Comunicado 4/20; São Paulo, Brazil, July 2020; Available online: http://site.sabesp.com.br/site/uploads/file/tabelas_tarif%C3%A1rias/Comunicado%204-20.pdf (accessed on 30 April 2021). (In Portuguese)
  53. Montgomery, D.C.; Runger, C. Applied Statistics and Probability for Engineers, 6th ed.; John Wiley & Sons, Inc. LTC: Rio de Janeiro, Brazil, 2012. [Google Scholar]
  54. INCC. Price Index: INCC-DI/FGV. 2021. Available online: http://indiceseconomicos.secovi.com.br/indicadormensal.php?idindicador=59 (accessed on 12 January 2021). (In Portuguese).
  55. Ghisi, E.; Oliveira, S.M. Potential for potable water savings by combining the use of rainwater and greywater in houses in southern Brazil. Build. Environ. 2007, 42, 1731–1742. [Google Scholar] [CrossRef]
  56. Carvalho, R.S. Potencial Econômico do Aproveitamento de águas Pluviais: Análise da Implantação de um Sistema Para a Região Urbana de Londrina [Economic Potential of Rainwater Harvesting: Analysis of the Implementation of a System for the Urban Region of Londrina]. Master’s Thesis, Postgraduate Diploma in Public Works Construction, Federal University of Paraná, Curitiba, Brazil, 2010. Available online: https://acervodigital.ufpr.br/bitstream/handle/1884/34378/CARVALHO,%20RAQUEL%20SARAVY%20DE.pdf;sequence=1 (accessed on 17 October 2022). (In Portuguese).
Figure 1. Indirect (a) and direct (b) rainwater distribution schemes.
Water 15 01112 g001
Figure 2. Average initial outlays for Brazilian RWH systems.
Water 15 01112 g002
Figure 3. Financial feasibility of Brazilian residential RWH systems with direct and indirect rainwater distribution schemes.
Water 15 01112 g003
Figure 4. Discounted paybacks among feasible systems with indirect rainwater distribution.
Water 15 01112 g004
Figure 5. Net present values for systems with indirect rainwater distribution.
Water 15 01112 g005
Figure 6. Internal rate of return for systems with indirect rainwater distribution.
Water 15 01112 g006
Figure 7. Financial feasibility analysis for eight Brazilian cities.
Water 15 01112 g007
Figure 8. Influence of design variables on the net present value.
Water 15 01112 g008
Figure 9. Correlation coefficients between rainfall indicators and the average and median net present value obtained in the financial analysis of Brazilian cities.
Water 15 01112 g009
Figure 10. Correlation between the seasonality index and the average and median net present value of the RWH systems.
Water 15 01112 g010
Table 1. Design conventions adopted to define initial outlays.
ItemConvention
Rainwater tanksTypeFibreglass, standard type, with lid
IncludesPVC Rainwater distribution branches
Overflow and cleaning branches in the tanks
Potable water supply system for dry seasons
Pumping branch (only in indirect system)
Civil worksUnderground rainwater tankManual excavation
Levelled base with 5 cm of gravel
Masonry walls at the edges of the cavity
Precast concrete cover
Overflow systemManual excavation
Precast concrete inspection boxes
CatchmentGuttersPVC—according to the catchment area
FilterPVC filter, according to NBR 15527 [21]
First-flush200L plastic barrels, according to catchment area
Includes PVC knobs and pipes for operation
Electrical installationsLevel sensorsElectric floats
Flow controlSolenoid valve (dry season feeder)
Wiring Includes cables and conduits
Motor pumpPower ½ HP
Includes circuit board for automatic activation
PressuriserPower ½ HP
Controlled by a built-in pressure switch
Includes circuit board for automatic activation
Table 2. Input values used for the computer simulations.
VariableUnitInput Data
Rainfall time series-Daily data for eight cities
Rainwater distribution-Indirect 1, Direct 2
Runoff coefficient %80
Catchment aream2100, 200 and 300
Number of dwellersinhabitant2, 4 and 6
Total water demandL/inhab.day165
Rainwater demand
(% of total water demand)
%30, 50 and 70
First-flush dischargemm2
Upper tank sizeL1 variable, 2 zero
Lower tank sizeL1000–50,000 (at intervals of 1000)
Note(s): 1 Indirect rainwater distribution, 2 Direct rainwater distribution.
Table 3. Water utility companies consulted.
CityReference
Belém-PACONSANPA [45]
Belo Horizonte-MGARSAE [46]
Brasília-DFCAESB [47]
Campo Grande-MSAEGEA [48]
Florianópolis-SCCASAN [49]
Recife-PECOMPESA [50]
Salvador-BAEMBASA [51]
São Paulo-SPSABESP [52]
Table 4. Rainfall time series indicators for eight Brazilian cities.
CityAverage Annual Rainfall (mm)Average Number of Dry Days per Year (Days)Seasonality Index (Non-Dimensional)Dry Periods
Average Duration (Days)Standard Deviation (Days)Coefficient of Variation (%)Maximum Duration (Days)
Belém2998980.461.841.590.8618
Recife23601450.562.582.631.0218
Florianópolis18571980.223.173.080.9724
Salvador17541700.482.942.820.9622
São Paulo16582380.534.325.491.2751
Brasília14992370.746.2915.752.50128
Belo Horizonte14862630.746.7111.911.7797
Campo Grande14792350.474.867.751.6090
Table 5. Average initial outlays (BRL).
Rainwater Tank (L)Catchment Area (m2)—IndirectCatchment Area (m2)—Direct
100200300100200300
300010,999.1812,077.0212,885.1810,749.3011,872.1412,680.30
400011,565.9312,643.7713,451.9411,361.0512,438.8913,247.06
500012,157.4313,235.2714,043.4311,952.5513,030.3913,838.55
600013,134.9514,212.7815,020.9512,930.0714,007.9014,816.07
700014,130.4415,208.2716,016.4413,925.5615,003.3915,811.56
800015,143.9016,221.7417,029.9014,939.0216,016.8616,825.02
900016,175.3417,253.1718,061.3415,970.4617,048.2917,856.46
Table 6. Initial outlay distribution for systems with a catchment area of 200 m2.
Tank Size (L)Tanks (%)Plumbing (%)Civil Works (%)Rain Collection (%)Electrical System (%)
IndirectDirectIndirectDirectIndirectDirectIndirectDirectIndirectDirect
300015.614.124.616.015.823.431.414.512.631.9
400017.316.023.517.417.122.330.013.812.130.5
500018.917.722.518.718.421.328.713.211.529.1
600022.821.720.919.118.819.826.712.310.727.1
700026.225.319.619.519.218.524.911.510.025.3
800029.228.318.319.919.717.323.410.79.423.7
900031.831.017.220.320.116.322.010.18.922.2
Table 7. Operational costs per cubic meter of consumed rainwater for each city.
CityAverage Operational Cost—General (BRL/m3)Average Operational Cost—Feasible Scenarios (BRL/m3)Average Operational Cost—Unfeasible Scenarios (BRL/m3)
IndirectDirectIndirectDirectIndirectDirect
Belém4.314.153.73.624.974.81
Belo Horizonte5.325.144.554.396.286.09
Brasília5.134.984.474.335.415.25
Campo Grande4.744.584.094.066.035.83
Florianópolis4.674.484.284.125.435.23
Recife4.464.334.244.115.125.18
Salvador4.634.504.244.115.405.27
São Paulo4.814.754.033.875.355.27
Table 8. Average financial feasibility indicators obtained for both rainwater distribution schemes.
CityNet Present Value (BRL)Discounted Payback (Years)Internal Rate of Return (%/Month)
IndirectDirectIndirectDirectIndirectDirect
Belém9223.569316.6718.318.10.850.86
Belo Horizonte10,328.6910,977.6018.217.50.840.86
Brasília6877.527472.5920.520.30.560.56
Campo Grande15,317.7915,039.2815.315.60.990.99
Florianópolis35,473.2036,133.108.98.71.451.47
Recife14,334.8513,022.8914.115.61.010.93
Salvador16,152.3716,893.4514.314.11.021.03
São Paulo24,108.9725,068.6014.514.10.990.95
Disclaimer/Publisher’s Note: The statements, opinions and data contained in all publications are solely those of the individual author(s) and contributor(s) and not of MDPI and/or the editor(s). MDPI and/or the editor(s) disclaim responsibility for any injury to people or property resulting from any ideas, methods, instructions or products referred to in the content.

