
Determining Wave Transmission over Rubble-Mound Breakwaters: Assessment of Existing Formulae through Benchmark Testing


Abstract
1. Introduction
1.1. Governing Parameters of Wave Transmission
1.2. Existing Wave Transmission Formulae
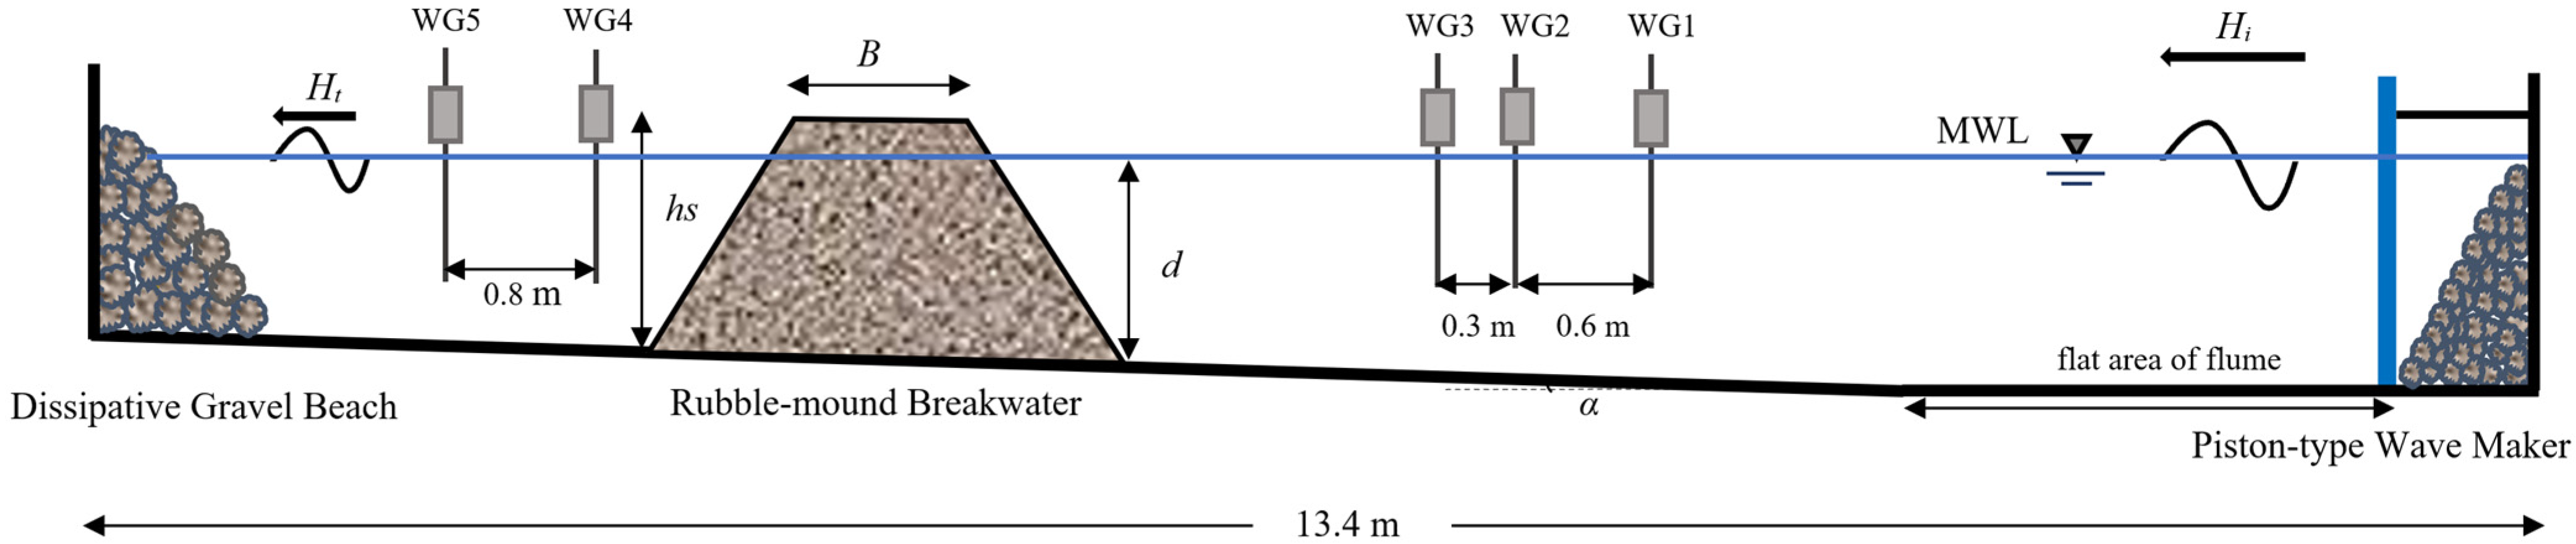
2. Experimental Procedure and Setup
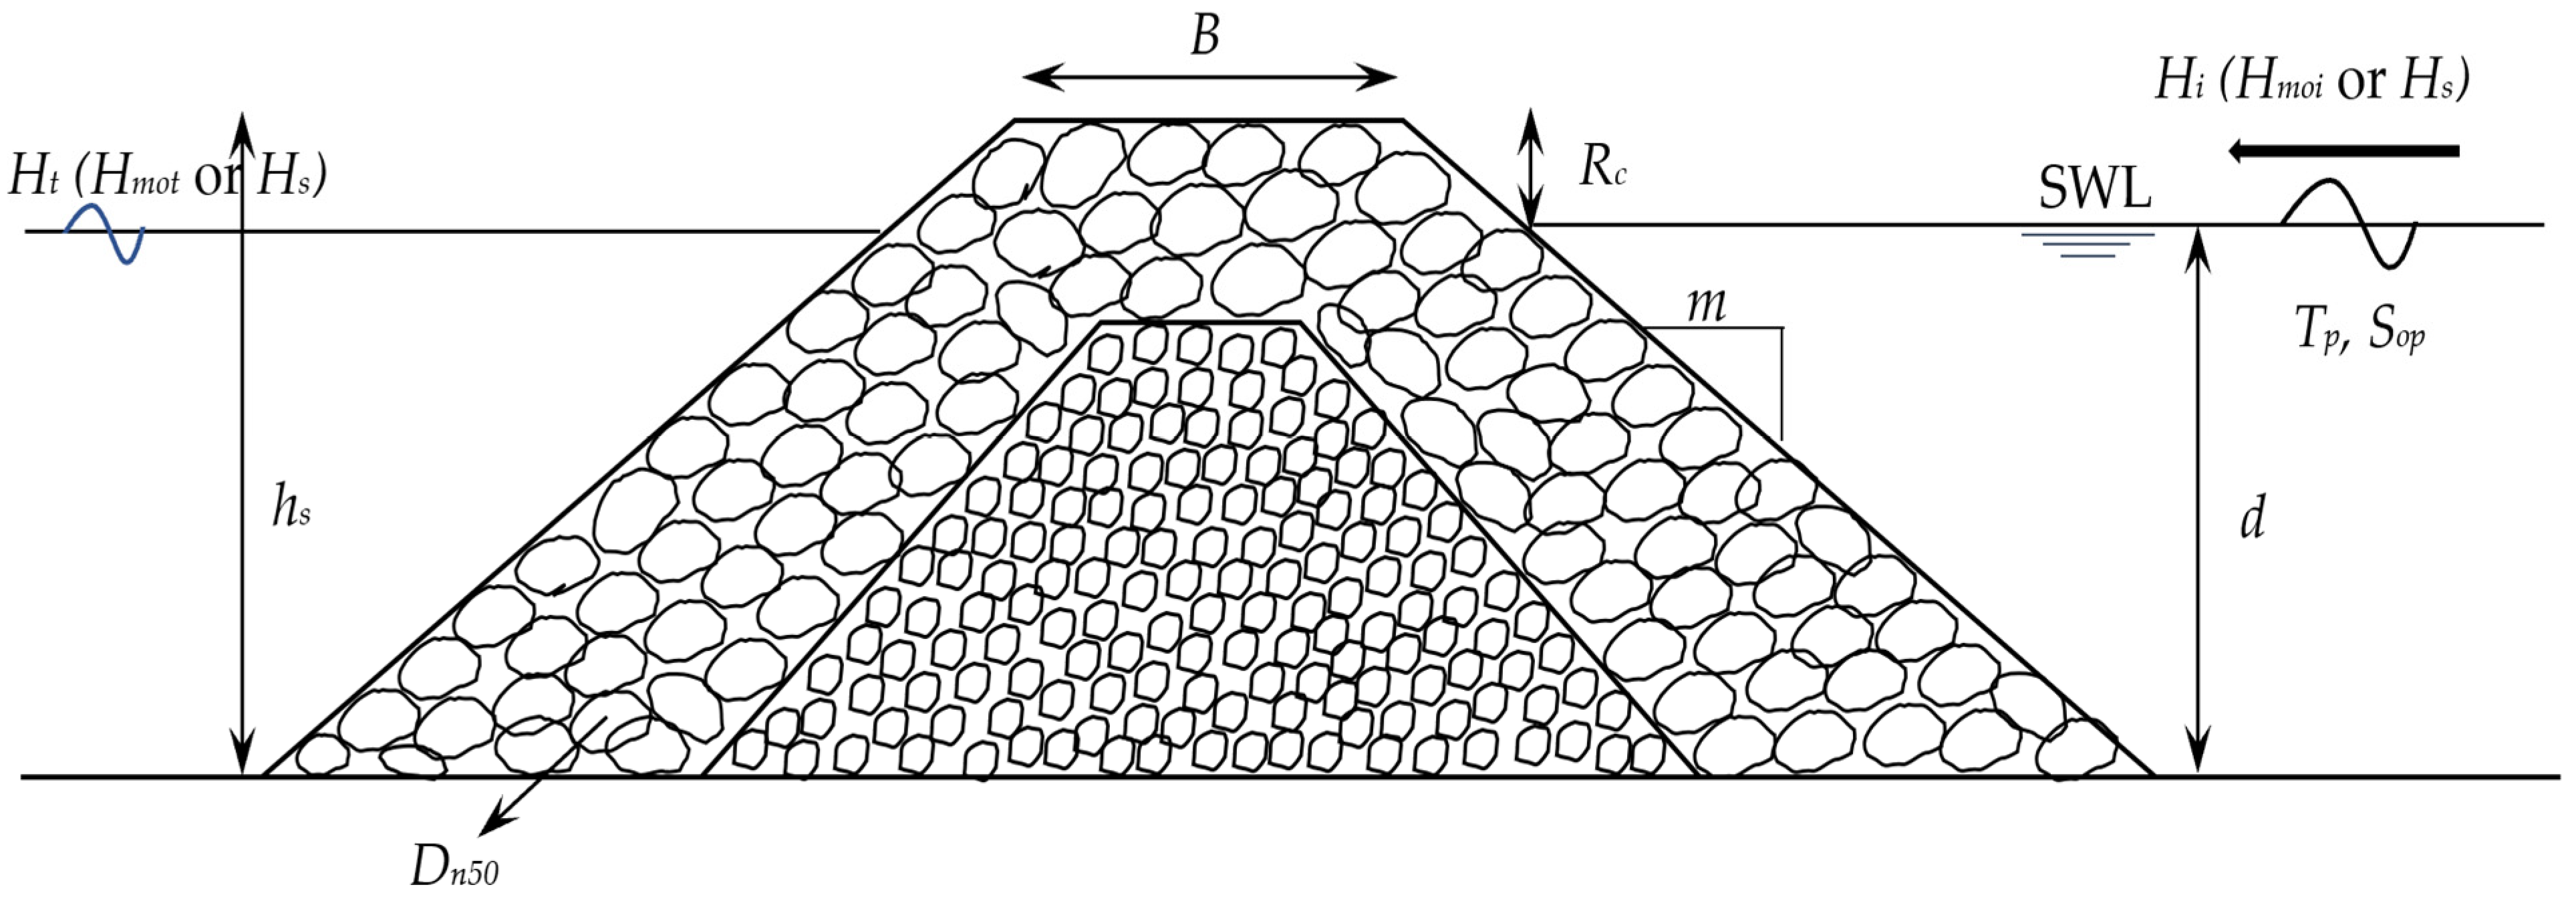
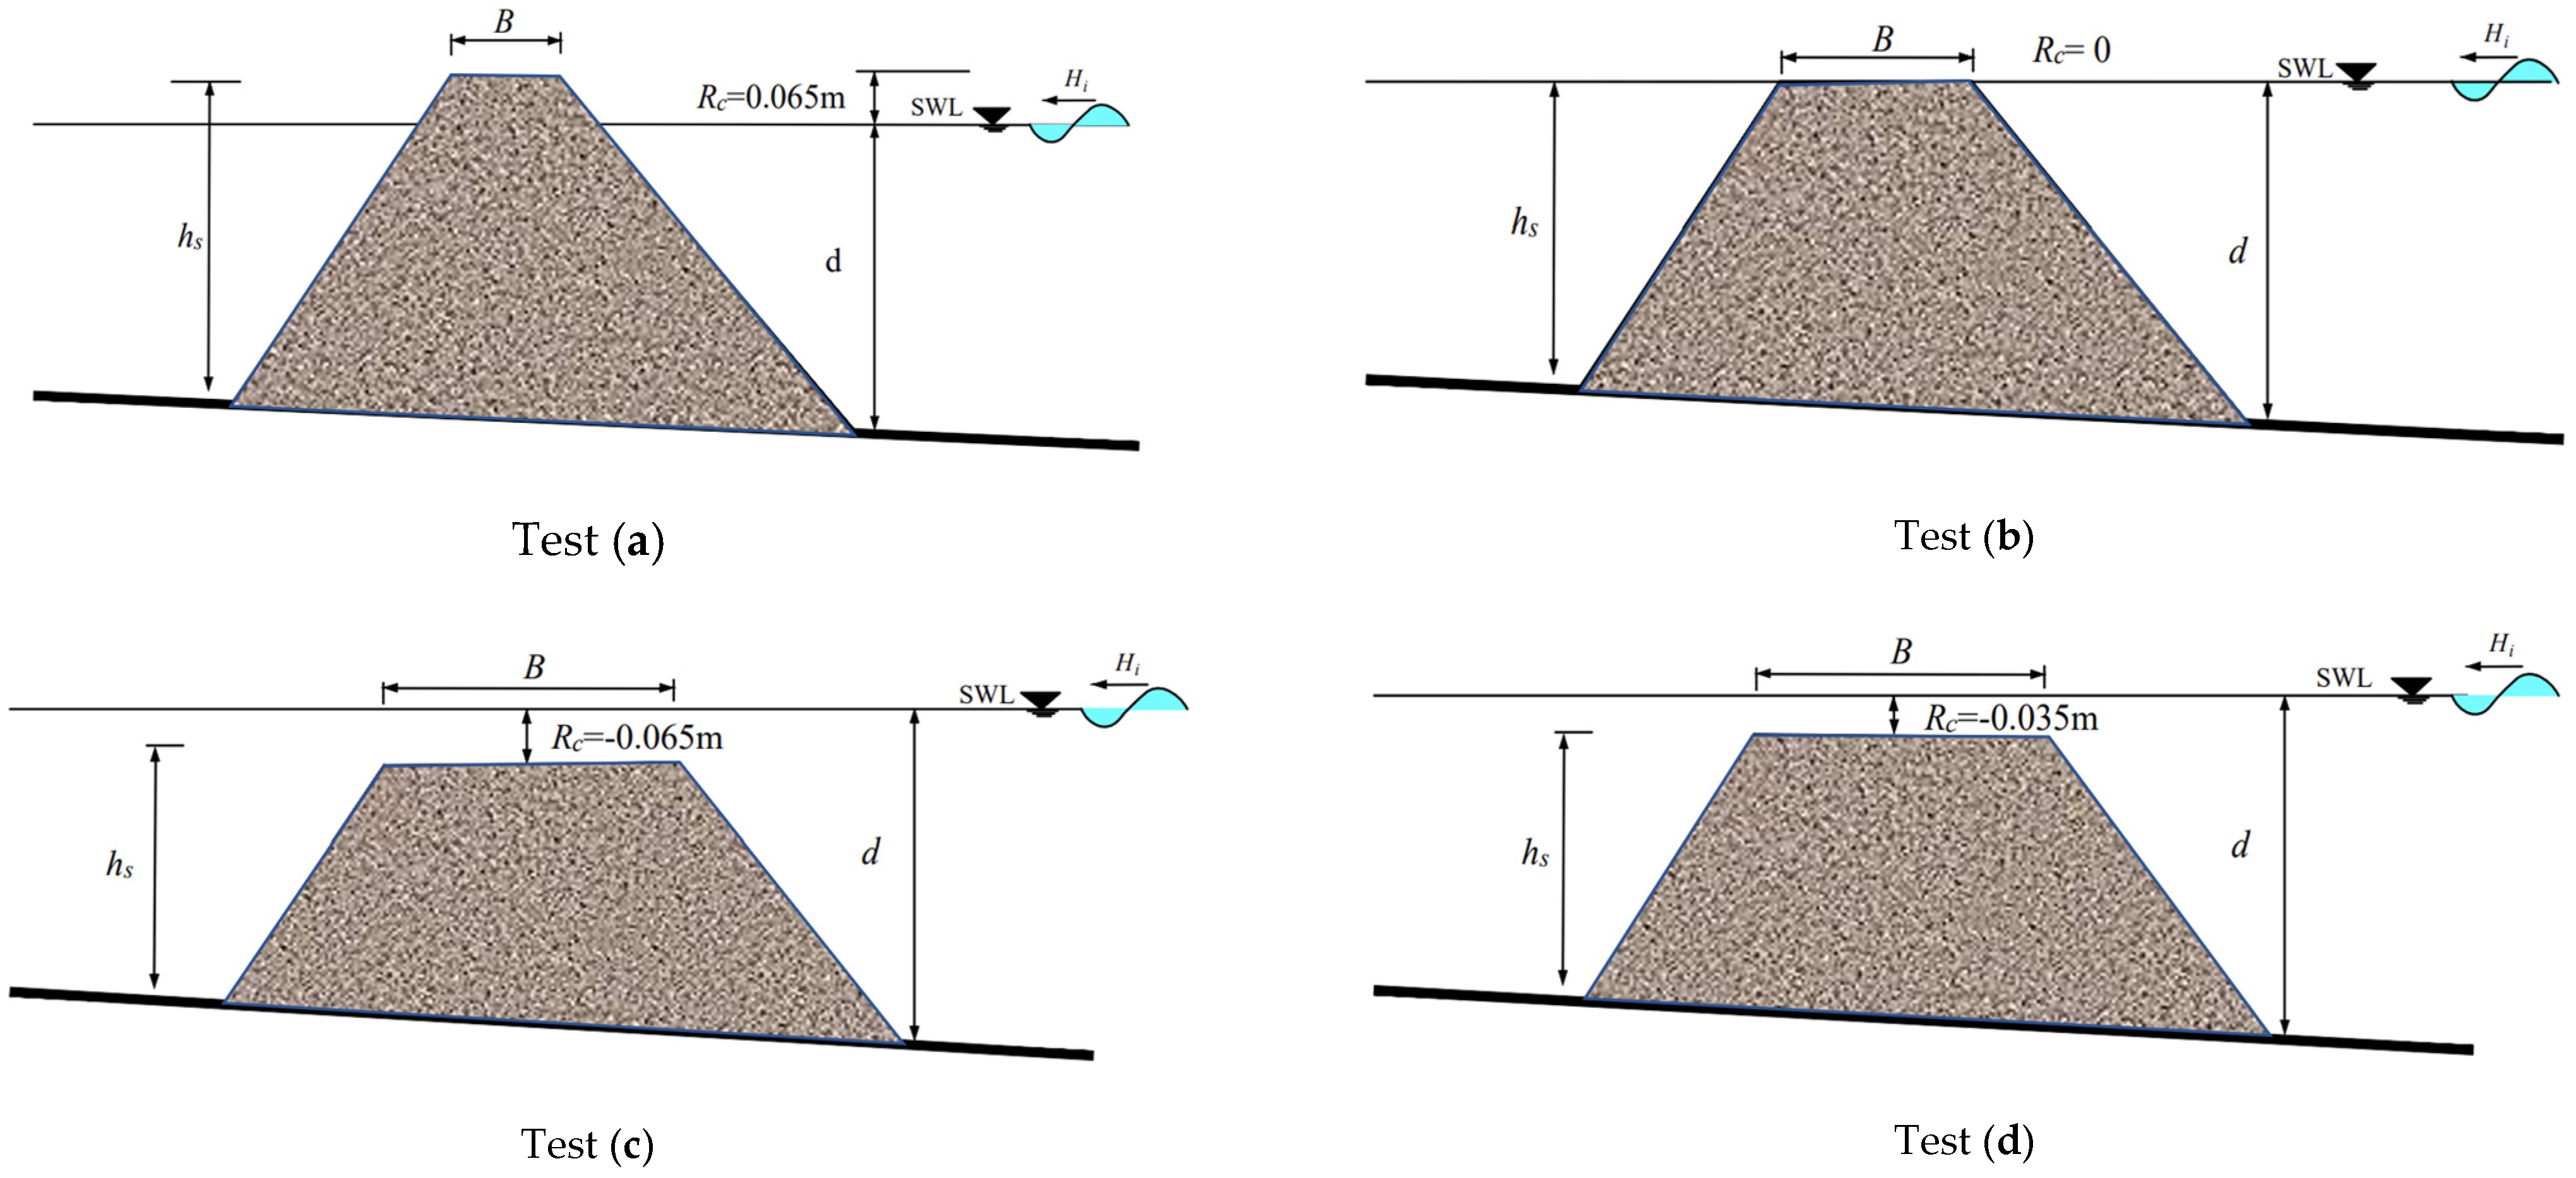
2.1. Laboratory Model
2.2. Wave Characteristics and Measurements
2.3. Dimensional Analysis
3. Results
3.1. Wave Transmission Performance
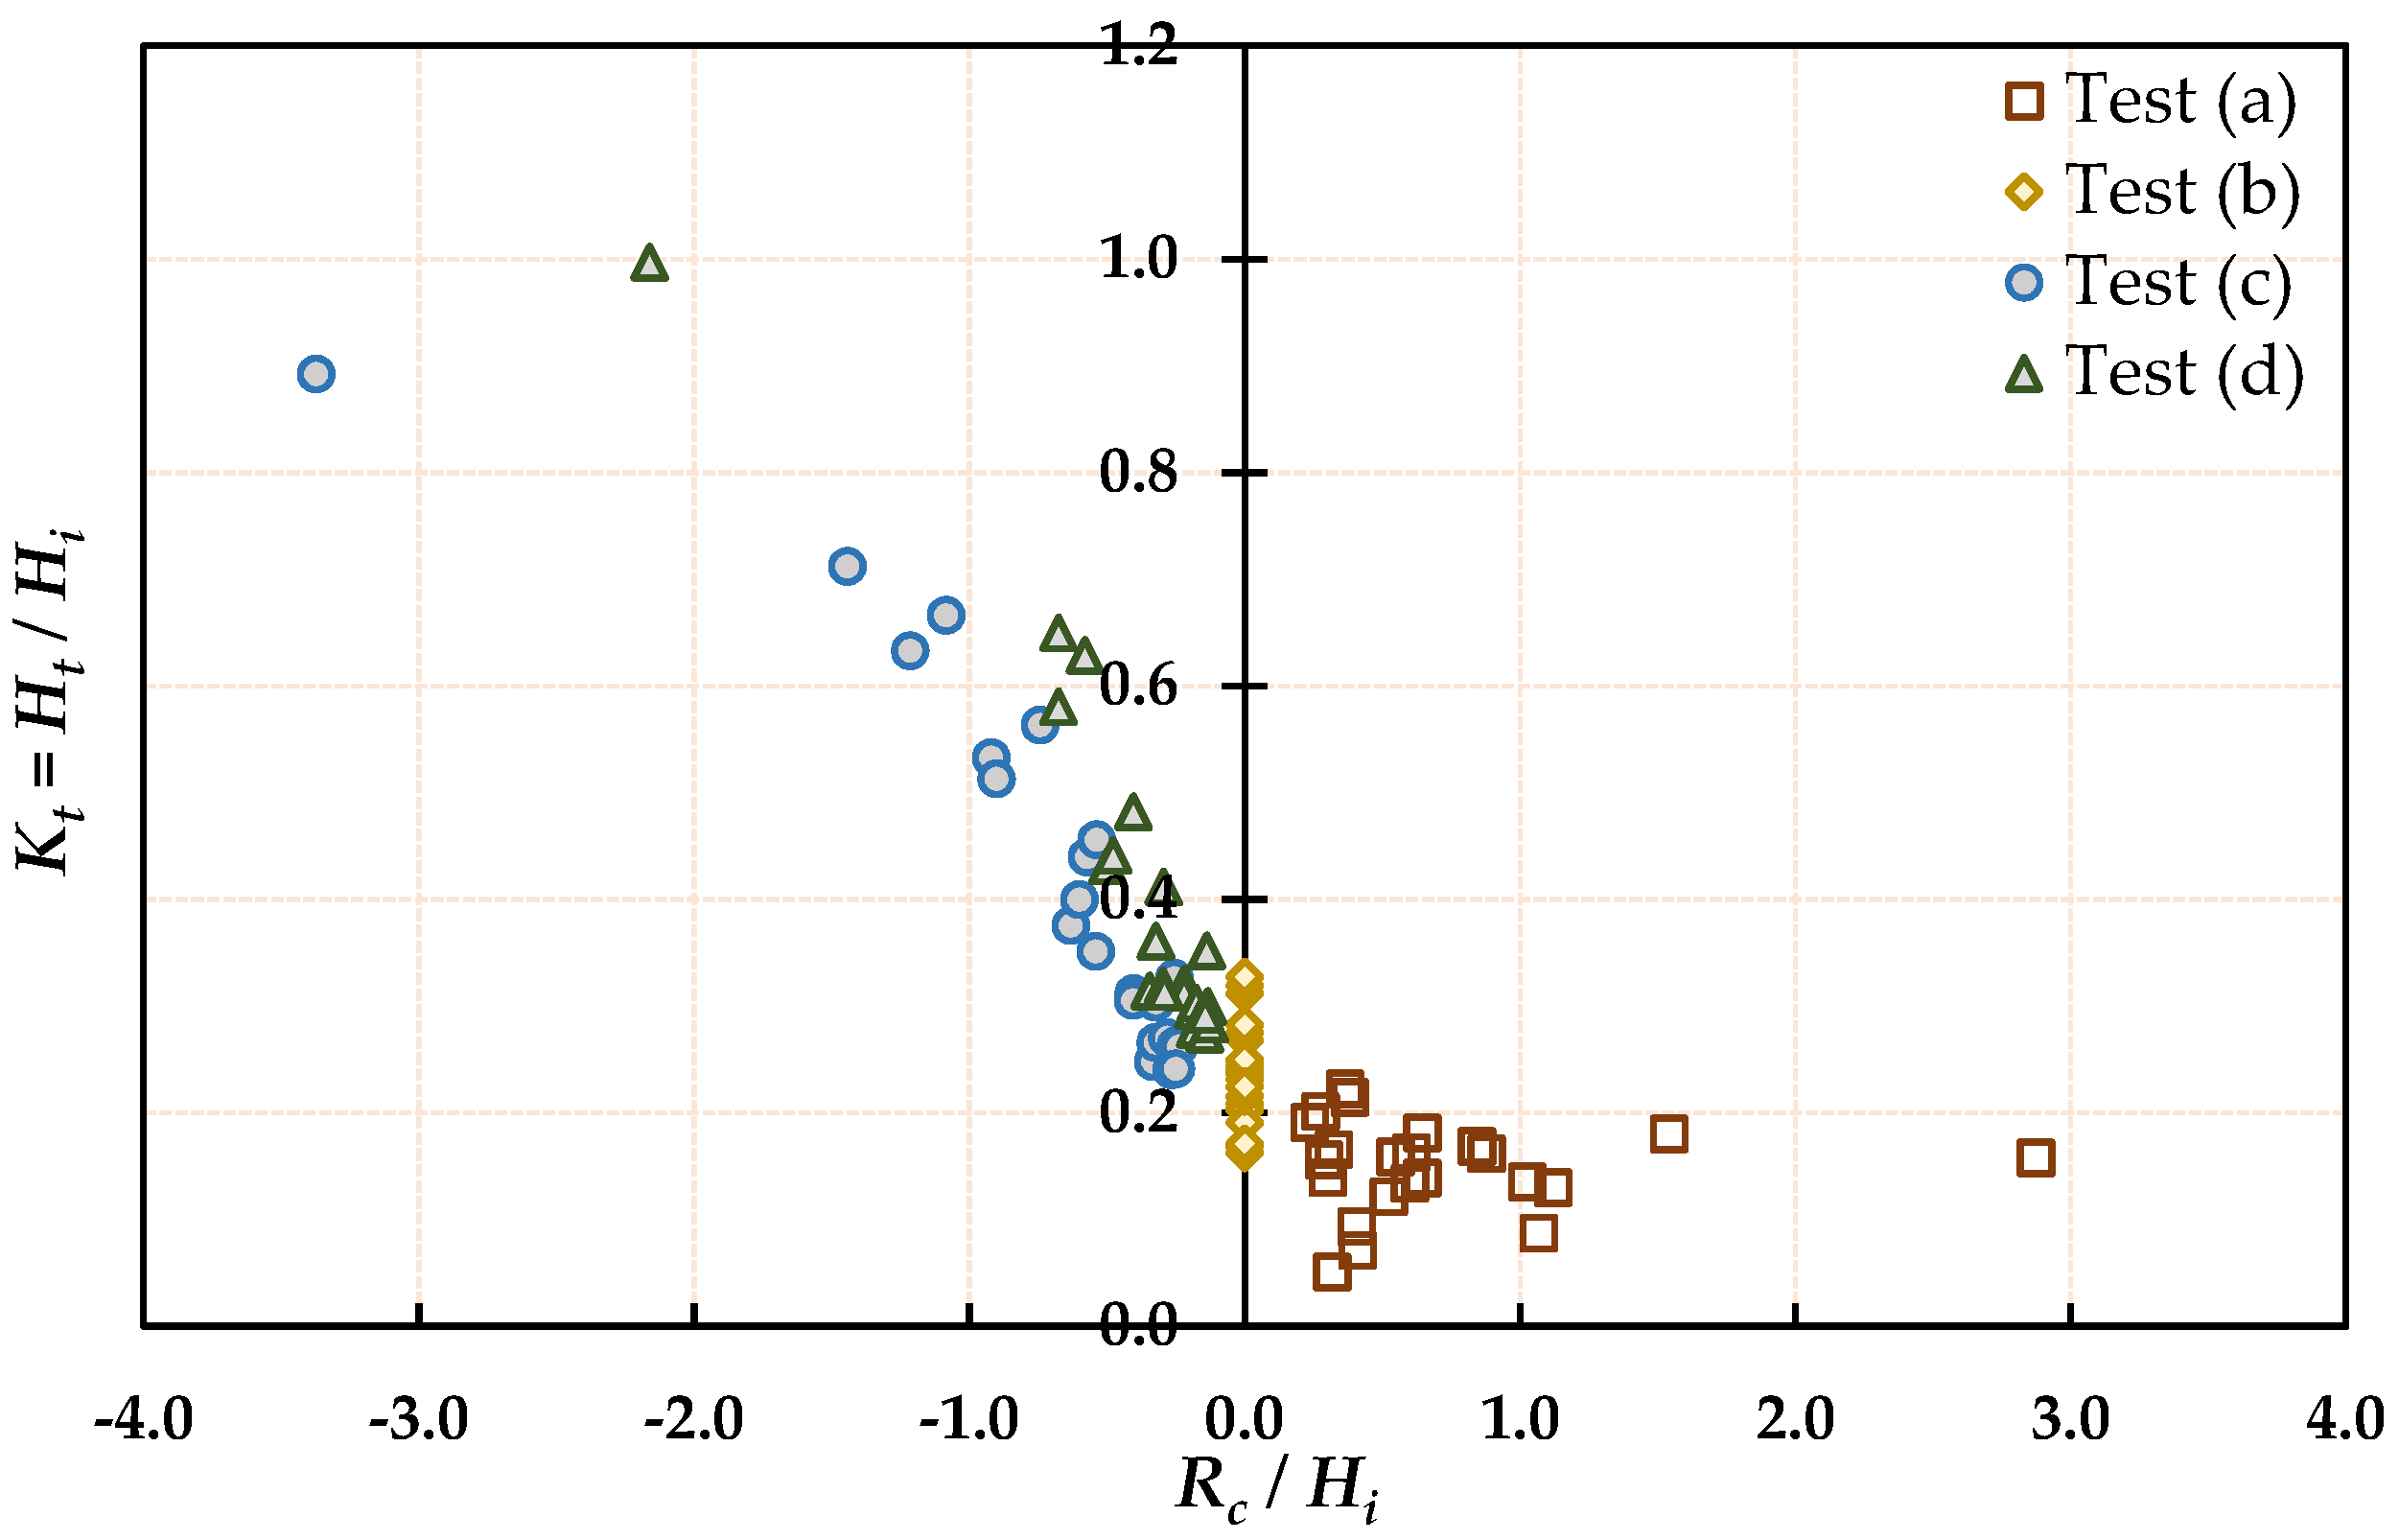
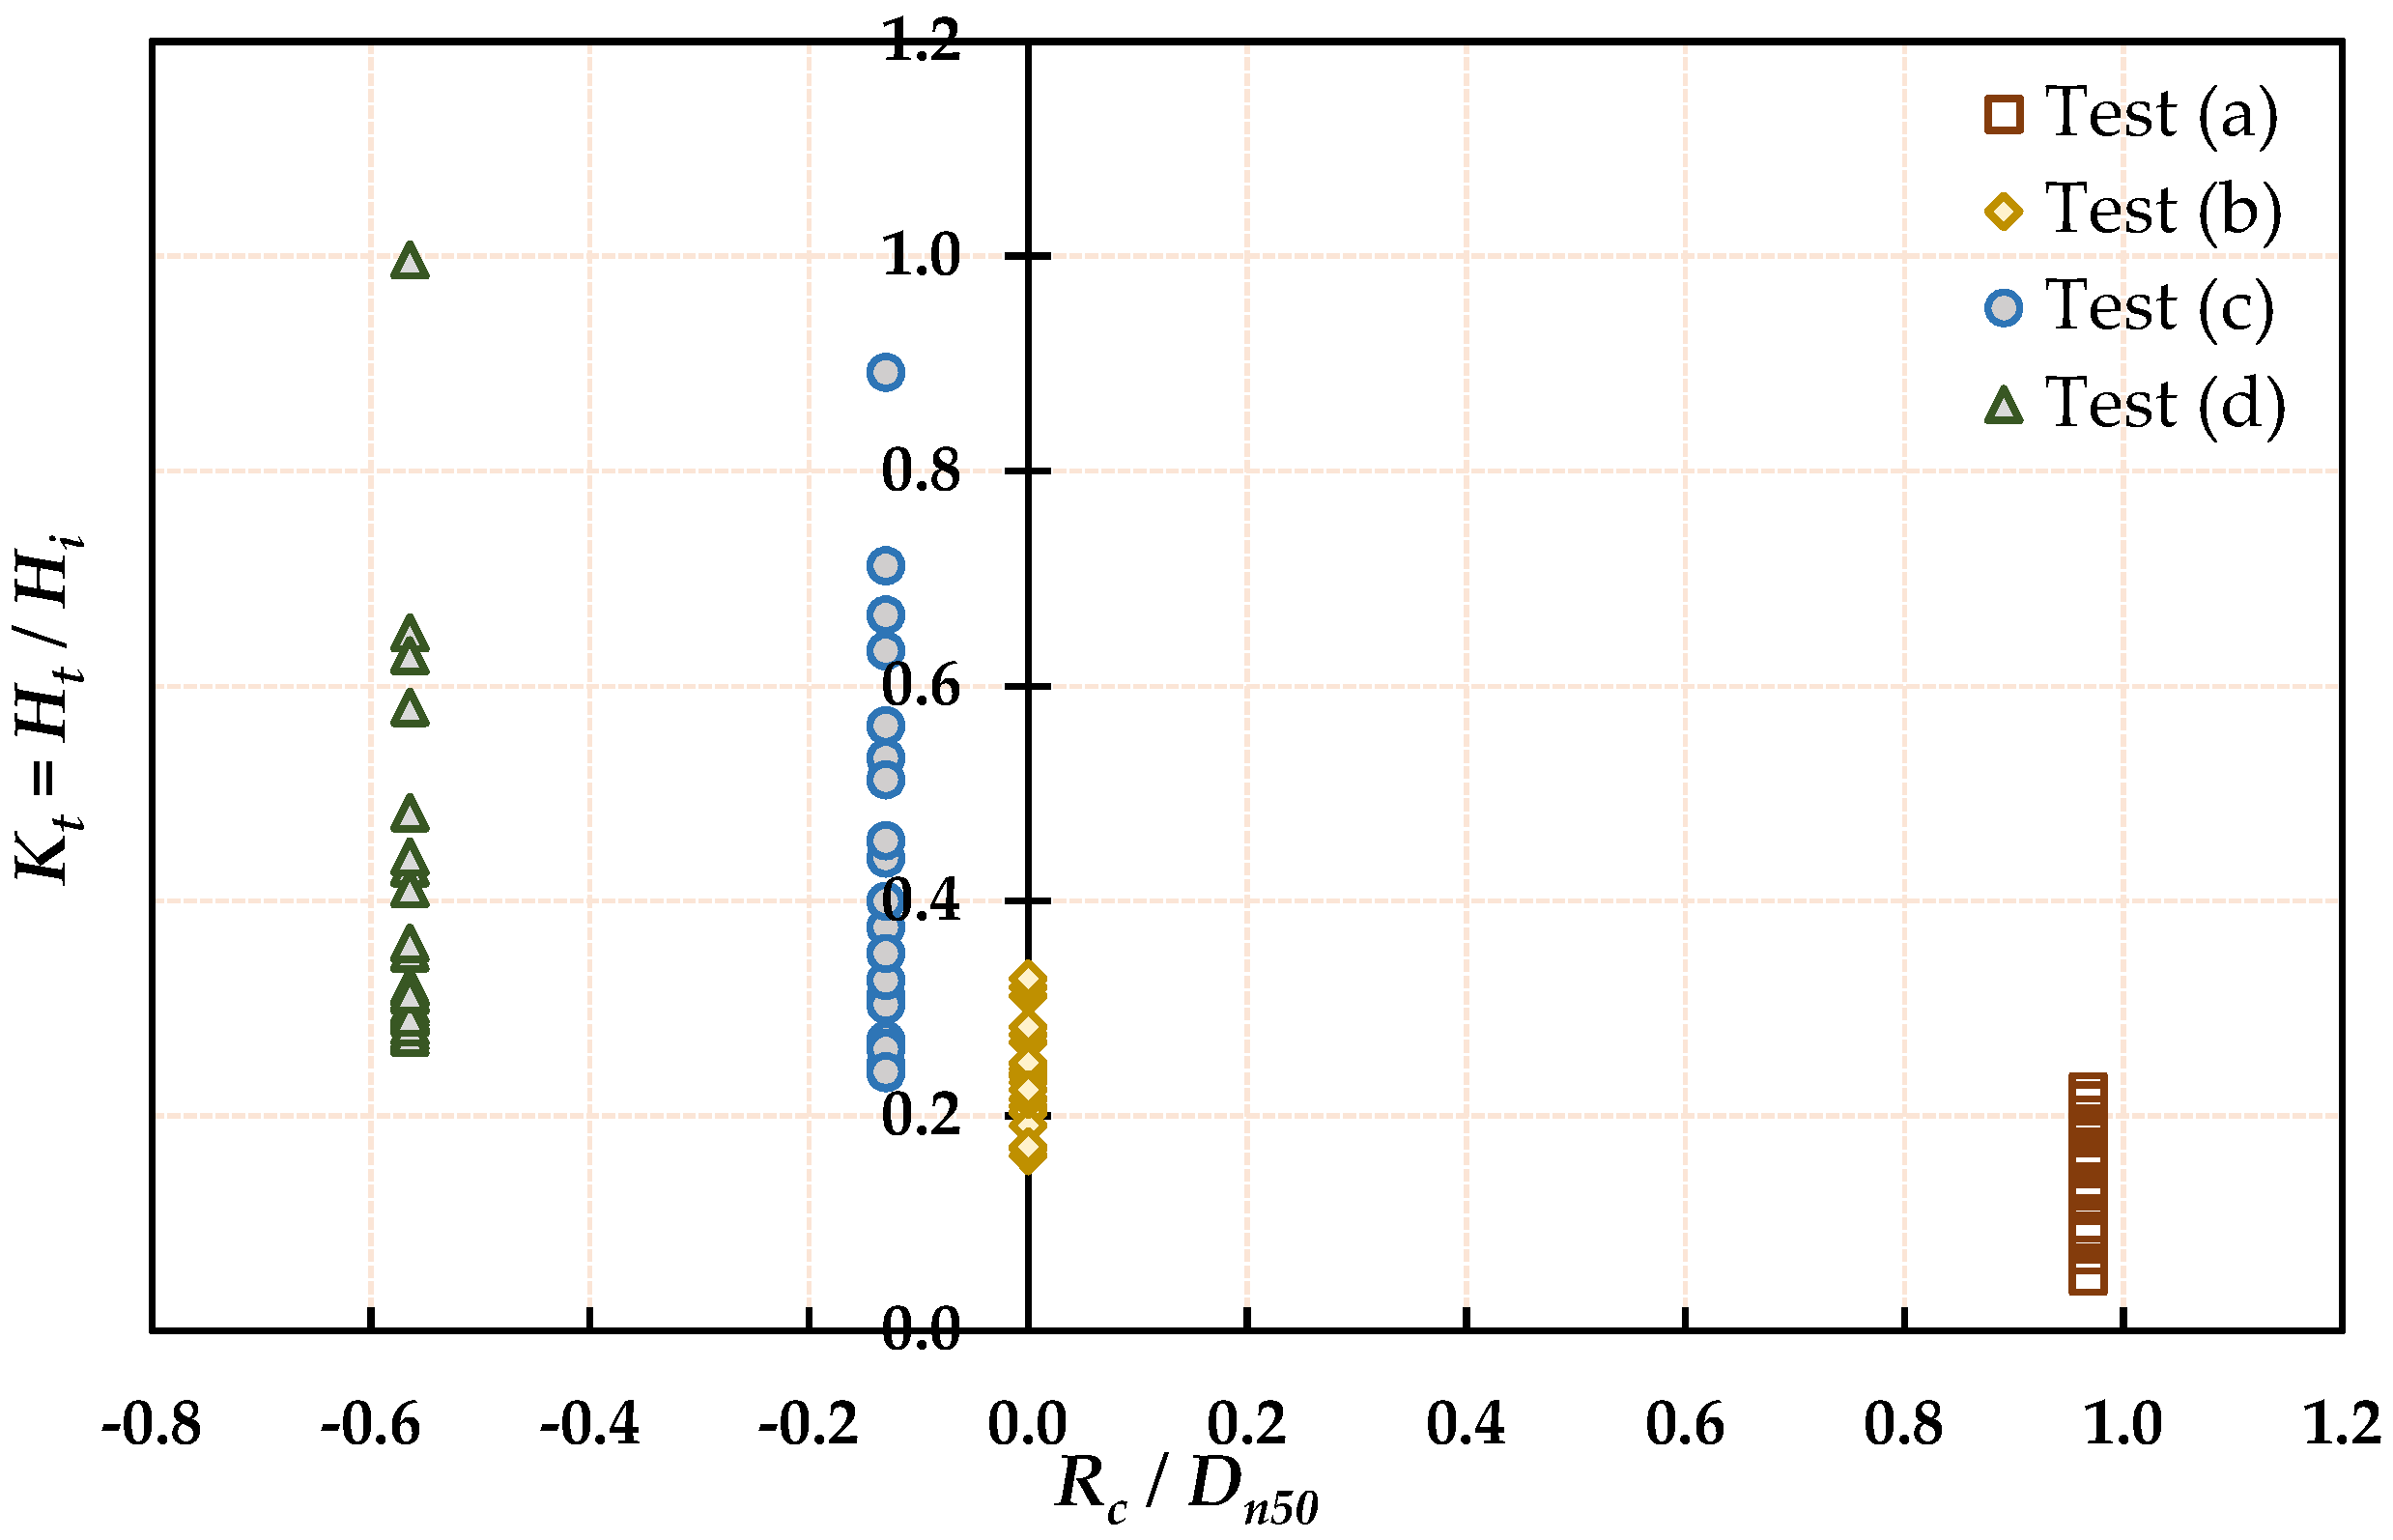
3.1.1. Effect of Relative Crest Freeboard () on Wave Transmission Coefficient ()
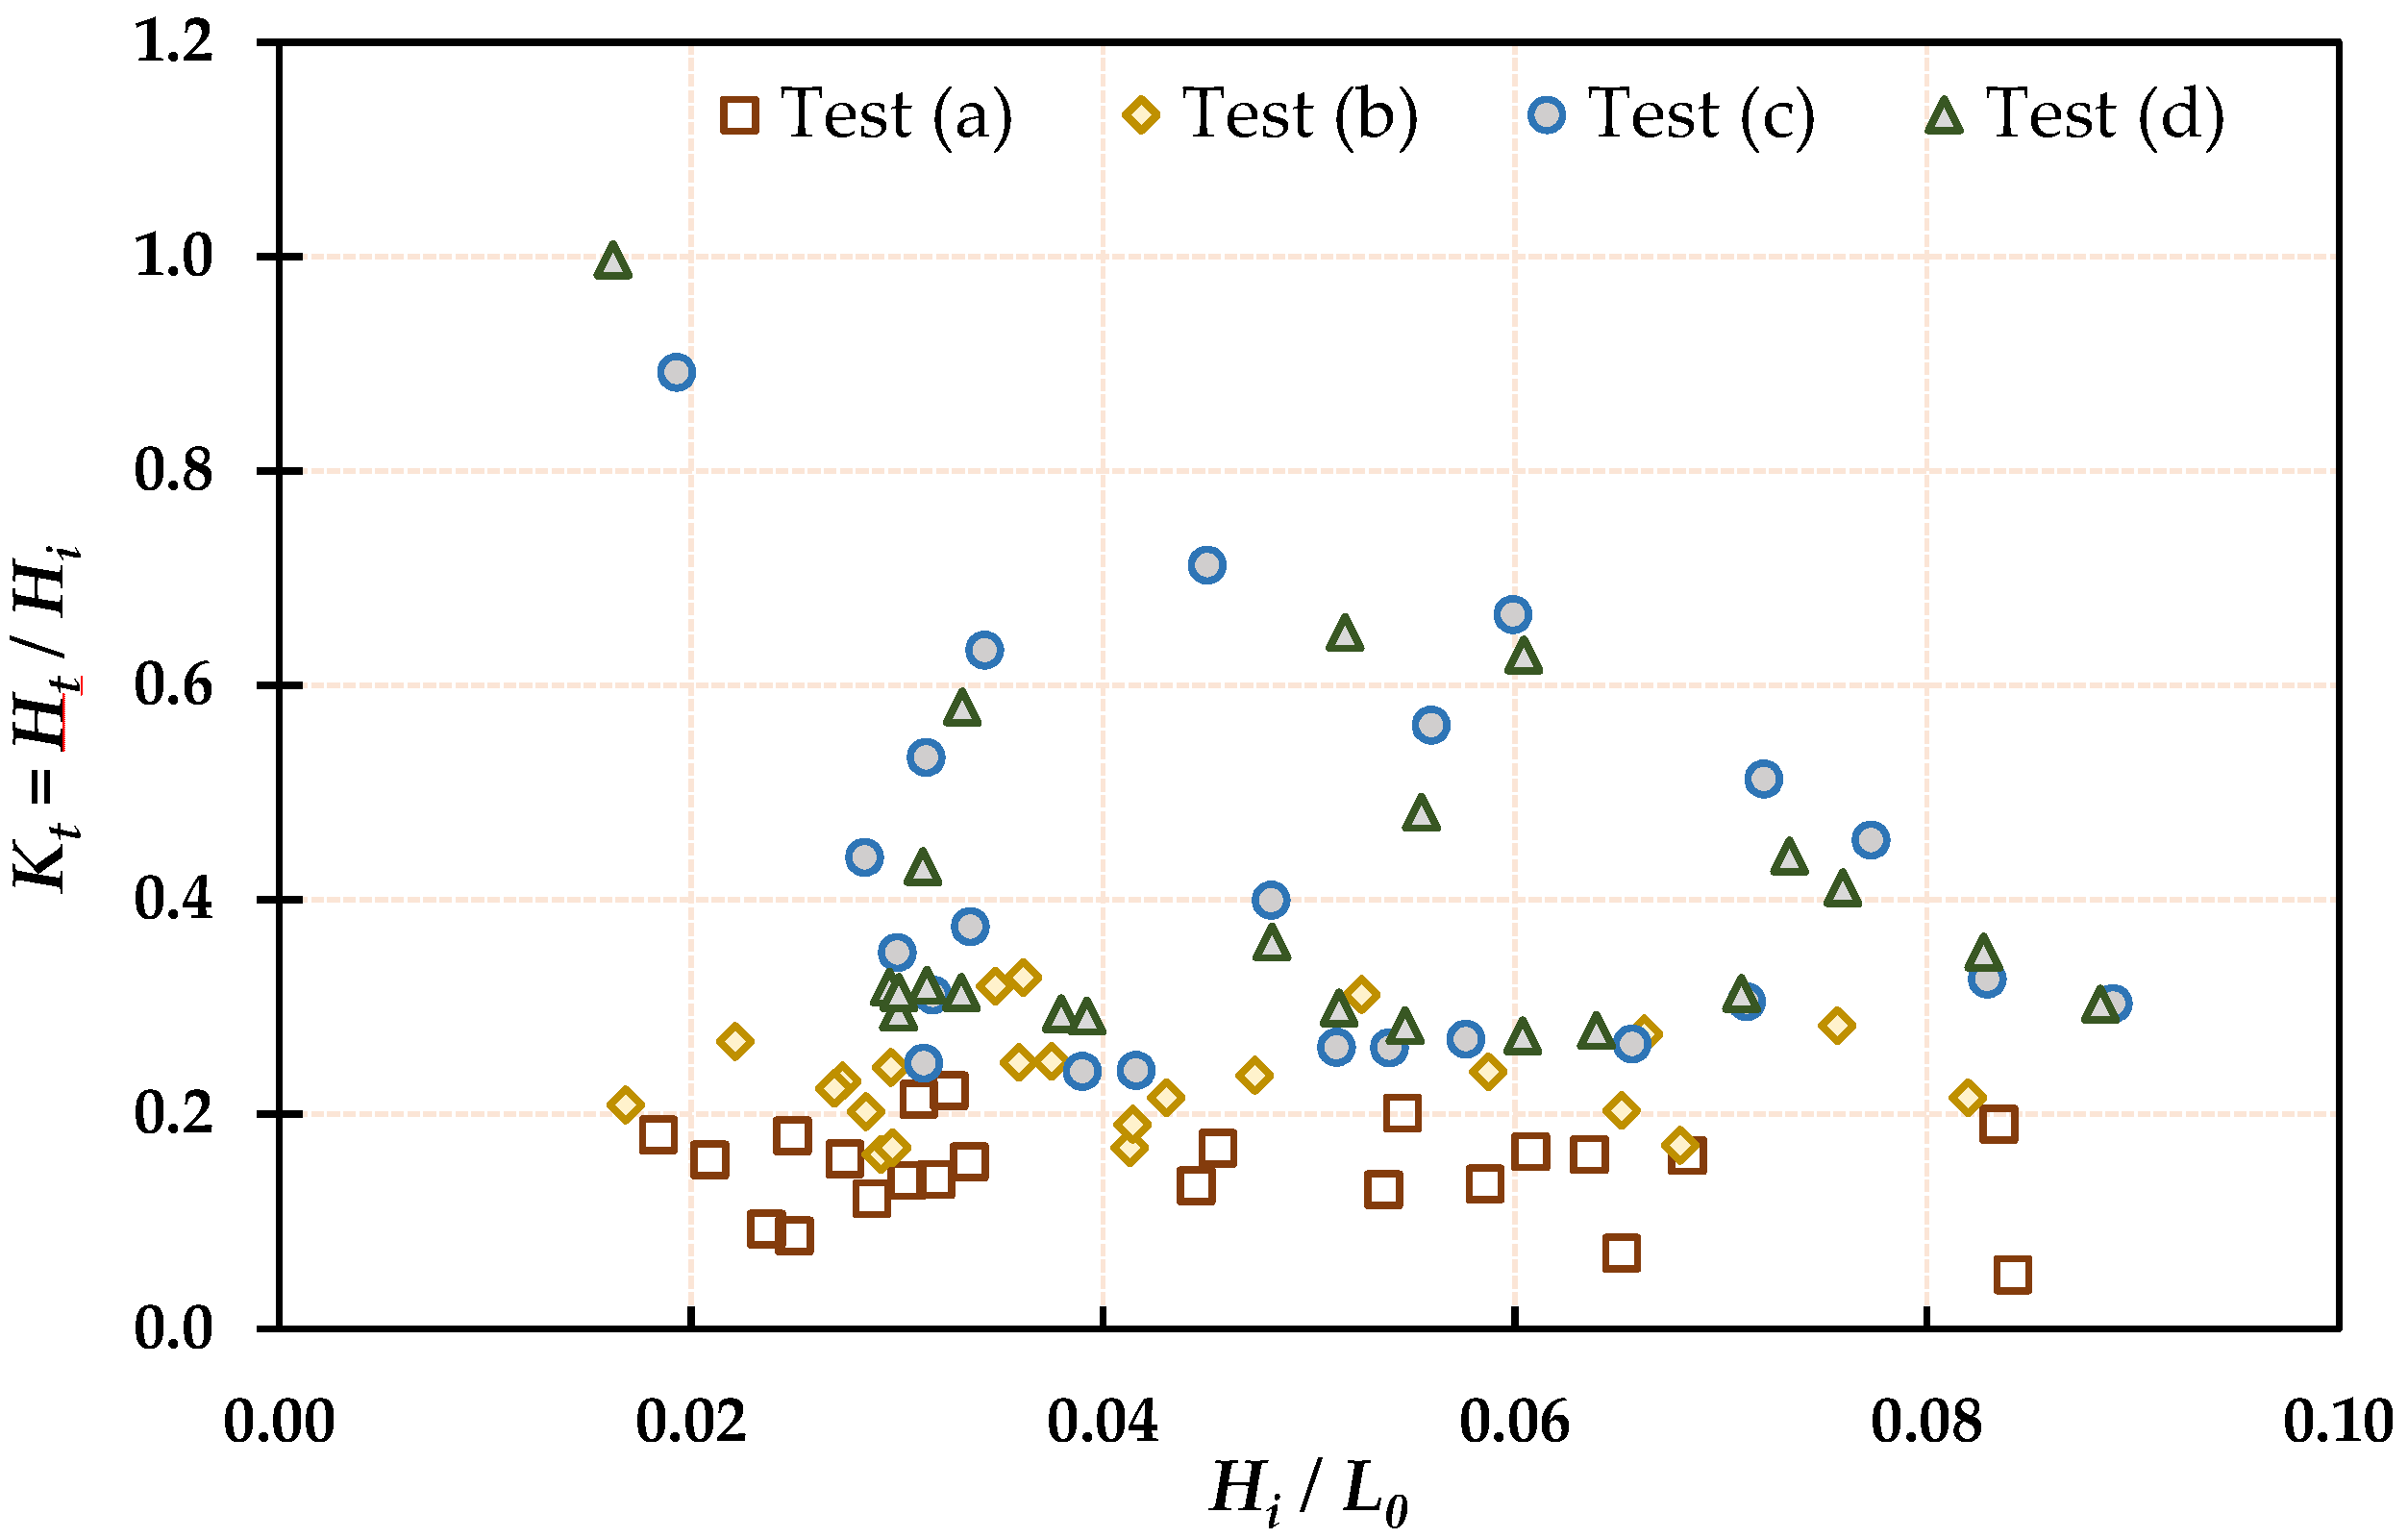
3.1.2. Effect of Wave Steepness () on Wave Transmission Coefficient ()
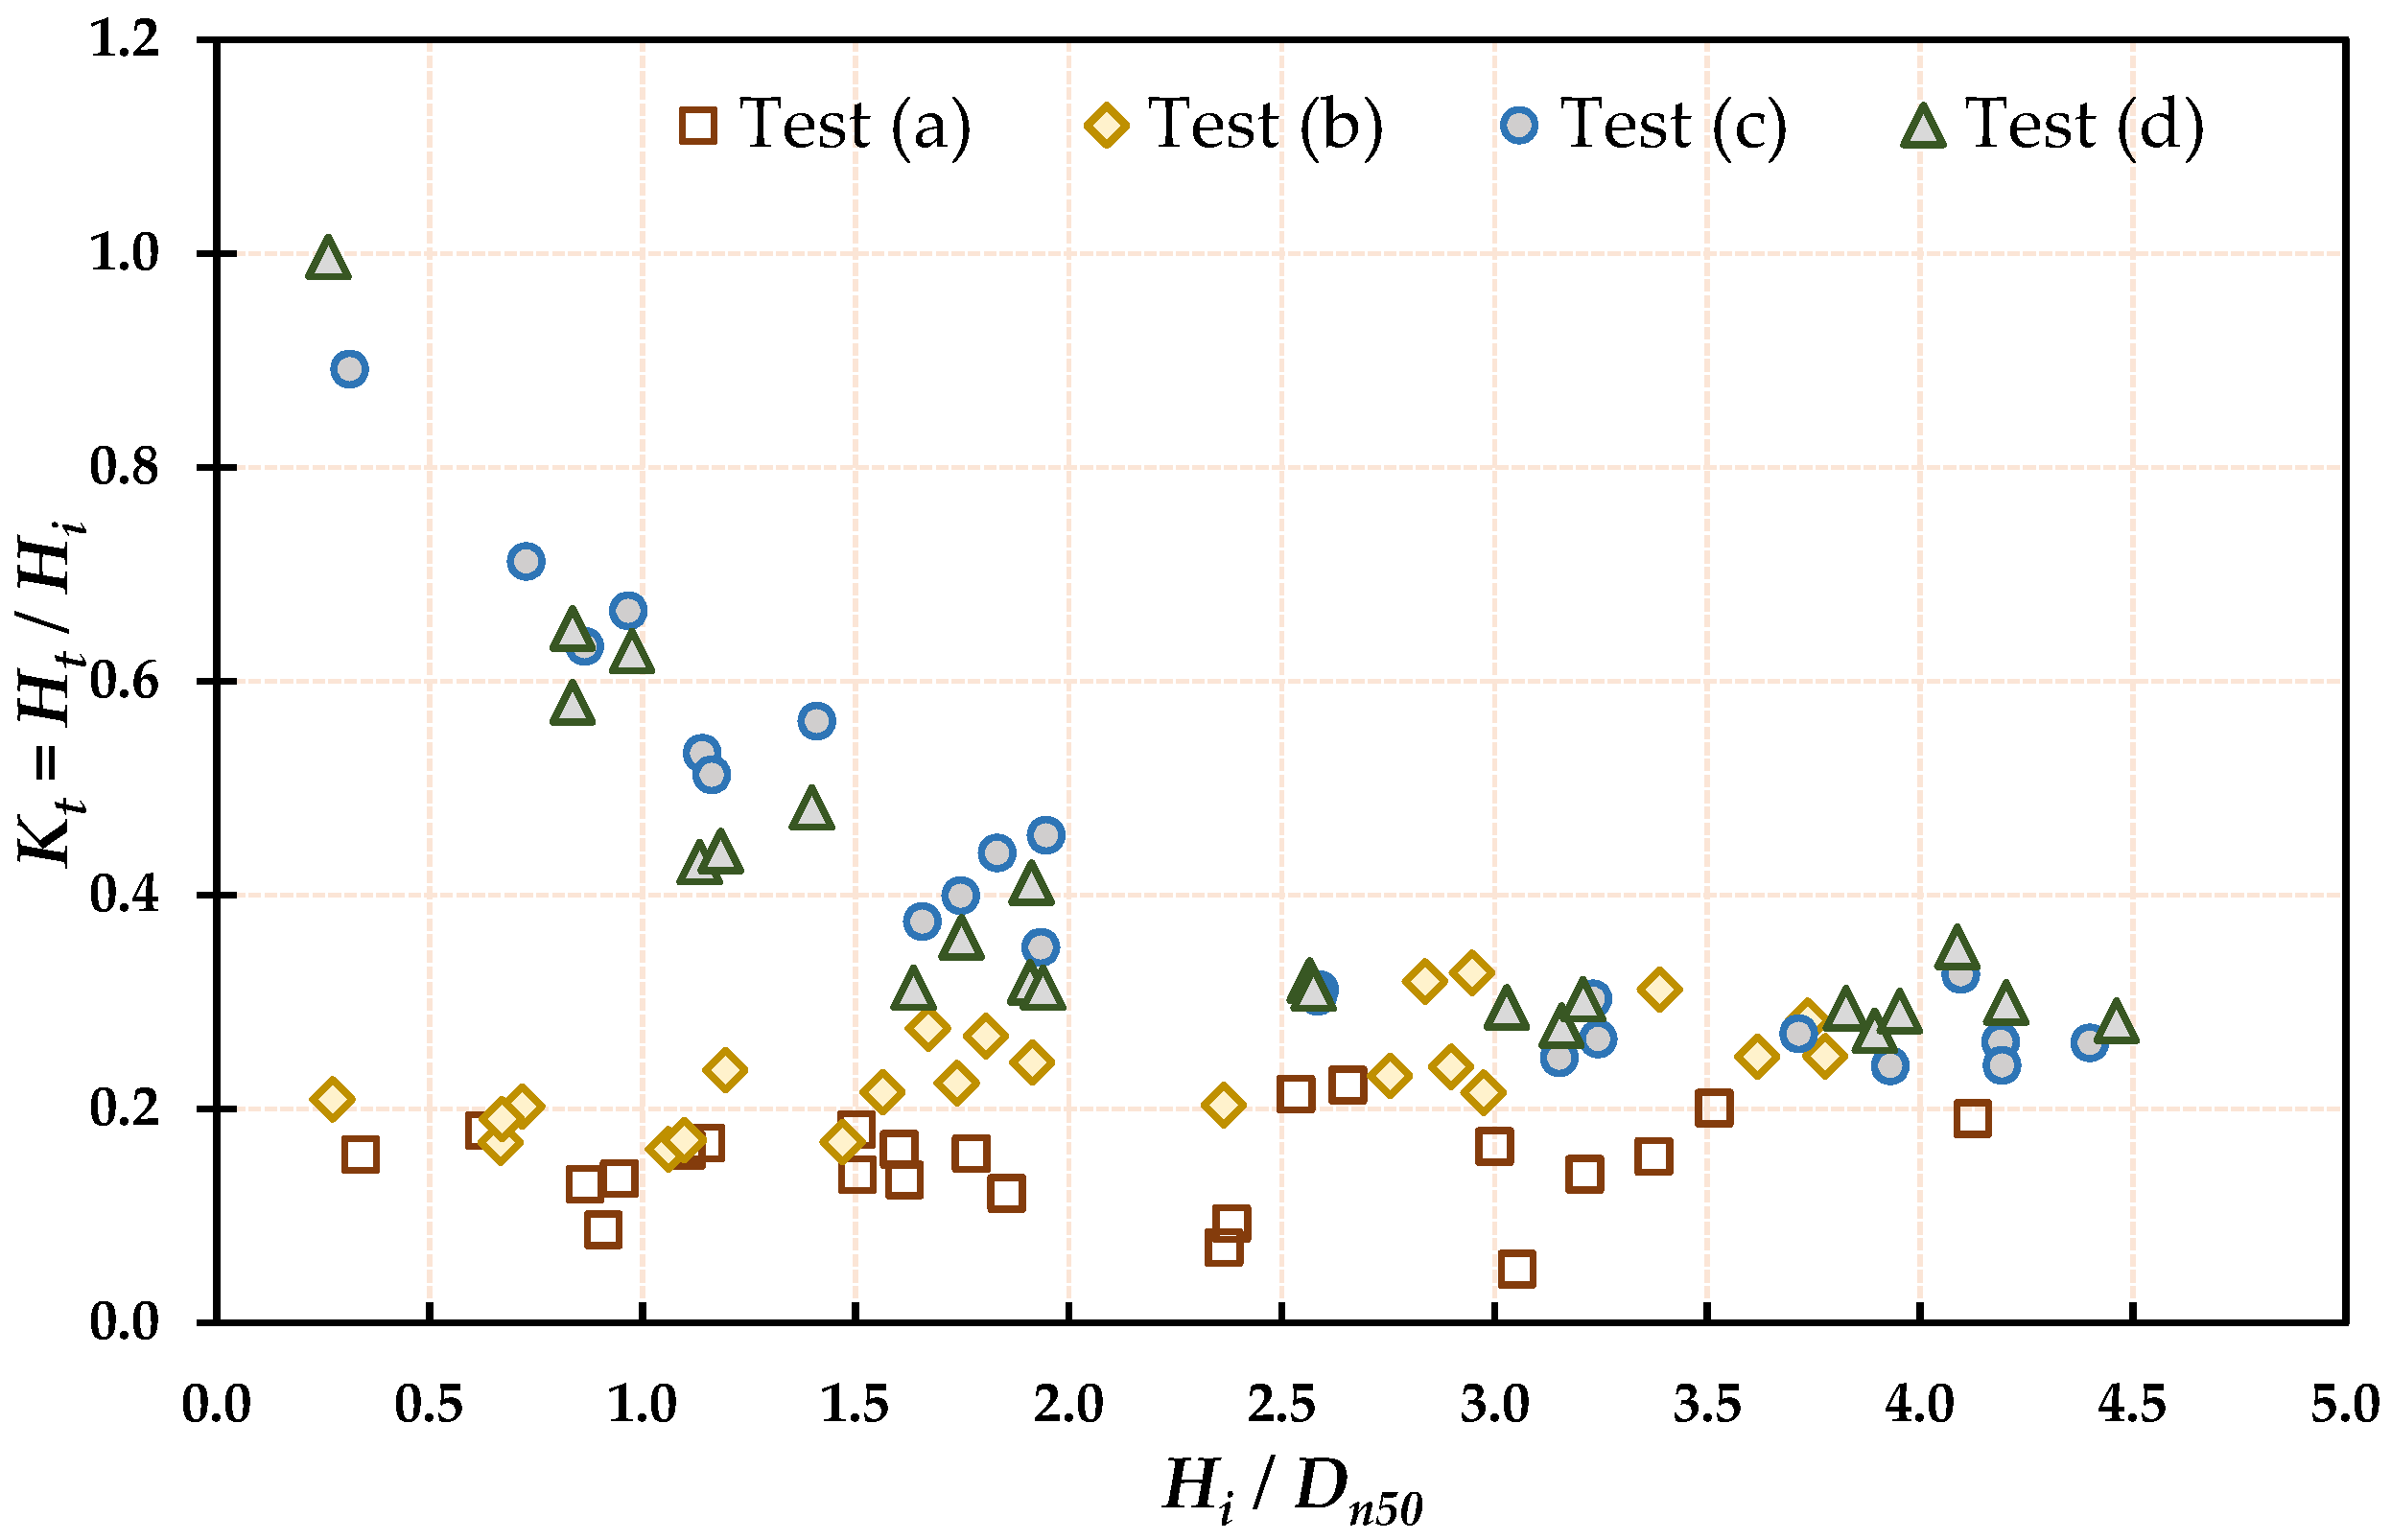
3.1.3. Effect of Relative Wave Height () on Wave Transmission Coefficient ()
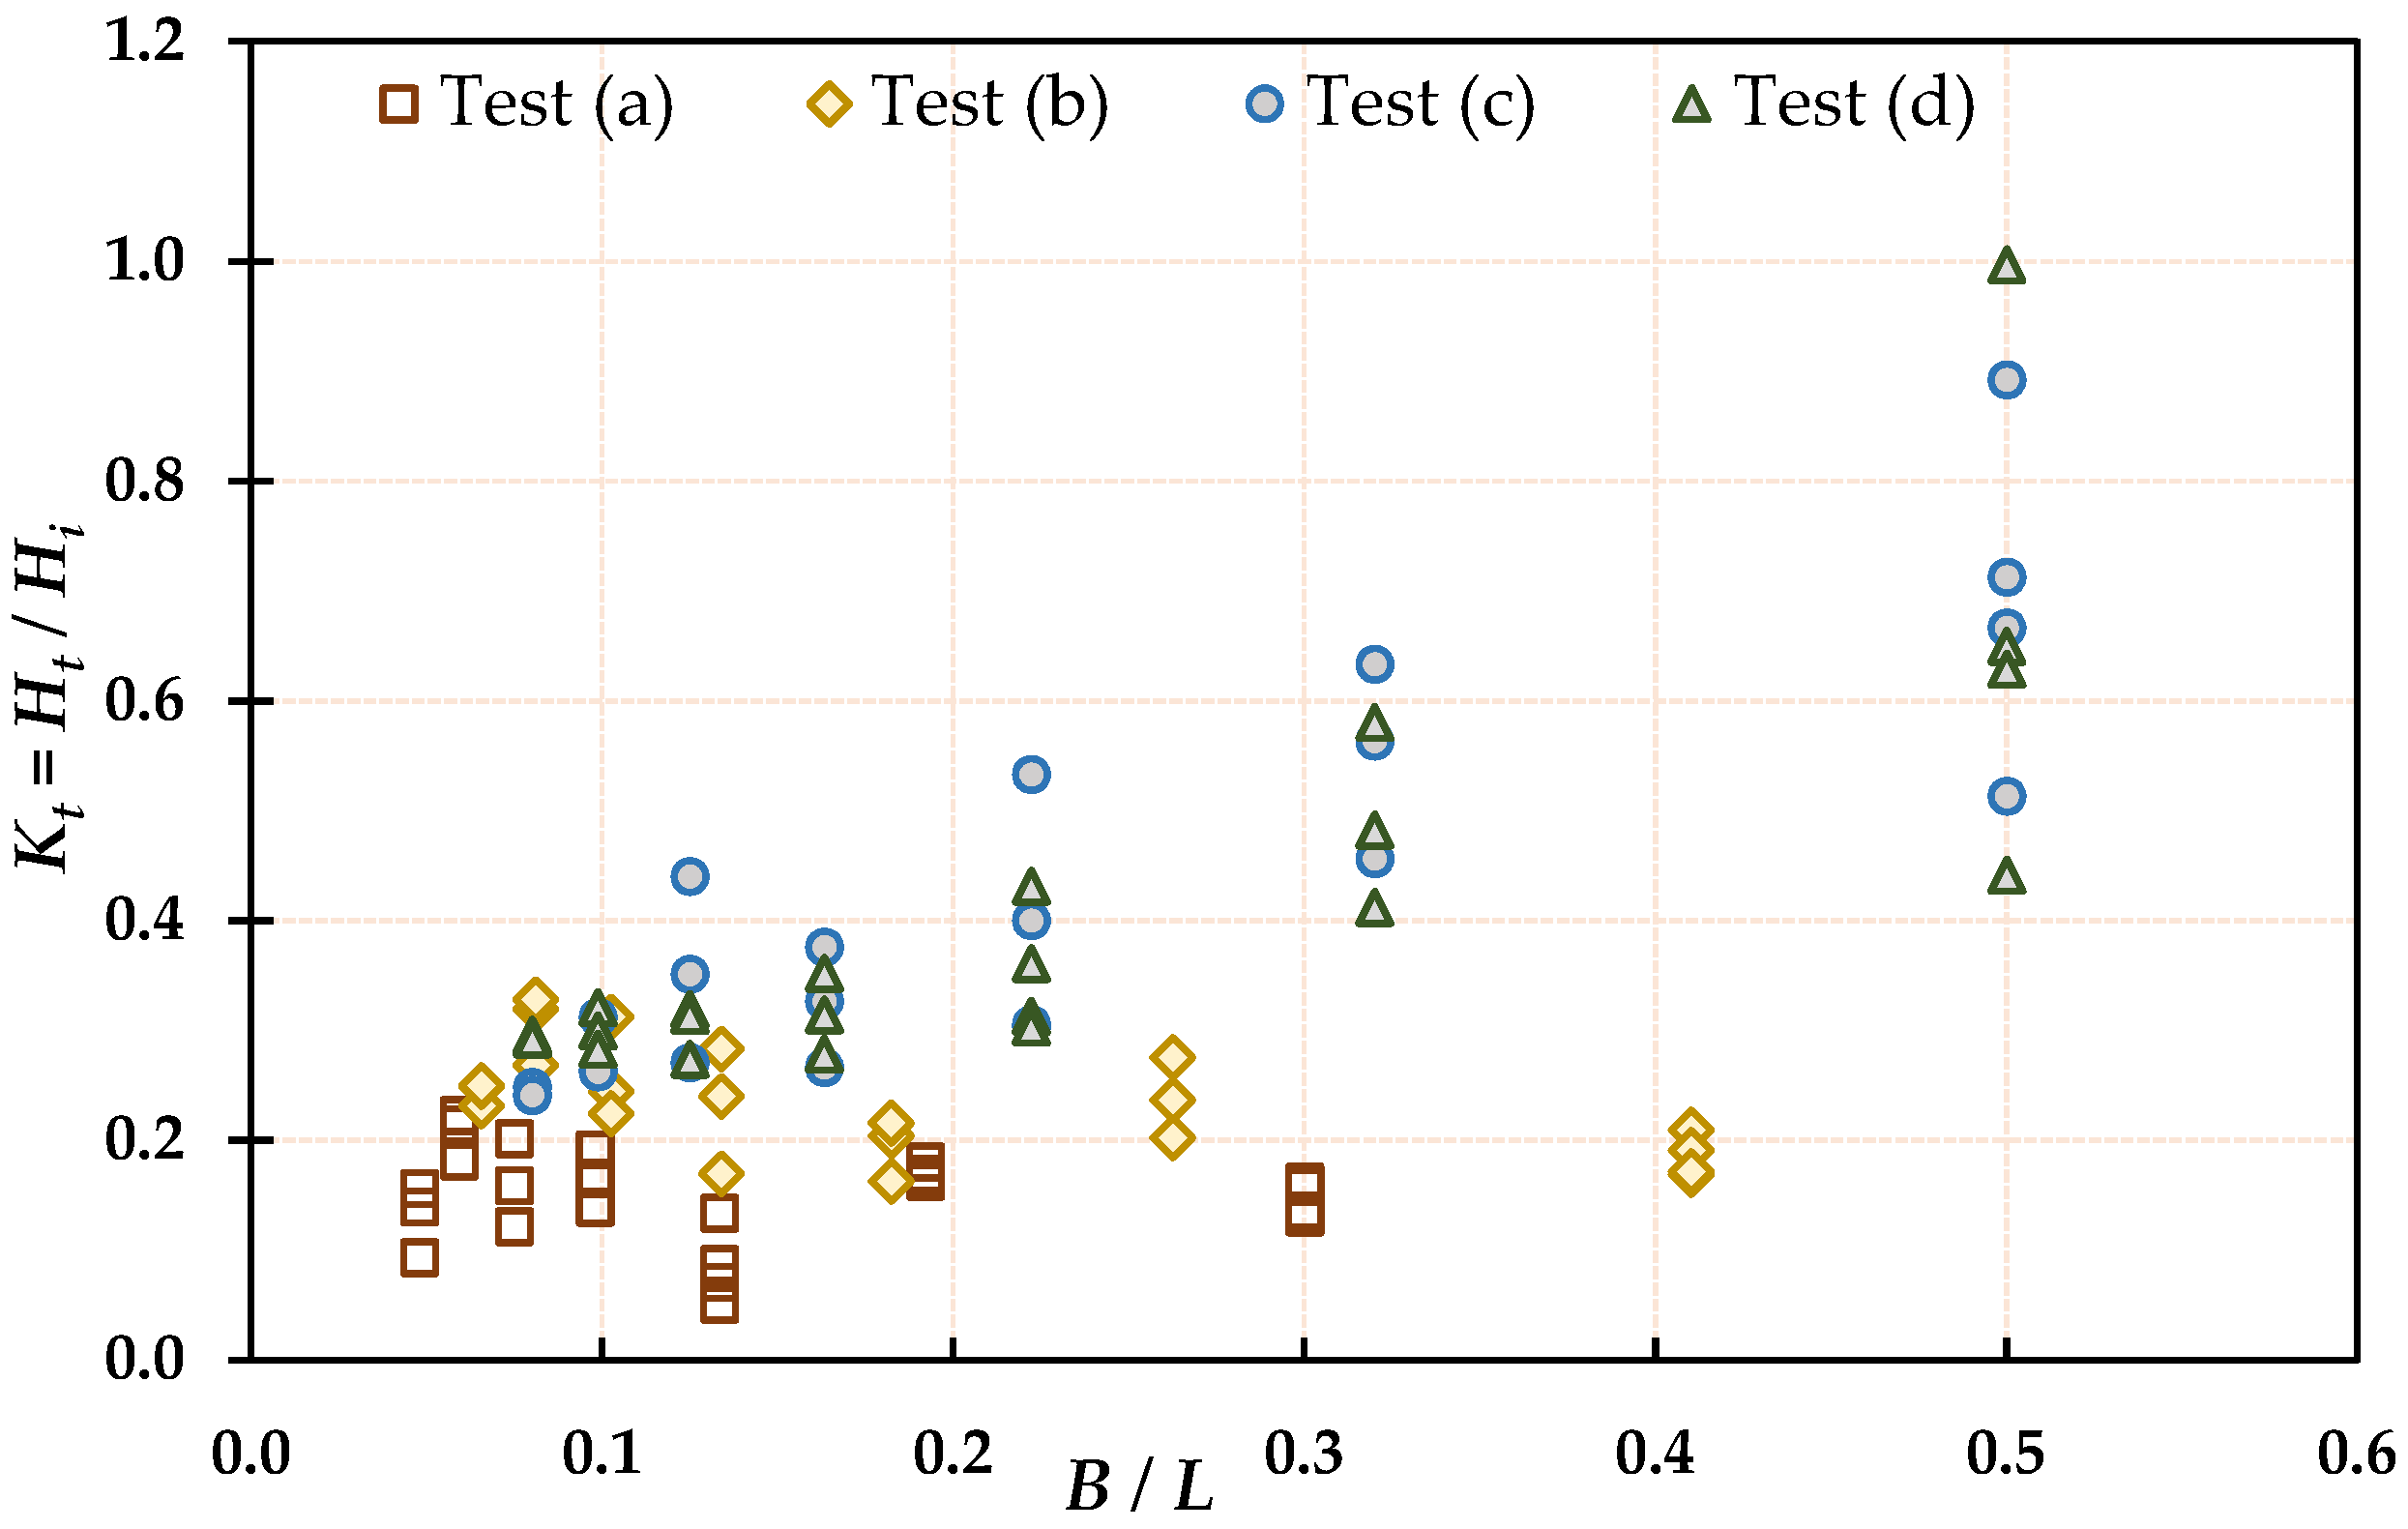
3.1.4. Effect of Relative Crest Width () on Wave Transmission Coefficient ()
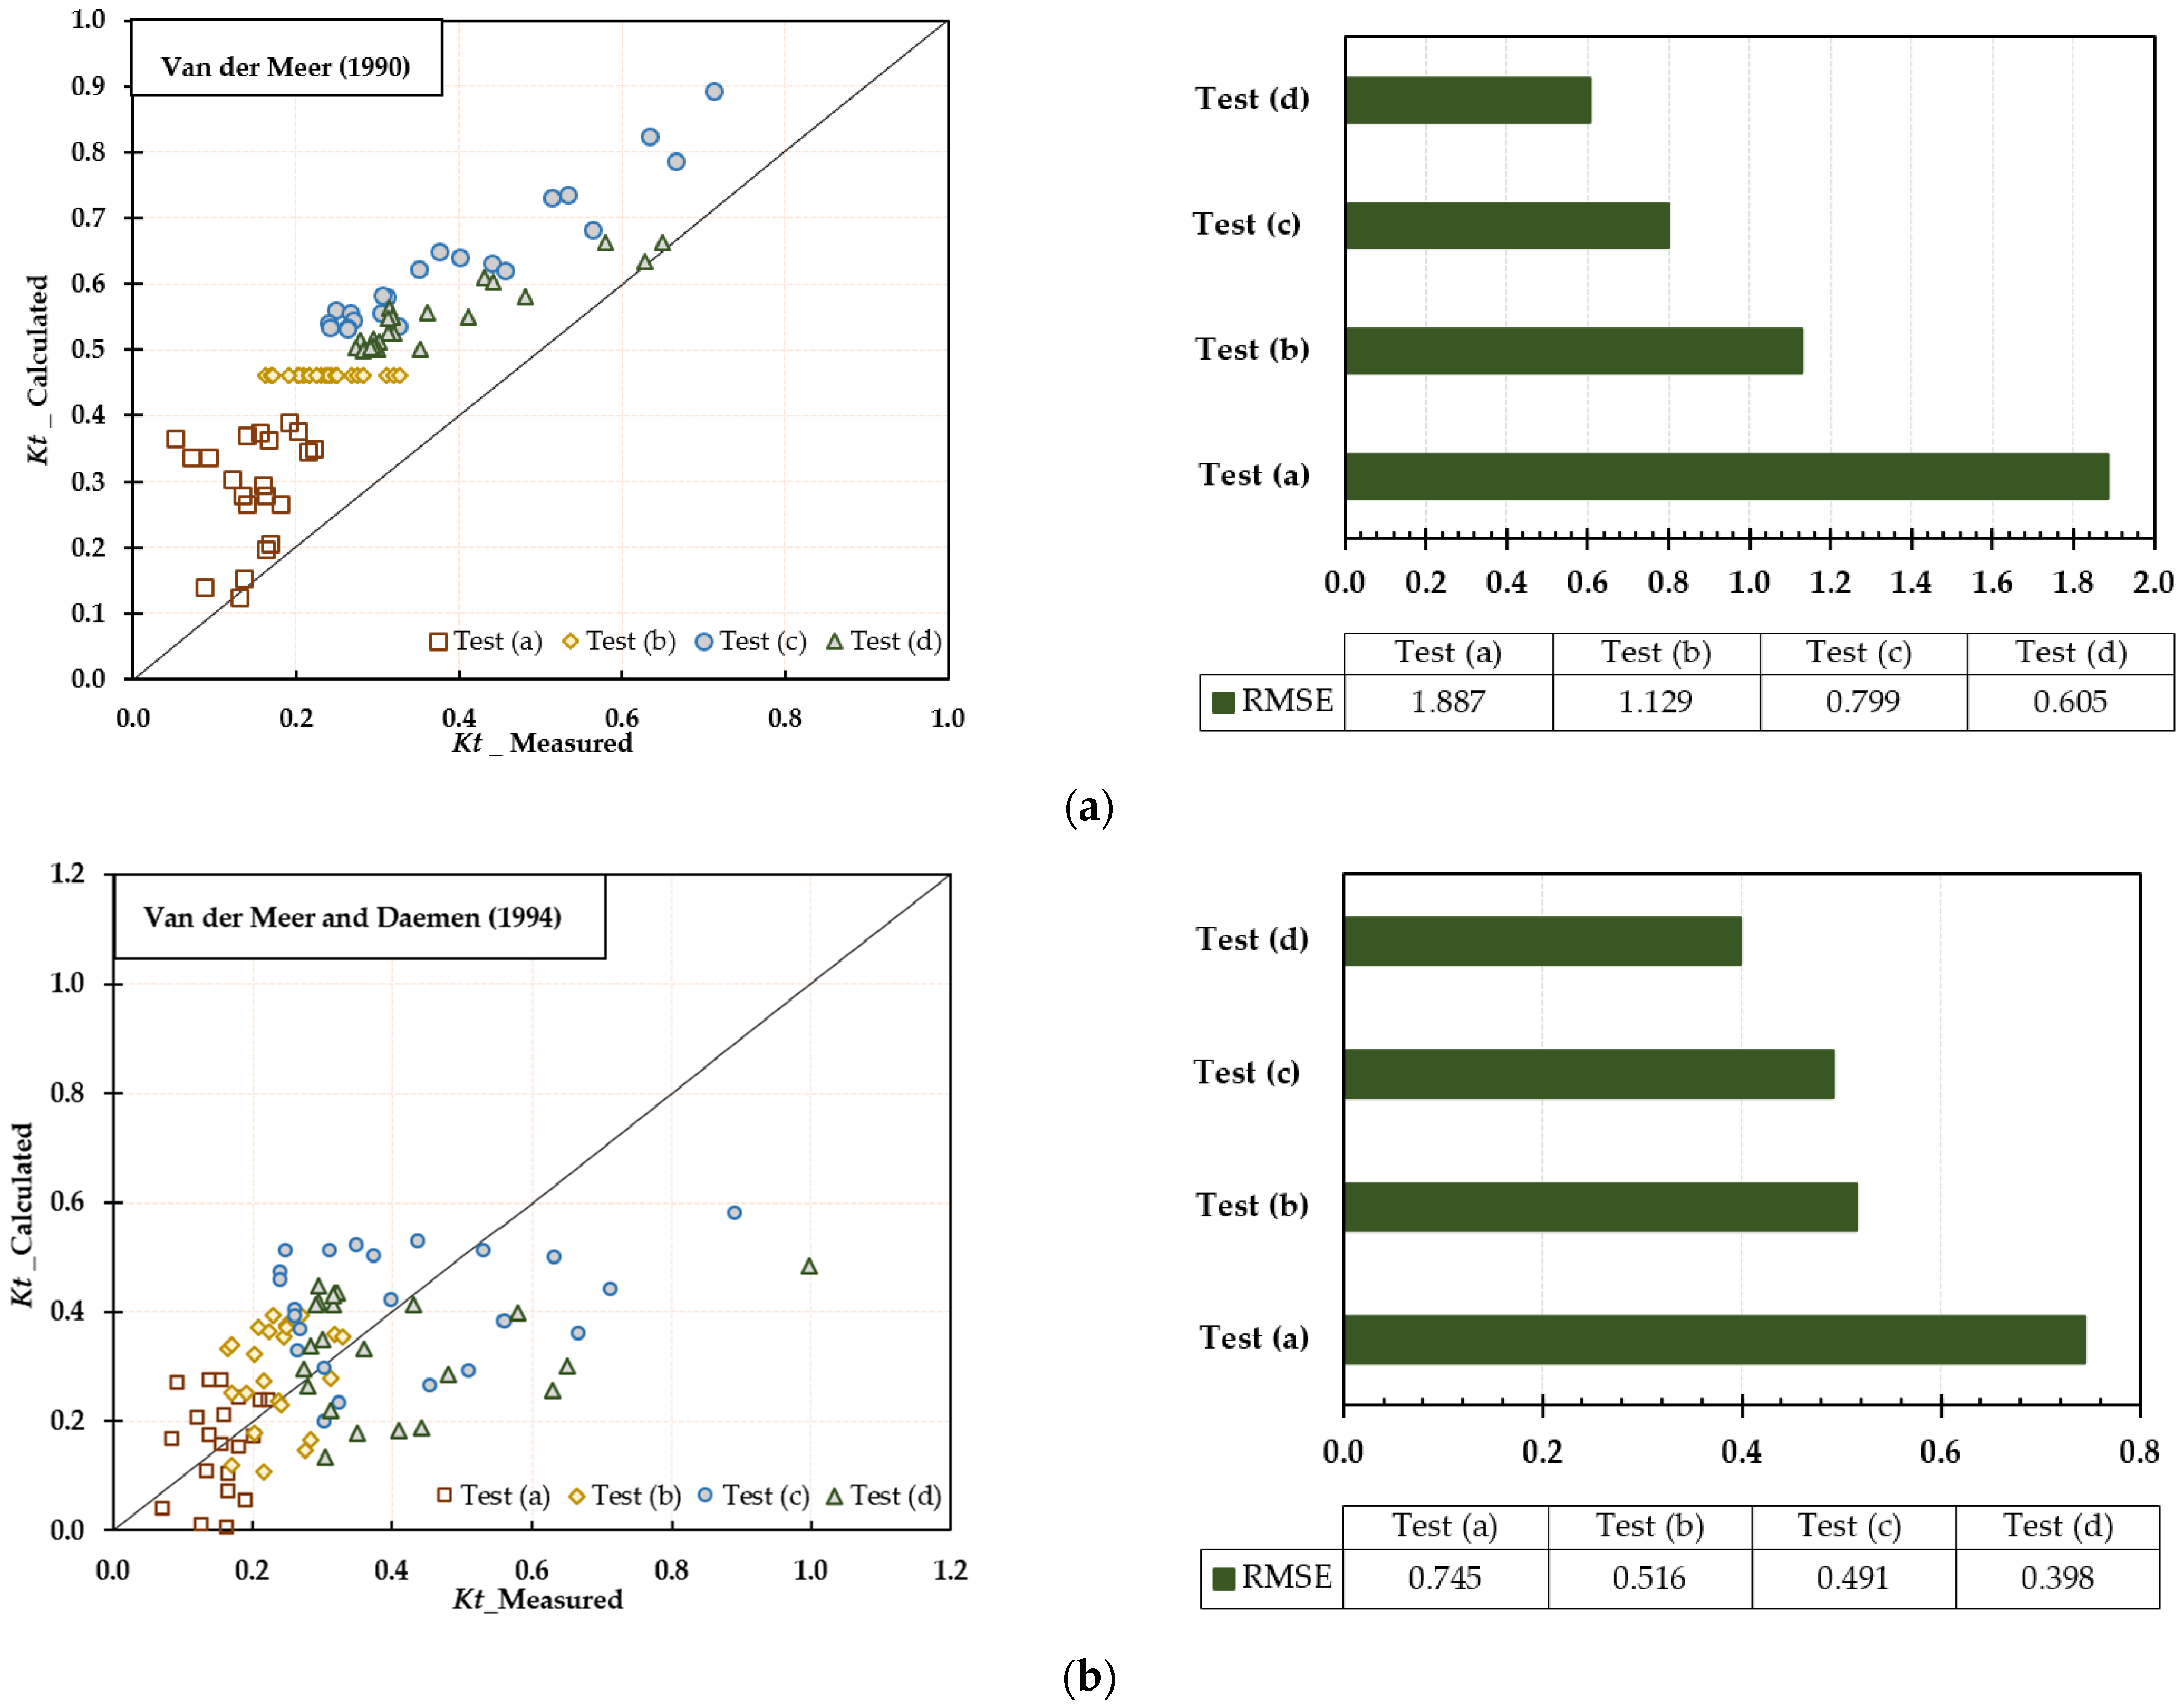
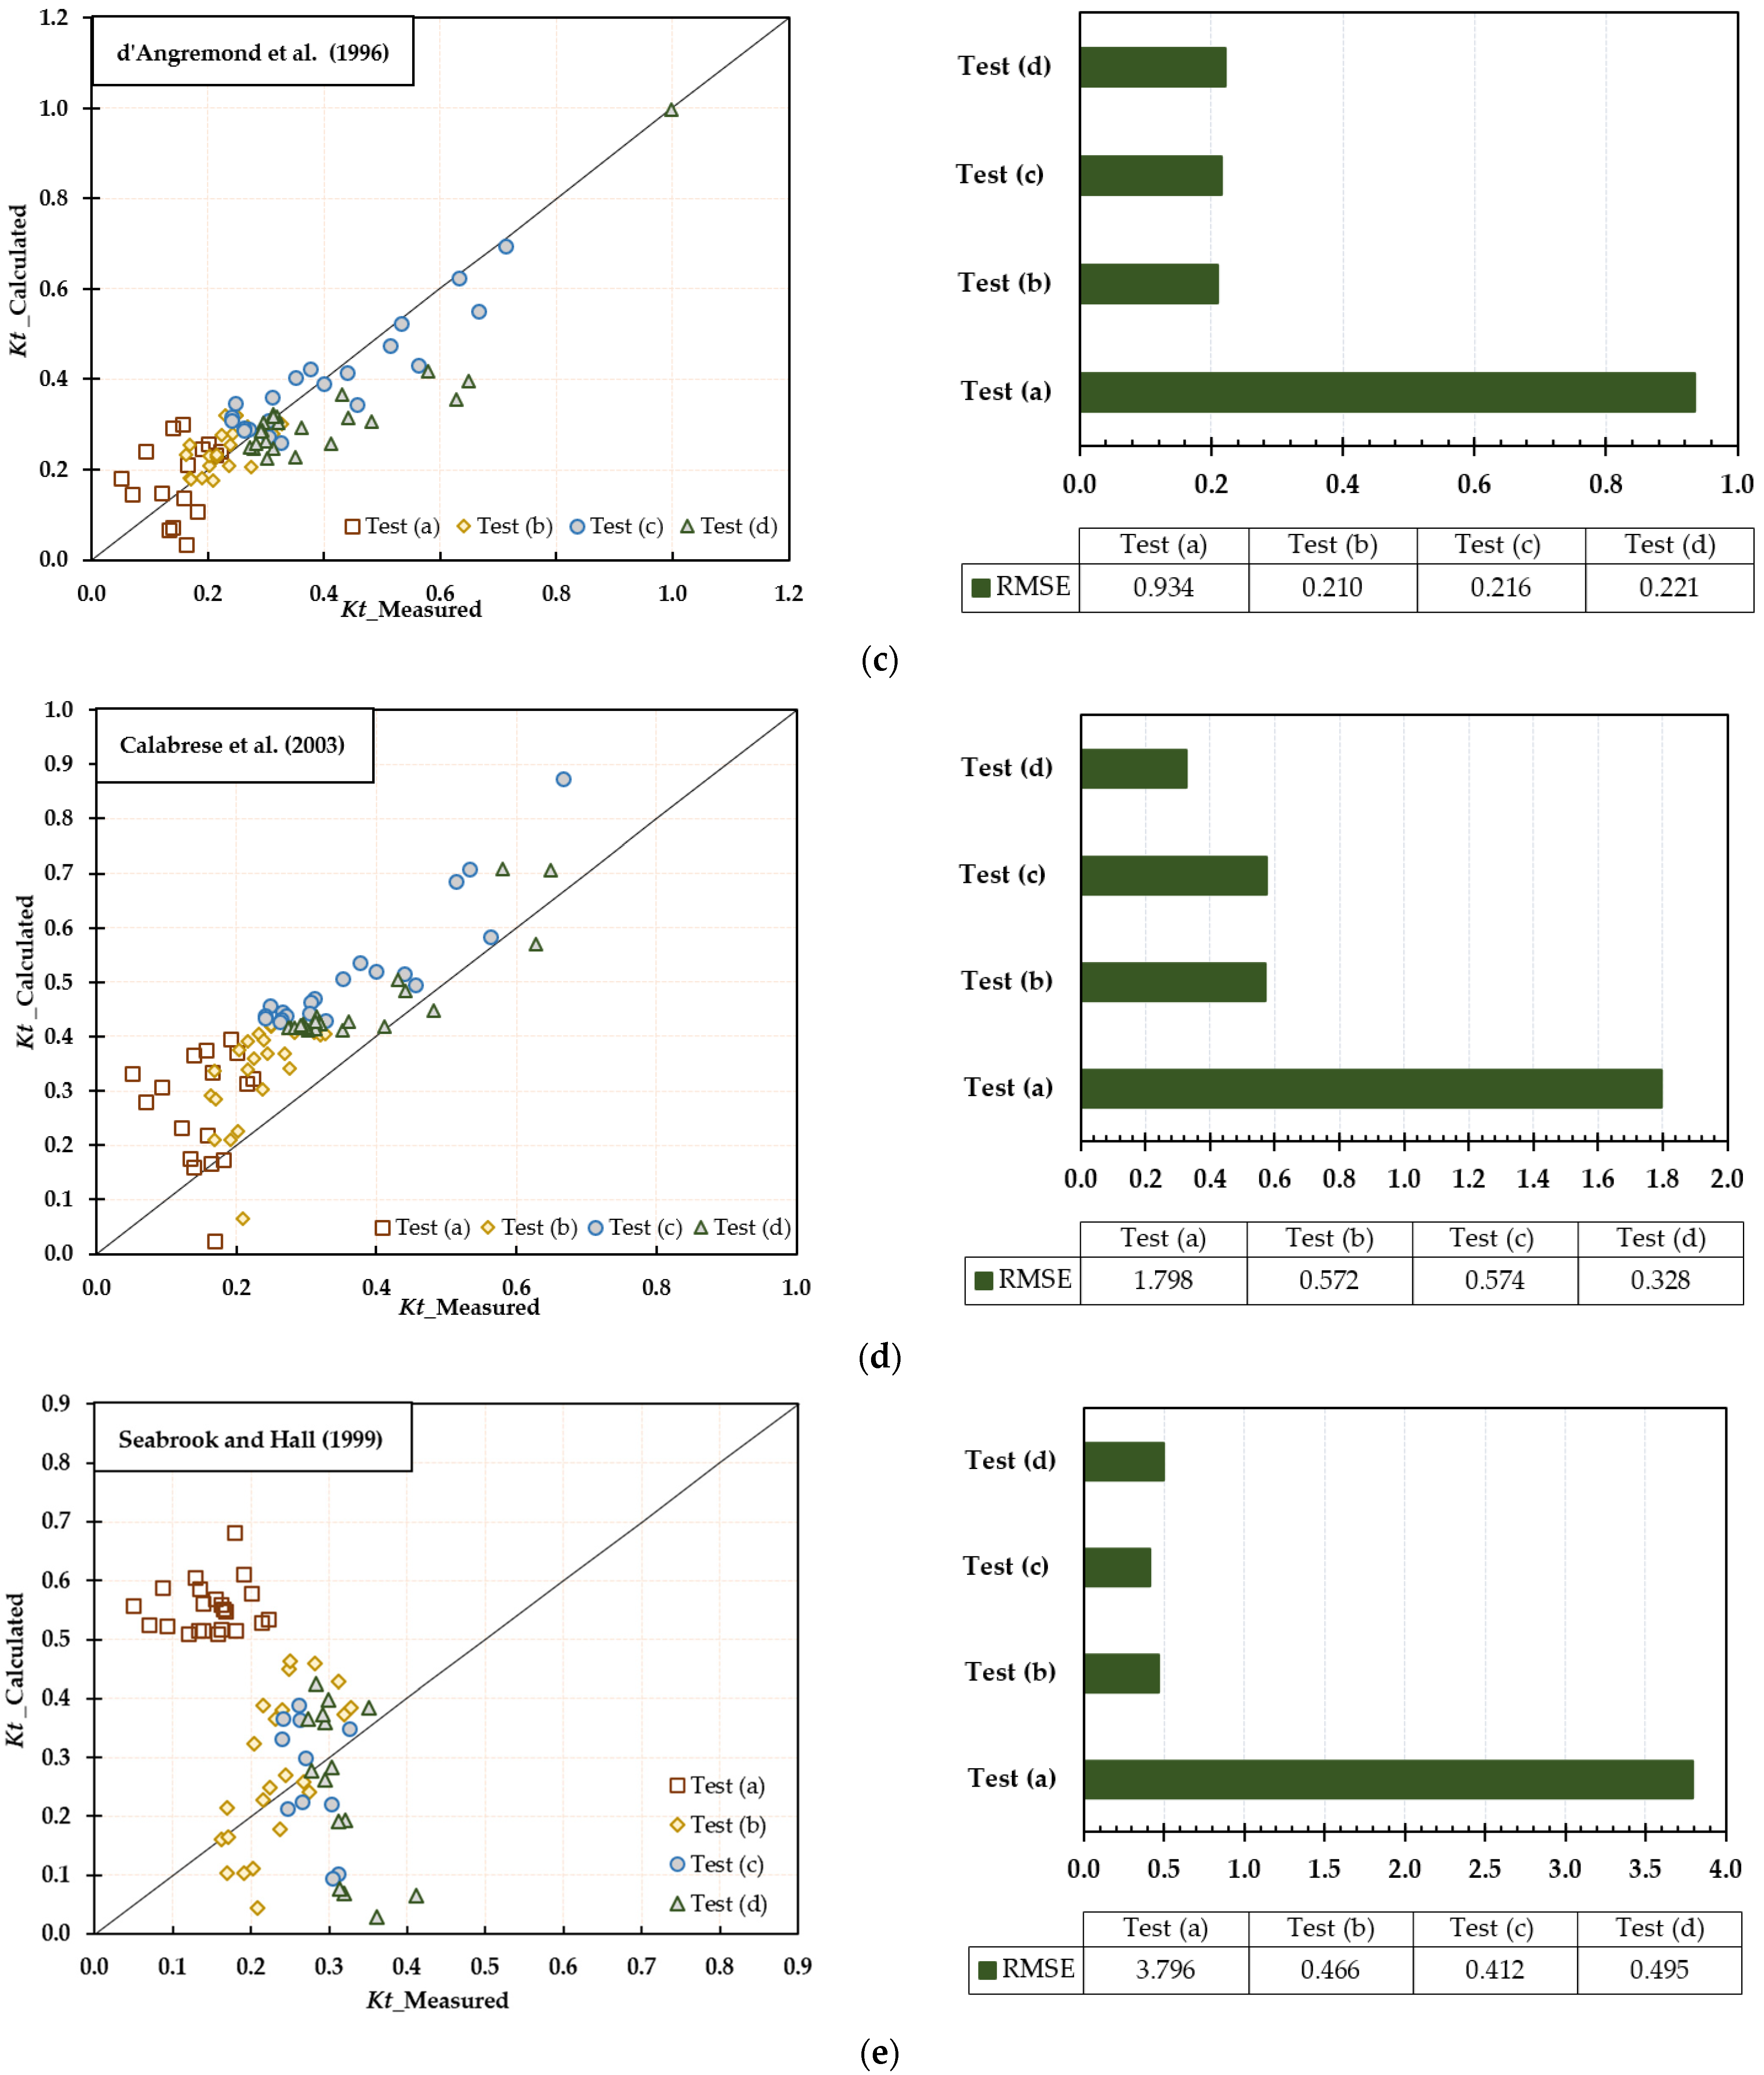
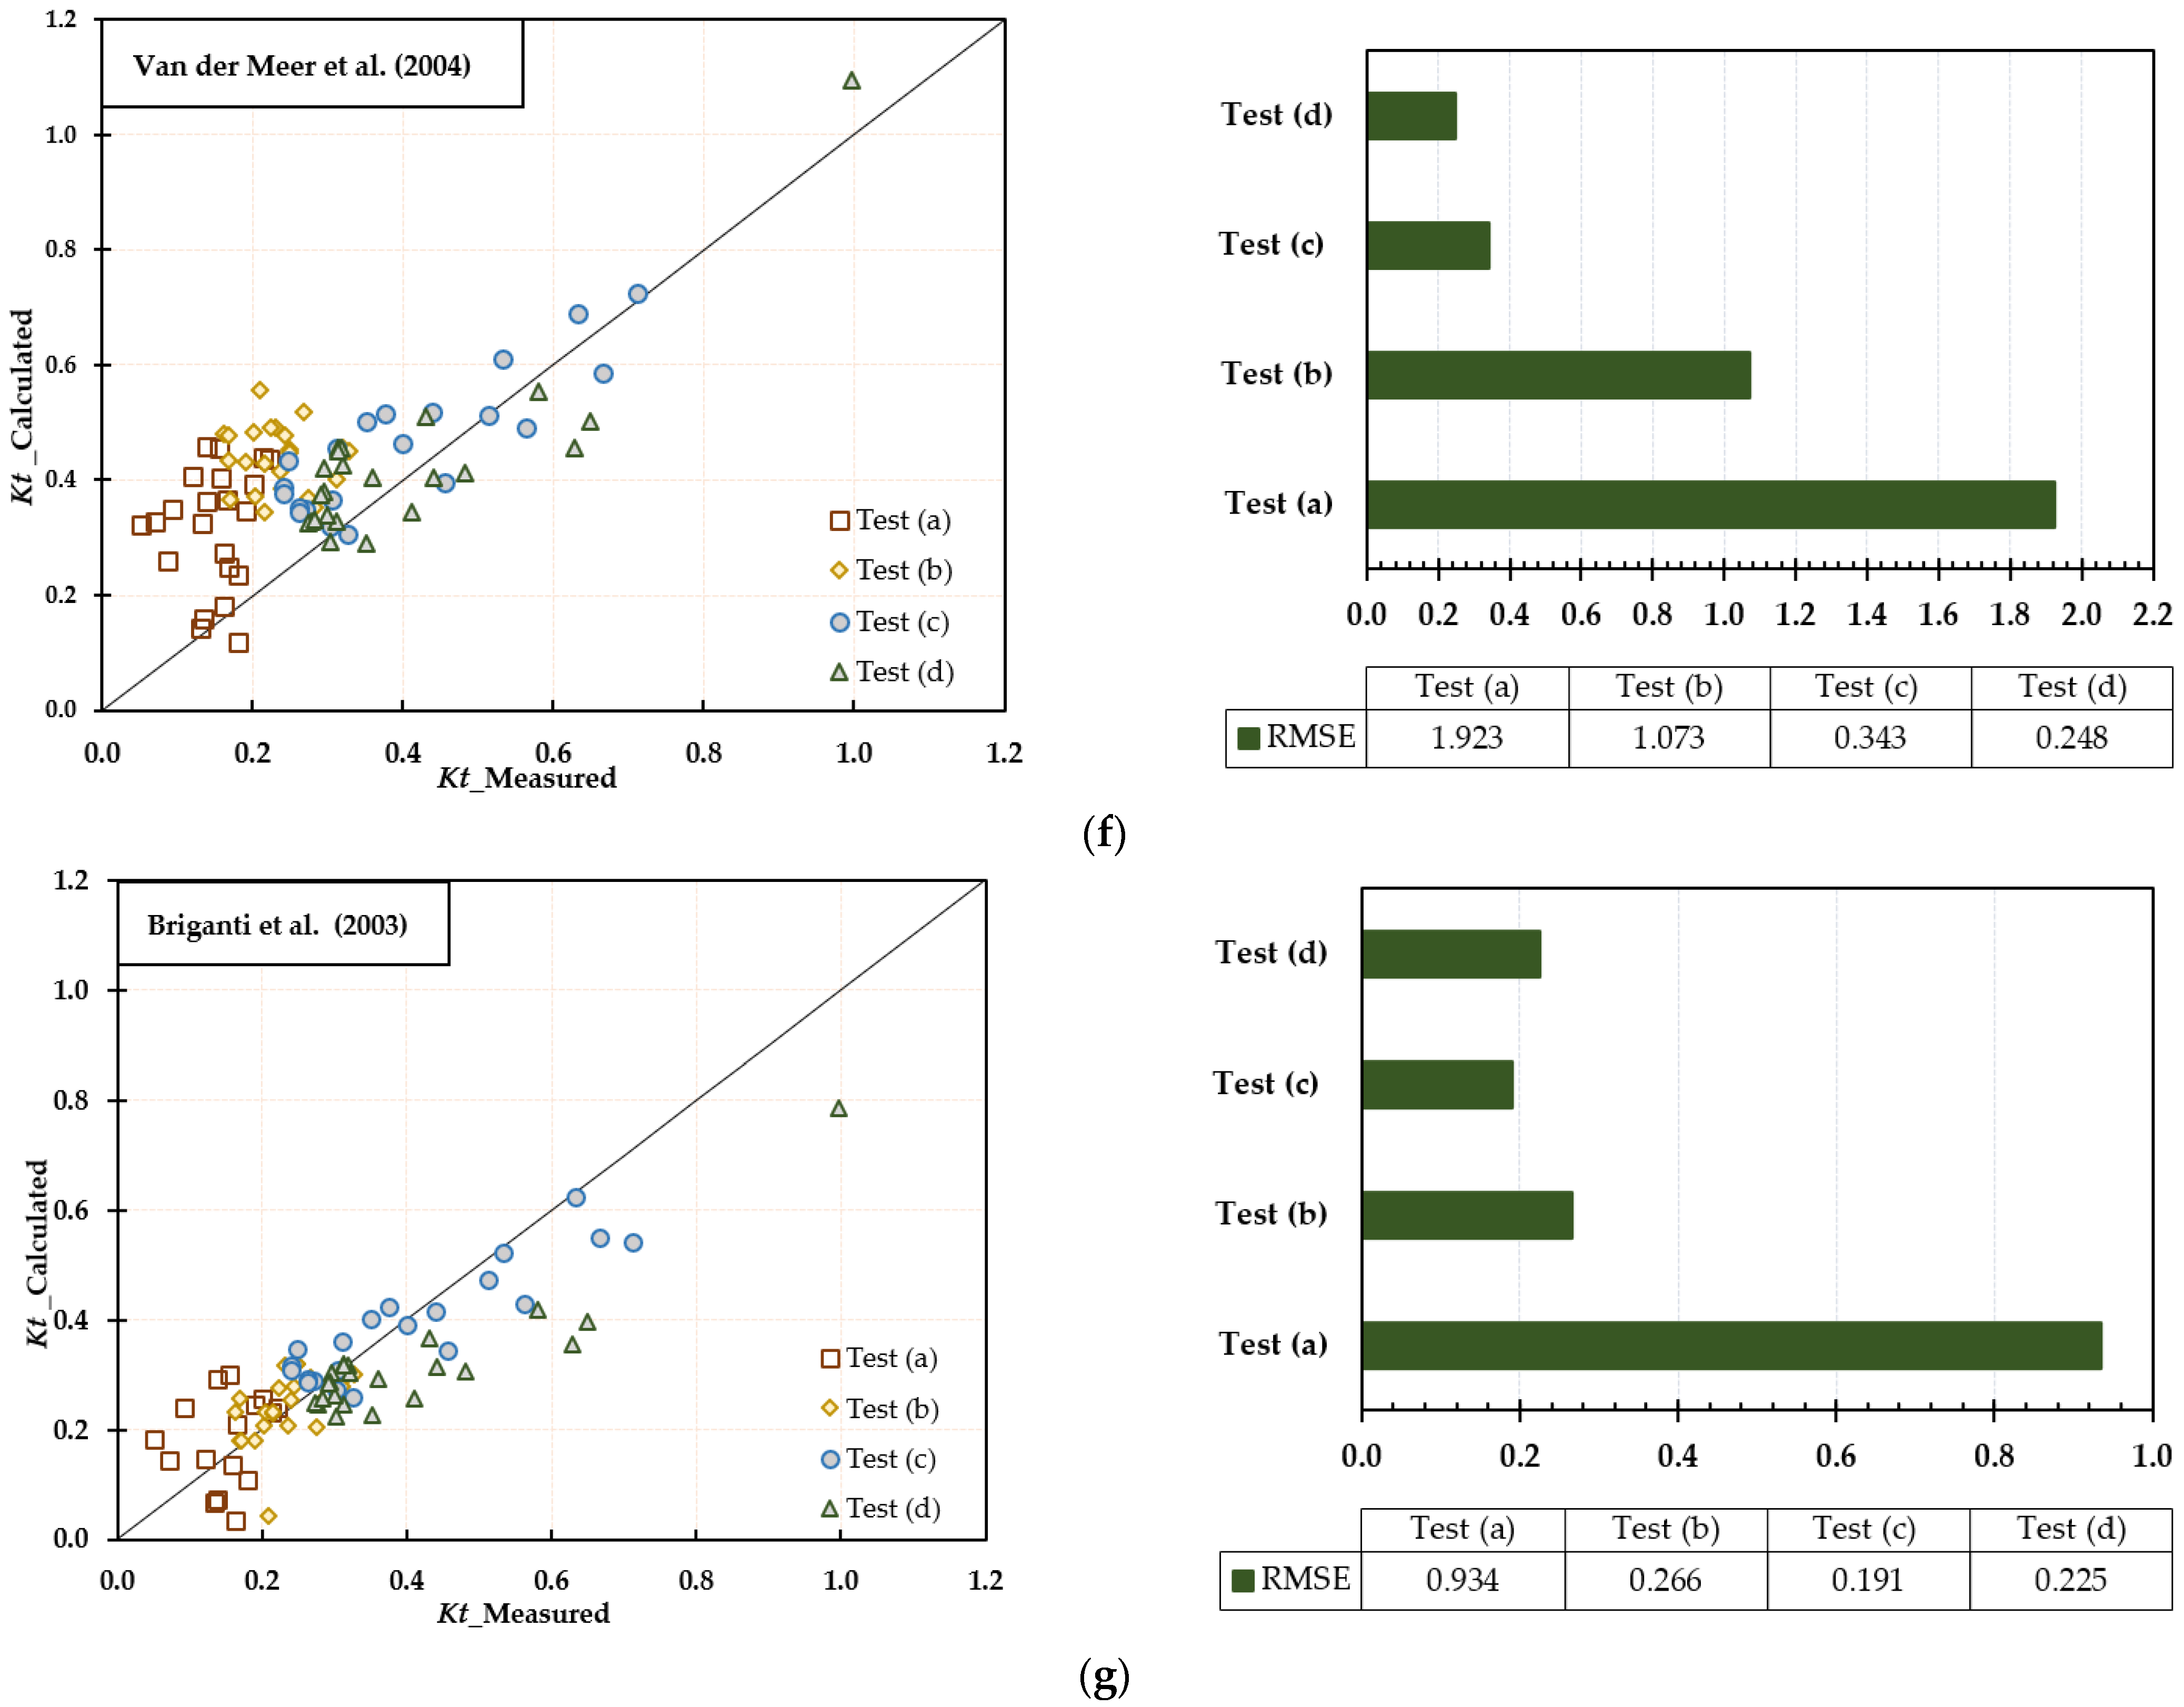
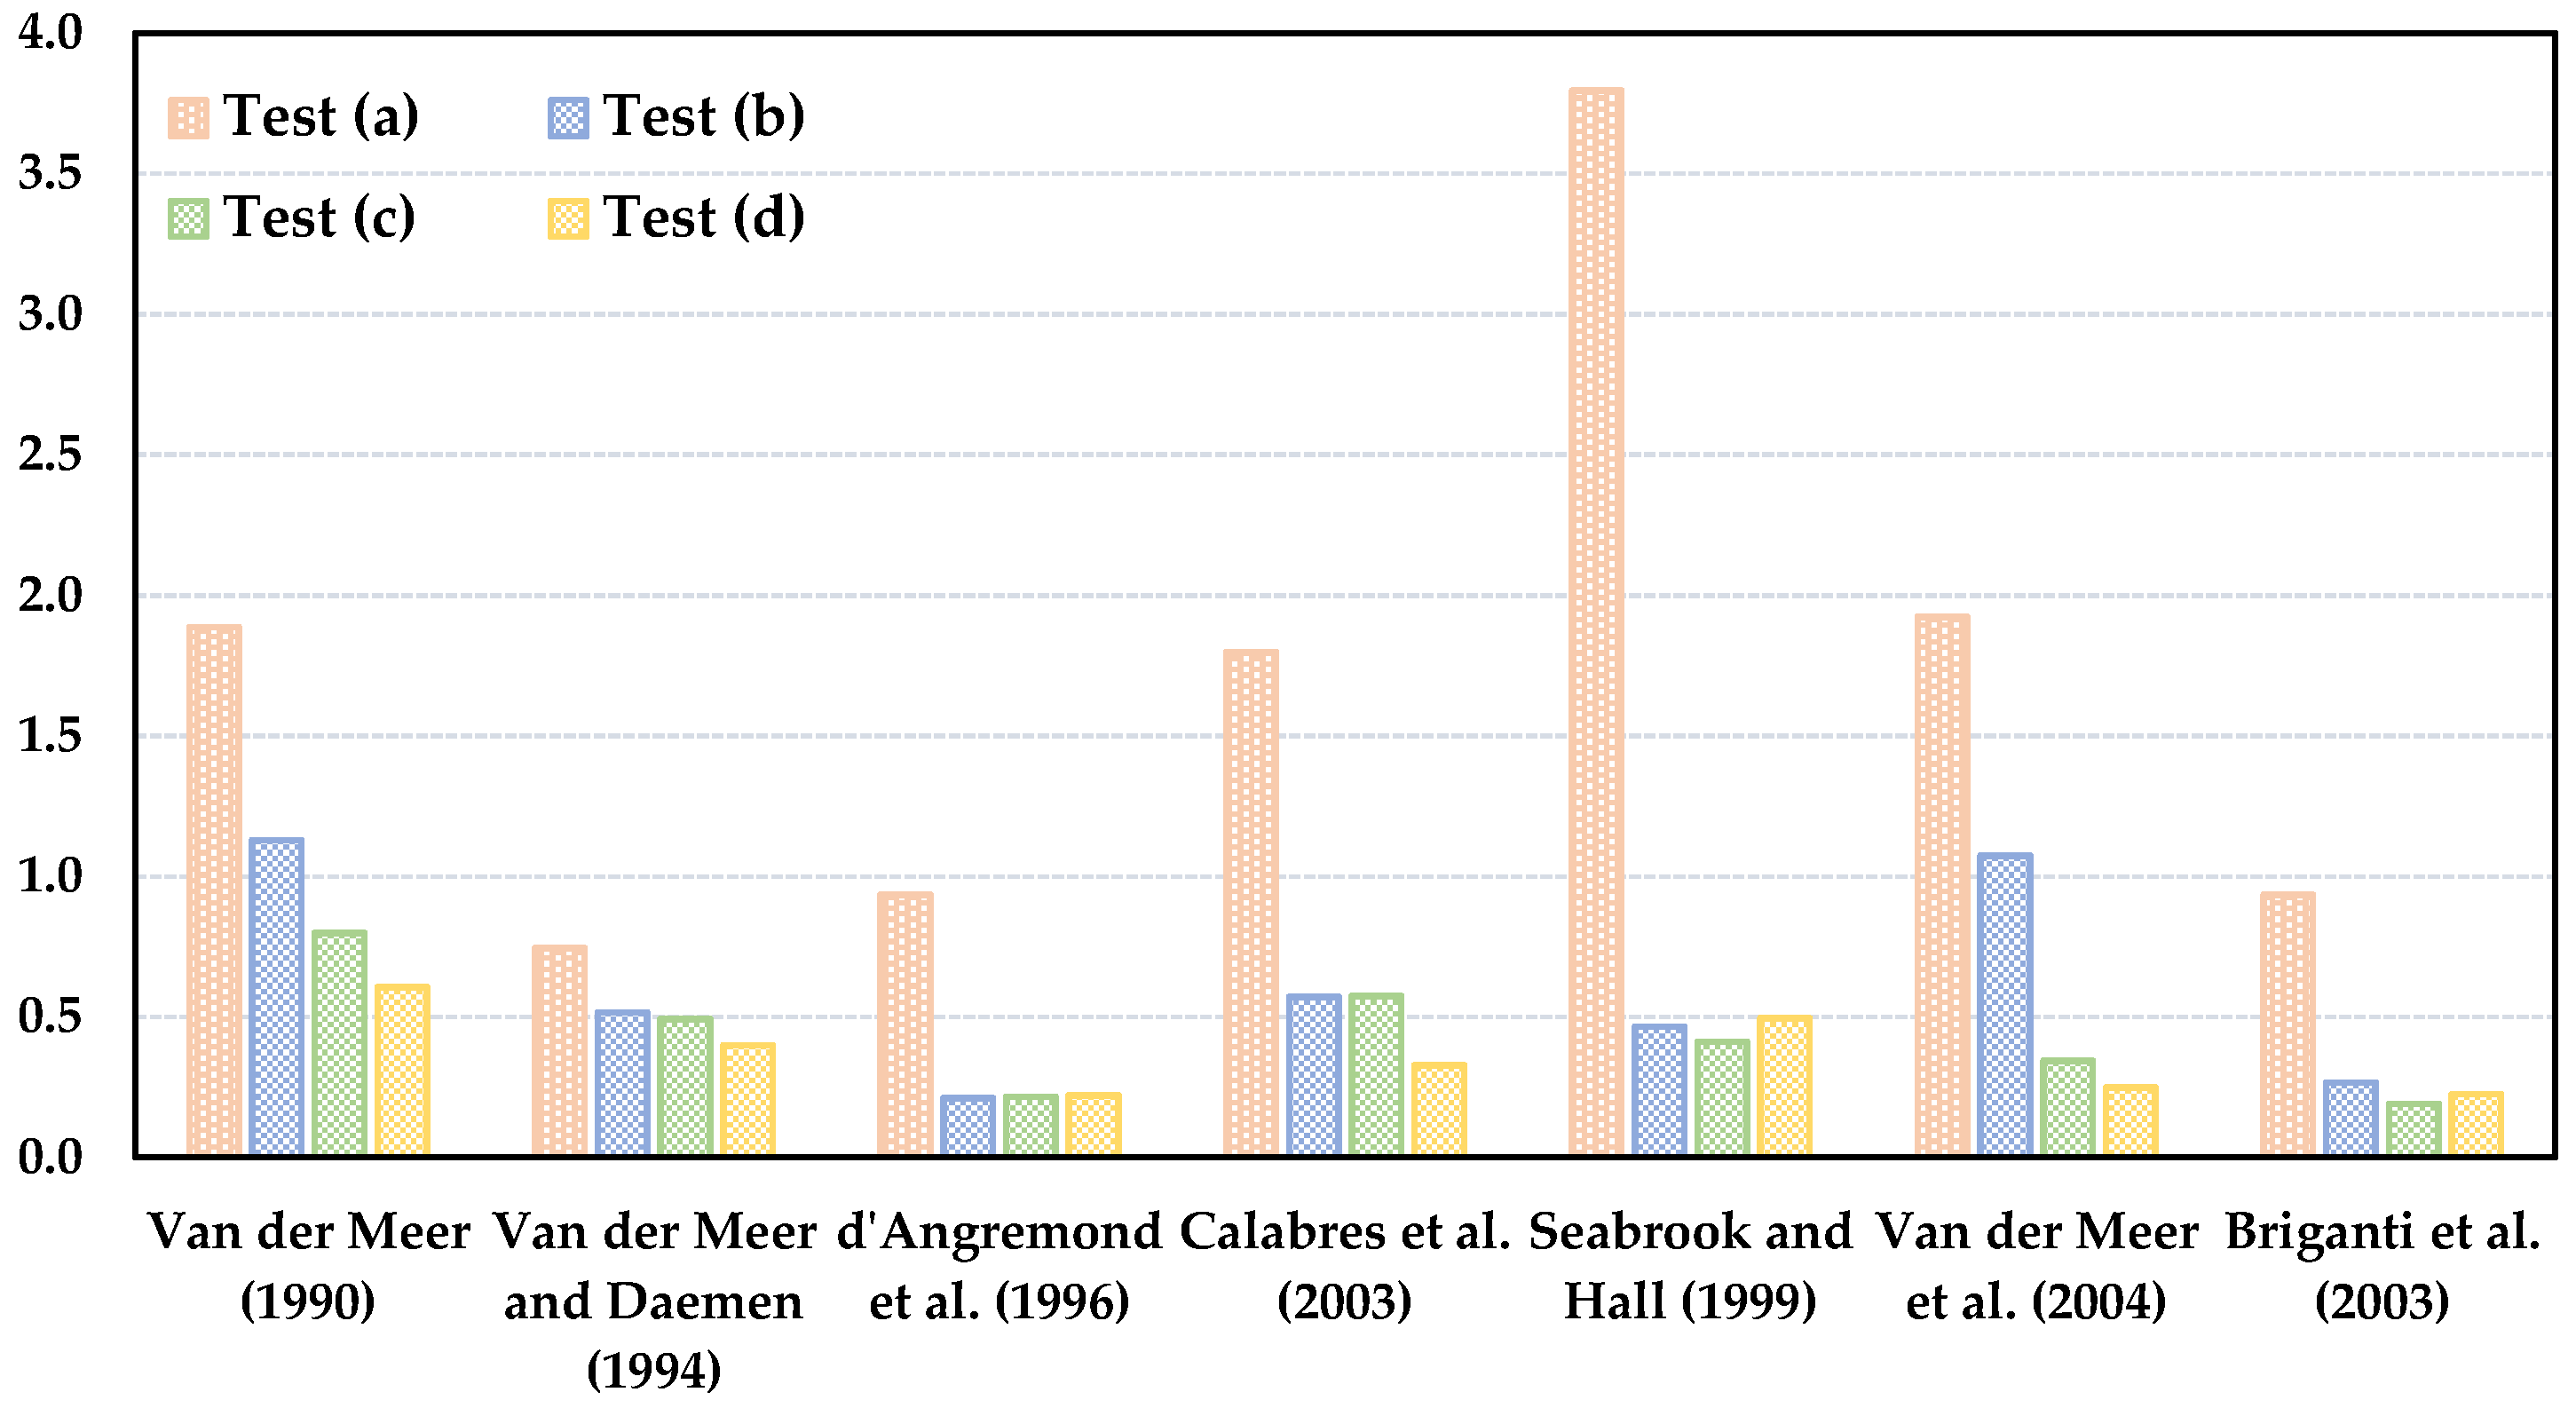
3.2. Literature Formulae Performance
4. Discussion
4.1. Literature Formulae Comparison
4.2. Additional Considerations
5. Conclusions
Author Contributions
Funding
Data Availability Statement
Acknowledgments
Conflicts of Interest
References
- Elsheikh, A.K.; Mostafa, Y.E.; Mohamed, M.M. A comparative study between some different types of permeable breakwaters according to wave energy dissipation. Ain Shams Eng. J. 2021, 13, 101646. [Google Scholar] [CrossRef]
- Sorensen, R.M. Wave Refraction, Diffraction, and Reflection. In Basic Coastal Engineering; Springer: Boston, MA, USA, 2006; pp. 79–111. [Google Scholar]
- Prasetya, G. Protection from Coastal Erosion. Thematic Paper: The Role of Coastal Forests and Trees in Protecting against Coastal Erosion; RAP Publication (FAO): Rome, Italy, 2007. [Google Scholar]
- Center, C.E.R. Shore Protection Manual; Department of the Army, Waterways Experiment Station, Corps of Engineers: Washington, DC, USA, 1984; Volume 1. [Google Scholar]
- BS 6349-1; Maritime Structures. British Standards Institution: Loughborough, UK, 1984.
- Sabatier, F.U.S. Army Corps of Engineers, Coastal Engineering Manual (CEM), Engineer Manual 1110-2-1100; U.S. Army Corps of Engineers: Washington, DC, USA, 2007. [Google Scholar]
- Cappietti, L. Converting emergent breakwaters into submerged breakwaters. J. Coast. Res. 2011, 1, 479–483. [Google Scholar]
- Lorenzoni, C.; Postacchini, M.; Brocchini, M.; Mancinelli, A. Experimental study of the short-term efficiency of different breakwater configurations on beach protection. J. Ocean Eng. Mar. Energy 2016, 2, 195–210. [Google Scholar] [CrossRef]
- Hawkins, S.J.; Burcharth, H.F.; Zanuttigh, B.; Lamberti, A. Environmental Design Guidelines for Low Crested Coastal Structures; Elsevier: Amsterdam, The Netherlands, 2010. [Google Scholar]
- Brancasi, A.; Leone, E.; Francone, A.; Scaravaglione, G.; Tomasicchio, G.R. On Formulae for Wave Transmission at Submerged and Low-Crested Breakwaters. J. Mar. Sci. Eng. 2022, 10, 1986. [Google Scholar] [CrossRef]
- Lamberti, A.; Archetti, R.; Kramer, M.; Paphitis, D.; Mosso, C.; Di Risio, M. European experience of low crested structures for coastal management. Coast. Eng. 2005, 52, 841–866. [Google Scholar] [CrossRef]
- Burcharth, H.F.; Zanuttigh, B.; Andersen, T.L.; Lara, J.L.; Steendam, G.J.; Ruol, P.; Sergent, P.; Ostrowski, R.; Silva, R.; Martinelli, L. Innovative engineering solutions and best practices to mitigate coastal risk. In Coastal Risk Management in a Changing Climate; Elsevier: Amsterdam, The Netherlands, 2015; pp. 55–170. [Google Scholar]
- De Rouck, J.; Van de Walle, B.; Geeraerts, J. Crest level assessment of coastal structures by full scale monitoring, neural network prediction and hazard analysis on permissible wave overtopping. In Proceedings of the European Conference on Marine Science & Ocean Technology, Galway, Ireland, 10–13 May 2004; p. 261. [Google Scholar]
- Lokesha; Kerpen, N.; Sannasiraj, S.; Sundar, V.; Schlurmann, T. Experimental Investigations on Wave Transmission at Submerged Breakwater with Smooth and Stepped Slopes. Procedia Eng. 2015, 116, 713–719. [Google Scholar] [CrossRef]
- Calabrese, M.; Vicinanza, D.; Buccino, M. 2D wave set up behind low crested and submerged breakwaters. In Proceedings of the Thirteenth International Offshore and Polar Engineering Conference, Honolulu, HI, USA, 25–30 May 2003; pp. 2176–2181. [Google Scholar]
- Gao, J.; Ma, X.; Dong, G.; Chen, H.; Liu, Q.; Zang, J. Investigation on the effects of Bragg reflection on harbor oscillations. Coast. Eng. 2021, 170, 103977. [Google Scholar] [CrossRef]
- Sharifahmadian, A. Numerical Models for Submerged Breakwaters: Coastal Hydrodynamics and Morphodynamics; Butterworth-Heinemann: Oxford, UK, 2015. [Google Scholar]
- Gao, J.; Ma, X.; Zang, J.; Dong, G.; Ma, X.; Zhu, Y.; Zhou, L. Numerical investigation of harbor oscillations induced by focused transient wave groups. Coast. Eng. 2020, 158, 103670. [Google Scholar] [CrossRef]
- Vicinanza, D.; Cáceres, I.; Buccino, M.; Gironella, X.; Calabrese, M. Wave disturbance behind low-crested structures: Diffraction and overtopping effects. Coast. Eng. 2009, 56, 1173–1185. [Google Scholar] [CrossRef]
- van der Meer, J.W.; Briganti, R.; Zanuttigh, B.; Wang, B. Wave transmission and reflection at low-crested structures: Design formulae, oblique wave attack and spectral change. Coast. Eng. 2005, 52, 915–929. [Google Scholar] [CrossRef]
- van der Meer, J.W. Data on Wave Transmission Due to Overtopping; Delft Hydraulics: Delft, The Netherlands, 1990. [Google Scholar]
- van der Meer, J.W.; Daemen, I.F. Stability and wave transmission at low-crested rubble-mound structures. J. Waterw. Port Coast. Ocean. Eng. 1994, 120, 1–19. [Google Scholar] [CrossRef]
- d’Angremond, K.; Van Der Meer, J.W.; De Jong, R.J. Wave transmission at low-crested structures. In Coastal Engineering 1996; ASCE: Reston, VA, USA, 1997; pp. 2418–2427. [Google Scholar]
- Seabrook, S.R.; Hall, K.R. Wave transmission at submerged rubblemound breakwaters. In Coastal Engineering 1998; ASCE: Reston, VA, USA, 1999; pp. 2000–2013. [Google Scholar]
- CIRIA; CUR; CETMEF. The Rock Manual "The Use of Rock in Hydraulic Engineering", 2nd ed.; C683; CIRIA: London, UK, 2007. [Google Scholar]
- Holthuijsen, L.; Booij, N.; Herbers, T. A prediction model for stationary, short-crested waves in shallow water with ambient currents. Coast. Eng. 1989, 13, 23–54. [Google Scholar] [CrossRef]
- Verhagen, H.J.; van Vledder, G.; Arab, S.E. A practical method for design of coastal structures in shallow water. In Coastal Engineering 2008: (In 5 Volumes); World Scientific: Singapore, 2008; pp. 2912–2922. [Google Scholar]
- Contestabile, P.; Ferrante, V.; Vicinanza, D. Wave Energy Resource along the Coast of Santa Catarina (Brazil). Energies 2015, 8, 14219–14243. [Google Scholar] [CrossRef]
- EurOtop. Manual on Wave Overtopping of Sea Defences and Related Structures. An Overtopping Manual Largely Based on European Research, but for Worldwide Application. 2018. Available online: www.overtopping-manual.com (accessed on 9 March 2023).
- Calabrese, M.; Vicinanza, D.; Buccino, M. Large-scale experiments on the behaviour of low crested and submerged breakwaters in presence of broken waves. In Coastal Engineering 2002: Solving Coastal Conundrums; World Scientific: Singapore, 2003; pp. 1900–1912. [Google Scholar]
- Hirose, N.; Watanuki, A.; Saito, M. New type units for artificial reef development of eco-friendly artificial reefs and the effectiveness thereof. In Proceedings of the 30th PIANC-AIPCN Congress, Sydney, NSW, Australia, 1 January 2002; Institution of Engineers: Sydney, NSW, Australia. [Google Scholar]
- Melito, I.; Melby, J.A. Wave runup, transmission, and reflection for structures armored with CORE-LOC®. Coast. Eng. 2002, 45, 33–52. [Google Scholar] [CrossRef]
- Briganti, R.; Van Der Meer, J.; Buccino, M.; Calabrese, M. Wave transmission behind low-crested structures. In Coastal Structures 2003; ASCE: Reston, VA, USA, 2003; pp. 580–592. [Google Scholar]
- van der Meer, J.W.; Wang, B.; Wolters, A.; Zanuttigh, B.; Kramer, M. Oblique wave transmission over low-crested structures. In Coastal Structures 2003; ASCE: Reston, VA, USA, 2004; pp. 567–579. [Google Scholar]
- Buccino, M.; Calabrese, M. Conceptual approach for prediction of wave transmission at low-crested breakwaters. J. Waterw. Port Coast. Ocean. Eng. 2007, 133, 213–224. [Google Scholar] [CrossRef]
- Mansard, E.P.; Funke, E. The measurement of incident and reflected spectra using a least squares method. In Coastal Engineering 1980; ASCE: Reston, VA, USA, 1980; pp. 154–172. [Google Scholar]
- Klopman, G.; van der Meer, J.W. Random wave measurements in front of reflective structures. J. Waterw. Port Coast. Ocean. Eng. 1999, 125, 39–45. [Google Scholar] [CrossRef]
- Pina, G.G.; de Alarcón, J.V.F. Experiments on coastal protection submerged breakwaters: A way to look at the results. In Coastal Engineering 1990; ASCE: Reston, VA, USA, 1990; pp. 1592–1605. [Google Scholar]
- Makris, C.V.; Memos, C.D. Wave transmission over submerged breakwaters: Performance of formulae and models. In Proceedings of the Seventeenth International Offshore and Polar Engineering Conference, Lisbon, Portugal, 1–6 July 2007. [Google Scholar]
- Ward, D.L.; Zhang, J.; Wibner, C.G.; Cinotto, C.M. Wind effects on runup and overtopping of coastal structures. In Coastal Engineering 1996; ASCE: Reston, VA, USA, 1996; pp. 2206–2215. [Google Scholar]
- Murakami, K.; Maki, D.; Ogino, K. Effect of wind velocity on wave overtopping. In Proceedings of the APAC 2019: Proceedings of the 10th International Conference on Asian and Pacific Coasts, Hanoi, Vietnam, 25–28 September 2019; pp. 57–63. [Google Scholar]
- Dimitriadis, P.; Koutsoyiannis, D.; Iliopoulou, T.; Papanicolaou, P. A Global-Scale Investigation of Stochastic Similarities in Marginal Distribution and Dependence Structure of Key Hydrological-Cycle Processes. Hydrology 2021, 8, 59. [Google Scholar] [CrossRef]
- Moschos, E.; Manou, G.; Dimitriadis, P.; Afentoulis, V.; Koutsoyiannis, D.; Tsoukala, V.K. Harnessing wind and wave resources for a Hybrid Renewable Energy System in remote islands: A combined stochastic and deterministic approach. Energy Procedia 2017, 125, 415–424. [Google Scholar] [CrossRef]
- Riefolo, L.; Contestabile, P.; Vicinanza, D. Seiching Induced by Bichromatic and Monochromatic Wave Conditions: Experimental and Numerical Analysis in a Large Wave Flume. J. Mar. Sci. Eng. 2018, 6, 68. [Google Scholar] [CrossRef]
- Contestabile, P.; Crispino, G.; Russo, S.; Gisonni, C.; Cascetta, F.; Vicinanza, D. Crown Wall Modifications as Response to Wave Overtopping under a Future Sea Level Scenario: An Experimental Parametric Study for an Innovative Composite Seawall. Appl. Sci. 2020, 10, 2227. [Google Scholar] [CrossRef]
- van der Meer, J.; Regeling, E.; de Waal, J. Wave transmission: Spectral changes and its effects on run-up and overtopping. In Coastal Engineering 2000; ASCE: Reston, VA, USA, 2000; pp. 2156–2168. [Google Scholar]
- Yamashiro, M.; Yoshida, A.; Irie, I.; Oti, H. Long period oscillation of fluid velocity behind submerged breakwater caused by absorbing wave generator. Proc. Civ. Eng. Ocean. 1999, 15, 83–88. [Google Scholar] [CrossRef]
- Vicinanza, D.; Baldock, T.; Contestabile, P.; Alsina, J.; Cáceres, I.; Brocchini, M.; Conley, D.; Andersen, T.L.; Frigaard, P.; Ciavola, P. Swash zone response under various wave regimes. J. Hydraul. Res. 2011, 49, 55–63. [Google Scholar] [CrossRef]
- Baldock, T.; Alsina, J.; Caceres, I.; Vicinanza, D.; Contestabile, P.; Power, H.; Sanchez-Arcilla, A. Large-scale experiments on beach profile evolution and surf and swash zone sediment transport induced by long waves, wave groups and random waves. Coast. Eng. 2011, 58, 214–227. [Google Scholar] [CrossRef]


| Symbol | Unit | Definitions |
|---|---|---|
| Hi | (m) | Incident significant wave height, preferably Hm0i, at the toe of the breakwater |
| Ht | (m) | Transmitted significant wave height, preferably Hm0t |
| Tp | (s) | Peak wave period |
| Lp | (m) | Deep-water wavelength |
| mo | (m2) | Zeroth-order moment of the wave spectrum |
| Tm−1,0 | (s) | First negative moment of the energy spectrum |
| Tm0,2 | (s) | Zero-crossing period or mean zero-crossing period |
| hs | (m) | Height of the breakwater |
| d | (m) | Water depth at the toe of the breakwater |
| Rc | (m) | Crest freeboard of the breakwater |
| B | (m) | Crest width of the breakwater |
| m | (-) | Seaward slope of the breakwater |
| Sop | (-) | ) |
| ξop | (-) | ) |
| Dn50 | (m) | Nominal diameter of the armour rock |
| Reference | Formulae | Limitations | Type of Structure | Equation No. |
|---|---|---|---|---|
| Van der Meer [21] | for for for | Emerged Submerged | (1) | |
| Van der Meer and Daemen [22] | Emerged Submerged | (2) | ||
| D’Angremond et al. [23] | Emerged Submerged | (3) | ||
| Seabrook and Hall [24] | Submerged | (4) | ||
| Calabrese et al. [30] | Emerged Submerged | (5) | ||
| Briganti et al. [33] | : for : | Emerged Submerged | (6) | |
| Van der Meer et al. [34] | : : | Emerged Submerged | (7) | |
| Buccino & Calabrese [35] | for : for : | Submerged | (8) |
| Models | Wave Type | Measured Incident | Measured Transmitted | |||
|---|---|---|---|---|---|---|
| Hm0-i (m) | Tp0,2-i (s) | Hm0-t (m) | Tp0,2-t (s) | Rc (m) | ||
| Test (a) | Regular | 0.021–0.256 | 0.772–1.698 | 0.003–0.044 | 0.418–1.748 | +0.065 |
| Irregular | 0.068–0.110 | 0.742–1.314 | 0.011–0.017 | 0.664–0.925 | ||
| Test (b) | Regular | 0.017–0.234 | 0.766–1.750 | 0.004–0.066 | 0.489–1.513 | 0.00 |
| Irregular | 0.068–0.108 | 0.743–1.305 | 0.012–0.024 | 0.642–1.104 | ||
| Test (c) | Regular | 0.019–0.273 | 0.779–1.768 | 0.017–0.083 | 0.713–1.519 | −0.065 |
| Irregular | 0.072–0.120 | 0.763–1.315 | 0.037–0.043 | 0.711–0.951 | ||
| Test (d) | Regular | 0.016–0.277 | 0.766–1.752 | 0.016–0.089 | 0.597–1.472 | −0.035 |
| Irregular | 0.073–0.120 | 0.762–1.318 | 0.032–0.039 | 0.646–1.002 | ||
Disclaimer/Publisher’s Note: The statements, opinions and data contained in all publications are solely those of the individual author(s) and contributor(s) and not of MDPI and/or the editor(s). MDPI and/or the editor(s) disclaim responsibility for any injury to people or property resulting from any ideas, methods, instructions or products referred to in the content. |
© 2023 by the authors. Licensee MDPI, Basel, Switzerland. This article is an open access article distributed under the terms and conditions of the Creative Commons Attribution (CC BY) license (https://creativecommons.org/licenses/by/4.0/).
Share and Cite
Hassanpour, N.; Vicinanza, D.; Contestabile, P. Determining Wave Transmission over Rubble-Mound Breakwaters: Assessment of Existing Formulae through Benchmark Testing. Water 2023, 15, 1111. https://doi.org/10.3390/w15061111
Hassanpour N, Vicinanza D, Contestabile P. Determining Wave Transmission over Rubble-Mound Breakwaters: Assessment of Existing Formulae through Benchmark Testing. Water. 2023; 15(6):1111. https://doi.org/10.3390/w15061111
Chicago/Turabian StyleHassanpour, Nasrin, Diego Vicinanza, and Pasquale Contestabile. 2023. "Determining Wave Transmission over Rubble-Mound Breakwaters: Assessment of Existing Formulae through Benchmark Testing" Water 15, no. 6: 1111. https://doi.org/10.3390/w15061111
APA StyleHassanpour, N., Vicinanza, D., & Contestabile, P. (2023). Determining Wave Transmission over Rubble-Mound Breakwaters: Assessment of Existing Formulae through Benchmark Testing. Water, 15(6), 1111. https://doi.org/10.3390/w15061111