Abstract
Typhoon rain dominates meteorology-rainfall-runoff-environmental factor changes at the regional scale and regulates water resources in the river network area by means of multi-field coupled meteorological, hydrological, and geographic models, shaping complex water resources and water environment scenarios in the Pearl River Delta. Because of limitations in the monitoring capacity of the typhoon process, quantifying the ephemeral processes and spatial heterogeneity information of typhoon rain events is difficult, which makes the degree of research on typhoon rainfall-runoff transformation processes low and the progress in regional water resources and water environment evaluations based on typhoon events slow. In this study, typhoon rain event data, namely, remote-sensing spectra, measured water quality parameters, and meteorological factors, in the Pearl River Delta during 2022 were first collected. Next, a dynamic coupling model between typhoon rain events and the water network environment was established to simulate and predict the water environment conditions of the Zhongshan City water network controlled by the regulation of typhoon rain events. By inputting the quantitative data of the typhoon rain events, the water environment conditions of the river network in Zhongshan City after the typhoon rain events were simulated and output. The results showed that the distribution of dissolved oxygen concentrations and ammonia nitrogen concentrations were consistent: the concentration was highest in the central urban area, which is more urbanised than other areas, and it was lowest in the area far from the urban centre. Moreover, under the influence of Typhoon Ma-on, the water environment of the Zhongshan City water network changed over time: dissolved oxygen concentrations decreased and then increased, and ammonia nitrogen concentrations increased and then decreased. The water quality prediction model proposed in this study helps to improve the understanding of the dynamic impact of typhoon rain on the water quality of an urban water network in the Pearl River Delta and is conducive to improving the formulation of water environment control strategies during typhoon transit.
1. Introduction
The development of the Guangdong-Hong Kong-Macao Greater Bay Area has rapidly advanced the social economy and the living standard of individuals in the Pearl River Delta region. However, the river network in the Pearl River Delta, an essential route for the Pearl River to flow into the South China Sea, has been experiencing increasingly prominent water quality pollution problems [1]. The Pearl River Delta is the area that is most severely affected by typhoons in China [2], and it suffers economic losses and human casualties from typhoons annually [3,4]. Under the influence of the global trend of frequent extreme weather [5], typhoon rains present natural characteristics such as a high intensity, wide distribution, rapid development and evolution, and suddenness [6]. Typhoons have obvious seasonality [7], and in addition to triggering natural disasters such as mudslides [8] and landslides [9], they accelerate the frequency of hydraulic exchange [10], intensify bottom sediment disturbance [11], and increase the input of organic matter and nutrients from terrestrial sources [12], affecting surface water quality [13,14]. Because the Pearl River Delta is one of the most complex and variable environmental regions worldwide, traditional water environment mathematical models are often not applicable [15], and most water environment mathematical models involve increasingly complex elements and require an increasing number of input parameters [16]. The aforementioned phenomenon and the high cost of traditional water quality-monitoring methods [17] make gaining a comprehensive, accurate understanding of the problem of water quality conditions difficult [18]. Therefore, remote-sensing technology, which is fast, extensive, and time-sensitive, has become an essential tool for assessing water quality conditions and must be applied flexibly [19].
A series of studies on water quality data have been conducted to improve the accuracy of water quality predictions. Data-processing methods have included: Gray Relational Analysis [20], Gaussian Cloud Transformation [21], Principal Component Analysis [22], Wavelet Transform [23], and Moving Average Filter [24]. In 2011, Wang [25] et al. developed a prediction model based on an agenetic algorithm-back propagation model for the concentrations of ammonia nitrogen and chemical oxygen demand in the Weihe River region of China. Their results showed that the method had better prediction results than the traditional statistical multiple regression method. Wang Jing [26] et al. used a GA-BP model to consider four meteorological factors—air temperature, water temperature, water surface evaporation, and rainfall—to establish a prediction model for the total concentration of nitrogen and phosphorus in water bodies. Ye [27] and Nukapothula [28] et al. have studied the spatial and temporal distribution of total suspended solids (TSS)’ concentrations in the waters of the Pearl River Estuary based on MODIS. The authors pointed out that precipitation, river flow, and wind play a key role in the variation in TSS concentrations. In 2020, Kupssinskü [29] et al. used remote-sensing information and machine-learning techniques to develop a prediction model for TSS and chlorophyll concentrations in the study area and showed that the model had high accuracy. Li [30] et al. used MIKE21 to develop a GA-BP model to simulate the chlorophyll content of the Wuhan East Lake.
In summary, typhoon rain events regulate water resources and the water environment in the water network globally, coordinate meteorological and hydrological models with strong coupling ability, and dominate integrated meteorological-rainfall-runoff-environmental change scenarios, resulting in significant changes in the water environment conditions in their impact areas. Therefore, research on the prediction of water environment conditions in urban water networks under the influence of typhoon rain events can facilitate the sustainable development of the urban economy and water ecology. As the area most severely affected by typhoon rain events in China, the Pearl River Delta is not only affected by typhoon rain events annually, but it has also incurred the phenomenon of multiple typhoons in a single typhoon rain event on a time scale. Moreover, the typhoon cloud system covers a wide area, and the clouds are dense during the typhoon impact, posing a substantial challenge to the monitoring of water environment conditions by optical remote-sensing satellites, and thus weakening the study of the typhoon rainfall-runoff transformation process. To study the urban water environment conditions under the influence of typhoon rain events, we established a water quality parameter prediction model based on a BP artificial neural network, considering remote-sensing waveform information, meteorological factors, interval time, and water quality parameter information. Few studies have explored the prediction of water quality under the influence of typhoon rain events; therefore, this study has exemplary significance and promotion value. The remote-sensing processing methods used in this study are conventional and mature. The processing algorithms for remote-sensing data and the differences between different algorithms are not within the scope of this study.
2. Data and Methods
2.1. Study Area
Zhongshan is in the south-central part of Guangdong Province, south of the central part of the Pearl River Delta at the lower reaches of the West and North Rivers. It is an important node city in the Guangdong-Hong Kong-Macao Greater Bay Area. The administrative jurisdiction of the city covers an area of 1800.14 , between latitudes 22°11′–22°47′ north and longitudes 113°09′–113°46′ east. The topography of Zhongshan City is mainly plain, with the central part of the terrain being high and the surrounding area being flat. The plain area slopes from northwest to southeast, of which low mountains, hills, and terraces account for 24% of the total area, with a general elevation from 10 to 200 . Rivers account for 8% of the entire territory. The Modaomen Waterway and the Xihai Waterway of the Xijiang River flow downstream from north to south through the western boundary of Zhongshan City and exit the South China Sea by the Modaomen. The Hongqili Waterway of the Beijiang River flows downstream from northwest to southeast through the northeast boundary of Zhongshan City and exits the Pearl River Estuary by the Hongqili. Zhongshan City has a subtropical monsoon climate, with abundant heat, light, and rainfall, and it is a water-rich region. The annual average temperature is 22.5 °C, the annual average precipitation is 1886 , and the total precipitation reaches 29.18 billion . Disaster weather mainly includes typhoons, heavy rains, and strong convection, with a lot of rain and high intensity. The study area is shown in Figure 1.
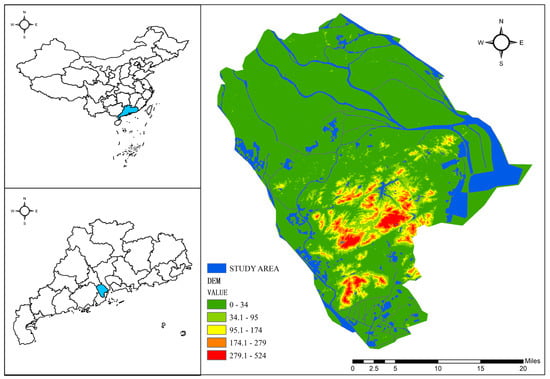
Figure 1.
Map of the study area.
2.2. Typhoon Data
The typhoon data used in this study were obtained from the Typhoon Network (http://typhoon.weather.com.cn/index.shtml) (accessed on 23 November 2022). Four typhoon events (Chaba, Mulan, Ma-on, and Nalgae) affecting the study area in 2022 were used as study cases. Typhoon Chaba was generated in the South China Sea on 30 June 2022 and made landfall in Dianbai, Guangdong Province on 2 July with a landfall wind speed of 35 m/s. Chaba had an asymmetrical structure, a large circulation range of the cloud system, slow movement, a long influence time, and a wide range. Typhoon Mulan was generated in the South China Sea on 8 August 2022 and landed in Xuwen, Guangdong Province on 10 August with a landing wind speed of 23 m/s. Mulan had characteristics of, for example, a large size, a peculiar path, a short life cycle, a wide impact range, and strong local rain. Typhoon Ma-on was generated in the ocean east of the Philippines on 21 August 2022 and made landfall in Isabela Province, Philippines on 23 August and in Dianbai, Guangdong Province on 25 August. Ma-on was fast moving and had an asymmetric structure. Typhoon Nalgae was generated in the northwest Pacific Ocean on 27 October 2022 and made landfall in Catanduanes, Philippines on 29 October and Zhuhai, Guangdong Province on 3 November. Nalgae was characterised by low intensity and a loose structure with a large cloud scale. The typhoon path is shown in Figure 2.
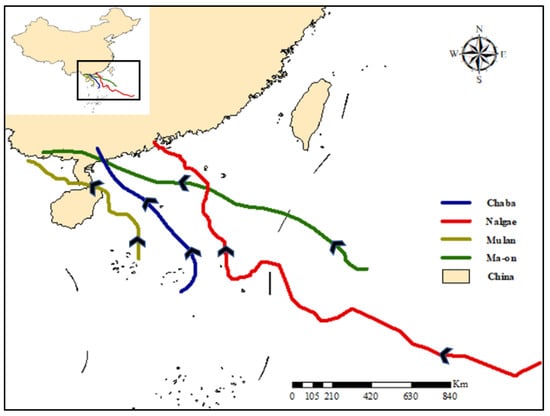
Figure 2.
Map of the typhoon path.
2.3. Remote-Sensing Data and Pre-Processing
The remote-sensing image data used in this study were obtained from the Resolution Imaging Spectrometer (MODIS) remote-sensing image files of the Earth Observing System programme conducted by NASA (https://ladsweb.modaps.eosdis.nasa.gov/) (accessed on 29 November 2022). MODIS has 36 discrete spectral bands to achieve full spectral coverage from visible to thermal infrared, with a swath width of 2330 km and ground resolutions of 250 m, 500 m, and 1000 m, respectively, and global observations can be acquired every 1 to 2 d. After acquiring the images, geometric correction was performed to eliminate the ‘double-eye’ phenomenon and the reprojection operation. Next, FLASSH atmospheric correction was performed to eliminate the influence of atmospheric and lighting factors on the reflection of features to obtain the remote-sensing images that fulfil the requirements of this study.
The principle of geometric correction is as follows [31]:
where and are the image element coordinates in the aberrated image space, and and are the image element coordinates corresponding to and in the corrected image space, called the conjugate points of and .
FLASSH atmospheric correction is an image-level atmospheric correction model developed based on the MODTRAN4+ radiative transfer model [32], where the spectral radiance equation for calculating the surface reflectance value () is:
where is the radiance of the image element, is the surface reflectance of the image element, is the average surface reflectance of the image element and the surrounding area, is the spherical reflectance of the atmosphere, is the atmospheric backscatter, is the average radiance of the image; and and are the non-surface atmospheric and geometric condition coefficients, respectively, which are related to the solar altitude angle, atmospheric model, aerosol type, visibility, average elevation value, and water vapour content related to the calculation parameters.
The radiative transfer equation for MODTRAN4+ under homogeneous Lambert Surface conditions (in the form of radiative brightness) is:
where is the radiation brightness received by the sensor, is the path radiation, is the total solar downlink radiation, is the transmittance between the sensor and target, and is the target surface reflectance.
2.4. Dynamic Coupling Model
The dynamic coupling model proposed in this study is based on a BP neural network, using remote-sensing band data, actual measured water quality parameter data, rainfall data, and time factors to construct a water quality prediction model. Among these models, the artificial neural network model is used to realise machine learning, which is connected by multiple neurons and usually divided into an input layer, a hidden layer, and an output layer. The BP neural network used in this study is based on a fully connected neural network, which is comprised of forward propagation of the signal and backward propagation of the error. In forward propagation, the input signal acts on the output node through the hidden layer and undergoes nonlinear transformation to produce the output signal. If the actual output does not match the desired output, it is transferred to the backward propagation process of the error. Error back propagation is used to back propagate the output error through the hidden layer to the input layer and to apportion the error to all units in each layer, using the error signal obtained from each layer as the basis for adjusting the weight value of each unit. After adjusting the connection strength of the input nodes to the hidden layer nodes, as well as that of the hidden layer nodes to the output nodes and the threshold value, the error decreased along the gradient direction, the network parameters (weights and thresholds) corresponding to the minimum error were determined, and the optimal solution was finally obtained. The main formula is as follows [33]:
where denotes the change value of the weight matrix at layer , is the learning rate, is the output of the network at layer , is the learning signal at layer , is the learning signal at the output layer, denotes the label value of the data, denotes the predicted value of the model, denotes the derivative of the activation function, and denotes the summary of the signal at the output layer.
In this study, the band data of MODIS remote-sensing images, measured dissolved oxygen (DO) and ammonia nitrogen (NH3-N) data, single-day cumulative rainfall data, and interval time data of Zhongshan water quality-monitoring stations were used as training samples to train the network. Wavelength data, single-day cumulative rainfall data, and interval data of MODIS remote-sensing images were used as inputs, and DO and NH3-N concentrations were used as outputs. The overall schematic of the dynamic coupled model is shown in Figure 3.
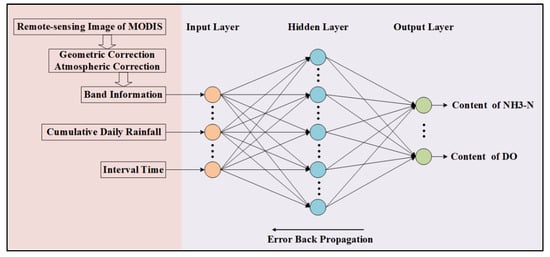
Figure 3.
Schematic of dynamic coupling model.
3. Research Results
3.1. Results of Measured Data
The data on the dissolved oxygen concentration, ammonia nitrogen concentration, and rainfall during the transit of Typhoon Chaba, Typhoon Mulan, Typhoon Ma-on, and Typhoon Nalgae were collected based on the measured data from the water quality-monitoring stations in Zhongshan City. Owing to limited space, the daily cumulative rainfall at three typical water quality-monitoring stations was considered. As shown in Figure 4, the histogram indicates single-day cumulative rainfall. The rainfall curves of the four typhoons at the three monitoring stations were similar, and the overall trend was consistent. The difference in the magnitude of the rainfall values may be due to local topography, hydrology, and other factors.
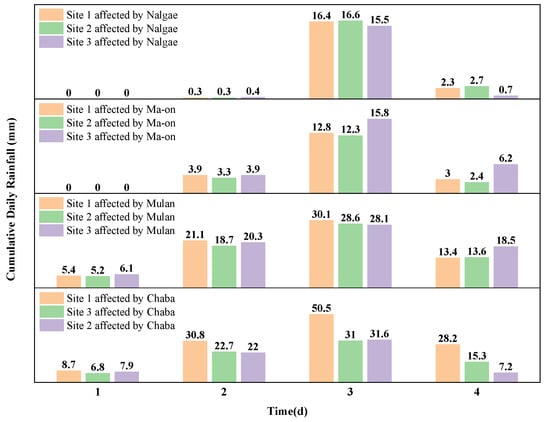
Figure 4.
Daily cumulative rainfall map of typhoon rain.
Figure 5a shows the relationship between daily cumulative rainfall and dissolved oxygen concentration at three water quality-monitoring stations under the influence of the same typhoon rain, where the line is the daily cumulative rainfall, and the histogram is the dissolved oxygen concentration. As shown in Figure 5a, the dissolved oxygen concentration at site 1 shows a positive correlation with the daily accumulated rainfall, the dissolved oxygen concentration at site 2 shows a negative correlation with the daily accumulated rainfall, and the dissolved oxygen concentration at site 3 shows a nonlinear relationship with the daily accumulated rainfall. Figure 5b shows the relationship between the daily cumulative rainfall and the ammonia nitrogen concentration at three water quality-monitoring stations under the influence of the same typhoon rain, where the line is the daily cumulative rainfall, and the histogram is the ammonia nitrogen oxygen concentration. As shown in Figure 5b, the concentration of ammonia nitrogen at sites 1 and 2 showed a negative correlation with the daily cumulative rainfall, and the concentration of ammonia nitrogen at site 3 had little correlation with the daily cumulative rainfall.
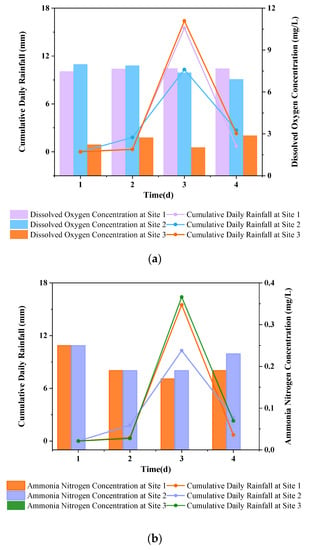
Figure 5.
(a) Relationship between daily cumulative rainfall and dissolved oxygen concentration at different stations under the same typhoon rain. (b) Relationship between daily cumulative rainfall and ammonia nitrogen concentration at different stations under the same typhoon rain.
Figure 6a shows the relationship between the daily cumulative rainfall and dissolved oxygen concentration at the same station under the influence of four typhoon rains, where the line is the daily cumulative rainfall, and the histogram is the dissolved oxygen concentration. As shown in Figure 6a, the dissolved oxygen concentration at site 4 showed a positive correlation with the daily cumulative rainfall under the influence of Typhoon Mulan and Typhoon Ma-on and a negative correlation with the daily cumulative rainfall under the influence of Typhoon Chaba and Typhoon Nalgae. Figure 6b shows the relationship between the daily cumulative rainfall and ammonia concentration at the same site under the influence of four typhoon rains, where the line is the daily cumulative rainfall, and the histogram is the ammonia concentration. As shown in Figure 6b, under the influence of Typhoon Chaba and Typhoon Ma-on, the concentration of ammonia nitrogen at site 4 showed a negative correlation with the daily cumulative rainfall; under the influence of Typhoon Nalgae, it showed a positive correlation; under the influence of Typhoon Mulan, a nonlinear relationship was observed.
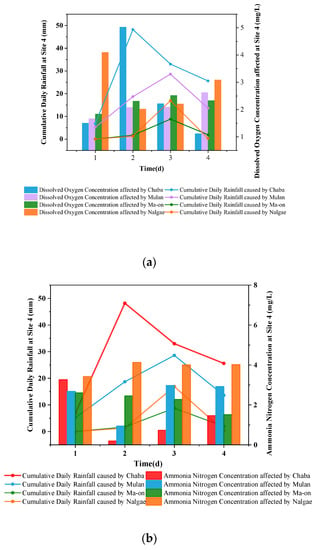
Figure 6.
(a) Plot of daily cumulative rainfall versus dissolved oxygen concentration under different typhoon rains at the same station. (b) The relationship between daily cumulative rainfall and ammonia nitrogen concentration under different typhoon rains at the same station.
3.2. Model Prediction Results
3.2.1. Model Establishment
To effectively predict the dissolved oxygen and ammonia nitrogen concentrations in the urban water network under the influence of typhoons, this study used the waveband data of MODIS remote-sensing images from Band1 to Band7, measured dissolved oxygen (DO) concentration data, ammonia nitrogen (NH3-N) concentration data, single-day cumulative rainfall data, and interval data as training samples to construct a prediction model based on a BP artificial neural network. The training samples include the training set, verification set, and test set, which account for 70%, 15%, and 15% of the training samples, respectively.
The artificial neural network fitted data are shown in Figure 7.
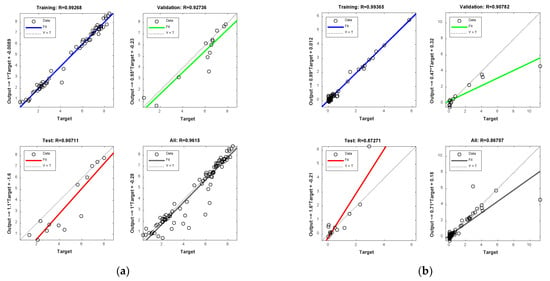
Figure 7.
Regression analysis schematic diagram of water quality parameters. (a) Schematic of regression analysis of dissolved oxygen dataset. (b) Schematic of regression analysis of ammonia nitrogen dataset.
3.2.2. Model Validation
The measured data outside the training samples were selected to validate the model (Table 1). The maximum absolute error of the dissolved oxygen concentration prediction model was 1.2753, the minimum absolute error was 0.4514, the average absolute error was 0.7583, the maximum relative error was 0.76, the minimum relative error was 0.078, and the average relative error was 25.24%. The maximum absolute error of the ammonia nitrogen concentration prediction model was 0.0733, the minimum absolute error was 0.0135, the average absolute error was 0.04875, the maximum relative error was 0.45, the minimum relative error was 0.0226, and the average relative error was 28.88%. Thus, the model proposed in this study has a satisfactory generalisation ability and a certain reference role in predicting water quality under the influence of typhoon rain events.

Table 1.
Dynamic coupling model validation table.
3.2.3. Model Prediction
The water quality prediction model proposed in this study was used to predict the water environment of the Zhongshan City water network during the transit of Typhoon Ma-on, as shown in Figure 8. The data used for water body extraction were obtained from GlobeLand30 2020, the first global geographic information publicly provided by China to the United Nations [34].
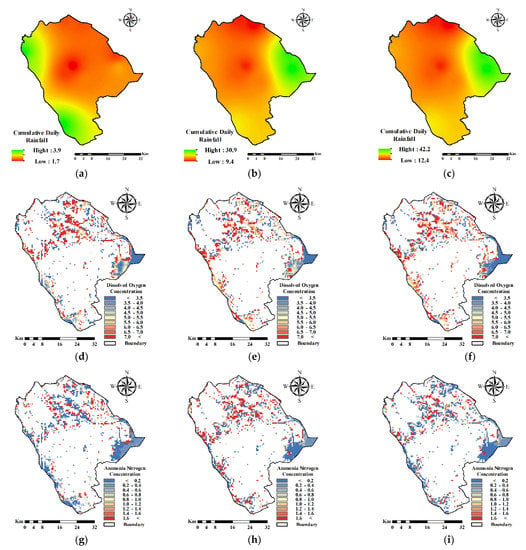
Figure 8.
Water quality parameter concentration distribution under the influence of Typhoon Ma-on. (a) Distribution of rainfall on the first day. (b) Distribution of rainfall on the second day. (c) Distribution of rainfall on the third day. (d) DO concentration distribution on the first day. (e) DO concentration distribution on the second day. (f) DO concentration distribution on the third day. (g) NH3-N concentration distribution on the first day. (h) NH3-N concentration distribution on the second day. (i) NH3-N concentration distribution on the third day.
Figure 8 shows the concentration distribution of water quality parameters in the Zhongshan City water network during the transit of typhoon Ma-on. Overall, the distribution of dissolved oxygen and ammonia nitrogen concentrations is consistent: the concentration is highest in the central urban area, which is more urbanised than other areas, and lowest in the area far from the urban centre.
4. Discussion
Improving the understanding of the water quality changes in the urban water network under the influence of typhoon rain events helps to reveal the trends of urban water environment changes under the influence of these events, which helps decisionmakers and planners to improve water environment control strategies during these events.
The literature has used satellite remote-sensing images and artificial neural networks in water quality prediction research. All these studies have linked the interrelationship between remote-sensing image band data and water quality parameters or between water quality parameters and meteorological factors and then constructed water quality prediction models. In this study, a new idea for constructing a model is proposed by linking remote-sensing image band data, water quality parameters, meteorological factors, and temporal factors to construct a water quality prediction model for urban water networks under the influence of typhoon rain events suitable for this study area. We used a training sample outside of the actual measurement data to validate the model. The model had a good predictive performance, and the water quality prediction under the influence of typhoon rain events has a certain reference role. In general, rainfall with a high dissolved oxygen concentration can effectively increase the dissolved oxygen concentration in rivers, whereas a large amount of rainwater inflow leads to an increase in river flow rate, and thus an increase in dissolved oxygen concentration in rivers [35]. However, rainfall can also cause a large amount of oxygen-depleting compounds and organic matter to enter the river, which can rapidly decrease dissolved oxygen content in the river under the effect of sink production [36].
Based on the water quality prediction model proposed in this study, a water quality prediction study of the urban water network in Zhongshan City under the influence of typhoon rain events was conducted, and the change in concentration distribution during the typhoon ephemeris was compared and analysed. Figure 9 shows the distribution of dissolved oxygen and ammonia nitrogen concentrations in the urban water network of Zhongshan City during the transit of typhoon Ma-on compared with that of the previous day. Overall, the concentration of dissolved oxygen in the urban water network of Zhongshan City first decreased and then increased with an increase in the intensity of typhoon rain. The concentration of ammonia nitrogen initially increased and then decreased. This finding is consistent with those in the literature. In the early stage of typhoon rain, a large amount of pollutants are washed away and eroded to form surface runoff into rivers, and impervious urban pavement significantly increases surface runoff and accelerates the sink process [37], leading to a decrease in the dissolved oxygen concentration and an increase in the ammonia nitrogen concentration in the urban water network. In the late stage of typhoon rain, the pollutant sources are significantly reduced, and a large amount of dissolved oxygen-rich rainwater still enters the water bodies of the urban river network under the effect of sink production, leading to an increase in the dissolved oxygen concentration and a decrease in the ammonia nitrogen concentration in the urban water network. Thus, the examined typhoon rain events have a certain degree of a purification effect on the water bodies in the urban water network. The results of this study can be analysed using multi-criteria decision analysis [38,39] to produce visualisation results that are critical for urban environmental decision making and may help urban decisionmakers to increase the cost effectiveness of water environment control strategies during typhoon transit.
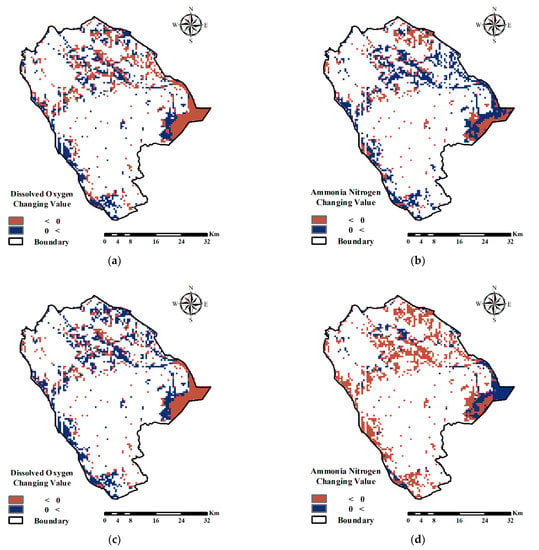
Figure 9.
Water quality parameter concentration changes under the influence of Typhoon Ma-on. (a) Variation in dissolved oxygen concentration on the second day. (b) Variation in ammonia nitrogen concentration on the second day. (c) Variation in dissolved oxygen concentration on the third day. (d) Variation in ammonia nitrogen concentration on the third day.
5. Conclusions
Understanding the trend of the concentration of water quality parameters in urban water networks under the influence of typhoon rain events is important for the protection and control of the water environment during typhoon transit. However, the change in the concentration of water quality parameters depends on many factors, and its mechanism and process remain unclear. In this study, we proposed a new idea for constructing a water quality prediction model, that is, using training samples of remote-sensing image band data, water quality parameters, meteorological factors, and the role of time factors. The model achieved good prediction results in data outside of the training sample and predicted the water quality of Zhongshan City’s water network under the influence of Typhoon Ma-on. The distribution of dissolved oxygen and ammonia nitrogen concentrations in the urban water network of Zhongshan City after a typhoon was consistent: the concentration was highest in the central urban area, which is more urbanised than other areas, and it was lowest in the area far from the urban centre. Additionally, the dissolved oxygen concentration in the urban water network decreased and then increased over time, and the ammonia nitrogen concentration increased and then decreased over time under the influence of typhoon rain events. This study effectively predicted the water quality of the urban water network in the Pearl River Delta under the influence of typhoon rain events and conducted adaptive water management to reduce unnecessary government expenditures [40,41]. The results of this study can be combined with environmental input-output models [42] to help policymakers and planners increase the efficiency of water environment control strategies during typhoon transit periods to achieve sustainable economic and ecological development.
Author Contributions
Conceptualisation, P.C.; Funding acquisition, Y.J., P.C. and G.L.; Methodology, Y.J.; Resources, G.L.; Writing—original draft, W.S.; Writing—review and editing, P.C. All authors have read and agreed to the published version of the manuscript.
Funding
This work was supported by the National Natural Science Foundation of China (grant no. 42101422 and no. 52178209) and the Science and Technology Program of Guangzhou (grant no. 201605030009 and no. 201803020036). The project was supported by the Guangdong Engineering and Research Center for Unmanned Aerial Vehicle Remote Sensing of Agricultural Water and Soil Information.
Institutional Review Board Statement
Not applicable.
Informed Consent Statement
Not applicable.
Data Availability Statement
All relevant data are included in the paper.
Acknowledgments
The authors would like to thank the editors and reviewers for their useful comments, which was helpful in improving the quality of the manuscript.
Conflicts of Interest
The authors declare no conflict of interest.
References
- Yang, W.; Lai, Z.; Zeng, Y.; Gao, Y.; Wang, C.; Shuai, F.; Liu, Q. The Distribution and Contamination Levels of Arsenicinwater and Sediment of the Pearl River Delta. Ecol. Environ. Sci. 2015, 24, 831–837. [Google Scholar] [CrossRef]
- Yu, H.; Guo, H.; Wang, J. Comprehensive risk assessment of typhoon for regionalization—A case of population and economic risk in Guangdong Province. Acta Sci. Nat. Univ. Sunyatseni 2023, 62, 86–95. [Google Scholar] [CrossRef]
- Kim, K.O.; Yuk, J.-H.; Jung, K.T.; Choi, B.H. Swell Propagation Caused by Typhoon Passage to the Yellow and East China Seas. J. Coast. Res. 2017, 79, 144–148. [Google Scholar] [CrossRef]
- Pan, G.; Chai, F.; Tang, D.; Wang, D. Marine phytoplankton biomass responses to typhoon events in the South China Sea based on physical-biogeochemical model. Ecol. Model. 2017, 356, 38–47. [Google Scholar] [CrossRef]
- Ren, G.Y.; Chen, Y.; Zou, X.K.; Zhou, Y.Q.; Wang, X.L.; Jiang, Y.; Ren, F.M.; Zhang, Q. Definition and Trend Analysis of an Integrated Extreme Climatic Index. Clim. Environ. Res. 2010, 15, 354–364. [Google Scholar]
- Ivers, L.C.; Ryan, E.T. Infectious diseases of severe weather-related and flood-related natural disasters. Curr. Opin. Infect. Dis. 2006, 19, 408–414. [Google Scholar] [CrossRef]
- Chen, X. Causes and countermeasures of typhoon disaster in Xiamen. China Flood Drought Manag. 2008, 18, 27–29. [Google Scholar] [CrossRef]
- Llanes, F.V.; Eco, R.; Herrero, T.M.; Briones, J.B.L.; Escape, C.M.; Sulapas, J.J.; Galang, J.A.M.; Ortiz, I.J.; Sabado, J.M.; Lagmay, A.M.F.; et al. Practices in disaster mitigation in the case of the 2015 Typhoon Koppu debris flows in Nueva Ecija, Philippines. Nat. Hazards 2022, 114, 665–690. [Google Scholar] [CrossRef]
- Yan, Y.; Yan, Y.; Zhao, G.; Zhou, Y.; Wang, Z. Combined ERT and GPR Data for Subsurface Characterization of Weathered Hilly Slope: A Case Study in Zhejiang Province, Southeast China. Sustainability 2022, 14, 7616. [Google Scholar] [CrossRef]
- Li, J.; Li, G.; Xu, J.; Qiao, L.; Ma, Y.; Ding, D.; Liu, S. Responses of Yellow Sea Cold Water Mass to Typhoon Bolaven. J. Ocean Univ. China 2019, 18, 31–42. [Google Scholar] [CrossRef]
- Chen, H.; Zhu, Y.; Zhang, Y.; Chen, X.; Wang, R.; Zhu, W. Cyanobacterial bloom expansion caused by typhoon disturbance in Lake Taihu China. Environ. Sci. Pollut. Res. 2020, 27, 42294–42303. [Google Scholar] [CrossRef]
- Lu, J.; Jiang, J.; Li, A.; Ma, X. Impact of Typhoon Chan-hom on the marine environment and sediment dynamics on the inner shelf of the East China Sea: In-situ seafloor observations. Mar. Geol. 2018, 406, 72–83. [Google Scholar] [CrossRef]
- Fakour, H.; Lo, S.L.; Lin, T.F. Impacts of Typhoon Soudelor (2015) on the water quality of Taipei, Taiwan. Sci. Rep. 2016, 6, 25228. [Google Scholar] [CrossRef]
- Lee, C.-S.; Lee, Y.-C.; Chiang, H.-M. Abrupt state change of river water quality (turbidity): Effect of extreme rainfalls and typhoons. Sci. Total Environ. 2016, 557–558, 91–101. [Google Scholar] [CrossRef]
- Zeng, F.; Huang, S. Evaluation of mathematical modeling techniques for tidal river networks on Pearl River Delta. Mar. Environ. Sci. 2000, 19, 46–50. [Google Scholar]
- Li, Y.; Shi, Y.; Jing, L.; Zhu, X.; Gong, R. Advances in surface water environment numerical models. Water Resour. Prot. 2019, 35, 1–8. [Google Scholar]
- Sagan, V.; Peterson, K.T.; Maimaitijiang, M.; Sidike, P.; Sloan, J.; Greeling, B.A.; Maalouf, S.; Adams, C. Monitoring inland water quality using remote sensing: Potential and limitations of spectral indices, bio-optical simulations, machine learning, and cloud computing. Earth-Sci. Rev. 2020, 205, 103187. [Google Scholar] [CrossRef]
- Si-meng, W.; Bo-qiang, Q. Research Progress on Remote Sensing Monitoring of Lake Water Quality Parameters. Environ. Sci. 2022. [Google Scholar] [CrossRef]
- Jiren, L. Advance of hydrographic remote sensing with time. J. Hydraul. Eng. 2016, 47, 436–442. [Google Scholar] [CrossRef]
- Zhou, J.; Wang, Y.; Xiao, F.; Wang, Y.; Sun, L. Water Quality Prediction Method Based on IGRA and LSTM. Water 2018, 10, 1148. [Google Scholar] [CrossRef]
- Deng, W.; Wang, G.; Zhang, X. A novel hybrid water quality time series prediction method based on cloud model and fuzzy forecasting. Chemom. Intell. Lab. Syst. 2015, 149, 39–49. [Google Scholar] [CrossRef]
- Ding, Y.R.; Cai, Y.J.; Sun, P.D.; Chen, B. The Use of Combined Neural Networks and Genetic Algorithms for Prediction of River Water Quality. J. Appl. Res. Technol. 2014, 12, 493–499. [Google Scholar] [CrossRef]
- Mei, X.; Fu, Y.; Zhenzhong, L.; Gaohua, L.; Peiyun, Q. Forecasting of water quality using grey GM(1,1)-wavelet-GARCH hybrid method in Songhua River Basin. Trans. Chin. Soc. Agric. Eng. 2016, 32, 137–142. [Google Scholar] [CrossRef]
- Hu, Z.; Zhang, Y.; Zhao, Y.; Xie, M.; Zhong, J.; Tu, Z.; Liu, J. A Water Quality Prediction Method Based on the Deep LSTM Network Considering Correlation in Smart Mariculture. Sensors 2019, 19, 1420. [Google Scholar] [CrossRef]
- Wang, X.; Fu, L.; He, C. Applying support vector regression to water quality modelling by remote sensing data. Int. J. Remote Sens. 2011, 32, 8615–8627. [Google Scholar] [CrossRef]
- Wang, J.; Geng, Y.; Zhao, Q.; Zhang, Y.; Miao, Y.; Yuan, X.; Jin, Y.; Zhang, W. Water Quality Prediction of Water Sources Based on Meteorological Factors using the CA-NARX Approach. Environ. Model. Assess. 2021, 26, 529–541. [Google Scholar] [CrossRef]
- Ye, H.; Chen, C.; Tang, S.; Tian, L.; Sun, Z.; Yang, C.; Liu, F. Remote sensing assessment of sediment variation in the Pearl River Estuary induced by Typhoon Vicente. Aquat. Ecosyst. Health Manag. 2014, 17, 271–279. [Google Scholar] [CrossRef]
- Nukapothula, S.; Chen, C.; Wu, J. Long-term distribution patterns of remotely sensed water quality variables in Pearl River Delta, China. Estuar. Coast. Shelf Sci. 2019, 221, 90–103. [Google Scholar] [CrossRef]
- Silveira Kupssinskü, L.; Thomassim Guimarães, T.; Menezes de Souza, E.; C. Zanotta, D.; Roberto Veronez, M.; Gonzaga, L., Jr.; Mauad, F.F. A Method for Chlorophyll-a and Suspended Solids Prediction through Remote Sensing and Machine Learning. Sensors 2020, 20, 2125. [Google Scholar] [CrossRef]
- Li, X.; Huang, M.; Wang, R. Numerical Simulation of Donghu Lake Hydrodynamics and Water Quality Based on Remote Sensing and MIKE 21. ISPRS Int. J. Geo-Inf. 2020, 9, 94. [Google Scholar] [CrossRef]
- Chao, M.; Hong-Yan, Z.; Jian-Jun, Z.; Si-Wen, F. Simulation Optimization Study of Satellite Remote Sensing Image Geometric Correction. Comput. Simul. 2017, 34, 4. [Google Scholar]
- Guo, Y.; Zeng, F. Atmospheric correction comparison of SPOT-5 image based on model FLAASH and model QUAC. Int. Arch. Photogramm. Remote Sens. Spat. Inf. Sci. 2012, 39, 21–23. [Google Scholar] [CrossRef]
- Xiao-Ping, W.; Ji-Yang, S.; Xin, J. Prediction of water quality index in Qiantang River based on BP neural net work model. J. Zhejiang Univ. (Eng. Sci.) 2007, 41, 4. [Google Scholar]
- Chen, J.; Yifang, B.; Songnian, L. China: Open access to Earth land-cover map. Nature 2014, 514, 434. [Google Scholar] [CrossRef]
- Muñoz, H.; Orozco, S.; Vera, A.; Suárez, J.; García, E.; Neria, M.; Jiménez, J. Relationship between Dissolved Oxygen, Rainfall and Temperature: Zahuapan River, Tlaxcala, Mexico. Water Technol. Sci. 2015, 6, 59–74. (In Spanish) [Google Scholar]
- Pearce, M.W.; Schumann, E.H. Dissolved Oxygen Characteristics of the Gamtoos Estuary, South Africa. Afr. J. Mar. Sci. 2010, 25, 99–109. [Google Scholar] [CrossRef]
- Rui, C.; Shu, L.; Zhong-ya, F.; Wen-jing, L.; Fan-tang, Z.; Ben-jian, M.; Lei, S.; Zhi-wei, H. Effects of Continuous Extreme Rainfall on Water Quality of the Dongjiang River Basin. Environ. Sci. 2019, 40, 4440–4449. [Google Scholar] [CrossRef]
- Kut, P.; Pietrucha-Urbanik, K. Most Searched Topics in the Scientific Literature on Failures in Photovoltaic Installations. Energies 2022, 15, 8108. [Google Scholar] [CrossRef]
- Zhang, W.; Zhou, X.; Wei, W.; Cheng, X. Risk Assessment of Water Inrush in Tunnels: A Case Study of a Tunnel in Guangdong Province, China. Sustainability 2022, 14, 11443. [Google Scholar] [CrossRef]
- Mishra, B.; Kumar, P.; Saraswat, C.; Chakraborty, S.; Gautam, A. Water Security in a Changing Environment: Concept, Challenges and Solutions. Water 2021, 13, 490. [Google Scholar] [CrossRef]
- Liya, G.; Linruo, Z.; Zhiran, X. Water security under the impact of climate change and sustainable solutions. China Water Resour. 2022, 9, 3. [Google Scholar]
- Hui, B.; Yan, C.; Dong, W.; Shunze, W.; Wei, G.; Huaicheng, G. Study on the Classification of Response Relationship between Total Pollutant Emission Reduction and Water Quality Improvement in China. Acta Sci. Nat. Univ. Pekin. 2020, 56, 7. [Google Scholar] [CrossRef]
Disclaimer/Publisher’s Note: The statements, opinions and data contained in all publications are solely those of the individual author(s) and contributor(s) and not of MDPI and/or the editor(s). MDPI and/or the editor(s) disclaim responsibility for any injury to people or property resulting from any ideas, methods, instructions or products referred to in the content. |
© 2023 by the authors. Licensee MDPI, Basel, Switzerland. This article is an open access article distributed under the terms and conditions of the Creative Commons Attribution (CC BY) license (https://creativecommons.org/licenses/by/4.0/).