3.1. Results of Slow Pyrolysis Tests
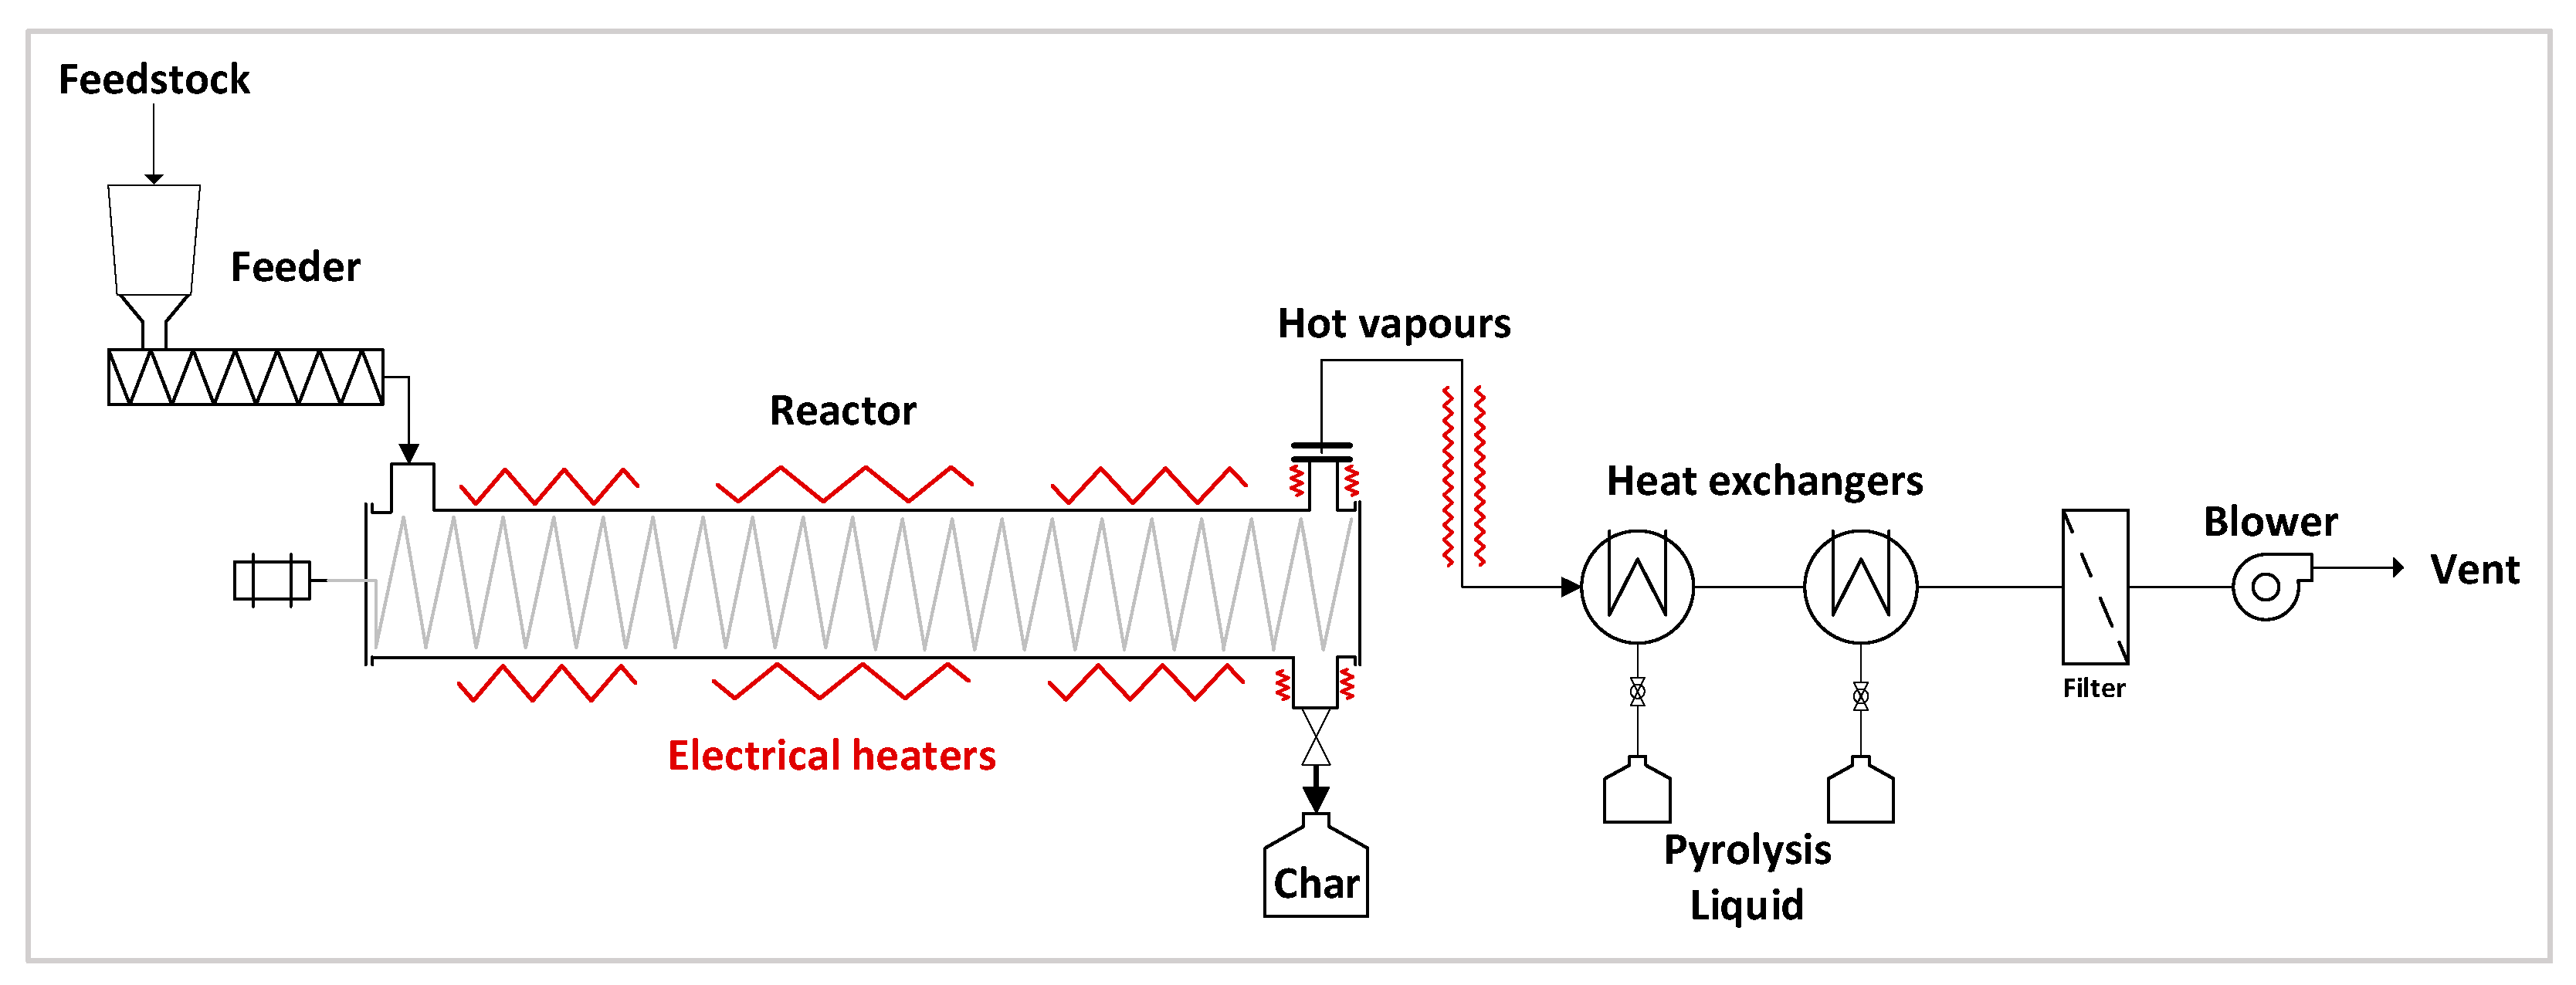
During the slow pyrolysis test on the pilot plant, 2.790 kg dry sludge was processed and 1.615 kg char (char SPYRO) produced, corresponding to a char yield of 57.9%. The elevated ash content in the feedstock (
Table 2) leads to a higher char yield compared to the typical char yield of 20–35% usually achieved by slow pyrolysis [
15]. The mass balance of the process is reported in
Table 7, where output permanent gases mass is calculated as the difference between input dry sewage sludge mass and output char and liquids, which were weighted.
The energy balance of the process (
Table 8) shows the chemical power distribution of the feedstock among the pyrolysis products. The chemical power of the feedstock and char was calculated from the mass of the materials (respectively processed and produced, from
Table 7) and the respective HHV (from
Table 8). The chemical power of the liquids was calculated accordingly, referring to the mass of recovered liquids and liquids HHV calculated (from
Table 7 and
Table 8, respectively). The chemical power of the output of permanent gases was determined as the difference between the input power and recovered power in the char and liquids. By 8.0 kWt theoretically introduced in the plant as dry sewage sludge, 5.5 kWt (almost 69%) is recovered as pyrogas (mainly as permanent gases) and 2.5 kWt is recovered as char.
3.2. Characterization of the Slow Pyrolysis Char
The physical–chemical analysis of the char obtained (
Table 9) shows an increase in ash content of about 60% against the processed feedstock. During pyrolysis, part of the organic matter is devolatilised and converted into pyrogas, determining the increase in the inorganic compounds (ash) percentage content [
33] and leading volatiles to decrease to 12.5%. The material has a carbon content of about 14.4% and a nitrogen content of 2.4%. Char LHV is reduced compared to the dry feedstock due to the increased ash content and decrease in carbon and hydrogen in the material.
The elemental composition of the char in terms of metals and other mineral elements is reported in
Table 10. The sum of Al (14.1%), Si (10.0%), P (47.2%), Ca (3.6%), and Fe (2.6%) represents around 35% of the char dry matter. Comparing this composition with the composition of sewage sludge (
Table 3), we can observe an increase in almost all concentrations. In particular, aluminium concentration is almost tripled, and chromium and copper concentrations show increases of around 80% and 60%, respectively. The iron concentration is almost doubled, while nickel and lead are almost two and three times, respectively, compared to sewage sludge.
3.5. Ash Extraction Efficiency and Biocoals Characterization
The ash extraction efficiencies (
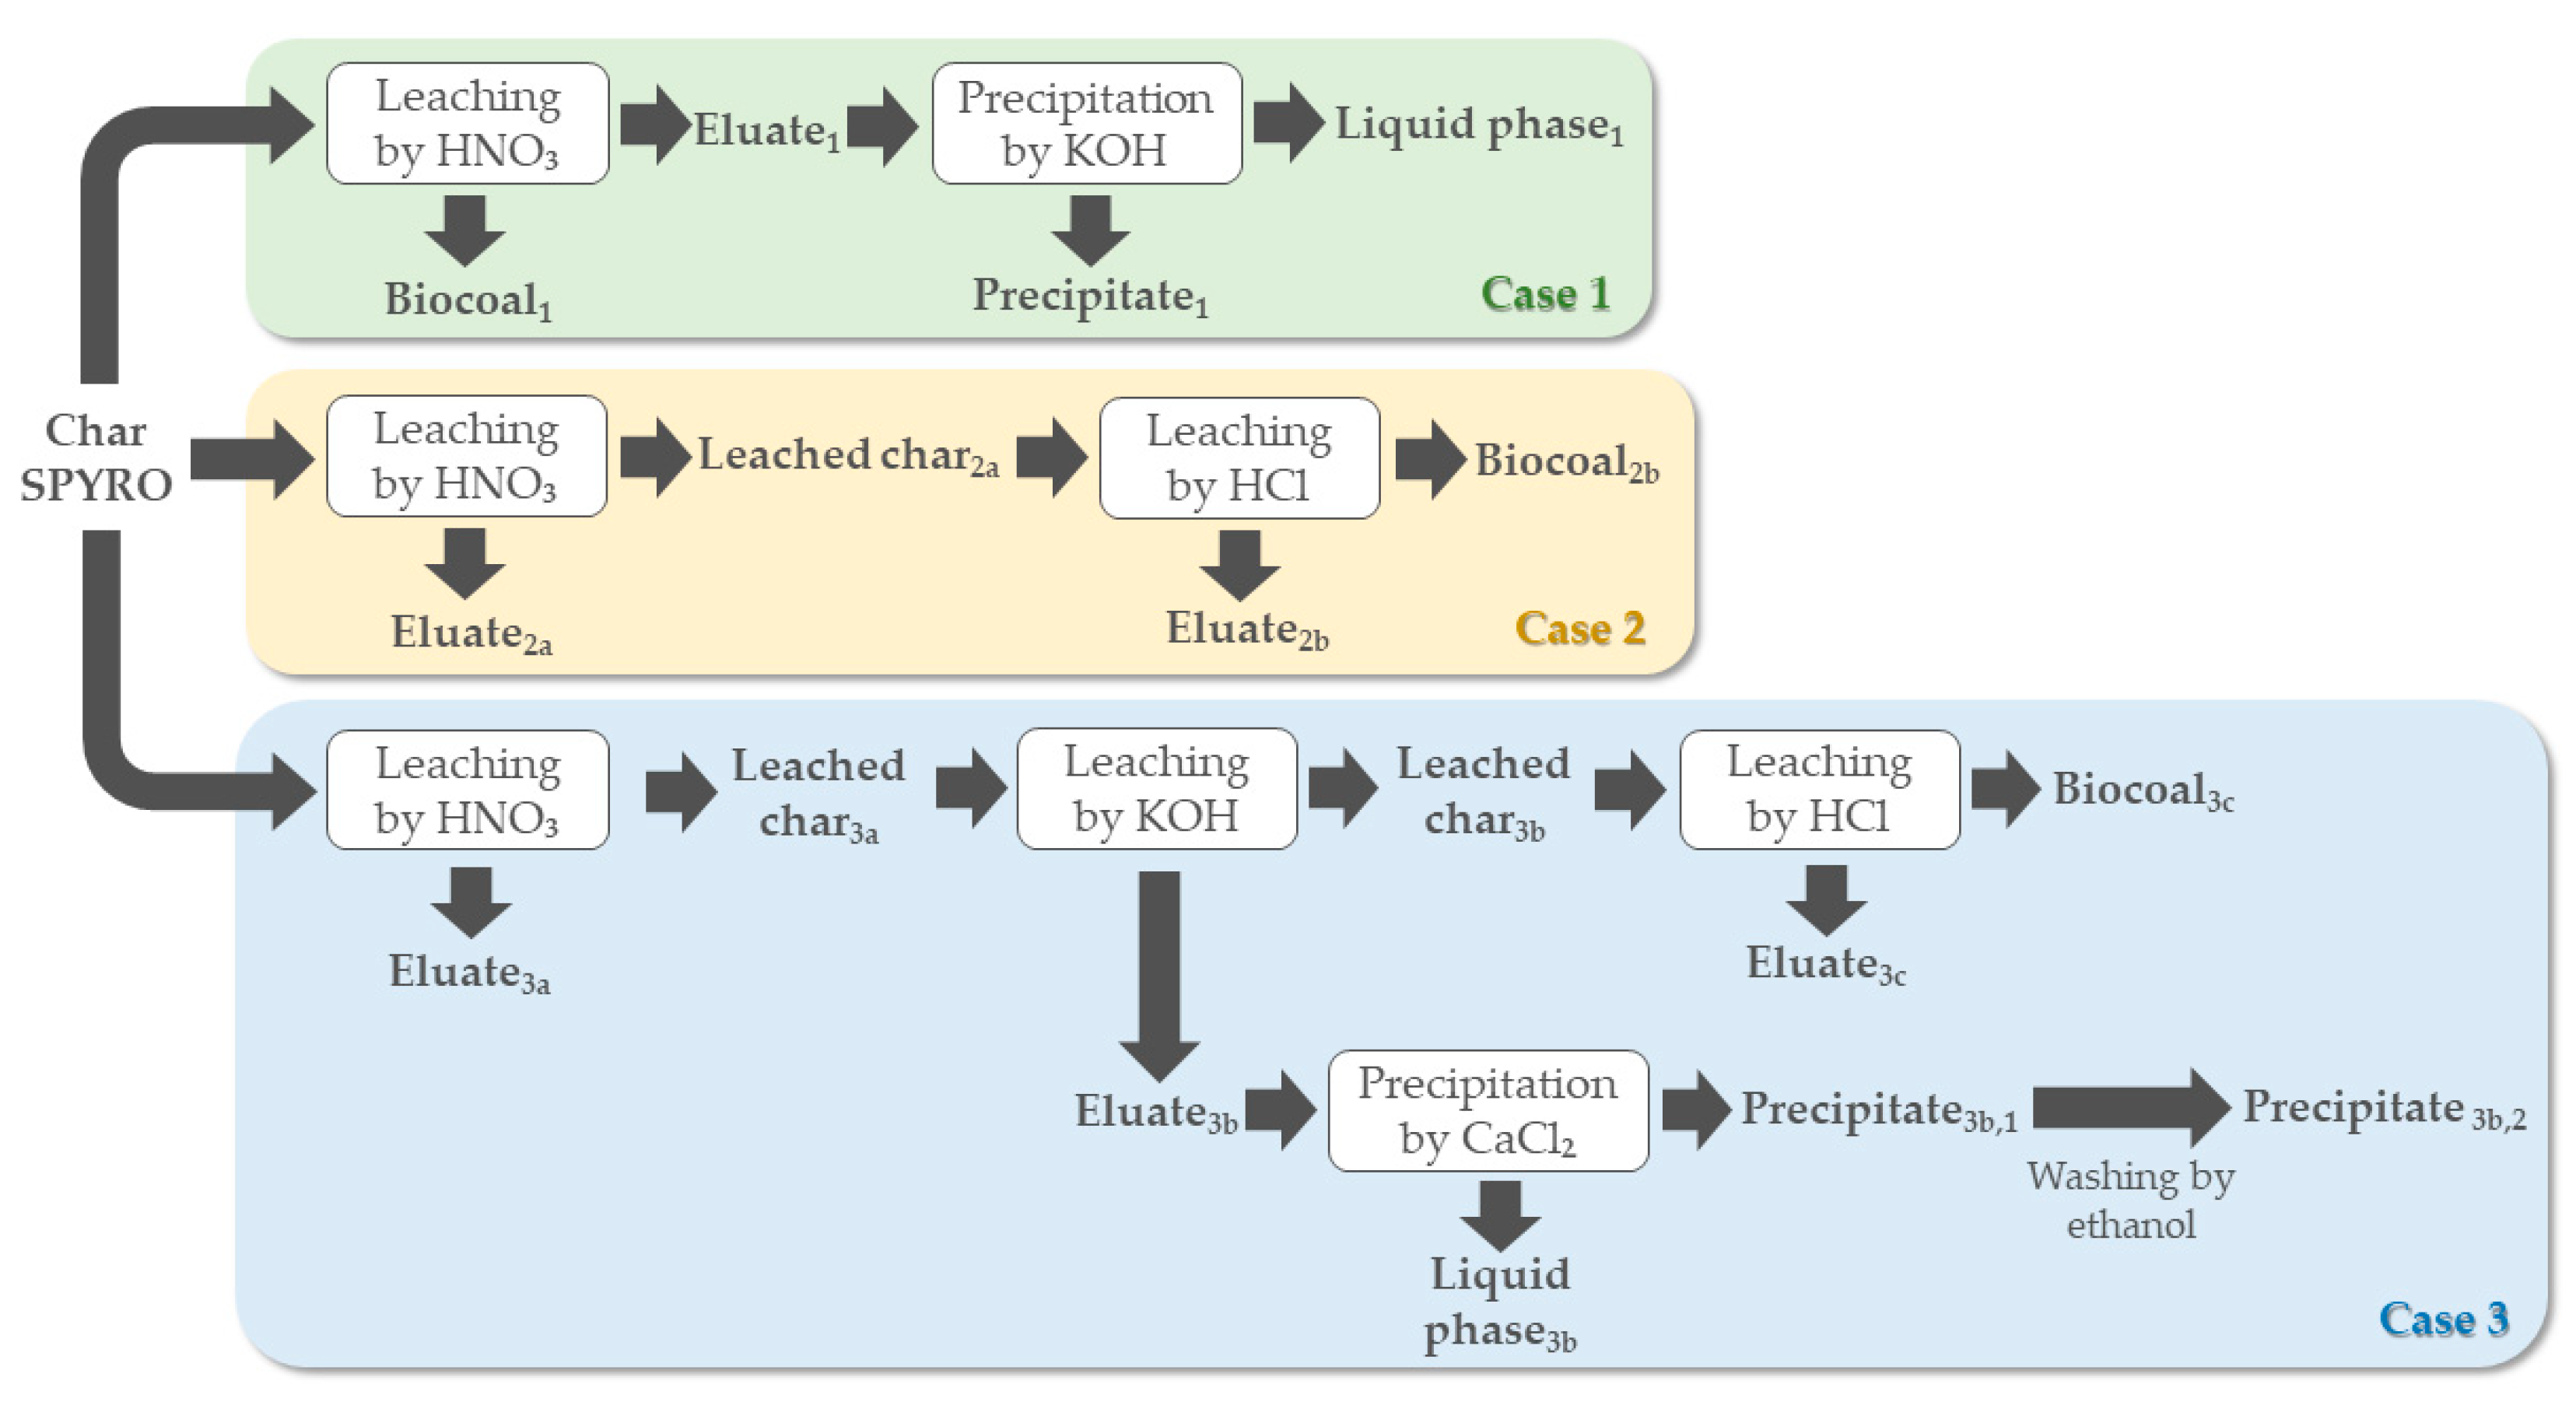
AE) achieved in cases 1–3 are summarized in
Table 15, showing that the mean values were statistically different. We can observe that the highest
AE (61.4%) was achieved by the sequential HNO
3 and HCl leaching of case 2. The first step of this case and the single-step HNO
3 leaching of case 1 are comparable (around 55%) since the only different adopted parameter was the liquid to char ratio, which did not have a high impact on the process. Case 3, which included sequential leaching by HNO
3, KOH, and HCl, led to an overall
AE around 58.6%. The third step by HCl, in particular, was the most effective on ash extraction among the three of the case, and its introduction in the process was dictated by the low
AE obtained by the first two steps.
In
Table 15, the characterizations of the produced biocoals are provided as well, while
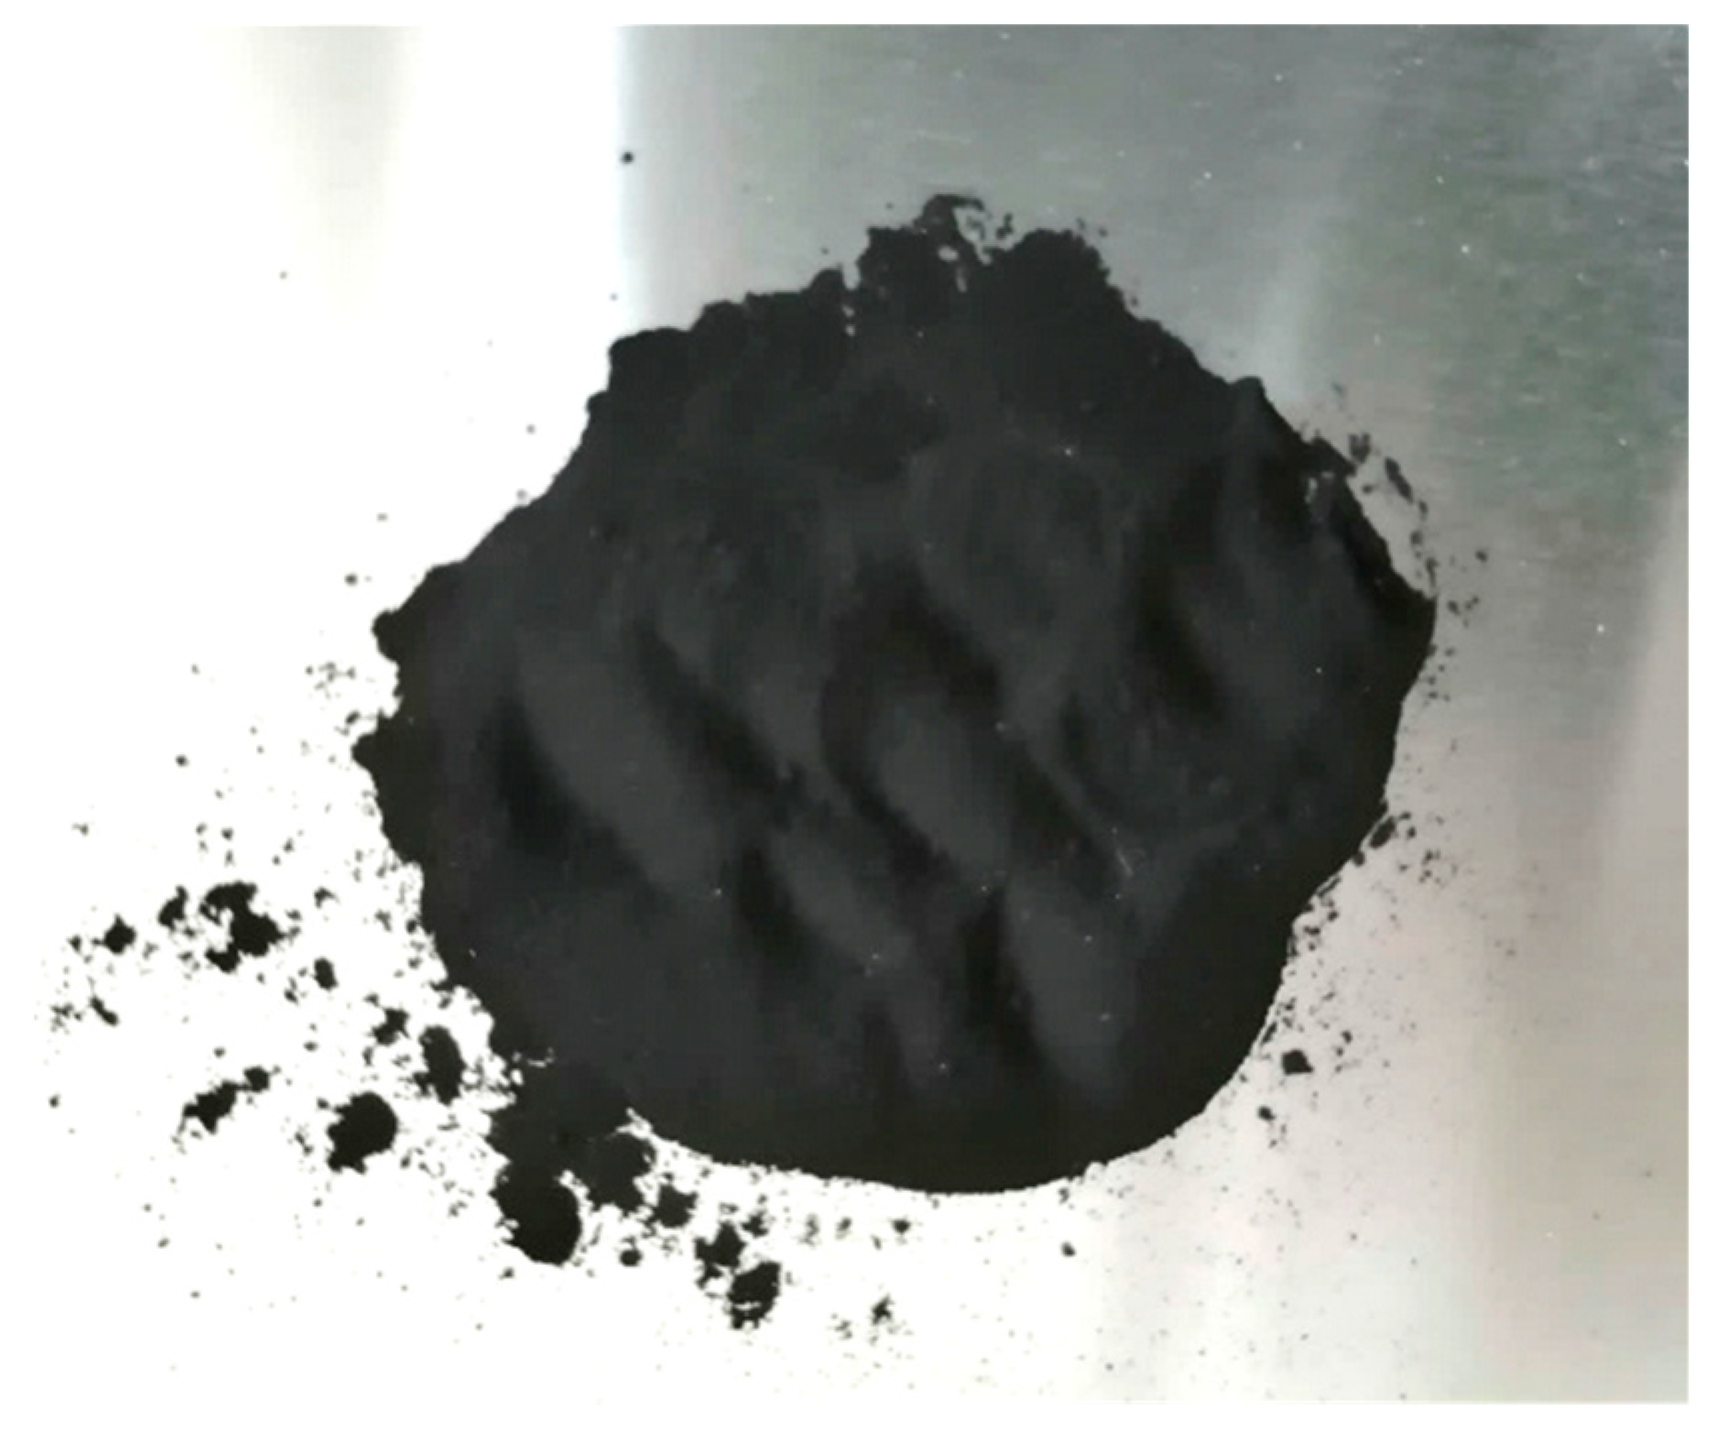
Figure 4 shows the biocoal from case 3. Since the ash content of the processed char was around 77.7% (
Table 9), although the achieved
AE was over 55% for case 1, case 2 and case 3, the ash content of the biocoals produced remained over 50%. Case 2 led to the minimum ash content, 57.4%. The ash mean value of biocoal
1 was significantly higher than that of biocoal
3c and biocoal
2b, the latter showing the lowest value.
Ash extraction from the processed char by leaching led to increasing carbon content in the material since one of the targets of the integration of slow pyrolysis and chemical leaching was to recover carbon from sewage sludge.
Table 15 shows that the carbon percentage content of the biocoals from case 1, case 2, and case 3 was increased, respectively, by 77%, 91%, and 86% against the starting carbon content in the processed char. We can observe that higher carbon content was reached when a higher
AE was achieved, so case 2, case 3, and case 1 led to statistically different carbon contents of 27.4%, 26.7%, and 25.5%, respectively. Similarly, hydrogen and nitrogen contents of biocoals are quite comparable (respectively, between 1.4% and 1.7% and between 4.1% and 4.2%). Statistical analysis showed that the mean values of hydrogen content of biocoal
2b and biocoal
3b were similar but higher than case 1 biocoal. On the other hand, biocoal
3b showed the lowest nitrogen content, the values of biocoal
2b and biocoal
1 being significantly similar. The molar H/C ratio is around 0.6 (case 3) and 0.7 (cases 1 and 2), the values being statistically different.
The mineral composition of the biocoal obtained by EDX analysis is reported in
Table 16. We can observe that SiO
2 is the main compound, representing 29–42% of the biocoals, followed by minor concentrations of Al
2O
3, representing above 10–15% of the biocoals. In fact, none of the leaching tests were effective on Si extraction from char.
Concerning case 2, an interesting surface area value, namely 70 m
2/g, was reached, which is higher than typical waste material values and comparable to that shown by biochar produced from some lignocellulosic materials (e.g., maize straw [
36]). This characteristic makes the material of potential interest for being used as absorption material or activated carbon production.
The char produced from case 3 presented reduced surface area compared to case 2 (42 m
2/g), probably due to a higher ash content. As visible from
Table 15, surface area increases with a decrease in ash content in the biocoal [
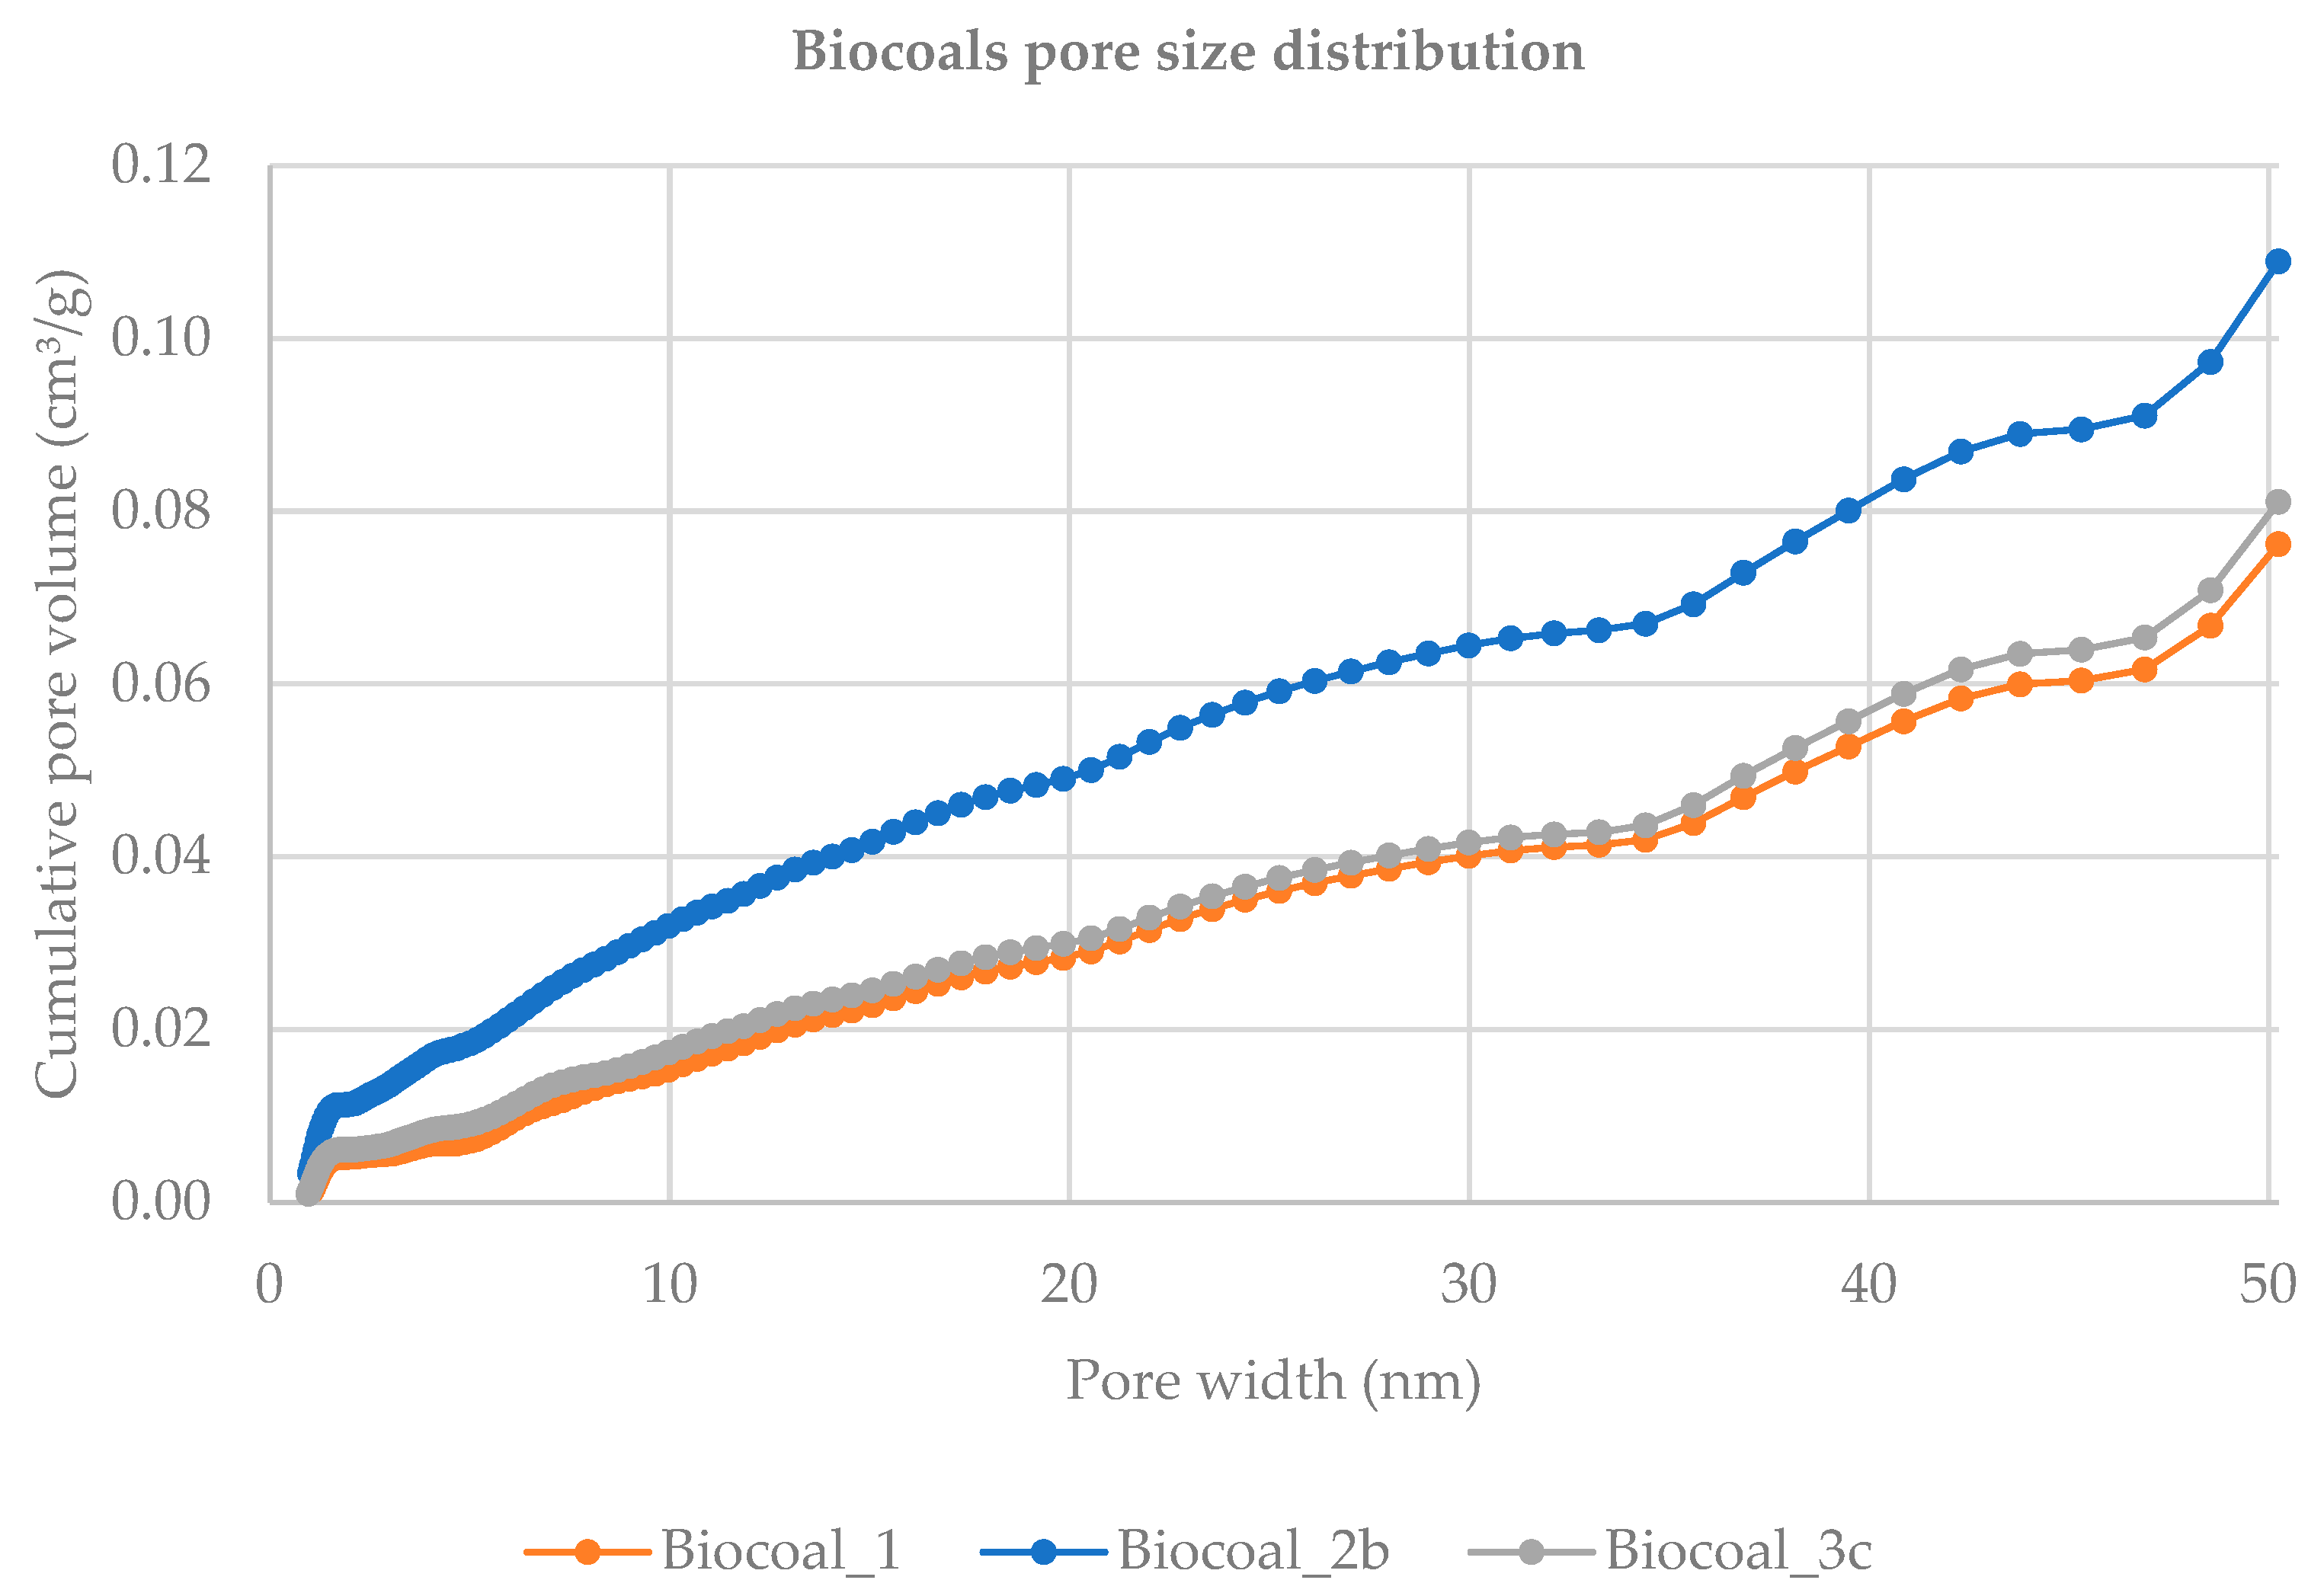
37]. The pore size distribution of the biocoals, determined by DFT method, is reported in
Figure 5, showing an increase in the cumulative pore volume (analysed in the range 0–50.2316 nm) from biocoal
1 to biocoal
2b, similar to surface area.
As reported in
Table 16, the ash of the extracted biocoals in the three cases contains mainly silica (from 61% to 71% of dry ash) and alumina (from 16% to 19% of dry ash), with the rest including Fe
2O
3 (3–6%) and K
2O (3–4%), plus a variable amount of other inorganic compounds, such as carbonates, and other metal oxides.
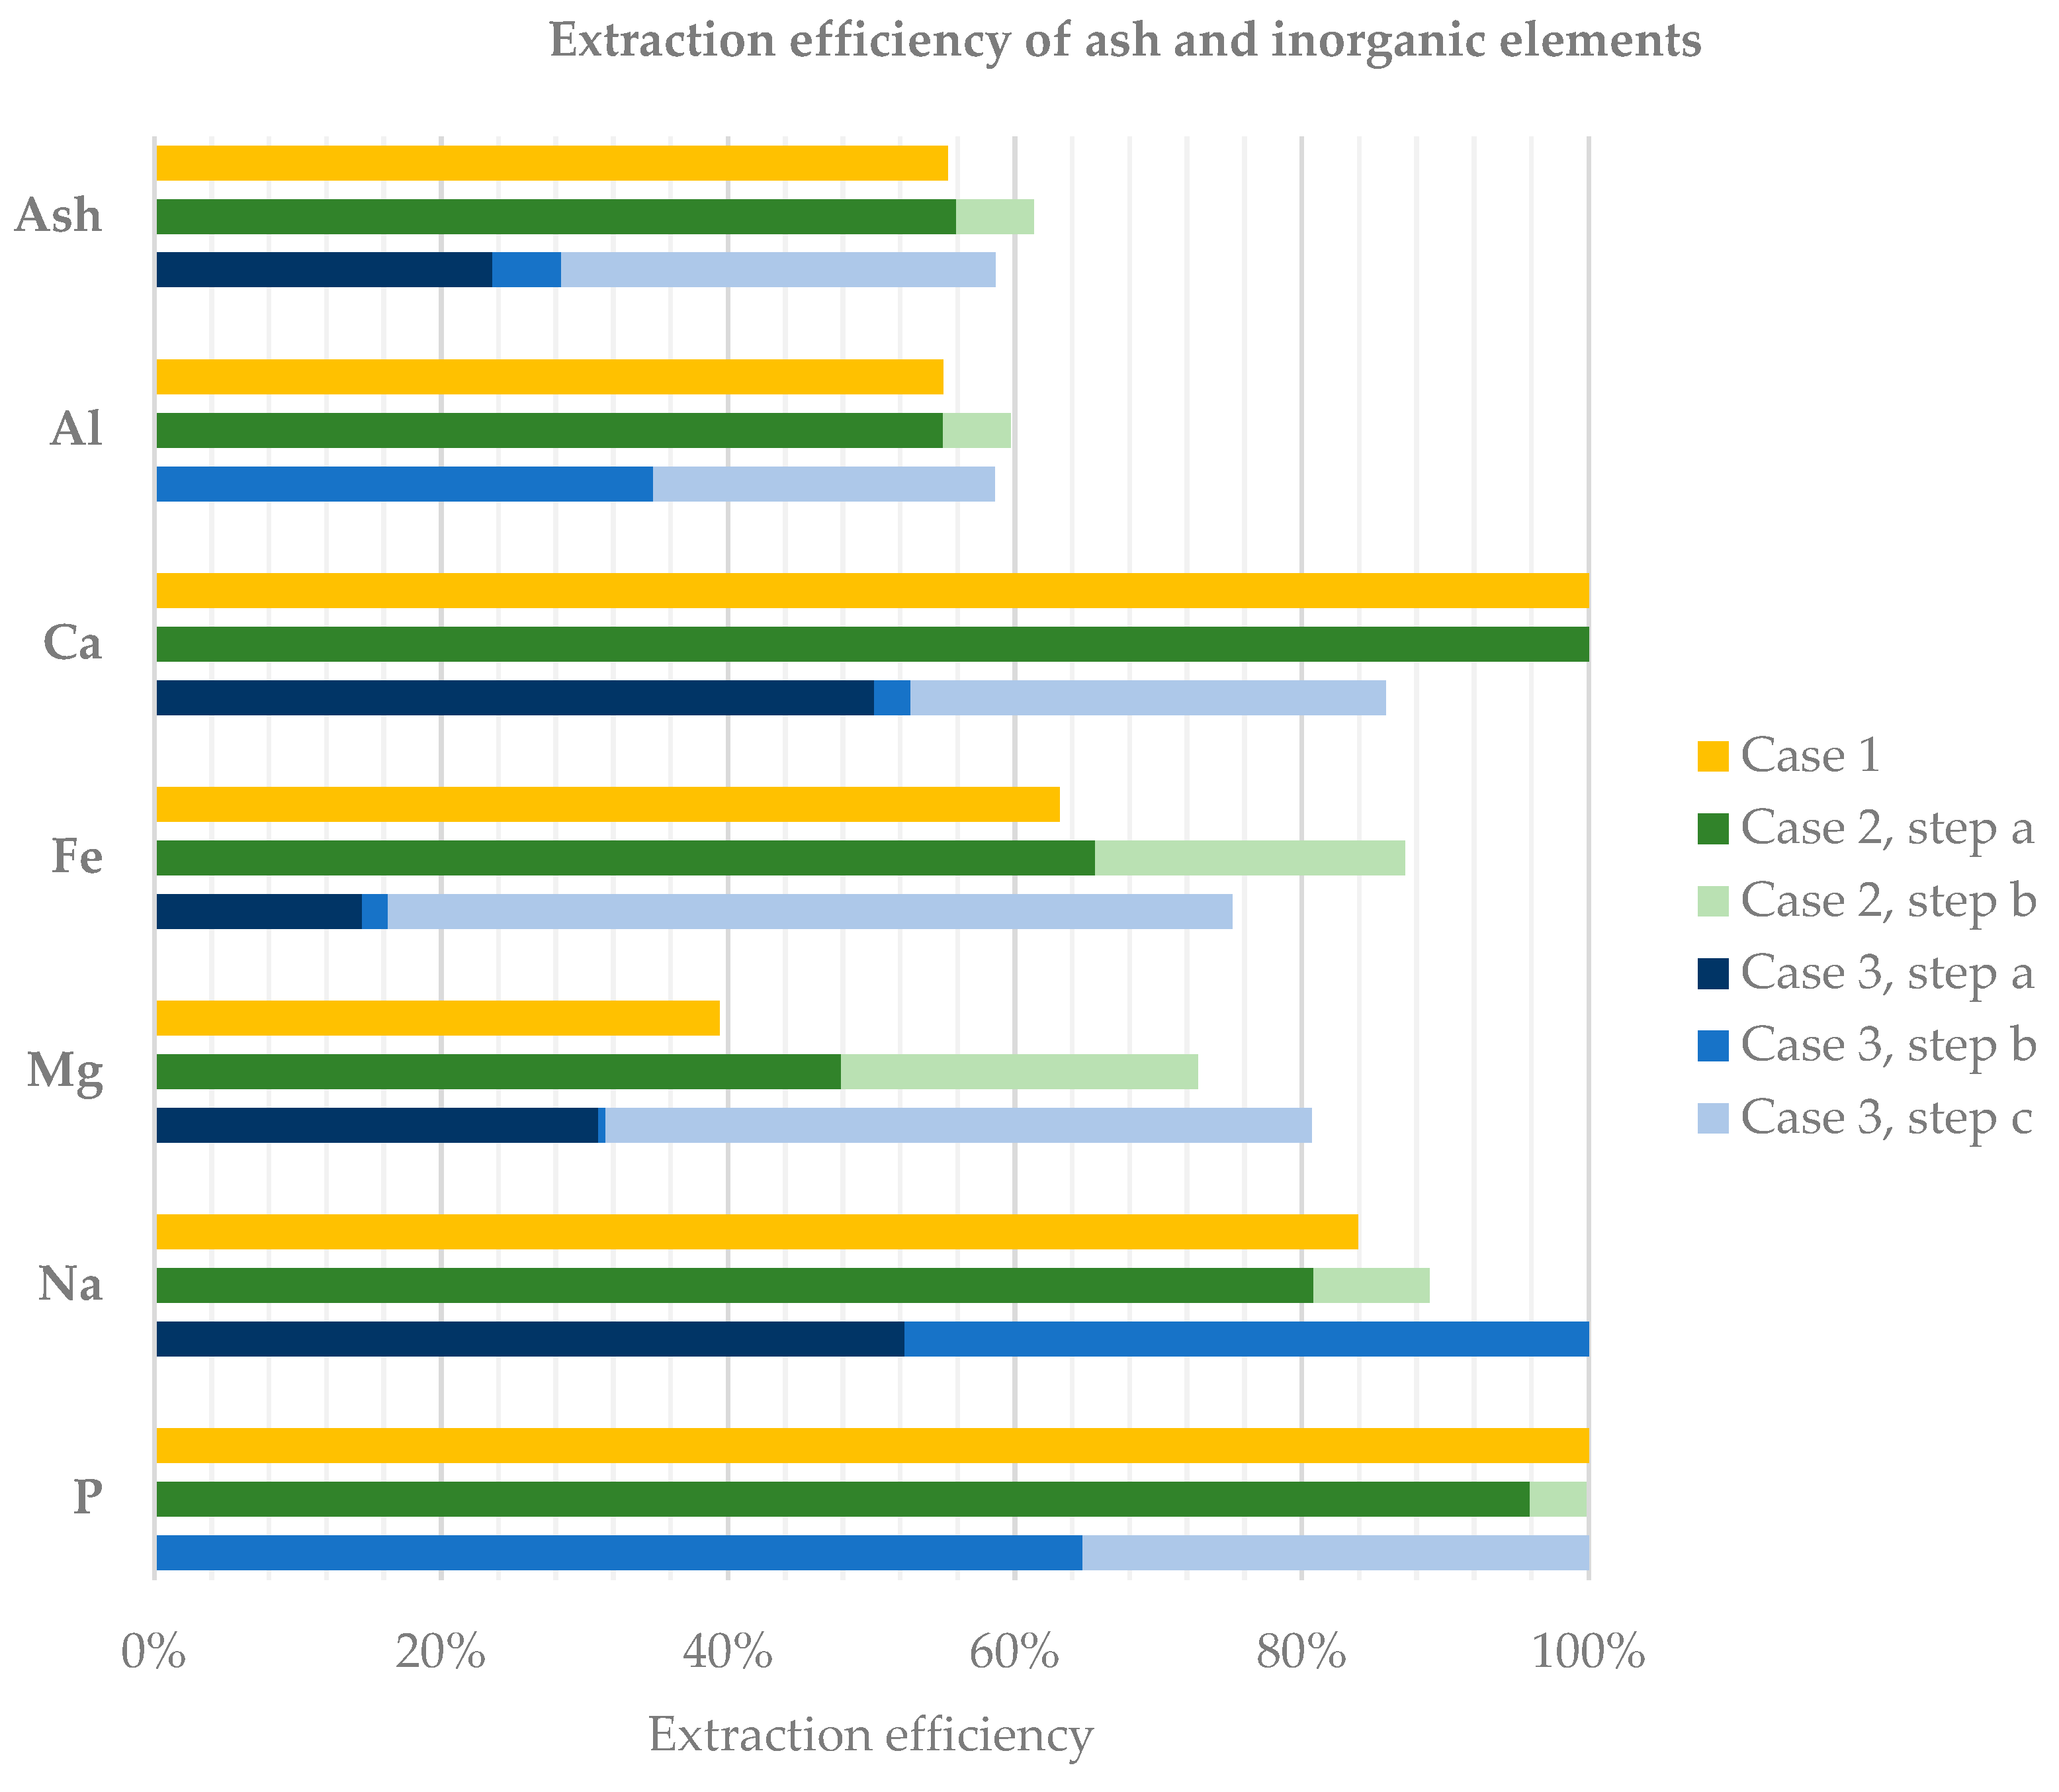
As visible from
Figure 3, which reports the performance in terms of ash and inorganic elements extraction rate obtained by the three performed test cases, high extraction efficiency was achieved for P and Ca in all the three cases, while the extraction efficiency of aluminium did not overcome 60%. Potassium extraction efficiency was not reported in
Figure 3 as this parameter could be determined only for case 1 and case 2. For these two cases, the extraction efficiency of potassium was found to be 33.6% and 42.5%, respectively.
3.6. Discussion on Leaching Tests Performances
The first one-step chemical leaching test enabled to extract 100% of P and Ca and more than 50% of Al and Fe contained in char, with 55.3% of initial ash dissolved into eluate. Precipitation by KOH enabled to recover 100% Al and P in a promising solid N–P–K inorganic fertiliser. Due to the presence of aluminium, which reduces the quality of a recovered inorganic compound, two additional tests were performed with two and three leaching steps, respectively. In fact, although aluminium is not considered harmful for soil, its presence in an inorganic compound lowers concentration of other useful elements for soil (NPK), leading the quality of the fertilizing product to decrease.
However, despite slightly higher ash extraction efficiency, double-step acid leaching by HNO
3 followed by HCl of case 2 enabled to extract around 55% Al, 100% Ca, and around 96% P without separate recovery of aluminium. In comparison with similar processes for combined recovery of carbon and inorganic elements, the process tested in this work has shown higher phosphorus extraction performances. In fact, a phosphorus extraction efficiency of 71% was achieved by acid leaching with HCl and subsequent precipitation with NaOH of hydrochar obtained from sewage sludge HTC [
38], while use of HNO
3 as a leaching agent led to recovery of 78% of the phosphorous retained in the hydrochar from an Italian sewage sludge [
39]. Despite a high phosphorus extraction rate, separation of Al from P was partially achieved in case 3 but with a complicated, ineffective process.
Analysing case 3, a leaching step by HNO3 aimed at production of calcium nitrate. In the following step (leaching by KOH), the targets of extraction were P and Al in the form of aluminium phosphate, and around 35% Al and 65% P were extracted. The solid product obtained from precipitation by CaCl2 applied to KOH eluate, washed with ethanol, had relevant Ca (7.3%) and P (12.1%) contents, which makes it potentially applicable as raw material for fertilizers production. However, phosphorus recovered in the precipitate was reduced compared to the total available as 30.6% of the P available in the eluate was recovered in the precipitate. Addition of a third leaching step by HCl enabled to reach 86% Ca and 100% P extraction from char, reducing the ash content of the generated biocoal. However, the third step performed with HCl produced a third eluate rich in chlorine, where most of the phosphorus and aluminium were dissolved, but of difficult valorisation in agriculture.
3.7. Potential Application of Obtained Biocoals
The quality of the biocoals produced by the three cases is comparable. All obtained biocoals presented a C content between 25 and 28% on a dry basis and an ash content between 57.4% and 61%. With ashes composed mainly of Al
2O
3 and SiO
2, the biocoal from case 2 presented an interesting BET surface area (70 m
2/g). The study demonstrated that, at the proposed conditions, maximum extraction of P and Ca is achievable, but silicon is not removed. Silica extraction by alkali leaching could be performed but at more severe conditions. For example, on coal fly ash, an extraction efficiency of SiO
2 around 80% was achieved at NaOH concentration of 40%, ratio of fly ash to NaOH 1:1, leaching temperature of 95 °C, and leaching time of one hour [
40]. However, an increase in operating conditions severity was avoided as it could affect the organic matter of chars and could also impact the process economy.
A more interesting strategy could be represented by application of biocoal as precursor for adsorbents production, a SiO
2 source in the construction industry, or in metallurgy to produce silicon metal in submerged arc furnaces. In the case of silicon metal production, during the process, SiO
2 is reduced into silicon at high temperatures (>2000 °C). A reduction reaction takes place by adding a reducing agent to the silica. The reducing agent consists of carbon in the form of mineral carbon, or charcoal or wood chips [
41]. Quartz sand and carbon are fed in appropriate proportions through the top, and liquid silicon is extracted at the bottom [
42]. According to the simplified reaction of the process [
41], 0.4 kg C is necessary per kg of SiO
2 reduced. The ratios between C and SiO
2 contained in the biocoals from case 1, case 2, and case 3 correspond to 0.6, 0.8, and 0.6, respectively, meaning that they all contain an excess of C compared to the stoichiometric quantity. According to the reaction, C excess can also result in production of silicon carbide SiC [
41].
