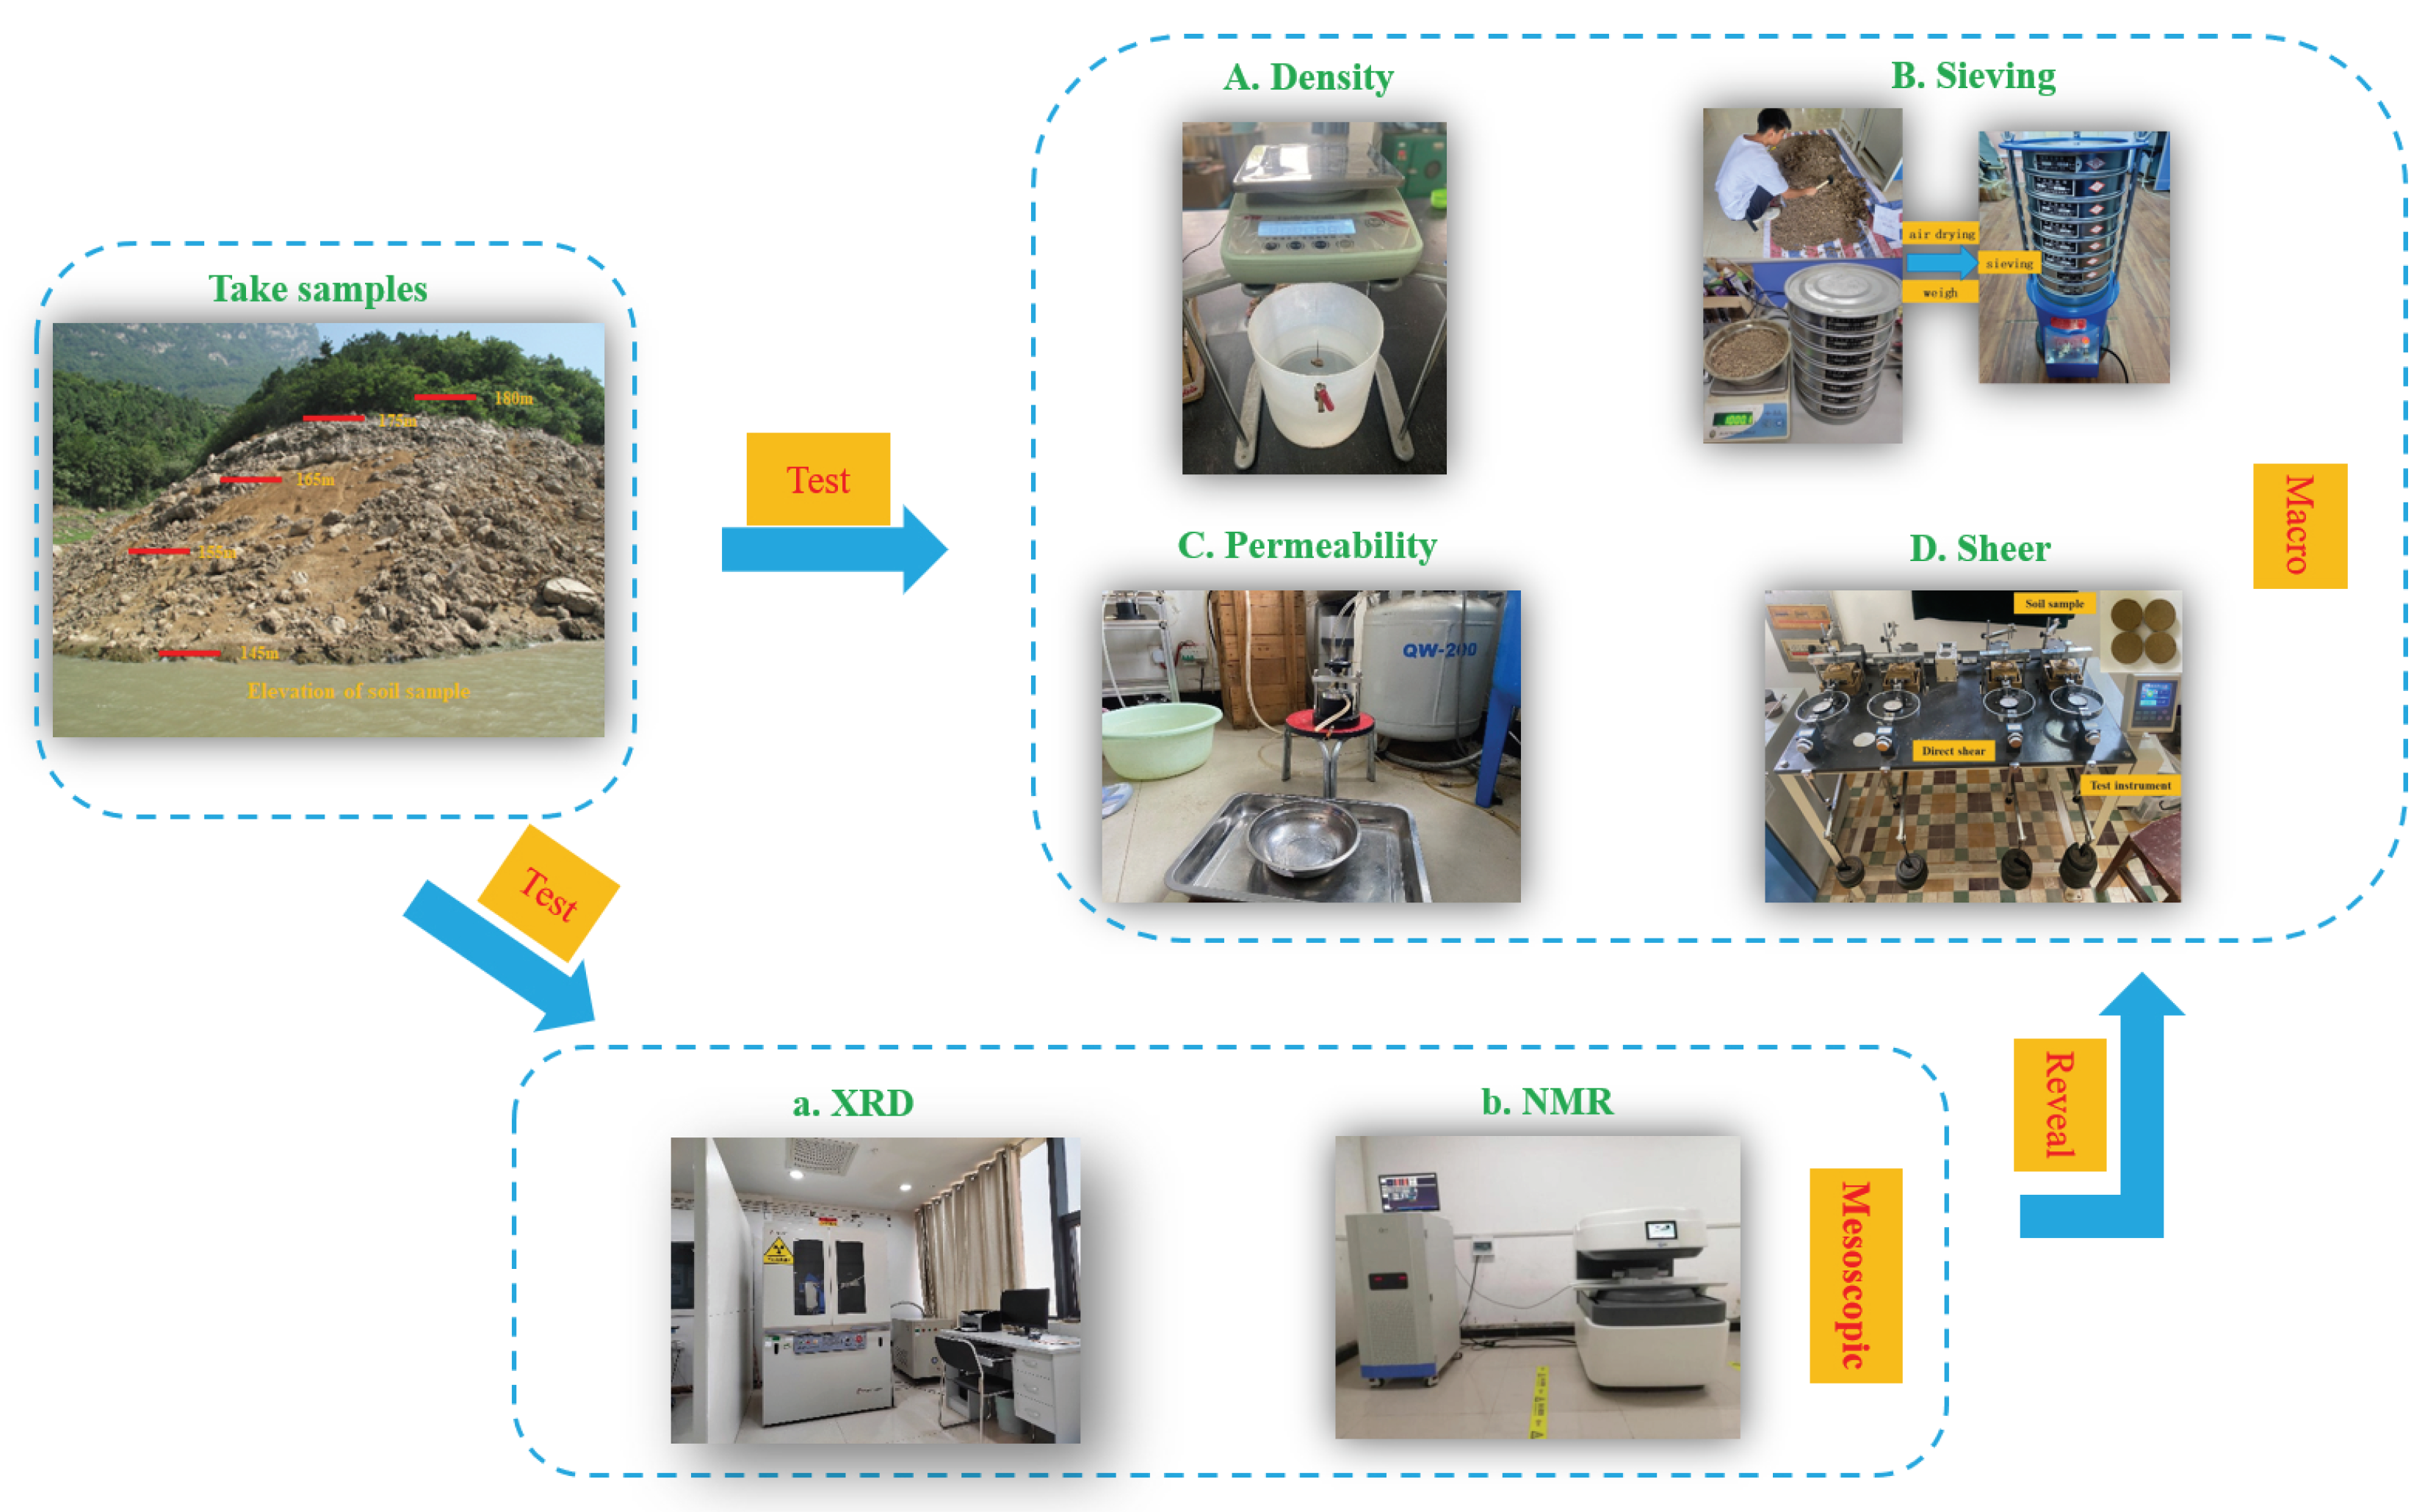
3.1. Physical Index
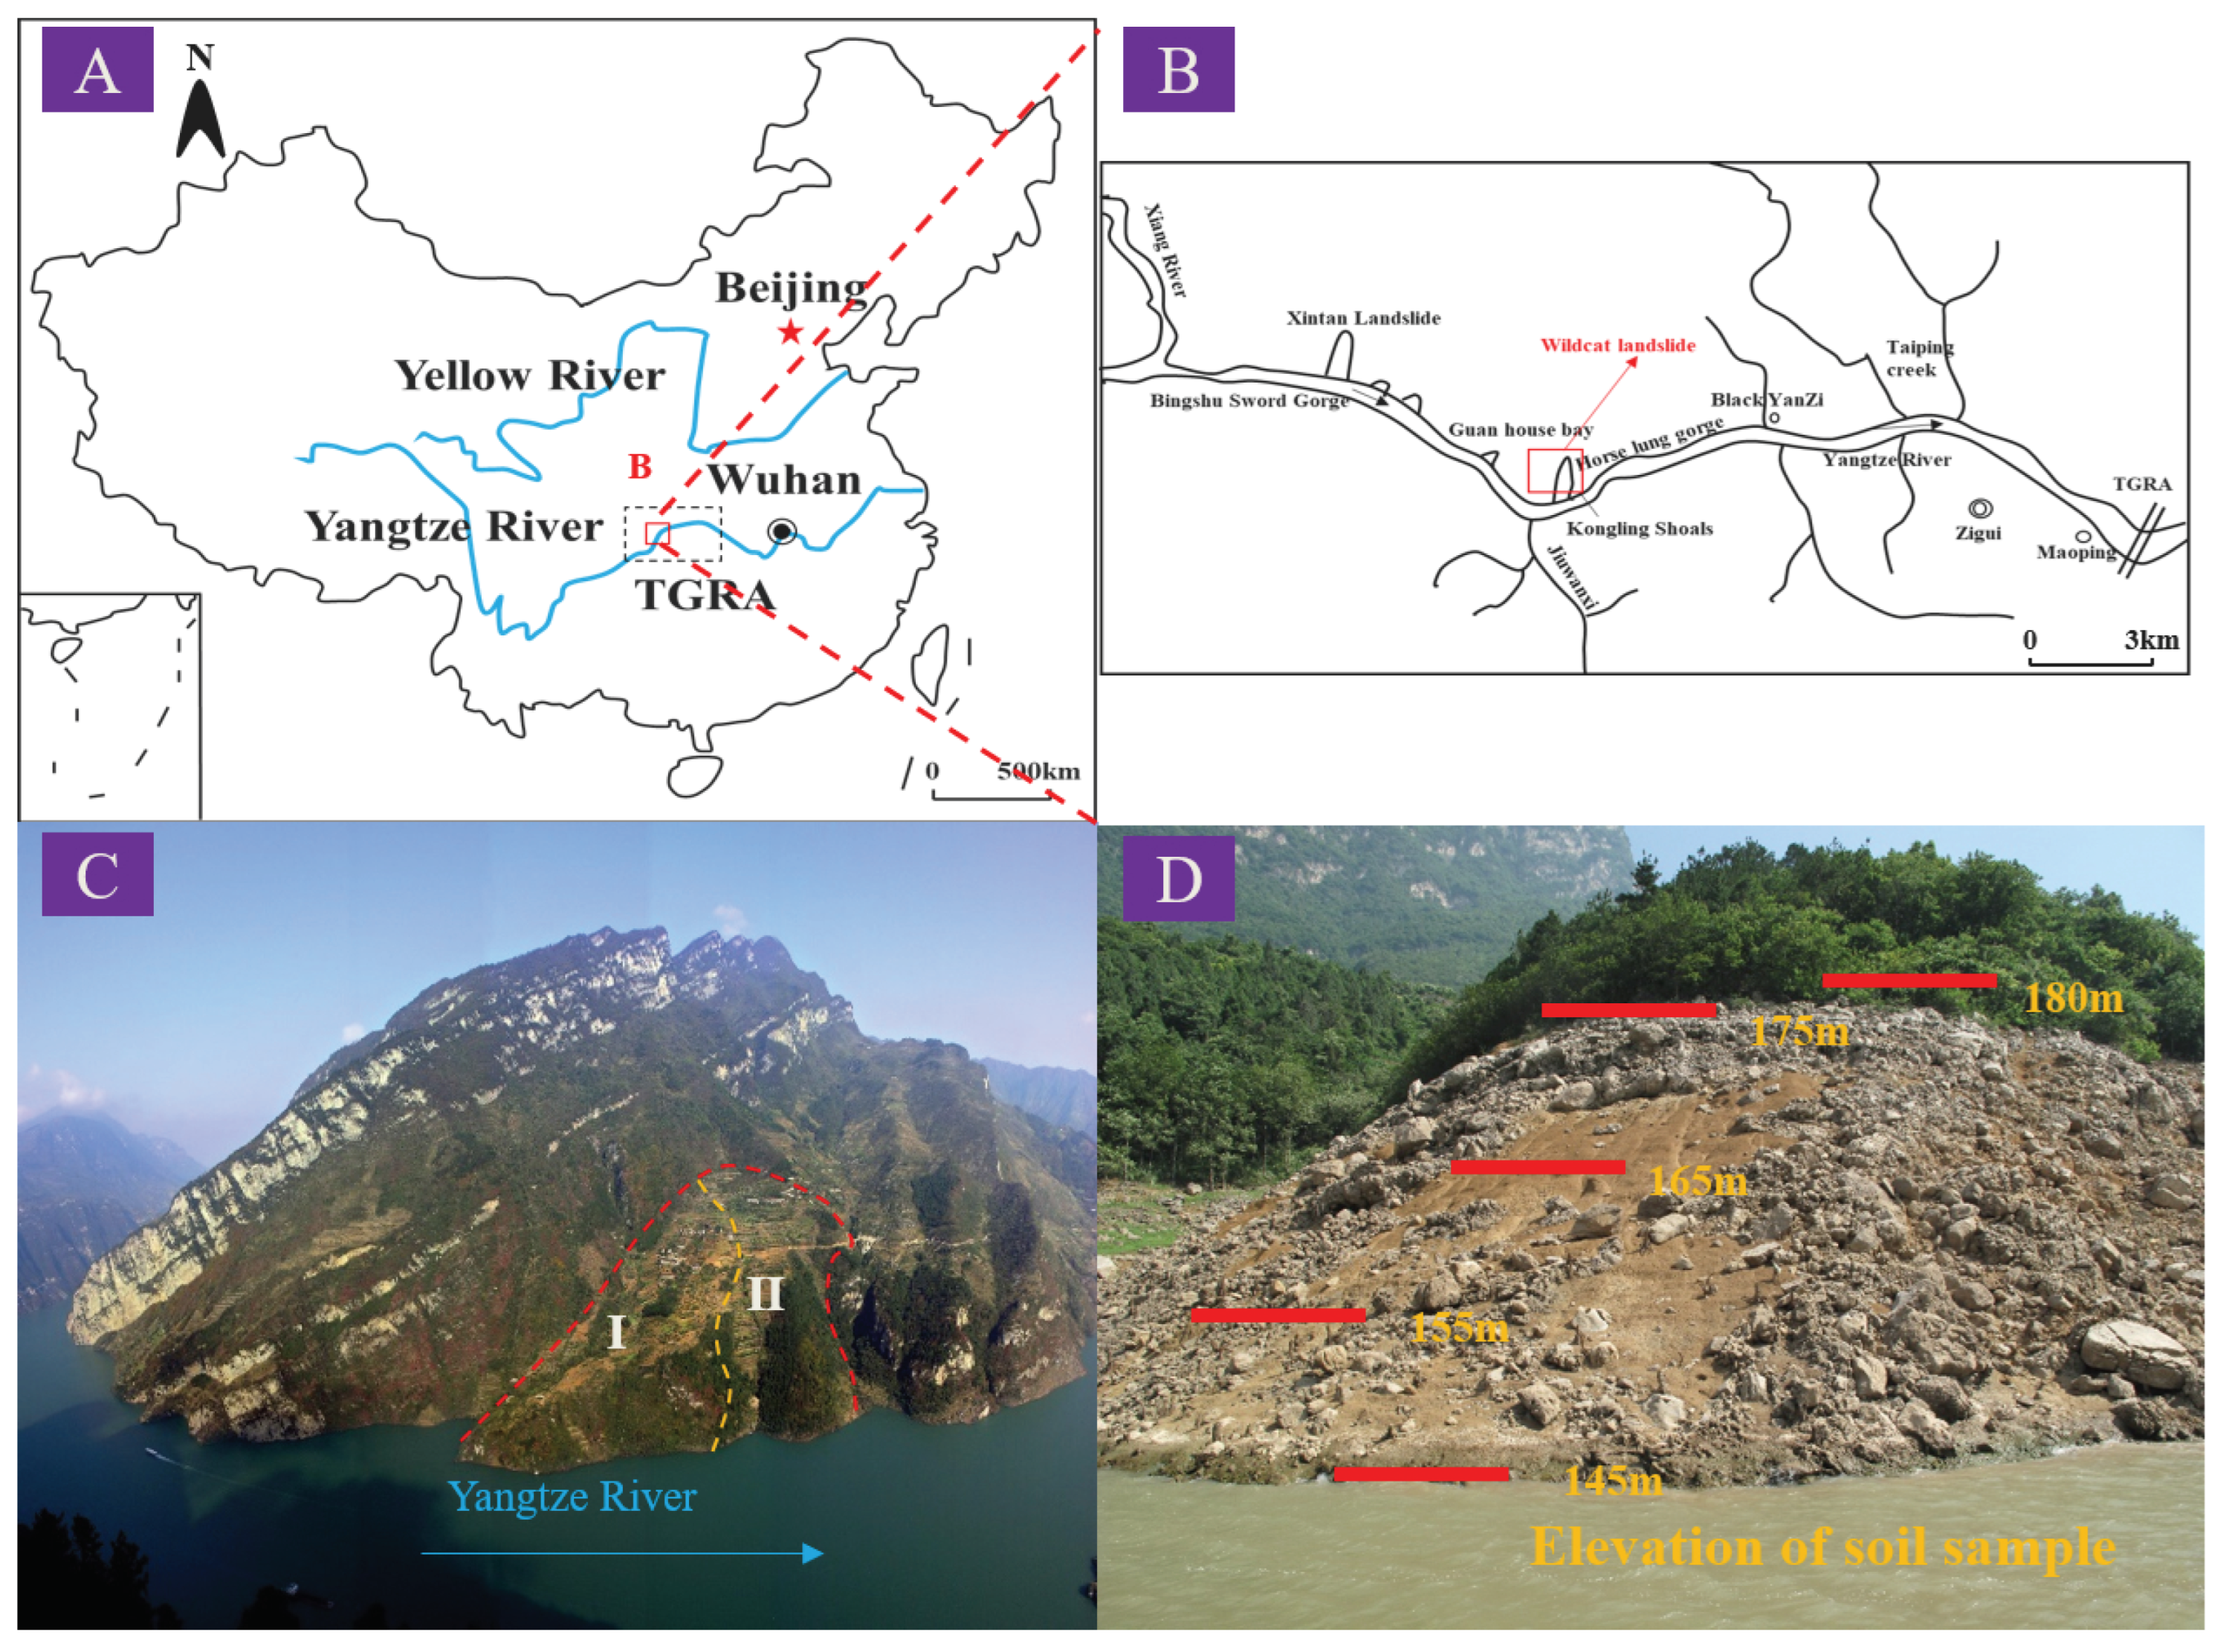
Soil samples were selected from five different elevations in the water-leveling zone of the Wildcat landslide, and the natural moisture content of the soil was tested by the drying method.
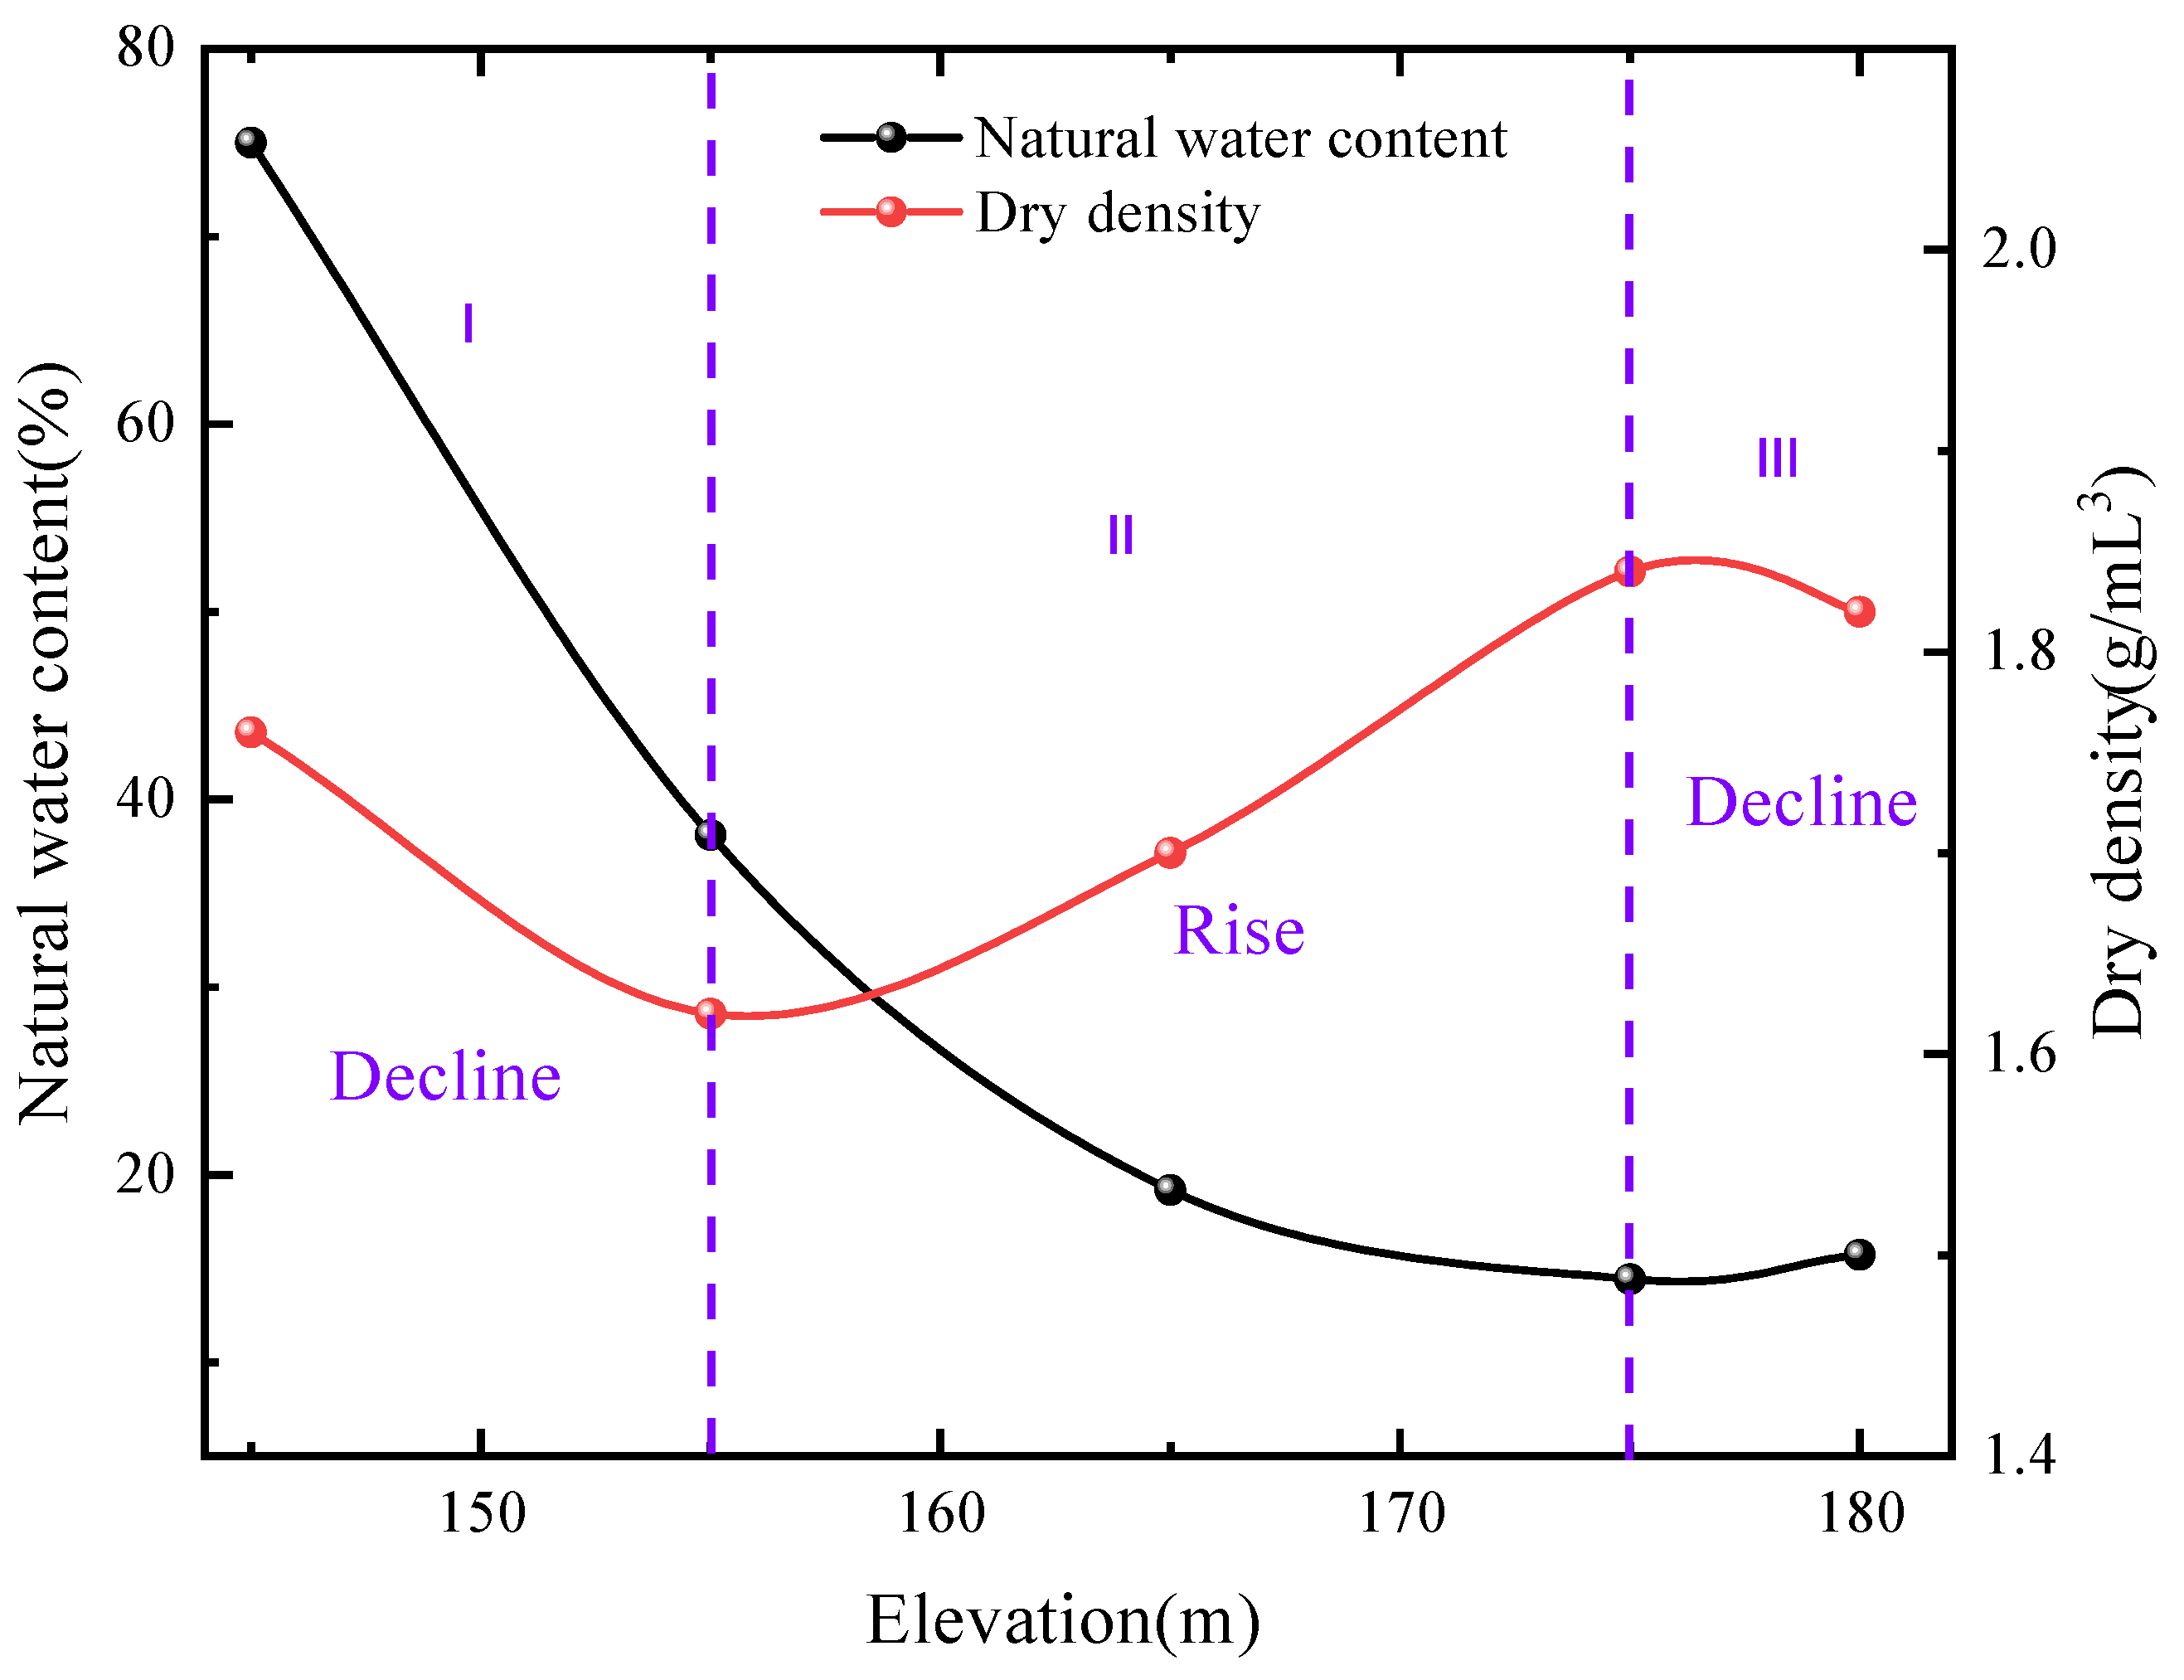
Figure 3 shows the various rules of the dry density and natural water content of the samples of the soil at different elevations. It can be seen in the figure that the natural water content of soil samples is negatively correlated with the sampling elevation and decreases with the elevation increase. After the soil mass was dried for 24 h in the oven, the wax sealing method was used to test the dry density of the soil sample. As shown in
Figure 3, the dry density of the soil sample was at a minimum when the sampling elevation was 155 m, and at a maximum when the sampling elevation was 175 m. When the sampling elevation was between 155 m and 175 m, the dry density of the soil sample increased with the increase in the sampling elevation. When the sampling elevation was 180 m, the dry density of the soil sample began to decrease, and when the sampling elevation was 145 m, the dry density of the soil sample was greater than that of the soil sample at the elevation of 155 m.
The above rules show that the natural water content and dry density of the soil at different elevations are closely related to the water level elevation. The closer the soil sample is to the water level elevation of 145 m, the higher the natural water content is and the lower the dry density is. The farther away the soil sample is from that water level elevation, the lower the natural water content is and the higher the dry density is. Therefore, the fluctuation of the water level in the water-leveling zone will lead to the long-term unsaturated state of the soil mass in the region, and the moisture content of the soil mass at different elevations will be different.
The landfall zone of the Wildcat landslide is a soil–rock accumulation landslide, and the soil of different elevations belongs to the same area. The distribution and structure of soil particles in macro and meso are self-similar. Therefore, according to [
25], the fractal theory can be used to quantitatively fractal the self-similarity of this kind of soil–rock mixture. In fractal theory, the number
N(
R) of particles with particle size less than or equal to
R has a positive correlation with particle size (a simplified expression of the constant term), namely
In Equation (
1),
D is the fractal dimension.
In practice, it is found that when the particle size is large, it can be read; when the particle size is small, the size of the particle group is too large to be obtained directly. Equation (
1) can be derived and transformed into a mass distribution model, and the derivation process is as follows:
If the particles are assumed to be spherical, then the sum of the particle mass of a certain particle group
is proportional to the product of the particle size
and the number of particles
:
Combined with Equations (
2) and (
3), we obtain the following:
The cumulative mass
of particles smaller than a certain particle size can be obtained by integrating both ends within the particle size range in Equation (
4).
According to the characteristics of the gradation curve, the cumulative mass percentage
is positively correlated with
, so Equation (
5) is equivalent to
, and logarithms are taken at both ends:
According to Equation (
6),
is taken as the vertical coordinate and
as the horizontal coordinate, the skew rate
is calculated by linear fitting, and the fractal dimension of graininess is
.
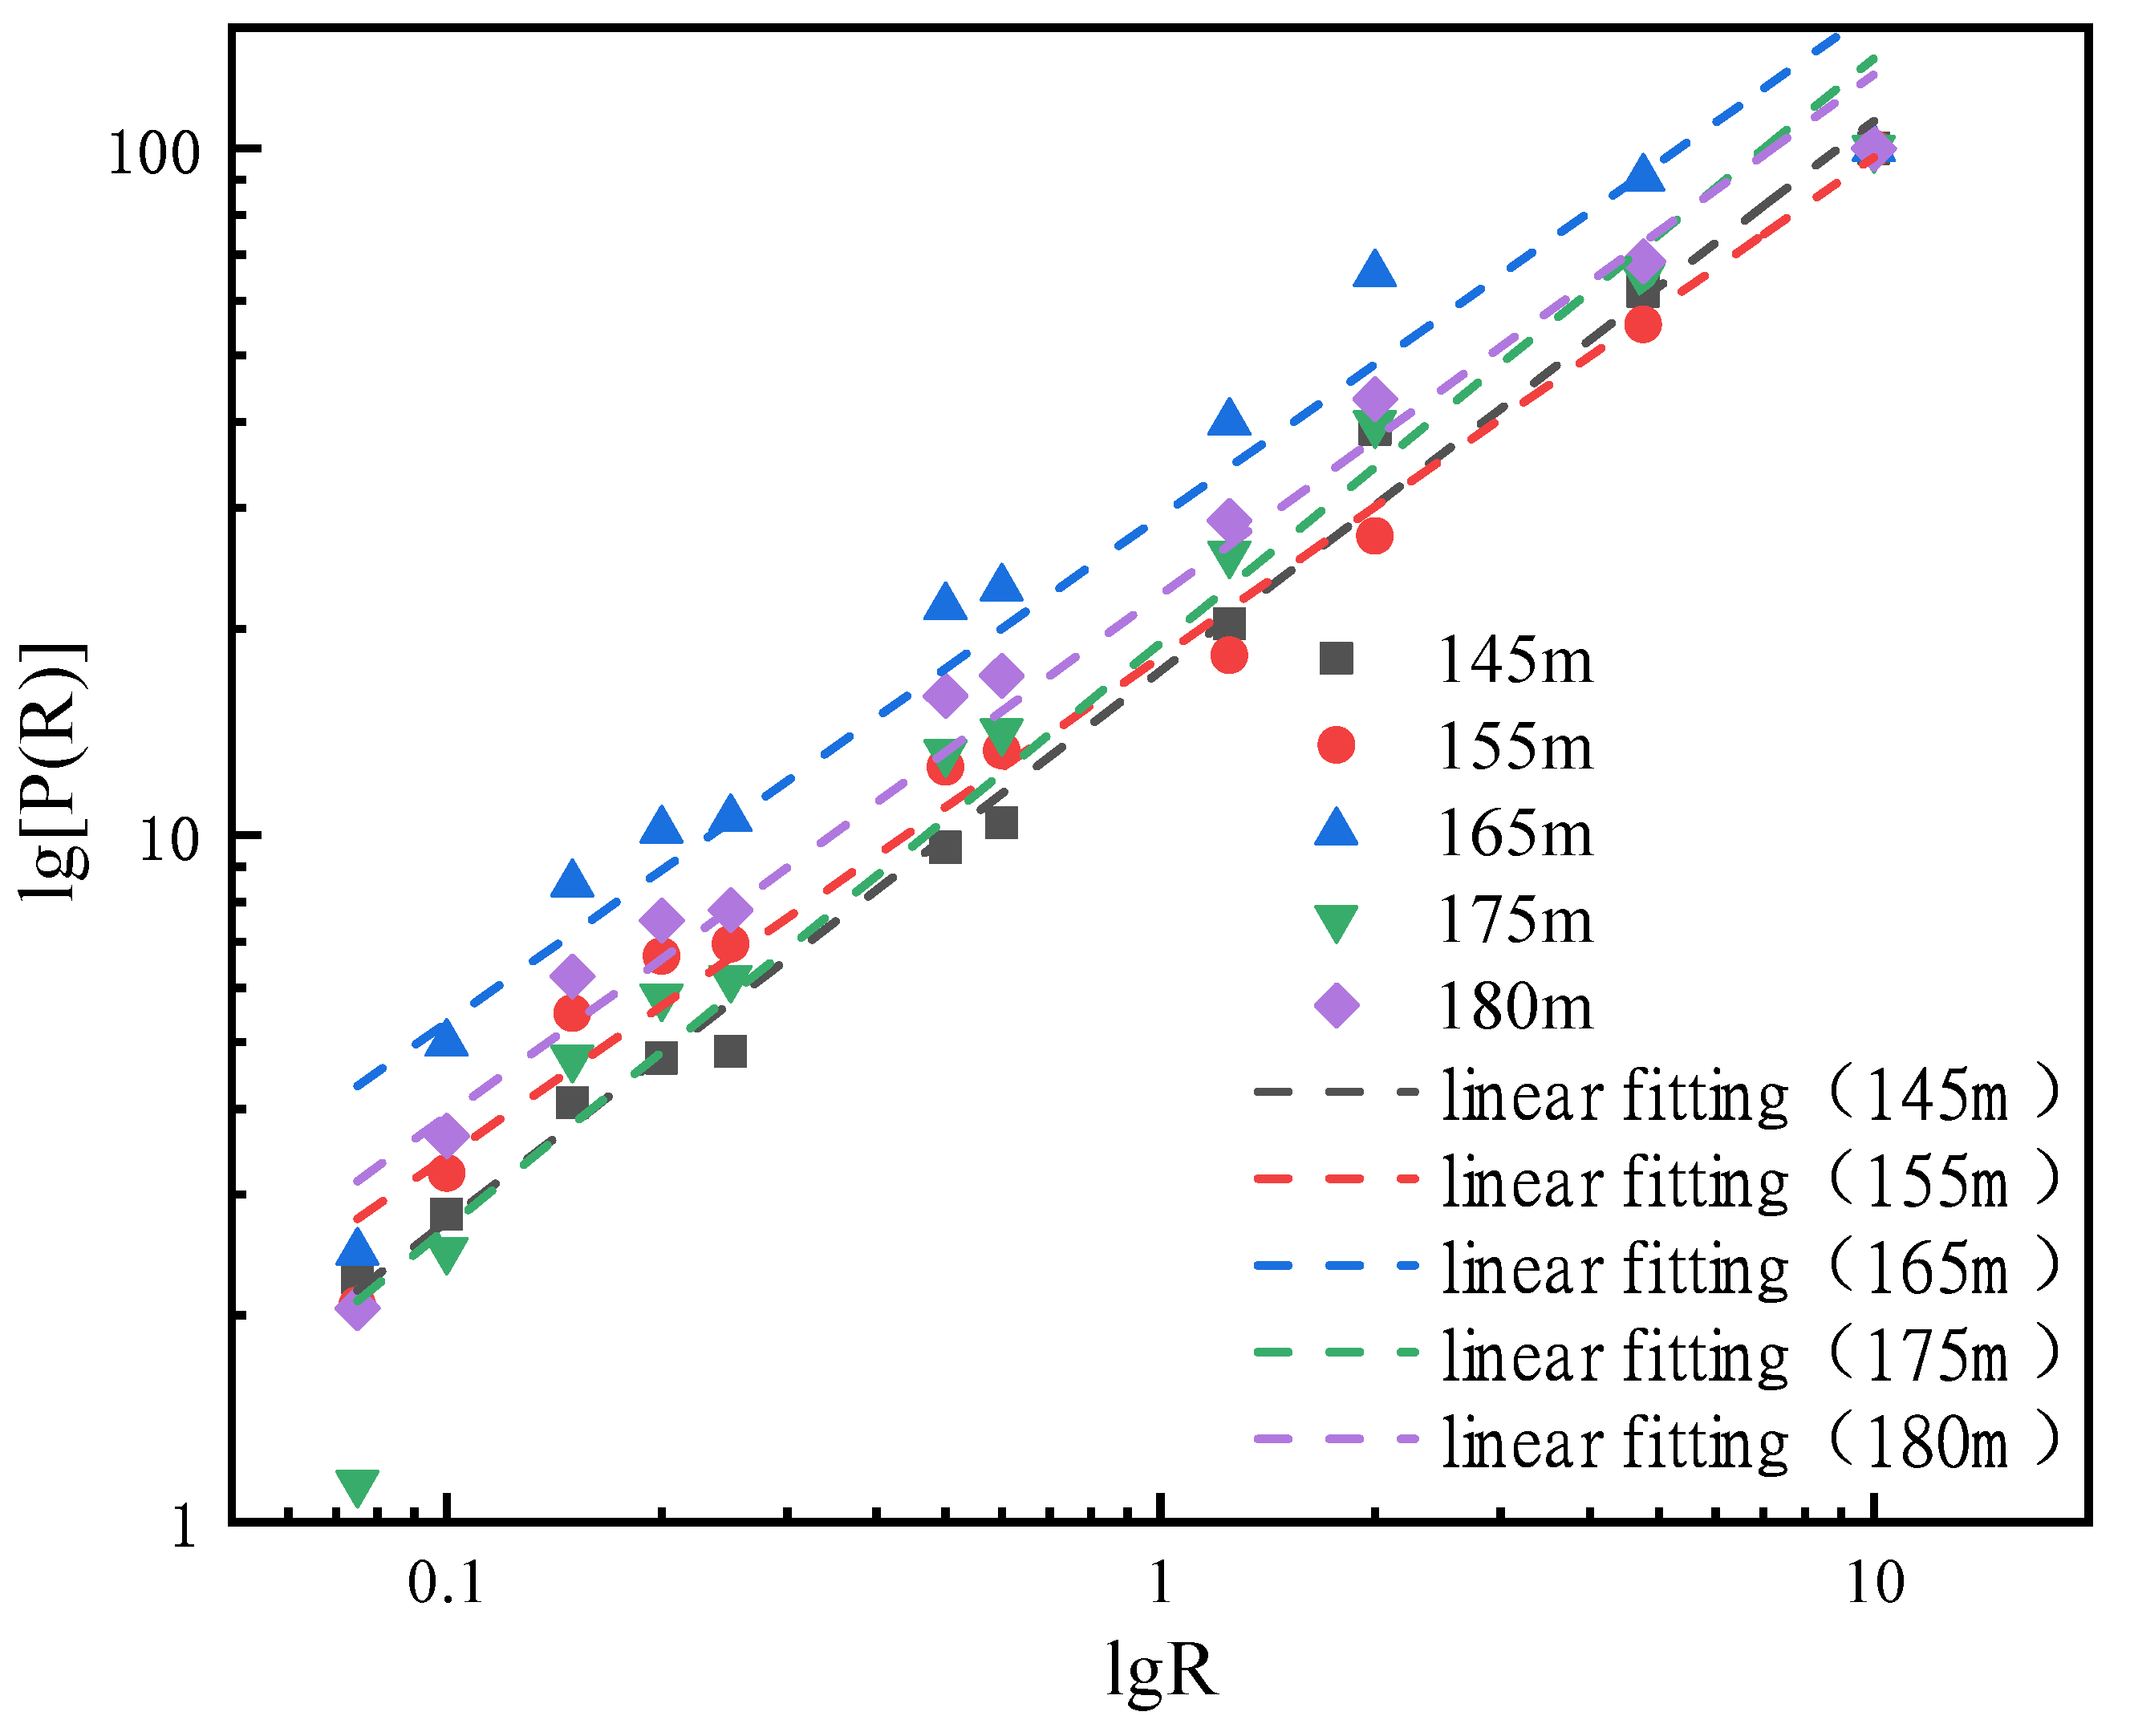
In the indoor laboratory, to retrieve the site soil sample screening test, the mass percentage distribution of soil particles at different elevations in the water dissipation zone of the Wildcat landslide was obtained, and the fractal theory was used to deduce it.
Figure 4 shows the fractal curves of the soil at different elevations. The linear fitting curve is shown in Equation (
7):
According to the linear fitting curve, the fractal dimension of soil mass is calculated, as shown in
Table 1. The fitting coefficient is between 0.95 and 0.99, and the fitting effect is ideal. The fractal dimension D of soil is between 2.15 and 2.28.
The fractal theory is a comprehensive fractal of all soil particles, which can be regarded as a general understanding of soil particles from local to the whole. Therefore, the fractal dimension can be used as a quantitative characteristic index of soil gradation characteristics. The larger the fractal dimension, the higher the degree of soil particles’ fragmentation. When the soil elevation is 155 m, the maximum fractal dimension is 2.28, indicating that the soil fracture degree is the highest. When the soil elevation is 175 m, the fractal dimension is 2.15, indicating that the soil fracture degree is the lowest. Furthermore, although the soil is selected as the same area, the fractal dimension of the soil at different elevations is different, so the deterioration degree of the soil at different elevations is also different.
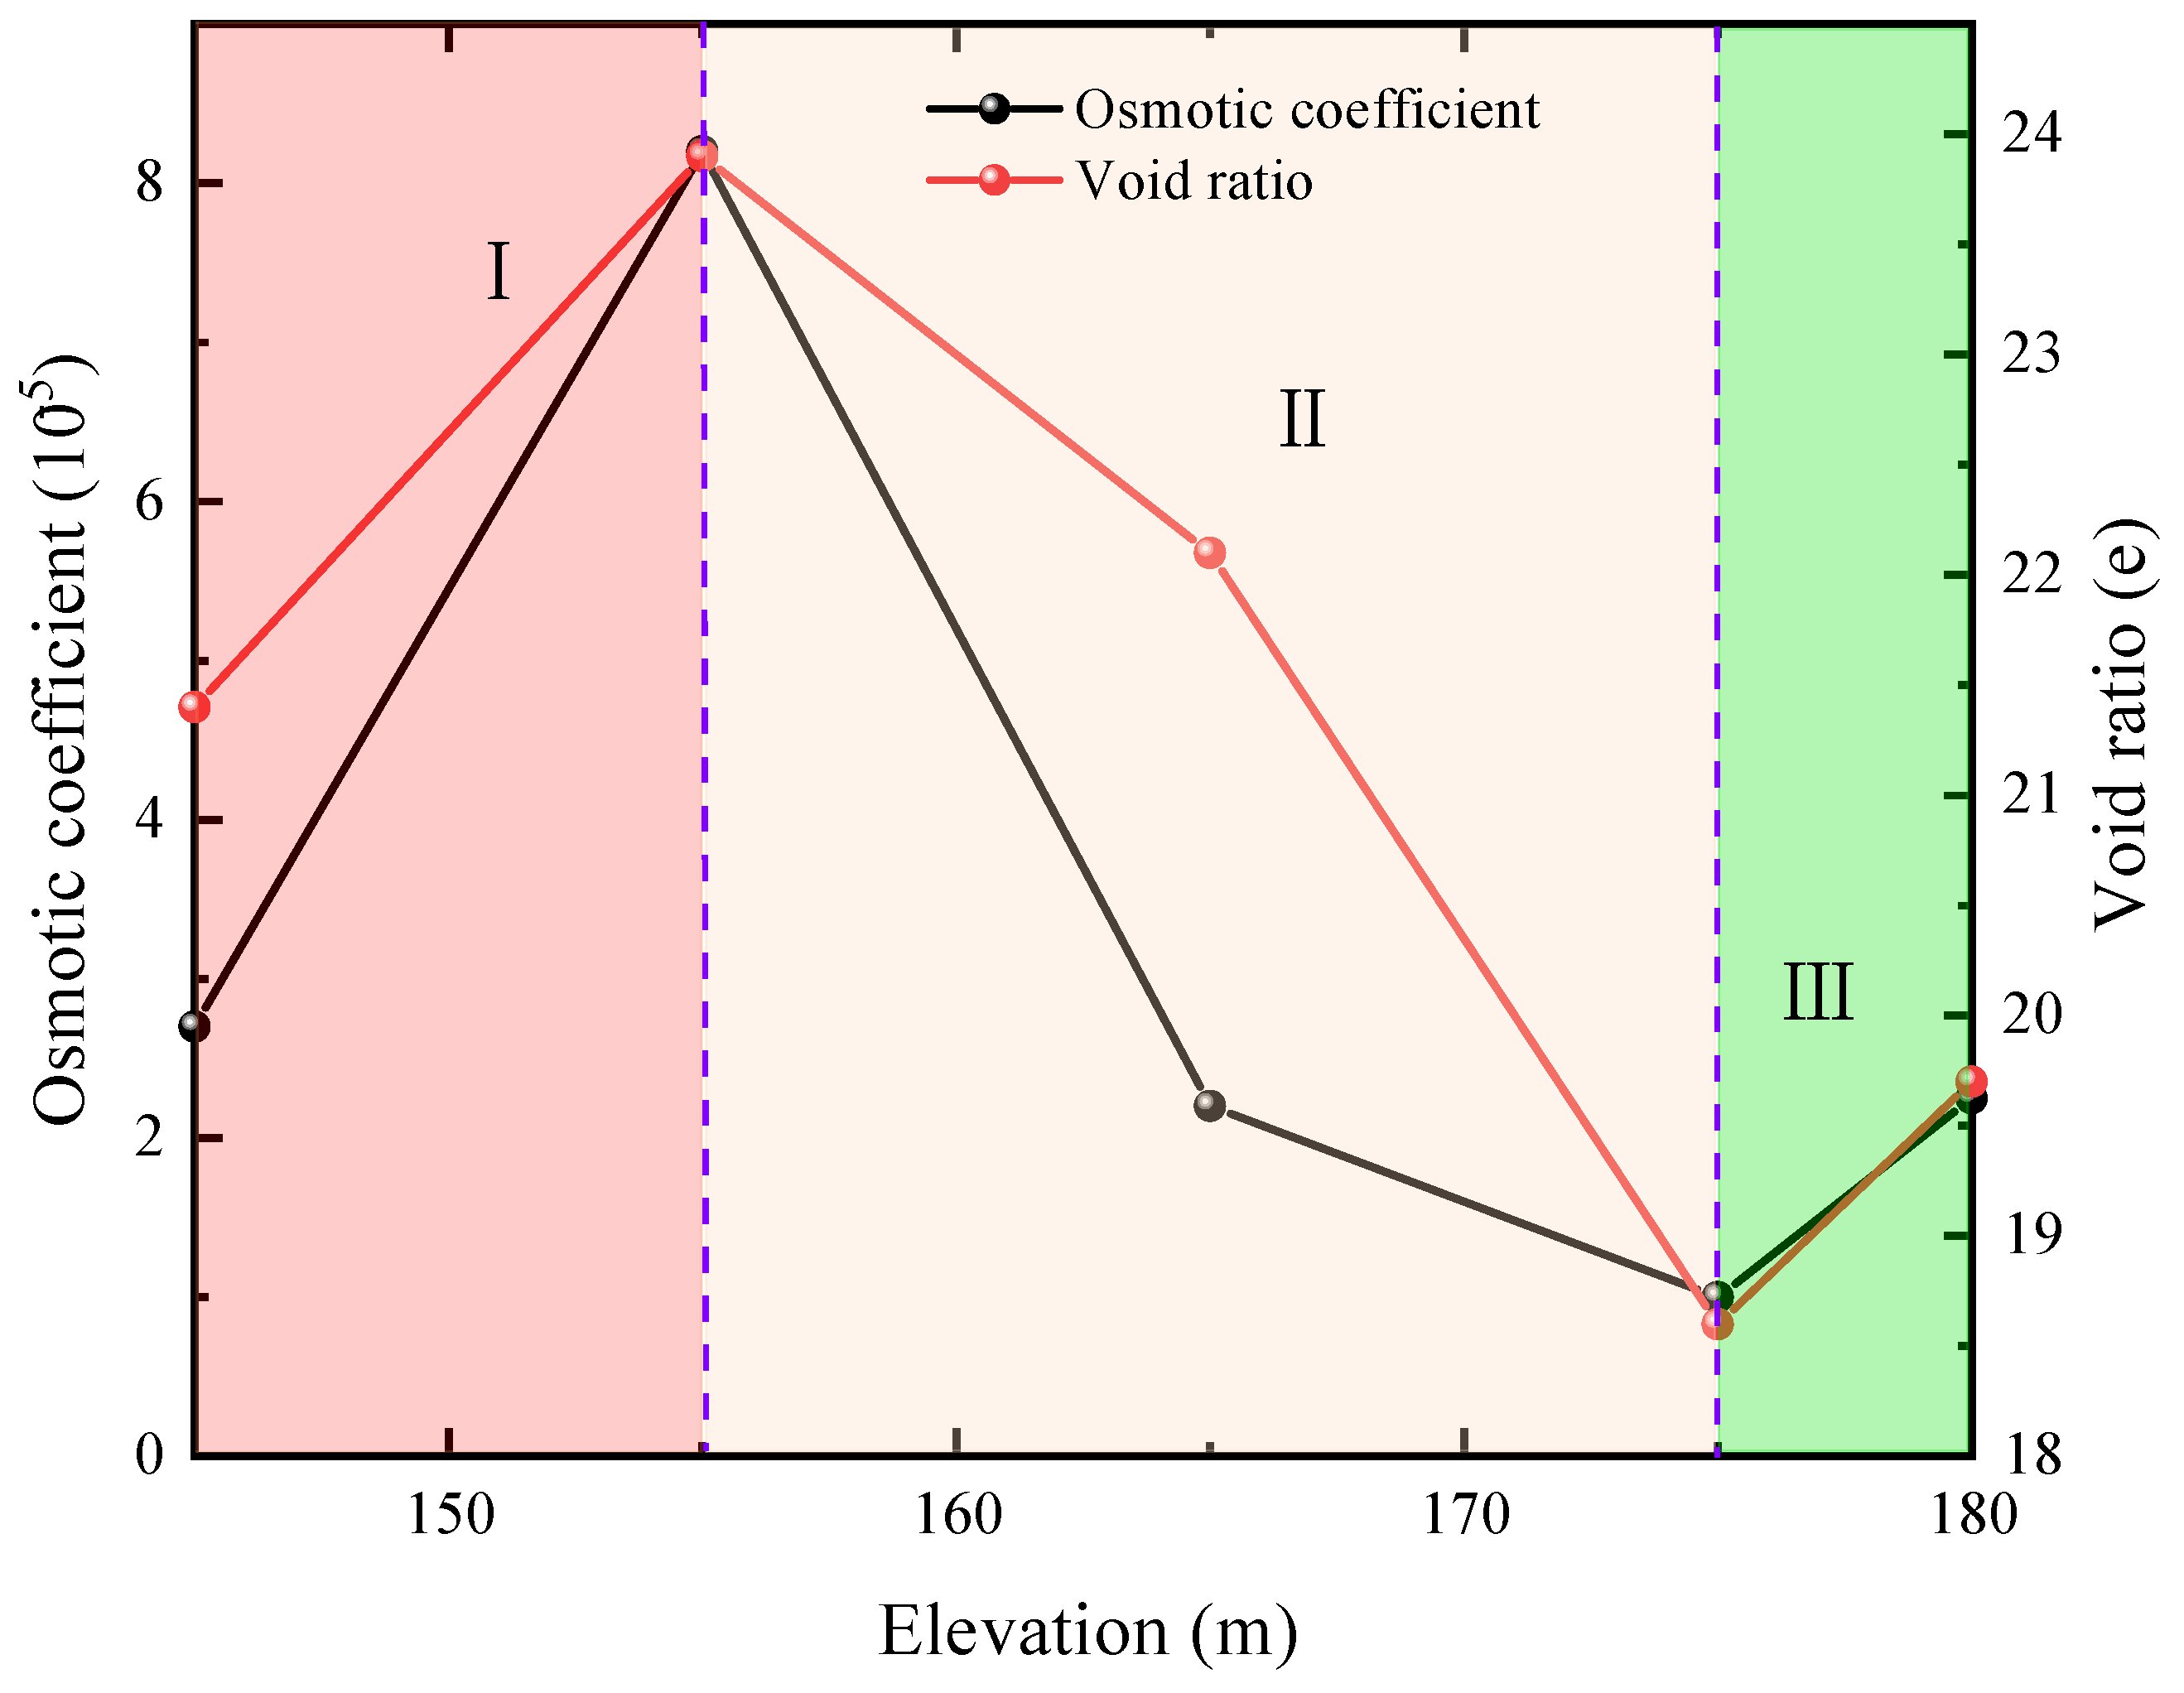
The permeability coefficient comprehensively reflects the difficulty of water flowing in the pores of the soil, which is mainly affected by the particle size (mineral composition, particle size, and grading), density (expressed by available pore ratio e), humidity (expressed by the available water content/saturation), structure (soil structure) and hydraulic path. In accordance with “GB/T50123-1999 Geotechnical test Method”, the saturated permeability coefficient
k of the soil at different elevations was tested using the constant head test. The calculation formula of the pore ratio is shown in Equation (
8):
where
e is the pore ratio,
is the saturated mass of soil, and
is the dry mass of soil.
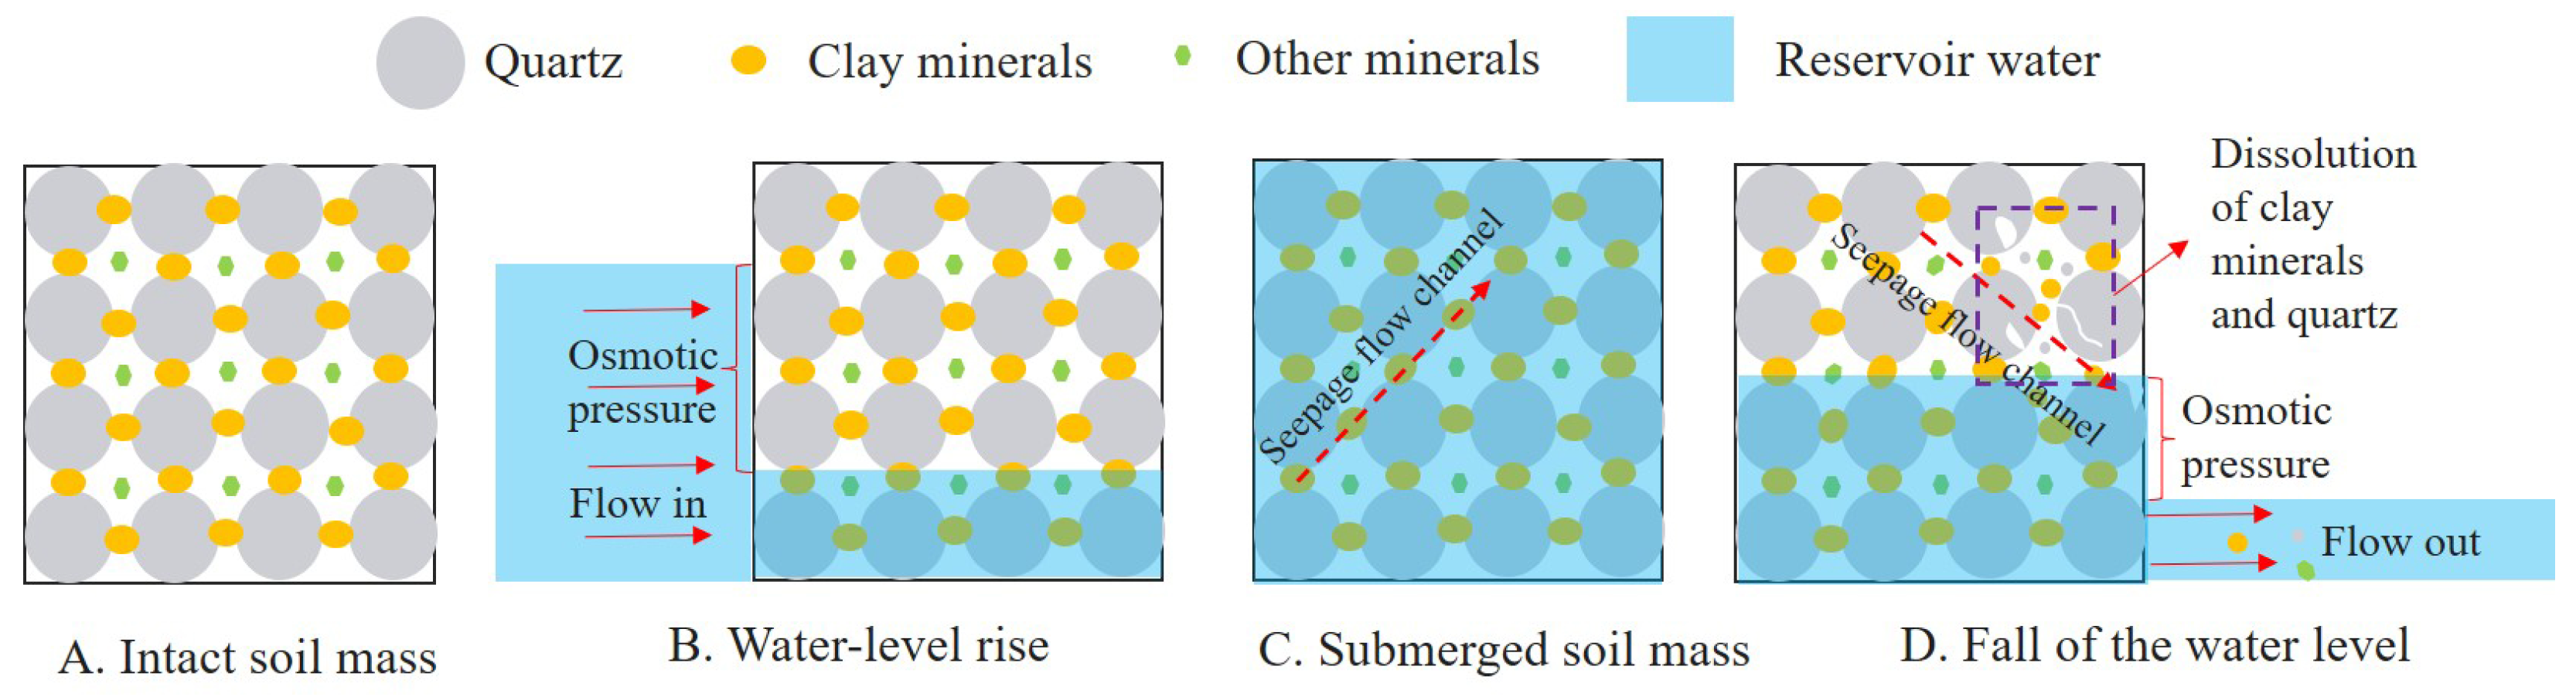
Figure 5 shows the variation law of the soil permeability coefficient and the pore ratio with elevation. It can be seen in the figure that the soil permeability coefficient and porosity ratio change in the same law. When the porosity ratio of soil increases, the permeability coefficient also increases, and when the porosity ratio decreases, the permeability coefficient also decreases. When the sampling elevation is 155 m, the soil pore ratio is the largest, and the permeability coefficient is also the largest. When the sampling elevation is 175 m, the soil porosity ratio is the smallest, and the soil permeability coefficient is the smallest. Therefore, according to the law of water seepage in the soil of different elevations, the soil seepage of different elevations in the fluctuation zone is defined by three regions: Region I, with an elevation of 145–155 m, is the penetration acceleration zone. Region II has an elevation of 155–175 m and is an osmotic deceleration zone. The elevation of Region III is more than 175 m and permeability is lowest at 175 m, but gradually increases with elevation. According to the above rules, due to the periodic changes in reservoir water, the deterioration of the soil mass of 155 m is the most severe. The internal pores of the soil mass are large, and the water flow rate in the soil mass is fast. Therefore, the pore ratio and permeability coefficient of the soil mass at the height of 155 m are the largest.
3.2. Strength Characteristics
As shown in
Figure 6, the change rules for the soil viscosity and friction angle are different at different sampling elevations. Comparing the sampling elevations of 145 m and 155 m, the soil cohesive force is larger, and the friction angle is smaller at 145 m. When the elevation is 155 m, the soil cohesive force is at a minimum, and the friction angle is at a maximum. When the sampling elevation is greater than 155 m and less than 175 m, the cohesion of the soil increases with the increase in elevation, and the friction angle decreases with the increase in elevation. When the sampling elevation is greater than 175 m, the cohesion of the soil decreases, and the friction angle increases. Therefore, different elevations of the fluctuation zone are divided into three areas: The first region has an elevation of 145–155 m, and the soil strength decreases; the second region has an elevation of 155–175 m, and the soil strength increases; the third region has an elevation of more than 175 m, and the soil strength decreases, but the amplitude is not large. There is no deterioration zone above the fall zone.
Thus, the macroscopic parameters of soil in different elevations at the same sampling location are significantly different. The main reason is that the elevation of the reservoir water level in the water-leveling zone of the Wildcat landslide varies from 145 to 175 m throughout the year. When the elevation is 145 m, it is the same as the lowest water level of the reservoir water, and the natural water content of the soil is the highest. However, because the soil of the Wildcat landslide is mainly gravel soil, under the condition of a water level change, more small gravel is deposited at the lower water level. Compared with the elevation of 155 m, the water level of 145 m contains more gravel. Therefore, when the elevation is 145 m, the soil density is higher, the permeability is smaller, and the soil strength is larger. When the sampling elevation is greater than or equal to 155 m and less than 175 m, the soil moisture content gradually decreases, indicating that the degree of soil water loss increases due to the decrease in water level, the soil density gradually increases, the permeability gradually decreases, and the soil strength gradually increases. When the sampling elevation is greater than 175 m, the soil is in the non-subsidence zone, there is obvious vegetation growth, and the vegetation roots have the function of water fixation. The soil contains vegetation roots during sampling, but the soil is loose after the removal of the roots in the laboratory test. Therefore, when the sampling elevation is greater than 175 m, the moisture content of the soil increases, the density decreases, the permeability increases, and the soil strength decreases. To sum up, periodic water level variation in the water-leveling zone will lead to significant differences in the physical properties of soil mass at different elevations, leading to different degrees of deterioration of the soil mass.
3.3. Microscopic Observations
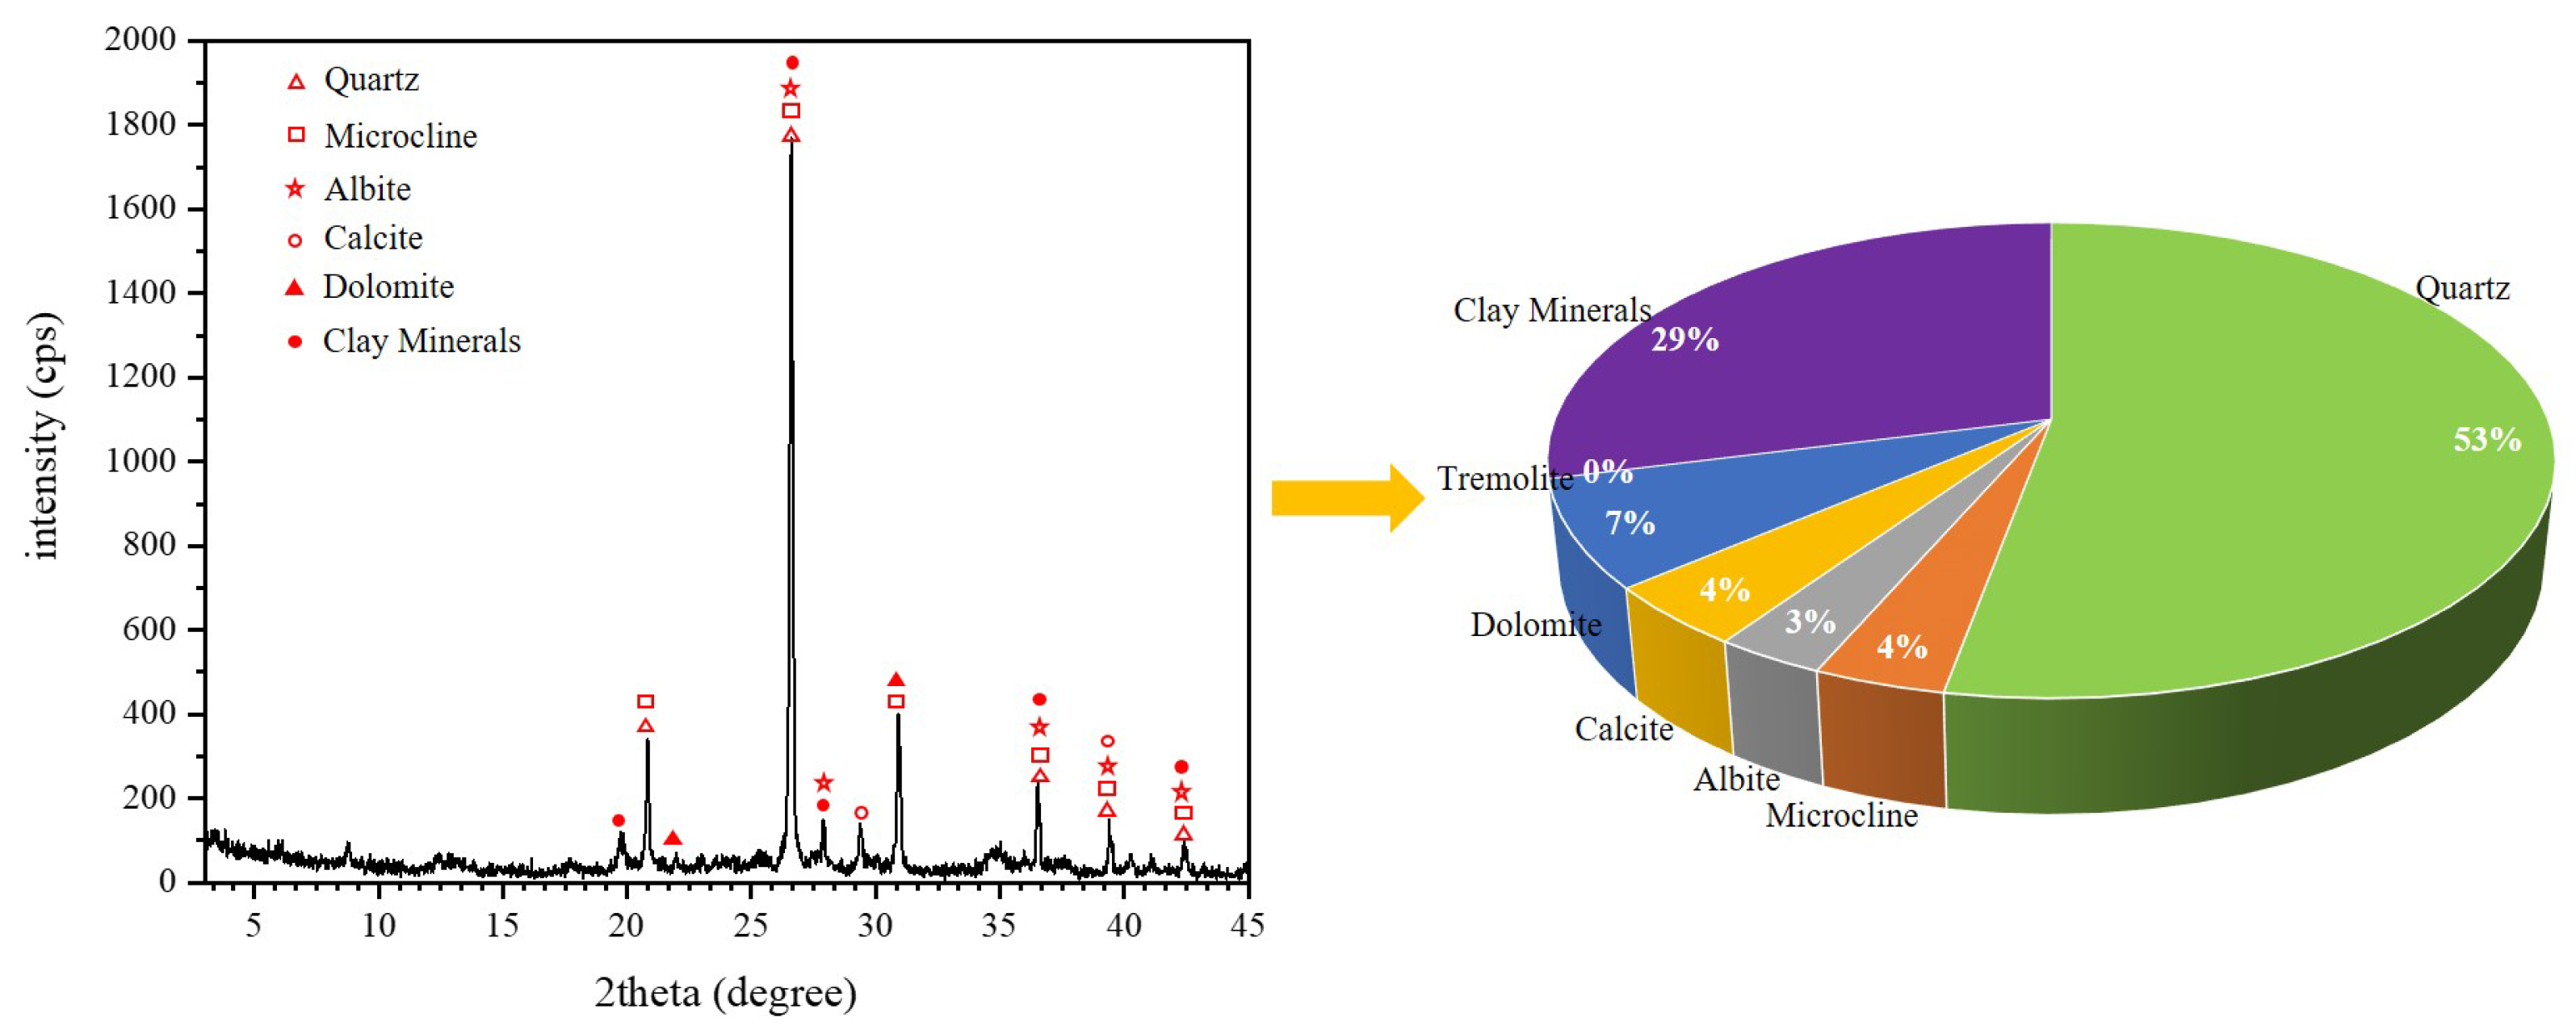
XRD tests were conducted on the samples of the soil at different elevations, and the test analysis employed samples of soil at an elevation of 145 m as an example, as shown in
Figure 7. It can be seen in the figure that the soil mass of the Wildcat landslide is mainly composed of quartz, clay minerals, potassium feldspar, alacrite, calcite, dolomite, tremolite, and other minerals, among which quartz and clay minerals are the main components, accounting for the largest proportion.
Figure 8 shows the mineral composition of the soil at different elevations. A comparison shows that the mineral composition of the soil at different elevations is different. When the elevation is 175 m, the total proportion of quartz and clay minerals in the soil reaches
. When the elevation is 155 m, this proportion is the lowest, only
. When the elevation is 145 m, this proportion is
. When the elevation is 165 m, the proportion is
. When the elevation is 180 m, the proportion is
.
The above analysis shows that the largest difference in the mineral composition of the soil at different elevations in the subsidence zone is the difference in the content of clay minerals and quartz. The clay mineral is the main component of the soil cement, and the quartz is the main component of the soil skeleton mineral. Therefore, the different amounts of quartz and clay minerals greatly affect the macroscopic strength properties of the soil. When the soil elevation is 175 m, the content of clay minerals and quartz is the highest, the soil is the most stable, and the cohesion is the highest. When the soil elevation is 155 m, the content of clay minerals and quartz is the lowest, the soil is the most unstable, and the cohesion is the lowest. According to the mineral composition of the soil at different elevations, the soil at different elevations in the subsidence zone can also be divided into three regions: Region I has an elevation of 145–155 m, and the proportion of clay minerals and quartz decreases. The elevation of Region II is 155–175 m, and the proportion of clay minerals and quartz increases. The elevation of Region III is more than 175 m, and the proportion of clay minerals and quartz decreases, but the decreasing range is relatively low.
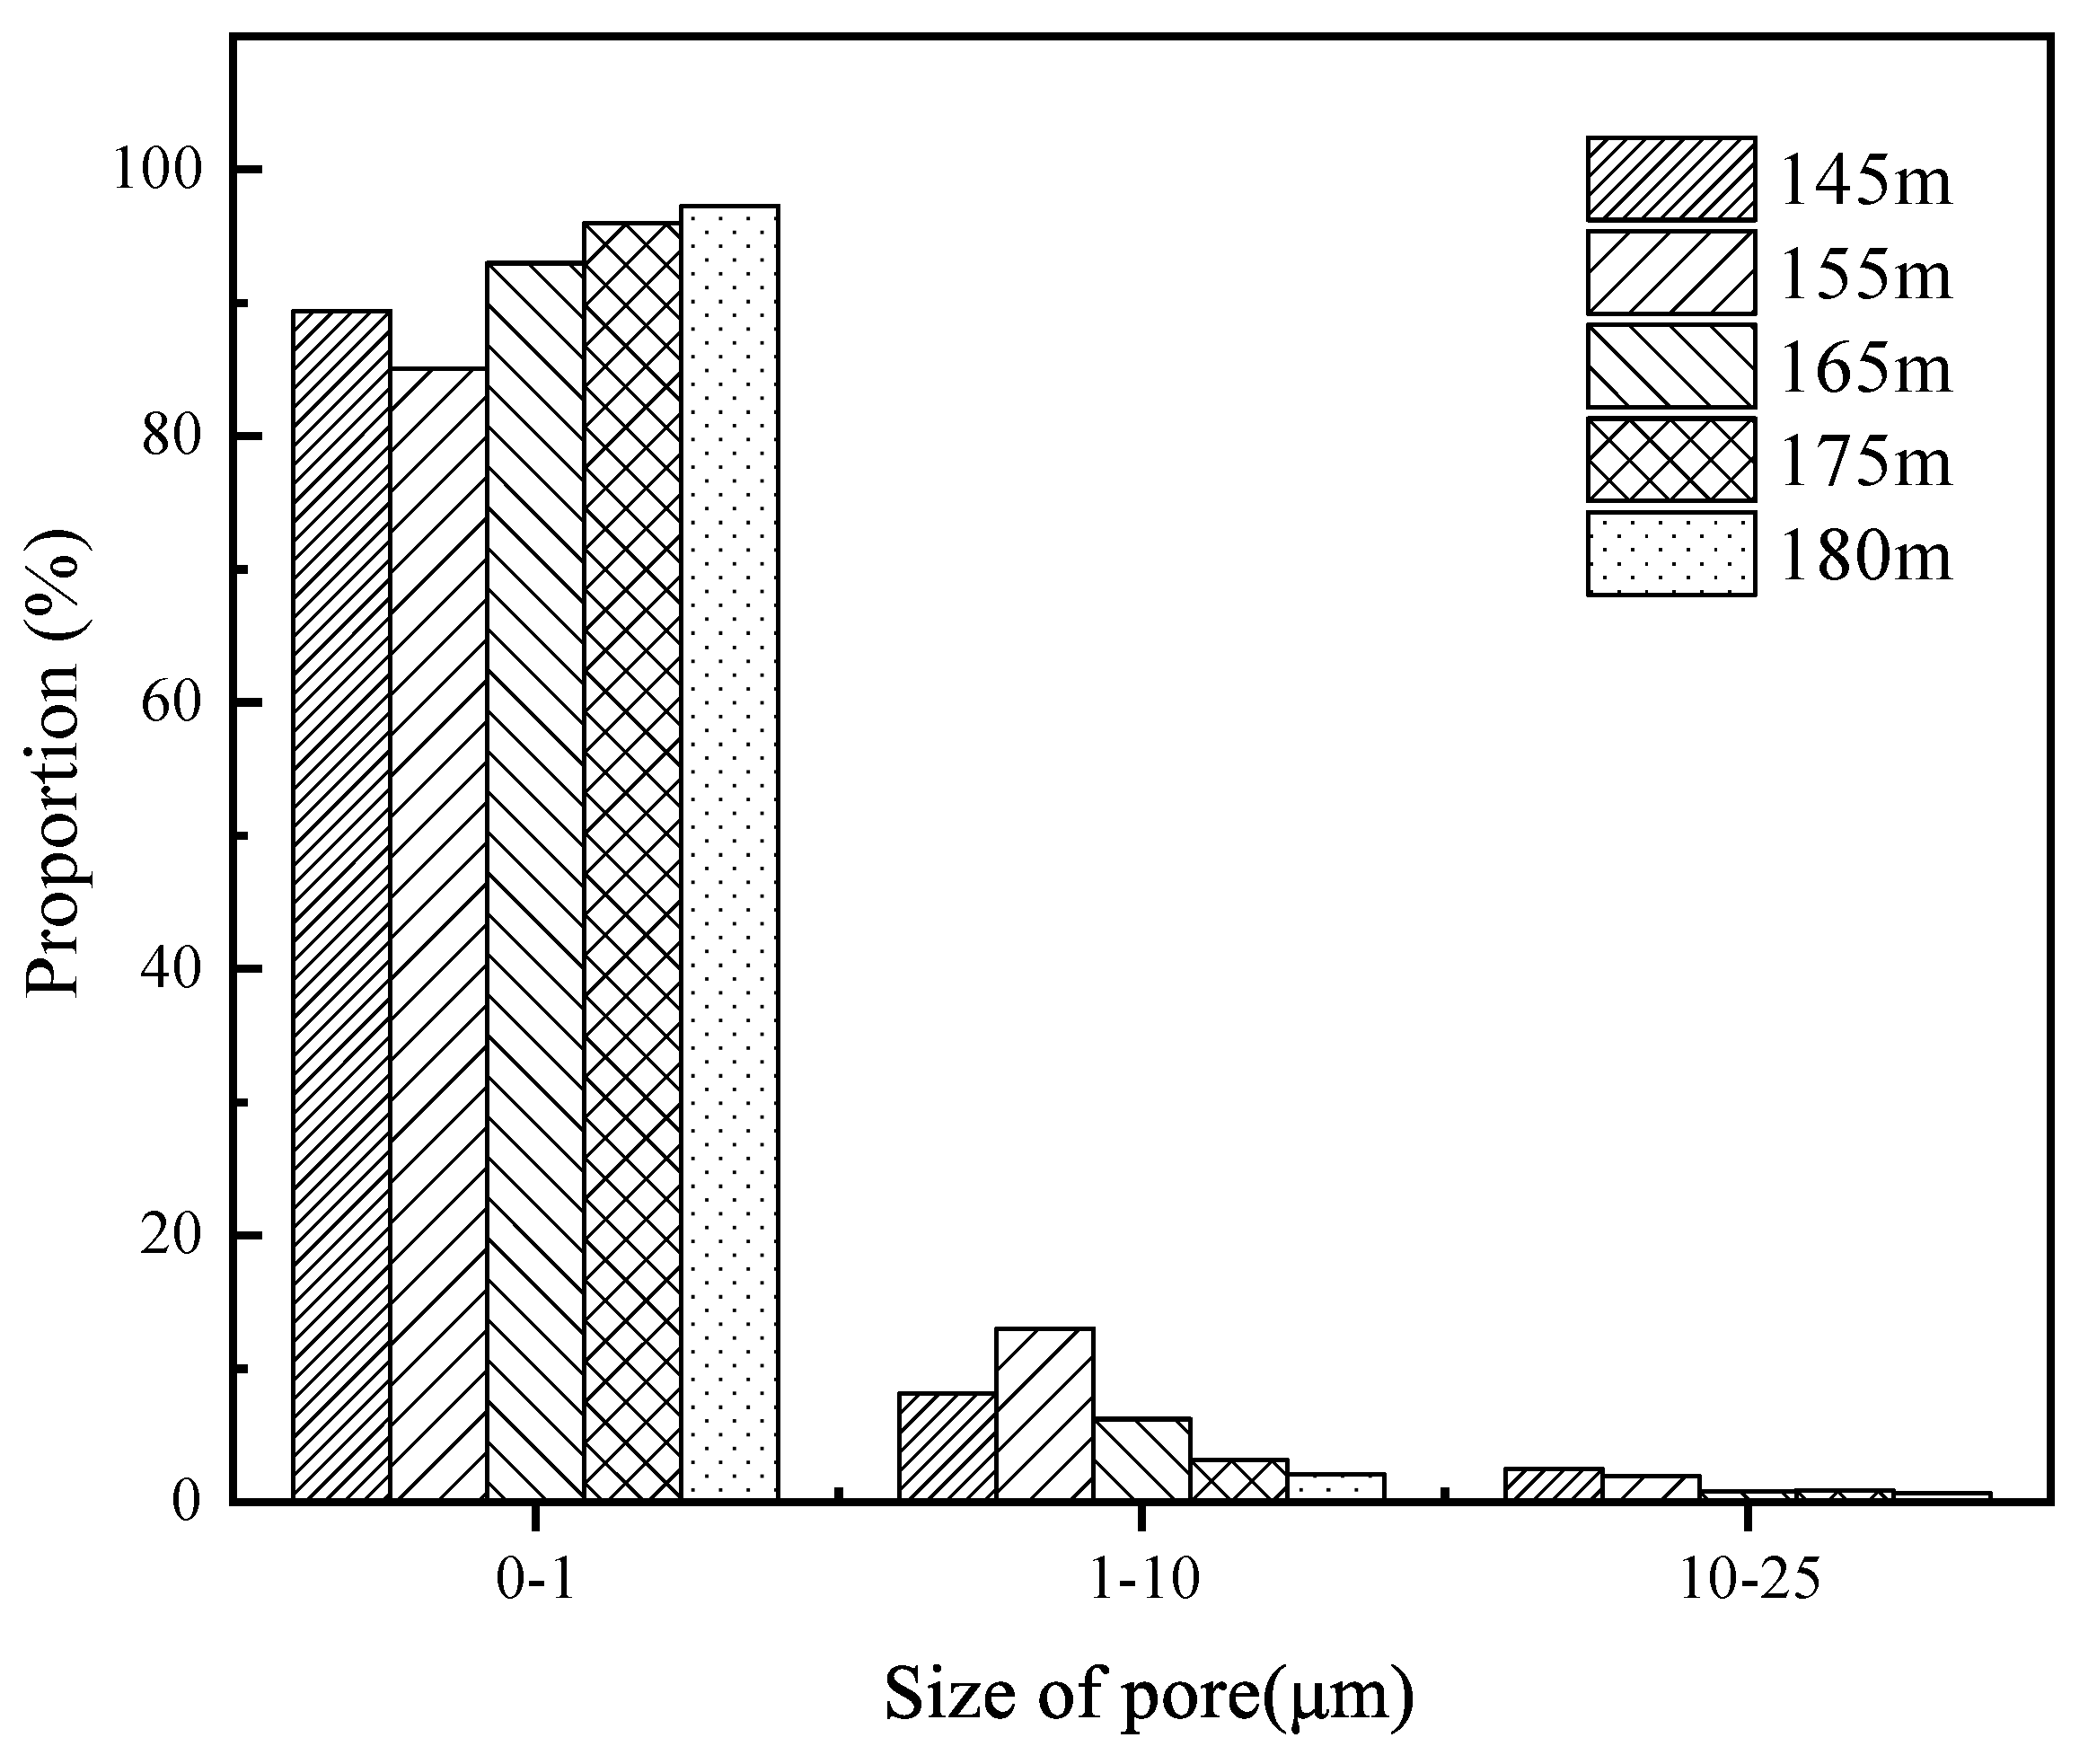
A MacroMR12-150H-1 NMR analyzer was used to test the samples after cyclic loading and unloading, and the pore size characteristics of the soil at different elevations were obtained. According to the dry density of the soil mass, the corresponding volume mass was weighed, and the soil mass was pressed into a PVC pipe with a diameter of 50 mm and a height of 20 mm. The PVC pipe was used to prevent the interference of nuclear magnetic signals, and it was used in conjunction with the nuclear magnetic resonance testing equipment. The pore size distribution was tested using core analysis software, and the pore sizes were defined as different pore types, i.e., small pores (0–1 µm), medium pores (1–10 µm), and large pores (10–25 µm). Through calculation, the proportion of different types of pores is obtained, and the test and calculation results are shown in
Figure 9.
Figure 9 shows that the soil mass at different elevations contains small pores, medium pores, and large pores. The small pores account for the highest proportion, which is above
, and the large pores account for the lowest proportion, which is all less than
. However, comparing the proportion of small pores in the soil at different elevations shows that the proportion of small pores in the soil at an elevation of 155 m is the lowest compared with the soil at other elevations. The proportion of small pores in the soil at an elevation of 180 m is the highest, and the proportion of small pores increases with the increase in sampling elevation between 155 and 180 m. When the soil elevation is 155 m, the proportion of pores is the highest; when the sampling elevation is 180 m, this proportion is the lowest. When the soil elevation is 155–180 m, it decreases with the increase in sampling elevation. The proportion of large pores in the soil at different elevations decreases with the increase in elevation. When the soil elevation is 145 m, this proportion is the highest, and when the soil elevation is 180 m, it is the lowest.
In summary, when the soil elevation is 155 m, the proportion of medium pores and large pores in the soil is much higher than that at other soil elevations, and the proportion of small pores is smaller than that at other soil elevations. The reservoir water permeates into the soil at an elevation of 155 m, forming a large seepage channel, with a large pore size and obvious damage to the soil. Therefore, the permeability coefficient of the high-rise soil is high, and the strength of the soil is low. Regarding soil at a higher elevation, its internal small pores account for a higher proportion, the seepage channel is smaller, the seepage velocity is smaller, and the permeability coefficient is relatively lower. Therefore, its macro strength is higher than that of soil at an elevation of 155 m.


