Article

Experimental Evaluation of Tubular Flocculator Implemented in the Field for Drinking Water Supply: Application in the Developing World

by
Fernando García-Ávila
1,2,*,
Angel Méndez-Heredia
1,
Alex Trelles-Agurto
1,
Esteban Sánchez-Cordero
3,4,
Emigdio Antonio Alfaro-Paredes
5,
Freddy Criollo-Illescas
1,
María D. Tonon-Ordoñez
1 and
Gina Heredia-Cabrera
6
1
Carrera de Ingeniería Ambiental, Facultad de Ciencias Químicas, Universidad de Cuenca, Cuenca 010203, Ecuador
2
Grupo de Evaluación de Riesgos Ambientales en Sistemas de Producción y Servicios (RISKEN), Departamento de Química Aplicada y Sistemas de Producción, Cuenca 010203, Ecuador
3
Facultad de Ingeniería, Universidad de Cuenca, Cuenca 010203, Ecuador
4
Departamento de Ingeniería Civil, Universidad de Cuenca, Cuenca 010203, Ecuador
5
Professional School of Systems Engineering, Universidad César Vallejo, Lima 15314, Peru
6
Carrera de Medicina, Universidad Católica de Cuenca, Campus Azogues, Azogues 030102, Ecuador
*
Author to whom correspondence should be addressed.
Water 2023, 15(5), 833; https://doi.org/10.3390/w15050833
Submission received: 12 January 2023 / Revised: 3 February 2023 / Accepted: 7 February 2023 / Published: 21 February 2023
(This article belongs to the Topic Sustainable Environmental Technologies)

Abstract

:
The purpose of this study was to evaluate the efficiency of a large-scale Horizontal Tubular Flocculator (HTF) as an easy-to-implement technology for potable water provision compared to the efficiency of a traditional baffle flocculator. The HTF was built with a 4-inch diameter PVC pipe and coupled to a sedimentation and filtration process. Experimental tests were performed using lengths of 68.4 m and 97.6 m for the HTF. These lengths were combined with raw water flow rates of 0.25, 0.5, 0.75, 1, and 2 L/s and five turbidity ranges <10 NTU, 10–20 NTU, 21–50 NTU, 51–100 NTU, >100 NTU, giving a total of 100 tests for one year. Jar tests were performed to determine the optimal dose of aluminum sulfate used as a coagulant. Hydraulic characteristics such as time of retention (TR) and velocity gradient (G) were evaluated; likewise, plug flow, dead volume, and short-circuit ratios were determined by tracer tests using the Wolf–Resnick model. The average results determined a removal of 98.8% of turbidity and 99.93% of color. The TR varied between 4.62 and 36.97 min and G varied between 6.15 and 109.62 s−1. The results showed that HTF can be useful as a flocculation unit in a purification system.

1. Introduction

The sustainable development goals were adopted by the United Nations Organization in 2015, recognizing that the sixth goal proposed was “to guarantee the availability and sustainable management of water and sanitation for all” [1]. This sixth goal reaffirmed that good quality drinking water and sanitation are essential for human development [2,3]. This right is not fulfilled on many occasions, especially in most rural communities, where they lack drinking water service, and the few communities that do have this service consume drinking water after poor treatment, which makes it difficult to use due to its unappetizing color, smell, and taste; in addition, this water puts health at risk due to the pathogens that can be found in the water [4].
The quality of raw water in places close to the catchment of water used for drinking water in rural areas has been affected by climate change [5], population growth, and the increase in anthropogenic activities, making the existing treatment systems in those sites inefficient due to the higher level of contaminants that must be removed [6]. To remove this higher level of contaminants, it is necessary to implement conventional processes, and sometimes advanced treatments are needed [7,8]. A conventional treatment plant made up of coagulation, flocculation, sedimentation, filtration, and disinfection requires the construction of civil works [9], requiring financial resources for its implementation, which is unattainable due to the costs involved in the majority of developing communities [10,11].
However, considering that the flow in rural areas is small, the construction of conventional hydraulic baffle flocculators becomes complicated due to the small dimensions of the channel width, as well as certain conditions that the flocculator baffles must meet, causing relatively high investments of money for these communities, which, on many occasions, do not have such economic resources [12]. Mechanical flocculators are not recommended for treatment plants with small flows due to the use of electromechanical equipment and electrical energy consumption [13]. In this sense, it is necessary to investigate simple, effective, and low-cost solutions for the construction and operation of drinking water treatment plants for small flows that can be easily implemented in developing communities.
For the reasons stated in previous paragraphs, this study examined other appropriate technological options for flocculation that offer less dependence on proprietary infrastructure for water treatment in rural areas, presenting tubular flocculation as an alternative that is easy to implement within a water treatment process in a rural community.
Tubular flocculators are hydraulic flocculators that use the energy of water flow and have been used to treat wastewater, previously mixed with chemical products, promoting coagulation and flocculation [14,15]. In this respect, Boily and Butler [16] implemented a wastewater treatment system in a cheese-producing company with a horizontal flow tubular flocculator with a pipe length of 80 m with eleven 180° turns and a Reynolds number slightly above 4000, which is desirable for adequate mixing, although not too high in order to avoid breaking the formed flocs. This flocculator was connected to a sedimentation tank to remove the flocculent particles. This study determined that elevation should be taken into account along with the length of the pipe as the most critical parameters with respect to head loss within the system. This coagulation and flocculation system used aluminum sulphate as a coagulating agent.
Kurbiel et al. [17] studied the treatment of electroplating wastewater, which used a propeller mixer followed by a tubular flocculator. Two 20 m long tubular flocculators with different diameters were tested. These flocculators were made of transparent polyvinyl chloride (PVC), which allowed continuous monitoring of the experiment. Wastewater was treated with cyanide, chromium, nickel, and low concentrations of copper. The results of the experiments carried out on a pilot scale clearly indicated the good performance of the system. The reduction in turbidity and suspended solids achieved during the experiment were in the ranges of 90% to 99% and 88% to 98%, confirming the high efficiency of the system in treating electroplating wastewater. Some of the advantages of the mentioned system are less surface area and the ability to be operated without mechanical equipment; in addition, the total retention time in the flocculator can be 12 min, maintaining the total removal efficiency.
Pennock [18] developed a turbulent regime tubular flocculator with a total tube length of 56.35 m and an internal diameter of 0.93 cm and analyzed the changes in the flow direction of 180° and time of retention of 6.82 min in a laboratory-scale study. The coagulant used in this research was poly-aluminum chloride (PACl). After the suspension had flocculated, the water was passed to a settler and the turbidity of the settled effluent was used as a measure of flocculation performance. The turbidity of the water that entered the system of 150 NTU (nephelometric turbidity unit) was reduced to values that varied between 0.5 and 7 NTU at the outlet of the settler.
Oliveira and Teixeira [19] investigated the performance of the helical tubular flocculator for turbidity removal. This study used helically coiled tubes (HCT) as a coagulation–flocculation reactor coupled with a conventional decanter. Turbidity removal was analyzed to evaluate the proposed clarification system, while the hydraulic and geometric parameters in the HCT were varied. Removal efficiencies between 80% and 86.2% were obtained, presenting better results than flocculators with baffles, which are commonly applied for purification in developing countries.
However, despite the advantages that this type of flocculators has presented in numerous industrial processes, in recent decades, no information has been presented about the application of tubular flocculators for drinking water and wastewater [20]. In previous studies, tubular flocculators have been evaluated when applied to wastewater, and other studies have been carried out at the laboratory and batch levels. There is a gap in the evaluation of tubular flocculators for drinking water at the field scale with continuous flow. Therefore, one of the objectives of the present study was to bridge the gap between laboratory tubular flocculation research and field research, contributing new knowledge in this research area and demonstrating that tubular flocculation is an alternative solution for small and medium-sized communities.
This study was carried out in a treatment plant, using raw water with turbidity that varied between 10 and 249.60 NTU with flows between 0.25 and 2 L/s, which can supply approximately 1000 people in rural areas. The velocity gradient, retention time, raw water quality, water flow, and tube length were analyzed as factors that influence the efficiency of drinking water treatment.
The results of this study made it possible to calculate the efficiency and feasibility of implementing this low-cost technology in developing communities. In addition, the results could be widely known among consultants and local government authorities, in order to be replicated in other parts of the world. The implementation of a horizontal flow tubular flocculator (HTF) made of straight PVC tubes will replace conventional concrete baffle flocculators (deflectors), avoiding the construction of civil works and reducing investment costs and physical space. Therefore, the main purpose of this study was to evaluate a tubular flocculator made of PVC in the field and its ease of implementation in treatment plants in rural communities, as well as to offer a framework for the sustainable development of the rural water supply.

2. Materials and Methods

2.1. The Description of the Location of the Study

The pilot treatment system that includes the HTF was implemented in the ¨Bayas¨ Drinking Water Treatment Plant (DWTP) using the same raw water that enters the DWTP and comparing the results of the Pilot Treatment System (PTS) with the DWTP. This DWTP belongs to a Drinking Water Board managed by people chosen from the members of the community and it is located in a rural area of the city of Azogues, Ecuador, at 2797 m above sea level, at coordinates 740,741 m E, 9,699,971 m S of zone 17 M. The temperature of the place of the execution of this research varied between 12 and 16 °C, which did not represent a high variation and, due to that reason, an analysis of the relation of the temperature with the coagulation was not realized.
The treatment plant of this community is of the conventional type with gravity operation, which includes the processes of coagulation, flocculation, sedimentation, rapid filtration, and disinfection [21]. This treatment plant uses aluminum sulphate as a coagulant, which is added at the foot of a rectangular weir used as a rapid mixer. The formation of flocs is carried out in a horizontal hydraulic flocculator and a vertical flocculator, of which the design flow is 10 L/s for each flocculator, treating a total of 20 L/s.

2.2. Design and Construction of the Pilot Treatment System

2.2.1. Rapid Mixer

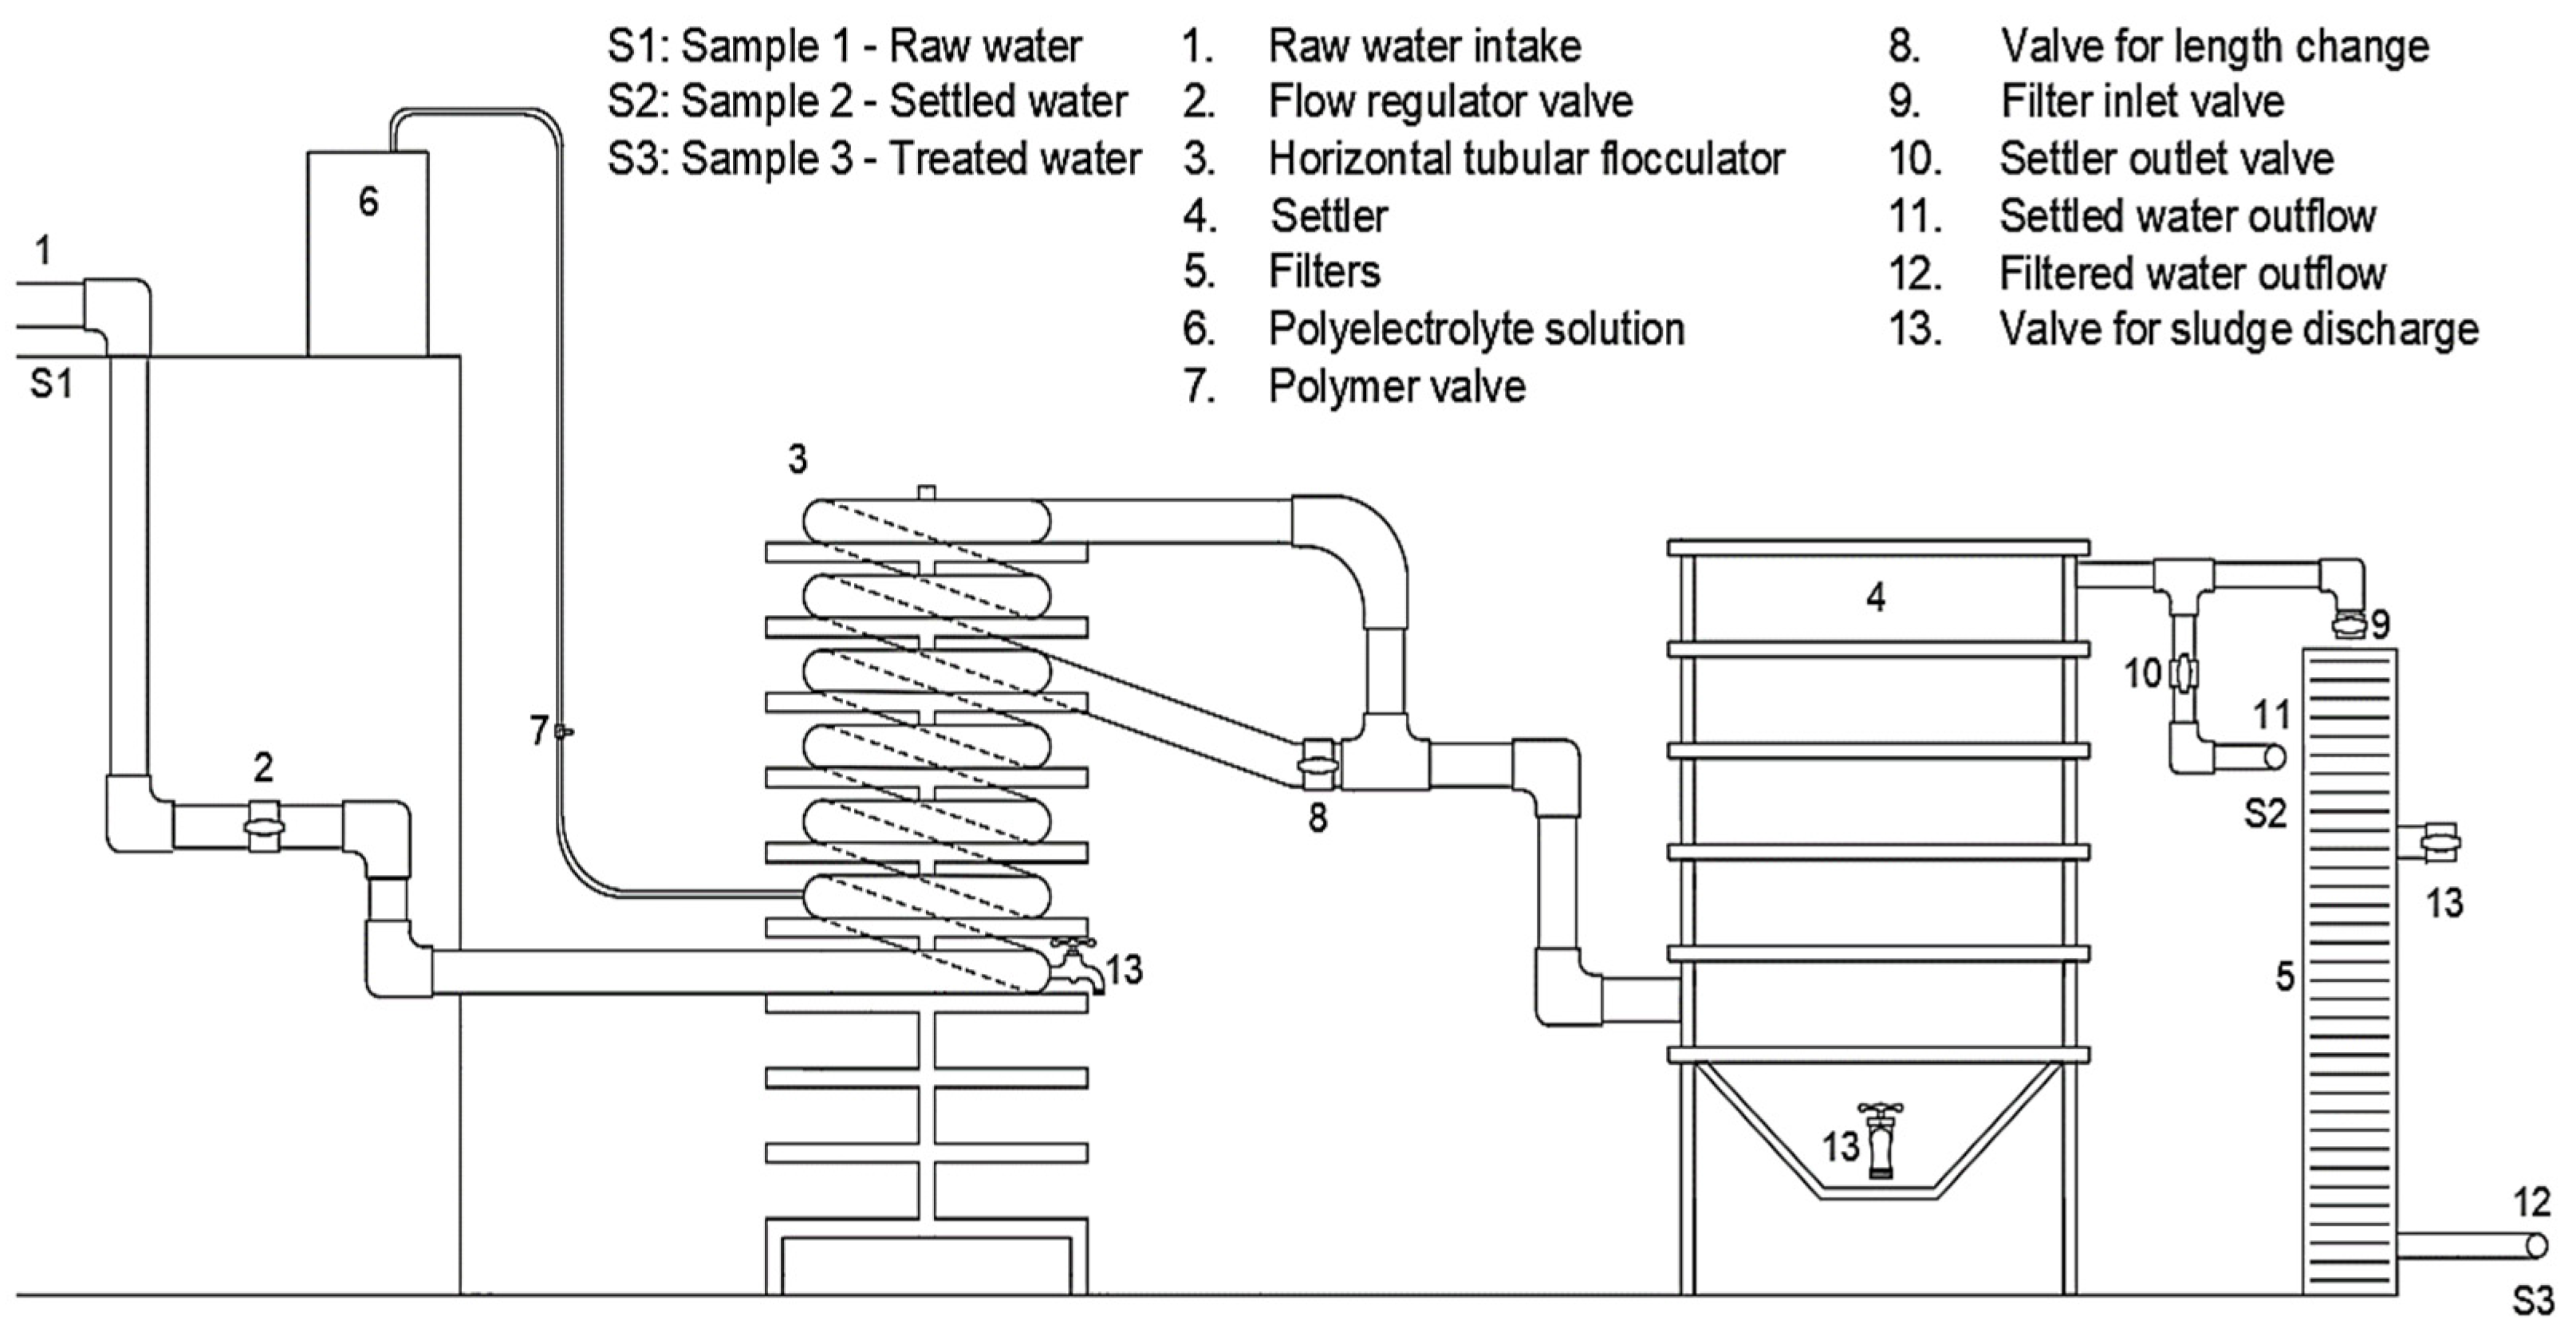
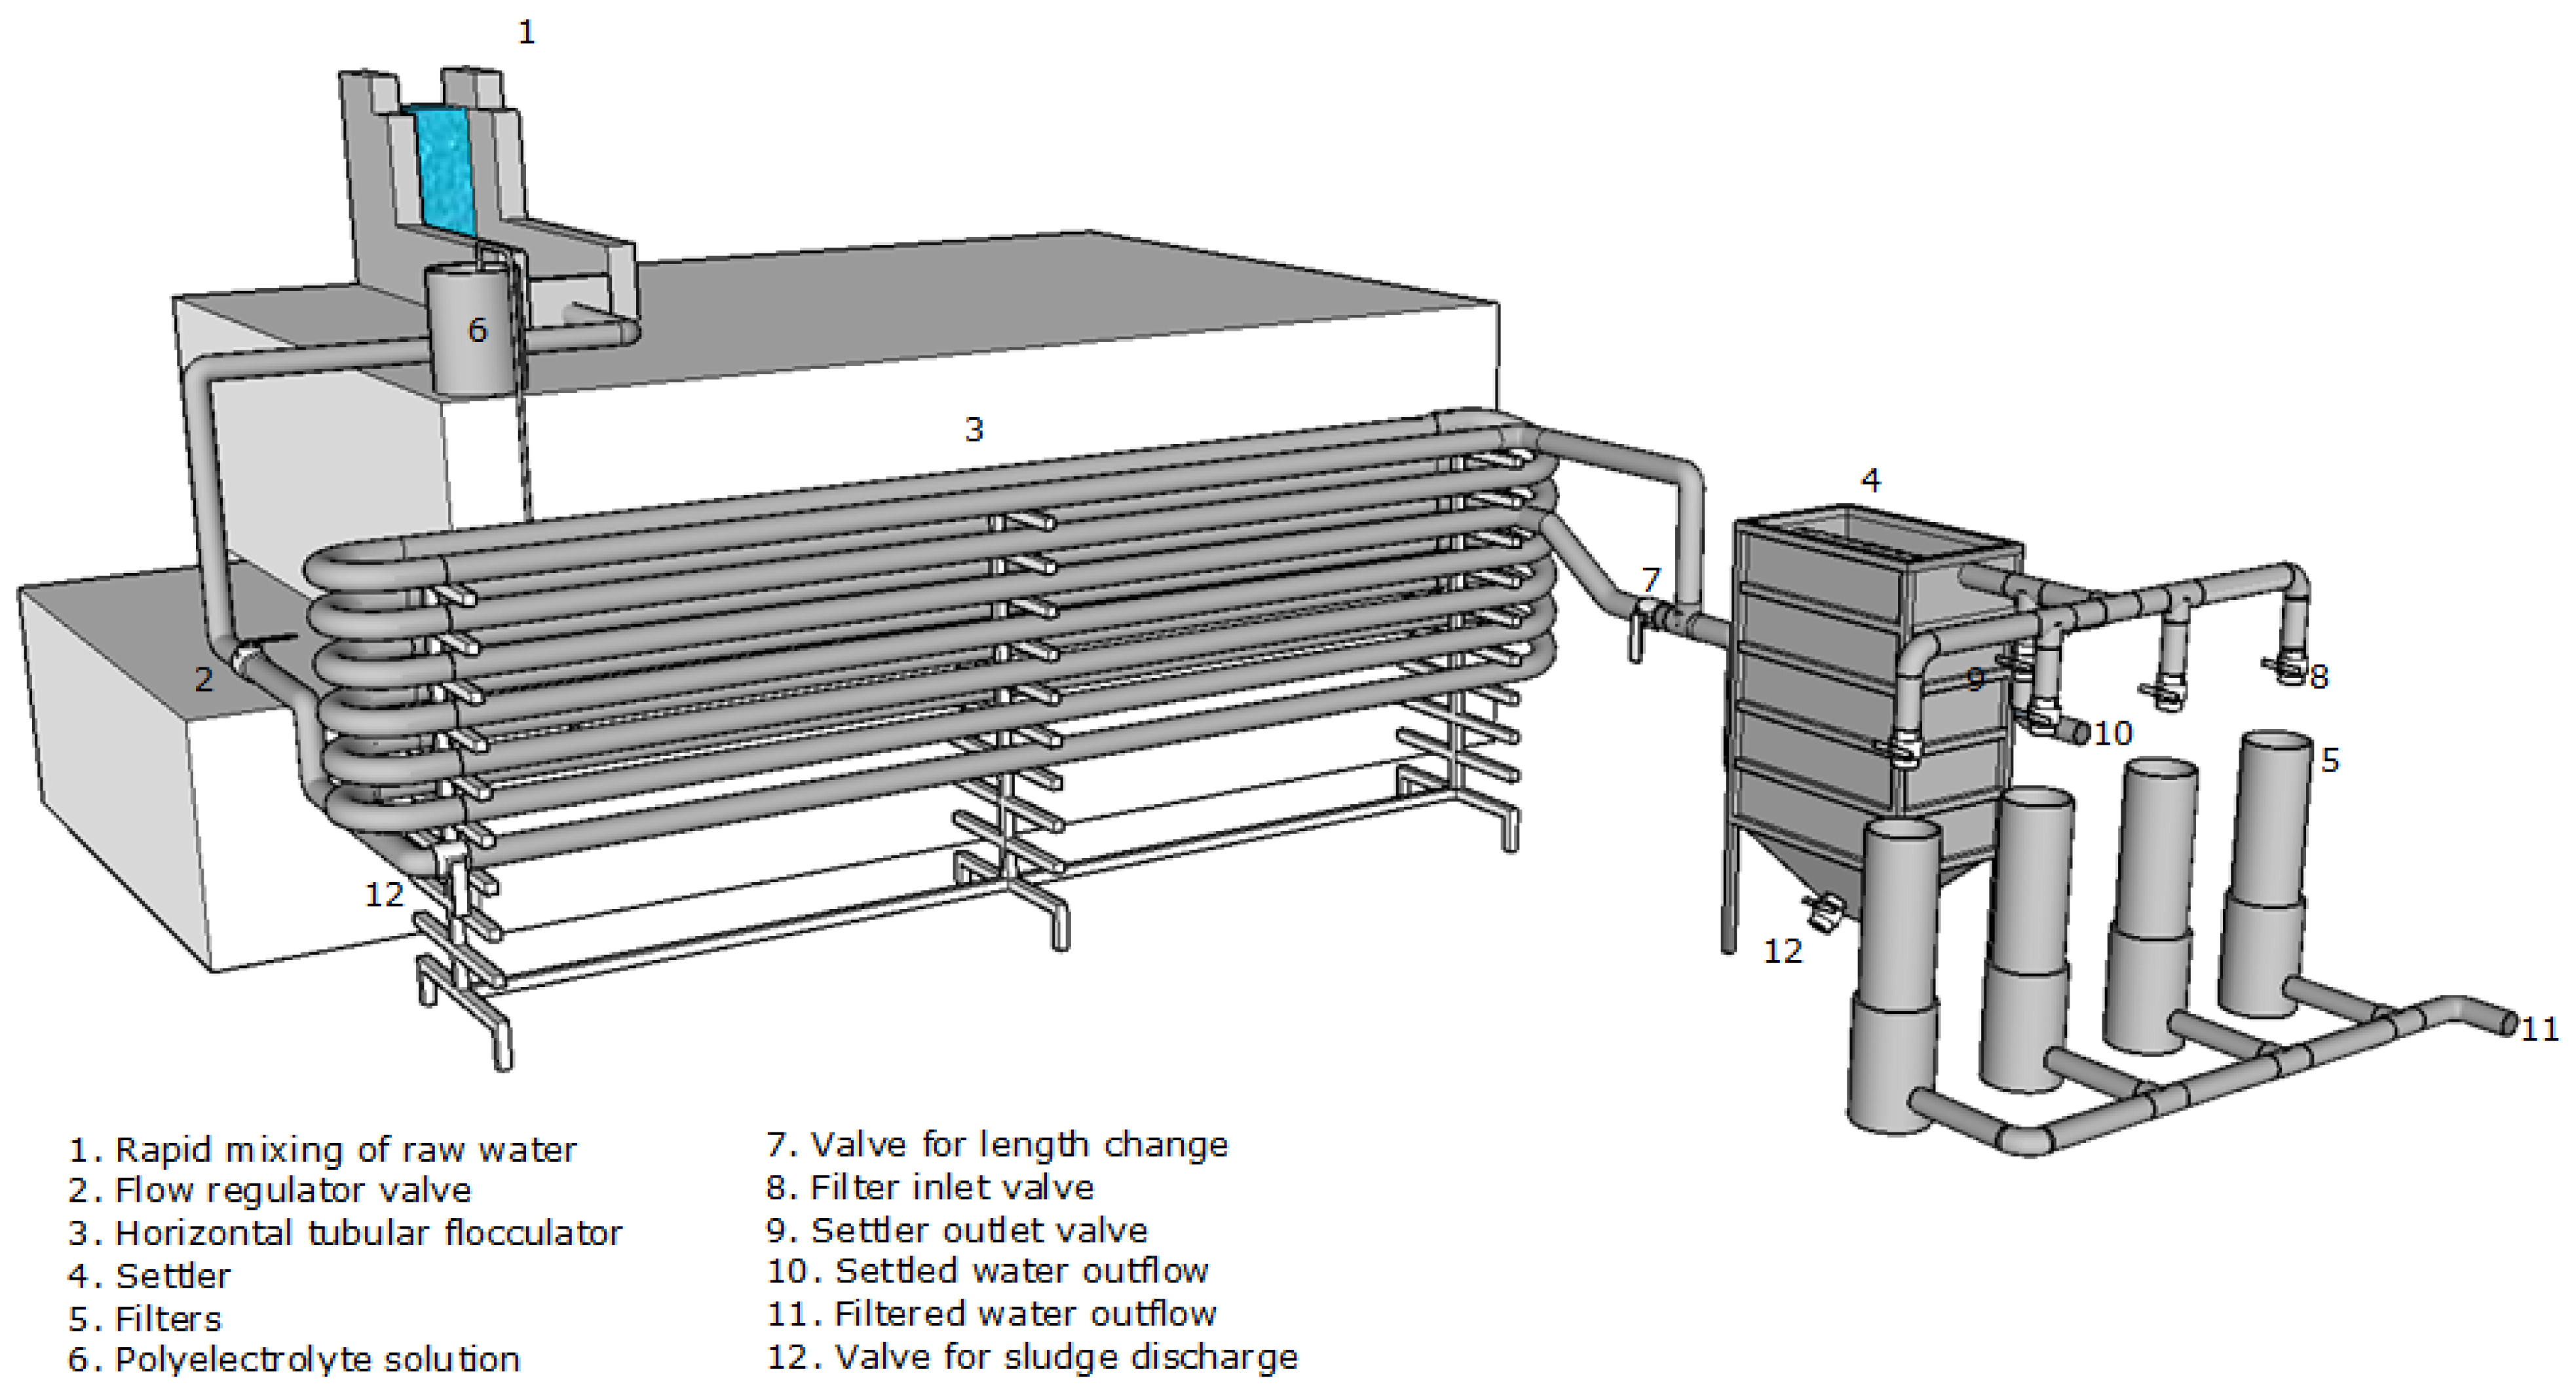
The rapid mixing chamber (RMC) is the unit where the coagulant is dosed. For the experimental tests, the same RMC of the DWTP “Bayas” was used, that is, the flow rate necessary for the experimental tests in the PTS was derived from the already coagulated water (Figure 1). Therefore, it was not necessary to build an RMC for the PTS. The RMC operates through a rectangular weir, whose free flow of water allows the formation of a hydraulic jump to mix the aluminum sulphate with the raw water [22]. A channel provided with holes was implemented to homogeneously distribute the coagulant and initiate the destabilization of the particles in the RMC. This RMC has a velocity gradient of 1700 s−1, a retention time of 0.55 s, and a Froude number of 5.86, which allows it to maintain a hydraulic jump established for achieving adequate coagulation.

2.2.2. Horizontal Flow Tubular Flocculator

Due to the fact that a methodology for the design of tubular flocculators was not found, the existing methodology for the design of hydraulic flocculators with horizontal flow deflectors of Haarhoff [12] and Romero [23] was used for a design flow rate of 1 L/s. These authors indicated that the most important parameters in the design of a horizontal flocculator with deflectors (HFD) are the following: The total length of the flocculator, the area of the channel, the velocity of the fluid, the flocculation time, and the velocity gradient. To start the design of the HTF, the flow rate (1 L/s), the speed, and the retention time were defined. Haarhoff [12] and Romero [23] recommended that the adequate retention period for an HFD must be in the range of 10 to 60 min, so a time of 12.5 min was chosen for the HTF design of this study. Romero [23] indicated that the speed in an HFD varies between 0.10 and 0.60 m/s, choosing a speed of 0.13 m/s. These values were chosen because this type of flocculator has the advantage of low retention times [17,18,24].
After having calculated the length and area of the HFD channel, these dimensions were correlated with the dimensions of PVC pipes. Thus, the calculated length of the HFD was divided by 6 to find the number of PVC pipes needed to build the HTF, due to the fact that a commercial PVC pipe is 6 m long. The channel width calculated for an HFD was conditioned to the area of a commercial PVC pipe. The configuration of the HTF was made with sections of straight pipe arranged horizontally, with each section made up of 6 m tubes, and an elbow of 180° was implemented at the end of each tube. Another straight tube was added to this elbow and was built in this way until the calculated number of tubes was completed. Figure 1 presents a schematic of the HTF.
PVC pipes of 110 mm in diameter were used; additionally, accessories were necessary such as 90° and 180° elbows, tees, and valves, thus forming a round-trip circuit. All this infrastructure was mounted on a metal shelf that served as support. Additionally, it should be indicated that pipes and fittings with elastomeric sealing of PVC were used in order to be able to assemble and disassemble when convenient. A bypass was installed to evaluate the influence of the path length on the HTF efficiency, in such a way that the system could be operated only with a shorter length of L1 = 68.4 m and only with a longer length of L2 = 97.6 m.

2.2.3. High-Rate Settler

A high-rate settler was necessary to retain the flocculent particles formed in the HTF. The sedimentation tank was provided with honeycomb-shaped sedimentation modules made of ABS. These modules have cells inclined at 60°, with a cell gap of 5 cm, so that the water rises through the cells with laminar flow. For the design of the settler, the methodology set forth by Romero [23] and Arboleda [25] was used. The following criteria were taken into account: (a) A flow rate of 1 L/s, (b) surface load of 120 m3/m2d, and (c) Reynolds Number of 71. Finally, a settler 0.6 m in width, 1.20 m in length, and 1.80 m in depth was obtained. Figure 1 shows the location of the high-rate settler, which was made of galvanized brass.

2.2.4. Rapid Sand Filters

A system of four rapid filters that operated with a filtration rate of 5 m3/m2/h was implemented to retain the particles that were not retained in the settler, and these filters were interconnected at the outlet with each other by means of valves located in the back. Individual valves located at the top of the filters were provided to evacuate the backwash water. For the design of the filters, the methodology used by Romero [23] and Arboleda [25] was used. A filter bed made up of gravel and sand was used. For the design, a filtration rate of 120 m3/m2/day and a sand depth of 0.6 m were used. The following characteristics were chosen for the sand: (a) Effective size TE = 0.55 mm, (b) a uniformity coefficient CU = 1.60, and (c) a porosity = 0.42. With the collaboration of the “Bayas” Water Board, the filters could be implemented using PVC pipes 300 mm in diameter. Each one of the four filters was built operating with a flow rate of 0.098 L/s and producing a flow of 0.39 L/s jointly. The other 0.61 L/s was sent to the DWTP filters. Figure 1 shows the location of the rapid sand filters after the settler.

2.3. Hydraulic Evaluation of the Pilot Horizontal Tubular Flocculator

2.3.1. Calculation of the Theoretical Retention Time

Equation (1) was used to calculate the theoretical retention time (TRT or to) in the HTF, in which V is the volume of the flocculator and Q is the flow rate of water entering the system. The volume of the HTF was determined from the length (L) and the radius (r) of the pipe (V = πr2L). The TRT was calculated for the five flows used (0.25, 0.5, 0.75, 1.0, and 2.0 L/s) and for the two lengths tested (L1 = 68.4 m and L2 = 97.6 m).
t o = V Q

2.3.2. Determination of Mean Retention Time

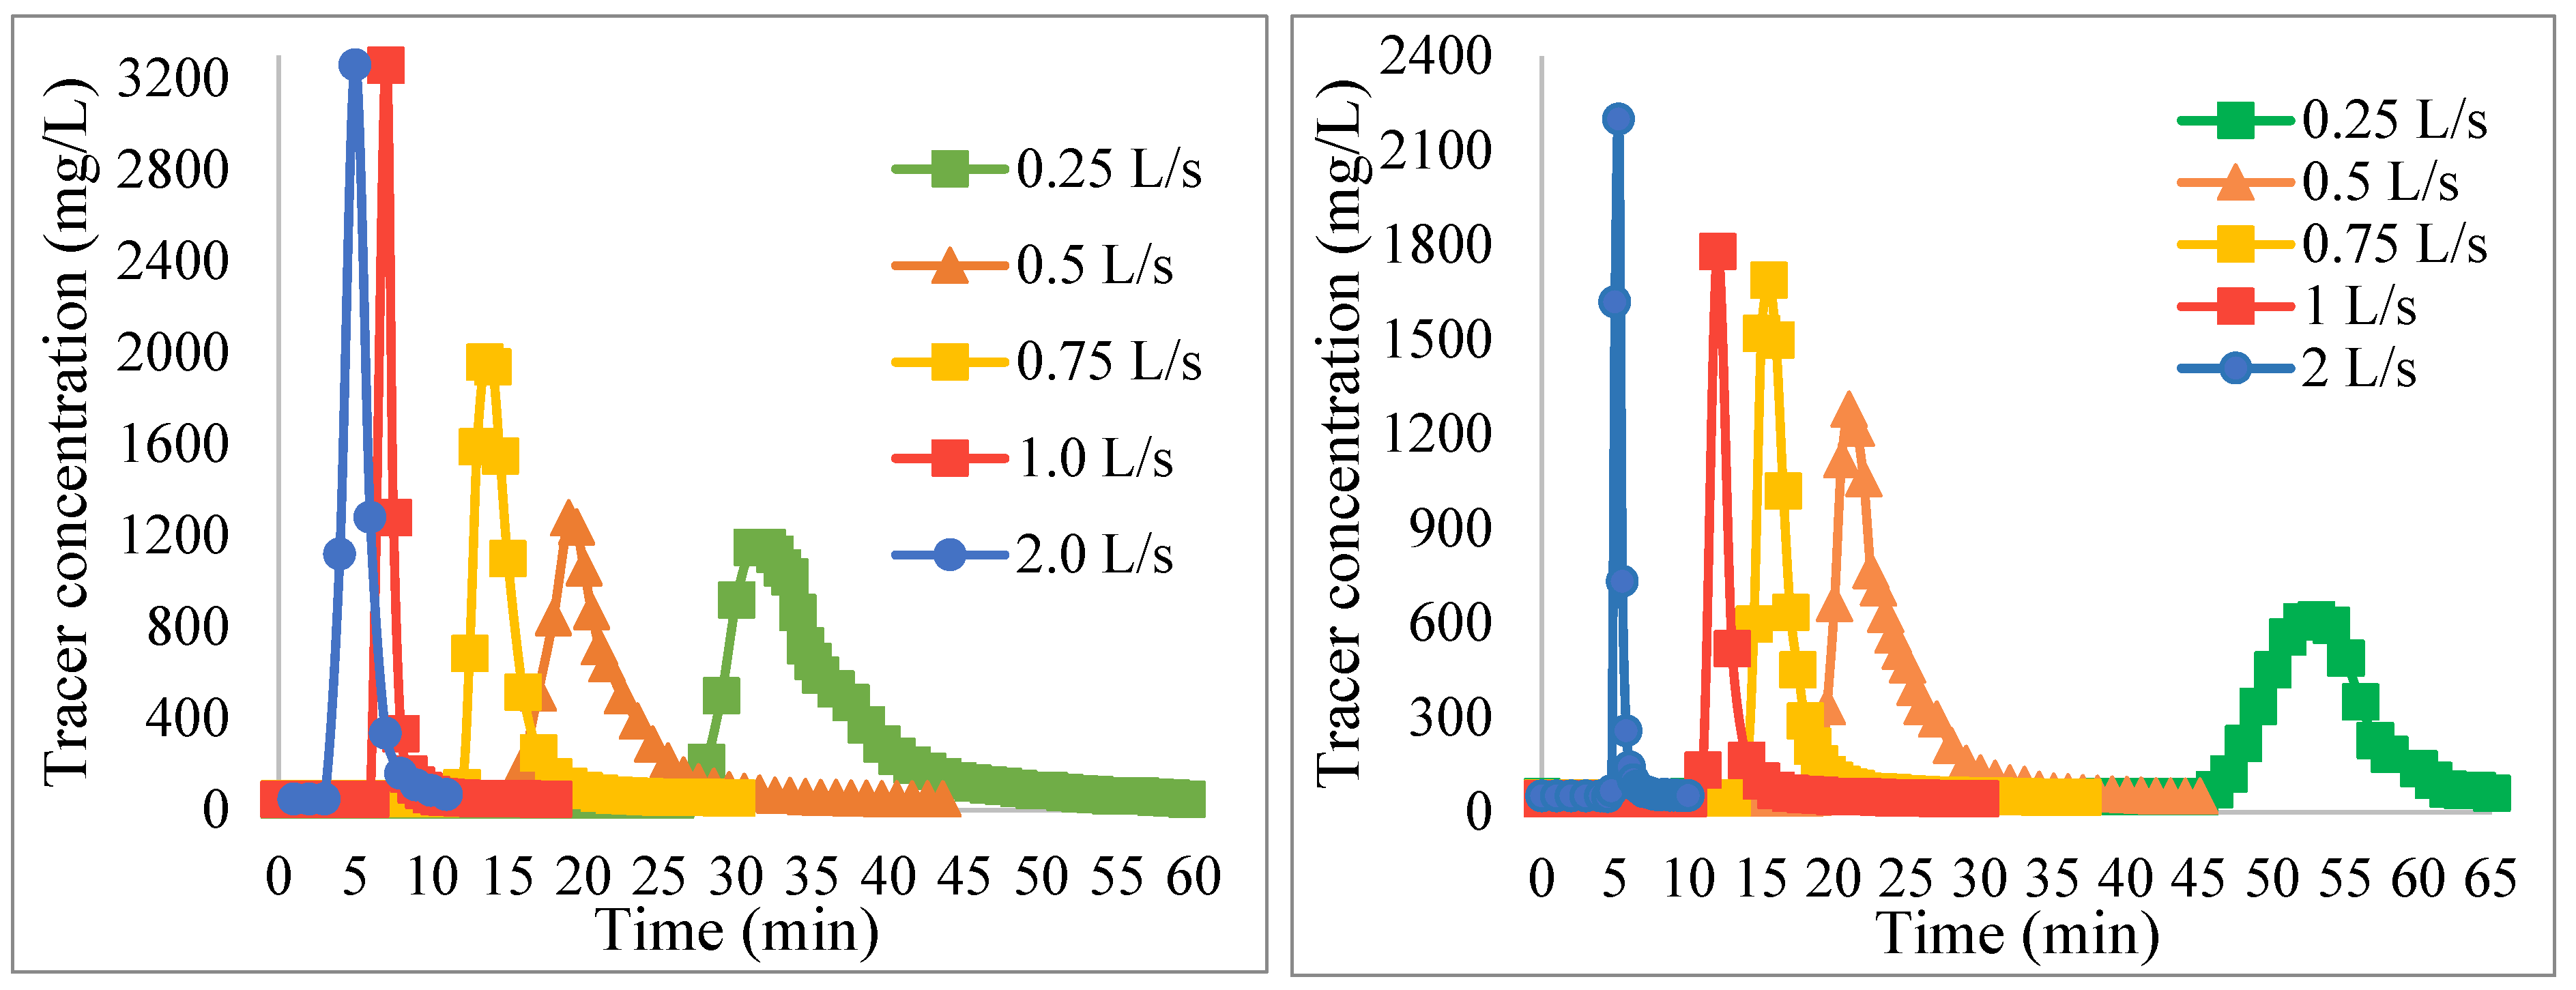
The tracer technique was used through the application of instantaneous doses, using a saline substance of NaCl in solution with water to determine the mean retention time (MRT) (tm). The tracer was added at the entrance of the HTF. The measurement of total dissolved solids (TDS) was performed at the end of the HTF (before the water enters the settler). The samples were taken every minute from the addition of the tracer at the moment that a sudden change in the TDS was detected. The sampling time was reduced to 30 s. The data obtained from the tracer test permitted us to make graphs of the time vs. concentration of TDS, and the MRT was obtained from this curve. For TDS measurements, a digital dissolved solids meter was used. The methodology applied by Mastrocicco et al. [26] was followed for the application of the tracer technique. This method allowed the identification of the hydrodynamic characteristics of HTF, for which the mean retention time was determined using Equation (2) [27].
t m = i = 0 n t i   ( C i C o ) i = 0 n ( C i C o )
where tm is the mean retention time, Co is the initial concentration of the tracer substance, and Ci is the concentration in an instant ti.

2.3.3. Hydraulic Characteristics of the HTF

Water does not flow homogeneously in a flocculator. Different types of flows can occur, such as piston flow in which the particles move perpendicularly following a certain order [28]. On the other hand, mixed flow can occur, in which the composition of the mass is the same throughout the effluent [28,29]. Likewise, there could be dead spaces, which are spaces where the fluid remains static [30]. The short circuits constituted the mass of water that comes out at t = 0. The efficiency of the system increases while the piston flow increases [30,31]. The simplified Wolf–Resnick model was applied to identify the hydrodynamic characteristics of the HTF. This method provided information to determine the percentage values of piston flow (PF), mixed flow (MF), and dead zones; when there are no dead spaces, it is considered that the sum of the PF and MF ratio is equal to the unit for any reactor (Equation (3)).
p + (1 − p) = 1
where p is the piston flow; (1 − p) = non-piston flow = mixed flow
When there are dead spaces, if m is the fraction of the volume considered dead space, the fraction that does not have dead spaces will be equal to 1 − m and, for that we have Equation (4) [31].
p × (1 − m) + (1 − p) (1 − m) + m = 1
In most of the reactors used in treatment plants, there is a volume of water that leaves before the TRT and another after the TRT. The fraction of the volume that comes out first is called F. Wolf and Resnick [30] indicated that the function F(t) is represented by Equation (5) for real systems. The initial postulate of Wolf and Resnick was that if piston flow (p) and mixed flow (M) accompanied by dead zones (m) were present in a reactor, then Equation (5) would describe this design model.
F ( t ) = 1 e 1 ( 1 p ) × ( 1 m ) ( t t o p   ( 1 m ) )  
Taking logarithms on both sides and rearranging them gives Equation (6)
log [ 1 F ( t ) ] = log ( e ) ( 1 p ) ( 1 m )   [ t t o p ( 1 m ) ]
This equation corresponds to a straight line whose slope is given by Equation (7).
tan   α = log ( e ) ( 1 p ) ( 1 m )
Upon multiplying and dividing p and substituting the value of log e = 0.435, Equation (8) is obtained.
tan   α = 0.435 p p ( 1 p ) ( 1 m )
Considering θ = p (1 − m) in the equation and calculating p (piston flow), Equation (9) is obtained.
p = θ   tan   α 0.435 + θ   tan   α  
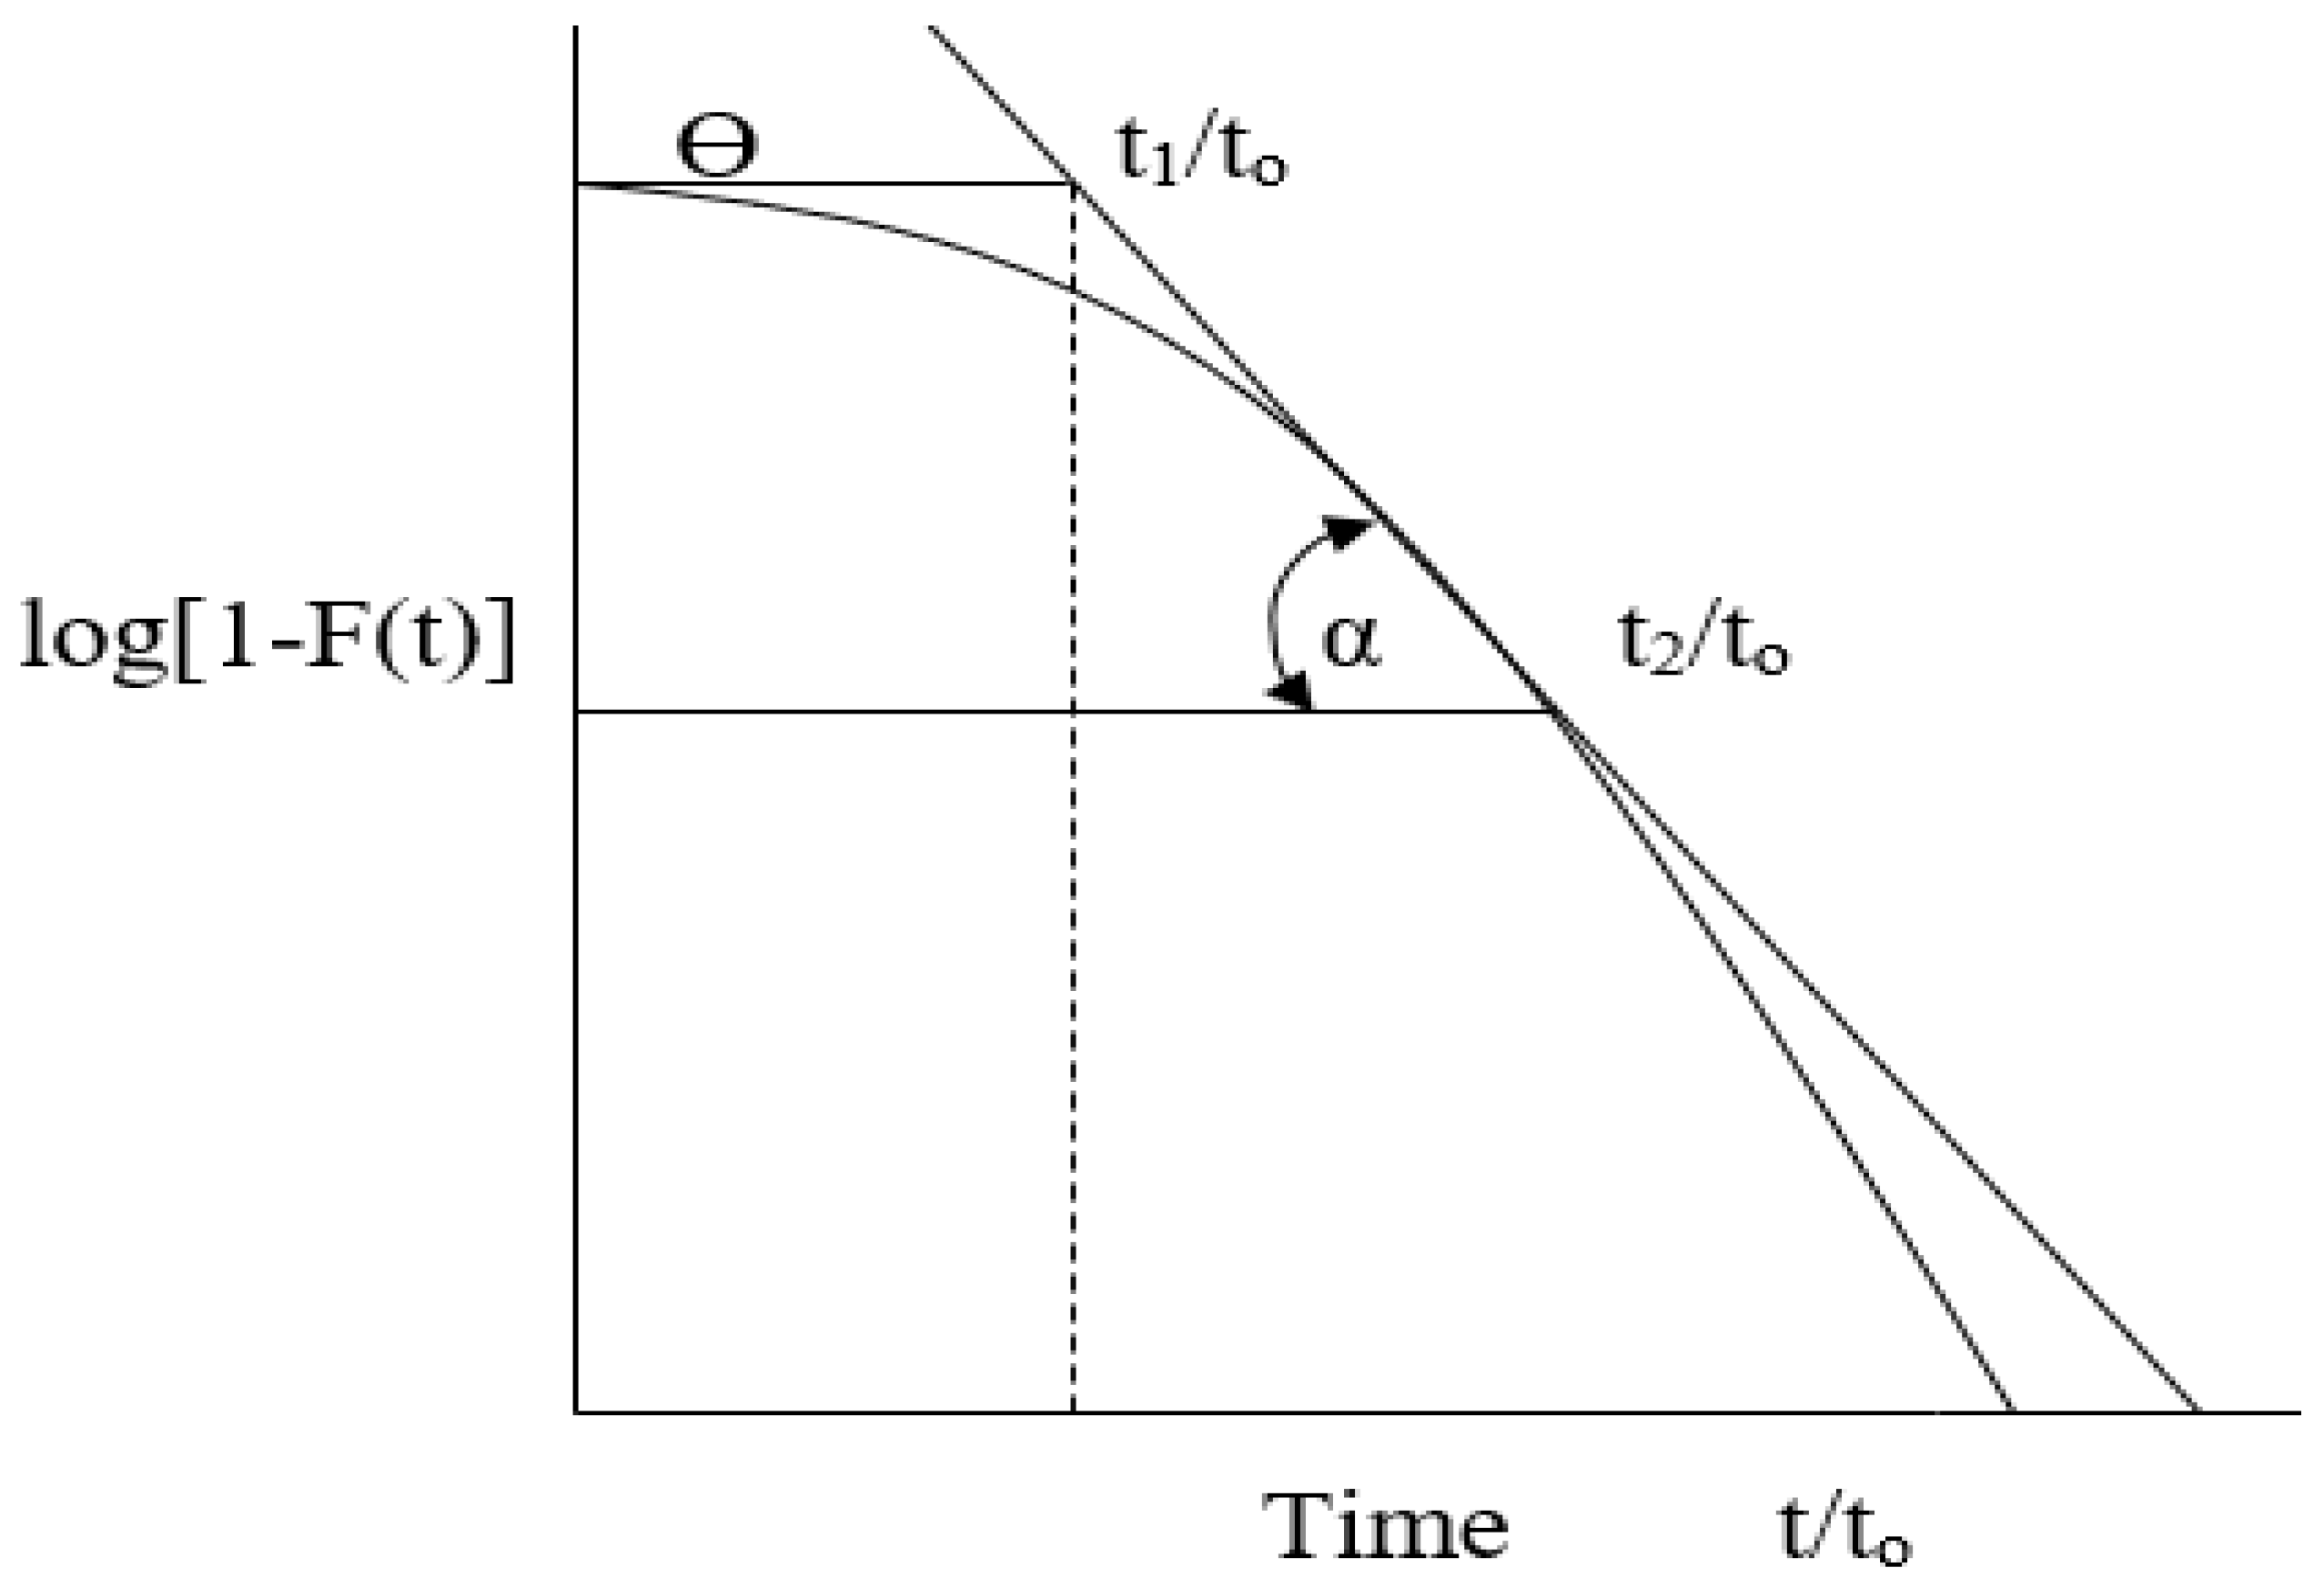
The values of the unknowns θ and tan α are obtained by plotting the curve on a semilogarithmic scale [1−F(t)] on the ordinates and as a function of dimensionless time (t/to) on the abscissas, resulting in a line that forms an angle with the horizontal, as is described in Figure 2. The values of the remaining fraction are in logarithmic form, while those of dimensionless time t/to are in arithmetic form. A tangent line is drawn at the point where the line begins to turn vertically. α is the angle between the tangent line and the horizontal and Ɵ is the intercept of the line with the abscissa axis, obtaining Equation (9) and θ = p (1 − m) [28,31].
The volume of dead spaces (m) will be equal to Equation (10)
m = 1 Ɵ p
and the mixed flow (M) will be equal to Equation (11).
M = 1 p
The statistical program STATGRAPHICS 16.1 was used to graph the semi-logarithmic curve given by the function 1-F(t) and t/to, obtaining the equation of the straight line adjusted to the points, which permitted us to determine the values of piston flow, mixed flow, and dead zones based on Equations (9)–(11).

2.3.4. Calculation of the Velocity Gradient

According to Oliveira and Teixeira [19], the velocity gradient (G) can be calculated using Equation (12). For the calculation of G, the theoretical retention period was considered. Water properties such as density and dynamic viscosity were taken into account, considering the average water temperature measured during the experimental part.
G = ρ * g * h f µ * t
where G is the mean velocity gradient (s−1), hf is the head loss (m), ⍴ is the water density (kg/m3), g is the gravity (m/s2), µ is the dynamic viscosity of water (kg/m s), and t is the retention time (s).
Meng et al. [32] mentioned that the Darcy–Weisbach equation allows the calculation of head losses through pipes (Equation (13)). The hf was determined for HTF lengths of 68.4 m and 97.6 m.
h f = f * L D * v 2 2 g
where f is the friction factor (dimensionless), L is the pipe length (m), D is the pipe diameter (m), and v is the average speed (m/s).
Anaya et al. [33] proposed the Chen expression for the calculation of the friction factor (f) established in Equation (14). The roughness of the 3.0 × 10⁻⁷m PVC pipe was taken into account [34].
f = 1 ( 2 log { ε 3.7065 D 5.0452 R e log [ 1 2.8257 ( ε D ) 1.1098 + 5.8506 R e 0.8981 ] } ) 2
where ε is the pipe roughness (m) and Re is the Reynolds number, which was calculated using Equation (15).
R e = ρ *   D *   v µ  
The load loss for the accessories of the system was also taken into account. Flores et al. [35] pointed out the expression that allows one to determine hf in Equation (16), taking into account the coefficient of kinetic load (K), which varies depending on the type of accessory.
h f a = K v 2 2 g
where hfa is the load loss due to accessories (m) and K is the coefficient of kinetic load (dimensionless).

2.4. Experimental Analysis for Evaluating the Horizontal Tubular Flocculator

2.4.1. Pilot System Operation

For each experimental trial, in the first instance, a sample of the raw water that entered the DWTP Bayas was taken. Subsequently, the raw water sample was taken to the laboratory to determine the optimal dose of coagulant by means of the jar test.
The flow rate of the coagulant solution that had to be added to the bottom of the rectangular weir to generate the coagulation must be determined considering the raw water flow rate, optimal coagulant dose, and concentration of the coagulant solution (2%). It should be noted that rapid mixing was common for both the pilot system and the DWTP Bayas. A PVC pipe was implemented in the rapid mixer, which transported the coagulated water to the HTF. Polyelectrolyte was added to one-fifth of the length of the HTF. After the water flocculated in the HTF, the water entered the high-rate settler, and finally, the settled water moved to the rapid filters.

2.4.2. Determination of Optimal Dose of Coagulant

As mentioned above, the dose of coagulant applied to the experimental treatment system was determined by jar tests [35]. The agitation time that was applied in the jar tests was taken from the results of the tracer tests (the time was taken for a length of 97.6 m and a design flow rate of 1 L/s). Meanwhile, the velocity gradient applied in the jar test was obtained from Equation (12). The jar tests were carried out using a Phipps and Bird six-blade programmable blender (The equipment was lent by the drinking water company of the city of Azogues, EMAPAL). The dose of coagulant (aluminum sulphate) was determined for each one of the different turbidities of the raw water that was obtained during the year of experimental tests [36].
For each jar test, a known amount of coagulant was dosed after 30 s of the start of the test in order for the coagulant solution to be well distributed. This rapid mixing at 300 rpm took 1 min to destabilize the colloidal particles. The next period was the slow mixture that took 13 min. This time was determined by the tracer test. It was maintained at 50 rpm for adequate flocculation.

2.4.3. Experimental Tests varying Lengths of the HTF, Flow Rates, and Turbidities of Raw Water

As mentioned above, two lengths of the HTF (68.4 and 97.6 m) were used for the purpose of evaluating the relationship between length and efficiency. The HTF and the high-rate settler of the pilot plant were designed for a flow rate of 1 L/s; however, different flow rates were used to compare system performance under different operating conditions. The water was fed through a PVC pipe from the DWTP rapid mix channel to the HTF.
A regulating valve located in the HTF inlet pipe allowed the calibration of different flows that entered the system. Five different flows were tested (0.25, 0.5, 0.75, 1, and 2 L/s). The flows were measured by volumetric appraisal after the regulating valve. Likewise, different turbidities of the raw water were tested with the purpose of covering both the summer and winter seasons. According to the turbidity of the raw water obtained, the experimental tests were grouped into five groups, turbidities < 10 NTU, 10–20 NTU, 21–50 NTU, 51–100 NTU, and >100 NTU. In short, we experimented with combining 2 lengths, 5 flow rates, and 5 turbidity ranges, performing 50 tests. Each test was performed in duplicate in order to obtain reliable data on the removal of the analyzed parameters. A total of 100 experimental tests were performed between January and December 2020.

2.4.4. Sampling and Parameter Analysis

Turbidity and color were established as the main parameters for determining the efficiency of HTF. A HACH model 2100 Q turbidimeter was used for measuring turbidity, a HACH model DR/890 colorimeter for color, and a HANNA pH meter for pH and temperature; the equipments belongs to the "Bayas" DWTP. The water samples were taken at three points: (1) In the rectangular weir of the “Bayas” DWTP, that is, raw water (before the dosage of coagulant); (2) at the outlet of the module pilot settler (settled water); and (3) at the outlet of the pilot sand filters (filtered water). The sampling sites can be seen in Figure 3. Two water samples were taken simultaneously in the DWTP system, two at the outlet of the DWTP module settler, and three at the outlet of the DWTP modules and the outlet of the DWTP sand filters. These two additional samples made it possible to compare the efficiency of turbidity and color removal between the pilot system that includes the HTF and the conventional DWTP that has a horizontal hydraulic screen flocculator.

2.4.5. Removal Efficiency

Equation (17) proposed by Oliveira and Teixeira [24] allowed us to determine the percentage of turbidity and color removal from the systems. The removal efficiency (RE) of turbidity and color was calculated in each experimental test carried out, obtaining average removal values at the settler outlet and the filter outlet, both from the pilot system and the Bayas DWTP.
E   ( % ) = [ 1 ( R e m a n e n t   P a r a m e t e r I n i t i a l   P a r a m e t e r ) ] 100
Using the values of the turbidity and color removal efficiency, a box plot was made, using the length of 68.4 m and 97.6 m of the HTF. Likewise, a box plot was made with the removal values obtained from the DWTP. These box plots permitted us to analyze the turbidity and color removal efficiency of the Bayas DWTP settler vs. the pilot settler, as well as the turbidity and color removal efficiency of the Bayas DWTP filter vs. pilot filter. The R Studio program was used for the described analysis.

2.5. Statistical Analysis

To determine if there is a significant difference between the results of the efficiency obtained when using the HTF with a length of 68.4 m and 97.6 m, the Wilcoxon statistical test was used. This non-parametric test was used because the data did not present a normal distribution [37]. A significance level (α) of 0.05 was used. The null hypothesis Ho was considered true unless there was evidence to reject this hypothesis, and this happens when p < 0.05 because it represents a statistically significant difference [38]. For this study, Ho was considered: “The efficiency of turbidity removal at the outlet of the settler and pilot filter does not change as the length of the HTF increases”. Meanwhile, we considered the alternative hypothesis Ha: “The turbidity removal efficiency at the outlet of the settler and pilot filter changes with the increase of the HTF length”. Using the Infostat program, the p-value was determined to reject or confirm Ho. Likewise, it was determined if there is a significant difference between the results of the efficiency of turbidity and color removal considering the different flows and turbidity of the raw water. We also determined whether there was a significant difference between the turbidity and color removal efficiency, applying the HTF of the pilot system with respect to the turbidity and color removal efficiency by applying the HFD of the Bayas DWTP.
Finally, the Stepwise regression method was used to build multiple linear regression models. With this method, partial correlation coefficients were gradually added to the model starting with the highest and most significant variable. This process continued until there were no significant relationships [39]. A Stepwise regression model was performed in a multiple linear regression analysis to estimate the efficiency of the HTF.

2.6. Construction Cost Comparison

The construction cost of a drinking water treatment plant varies according to each place or city, the proposed design, and the specific evaluation of costs for each component of the project [40]. The construction cost of a concrete HFD was compared to the construction cost of the HTF used in this study. To determine the construction cost of the conventional flocculator, Equation (18) proposed by Deb and Richards [41] was used. In order to determine the construction costs of the HTF, the costs of each of the materials used in the implementation of this flocculator were added.
C C = 1553   ( Q M ) 0.45
CC is the construction cost in USD and QM is the maximum daily flow in mgd.

3. Results

3.1. This Evaluation of the Theoretical Retention Time in the Tubular Flocculator

For the different flow rates tested, the theoretical retention time (TRT) or “to” was calculated (0.25, 0.5, 0.75, 1, and 2 L/s). TRT was used in the text paragraphs and “to” was used in formulas. In the first instance, it was calculated for a length of 68.4 m and then for a length of 97.6 m from the HTF. The calculated TRTs are presented in Table 1. The time difference that exists between both lengths for the same flow rate can be identified. For all flows except for the flow of 2 L/s, the calculated theoretical times would be in compliance with the minimum time required for the flocculation process, which is 10 min. It shows that this implemented pilot system would meet the TRT conditions for flows equal to or less than 1 L/s.

3.2. Evaluation of Mean Retention Time

Once the tracer test was applied, the mean retention times (MRT) were calculated. These values can be seen in Table 1. As the operational flow decreases, the retention time in the reactor increases. For the same flow rate and length, the different theoretical retention times (TRT) and mean retention times (MRT) do not differ much. For the MRT analysis, the minimum retention time for flocculation was taken into account according to Garland et al. [42], which is between 10 and 30 min. For the length of 68.4 m, only the flows of 0.5 and 0.75 fulfilled the condition of the minimum retention time of 10 min. For the length of 68.4 m with a flow rate of 1.0 and 2.0 L/s, the minimum time of 10 min for both the MRT and the TRT is not met. For the two lengths of the HTF and the same flow rate of 2 L/s, both the MRT and TRT are less than the retention time recommended for conventional flocculators by the different authors cited by Romero [23], due to the fact that the flocculator worked with a double flow rate compared to the design flow rate in this case.
By increasing the length to 97.6 m, the minimum retention time for flocculation is met for all flows except 2 L/s. For the design flow rate (1 L/s) and the length of 97.6 m, the TRT (13.17 min) was close to the MRT (12.3 min), which, in turn, was close to the retention time used for the flocculator design (12.5 min).
Figure 4 shows the concentration curve of the tracer vs. time curve obtained in the hydrodynamic study. From this curve, the MRTs were obtained in a comparative way. The TRT was calculated by Equation (1). The results obtained are presented in Table 1. A slight decreasing “tail” can be observed after reaching the maximum concentration in Figure 4, but with a fast trend and little symmetry in the curve (more Gaussian and less exponential), which allowed the verification that the real average residence time in the system was similar to the calculated theoretical time.

3.3. Evaluation of the Hydraulic Behavior of the HTF by Means of the Wolf Resnick Simplified Method

Table 2 shows the percentages of piston flow, mixed flow, and dead spaces calculated for the different flows. It can be identified that the piston flow percentages are in the range of 88.5% to 94.11%. The presence of mixed flow could be attributed primarily to the 13 existing 180° turns in the system, by which the fluid goes through a mixing or turbulence process and therefore increases the percentage of mixing in the system. The piston flow values obtained by Ispilco [43] in a conventional horizontal flocculation system using the Wolf–Resnick model was 89.4% with a mixed flow of 10.6% and no dead zones, while Aguirre [44] evaluated a baffle flocculator and obtained a piston flow of 93% and mixed flow of 7%.
Analyzing the values presented in Table 2, the only value that is below the percentages found in other studies was for the flow rate of 2 L/s with a length of 68.4 m, corresponding to a piston flow of 88.5%; however, the difference is not significant. Rojas and García [45] mentioned that the efficiency of the flocculator increases when the piston flow is closer to 100%. The percentage of dead spaces was negative, which indicates that there were no dead spaces in the system. It can be attributed to the configuration of the system, due to the fact that the piston flow does not allow the existence of these zones, having an advantage over flocculators in conventional horizontal hydraulics, in which, due to the use of rectangular screens, short circuits could occur in the system. Therefore, in the HTF, as there is a predominance of piston flow, the mean retention times were similar to the theoretical retention times, for the range of flows analyzed.

3.4. Velocity Gradient Evaluation

The results indicated a direct relationship between the hydraulic gradient (G) and the operational flow. Similarly, the G calculated with both the MRT and the TRT increased with the increase in the length of the HTF for the same flow rate; however, this increase in the gradient was not significant (Table 3).
For the flows of 0.25, 0.5, 0.75, and 1 L/s in the two lengths, the values of G were found in the ranges recommended by the various authors for conventional flocculators (Table 4). However, for the flow rate of 2 L/s in the two lengths of the HTF, the value of G calculated exceeds 100 s−1, which is the maximum value recommended for conventional flocculators [23]. However, if the range suggested by Mohammed and Shakir [46] for G is taken into account, which is 10 and 75 s−1, only flows of 0.5, 0.75, and 1 L/s meet the range established by these authors. After the analysis of the values of the theoretical gradients with respect to the real gradients, it can be seen that the theoretical gradients are slightly less than the real gradients at each flow rate. This situation occurs because the mathematical models indicate ideal values due to the fact that these models do not take into account the real physical and geometric conditions of a certain unit.

3.5. Evaluation of the Dose of Coagulant

3.5.1. Dosage Curve Obtained by Jar Test

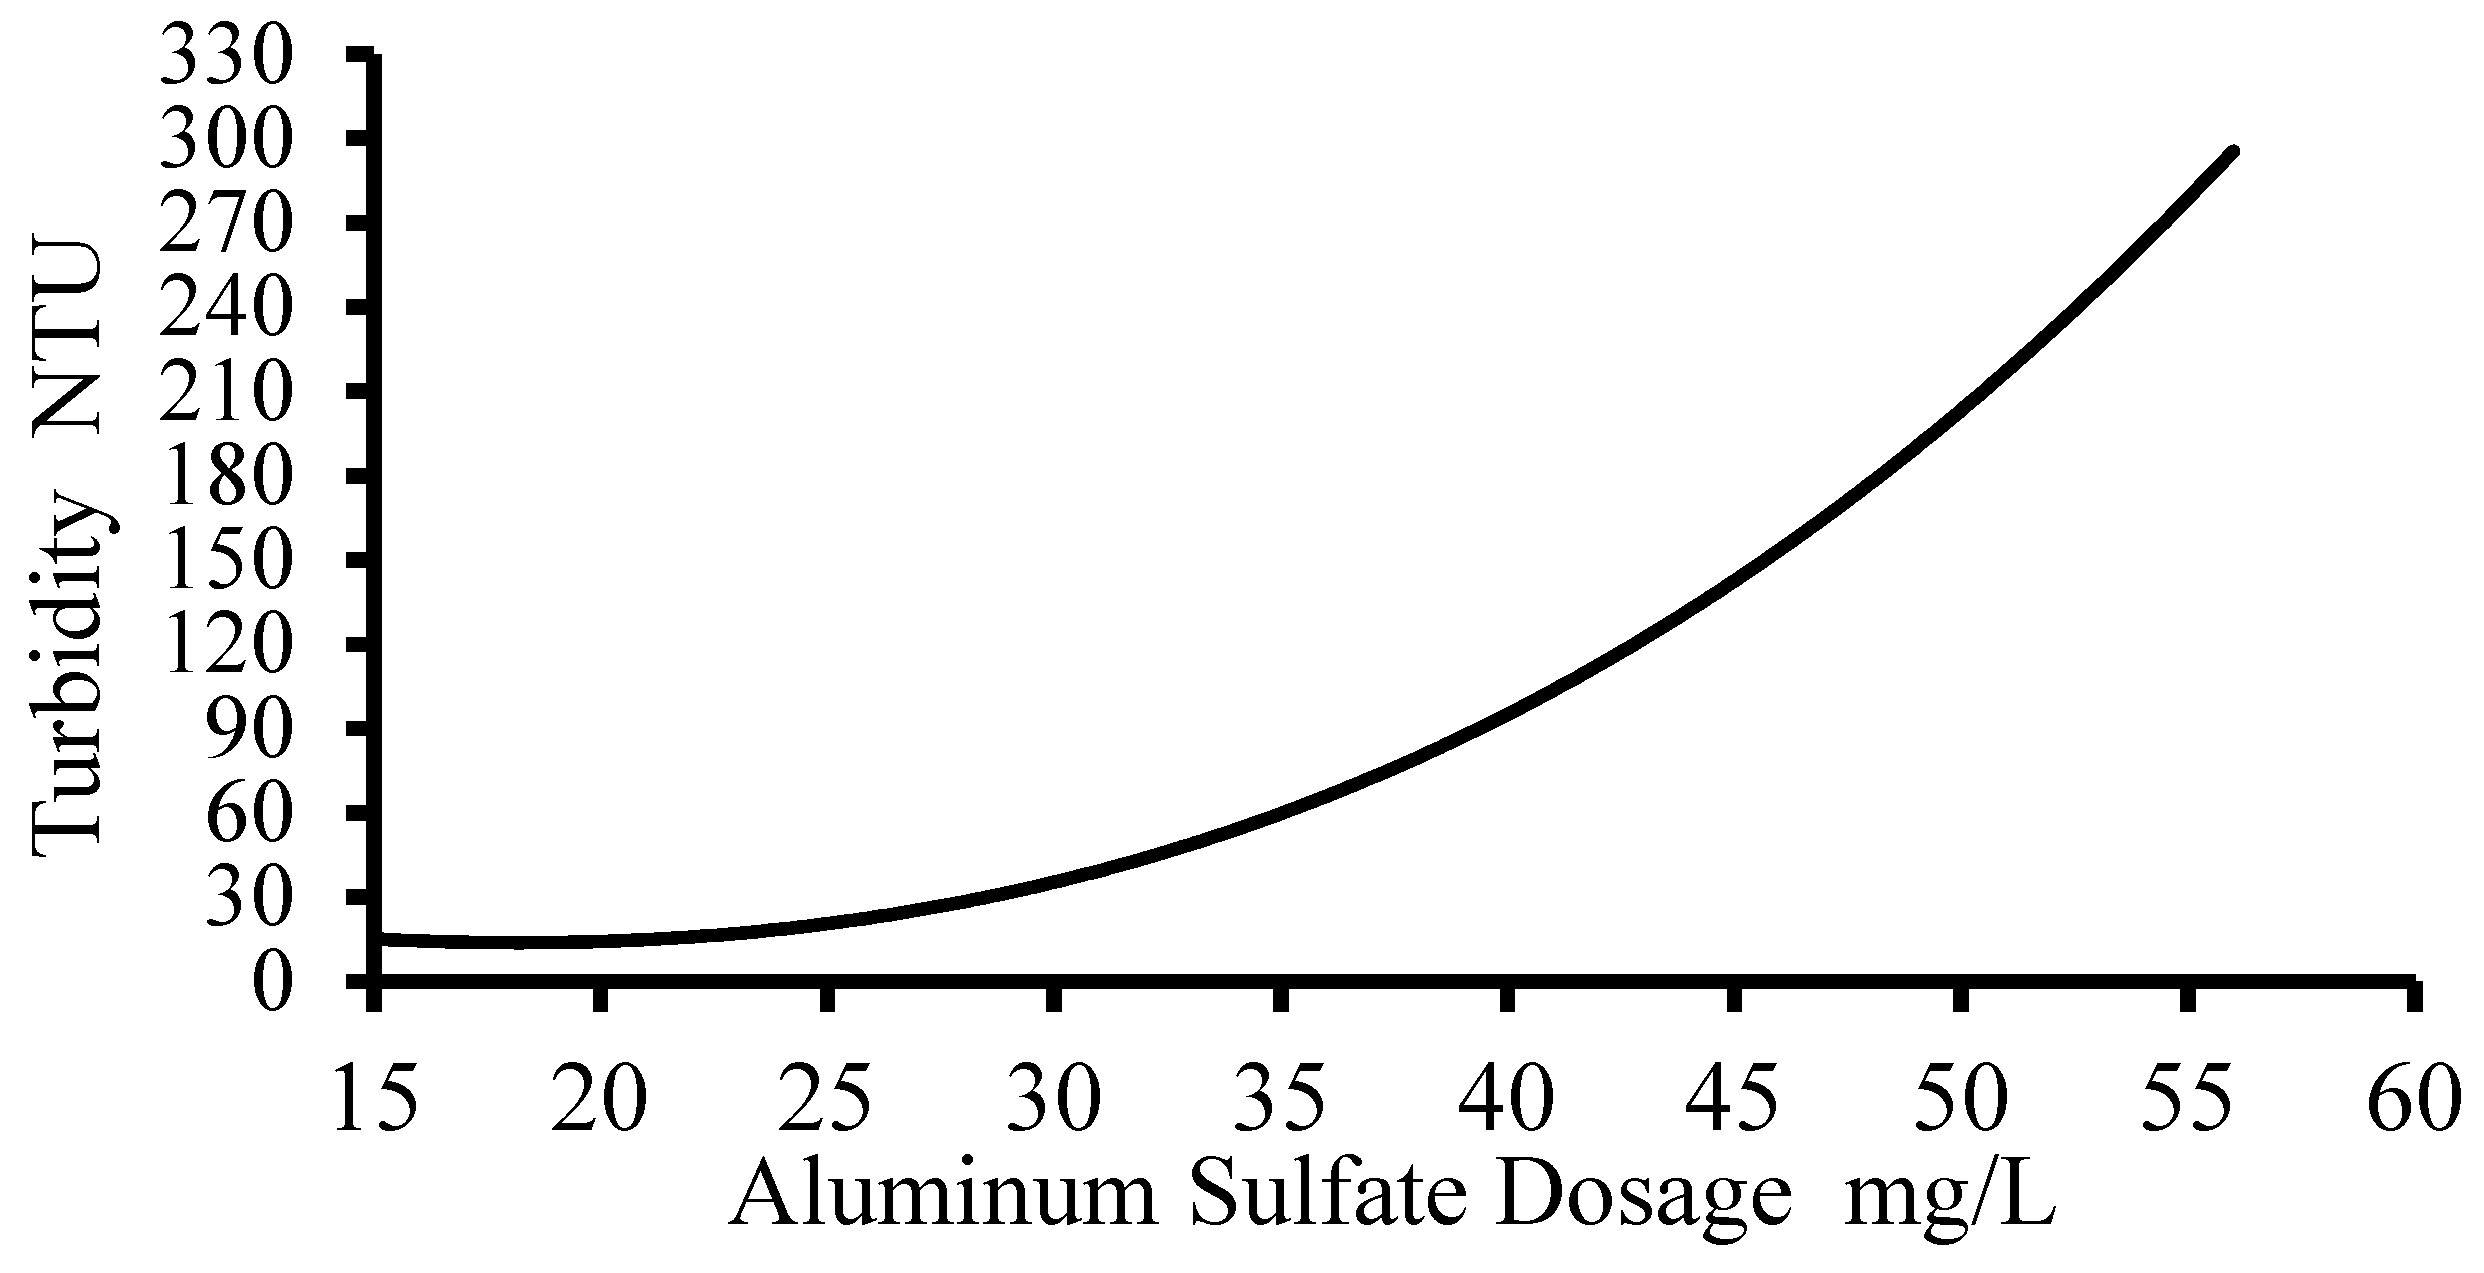
Jar tests were carried out for ensuring the correct dosage of coagulant for the different turbidities of the raw water. Their results allowed the elaboration of the dosage curve in Figure 5. The applied agitation time in the jar tests was 12.3 min, taken from the results of the tracer tests (Table 1) for the design flow rate (1 L/s). Meanwhile, the velocity gradient applied in the jar test was 41 s−1, obtained by applying Equation (12) for the aforementioned retention time.
Once the raw water entered the rapid mixing unit, the dose of coagulant corresponding to the turbidity of the raw water (Figure 5) was applied to carry out the coagulation process. Once the water was coagulated, the corresponding flow was conducted for each one of the tests in the HTF. Applying Figure 5, the correct dosage was guaranteed for the different turbidities used.

3.5.2. Applied Doses in Field Trials

It should be emphasized that Figure 5 served as applying a starting dose, due to the fact that a visual follow-up of the floc formation that entered the settler was continuously made and the turbidities at the settler outlet were also monitored and, if necessary, the dose was adjusted until the obtention of minimum turbidity in the effluent of the settler.
The raw water turbidities (RWT) and alum doses that were used in the different flows of the HTF68.4 m in length are expressed in Figure 6a. For the 68.4 m length, the maximum recorded raw water turbidity (RWT) was 240.18 NTU with a corresponding dose of aluminum sulphate of 52.1 mg/L, applied at an operational flow rate of 0.50 L/s. The minimum RWT recorded during the tests at this length was 8.82 NTU with a dose of 19.4 mg/L of alum applied at a flow rate of 2 L/s.
Figure 6b shows the different RWTs and alum doses for the 97.4 m length of the HTF. For this length of 97.4 m, the maximum RWT recorded was 249.6 NTU, with an alum dose of 55.6 mg/L applied at a flow rate of 1 L/s, while the minimum RWT recorded was 7.93 NTU with an alum dose of 17.7 mg/L for a flow rate of 0.25 L/s. For the RWT and applied alum dose dataset, it was determined that there is no normal distribution by means of the modified Shapiro–Wilk normality test, due to the fact that p < 0.05 in both data series. As there was no normal distribution in these datasets, the correlation of two variables was performed using Spearman’s correlation coefficient. Spearman’s value for the RWT data series and alum dose in the HTF was 0.97, displaying a very strong correlation.

3.6. Turbidity and Color Removal Efficiency

3.6.1. Impact of HTF on Turbidity and Color Removal Efficiency after Settler

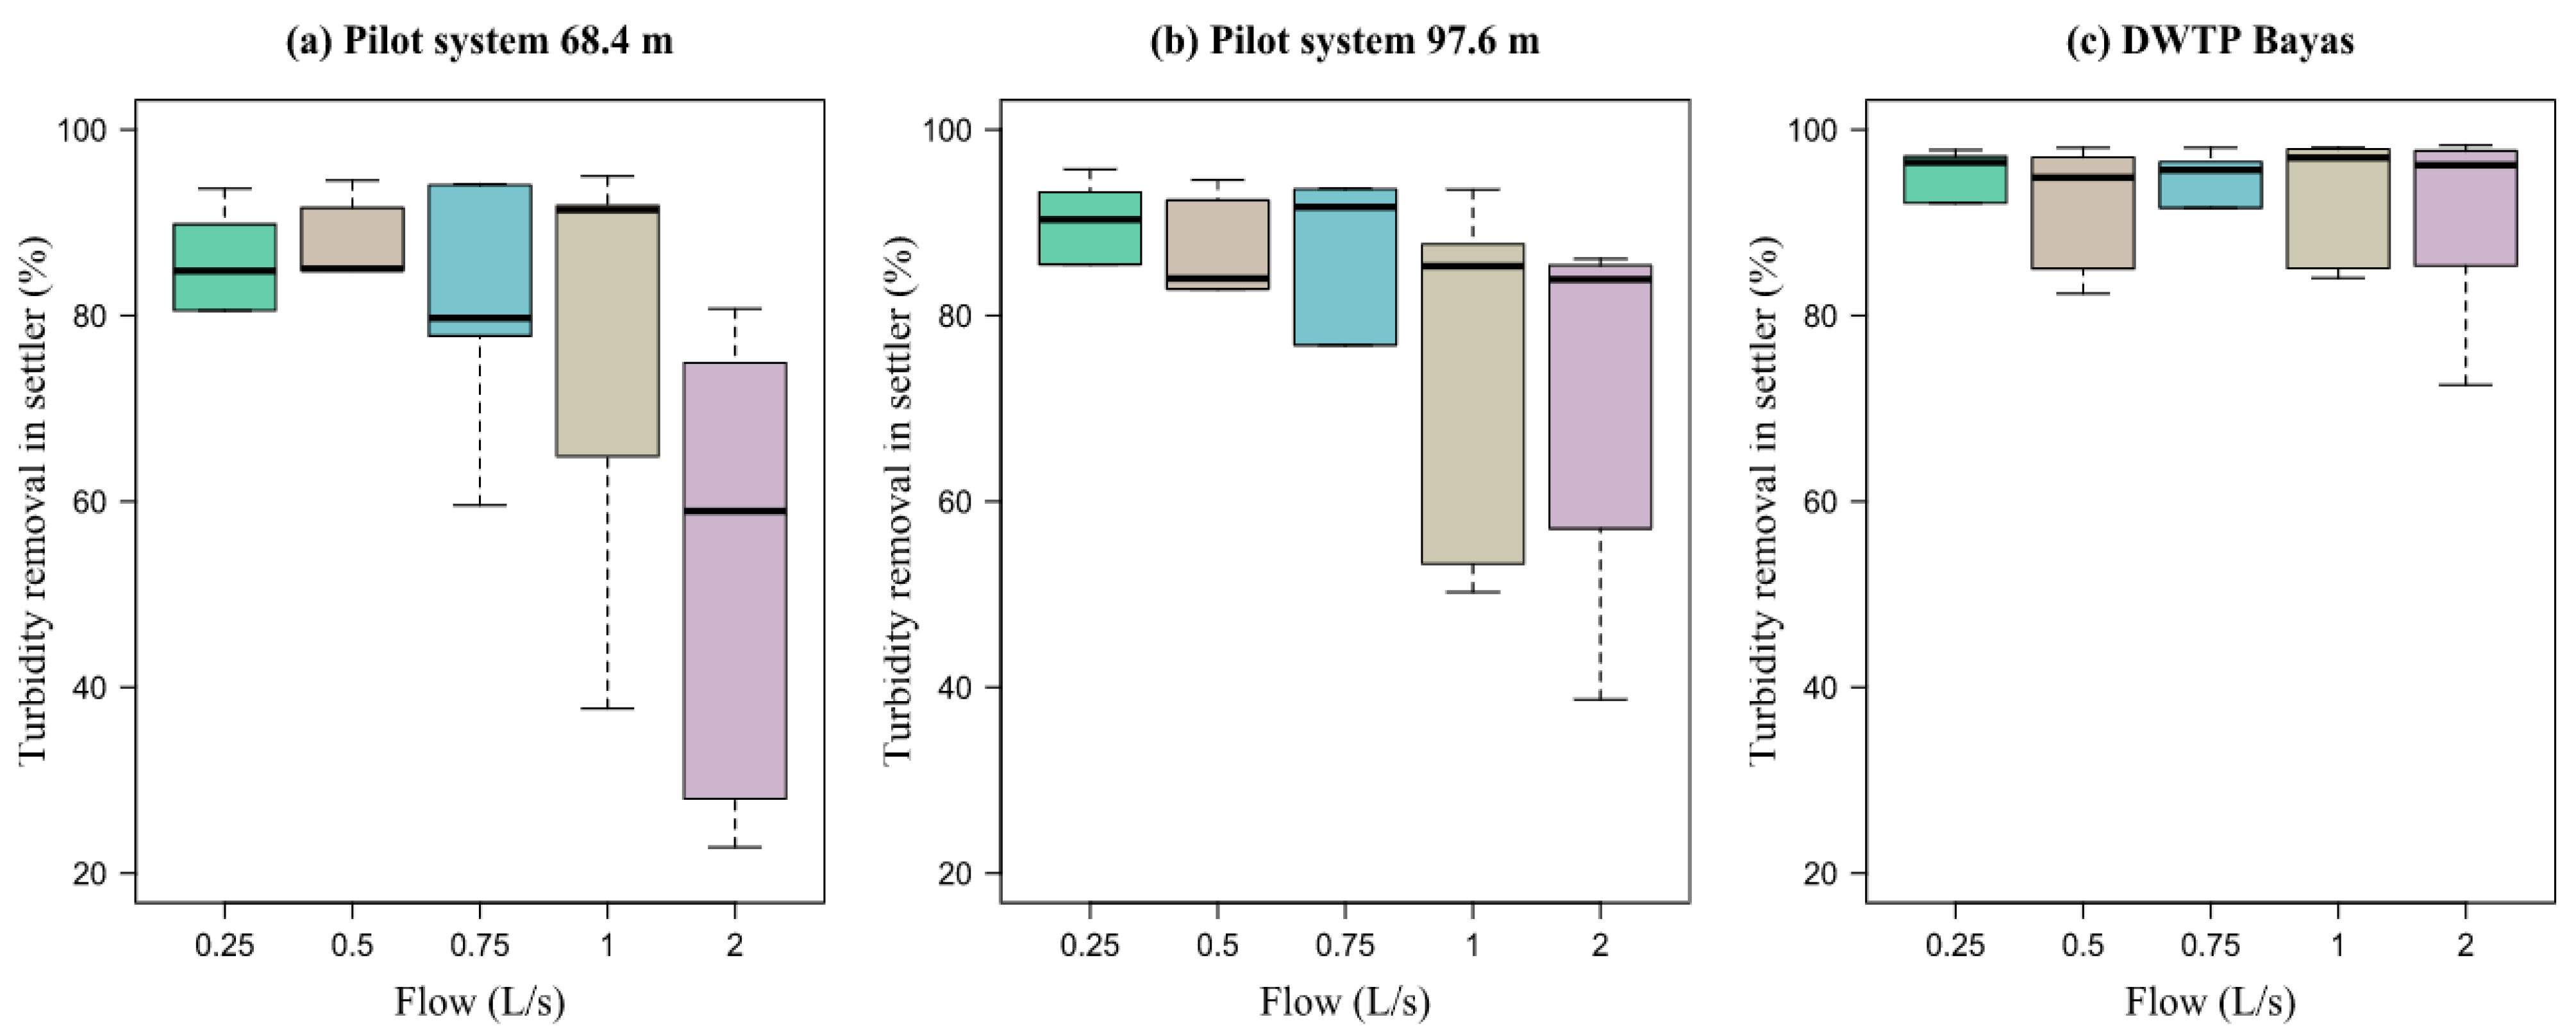
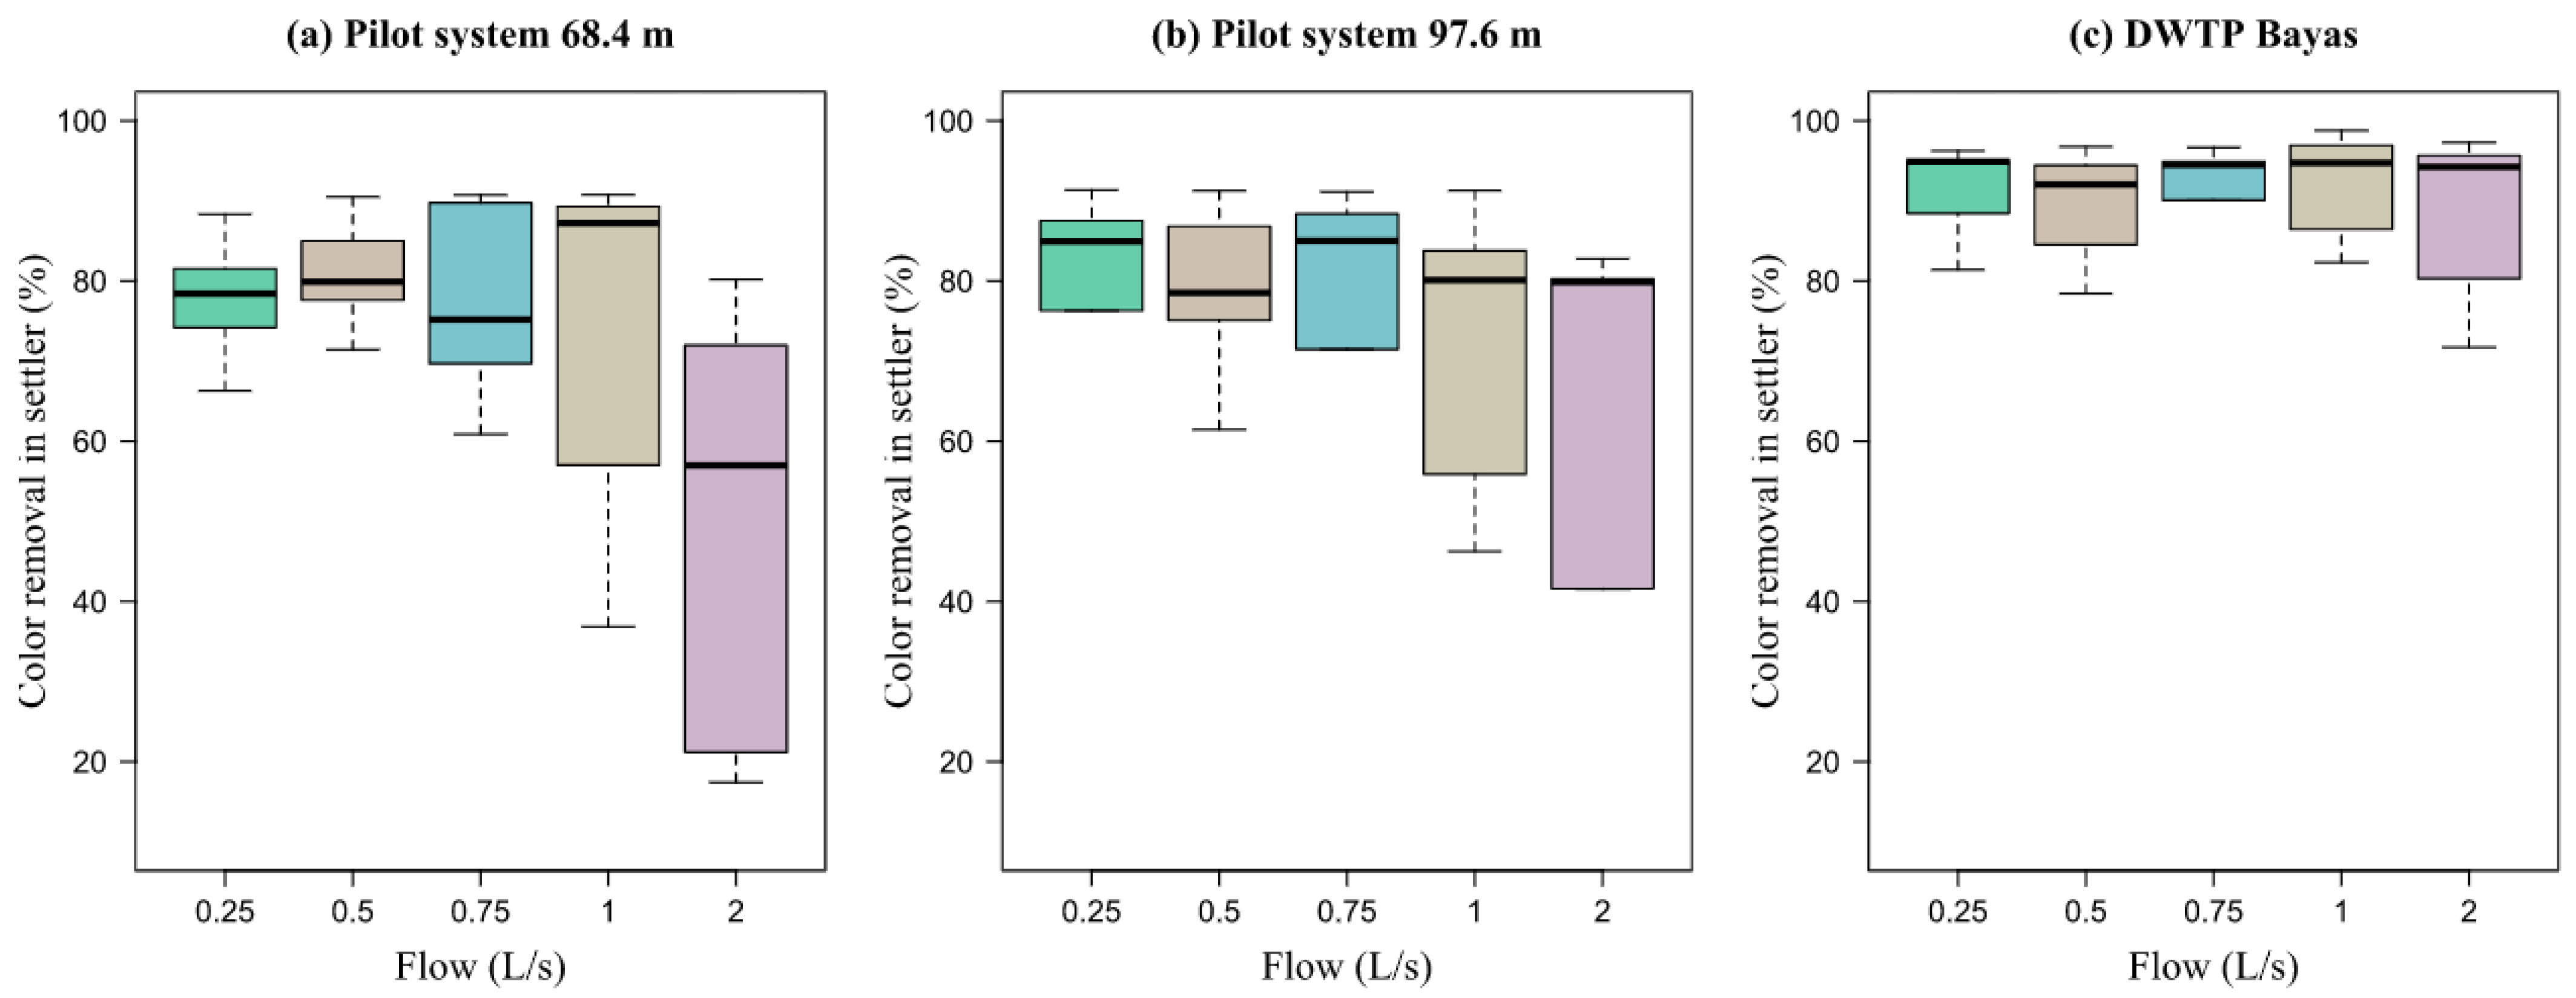
Figure 7 shows the turbidity removal efficiency measured in the pilot settler and once the water had been flocculated in the HTF using the length of 68.4 and 97.6 m (Figure 7a,b, respectively). Figure 7c also shows the turbidity removal efficiency in the DWTP settler and once the water had passed through the conventional baffle flocculator. It was performed to compare the efficiency between these systems. It can be seen that when the flow rate increased to 2 L/s in the pilot system, there is a lower turbidity removal efficiency (RE), although this trend is significantly reduced, especially for flows of 0.75, 1, and 2 L/s with the increase in the length of the HTF to 97.6 m. Meanwhile, the RE in the DWTP Bayas was constant. It should be emphasized that the characteristics of the raw water were the same for both the pilot system and the DWTP Bayas. The minimum RE in the HTF was presented for a flow of 2 L/s and a length of the HTF of 68.4 m, precisely due to the flow overload to the system, by doubling the design flow. The turbidity RE was 86.9% when the 68.4 m HTF was used; meanwhile, the RE was 83.89% when a length of 97.6 m was used.
Figure 8 shows the color RE for both lengths of the HTF, as well as for the settler of the DWTP Bayas. As in the case of turbidity removal, the color RE at the outlet of the settler using the length of 68.4 m in the HTF was greater than when 97.6 m was used for flows of 0.25, 0.5, 0.75, and 1 L/s (Figure 8a,b). Meanwhile, for the flow rate of 2 L/s, the RE was higher when 97.6 m was used. For the case of DWTP, the color RE was constant (Figure 8b).
At flow rates of 0.25, 0.5, 0.75, and 1 L/s, the color RE was similar using the two HTF lengths. However, for the 2 L/s flow rate, the RE was higher when a length of 97.6 m was used, with 79.87% efficiency, relative to the RE of 58.96% when a length of 68.4 m was used. Therefore, for flows higher than the design, a length of the HTF greater than 68.4 m will be required in order to increase the RE of color in the settler.

3.6.2. Impact of HTF on Turbidity and Color Removal Efficiency after the Filter

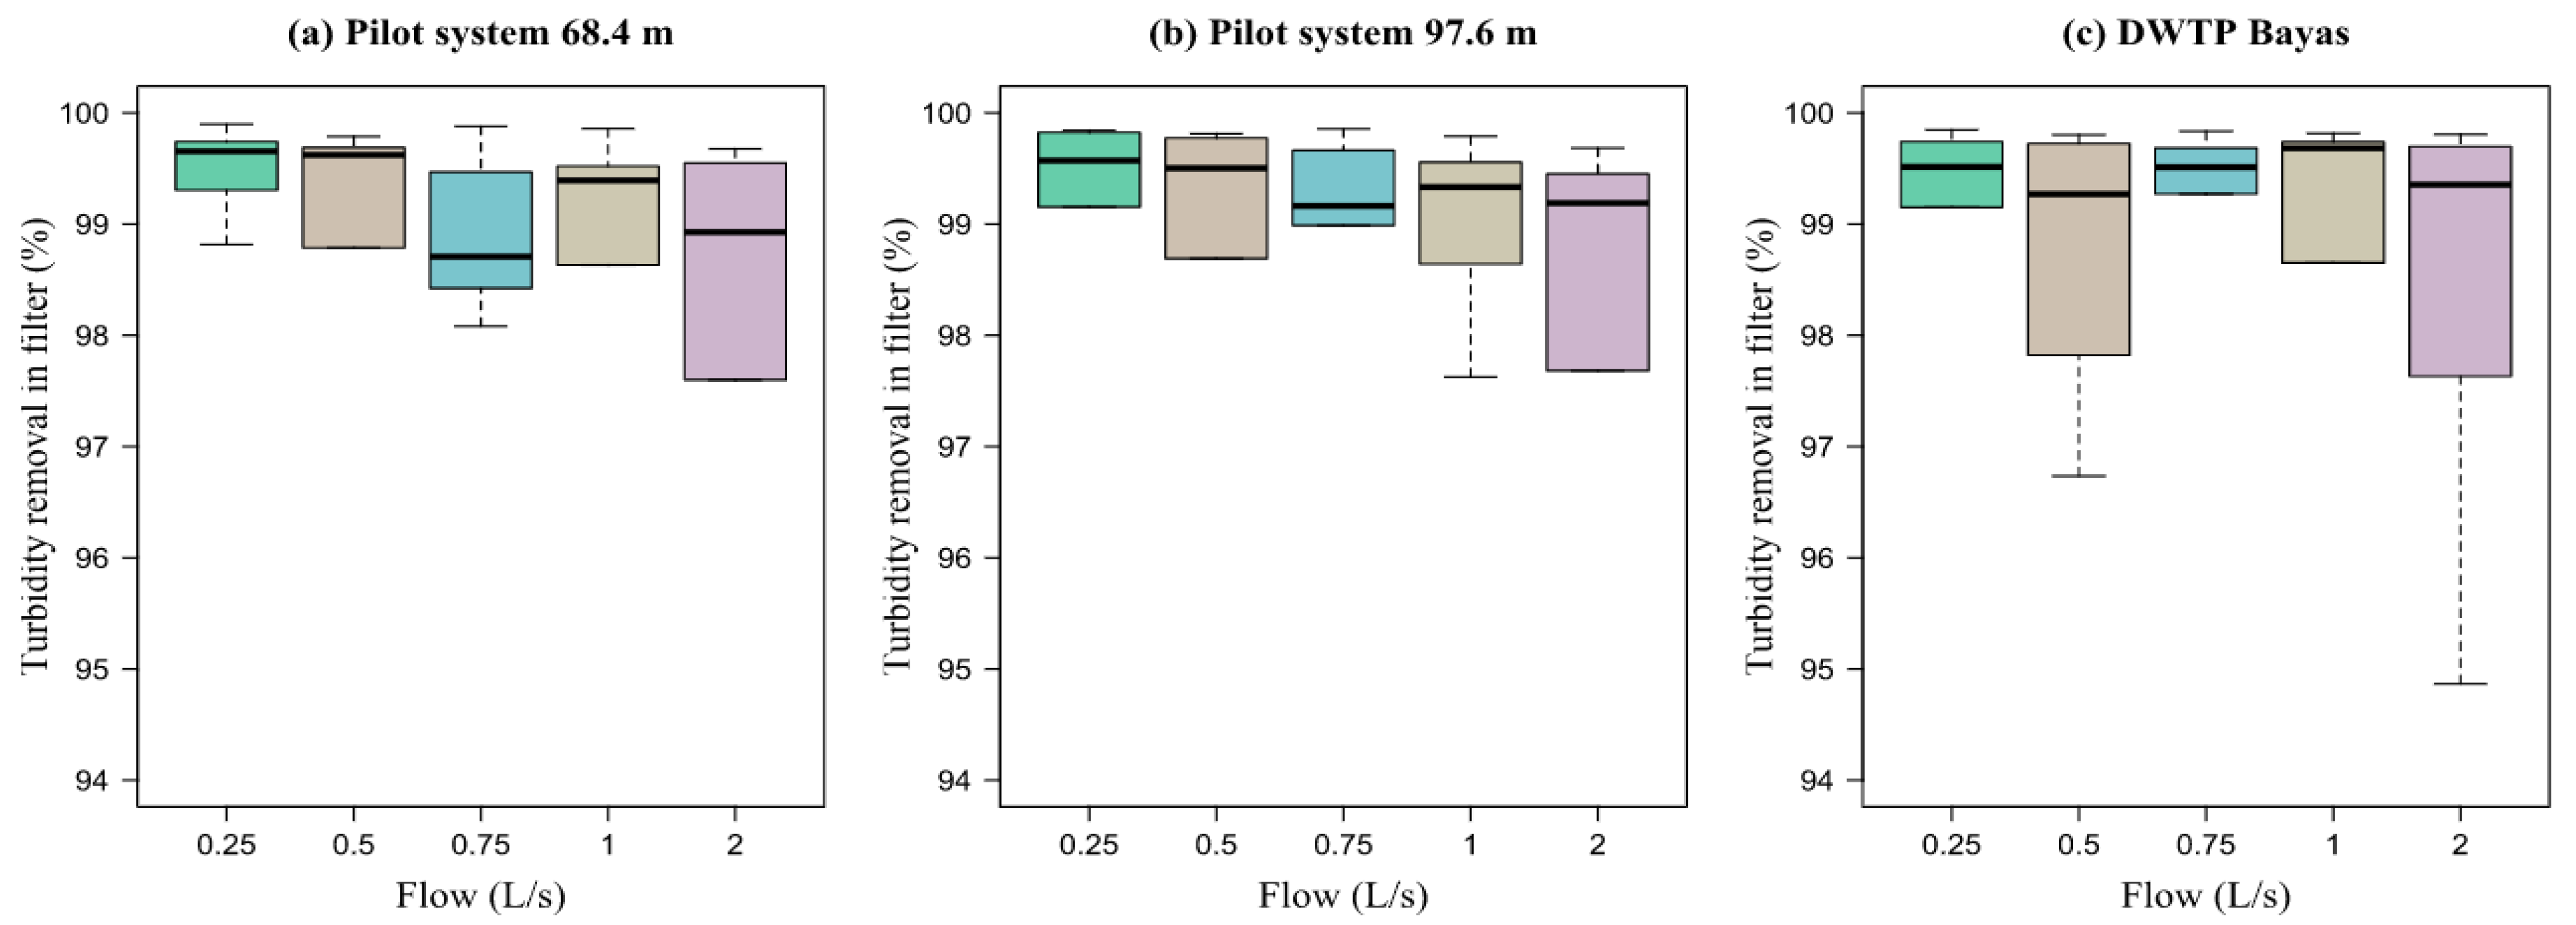
Figure 9 shows how the turbidity RE at the filter outlet of the pilot system presents a similar behavior when the two lengths of the HTF were used for each tested flow rate. This RE can be compared with the efficiency of the conventional DWTP filter, due to the fact that REs greater than 99% have been achieved at all flow rates. For flow rates of 0.25, 0.5, 0.75, and 1 L/s and using the two lengths of the HTF, the average turbidity RE is greater than 98.7% in the pilot filtration unit. However, for the flow rate of 2 L/s, the average RE in the two lengths of the pilot system was 97.88%, a relatively high efficiency considering that the retention time in both lengths of the HTF does not reach 10 min as suggested by the previously cited authors for adequate flocculation. However, an inadequate formation of flocs due to the short retention time when flow rates higher than the design flow rate are used in the HTF can cause a lower removal efficiency in the settler, as well as rapid saturation or clogging in the sand filters, meaning that the maintenance of this unit needs to be realized in short intervals of time.
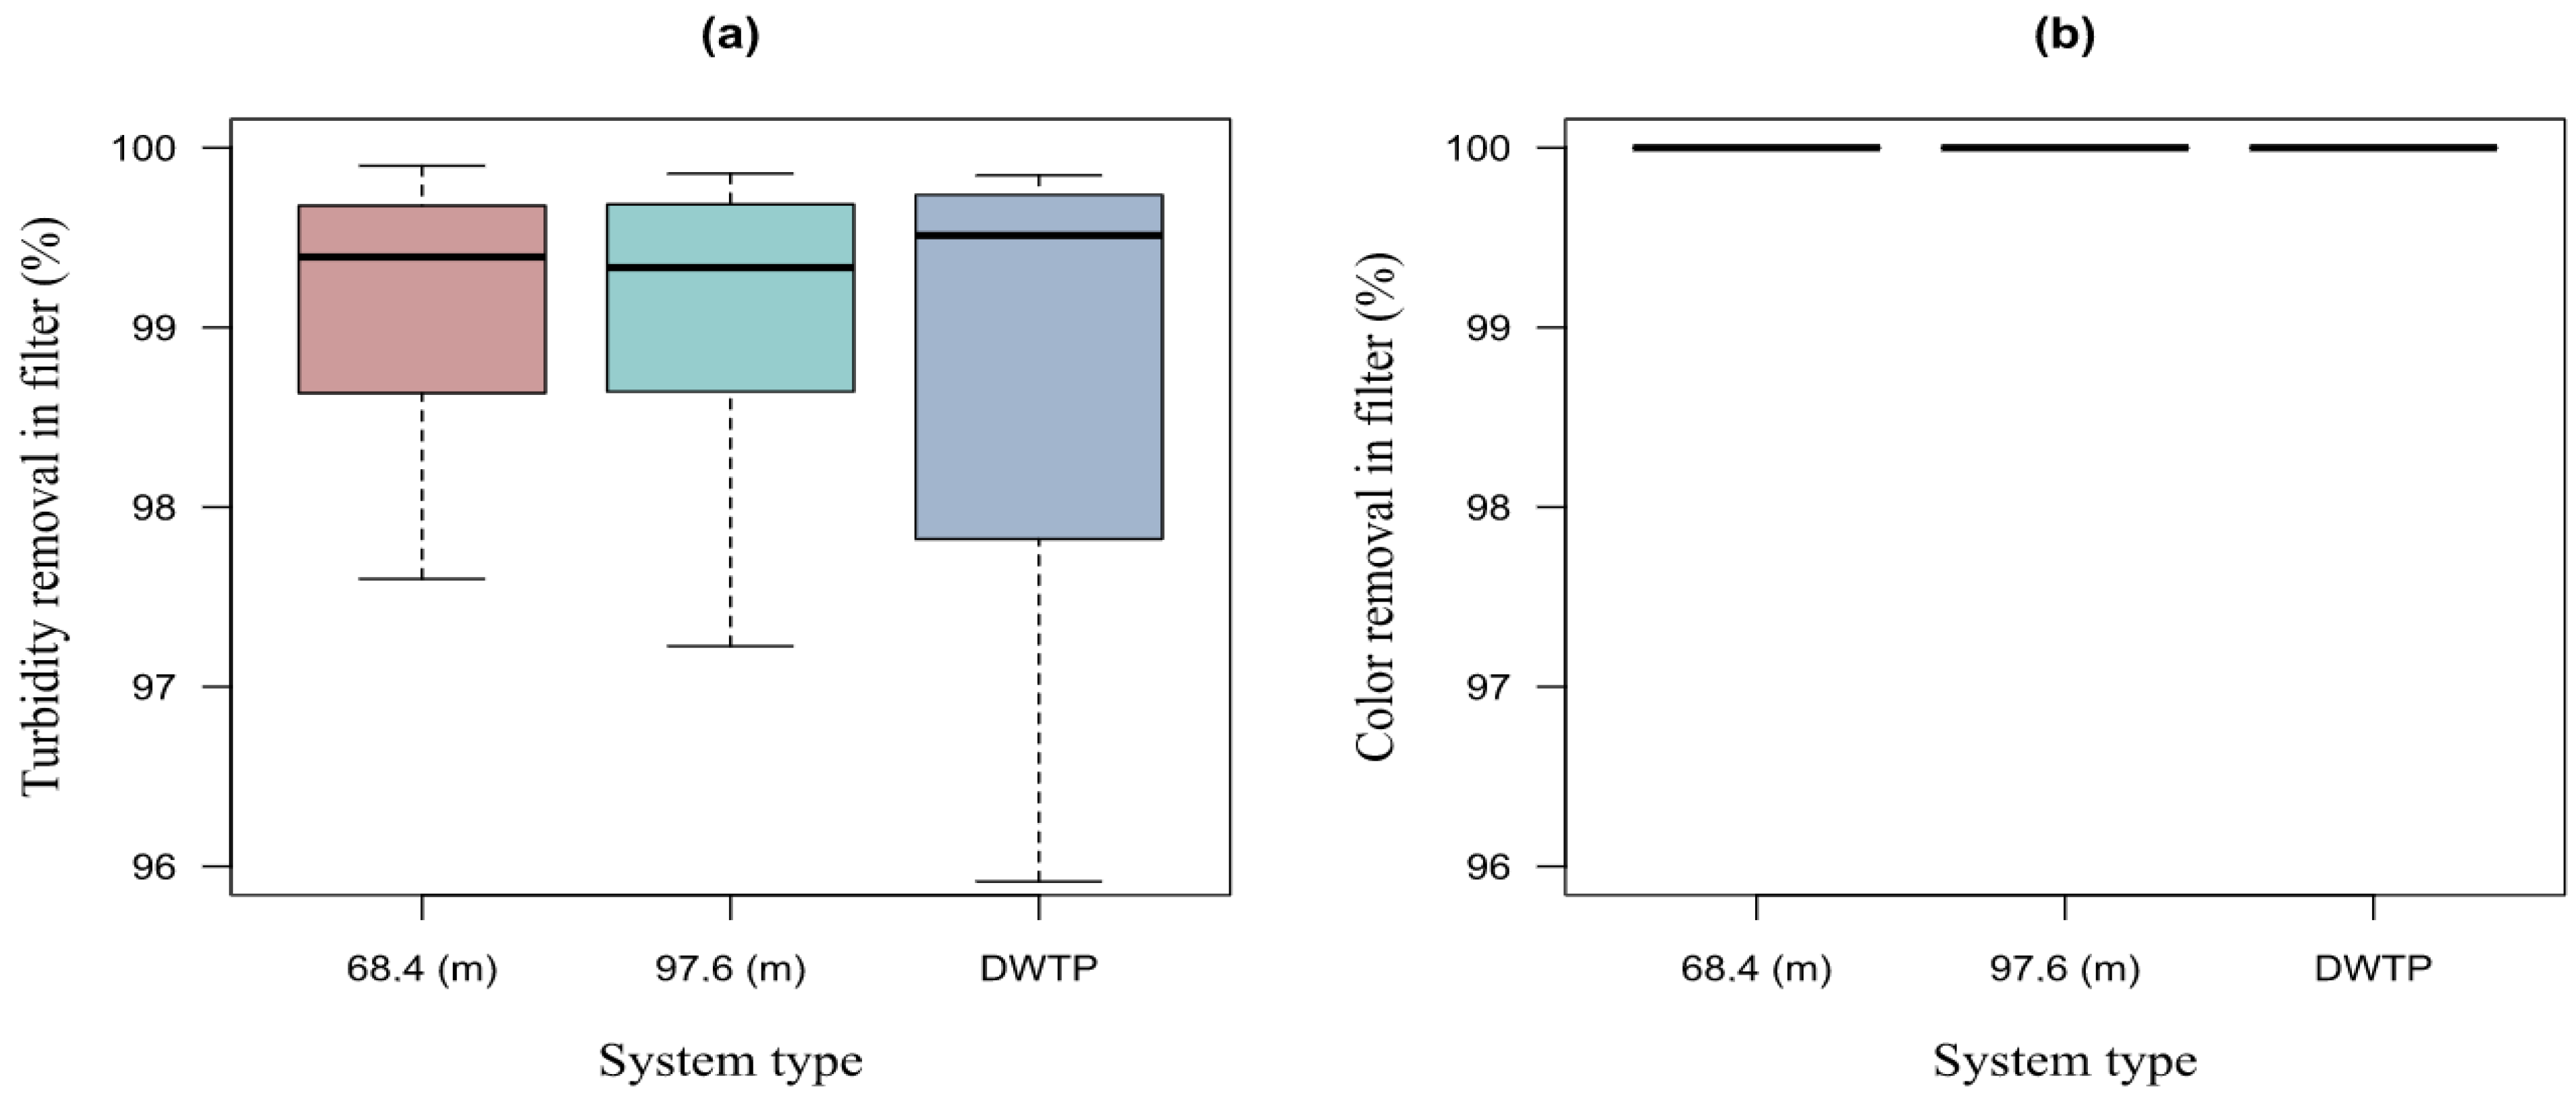
Figure 10 shows the color RE at the filter outlet after the water has passed through the HTF, as well as the RE of the filter after having passed the water through the DWTP baffle flocculator. The color RE at the filter outlet in the pilot system was similar for all flow rates, reaching 100% removal. High values were obtained at the output of the DWTP filter, with the RE of this parameter also reaching 100%. The average color removal at the filter outlet in the pilot system was 99.64% for the 68.4 m length and 99.56% for the 97.6 m length. Therefore, as in the case of turbidity, the color also meets the standards necessary for the supply of drinking water using a purification system that includes an HTF.

3.7. Comparison of Turbidity and Color Removal between the Pilot System and the Conventional Plant

3.7.1. Statistical Summary of the Efficiency of the HTF + Settler System

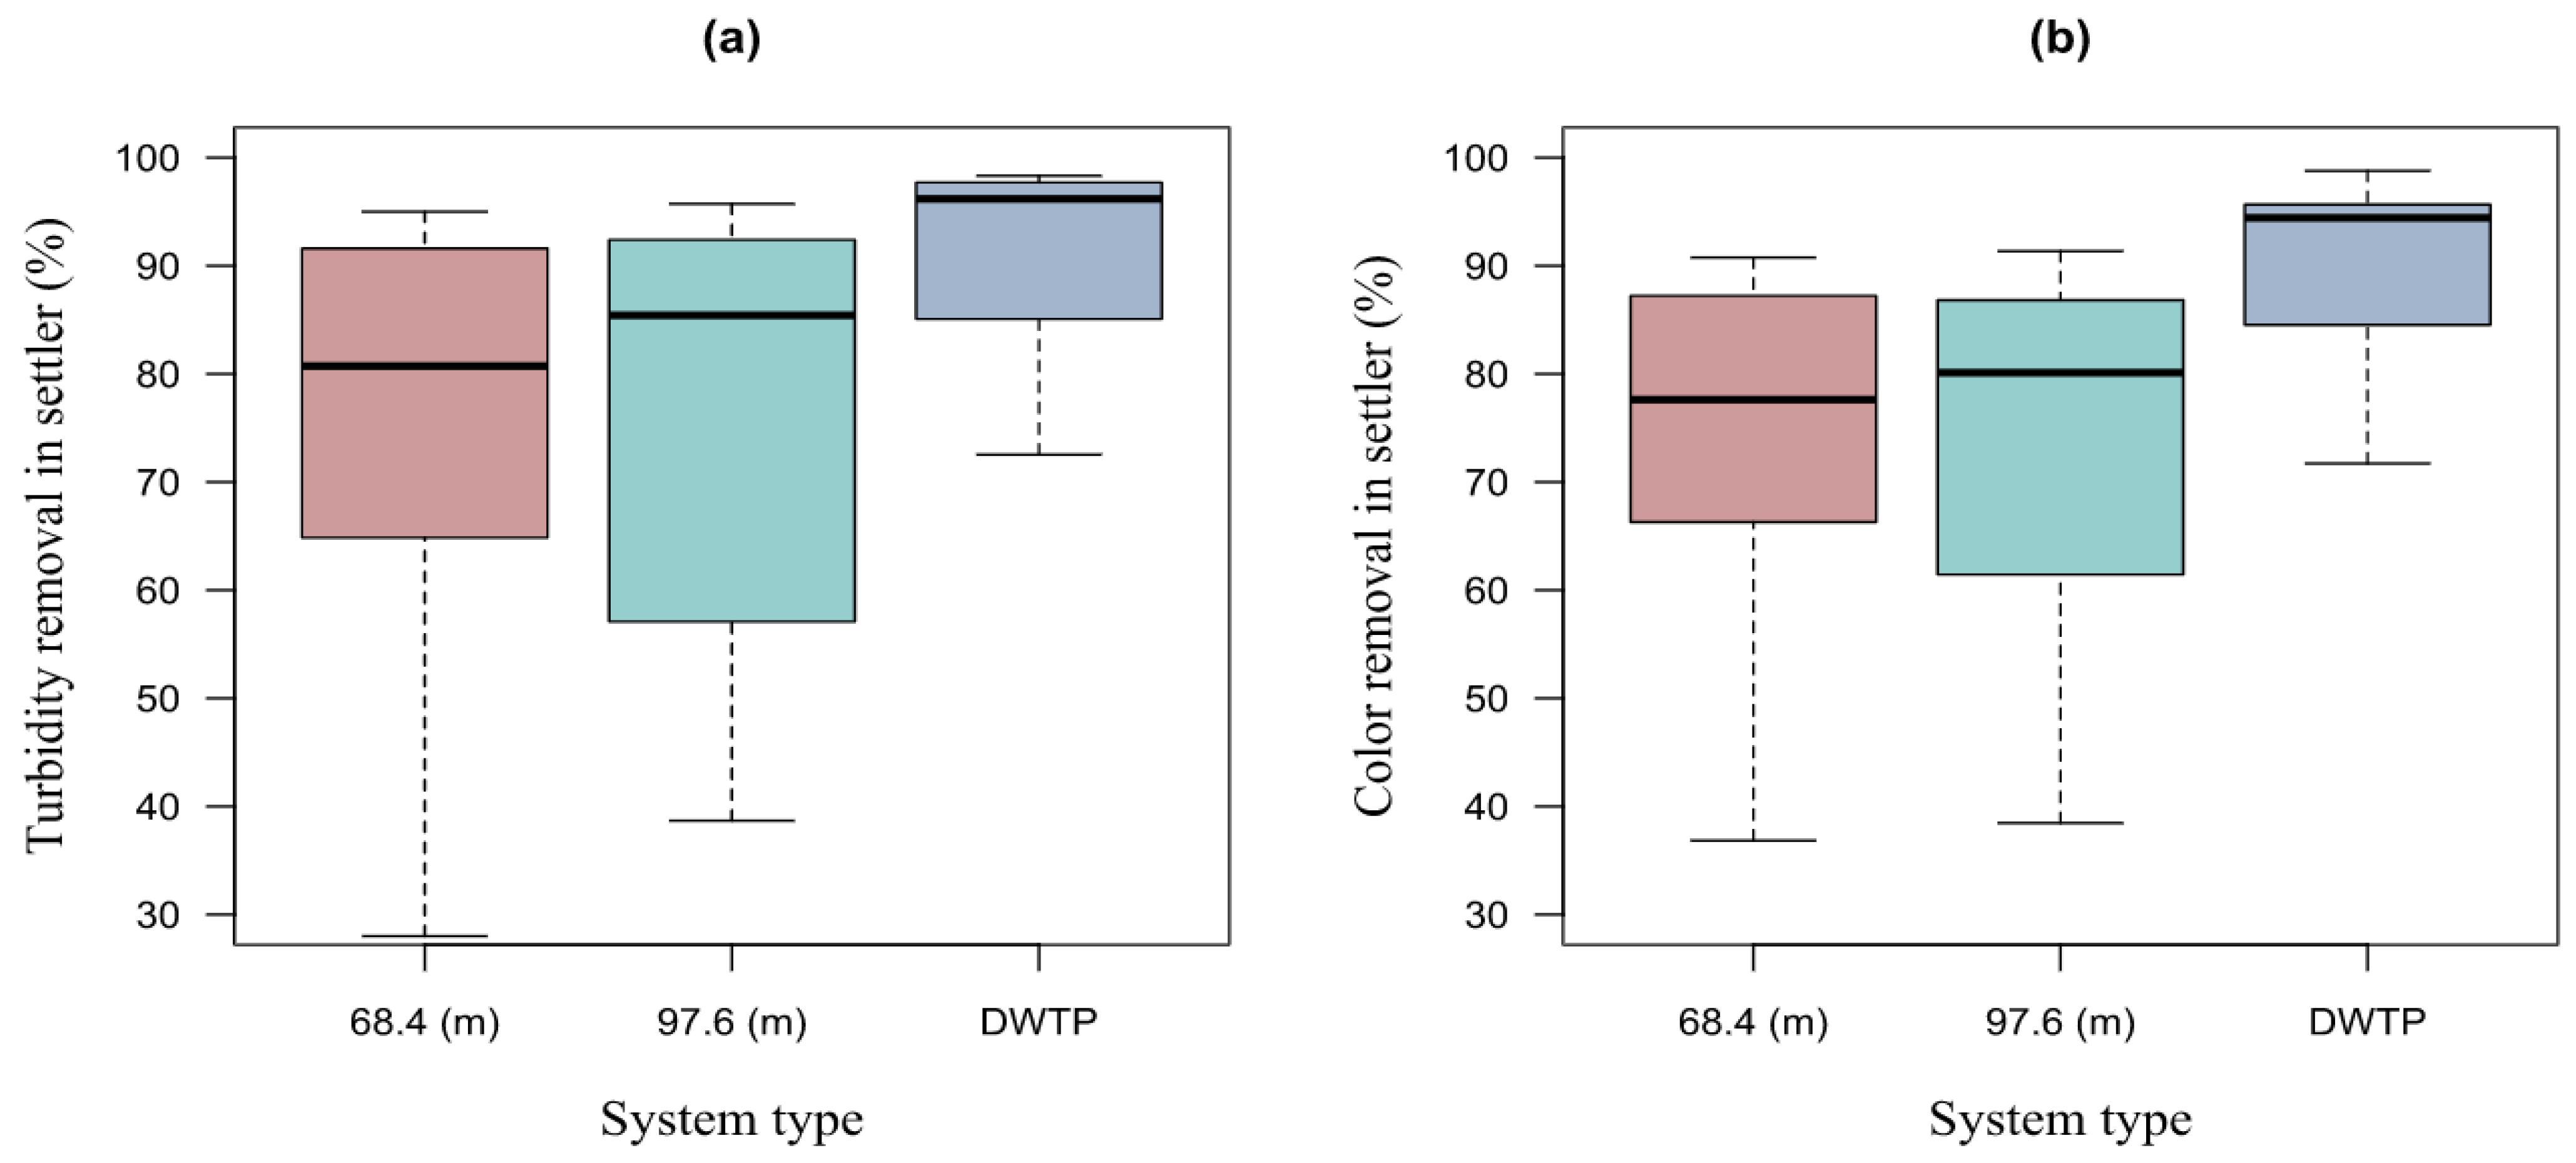
Table 5 shows the maximum values, minimum values, arithmetic mean (mean), and median (Me) of the turbidity and color removal obtained in the pilot settler after the water has passed through the HTF using the two lengths, as well as the removal of turbidity and color obtained in the DWTP settler.
The Bayas DWTP had the highest average turbidity RE at the settler outlet with 91.80%; meanwhile, the average RE of the pilot system with the HTF of 97.6 m and 68.4 m in length was 77.41% and 75.45%, respectively (to see Table 5). However, excluding the 2 L/s flow rate, the turbidity RE increased to 81.04% for the 68.4 m length of the reactor. Similarly, for the length of 97.6 m, the RE increased to 79.20%.
Oliveira and Teixeira [19] used a tubular helical flocculator (THF) for turbidity removal with different lengths between 1.89 m and 36.84 m. The average RE of turbidity in the THF and decanter was higher than 80%, with a maximum removal of 86.2%. In this study, the best removal results occurred with the lowest velocity gradients. Therefore, the turbidity removals in the settler + THF were slightly lower than those obtained in the settler + HTF system. However, the maximum turbidity RE values (95.73%) using HTF were higher than the maximum value (86.2%) using THF.
The maximum RE value of turbidity in the DWTP was 98.33% for a CT ≥ 200 NTU (Figure 11). In the HTF, for the length of 97.6 m, the maximum value of RE was 95.73% for an RWT ≥ 200 NTU. In the length of 68.4 m, the maximum value of RE was 95% with RWT ≥ 200 NTU. In the 68.4 m system, the minimum RE was 22.79% with RWT ≈ 10 NTU. The minimum RE for the length of 97.6 m was 38.68%, with RWT ≈10 NTU. For the DWTP Bayas, the minimum RE was 72.53% when the tests were carried out with RWT ≈ 10 NTU.
Therefore, the RE of color was similar in the pilot settler after the use of the HTF of 68.4 m and 97.6 m, with average values of 71.53% and 73.39%, respectively (see the right panel of Figure 11). For the DWTP, the color RE was higher than the pilot system with an average value of 90.14%.
Considering national and World Health Organization (WHO) regulations for water for human consumption require a maximum for turbidity and color of 5 NTU and 15 UC_Pt-Co, respectively, according to Table 6, it can be seen that the water obtained at the outlet of the settler does not meet these requirements. Meanwhile, the water obtained at the filtration outlet complies with the regulations for all flow rates tested for turbidity and color, indicating that in order to obtain water that complies with the regulations, it is necessary to implement a sedimentation and filtration system after the HTF.
In the case of the raw water pH, 91% of the measurements were in the range of 7.4 to 7.9 and 9% of the measurements were between 7.2 and 7.4. The pH measurement at the outlet of the experimental pilot system in 79% of the data was between 7.2 and 7.5; meanwhile, in 19% of the data, it was between 6.9 and 7.2, and in 2% of the data, it was between 6.8 and 6.9. In all cases, the pH of the treated water was within the range recommended by national regulations, which is from 6.5 to 8 for human consumption.
Regarding the average concentration of aluminum in the raw water, it was between 0.011 and 0.026 mg/L, obtaining an average concentration of 0.013 and 0.031 mg/L in the treated water. According to the previous results, the concentrations of residual aluminum were much lower than the limit allowed in the national regulations and the WHO (0.2 mg/L).

3.7.2. Statistical Summary of the Efficiency of the HTF + Settler + Filter System

Table 7 shows the maximum values, minimum values, arithmetic mean (Mean), and median (Me) of the turbidity and color removal obtained in the pilot filter after the water had passed through the settler and HTF using the two lengths, as well as the removal of turbidity and color obtained in the DWTP Bayas filter. The turbidity removal in both the pilot system using HTF with the two lengths and in the DWTP Bayas do not differ, being similar in their average values, with values of 98.80, 98.74, and 98.78%, respectively.
In the pilot system with the HTF length of 64.8 m and 97.6 m, the maximum values of RE of color were 100% and minimum values were 98.82 and 98.23%, respectively. There was an overall RE of 100% for this parameter in the DWTP, showing that there is no difference in color removal both in the pilot system and in the conventional DWTP.
The RE of turbidity and color obtained in the filter of the pilot system after the settler and HTF using both lengths is shown in Figure 12. Likewise, the RE of turbidity and color obtained in the DWTP Bayas filter can be observed. There are no differences in the average values with respect to the DWTP values. The maximum value of turbidity RE at the filter outlet using the HTF with a length of 64.8 m had a value of 99.9%, for a flow rate of 0.25 L/s and RWT ≈ 100 NTU. For the system with an HTF of 97.6 m, the highest RE was 99.86% with a flow rate of 0.75 L/s and RWT ≥ 200 NTU. Finally, the maximum value of RE in the DWTP was 99.85% when the test was performed with raw water turbidity (RWT) ≈ 100 NTU. The minimum turbidity RE value using the HTF length of 97.6 m was 92.53% with a flow rate of 2 L/s and RWT ≈10 NTU. For the same flow rate and RWT mentioned above, the minimum RE was given in the length of the HTF of 64.8 m, with a value of 93.65%. Finally, the minimum RE of turbidity in the DWTP was 94.87% when the test was performed with RWT ≈10 NTU.
The color RE was similar in the pilot filter after having used the settler and HTF of 68.4 m and 97.6 m, with average values of 99.93 and 99.91%, respectively (see the right panel in Figure 12). For the DWTP, the average color RE had an average value of 100%, showing that there is no difference in color removal both in the pilot system and in the conventional DWTP.

3.8. Comparison of Means with Wilcoxon Test

It was found that there is no normal distribution in the turbidity removal efficiency data measured at the settler outlet, nor at the filtration outlet; for this reason, the Wilcoxon test was applied to determine if there is a significant difference between the removal efficiency when using the HTF with 68.4 m and the HTF with 97.6 m. The results obtained determined that the p-value was >0.05. This value allowed us to validate the null hypothesis, which establishes that there is no significant difference in the RE when using the two established lengths of the HTF. Table 8 shows the p-values calculated using the Wilcoxon test. The comparison of the RE of the pilot settler using the 68.4 m HTF vs. the RE of the DWTP Bayas settler, as well as the RE of the settler of the pilot system using the 97.6 m HTF vs. the RE of the settler of the DWTP Bayas, showed that the p-value was <0.05 (see Table 8). The foregoing finding allowed us to reject the null hypothesis, establishing that there is a significant difference in the RE of the settler with the use of an HTF compared to a conventional system with a horizontal hydraulic screen flocculator.
When comparing the RE of the pilot filter using the 68.4 m HTF vs. the RE of the DWTP Bayas filter, as well as the RE of the pilot system filter with a length of 97.6 m vs. the RE of the DWTP Bayas, the p-value was >0.05 (to see Table 8). These results confirm the null hypothesis that there is no significant difference in the RE of a system made up of HTF + settler + filter compared to a conventional system made up of HFD + settler + filter. These results indicate that it is advisable to use a tubular flocculator followed by a sedimentation and filtration process.

3.9. Turbidity Removal Estimation Model

A model was defined to estimate the removal efficiency in the pilot system using HTF + settler + filter, for which it was necessary to define the variables that influence the efficiency of the HTF. Six variables were analyzed: (a) Reynolds number, (b) retention time, (c) hydraulic gradient, (d) operating flow rate, (e) raw water turbidity, and (f) HTF length.
Through the correlation matrix (Table 9), it was possible to identify the variables that have a significant correlation in the model. It was identified that the turbidity of the raw water is the factor that has the most influence on the efficiency of the HTF. It can be seen that there is a relationship between MRT, Reynolds, and flow with the hydraulic gradient because the aforementioned variables are involved in its calculation.
After a statistical analysis of collinearity, it was found that there is no collinearity of efficiency with the variables of Length, Gradient, and Turbidity of the raw water. For this reason, an adjusted model was applied using the Stepwise multiple linear regression statistical model [38,41]. In the Stepwise regression, two significant factors that influence the efficiency of the HTF were identified: Raw water turbidity with a positive coefficient and velocity gradient with a negative coefficient (see Table 10). The inclusion of the explanatory variable “raw water turbidity” with positive coefficients in the Stepwise regression model confirmed the considerable impact on the HTF efficiency, due to the fact that the HTF efficiency increases with the increase in raw water turbidity. Furthermore, considering that the velocity gradient has a relatively high incidence of flocculation, its inclusion with a negative coefficient indicated the important role of water agitation in the efficiency of the flocculation process.
Tests carried out at different speed gradients show a tendency for the efficiency of THF to increase with the decrease in the speed gradient in flocculation. For a given raw water turbidity, the efficiency decreases slightly with the velocity gradient used in this study from 6 to 120 s−1. For a given gradient, the efficiency increases with the turbidity of the raw water used in this study from 10 to 246 NTU. The velocity gradient associated with raw water turbidity constitutes an optimum value for a given efficiency.
The results of the multiple linear regression are presented in Table 10, where R is the correlation coefficient R ∈ [−1, 1], R2 is the square of the correlation coefficient or determination coefficient (R2 ∈ [0, 1]), Adjusted R2 is the R2 adjusted by the number of variables of the model (Adjusted R2 ∈ [0, 1]), and Se is the standard error of the estimation. Durbin–Watson values should be greater than 1.5 and less than 2.5 to indicate that the multiple linear regression data are free of first-order linear autocorrelation. For efficiency, the Durbin–Watson values were 1.618 and 1.711 in the linear model and in the model applying logarithms, respectively. In both models, the Durbin–Watson values are within the accepted range.
The non-standardized coefficient B for the Turbidity variable was 0.146 (see Table 11). This value indicates that if the turbidity variable increased by one unit, efficiency increased by 0.146. Furthermore, if the turbidity variable is reduced by one unit, efficiency decreased by 0.146. This interpretation is valid if the effect of the other variable remains constant.
The non-standardized coefficient B for the Gradient variable was −0.159. This value indicates that if the Gradient variable is increased by one unit, efficiency is reduced by 0.159. Moreover, if the Gradient variable is reduced by one unit, efficiency increases by 0.159. This interpretation is valid if the effect of the other variable remains constant.
With the models obtained, it was determined that the variables influencing the efficiency were the hydraulic gradient and the turbidity of the raw water, due to the fact that they met the necessary statistical conditions [47]. Table 12 presents the first model according to the Stepwise methodology, which was not properly adjusted considering that it had an adjusted R2 of 0.47. The second model was a closer representation due to the fact that it had an adjusted R2 of 0.65, as a result of the application of logarithms in the model according to Al-Zubaidi et al. [48]. Vaneli and Teixeira [49] found turbidity removal estimation models for helical flocculators whose R2 was 0.5.

3.10. Control Test

Two control tests were finally carried out to evaluate the efficiency of the tubular flocculator. The first test was not for using the HTF; that is, the coagulated water was sent directly to the settler and later to the filter. The second test consisted of feeding raw water without coagulant to the HTF, for its subsequent circulation to the settler and filter.
These tests were performed in triplicate using the design flow rate (1 L/s) with an average raw water turbidity value of 43.4 NTU and an average color value of 451 UC_Pt-Co. The results are presented in Table 13, obtaining average turbidity and color removal values of 49.3% and 51.1%, respectively, in the first test. These RE values were lower compared to the RE when the full pilot system was used. It shows the importance of the inclusion of the HTF before the settler and filter.
Meanwhile, in the second test, RE of turbidity and color were obtained at the outlet of the HTF_68.4m + Settler + filter of 16.38% for turbidity and 12.91% for color, while in the HTF_97.6m + Settler + filter system, the RE was 20.12% and 16.73% for turbidity and color, respectively. These RE values are lower in contrast to the RE when a coagulant (aluminum sulphate) was used. It evidences the importance of the use of a coagulant for eliminating turbidity and color in raw water using an HTF.

3.11. Comparison of Costs

Applying Equation (18), the construction cost of a conventional baffle flocculator with concrete was calculated; the construction cost was calculated for each of the five experimentally tested. Table 14 shows the costs incurred in the case of building a conventional baffle flocculator. Considering that the design flow of the HTF was 1 L/s, it was deduced that the construction cost of a conventional baffled flocculator of 1 L/s would be 11547.14 USD, approximately.
Table 15 details the necessary materials for the construction of the HTF, as well as their respective prices. A total cost of 2074.75 USD was determined. PVC with elastomeric sealing (U/Z) materials increase costs, so costs could be further reduced if bondable PVC material is used. PVC with elastomeric sealing (U/Z) materials allow the system to be disassembled if necessary. The construction cost of the HTF is lower due to the avoidance of the necessary labor in civil works, as well as the replacement of the concrete in the conventional DWTP units with PVC pipe for the HTF.
It was possible to determine that there is no significant difference in the efficiency of turbidity and color removal between a system composed of an HTF + settler + filter and a system composed of an HFD + settler + filter. The average efficiency of the pilot system of 98.77% for turbidity and 99.92% for color was determined, while the average efficiency of the DWTP Bayas was 98.78% for turbidity and 100% for color. However, the efficiency at the outlet of the pilot settler did represent a significant difference when compared to the efficiency of the DWTP settler, with the average removal efficiency in the settler of the pilot system of 76.43% for turbidity and 72.46% for color, while the efficiency at the outlet of the DWTP settler was 91.80% for turbidity and 90.14% for color. It is important to mention that some design parameters differed between the conventional system and the pilot system [50].
Table 16 shows the specifications of the pilot system and the conventional DWTP. The retention time in the hydraulic baffle flocculator (HBF) was 21 min, while in the HTF it was 12.5 min. It can be seen that the retention time of HBF was superior to HTF in 8.5 min. Although the retention time in the pilot system was lower than the retention time of the DWTP, the efficiencies were similar. The retention time in the DWTP Bayas settler was 25 min, while it was 12 min for the design flow (1 L/s) in the pilot settler. There was also a longer retention time in the settler of the DWTP, almost double with respect to the retention time of the used pilot system settler. The retention time is directly dependent on the depth of the settler to lower depth, and the shorter detention period necessary to collect said particle; for this reason, the removal efficiency of the flocculent particles will depend on the depth of the tank. The sedimentation rate in the DWTP Bayas settler was 94 m3/m2d, while it was 120 m3/m2d in the pilot settler. Considering that the efficiency decreases as the sedimentation load increases, the aforementioned could have influenced the existence of a lower turbidity and color removal efficiency in the pilot settler. The filtration rate was the same in both the DWTP Bayas filters and the pilot filters.
As can be seen in Table 16, the conventional DWTP has some parameters that offer better efficiency compared to the pilot system under study. Despite this, the pilot system composed of HTF + settler + filter had efficiencies similar to the obtained efficiencies of the HBF + settler + filter system.
In the operation of the HTF with raw water turbidity less than 20 NTU and working with the design flow rate (1 L/s), residual turbidity in the filter less than 0.75 NTU was obtained, which is below the Ecuadorian norm of 5 NTU, obtaining a removal efficiency of over 96%, which is very acceptable. With flow rates less than the design flow rate, that is, 0.25, 0.5, and 0.75 L/s, and with raw water turbidity conditions less than 20 NTU, residual turbidity in the filter less than 0.5 NTU was obtained, below what is indicated as standard, obtaining a removal efficiency over 98%, which is also very acceptable. With a flow greater than the design flow, that is, 2 L/s, and with raw water turbidity conditions less than 20 NTU, residual turbidity in the filter less than 1 NTU was obtained reaching a removal efficiency of 95%, which is below the norm but slightly lower quality than the design flow conditions, which is equally acceptable.
In the case of tests with turbidity greater than 100 NTU, working with the different flow rates, there was a resulting turbidity up to 0.53 NTU, which represents a removal efficiency greater than 99%. Up to 75 NTU, the relationship between the increase in the dose of coagulant and the increase in turbidity was linear. The increase was exponential after 75 NTU, indicating that as turbidity increased, small increments of the coagulant dose had to be added.
Once the particles are destabilized in the coagulation, the collision between them occurs efficiently in the HTF, allowing the growth of microflocs, until they form larger flocs [35]. This good formation of flocs in the HTF occurs after subjecting the microflocs to slow agitation with average gradients of 42 s−1 for the design flow rate, allowing the union of these in larger aggregates or flocs, with sufficient cohesion and density to submit them to the next stage of sedimentation. The aforementioned gradients prevented the breakage and disintegration of the already-formed flocs. For a flow rate of 2 L/s, the gradient was 123 s−1; however, the efficiency was acceptable, with the only limitation being that the filtration run decreased to 8 h.
For the different flows used, the theoretical retention time was practically equal to real time, which indicates that the unit has been designed well. This type of flocculator does not require electrical energy for its operation, which is why the production cost is very low. It was shown that piston flow predominates in this type of unit, which is why a good adjustment of the retention time is achieved.
It is known that by varying the plant’s operating flow rate, the retention times and velocity gradients in the reactors are modified. The HTF is somewhat flexible to these variations. Thus, when the flow rate decreased, the velocity gradient was reduced, therefore, the retention time increased; furthermore, when the flow rate increased, the effect was reversed. Depending on how much the operating flow is increased, velocity gradients so high that they can break the floc can be generated. In this study, the design flow rate was doubled, obtaining a maximum gradient of 126 s−1, which is somewhat higher than the maximum (100 s−1) recommended by the literature.
Table 17 presents a comparison between the present study and other studies carried out in terms of the efficiency obtained and some characteristics of the HTFs used. It can be seen that in the present study, much greater lengths and diameters of pipe were tested than those used in the studies by Tse et al. [14] and Oliveira and Teixeira [51], which is why this pilot system was able to treat many higher flows (3.6 m3/h) than those used in the aforementioned studies. In the studies by Kurbiel et al. [17], two diameters of 71.4 and 86.4 mm were used, which are slightly smaller than the one used in the present study, and for this reason, Kurbiel et al. [17] used flow rates of 3.5 and 4 m3/h. The gradients in the studies in Table 17 were between 10 and 100 s−1, which is recommended for tubular flocculators, with the exception of the study carried out by Oliveira and Teixeira (2018). The retention times used in the studies realized by Kurbiel et al. [17] and Oliveira and Teixeira (2018) were relatively low compared to the time used in the present study.
All the studies in Table 17 have shorter retention times in this type of tubular flocculators than those used in baffle flocculators. The times in the tubular flocculators varied from 56.2 to 738 s; meanwhile, in the screen flocculators, the times vary between 600 and 1800 s (Romero, 1999). The tubular flocculators used by Kurbiel et al. (1989) had more similar characteristics to this study, where the values of the pipe diameter, velocity gradient, and flow rate were similar, with the length of the pipe being the aspect that did present a difference between said study and this study. This difference in length made the retention time in this study much longer than the time used by Kurbiel et al. (1989); however, it was possible to show that there was a higher removal efficiency in this study.
Compared to a mechanical flocculator where the speed remains constant and the residence time increases or decreases according to the flow rate variation, the HTF is somewhat flexible to these variations in operation. If the velocity gradient range is properly selected, this property can be exploited in the design of plants that integrate an HTF, in which small daily flow variations can be expected.
Among the advantages of this type of flocculators, it can be mentioned that the cleaning of these units is easy, performing a backwash. It is a very simple unit to build and operate [52]. It is very efficient when it is complemented with a high-rate settler and a rapid filter. When it is well designed, the theoretical and real retention times are practically the same, eliminating the possibility of dead spaces and short circuits. The operation of the HTF is completely hydraulic, so the operation is very reliable and economical as it does not require electricity. It is a very suitable solution for medium to large plants. Due to its great depth, it requires small areas, and very compact designs are achieved.
Among the restrictions of this type of flocculators, it can be mentioned that it is only a recommended solution for small plants. Therefore, the use of HTF followed by a sedimentation-filtration and disinfection treatment is recommended, especially for small populations, due to its easy implementation and low cost, making it an option for rural communities with low resources. The results of the study allowed a contribution to the fulfilment of the sixth objective of the 2030 Agenda for Sustainable Development, which mentions “To guarantee the availability and sustainable management of water and sanitation for all”. The accomplishment of this objective is a great challenge considering that there are limitations in the treatment and distribution of drinking water, particularly in developing communities. An efficient, proven, easy-to-implement, and low-cost water purification system has been presented.
The growing need for adequate water treatment systems for rural and small populations led to the design and implementation of a tubular hydraulic flocculator, which allowed field research to be carried out. This tubular hydraulic flocculator presented high turbidity removal efficiency and low detection time compared to other flocculators commonly used in drinking water plants. This study evaluated a compact purification system made up of an HTF, high-rate settling, and rapid sand filters, with the aim of proposing a prediction model for turbidity removal efficiency. This pilot system has the capacity to treat 86,400 L/day (considering the design flow rate of 1 L/s), which makes it possible to provide drinking water to a rural community with a population of approximately 720 people, considering an allocation of 120 L/person/day.
In this study, other inlet configuration options were not evaluated, such as the introduction of raw water through the top of the flocculator or the effect that the variation of the diameter along the pipe could have on the efficiency of turbidity removal. Length 1 with a 3-inch pipe and length 2 with a 4-inch pipe could be tested at the beginning of flocculation in such a way that there would be a higher velocity gradient at the beginning and a lower gradient at the end as occurs in baffle flocculators, which could improve floc formation [49,53]. During the flocculation process, the size of the floc increases gradually. Considering that large flocs break easily, the value of G should be gradually reduced from the beginning of flocculation to the end of flocculation.
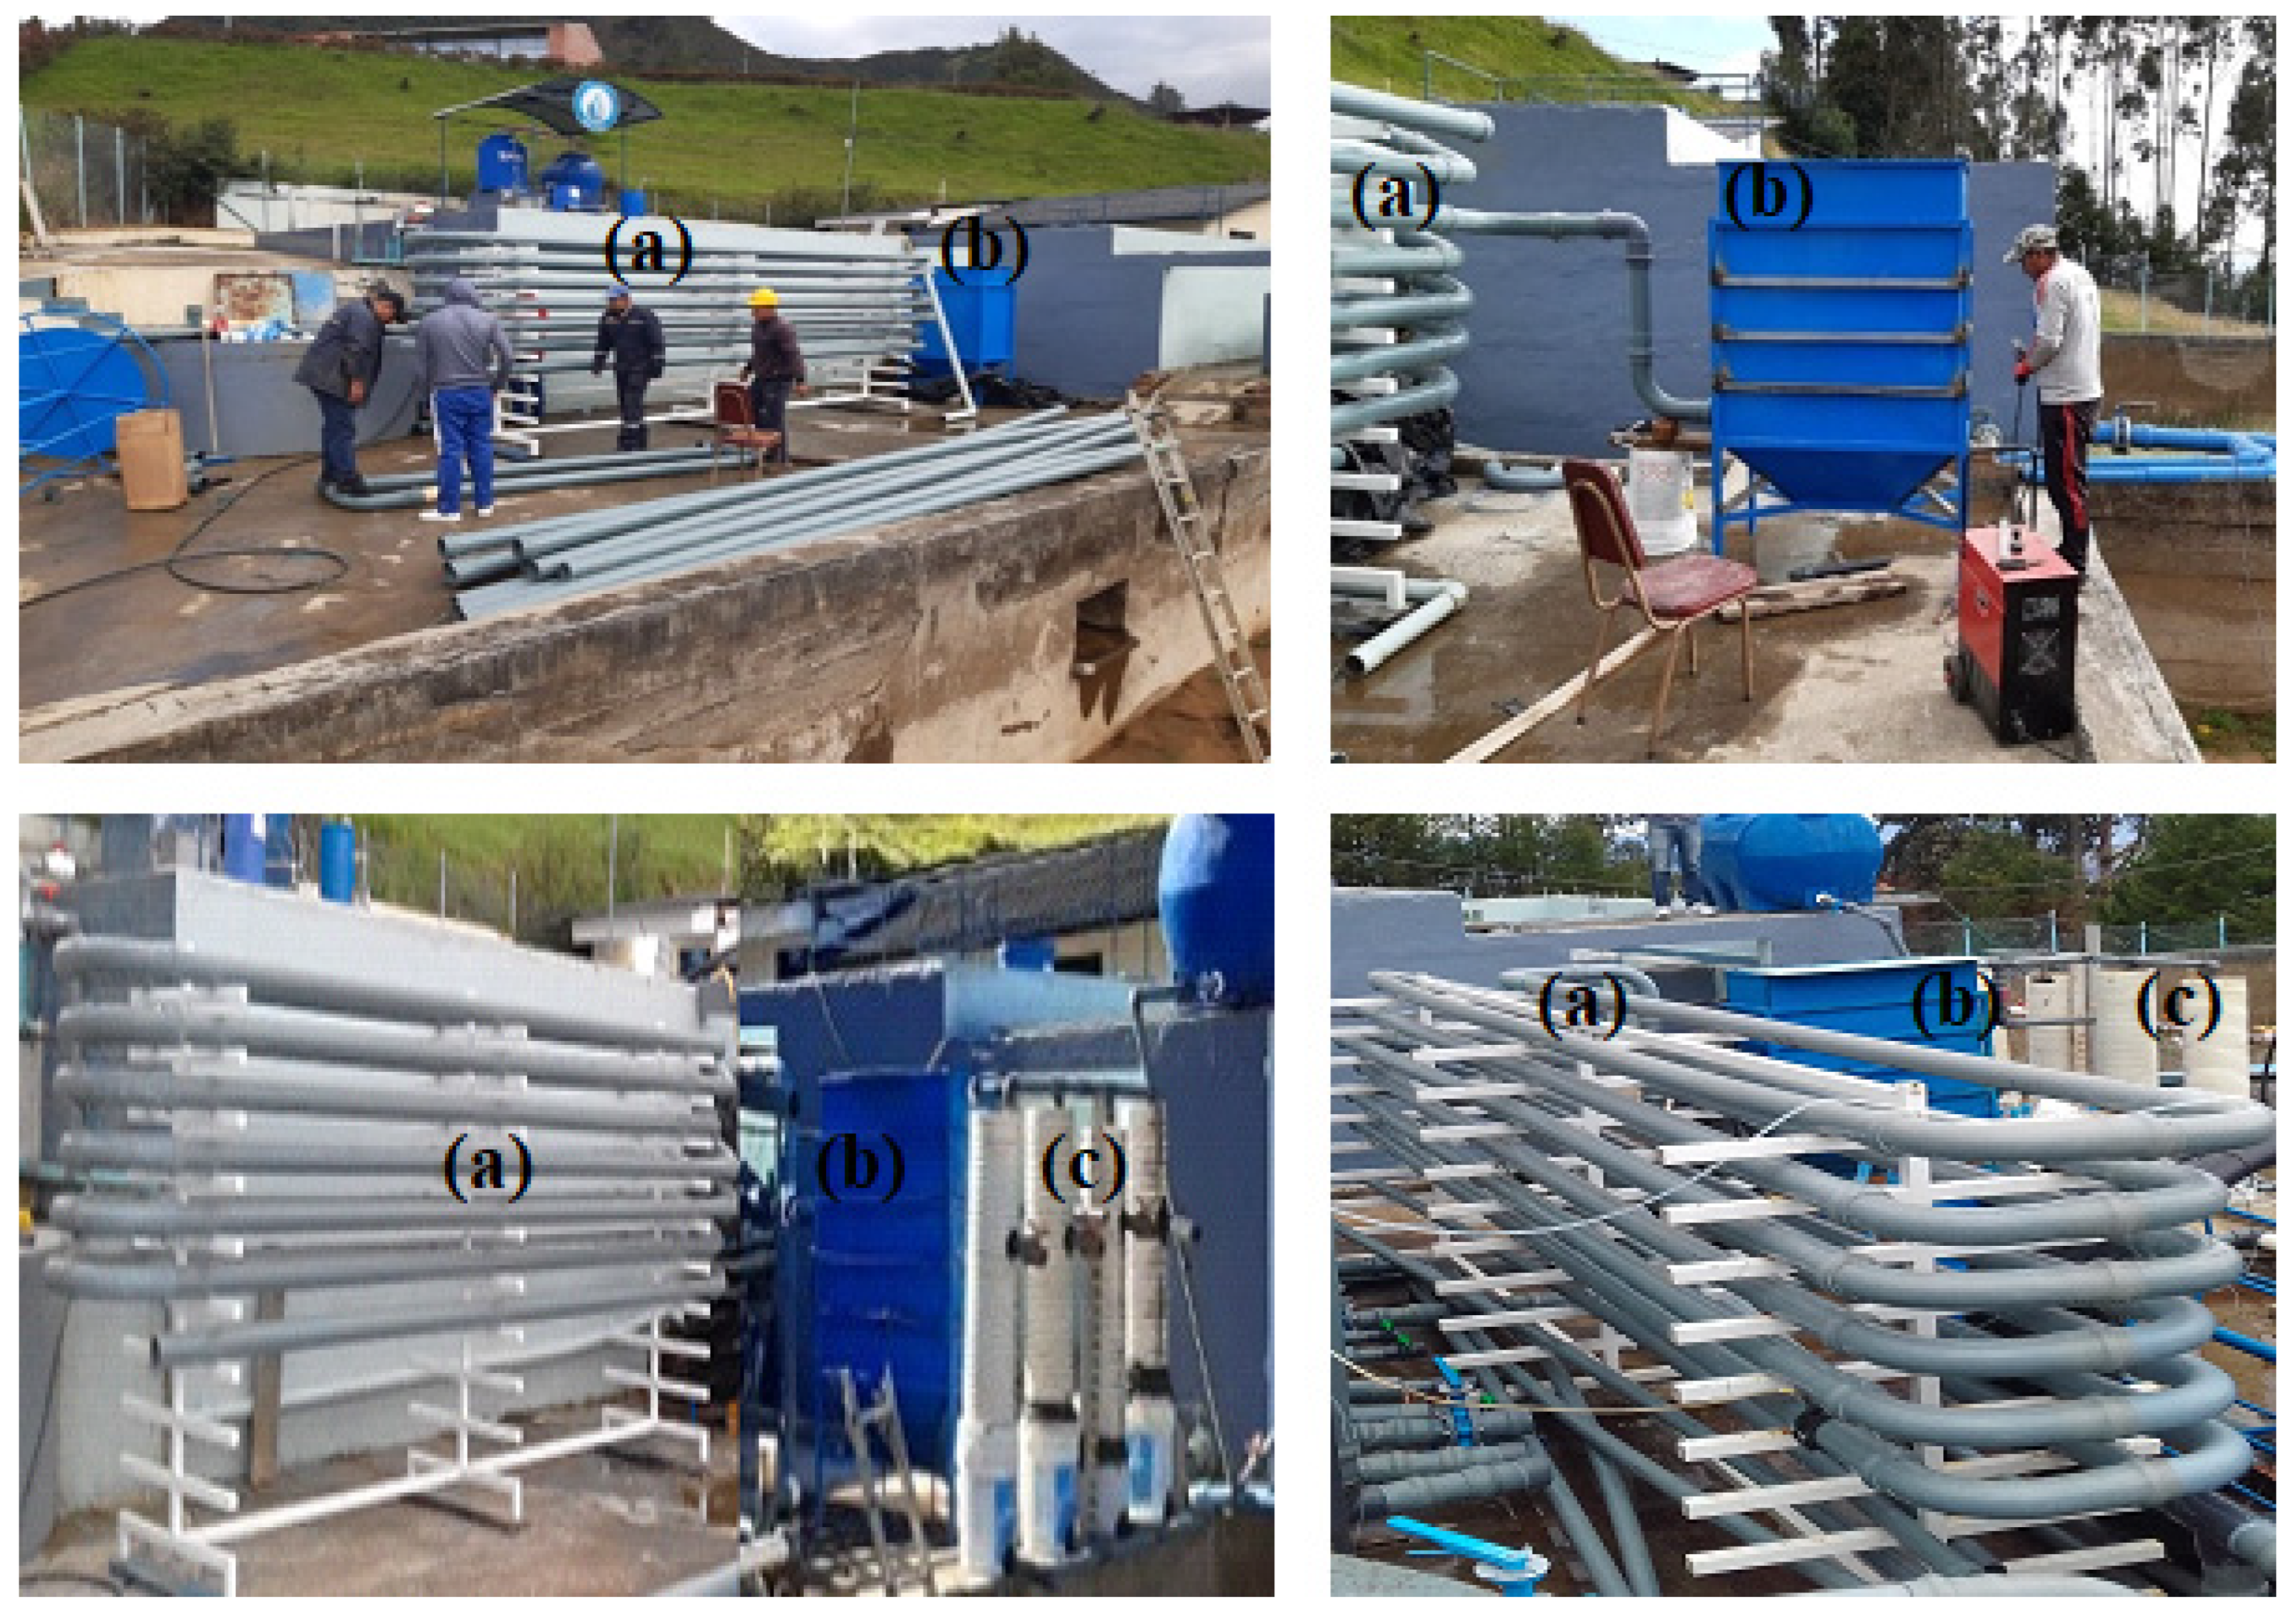
3.12. Pilot Treatment System

Figure 13 shows images of the implementation of the pilot treatment system.

4. Conclusions

In this study on the evaluation of tubular hydraulic flocculators for purifying small flows, it was determined that the calculations used for the design of a horizontal baffle flocculator are useful for identifying the length and diameter parameters when building the pilot HTF. Experimental trials have been carried out in the field through the implementation of a pilot system for calculating the efficiency of a tubular flocculator, which allowed us to consider the variation in the turbidity conditions of the natural raw water used in a purification plant in a rural community. A large-scale experimental investigation of a hydraulic tubular flocculator was carried out to evaluate the hydraulic conditions corresponding to the different conditions tested.
The removal efficiency values do not differ significantly with the use of an HTF of 68.4 and 97.6 m in length; therefore, using a shorter length is possible, which confirms that this type of flocculator has a low retention time. In addition, the system is flexible to fluctuations in the operating flow due to the fact that it has adapted to decreases of up to 75% and increases of up to 100% with respect to the design flow.
The design of the HTF was satisfactory, working under normal operating conditions (design flow rate = 1 L/s) and even with high turbidity. The purpose of the study was obtained due to the fact that the quality of the water in the effluent of the filtration process was below the maximum permissible limits that are set in international standards and the recommendations of the World Health Organization.
It should be noted that better removal efficiency results were obtained (99.65%) in the tests with the minimum flow rate of 0.25 L/s compared with the results of the maximum flow rate of 2 L/s (98.93%). However, it is recommended that efforts must be made to work with flows close to the design flow during the operation stage of these systems, to avoid damage to the quality of the water in the effluent. It should also be noted that there was no significant difference in turbidity and color removal between the pilot system that included the HTF and the conventional plant that included an HBF. In addition, this type of technology would be convenient for developing countries due to the fact that it eliminates the costs of electricity and equipment maintenance, its operation is simpler, and it does not require specialized labor during its implementation.
Using multiple linear regression analysis, it was possible to obtain two turbidity removal efficiency prediction models: One using the Stepwise methodology and the other using logarithms with coefficients of determination of 0.49 and 0.66, respectively. Finally, the results of this work showed that for obtaining greater efficiency in drinking water using a flow rate of 1 L/s, the HTF pipe should have a diameter of 110 mm, a length of 68 m, a speed of 0.13 m/s, a retention time of 12.5 min, and a velocity gradient of 42 s−1. A specific methodology for the design of tubular hydraulic flocculators has to be investigated, considering that the present study used the design methodology of hydraulic screen flocculators to establish the size of the pilot HTF.

Author Contributions

Conceptualization, F.G.-Á. and E.A.A.-P.; methodology, F.G.-Á.; software, A.M.-H.; validation, A.T.-A., F.C.-I., and A.M.-H.; formal analysis, F.G.-Á. and M.D.T.-O.; investigation, A.T.-A.; data curation, F.G.-Á.; writing—original draft preparation, F.G.-Á.; writing—review and editing, E.A.A.-P. and G.H.-C.; funding acquisition, E.S.-C. All authors have read and agreed to the published version of the manuscript.

Funding

This research received no external funding.

Data Availability Statement

All data generated or analyzed during this study are within the submitted manuscript.

Acknowledgments

The authors thank the Vicerrectorado de Investigación de la Universidad de Cuenca for the support provided to the project “Transferencia de nuevas tecnologías sostenibles de bajo costo para tratamiento de agua potable en comunidades en desarrollo” (Transfer of new low-cost sustainable technologies for drinking water treatment in developing communities).

Conflicts of Interest

The authors declare no conflict of interest.

References

  1. Villeneuve, C.; Tremblay, D.; Riffon, O.; Lanmafankpotin, G.Y.; Bouchard, S. A Systemic Tool and Process for Sustainability Assessment. Sustainability 2017, 9, 1909. [Google Scholar] [CrossRef] [Green Version]
  2. Mraz, A.L.; Tumwebaze, I.K.; McLoughlin, S.R.; McCarthy, M.E.; Verbyla, M.E.; Hofstra, N.; Rose, J.B.; Murphy, H.M. Why pathogens matter for meeting the united nations’ sustainable development goal 6 on safely managed water and sanitation. Water Res. 2020, 189, 116591. [Google Scholar] [CrossRef] [PubMed]
  3. Castro-Jiménez, C.C.; Grueso-Domínguez, M.C.; Correa-Ochoa, M.A.; Saldarriaga-Molina, J.C.; García, E.F. A Coagulation Process Combined with a Multi-Stage Filtration System for Drinking Water Treatment: An Alternative for Small Communities. Water 2022, 14, 3256. [Google Scholar] [CrossRef]
  4. Machado, A.V.M.; dos Santos, J.A.N.; Alves, L.M.C.; Quindeler, N.D.S. Contributions of Organizational Levels in Community Management Models of Water Supply in Rural Communities: Cases from Brazil and Ecuador. Water 2019, 11, 537. [Google Scholar] [CrossRef] [Green Version]
  5. García-Ávila, F.; Avilés-Añazco, A.; Sánchez-Cordero, E.; Valdiviezo-Gonzáles, L.; Ordoñez, M.D.T. The challenge of improving the efficiency of drinking water treatment systems in rural areas facing changes in the raw water quality. South Afr. J. Chem. Eng. 2021, 37, 141–149. [Google Scholar] [CrossRef]
  6. Ahmed, T.; Zounemat-Kermani, M.; Scholz, M. Climate Change, Water Quality and Water-Related Challenges: A Review with Focus on Pakistan. Int. J. Environ. Res. Public Health 2020, 17, 8518. [Google Scholar] [CrossRef]
  7. Park, C.M.; Chu, K.H.; Her, N.; Jang, M.; Baalousha, M.; Heo, J.; Yoon, Y. Occurrence and Removal of Engineered Nanoparticles in Drinking Water Treatment and Wastewater Treatment Processes. Sep. Purif. Rev. 2016, 46, 255–272. [Google Scholar] [CrossRef]
  8. Mustereț, C.P.; Morosanu, I.; Ciobanu, R.; Plavan, O.; Gherghel, A.; Al-Refai, M.; Roman, I.; Teodosiu, C. Assessment of Coagulation–Flocculation Process Efficiency for the Natural Organic Matter Removal in Drinking Water Treatment. Water 2021, 13, 3073. [Google Scholar] [CrossRef]
  9. Na Nagara, V.; Sarkar, D.; Elzinga, E.J.; Datta, R. Removal of heavy metals from stormwater runoff using granulated drinking water treatment residuals. Environ. Technol. Innov. 2022, 28, 102636. [Google Scholar] [CrossRef]
  10. Arman, N.Z.; Salmiati, S.; Aris, A.; Salim, M.R.; Nazifa, T.H.; Muhamad, M.S.; Marpongahtun, M. A Review on Emerging Pollutants in the Water Environment: Existences, Health Effects and Treatment Processes. Water 2021, 13, 3258. [Google Scholar] [CrossRef]
  11. Gonzales, L.G.V.; Ávila, F.F.G.; Torres, R.J.C.; Olivera, C.A.C.; Paredes, E.A.A. Scientometric study of drinking water treatments technologies: Present and future challenges. Cogent Eng. 2021, 8, 38. [Google Scholar] [CrossRef]
  12. Haarhoff, J. Design of around-the-end hydraulic flocculators. J. Water Supply: Res. Technol. 1998, 47, 142–152. [Google Scholar] [CrossRef]
  13. Ghawi, A.H. Optimal design parameters for hydraulic vertical flocculation in the package surface water treatment plant. Przegląd Nauk. Inżynieria i Kształtowanie Środowiska 2018, 27, 438–451. [Google Scholar] [CrossRef]
  14. Tse, I.C.; Swetland, K.; Weber-Shirk, M.L.; Lion, L.W. Fluid shear influences on the performance of hydraulic flocculation systems. Water Res. 2011, 45, 5412–5418. [Google Scholar] [CrossRef]
  15. Sun, Y.; Zhou, S.; Chiang, P.-C.; Shah, K.J. Evaluation and optimization of enhanced coagulation process: Water and energy nexus. Water-Energy Nexus 2019, 2, 25–36. [Google Scholar] [CrossRef]
  16. Boily, K.; Butler, C. Coagulation-Flocculation System for the Treatment of Cheese Production Wastewater; McGill University: Montreal, QC, Canada, 2014. [Google Scholar]
  17. Kurbiel, J.; Spulak, A.; Schade, H. Application of pipe flocculator and cross-flow tilted plate settler for effective separation of precipitate from electroplating wastewater. Water Sci. Technol. 1989, 21, 539–546. [Google Scholar] [CrossRef]
  18. Pennock, W. Development of the Turbulent Tube Flocculator; Cornell University: Ithaca, NY, USA, 2016. [Google Scholar]
  19. Oliveira, D.S.; Teixeira, E.C. Experimental evaluation of helically coiled tube flocculators for turbidity removal in drinking water treatment units. Water SA 2017, 43, 378. [Google Scholar] [CrossRef] [Green Version]
  20. Carissimi, E.; Rubio, J. The flocs generator reactor-FGR: A new basis for flocculation and solid–liquid separation. Int. J. Miner. Process. 2005, 75, 237–247. [Google Scholar] [CrossRef]
  21. García-Ávila, F.; Valdiviezo-Gonzales, L.; Iglesias-Abad, S.; Gutiérrez-Ortega, H.; Cadme-Galabay, M.; Donoso-Moscoso, S.; Arévalo, C.Z. Opportunities for improvement in a potabilization plant based on cleaner production: Experimental and theoretical investigations. Results Eng. 2021, 11, 100274. [Google Scholar] [CrossRef]
  22. Sánchez, L.D.; Marin, L.M.; Visscher, J.T.; Rietveld, L.C. Low-cost multi-stage filtration enhanced by coagulation-flocculation in upflow gravel filtration. Drink. Water Eng. Sci. 2012, 5, 73–85. [Google Scholar] [CrossRef] [Green Version]
  23. Romero, J. Water Purification, 3rd ed.; Mexico, D.F., Ed.; Alfaomega: Kryoneri, Attica, 1999. [Google Scholar]
  24. Oliveira, D.S.; Teixeira, E.C. Hydrodynamic characterization and flocculation process in helically coiled tube flocculators: An evaluation through streamlines. Int. J. Environ. Sci. Technol. 2017, 14, 2561–2574. [Google Scholar] [CrossRef]
  25. Arboleda, J. Teoría y Práctica de la Purificación del Agua [Theory and Practice of the Water Purification]. Bogotá, Colombia, s.e. 2000. pp. 1–390. Available online: https://docer.com.ar/doc/v8xcse. (accessed on 3 November 2022).
  26. Mastrocicco, M.; Prommer, H.; Pasti, L.; Palpacelli, S.; Colombani, N. Evaluation of saline tracer performance during electrical conductivity groundwater monitoring. J. Contam. Hydrol. 2011, 123, 157–166. [Google Scholar] [CrossRef] [PubMed]
  27. Maran, S. A stochastic approach to the evaluation of residence times. Water Resour. Res. 2002, 38, 1–8. [Google Scholar] [CrossRef] [Green Version]
  28. Pérez, J.M. Analysis of Flows and Factors that Determine Retention Periods. 2005. Available online: https://xdoc.mx/preview/analisis-de-flujos-y-factores-que-determinan-los-periodos-5ddae47319f3d. (accessed on 1 November 2022).
  29. Moruzzi, R.B.; de Oliveira, S.C. Mathematical modeling and analysis of the flocculation process in chambers in series. Bioprocess Biosyst. Eng. 2012, 36, 357–363. [Google Scholar] [CrossRef]
  30. Wolf, D.; Resnick, W. Residence Time Distribution in Real Systems. Ind. Eng. Chem. Fundam. 1963, 2, 287–293. [Google Scholar] [CrossRef]
  31. Alcocer, D.J.R.; Vallejos, G.G.; Champagne, P. Assessment of the plug flow and dead volume ratios in a sub-surface horizontal-flow packed-bed reactor as a representative model of a sub-surface horizontal constructed wetland. Ecol. Eng. 2012, 40, 18–26. [Google Scholar] [CrossRef]
  32. Meng, F.; Van Wie, B.J.; Thiessen, D.B.; Richards, R.F. Design and fabrication of very-low-cost engineering experiments via 3-D printing and vacuum forming. Int. J. Mech. Eng. Educ. 2018, 47, 246–274. [Google Scholar] [CrossRef] [Green Version]
  33. Anaya-Durand, A.I.; Cauich-Segovia, G.I.; Funabazama-Bárcenas, O.; Gracia-Medrano-Bravo, V.A. Evaluación de ecuaciones de factor de fricción explícito para tuberías. Educ. Química 2014, 25, 128–134. [Google Scholar] [CrossRef] [Green Version]
  34. Mott, R.L. Fluid Mechanics, 6th ed.; Pearson Education: Mexico City, Mexico, 2006. [Google Scholar]
  35. Flores, J.H.N.; Neto, O.R.; Faria, L.C.; Timm, L.C. ESTIMATION OF THE KINETIC HEAD COEFFICIENT (k) BASED ON THE GEOMETRIC CHARACTERISTICS OF EMITTER PIPES. Eng. Agríc. 2017, 37, 1091–1102. [Google Scholar] [CrossRef] [Green Version]
  36. Benalia, A.; Derbal, K.; Khalfaoui, A.; Bouchareb, R.; Panico, A.; Gisonni, C.; Crispino, G.; Pirozzi, F.; Pizzi, A. Use of Aloe vera as an Organic Coagulant for Improving Drinking Water Quality. Water 2021, 13, 2024. [Google Scholar] [CrossRef]
  37. Ahumada, L.K.; Sanchez, I.D. Application of the Wilcoxon Test to correlate the results of the Saber 11 and Saber T&T Test. IOP Conf. Series: Mater. Sci. Eng. 2019, 519, 012034. [Google Scholar] [CrossRef]
  38. Turner, D.P.; Deng, H.; Houle, T.T. Statistical Hypothesis Testing: Overview and Application. Headache 2020, 60, 302–308. [Google Scholar] [CrossRef] [PubMed]
  39. Jia, R.; Fang, S.; Tu, W.; Sun, Z. Driven Factors Analysis of China’s Irrigation Water Use Efficiency by Stepwise Regression and Principal Component Analysis. Discret. Dyn. Nat. Soc. 2016, 2016, 8957530. [Google Scholar] [CrossRef] [Green Version]
  40. Sethi, V.; Clark, R. Cost estimation models for drinking water treatment unit processes. Indian J. Eng. Mater. Sci. 1998, 5, 223–235. [Google Scholar]
  41. Deb, A.K.; Richards, W.G. Evaluating the economics of alternative technology for small water systems. J. AWWA 1983, 75, 177–183. [Google Scholar] [CrossRef]
  42. Garland, C.; Weber-Shirk, M.; Lion, L.W. Revisiting Hydraulic Flocculator Design for Use in Water Treatment Systems with Fluidized Floc Beds. Environ. Eng. Sci. 2017, 34, 122–129. [Google Scholar] [CrossRef]
  43. Ispilco, P. Efficiency of the Raw Water Treatment Plant for the City of San Marcos, 2017. (Cajamarca, Peru). 2018. Available online: https://repositorio.unc.edu.pe/handle/20.500.14074/2585. (accessed on 3 November 2022).
  44. Aguirre, D. Evaluation of the Flocculator in the “La Esperanza” Drinking Water Treatment Plant that Supplies the Cantons of Machala, Pasaje, and Guabo, El Oro province. Bachelor’s Thesis, Universidad Técnica de Machala, Machala, Ecuador, 2015. Available online: http://repositorio.utmachala.edu.ec/bitstream/48000/2928/1/EVALUACI%c3%93N%20PTAP%20LA%20ESPERANZA..pdf. (accessed on 13 November 2022).
  45. Rojas, A.; García, A. Analysis of the residence time distribution curve in a leaching system. Tecnol. Química 2010, 30, 61–68. [Google Scholar]
  46. Mohammed, T.J.; Shakir, E. Effect of settling time, velocity gradient, and camp number on turbidity removal for oilfield produced water. Egypt. J. Pet. 2018, 27, 31–36. [Google Scholar] [CrossRef]
  47. Smith, G. Step away from stepwise. J. Big Data 2018, 5, 32. [Google Scholar] [CrossRef]
  48. Al-Zubaidi, H.A.M.; Naje, A.S.; Al-Ridah, Z.A.; Chabuck, A.; Ali, I.M. A Statistical Technique for Modelling Dissolved Oxygen in Salt Lakes. Cogent Eng. 2021, 8, 1875533. [Google Scholar] [CrossRef]
  49. Vaneli, B.P.; Teixeira, E.C. Aperfeiçoamento de modelo de estimativa da eficiência de remoção de turbidez da água em floculadores tubulares helicoidais. Eng. Sanit. e Ambient. 2019, 24, 773–783. [Google Scholar] [CrossRef] [Green Version]
  50. Mcconnachie, G.; Liu, J. Design of baffled hydraulic channels for turbulence-induced flocculation. Water Res. 2000, 34, 1886–1896. [Google Scholar] [CrossRef]
  51. Oliveira, D.S.; Teixeira, E.C. Swirl number in helically coiled tube flocculators: Theoretical, experimental, and CFD modeling analysis. Int. J. Environ. Sci. Technol. 2018, 16, 3735–3744. [Google Scholar] [CrossRef]
  52. García-Ávila, F.; Tenesaca-Pintado, D.; Novoa-Zamora, F.; Alfaro-Paredes, E.A.; Avilés-Añazco, A.; Guanuchi-Quito, A.; Tonon-Ordoñez, M.D.; Zhindón-Arévalo, C. Vertical tubular flocculator: Alternative technology for the improvement of drinking water treatment processes in rural areas. J. Environ. Manag. 2023, 331, 117342. [Google Scholar] [CrossRef]
  53. Haarhoff, J.; Van Der Walt, J.J. Towards optimal design parameters for around-the-end hydraulic flocculators. J. Water Supply Res. Technol. 2001, 50, 149–160. [Google Scholar] [CrossRef]
Figure 1. Pilot System that Includes HTF for the Potable Water Treatment.
Water 15 00833 g001
Figure 2. Curve of 1 − F(t) plotted to calculate α and Ɵ.
Water 15 00833 g002
Figure 3. Location of sampling points: (a) S1 Raw water, (b) S2 settled water, and (c) S3 filtered water.
Water 15 00833 g003
Figure 4. Tracer distribution curves in the HTF effluent.
Water 15 00833 g004
Figure 5. Coagulant dosage curve.
Water 15 00833 g005
Figure 6. Dose of coagulant applied for (a) length of 68.4 m and (b) length of 97.6 m.
Water 15 00833 g006
Figure 7. Efficiency of turbidity removal in the settler: (a) With HTF of 68.4 m; (b) with HTF of 97.6 m, and (c) in the filter of the DWTP “Bayas”. The bluish-green boxes correspond to a flow of 0.25 L/s, the brown boxes correspond to a flow of 0.5 L/s, the turquoise boxes correspond to a flow of 0.75 L/s, the beige boxes correspond to a flow rate of 1.0 L/s, purple boxes correspond to a flow rate of 2.0 L/s.
Water 15 00833 g007
Figure 8. Color removal efficiency in the settler: (a) With HTF of 68.4 m, (b) with HTF of 97.6 m, and (c) in the filter of the DWTP “Bayas”. The bluish-green boxes correspond to a flow of 0.25 L/s, the brown boxes correspond to a flow of 0.5 L/s, the turquoise boxes correspond to a flow of 0.75 L/s, the beige boxes correspond to a flow rate of 1.0 L/s, purple boxes correspond to a flow rate of 2.0 L/s.
Water 15 00833 g008
Figure 9. Turbidity removal efficiency in the filter: (a) With HTF of 68.4 m, (b) with HTF of 97.6 m, and (c) in the filter of the DWTP “Bayas”. The bluish-green boxes correspond to a flow of 0.25 L/s, the brown boxes correspond to a flow of 0.5 L/s, the turquoise boxes correspond to a flow of 0.75 L/s, the beige boxes correspond to a flow rate of 1.0 L/s, purple boxes correspond to a flow rate of 2.0 L/s.
Water 15 00833 g009
Figure 10. Color removal efficiency in the filter: (a) With HTF of 68.4 m, (b) with HTF of 97.6 m, and (c) in the filter of the DWTP “Bayas”.
Water 15 00833 g010
Figure 11. Average, maximum, and minimum values of RE in the pilot settler with HTF of 68.4 m, with HTF of 97.6 m, and in the settler of the DWTP Bayas: (a) Turbidity and (b) color. The pink boxes correspond to the PTS with a 68.4m long tubular flocculator, the turquoise boxes correspond to the PTS with a 97.6m long tubular flocculator and the Light Steel Blue boxes correspond to the “Bayas” DWTP.
Water 15 00833 g011
Figure 12. Average, maximum, and minimum values of the RE in the pilot filter with HTF of 68.4 m, with HTF of 97.6 m, and in the DWTP Bayas filter: (a) Turbidity and (b) color. The pink boxes correspond to the PTS with a 68.4m long tubular flocculator, the turquoise boxes correspond to the PTS with a 97.6m long tubular flocculator and the Light Steel Blue boxes correspond to the “Bayas” DWTP.
Water 15 00833 g012
Figure 13. Implementation of the Pilot Treatment System. The upper left figure shows the HTF implementation; in the upper right, the implementation of the settler is presented. The complete experimental system is presented in the lower left and right figures, as follows: (a) HTF, (b) high-rate settler, and (c) rapid sand filters.
Water 15 00833 g013
Table 1. Theoretical and mean retention time of HTF.
HTF Length (m) Flow Rate (L/s) Theoretical Retention Time (min)Mean Retention Time (min)
68.40.2536.9732.20
0.5018.4819.10
0.7512.3214.33
1.09.247.25
2.04.624.42
97.60.2552.6752.05
0.5026.3322.43
0.7517.5616.11
1.013.1712.30
2.06.585.22
Table 2. Application Results of the Wolf–Resnick Model in the Tubular Flocculator.
Length (m)Flow Rate (L/s)EquationR2%p%Mm
HTF 68.40.25log [1 − F(t)] = 8.75064 − 8.42073 (t/to)98.3389.7410.26−0.15
0.5log [1 − F(t)] = 10.1537 − 6.50166 (t/to)99.0091.038.97−0.71
0.75log [1 − F(t)] = 11.7424 − 7.43647 (t/to)96.0892.157.85−0.71
1.0log [1 − F(t)] = 12.9807 − 12.9278 (t/to)97.4592.857.15−0.08
2.0log [1 − F(t)] = 7.7437 − 4.73155 (t/to)98.8688.5611.44−0.84
HTF 97.60.25log [1 − F(t)] = 9.54051 − 6.08172 (t/to)97.5990.519.49−0.73
0.5log [1 − F(t)] = 10.366 − 8.02142 (t/to)98.5291.208.80−0.41
0.75log [1 − F(t)] = 10.8456 − 8.32531 (t/to)95.6691.568.44−0.42
1.0log [1 − F(t)] = 9.05445 − 6.2873 (t/to)92.8590.059.95−0.59
2.0log [1 − F(t)] = 16.1483 − 13.0555 (t/to)92.7794.115.89−0.03
Note: p = piston flow, M = mixed flow, m = dead zones.
Table 3. Theoretical velocity gradient and real velocity gradient of the HTF.
Length (m)Flow Rate (l/s)Theoretical Hydraulic Gradient (s−1)Real Hydraulic Gradient (s−1)
HTF 68.40.256.156.59
0.516.2216.54
0.7529.2727.14
141.1346.44
2109.62112.09
HTF 97.60.256.216.24
0.516.9718.39
0.7529.5030.80
141.3542.78
2110.13123.67
Table 4. Recommended retention time ranges for conventional hydraulic flocculators.
AuthorVelocity Gradient (s−1)Retention Time (min)
Smethurst20–10010–60
Arboleda 10–10015–20
Insfopal (horizontal flow)-15–60
Hardenbergh and Rodie-20–50
Fair and Geyer-10–90
AWWA5–10010–60
Note: Source: Romero (1999).
Table 5. Statistical Parameters of the Turbidity and Color Removal Efficiency after HTF + Settler in the Studied Systems.
SystemTurbidity (%)Color (%)
MeanMeSDMinMaxMeanMeSDMinMax
HTF 68.4 m75.4580.7320.8922.7995.0071.5377.6220.4517.4290.77
HTF 97.6 m77.4185.4219.3738.6895.7373.3980.1118.0638.4691.35
DWTP Bayas91.8096.197.5672.5398.3390.1496.197.6771.7298.78
Table 6. Turbidity values in NTU and color in UC Pt-Co obtained at the outlet of the settler and the filter.
Flow
(L/s)
Settler OutletFilter Outlet
HTF 68.4 mHTF 97.6 mHTF 68.4 mHTF 97.6 m
TurbidityColorTurbidityColorTurbidityColorTurbidityColor
0.257.7873.405.8760.000.2100.240
0.507.1167.006.9965.000.3200.290
0.757.8872.907.3970.400.4100.350
1.07.0868.0011.0091.000.3400.390
2.023.05148.3515.39119.60.5610.631
Table 7. Statistical Parameters of the Turbidity and Color Removal Efficiency after HTF + Settler + Filter in the Studied Systems.
SystemTurbidity (%)Colour (%)
MeanMeSDMinMaxMeanMeSDMinMax
HTF 68.4 m98.8099.391.4393.6599.9099.931000.2498.82100
HTF 97.6 m98.7499.331.5293.4099.8699.911000.3598.23100
DWTP98.7899.511.4194.8799.851001000100100
Table 8. p-value of Turbidity Removal Efficiency with HTF of 68.4 and 97.6 m.
Observation 1Observation 2p-ValueInterpretation
Turbidity RE in settler using
68.4 m HTF
Turbidity RE in settler using 97.6 m HTF0.55No Significant Difference
Turbidity RE in filter using
68.4 m HTF
Turbidity RE in filter using 97.6 m HTF0.74No Significant Difference
Turbidity RE in settler using
68.4 m HTF
Turbidity RE in the DWTP Bayas settler<0.0001Significant Difference
Turbidity RE in filter using
68.4 m HTF
Turbidity RE in the DWTP Bayas filter0.39No Significant Difference
Turbidity RE in settler using
97.6 m HTF
Turbidity RE in the DWTP Bayas settler0.0002Significant Difference
Turbidity RE in filter using
97.6 m HTF
Turbidity RE in the DWTP Bayas filter0.31No Significant Difference
Table 9. Correlation matrix of influential factors in the HTF system.
Variable Efficiency ReynoldsMRTGradientFlow RateTurbidityLength
Efficiency1
Reynolds−0.391
MRT0.24−0.761
Gradient−0.391−0.711
Flow Rate−0.391−0.7611
Turbidity0.620.04−0.030.040.041
Length0.052.12 × 10−160.220.002−2.97 × 10−150.021
Table 10. Statistical values obtained from regression analysis for turbidity removal efficiency models.
ModelRR2Adjusted R2SeDurbin-Watson
10.7010.4910.4712.621.618
20.8150.6640.650.0671.711
Table 11. Standardized and non-standardized regression function coefficients for HTF efficiency.
ModeloNon-Standardized CoefficientsStandardized CoefficientstSig.
BDev. ErrorBeta
1(Constant)72.0773.234 22.284<0.001
Turbidity0.1460.0240.6646.196<0.001
Gradient−0.1590.053−0.319−2.9810.005
2(Constant)1.6700.048 35.061<0.001
LogGradient−0.0790.024−0.283−3.2580.002
LogTurbidity0.1900.0210.7949.136<0.001
Table 12. Stepwise Multiple Linear Regression Models to Estimate Treatment Efficiency Using an HTF.
Obtained ModelAdjusted R2
E f i c = 72.077 0.159   G + 0.146   T 0.47
E f i c = 10 [ 1.67 0.079   log ( G ) + 0.19   log ( T ) ] 0.65
Table 13. Turbidity and color removal in control tests.
Pilot SystemTurbidity Removal (%)Color Removal (%)
Settler + filter
(Coagulated water without HTF)
49.3 51.1
HTF_68.4m + Settler + filter
(No coagulant)
16.3812.91
HTF_97.6m + Settler + filter
(No coagulant)
20.1216.73
Table 14. Construction cost of a conventional flocculator.
Flow Rate (L/s)Flow Rate (mgd)Construction Cost (USD)
0.250.00576187.96
0.50.01148453.00
0.750.017110,145.00
1.00.022811,547.14
2.00.045615,773.86
Table 15. Summary of Materials and Used Prices.
ItemUnit PriceQuantityFinal Price
1PVC pipe 110 mm × 1.00 mpa × 6 m U/Z28.7515431.25
2PVC elbow 110 mm × 90 U/Z1626416.00
3Tee PVC 110 mm U/Z51151.00
4PVC bell flange mm U/Z23246.00
5Repair joint 110 mm U/Z11444.00
6Elbow 110 mm E/C11666.00
7Wafer valve of 110 mm (ductile iron)128.51128.50
9PVC ball valve 110 mm52152.00
10Pipe rack (iron)8401840.00
Total 2074.75
Note: U/Z = elastomeric sealing.
Table 16. Specifications of the pilot system and the conventional DWTP.
ComponentRetention Time (min)Surface Load (m3/m2d)
Pilot Horizontal Tubular Flocculator (HTF)12.5
Conventional horizontal screen flocculator21.0
Conventional DWTP High Rate Settler Bayas25.094
High rate pilot settler12.0120
Conventional DWTP Sand Filter Bayas 120
Pilot sand filter 120
Table 17. Characteristics of the HTF used in other studies.
AuthorFlocculator Length (m)Pipe Diameter (mm)Gradient G (s−1)Flow Rate (m3/h)Time (s)Initial Turbidity (NTU)Efficiency(%)
(Tse et al., 2011) [14]289.5400.1365050 ± 594
(Kurbiel et al., 1989) [17] 2071.452.73.582.3 68.8
(Kurbiel et al., 1989) [17] 2086.433.24105 54.3
(Oliveira and Teixeira, 2018) [51]11.371.581600.1256.25082.3
This study68.4110 463.6435206.191.37
This study97.6110 423.6738249.685.32
Disclaimer/Publisher’s Note: The statements, opinions and data contained in all publications are solely those of the individual author(s) and contributor(s) and not of MDPI and/or the editor(s). MDPI and/or the editor(s) disclaim responsibility for any injury to people or property resulting from any ideas, methods, instructions or products referred to in the content.