Analysis of Demand and Structural Changes in China’s Water Resources over the Next 30 Years
Abstract
:1. Introduction
2. Research Methods of Water Demand Forecasting
2.1. Research Status
2.2. Urgent Problems and Solutions
- The divergence of the anticipated value is substantial, and one of the major reasons is the deviation of basic data. Because there is a certain divergence between the historical data and the actual value, there is an error between the forecast result and the real value.
- A lack of systematic and continuous prediction research leads to a long cycle (more than 30 years) covering three fields (national, regional, and watershed) and three levels (total amount, four departments, and sub-departments).
- Inadequate theoretical and technical support, insufficient summarization of consumption laws, and a hazy driving mechanism for the adjustment and optimization of the economic and social development model.
- There is a lack of understanding of supply-side constraints such as water resource endowment and carrying capacity, water conservation projects, management and macro-control, and other factors.
3. Data Sources
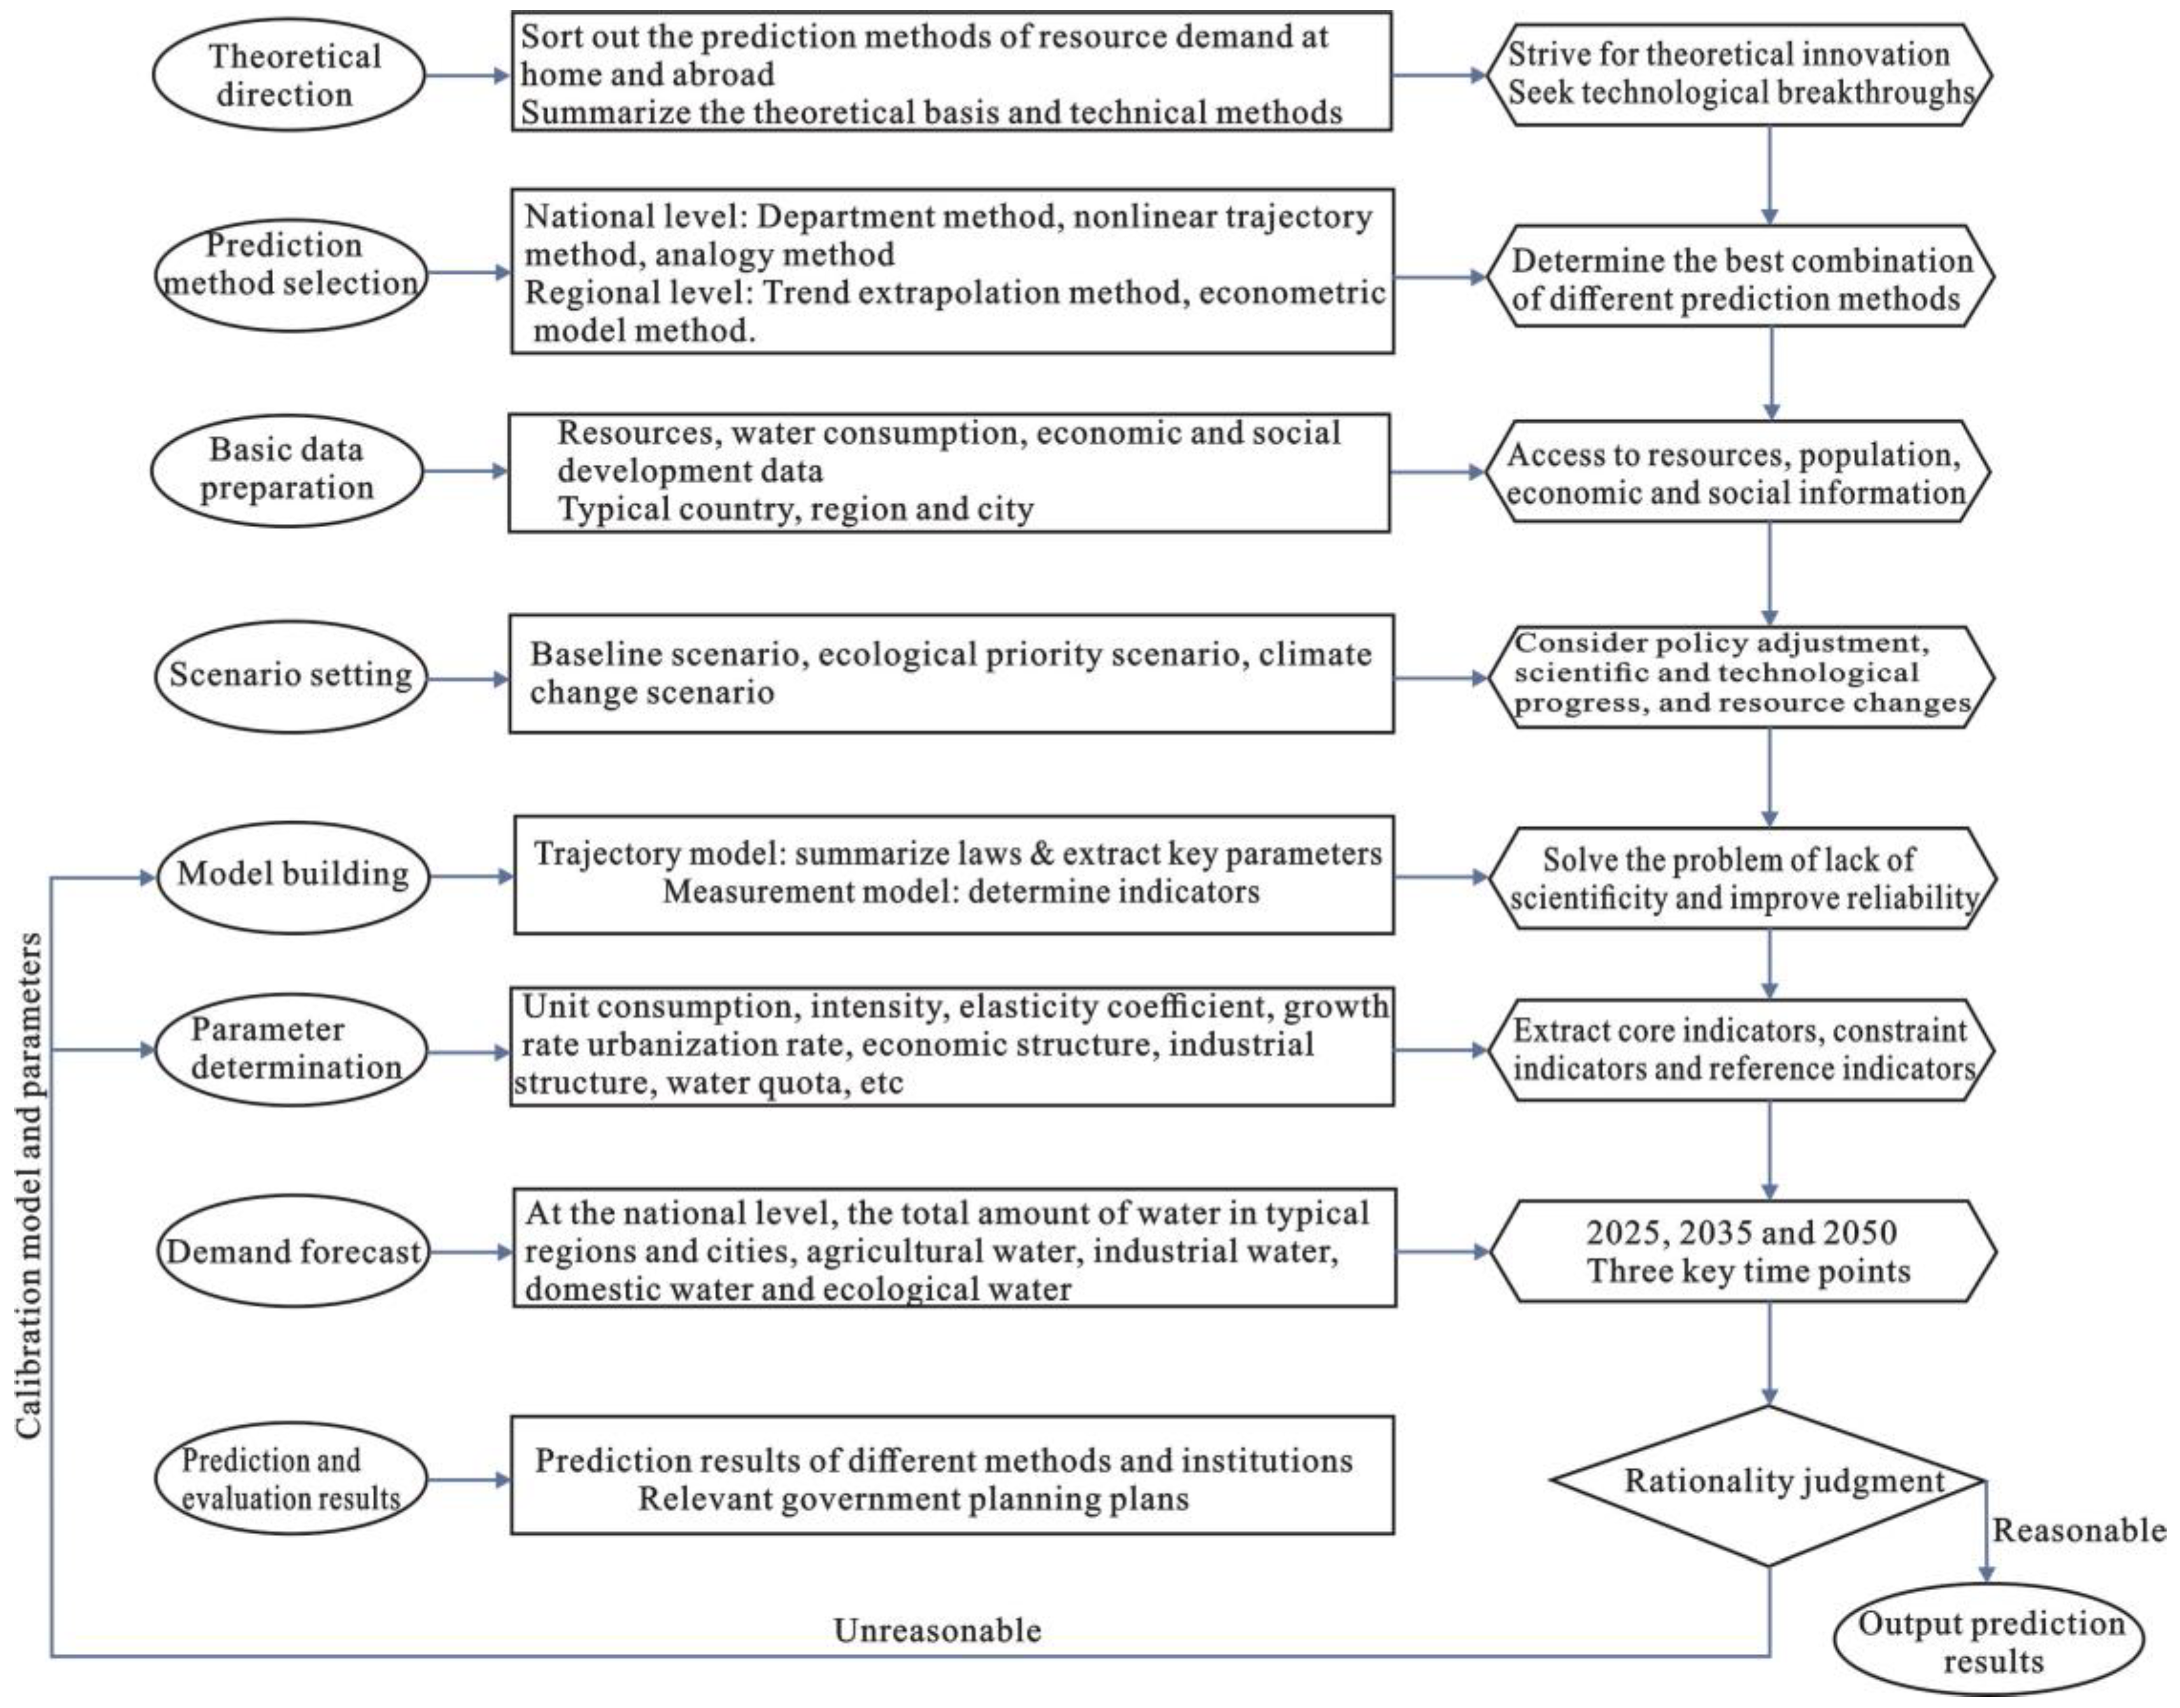
4. The Modeling Framework
4.1. Build Big Data on Water Consumption
4.2. Reveal the General Law of Water Resources Consumption
4.3. Consolidate Key Indicators for Future Economic and Social Development
5. Research on the Law of the Coupling Relationship between Water Resources, Economy, and Society
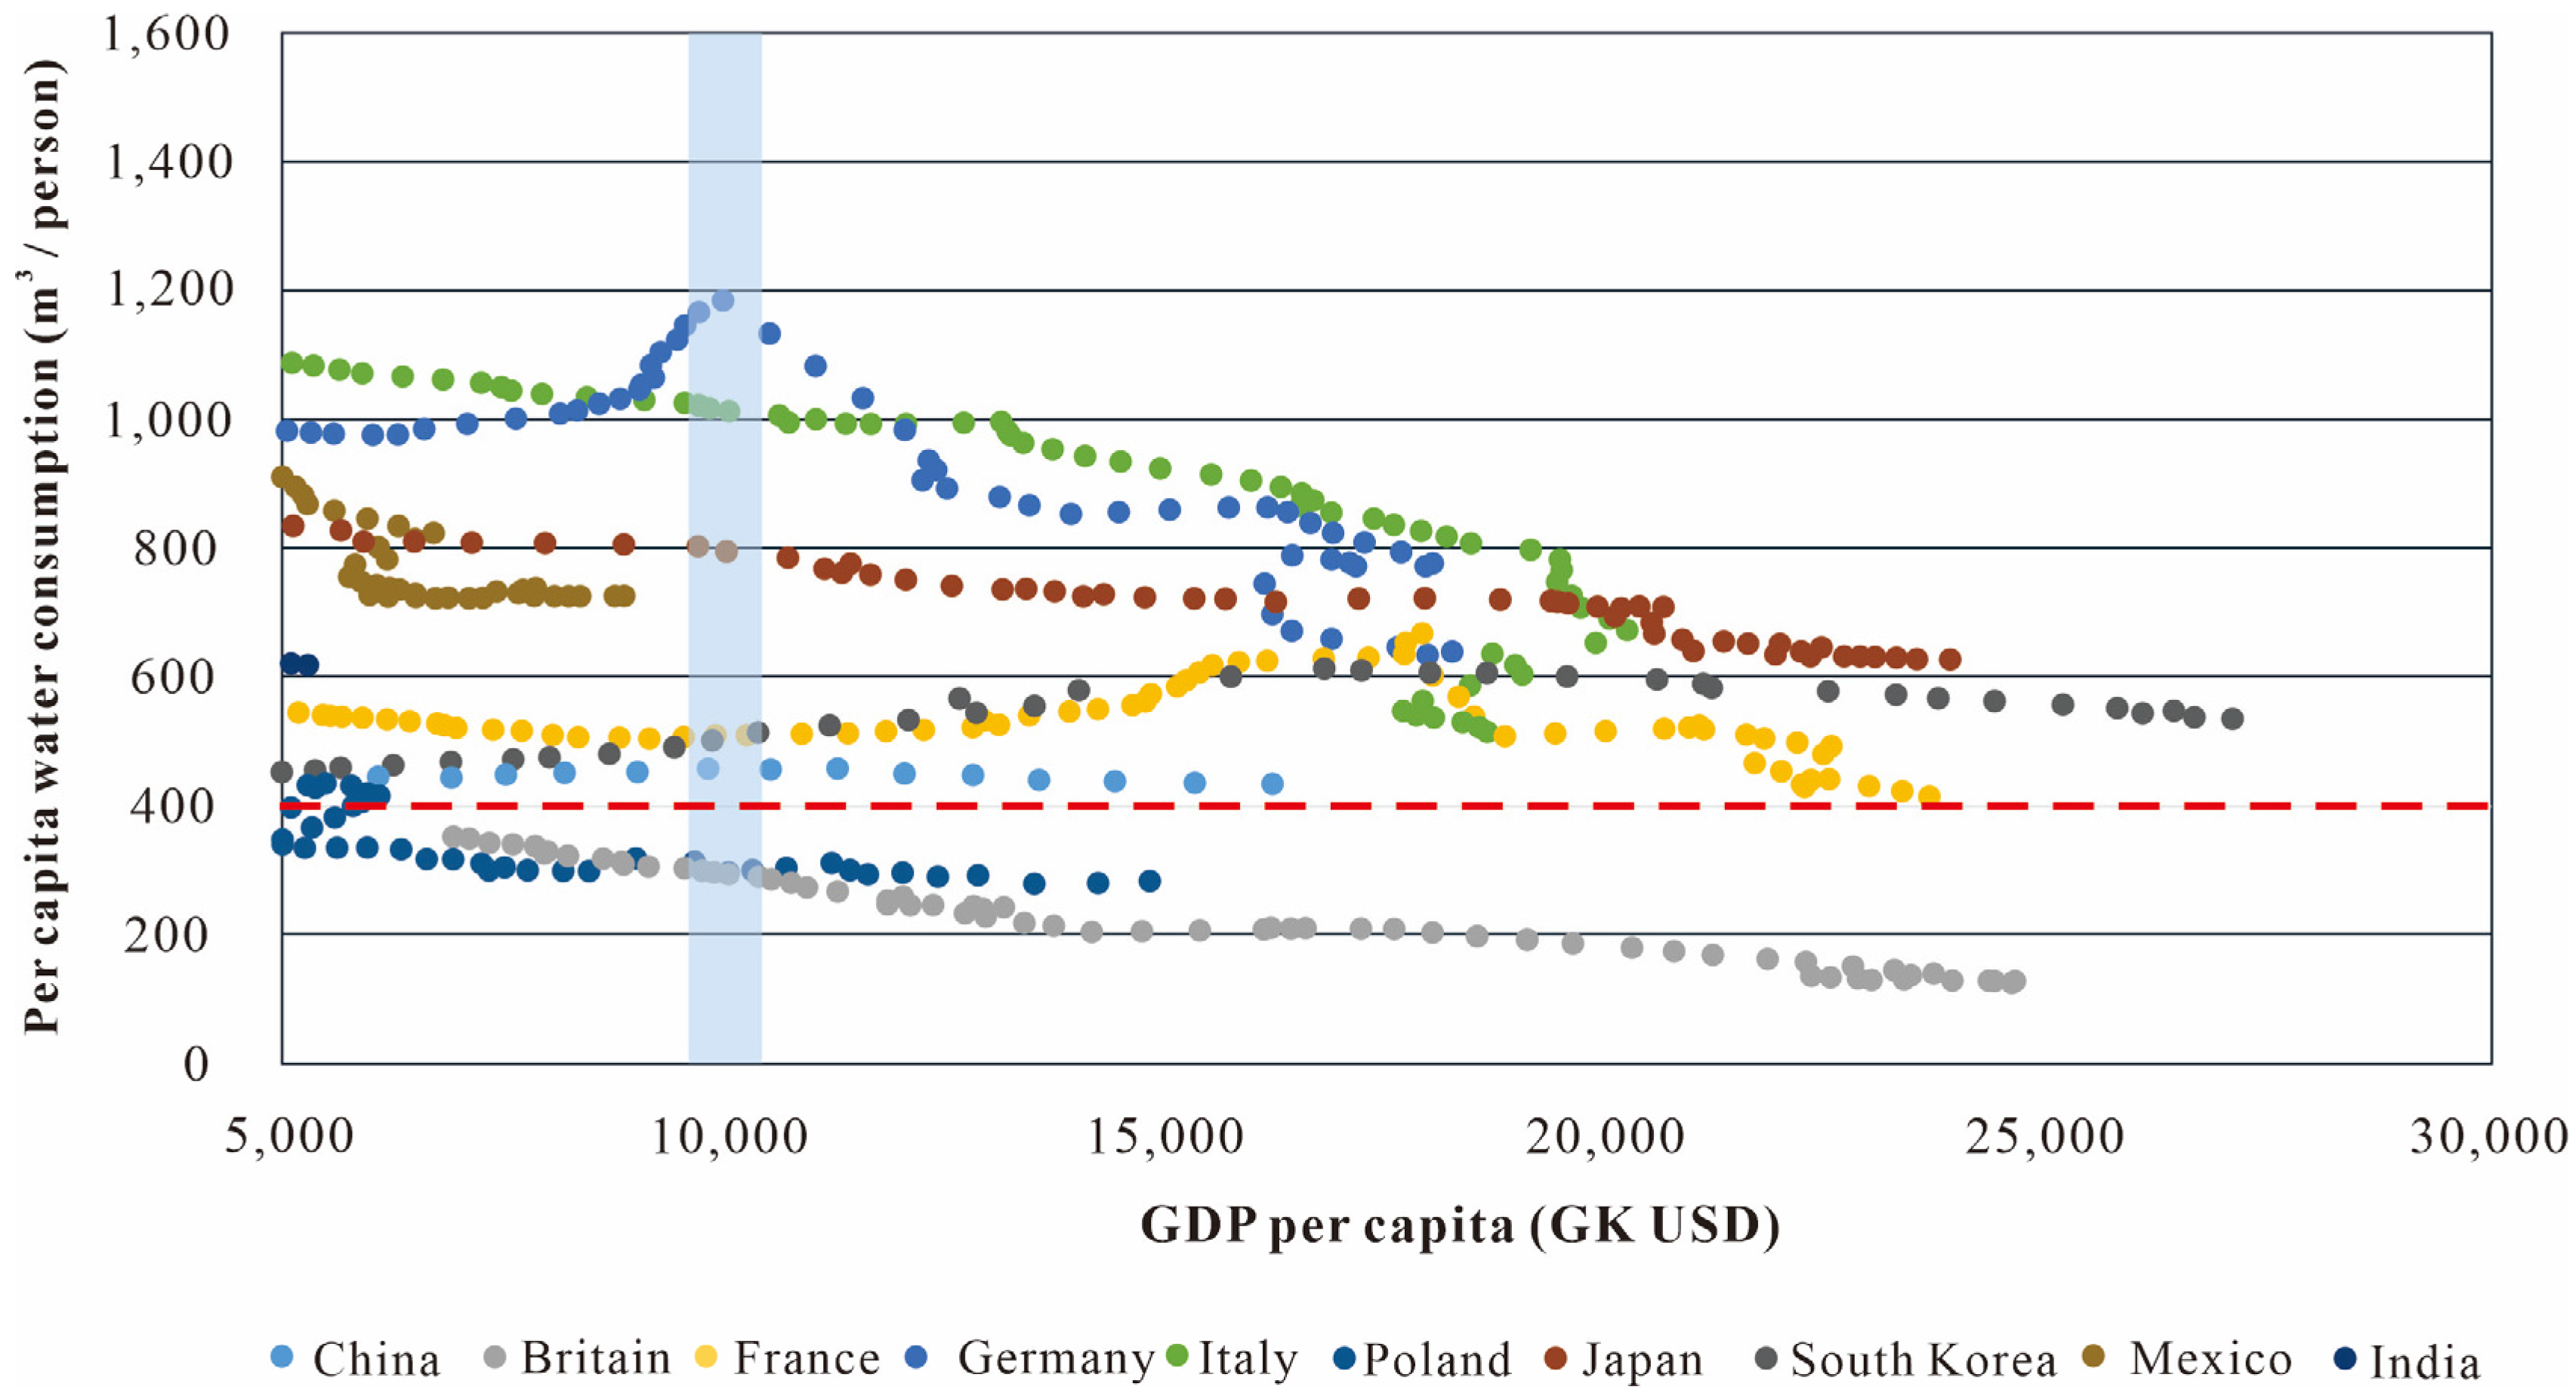
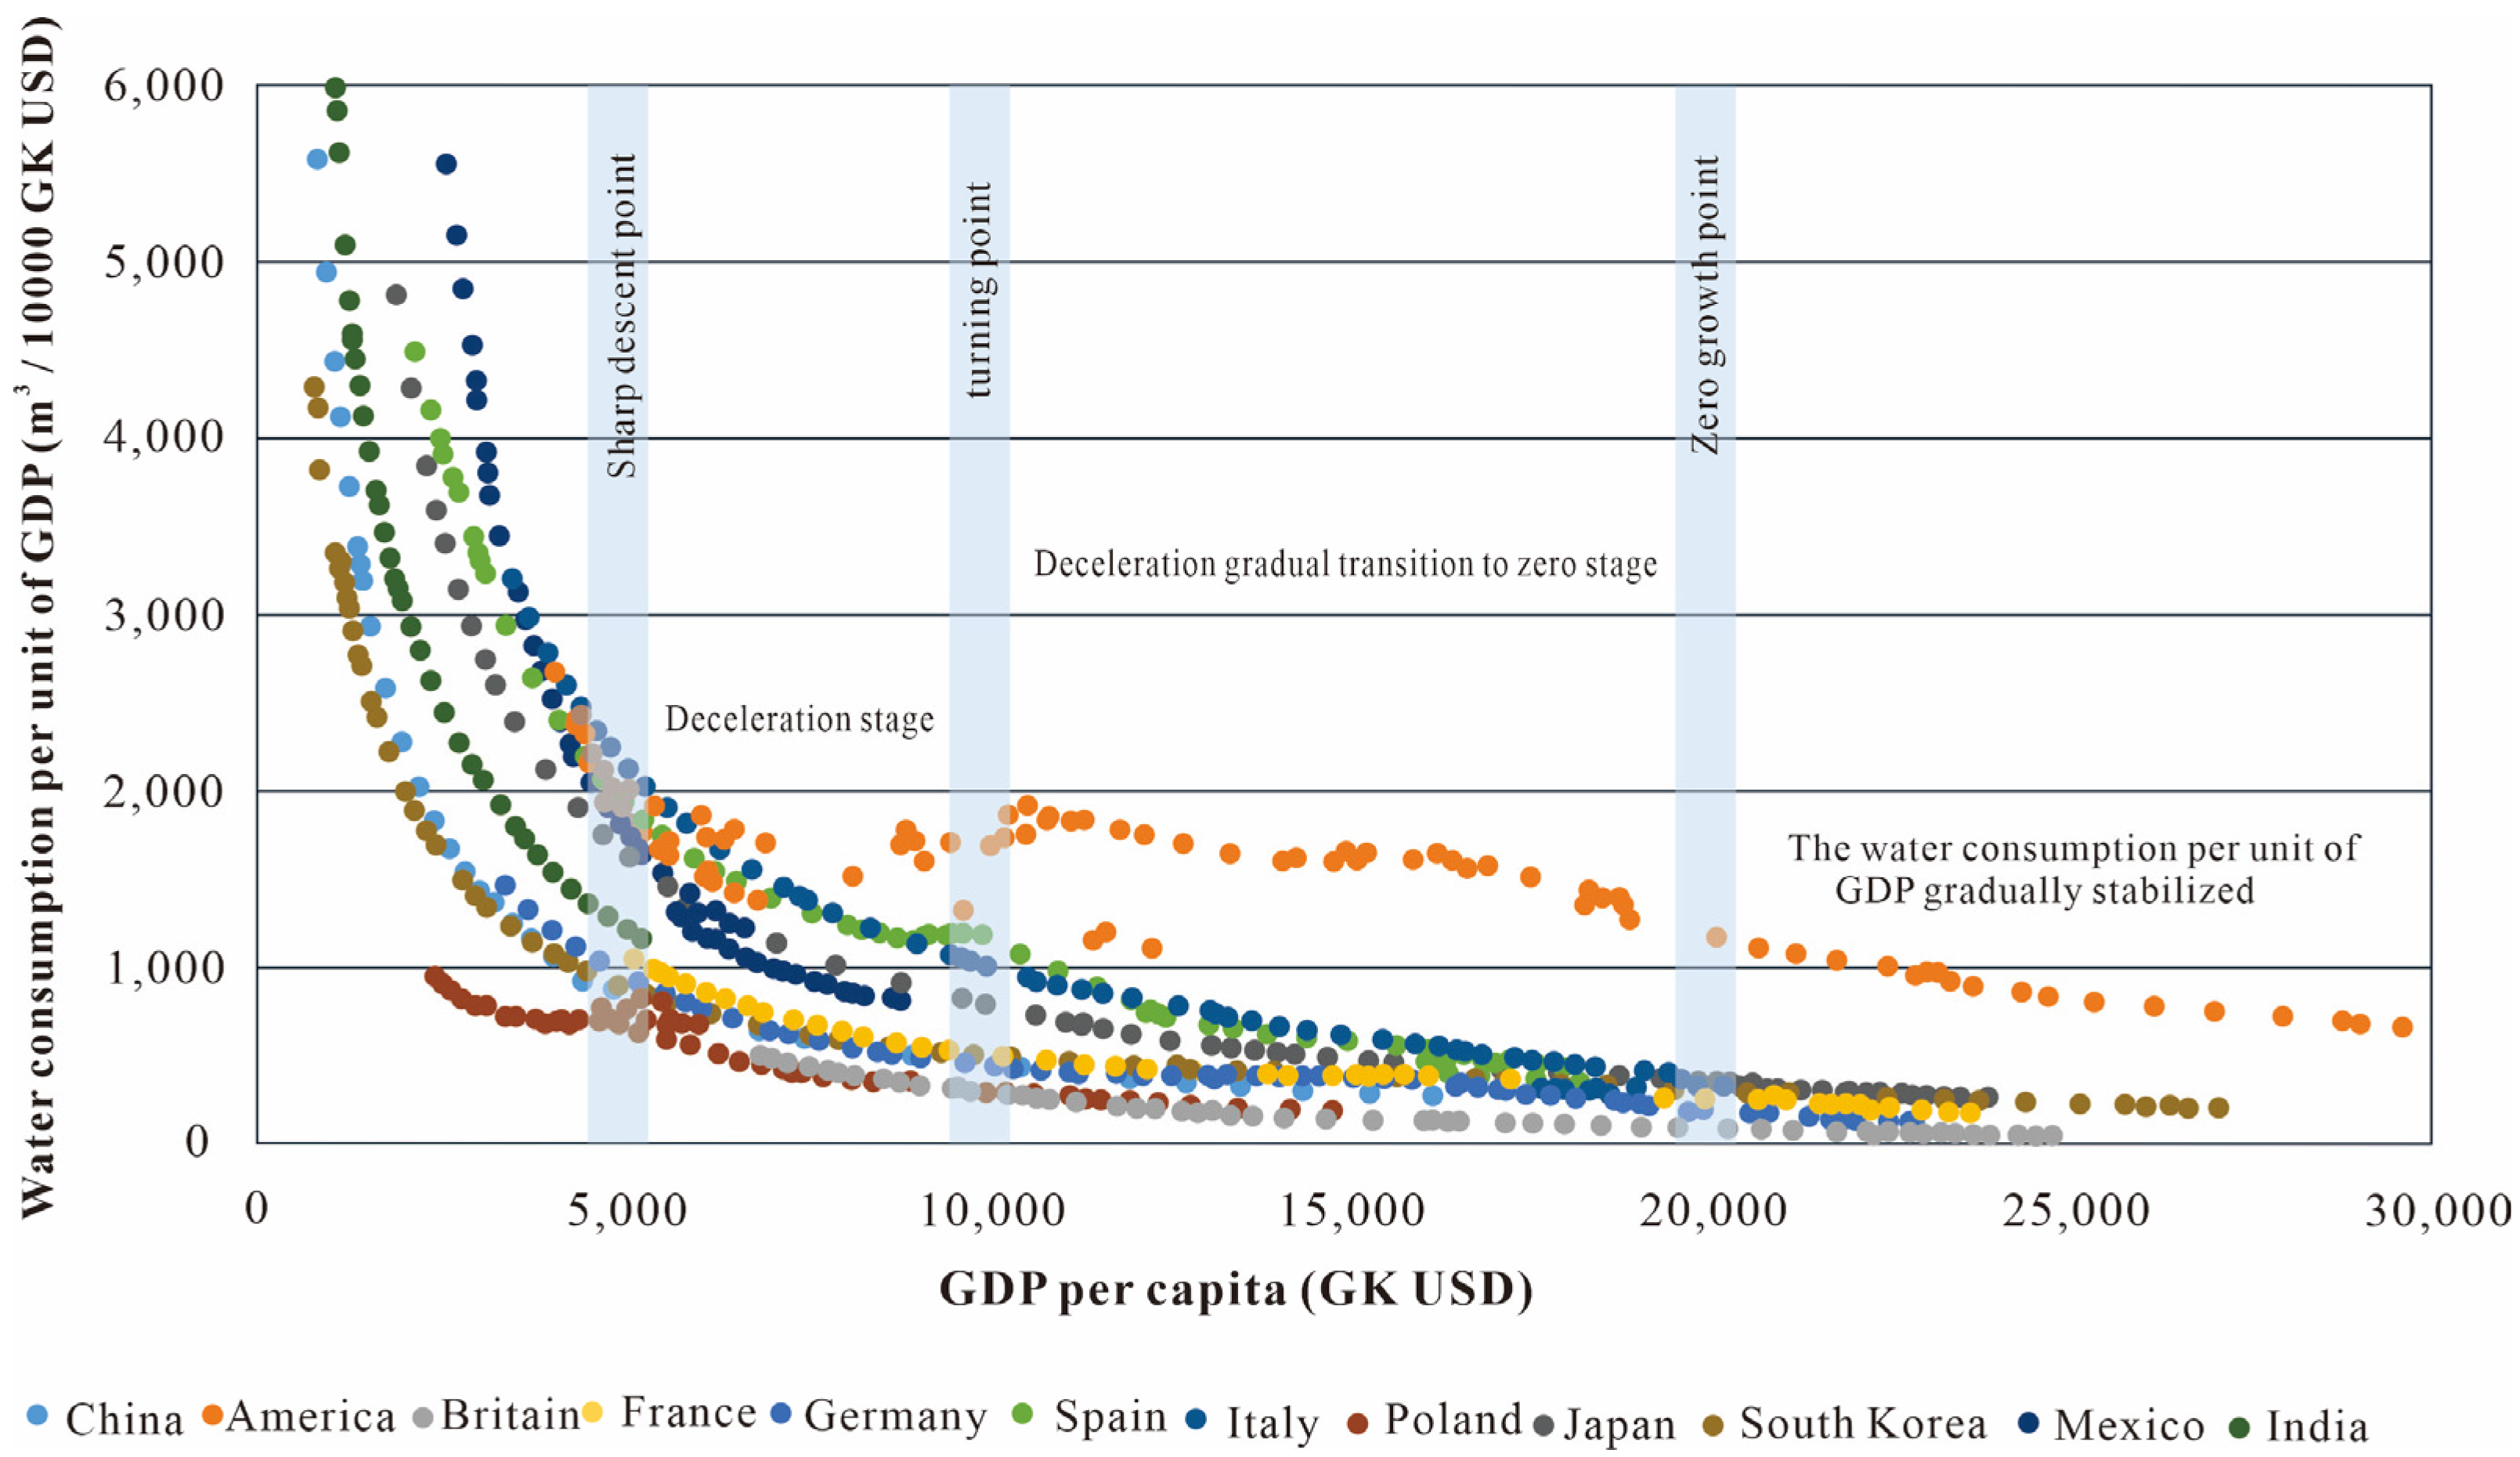
5.1. The Trend of per Capita Water Consumption and Consumption Intensity
5.2. The Order of Peak Consumption
- Agricultural water use
- Industrial water
- Domestic water
6. Analysis of China’s Water Resource Demand in the Next 30 Years
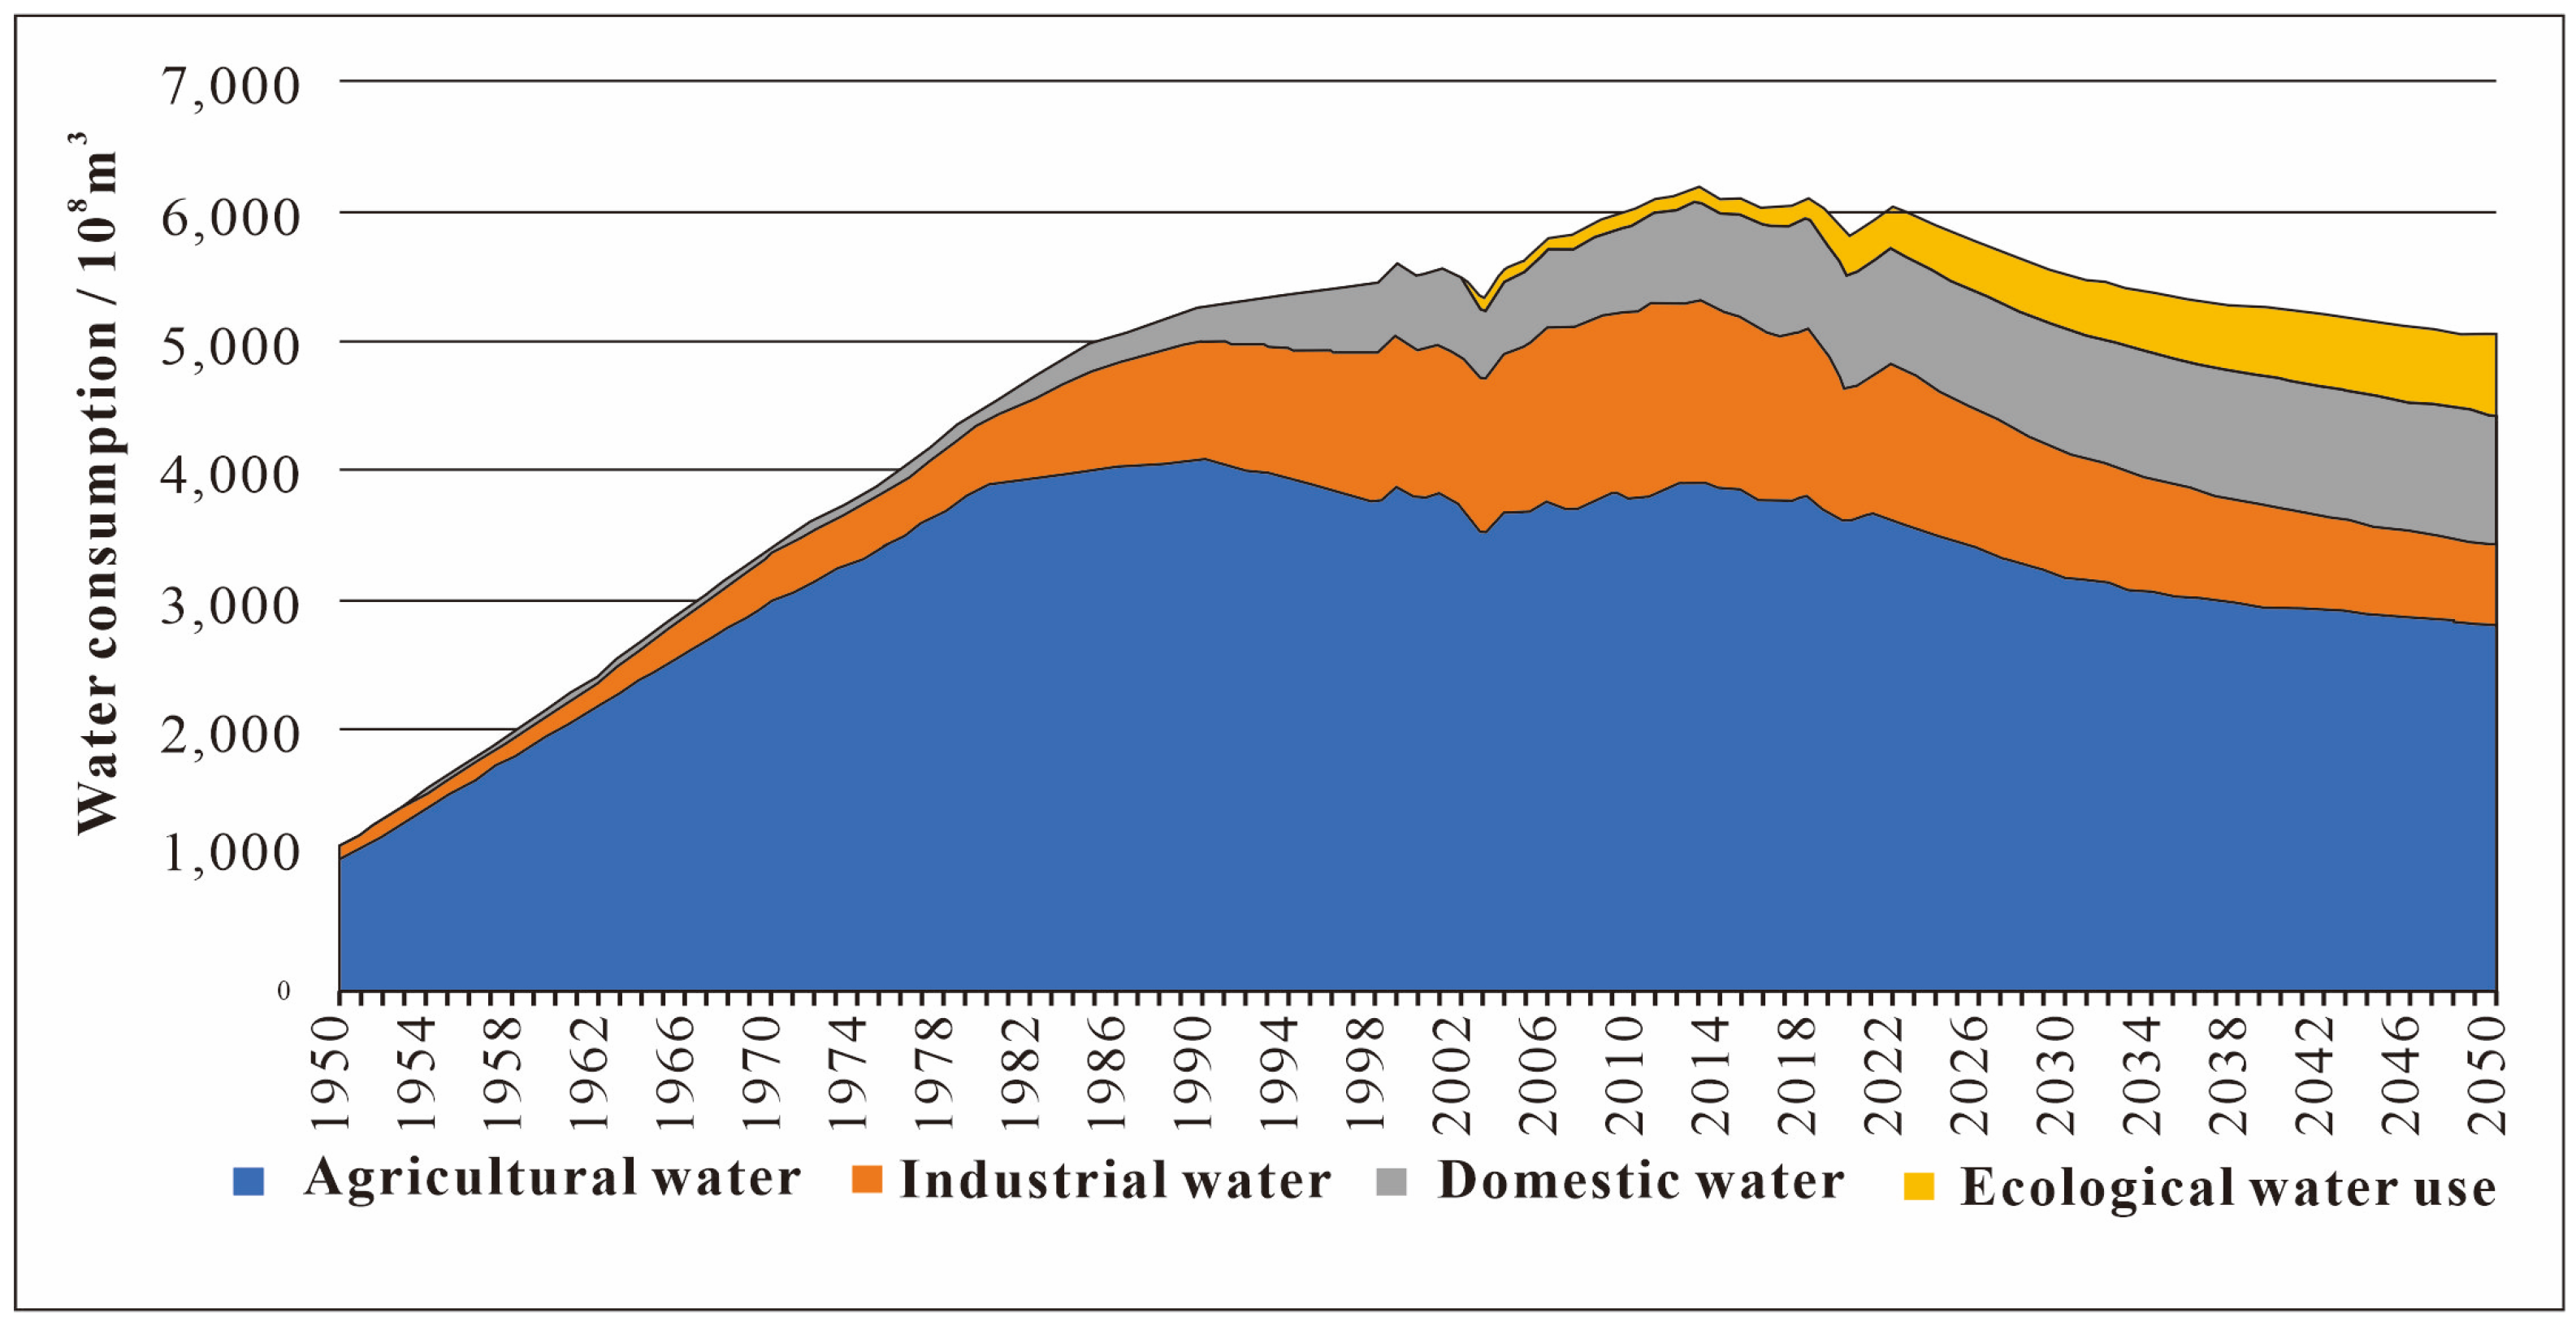
6.1. The Total Water Demand Shows a Downward Trend, and Domestic and Ecological Water Use Continues to Grow
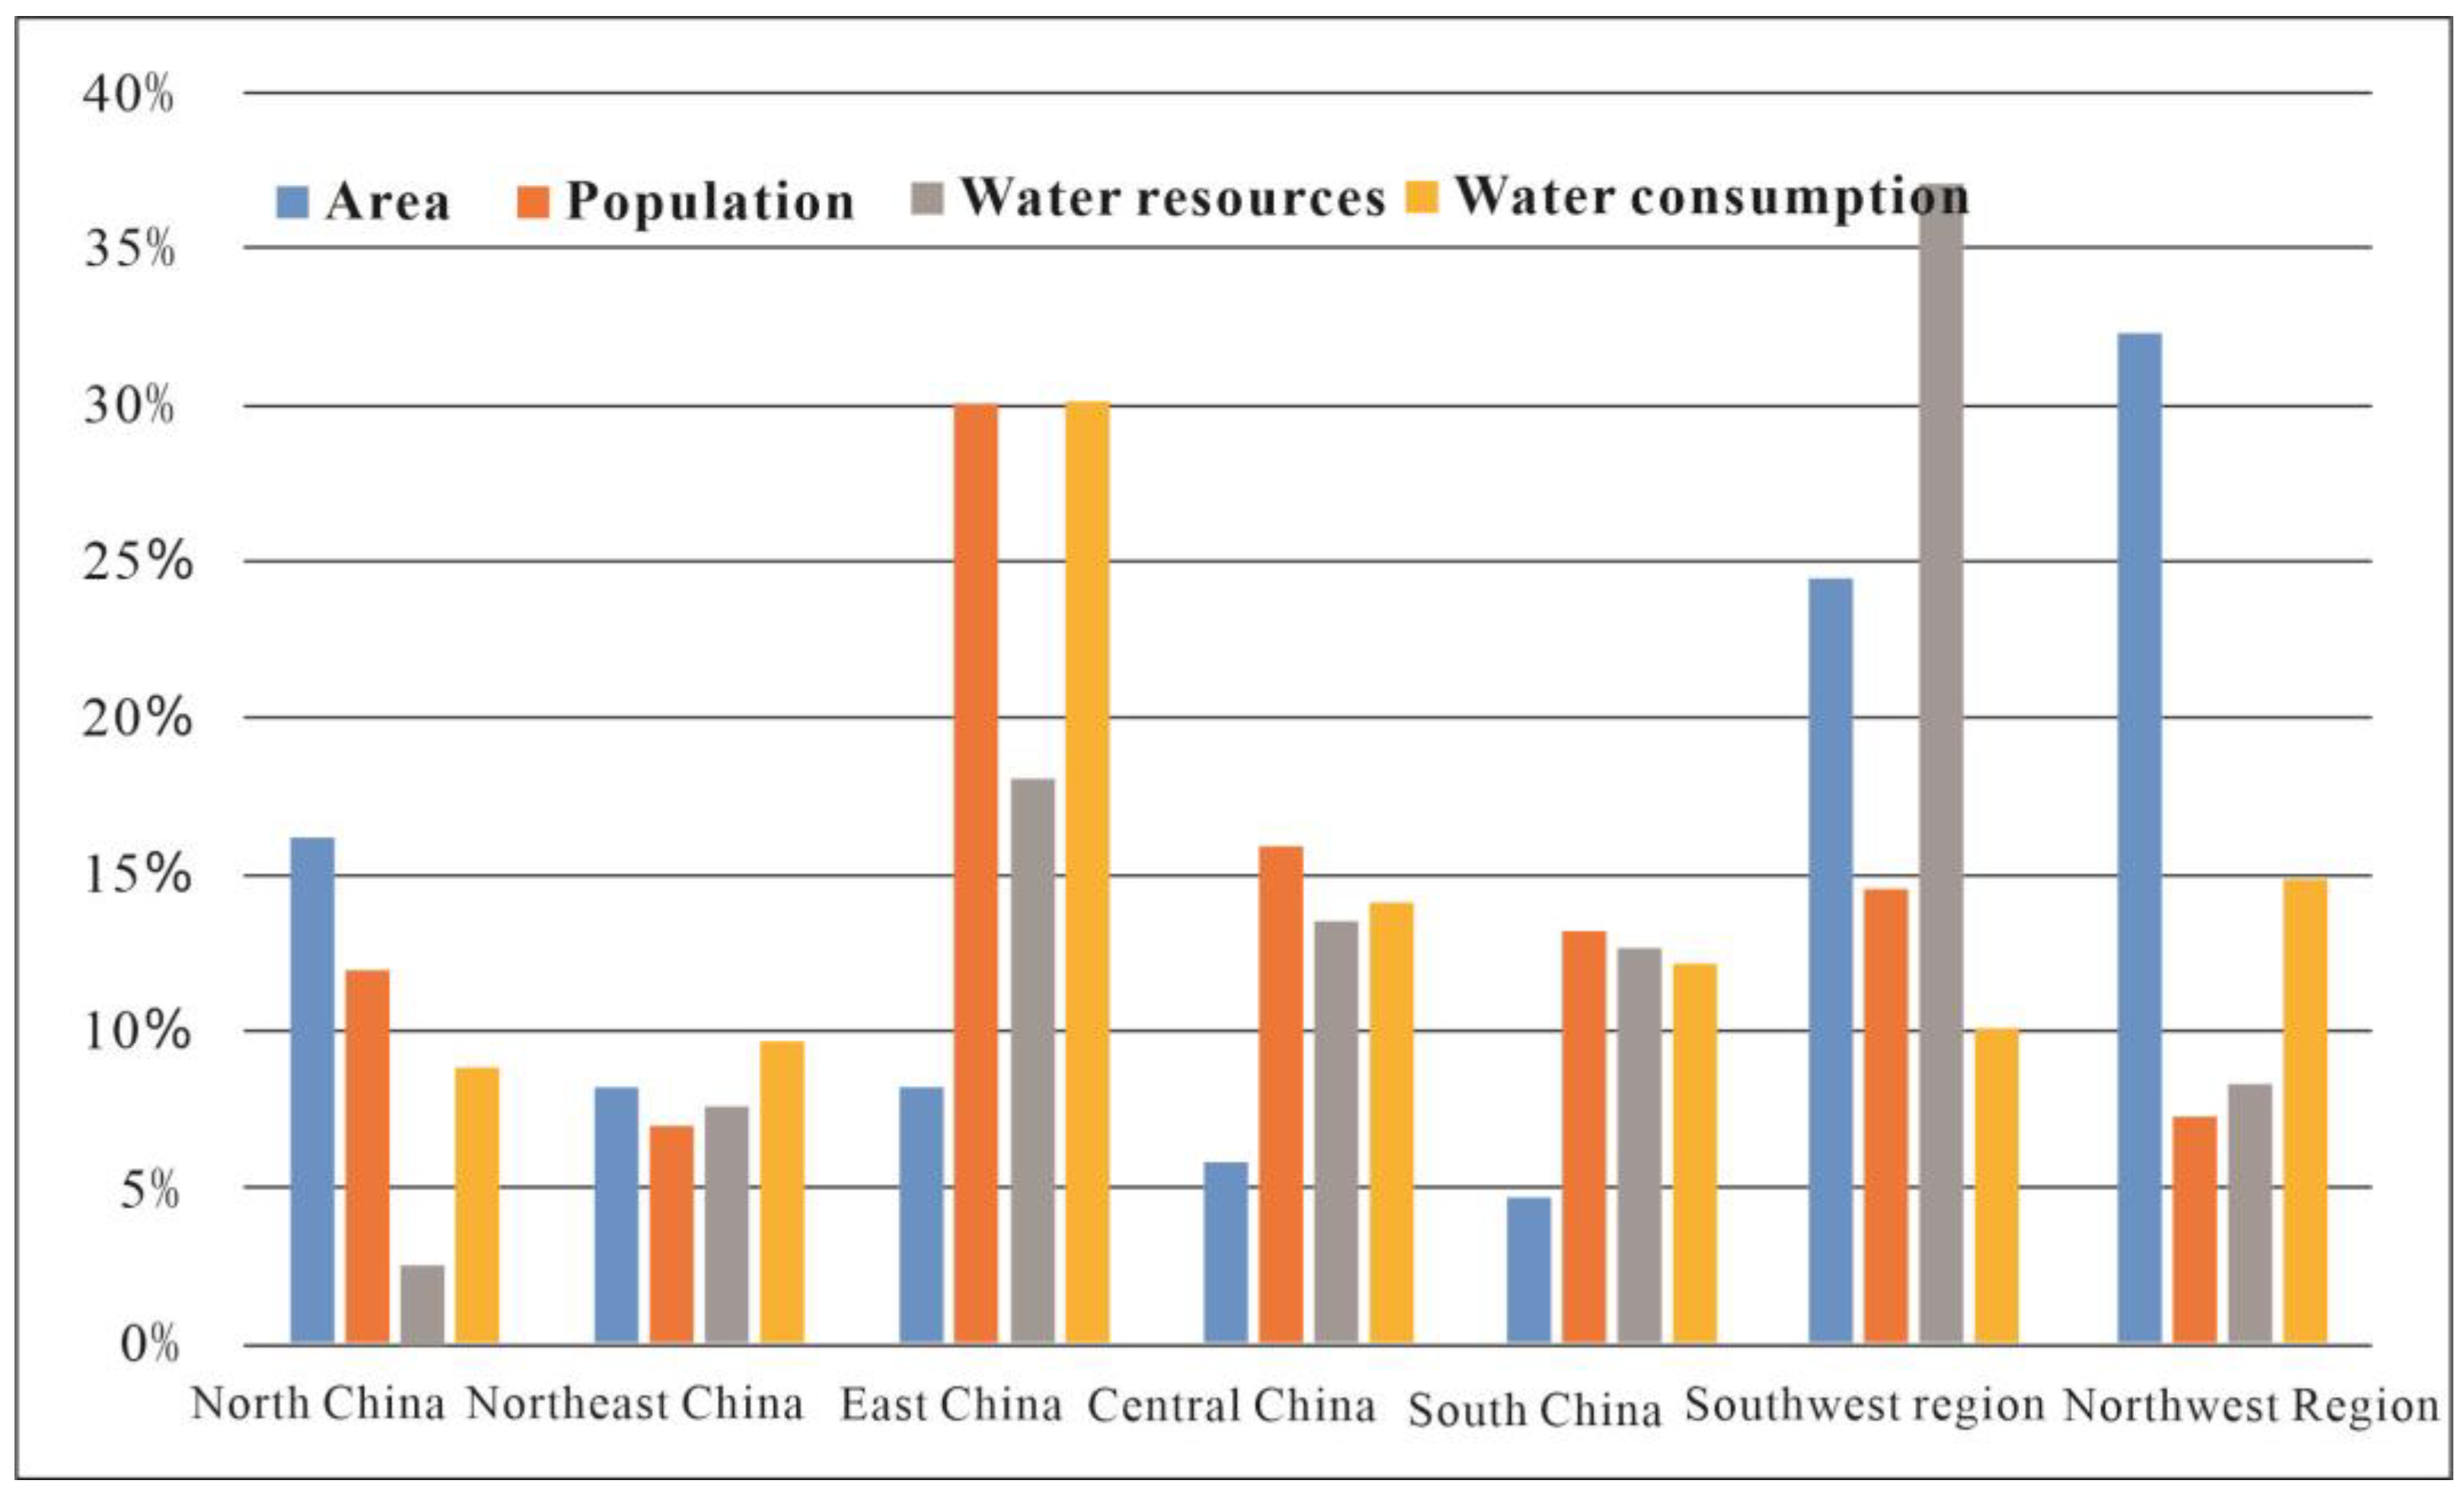
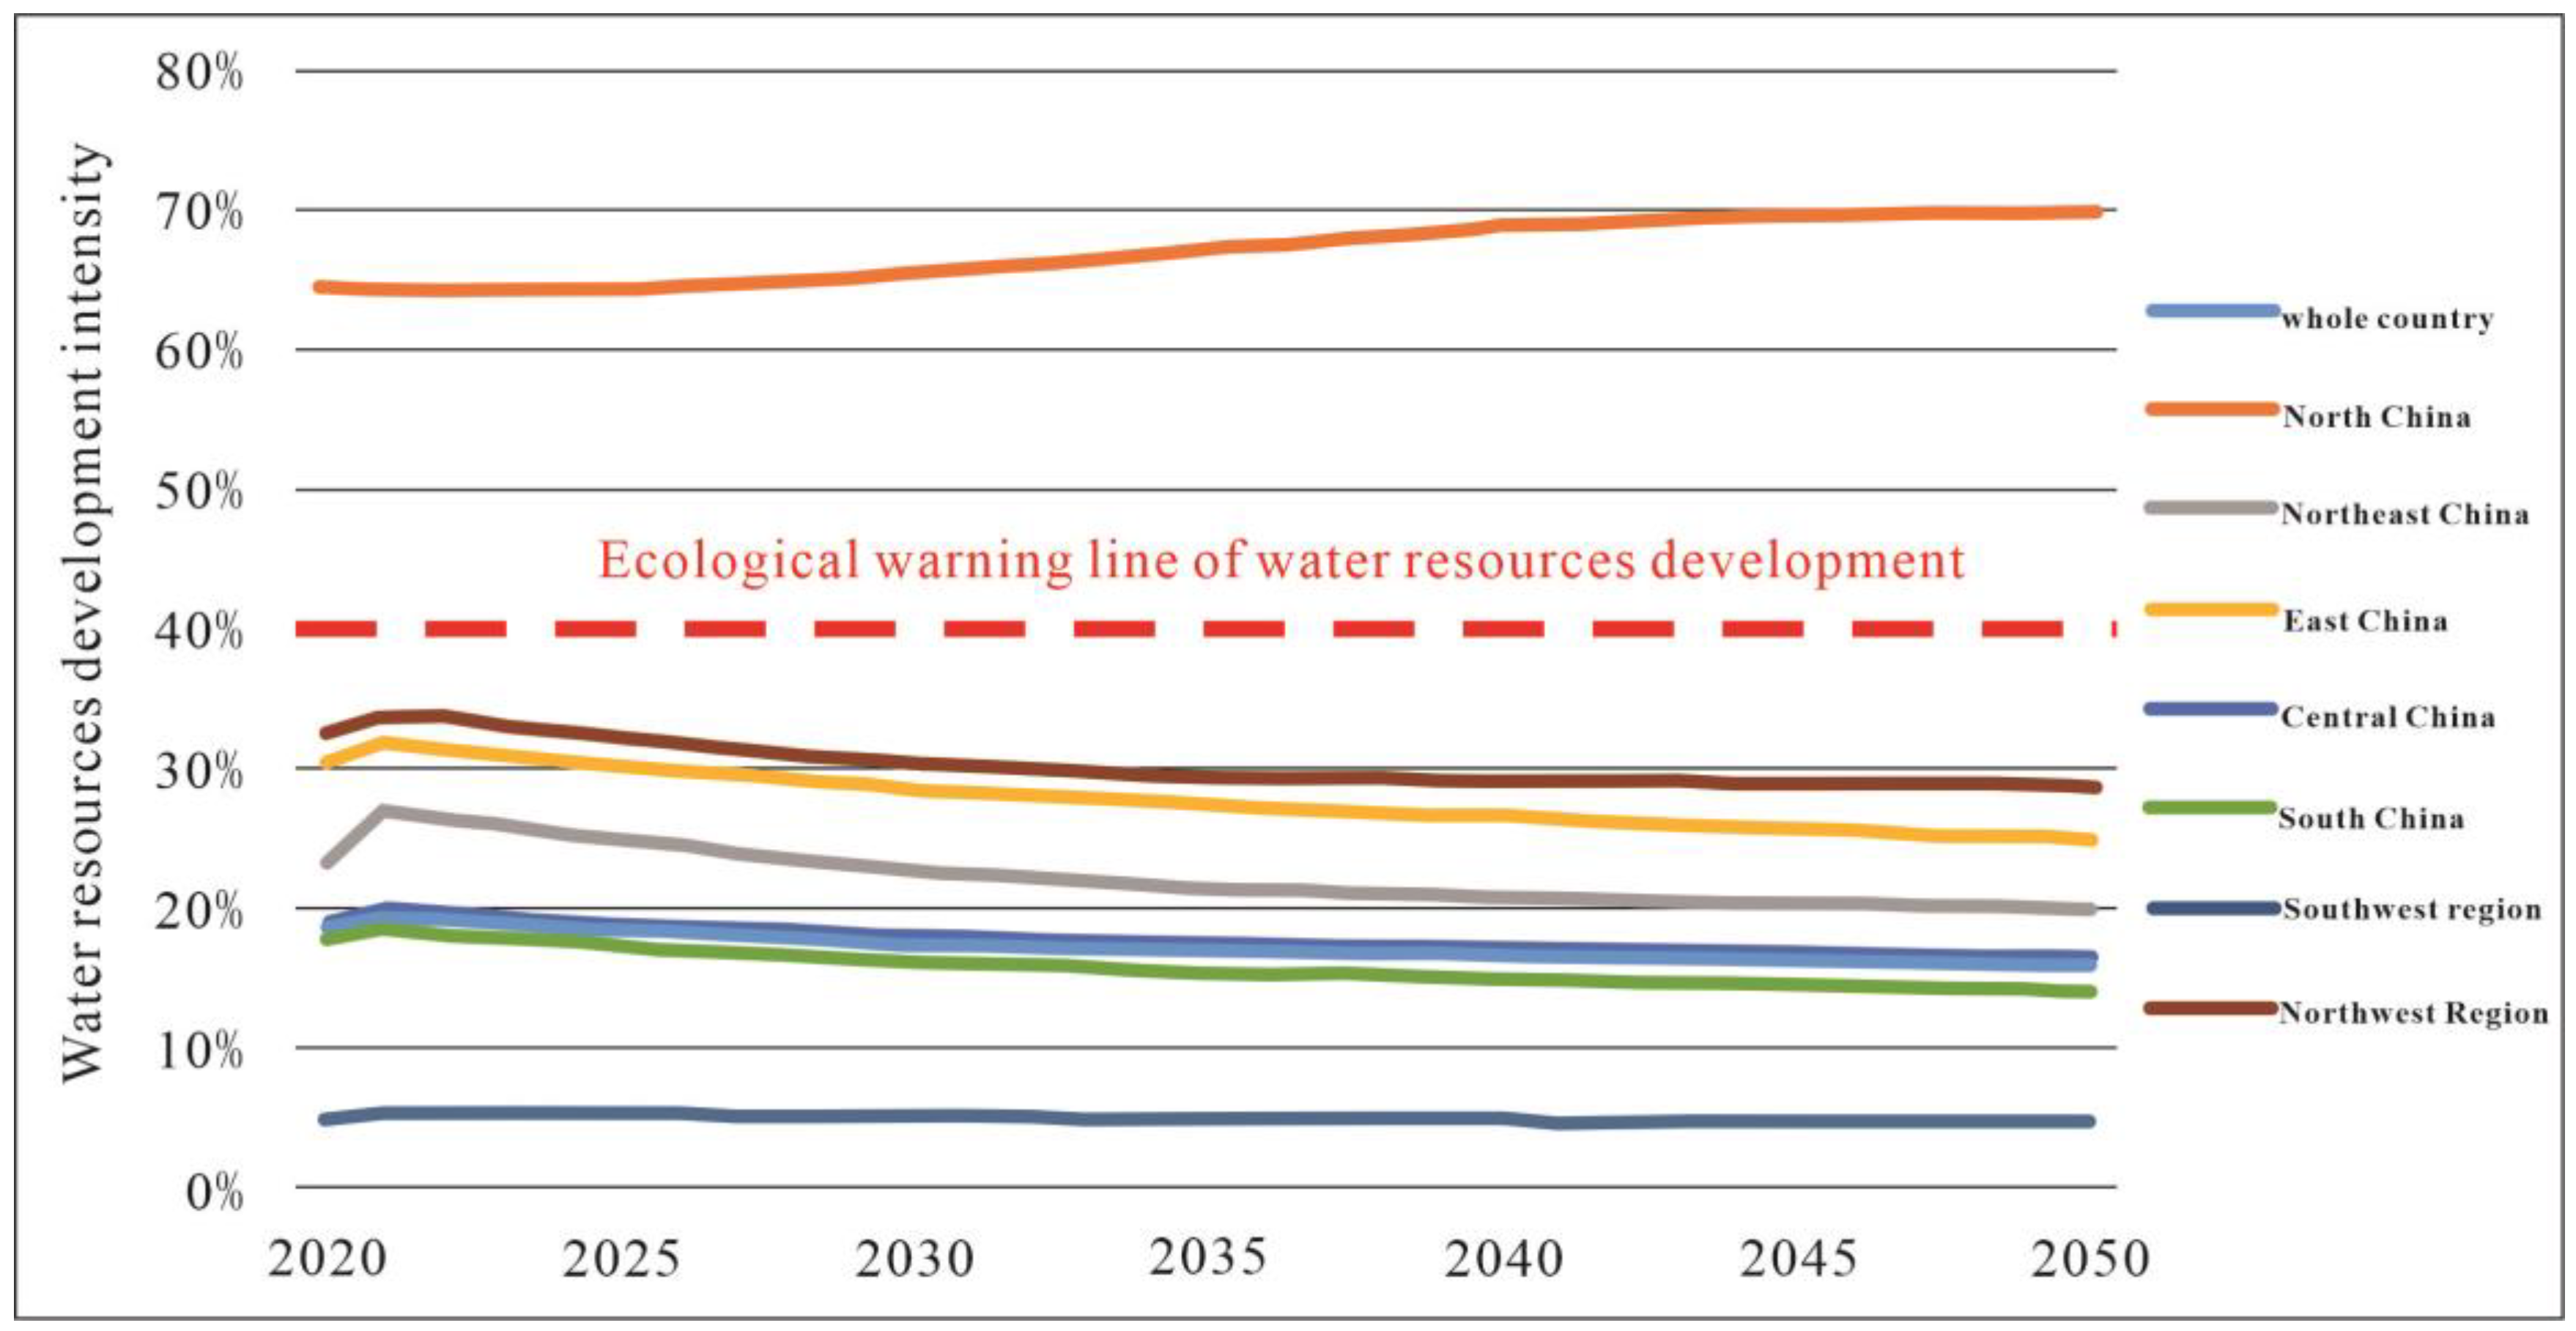
6.2. The Intensity of Water Resources Development in North China Is Far beyond the Warning Line, and It Will Be More Severe in the Future
7. Conclusions
- (1)
- Based on energy prediction methods, we proposed the “three in one” production model, namely: “data constraint + mathematical prediction + actuarial prediction.” The model integrates a wide range of disciplines, including economics, ecology, engineering, and mathematics. We anticipated water consumption in practice. Compared with the actual data (Table 1 and Table 3), the strategy proved to be both unique and practical, which not only follows the economic development trajectory but also takes into account changes in the basic data.
- (2)
- Peak demand for water resources in China (618.3 billion m3) was reached in 2013, with demand varying substantially by sector. For example, agricultural water has traditionally been the primary source of water consumption in China, peaking in 1990, and will continue to account for more than half of the total demand by 2050. Industrial water use efficiency has already surpassed the world’s advanced level; the trend shows a moderate fall, which will continue for a long time, and be less than domestic water by 2030. Domestic water use is gradually increasing in tandem with urbanization and growing living standards and is predicted to peak in 2030.
- (3)
- According to projections, in 2030, 56% of the water will be consumed by agriculture, 12% by industry, 20% by life, and 12% by ecology, with the composition of water consumption in different sectors altering as society develops. It is suggested to further demonstrate the viability of decreasing agricultural water consumption and increasing ecological water consumption in this region. Furthermore, inter-provincial water transfer and optimal adjustment of water use by departments still need to focus on North China.
- (4)
- In the future, North China is the only geographical area that will continue to grow, going from 64% today to 70% in 2050. Other regions will continue to fall below the internationally acknowledged ecological warning line of 40% of water resources development, reaching an average of less than 30% in 2050.
Author Contributions
Funding
Acknowledgments
Conflicts of Interest
References
- Xia, J.; Huo, J.L.; Zhan, C.S. Some refections on the research and of development water resources in China. Adv. Earth Sci. 2011, 26, 905–915. [Google Scholar]
- Hamza, A.A.; Getahun, B.A. Assessment of water resource and forecasting water demand using WEAP model in Beles river, Abbay river basin, Ethiopia. Sustain. Water Resour. Manag. 2022, 8, 22. [Google Scholar] [CrossRef]
- Wang, X.J.; Jin, Z.F.; Chen, Y.; Gu, L.Y.; Zhang, X. Research on rigid constraint mechanism of water resources in territorial space planning. Nat. Resour. Econ. China 2021, 34, 4–9. [Google Scholar]
- Jin, J.L.; Li, J.Q.; Wu, C.G.; He, J.; Guo, X.N.; Zhang, H.Y.; Chen, M.L.; Chen, L. Research progress on spatial equilibrium of water resources. J. North China Univ. Water Resour. Electr. Power 2019, 40, 47–60. [Google Scholar]
- Guo, X.Q.; Yan, Q.; Wang, G.S. Review of prediction methods on water resources demand. China Min. Mag. 2019, 28, 160–165. [Google Scholar]
- Yang, S.K. Research progress of water resource demand forecasting. Agric. Technol. 2020, 40, 39–41. [Google Scholar]
- Anderson, P. Demands and resource for Public Water Supplies in Soctland from 1991 to 2016. Water Int. 1997, 11, 164–169. [Google Scholar]
- Prassifka, D. Current Trends in Water Supply Planning New York; Von Nostrand Reinhold Company: New York, NY, USA, 1988. [Google Scholar]
- He, L.Y.; Xia, J.; Zhang, L.P. Present research and development trend on water resources demand forecast. J. Yangtze River Sci. Res. 2007, 24, 61–64. [Google Scholar]
- Al-Kharabsheha, T. Challenge of water demand management in Jordan. Water Int. 2005, 30, 210–219. [Google Scholar] [CrossRef]
- Zhang, Y. Research on the Matching of Water Resources Utilization and Economic Development in China: Calculation Based on Agricultural Virtual Water Volume and Water Quality Footprint. Ph.D. Thesis, Northwest A & F University, Xianyang, China, 2022. [Google Scholar]
- Li, J.Q.; Huang, D.C.; Huang, Y.W. The coupling coordination effect and space transmission of water-energy-food green development in China. Sci. Technol. Manag. Res. 2022, 42, 196–204. [Google Scholar]
- Xiu, H.L.; Zhu, W.B.; Wei, J.X.; Lv, A.F. Key technologies and policies to adjust water resource-carrying capacity. J. Beijing Norm. Univ. 2020, 56, 467–473. [Google Scholar]
- Zhang, G.D.; Chen, Z.K. Comprehensive Report of Strategy on Water Resources for China’s Sustainable Development; Water Conservancy and Hydropower Publishing House: Beijing, China, 2001. [Google Scholar]
- Wang, H. Research on Water Resources and Sustainable Development Strategy in China; China Electric Power Publishing House: Beijin, China, 2010. [Google Scholar]
- National Development and Reform Commission, Ministry of Water Resources. Comprehensive National Water Resources Planning (2010–2030); National Development and Reform Commission: Beijin, China, 2012; 7. [CrossRef]
- Joseph, A. Development and Testing of the Water GAP2 global model of Water Use and Availability. Hydrol. Sci. 2003, 48, 317–337. [Google Scholar]
- Cheng, D.X.; Shi, W.; Wang, X.Y. Prediction data analysis of future development of water resources based on time series model. Electron. Technol. Softw. Eng. 2019, 15, 120–122. [Google Scholar]
- Fullerton Jr, T.M.; Cárdenas, J.P. Forecasting water demand in Phoenix, Ariz. Am. Water Work. Assoc. 2016, 108, 533–545. [Google Scholar] [CrossRef]
- Wang, Y.J.; Guan, X.J.; Shen, K. Prediction of water resource demands in Xinzheng city. Bull. Soil Water Conserv. 2010, 30, 208–213. [Google Scholar]
- Wang, H.; Wang, W.J.; Cui, Z.H. A new dynamic firefly algorithm for demand estimation of water resources. Inf. Sci. 2018, 438, 95–106. [Google Scholar] [CrossRef]
- Liu, A.; Giurco, D.; Mukheibir, P. Motivating metrics for household water-use feedback. Resour. Conserv. Recycl. 2015, 103, 29–46. [Google Scholar] [CrossRef]
- Zhang, L.; Chen, X.H.; Liu, B.J. Projection pursuit model coupled with immune evolutionary algorithm for water demand prediction. J. Nat. Resour. 2009, 24, 328–334. [Google Scholar]
- Rathnayaka, K.; Malano, H.; Arora, M. Prediction of urban residential end–use water demands by integrating known and unknown water demand drivers at multiple scales II: Model application and validation. Resour. Conserv. Recycl. 2017, 118, 1–12. [Google Scholar] [CrossRef]
- Li, T.H.; Yang, S.N.; Tan, M.X. Simulation and optimiza-tion of water supply and demand balance in Shenzhen: A system dy-namics approach. J. Clean. Prod. 2019, 207, 882–893. [Google Scholar] [CrossRef]
- Marta, S.V. Modeling residential water demand: An approach based on household demand systems. J. Environ. Manag. 2020, 261, 109921. [Google Scholar]
- Wang, A.; Wang, G.; Chen, Q.; Yu, W.; Yan, K.; Yang, H. S-curve model of relationship between energy consumption and economic development. Nat. Resour. Res. 2014, 24, 53–64. [Google Scholar] [CrossRef]
- Li, J. Quantitative Research on the Relationship between Chinese Energy Intensity and Economic Structure. Ph.D. Dissertation, Southwestern University of Finance and Economics, Chengdu, China, 2012. [Google Scholar]
- Wang, A.J.; Wang, G.S.; Zhou, F.Y. The limits and cycles of the growth of energy and mineral resources consumption. Acta Geosci. Sin. 2017, 38, 3–10. [Google Scholar]
- Jia, S.F.; Zhang, S.F.; Yang, H.; Xia, J. Relation of industrial water use and economic development: Water use Kuznets curve. J. Nat. Resour. 2004, 19, 279–284. [Google Scholar]
- Yao, J.W.; Xu, Z.K.; Wang, J.S. Perspective of the water demand of China by the mid 21th century. Adv. Water Sci. 1999, 10, 190–194. [Google Scholar]
- Qian, Z.Y.; Zhang, X.D. The Strategic Research Collection of Sustainable Development Water Resources in China; Water Conservancy and Hydropower Press: Beijing, China, 2001. [Google Scholar]
| Items | «Comprehensive Report of Strategy on Water Resources for China’s Sustainable Development» [14] | «Research on Water Resources and Sustainable Development Strategy in China» [15] | «Comprehensive National Water Resources Planning (2010–2030)» [16] | Actual Data | ||||
|---|---|---|---|---|---|---|---|---|
| 2010 | 2030 | 2020 | 2030 | 2020 | 2030 | 2010 | 2020 | |
| Total population (billion) | 1.37 | 1.55 | 1.45 | 1.52 | 1.44 | 1.5 | 1.34 * | 1.41 * |
| Urbanization rate | 40% | 52% | 52% | 60% | 56% | 63% | 49% * | 61% * |
| GDP (trillion ¥) | 19 | 54 | 57 | 107 | 56 | 105 | 41 * | 101 * |
| Three-industry structure | 12:49:39 | 8:49:44 | 4:46:50 | 9:47:44 * | 8:38:55 * | |||
| Effective irrigation area (million km2) | 56.5 | 58.6 | 58 | 60 | 59.4 | 62 | 60.3 * | 69.2 * |
| Water requirements for Industry (billion m3) | 149.8 | 191.1 | 165 | 170 | 160.5 | 171.8 | 144.7 ** | 103 ** |
| Water requirements for Agriculture (billion m3) | 421.9 | 425.7 | 400 | 400 | 421.8 | 414.9 | 368.9 ** | 361.2 ** |
| Water requirements for Domestic (billion m3) | 70.8 | 95.1 | 86 | 99 | 87.2 | 102.1 | 76.6 ** | 86.3 ** |
| Total water requirements (billion m3) | 642.4 | 711.9 | 650 | 680 | 696.4 | 719.2 | 602.2 ** | 581.3 ** |
| Items | 2020 * | 2025 | 2030 | 2035 | 2040 | 2045 | 2050 |
| GDP growth rate/% | 2.2 | 5 | 4 | 3 | 2 | 2 | 2 |
| GDP/trillion | 23.36 | 30.37 | 36.95 | 42.83 | 47.29 | 52.21 | 57.64 |
| Per capita GDP | 16,624 | 21,331 | 25,839 | 30,021 | 33,421 | 37,409 | 42,095 |
| Urbanization rate/% | 63.9 | 66.5 | 70.6 | 73.9 | 76.4 | 78.3 | 80 |
| Items 100 Million m3 | 1980 * | 2000 * | 2010 * | 2020 * | 2025 | 2030 | 2035 | 2050 |
|---|---|---|---|---|---|---|---|---|
| Agricultural water | 3900 | 3784 | 3783 | 3613 | 3454 | 3191 | 3035 | 2811 |
| Industrial water | 500 | 1139 | 1447 | 1030 | 1100 | 957 | 854 | 614 |
| Domestic water | 100 | 575 | 672 | 863 | 911 | 955 | 979 | 1014 |
| Ecological water | - | - | 120 | 307 | 364 | 426 | 481 | 608 |
| Total | 4500 | 5498 | 6022 | 5813 | 5828 | 5529 | 5349 | 5047 |
| Unit: m3 | 2000 * | 2020 * | 2035 | 2050 | ||||
|---|---|---|---|---|---|---|---|---|
| Water Sector | Consumption | Proportion | Consumption | Proportion | Consumption | Proportion | Consumption | Proportion |
| Agricultural water | 381 | 76% | 302 | 58% | 260 | 48% | 245 | 44% |
| Industrial water | 65 | 13% | 52 | 10% | 34 | 6% | 22 | 4% |
| Domestic water | 58 | 12% | 77 | 15% | 95 | 18% | 99 | 18% |
| Ecological water | - | - | 88 | 17% | 151 | 28% | 195 | 35% |
| Total | 504 | 100% | 518 | 100% | 540 | 100% | 562 | 100% |
| Unit: m3 | 2000 * | 2020 * | 2035 | 2050 | ||||
|---|---|---|---|---|---|---|---|---|
| Water Sector | Consumption | Proportion | Consumption | Proportion | Consumption | Proportion | Consumption | Proportion |
| Agricultural water | 708 | 89% | 712 | 82% | 586 | 75% | 537 | 70% |
| Industrial water | 50 | 6% | 34 | 4% | 23 | 3% | 16 | 2% |
| Domestic water | 38 | 5% | 52 | 6% | 77 | 10% | 89 | 12% |
| Ecological water | - | - | 67 | 8% | 92 | 12% | 121 | 16% |
| Total | 796 | 100% | 865 | 100% | 778 | 100% | 763 | 100% |
Disclaimer/Publisher’s Note: The statements, opinions and data contained in all publications are solely those of the individual author(s) and contributor(s) and not of MDPI and/or the editor(s). MDPI and/or the editor(s) disclaim responsibility for any injury to people or property resulting from any ideas, methods, instructions or products referred to in the content. |
© 2023 by the authors. Licensee MDPI, Basel, Switzerland. This article is an open access article distributed under the terms and conditions of the Creative Commons Attribution (CC BY) license (https://creativecommons.org/licenses/by/4.0/).
Share and Cite
Yan, Q.; Zhang, Y.; Wang, Q. Analysis of Demand and Structural Changes in China’s Water Resources over the Next 30 Years. Water 2023, 15, 745. https://doi.org/10.3390/w15040745
Yan Q, Zhang Y, Wang Q. Analysis of Demand and Structural Changes in China’s Water Resources over the Next 30 Years. Water. 2023; 15(4):745. https://doi.org/10.3390/w15040745
Chicago/Turabian StyleYan, Qiang, Yan Zhang, and Qingwei Wang. 2023. "Analysis of Demand and Structural Changes in China’s Water Resources over the Next 30 Years" Water 15, no. 4: 745. https://doi.org/10.3390/w15040745


