Article

Sorption Behavior and Prediction of Tetracycline on Sediments from the Yangtze Estuary and Its Coastal Areas

1
School of Chemistry and Chemical Engineering, Nanjing University of Science and Technology, Nanjing 210094, China
2
Nanjing Center, China Geological Survey, Nanjing 210016, China
3
East China Geological Science and Technology Innovation Center, Nanjing 210016, China
4
East China (Jiangsu) Public Technology Service Center of Environmental Geological Testing, Nanjing 210016, China
*
Author to whom correspondence should be addressed.
These authors contributed equally to this work.
Water 2023, 15(4), 671; https://doi.org/10.3390/w15040671
Submission received: 14 January 2023 / Revised: 1 February 2023 / Accepted: 3 February 2023 / Published: 8 February 2023
(This article belongs to the Special Issue Advances in Coastal Geomorphology, Morphodynamics and Sedimentology)

Abstract

:
Sediments represent the major sink of antibiotics in aquatic systems. However, few studies have proposed effective models that can predict the adsorption capacity of sediments through their physicochemical parameters. Here, 49 sediment samples were collected from different locations in the Yangtze Estuary and its adjacent coastal areas. The sediments were characterized, and their adsorption behavior towards tetracycline (TC) was investigated. It was found that both the Langmuir and Freundlich models fit the TC adsorption data well, and the sediments in the mud area showed the highest adsorption capacity. Subsequently, through correlation analysis for the adsorption coefficients and physicochemical parameters of sediments, 11 models were established to predict the adsorption coefficients (Kd), in which clay and cation exchange capacity played significant roles. When the salinity was increased from 0 to 32.79‰, the Freundlich adsorption coefficient (Kf) of TC for most sediments was reduced by more than75% (except sediment C6). Therefore, the methods provided herein can be helpful in predicting the sorption behavior of antibiotics with similar structures toward TC by sediments in this region.

1. Introduction

Antibiotics are widely used in human healthcare and animal agriculture. Due to the continuous development of agriculture and aquaculture, antibiotic abuse has resulted in large emissions of antibiotics into the environment [1,2]. In recent years, numerous antibiotics have been detected in different environmental compartments, including rivers [3,4], drinking water [5], soil [6], and sediments [7,8,9]. With the in-depth understanding of the environmental hazards of antibiotics, it has been widely accepted that excessive antibiotic discharge into the environment may induce the development of bacterial-resistant genes [10,11], which pose great threats toward humans and other creatures in the environment.
Among various antibiotics, Tetracycline compounds (TCs) are a globally used veterinary antibiotic used to improve growth rate and feed efficiency [1]. The usage of TCs in China was about 12,000 tons in 2013, representing 7.41% of the total antibiotics usage in that year [2]. Therefore, tetracycline residues are most commonly detected in major rivers, seas and sediments in China [12]. For instance, the concentration of TC in the sediments of Pearl River was detected with a median concentration of 4.97 ng/g, which was higher than that of other rivers, including the Yellow River and Liao River, due to the extensive usage of TC in aquaculture and the high adsorption capability of sediments toward TC in the Pearl River [12]. Adsorbed TCs in sediments are often not easily affected by common degradation processes, and their persistence in water environments often results in significant antibiotic accumulation. Therefore, the ecological risk of TCs in sediments cannot be ignored.
The distribution behaviors of TCs between the water and solid phases are often characterized by adsorption coefficients (Kd values) to facilitate the comparison of different adsorbents [13]. Conde-Cid et al. [14] found that Kd displays a wide order of magnitude range (102 < Kd < 105 L/kg) in different soils/sediments via data compilation. The reason for this phenomenon is that the physical and chemical properties of sediments vary in organic carbon (OC) content, cation exchange capacity (CEC), texture, pH, clay content, free/crystalline oxide content or environmental conditions (i.e., salinity, pH, ionic strength, temperature and flow rate). For example, the Kd of eight sediments in Taihu Lake China was determined to be 1600–15,400 L/kg, and the sediment with the highest CEC and organic carbon content in East Tai Lake showed the strongest sorption capacity [15]. Sassman and Lee [16] found that soils with a low pH and high CEC in the USA exhibited a Kd as high as 312,447 L/kg. Li et al. [17] found that soil with a high pH and low organic matter content exhibits a lower Kd value of just 154 L/kg. Furthermore, the sorption of TC and oxytetracycline on marine sediments was found to be decreased along with the increase in pH and salinity [18,19]. Based on the experimental results, several models have been built to predict the adsorption capacity of sediments toward antibiotics [20,21]. However, due to the limited number of samples collected, the models only consider a limited number of sediment parameters. Therefore, developing a statistical model based on largely increased samples to cover as many sediment parameters as possible is of great value to improve the accuracy of predicting TC adsorption behavior.
The Yangtze Delta is an important industrial and economic center in China, with an area of approximately 99 thousand km2 and a population of more than 75 million. This region is responsible for 18.7% of the national gross domestic product [7]. Moreover, with the high-speed development of this region, coastal marine environments and especially estuarine systems have been exposed to large quantities of pollutants mainly transported from land-based sources via river runoff and sewage outfalls [22,23]. It is important to note that TC concentrations were found to be higher than those of other antibiotics in Yangtze River sediments [12]. Because of complex hydrodynamic conditions and dramatic changes in salinity, the sediments in this region are significantly different from those in other regions. Although TC adsorption soil had been previously studied, studies about the behavior of TCs in river and coastal marine environments are still scarce. Therefore, in this study, we used batch-type experiments to study the TC adsorption capability of the 49 different collected sediments from the Yangtze Estuary and its coastal areas. The following investigations were conducted to (i) quantify sediment properties, including mineralogical composition, element composition, particle size distribution and some important chemical parameters; (ii) identify the physicochemical factors related to TC adsorption; (iii) develop a prediction model associated with sediment characteristics and TC adsorption; and (iv)define the effect of environmental factor salinity on antibiotic adsorption coefficients.

2. Materials and Methods

2.1. Study Area

The study area is located in the Yangtze Estuary and its coastal areas (121°10′~124°00′ E, 29°97′~31°75′ N) (Figure 1), where extensive tidal flats have developed along the east coast of China. The estuary is divided into the South Branch and North Branch by Chongming Island, and the South Branch is divided into the South Channel and the North Channel by Changxing Island and Hengsha Island.
Diluted Yangtze water (Figure 1) takes different routes depending on the season, with northeastward flows in summer and southward flows in winter [24]. In summer, the northward Taiwan warm current increases, and the Jiangsu coastal current decreases because of the prevailing southeast monsoon. Therefore, the transport of terrigenous particles from the Yangtze Estuary to the sea is obstructed in summer, and suspended sediments concentrate in the Yangtze Estuary, forming the Yangtze Estuary mud area. This area is where Yangtze River sediments accumulate before entering the sea and is also the location of the main convergence area of the East China Sea shelf carbon and related substances [24].
In the present research, estuary sediments B and C were collected from the North Channel and South Channel, respectively. Among them, the South Channel represents the trunk stream. Marine samples (including the mud area and O area) were collected from the estuarine inner shelf region of the East China Sea (ECS), which is a major sink of Yangtze-River-derived fine-grained sediments and associated organic materials [25].
Figure 1. Sampling sites in the estuary of the Yangtze River and its coastal area (mud areas are modified according to Liu et al. 2007 [26]).
Water 15 00671 g001

2.2. Sample Collection and Preparation

2.2.1. Sediment Samples

Sediment samples were sampled from 49 different sites in the Yangtze Estuary and its coastal areas in China in July 2016 (Figure 1). Samples were collected along with the fleet of the Institute of Oceanology, Chinese Academy of Sciences. Surface sediments (0–5 cm) were collected with a box dredger, packed in sealed plastic bags and stored in the refrigerator. After being transported back to the laboratory, the sediments were freeze-dried and sieved through 60-mesh sieves.
The 49 samples taken in the study area were divided into four areas: the B area (7 samples) and C area (7 samples) corresponding to the Yangtze Estuary; the M area (20 samples) in the Yangtze Estuary mud area; and the O area (15 samples) to the east of 123° E.

2.2.2. Seawater

Natural seawater (with a salinity of 32.69‰) was collected from the ECS (32° N, 123° E) and filtered through 0.45 mm membranes [27]. The salinity was measured with a lab salinometer (National Ocean Technology Center, Tianjin, China). Before use, seawater was irradiated with ultraviolet light [18]. Seawater was used as the medium to simulate the adsorption process of TC on marine sediments.

2.3. Chemical Reagents

Pure tetracycline hydrochloride was purchased from Rhawn (Shanghai, China). The TC standard was dissolved in ultrapure water (Millipore, Billerica, MA, USA) as a stock solution (1000 mg/L), which was stored at 4 °C in the dark. This stock solution was diluted to a series of concentrations with ultrapure water or artificial seawater consisting of 0.01 M CaCl2 for further use. Sodium hydroxide (GR) was obtained from Yonghua Chemical Co., Ltd. (Changshu, China). Hydrochloric acid (GR) and calcium chloride (GR) were from Nanjing Chemical Co., Ltd. (Nanjing, China). All solutions were prepared using ultrapure water (Millipore, Billerica, MA, USA). For pH adjustment, 0.01 M HCl or a NaOH solution was used.

2.4. Measurement and Characterization of Sediment Properties

The physicochemical properties of the sediments are listed in Table S1. The physiochemical properties of the collected sediments were analyzed following standard analytical methods. The mineral composition was estimated using the semi-quantitative analyses of X-ray diffractometer (D/Max-2500, Rigaku, Tokyo, Japan) patterns [27]. Particle diameters (D50) were determined using a laser particle size analyzer (Mastersizer2000, Malvern Panalytical, York, UK). The organic matter (OM) content of the sediments was measured with a carbon/sulfur determinator (CS230, LECO, St. Joseph, MO, USA). In addition, CEC experiments were performed using the hexamminecobalt trichloride solution spectrophotometric method (HJ889-2017). Elemental analysis was measured via an X-ray fluorescence (XRF) spectrometer (Axios4kw, Panalytical, Almelo, Netherlands). The functional groups of sediments and TC were measured via Fourier-transform infrared spectrometry(Nicolet iS10, ThermoFisher, Waltham, MA, USA).

2.5. Sorption Experiments

2.5.1. Sorption Isotherm Experiments

The sediment collected from station M19 was chosen to conduct the kinetic sorption experiments. A 200 mL volume of 30 mg/L TC and 0.2 g sediment were added to each Erlenmeyer flask. The pH of the solutions was maintained at 7.0 ± 0.1. In order to determine the equilibration time, the samples were shaken for 5, 10, 15, 30, 60, 120, 240, 480, 720 and 1440 min intervals at 20 °C in a GY2016-SW temperature-controlled shaking incubator (Changzhou Guoyu Appliance Co., Changzhou, China). Then, the samples were centrifuged at a speed of approximately 4000 rpm for 10 mins, using a centrifuge (Shanghai Anting Scientific Instrument Factory, Shanghai, China). The supernatant was filtered with a 0.22 μm organic filter and analyzed at 350 nm using an ultraviolet spectrophotometer (PERSEE, TU-1950, Beijing, China) according to a previously reported method [27]. A sorption equilibration time of TC on sediment M19 at 20 °C is shown in Figure 2.
As shown in Figure 2, from 0 to 60 min, the adsorption occurred quite rapidly and then changed to a slow adsorption stage from 60 to 720 min, finally reaching rough equilibrium at 720 min. Therefore, in the sorption isotherm experiments, samples were shaken for 720 min (12 h) at a constant temperature.

2.5.2. Kinetic Sorption Experiments

In these experiments, the TC stock solution was diluted with ultrapure water to prepare the working solutions. Final concentrations of TC in the reaction mixtures were 5, 10, 15, 20, 25 and 30 mg/L, respectively, and its ionic strength was 0.01 mol/L of CaCl2. A series of 100 mL TC solutions and 0.1 g sediment were mixed in 250 mL Erlenmeyer flasks. Then, they were shaken (180 rpm) in the dark at 20 °C. After 12 h, 10 mL of supernatant was taken out and tested according to Section 2.5.1. The two blank sorption experiments were conducted according to a previously published method [28]. The results show that TC loss was less than 3% over the whole experimental process, and the introduced TC content by the sediment or background solution was lower than the detection limit. Each adsorption experiment was conducted with three parallel tests to ensure the accuracy of the results.

2.5.3. Effects of Salinity

In estuary or coastal regions, salinity usually varied in a wide range due to the combined diluting effects of stream flow input and precipitation [29]. Additionally, salinity is the most important environmental factor affecting the adsorption of sediments toward antibiotics. Hence, we selected salinity as an environmental factor in our experiments.
According to the results of the sorption Isotherm Experiments, four samples, C6, M4, M14 and M19, with different gradient adsorption constants (Kd, M4 > M19 > M14 > C6), were selected to further investigate the influence of salinity on TC adsorption. The stock solution was diluted in artificial seawater to prepare the working solutions. An amount of 50 mL of TC working solutions (seawater proportion was 0%, 5%, 10%, 20%, 30%, 50% and 100%) were prepared with their pH adjusted to 7.5 ± 0.1. In addition, in order to investigate the influence of salinity on the adsorption capability of sediments at different concentrations, three different levels of 10, 30 and 60 mg/L were selected. Later, 0.1 g of sediment and different working solutions were placed into the Erlenmeyer flasks and shaken at 20 °C and 180 rpm.

2.5.4. Data Analysis Method

The Langmuir and Freundlich isotherm models (Equations (1) and (2)) are most commonly used when describing TC adsorption:
Q e = K l Q m C e 1 + K l C e
Q e = K f C e n
where Qe (mg/g) is the amount of TC adsorbed onto the sediment at equilibrium; Ce (mg/L) is the TC equilibrium concentration; Qm (mg/g) is the maximum adsorption capacity; Kl represents the Langmuir adsorption coefficient; Kf represents the Freundlich coefficient; and n is a characteristic constant reflecting the nonlinear degree of adsorption. The data were processed with Origin 2018, and the distribution map of sample sites was drawn using ArcGIS. SPSS 19.0 software was used to calculate Pearson’s correlations among adsorption parameters and sediment variables (CEC, D50, OM, mineral composition and elemental content).
Kd (antibiotic distribution constant) was calculated using Equation (3):
K d = q i C i
where qi (mg/g) is the equilibrium amount of TC adsorbed onto the sediment and Ci (mg/L) is the TC concentration at equilibrium. Later, correlation models were obtained through multiple linear regressions using SPSS 19.0.

3. Results and Discussion

3.1. Physicochemical Properties of Sediments

The main physicochemical parameters of sediments are shown in Table S1. The mean values of different parameters for the sediments (CEC, D50, OM, mineral composition and elemental composition) are presented in Table 1. Sediments from the B and M areas showed similar physicochemical properties. In addition, the physicochemical parameters of C sediments were similar to those of O sediments. Sediment CEC and clay contents were highly variable, ranging from 2.71 to 18.41% for CEC and from 8.0 to 78.0% for clay contents. The highest mean values for CEC (11.98 and 14.16 cmol/kg, respectively) were observed in sediments collected from the areas B and M. Moreover, sediments in the O area showed a moderate mean CEC value (7.36 cmol/kg), and sediments in the C area displayed the lowest CEC (4.75 cmol/kg). Moreover, the maximum clay content was observed in sediment B (47.86%), followed by M (41.00%), O (21.80%) and C (16.14%). Nevertheless, the quartz content in sediments followed the opposite order compared to the clay content. However, OM contents in all sediments were low, varying between 0.12 and 1.22%. The highest OM mean content was found in the B (0.98%) and M (0.93%) areas, followed by the O (0.61%) area, and the lowest OM was found in the C area (only 0.42%, less than half of B). The difference in OM contents for these sediments was likely caused by the different clay content because the interlayer structure of clay can adsorb organic compounds.
With respect to particle size, the mean D50 values of sediments O and C (154.81 and 130.71 μm) were much greater than the values of M and B (45.61 and 36.35 μm). This result suggests that particle sizes in the M and B areas were smaller than those in the O and C areas. Except for SiO2, the content of other elements in the M and B areas was higher than that in the O and C areas. In this research, the identified chemical elements in the sediments were strongly influenced by sediment grain size. It was found that the contents of Al2O3, Fe2O3, MgO, K2O, Cu, Pb and Zn gradually increased along with the decrease in particle size, whereas the content of SiO2, CaO and Na2O decreased as particle size decreased.
In the Yangtze Estuary, the B sediments from the North Channel displayed high CEC, OM values, clay and elemental content (such as, Al2O3, Fe2O3 and Cu). On the other hand, they presented low D50 values, quartz and SiO2 content. The lowest CEC, OM and clay content values, as well as the highest quartz and SiO2 levels, were observed in the C sediments from the South Channel. These results are explained by the location of the sediments. In the case of the South Channel located in the trunk stream of the Yangtze River, coarse-grained sediments are rapidly deposited because of changes in hydrodynamic conditions. On the other hand, fine fractions continue southward along the Yangtze River. Moreover, the North Channel has weak hydrodynamic forces, and large amounts of fine clay are deposited herein.
Outside the Yangtze Estuary, contrary to the O sediments, the D50, quartz and SiO2 content in the M sediments from the Yangtze Estuary mud area were relatively low, whereas CEC, OM, clay content and most metals (listed in Table 1) displayed high values. This might be due to the strong blocking effect of the Taiwan warm current.

3.2. Adsorption Isotherms

The Langmuir model in Equation (1), the Freundlich model in Equation (2), and the Kd values of 49 sediments are summarized in Table 2. As seen in Table 2, the adsorption of TC is fitted quite well by Freundlich isotherms (R2 = 0.82–0.99), and they can also be fitted to Langmuir isotherms with very small errors (R2 = 0.84–1.00). This means that the adsorption of TC was a complex process of physical adsorption and chemical adsorption. However, for 37 sediment samples, the R2 values of the Freundlich equation were not as good as those obtained with the Langmuir model. Thus, physical adsorption played a major role in this process. The sorption isotherm for TC displayed a Langmuir-type shape, suggesting that sorption occurred at a limited number of sorption sites on the surface of the clay minerals.
It should be mentioned that the TC adsorption results obtained in the present research were more compatible with the Langmuir model compared to those published in other studies [22]. It is very likely that particle size exhibited a substantial influence on antibiotic adsorption. It has been previously reported that, when the particle size is >63 μm, the adsorption of most sediments fits well with the Langmuir model [30]. In the present experiments, the D50 of most sediment samples was greater than 63 μm (Table S1).
Kd values had minor differences, owing to the different initial TC concentration, as shown in Table S2 with Kd and Qe values at different initial concentrations of TC (5, 10, 15, 20, 25 and 30 mg/L). It is more appropriate to choose the average value (Kd-mean) to represent the adsorption capacity of the sediment. As seen in Table 2, the Kd-mean values different areas were in the following order: M area (0.49–1.78) > B area (0.44–1.70) > O area (0.31–0.94) > C area (0.072–0.15). In general, sediments in the M and B areas displayed higher adsorption capacities, and sediments in the O area presented an intermediate adsorption capacity. In addition, the lowest capacity was observed in the C sediments, which were mainly sand. This likely occurred because of the influence of land and ocean interactions on the physicochemical characteristics of sediments, which in turn affected their adsorption capacity.
Table S3 represents a comparison of the Langmuir adsorption coefficients (Kl), maximum adsorption capacities (Qm), Freundlich adsorption coefficients (Kf) and characteristic constants (n) of different adsorbents for TC adsorption. As noted above, in the Langmuir model, Kl values ranged from 0.01 to 0.49 L/mg (average 0.068), which are similar to those reported by Xu and Li [31] in marine sediments (Kl between 0.04 and 0.15 L/mg, average 0.09). However, our Kl values were slightly lower than those found by Huang et al. [21] (Kl between 0.06 and 0.28 L/mg, average 0.18, n = 12). Moreover, the Qm values ranged from 1.13 to 67.5 mg/g in this work. Previously, Xu and Li [31] obtained Qm values between 16.7 and 33.3 mg/g in marine sediments, whereas the Qm values were 10.2–40.7 mg/g in river sediments [21]. Compared to previous studies, it is obvious that Qm varied in a wide range (the lowest value is an order of magnitude lower than the others) because most Qm values of C sediments were lower than 10 mg/g.
In the Freundlich model, the Kf values obtained in this study were 0.29–5.30 Ln mg1−n g−1. In other studies, the Kf values for TC were 0.24–1.60 Ln mg1−n g−1 for soil [32], 2.39–4.27 Ln mg1−n g−1 for river sediment [21] and 1.12–2.29 for marine sediment [31]. In view of this, it can be seen that the range of Kf variation in this work is higher than that in previous reports but is in a similar range to the values 0.71–7.10 Ln mg1−n g−1 reported by Conde-Cida et al. [33], likely because both of them used a large number of samples (n = 49 and 63, respectively). As seen in Table 2 and Table S3, the n values ranged from 0.26 to 0.89 (average 0.43), indicating that the adsorption curves were nonlinear.

3.3. Pearson Correlation Analyses

The adsorption parameters (Kd-mean, Qm and Kf) were selected to analyze their correlations with the physicochemical properties of the sediments (Table 3). In general, most of the physicochemical parameters exhibited a significant effect on Kd and Kf values (For convenience, all following uses of kd in this manuscript refer to Kd-mean.) and a tiny effect on Qm values. As shown in Table 3, the most important positive descriptors found were CEC, clay contents, Al2O3, Cu and Fe2O3, K2O and OM. However, the adsorption of sediments toward TC presented a negative correlation with D50, quartz and SiO2 content.
The correlation coefficient of CEC with Kd (0.816) displayed the highest value among all the parameters, demonstrating that CEC has a significant effect on TC adsorption. This result is consistent with that obtained by Ji et al. [15]. They studied the sorption of eight different sediments for TC and found that the sediment in East Taihu Lake with the highest CEC exhibited the highest TC sorption capacity. Additionally, Teixidó et al. [32] found that the sorption of soil toward TC is governed by CEC (dominant at acidic–neutral soil pH). At the pH values of our experiments (7.0 ± 0.1), TC contained about 75% neutral zwitterions and 25% zwitteranions with a net negative charge [16]. Therefore, cation exchange and surface complexation are the major adsorption mechanisms.
Likewise, clay content is another major positive parameter in TC adsorption, which is similar to previous results [16]. Al-Wabel et al. [34] studied chlortetracycline adsorption by 10 different natural clay sediment samples and found that the CTC removal efficiency was positively correlated with the clay contents of the sediments.
The contents of Al2O3, Fe2O3, MgO, Cu and Pb, which are related to the sediment types and average particle size, also displayed a significant effect on the Kd value. Al is the characteristic element in clay minerals, and the correlation between these elements and Al2O3 indicates that they are all clay-friendly. In the estuarine area, Cu, Pb and other metal ions were easily adsorbed on the surface of fine sediments. The influence of metal cations on the adsorption of TC antibiotics was investigated. TCs are known to complex with divalent and trivalent cations (metal ions), owing to multiple O- and N-containing functional groups in TCs [35,36]. For example, it was observed that the increase in TC adsorption is related to the formation of TC–Cd2+ complexes [19]. Similar studies conducted by Zhao et al. 2011 [37] also found that Cu2+ can greatly enhance the adsorption capacity of kaolinite by acting as a bridge ion between TC species and the edge sites of kaolinite.
Previous studies have reported that organic matter is a key factor for controlling the adsorption behavior of TCs by different kinds of soils [14,38] and sediments [19], which is also in concordance with our findings in this work. For example, Xu and Li [31] found that the OM of the sediments has a profound effect on the sorption of TC. Differently, other scientists observed that the adsorption of oxytetracycline by clay may be increased or decreased in the presence of dissolved organic matter, depending on the quantity and pH of the medium [39]. In this work, it is worth noting that the correlation coefficient of OM with Kd (0.692) was lower than that of other parameters, likely due to the lower OM content of sediments (Table 1).

3.4. Model Fitting

SPSS multiple linear regressions were used to develop the TC adsorption model, selecting the adsorption coefficients (Kd) as the dependent variable and sediment physicochemical parameters as the independent variables [21,40]. Table 4 shows 11 different prediction models used for the TC adsorption of the sediments in the Yangtze Estuary and its adjacent coastal areas in our work. The data showed that each prediction model displayed R2 values of more than 0.628 (Table 4), which indicated a good fit for TC adsorption. As Table 4 shows, the 11 models that considered CEC, clay and Pb displayed the highest R2 values (R2= 0.764). Furthermore, nine fitting equations used clay and other parameters, and the other two used SiO2 and other parameters. In addition, the R2 value of the clay model (R2 = 0.764–0.648) was larger than that of the elemental content model (R2 = 0.628–0.634). These results demonstrate that clay content had a significant impact on the adsorption behavior of TC by sediments in the Yangtze Estuary and its adjacent coastal areas. Moreover, the adsorption equation based on elemental content (e.g., SiO2, Al2O3, and Cu) was also feasible.
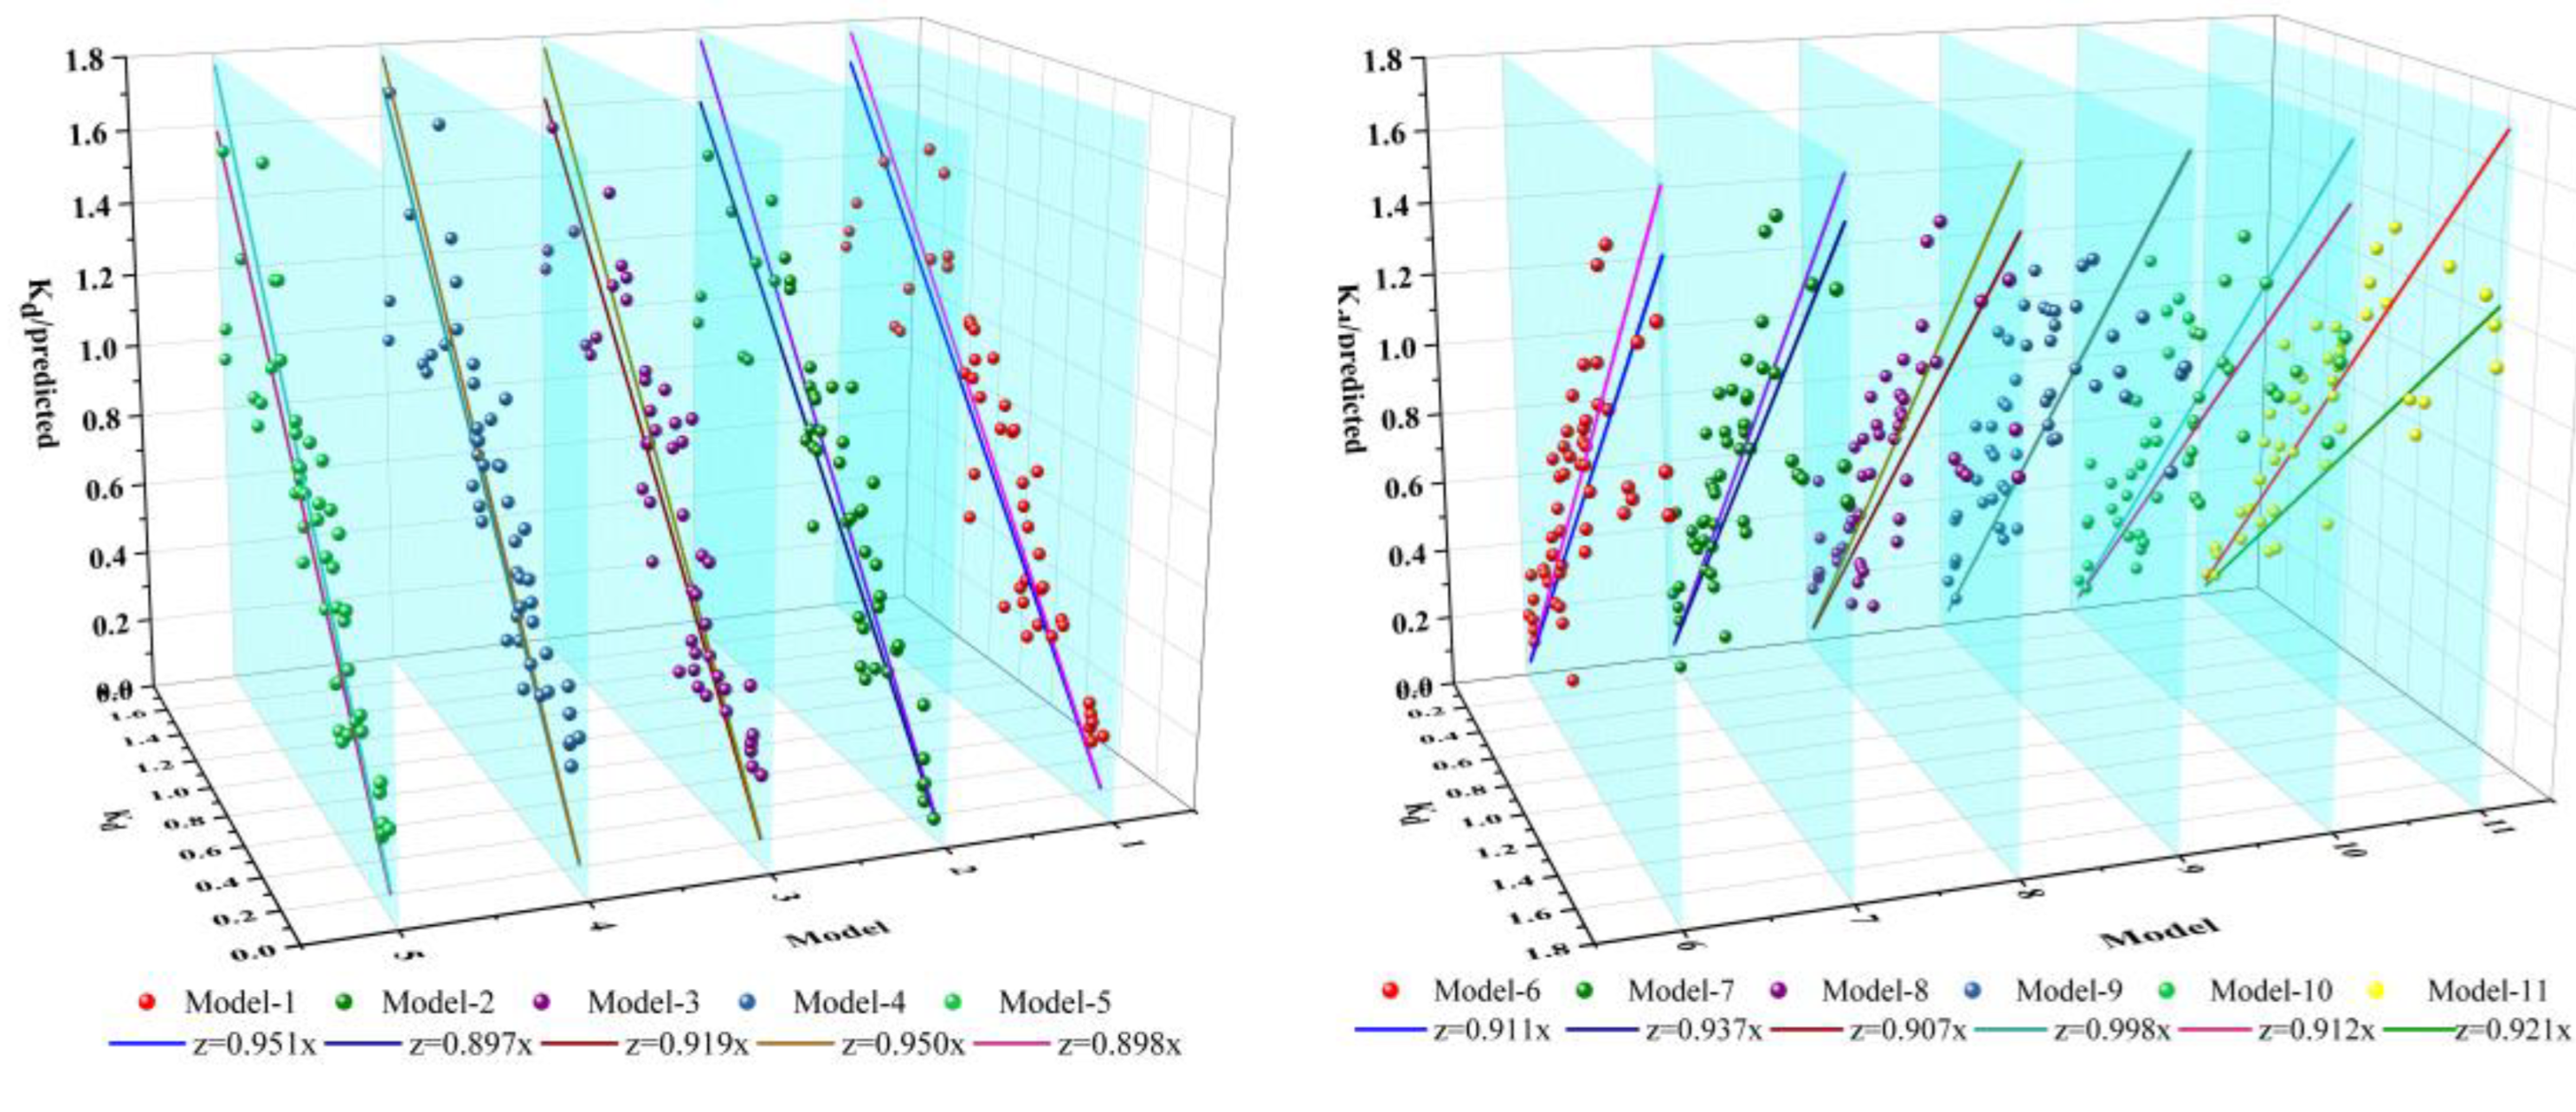
All 11 models shown in Table 4 were used to predict the Kd values of the 49 sampling sites. The Kd values obtained in our experiments were plotted against the predicted values. The results are shown in Figure 3. Herein, the linear fitting between the predicted and observed Kd values was performed using y = x as a reference [21]. It was observed that the predicted Kd values were consistent with the corresponding actual values, indicating that it is feasible to use the calculated values and the ten models to accurately predict the Kd values.

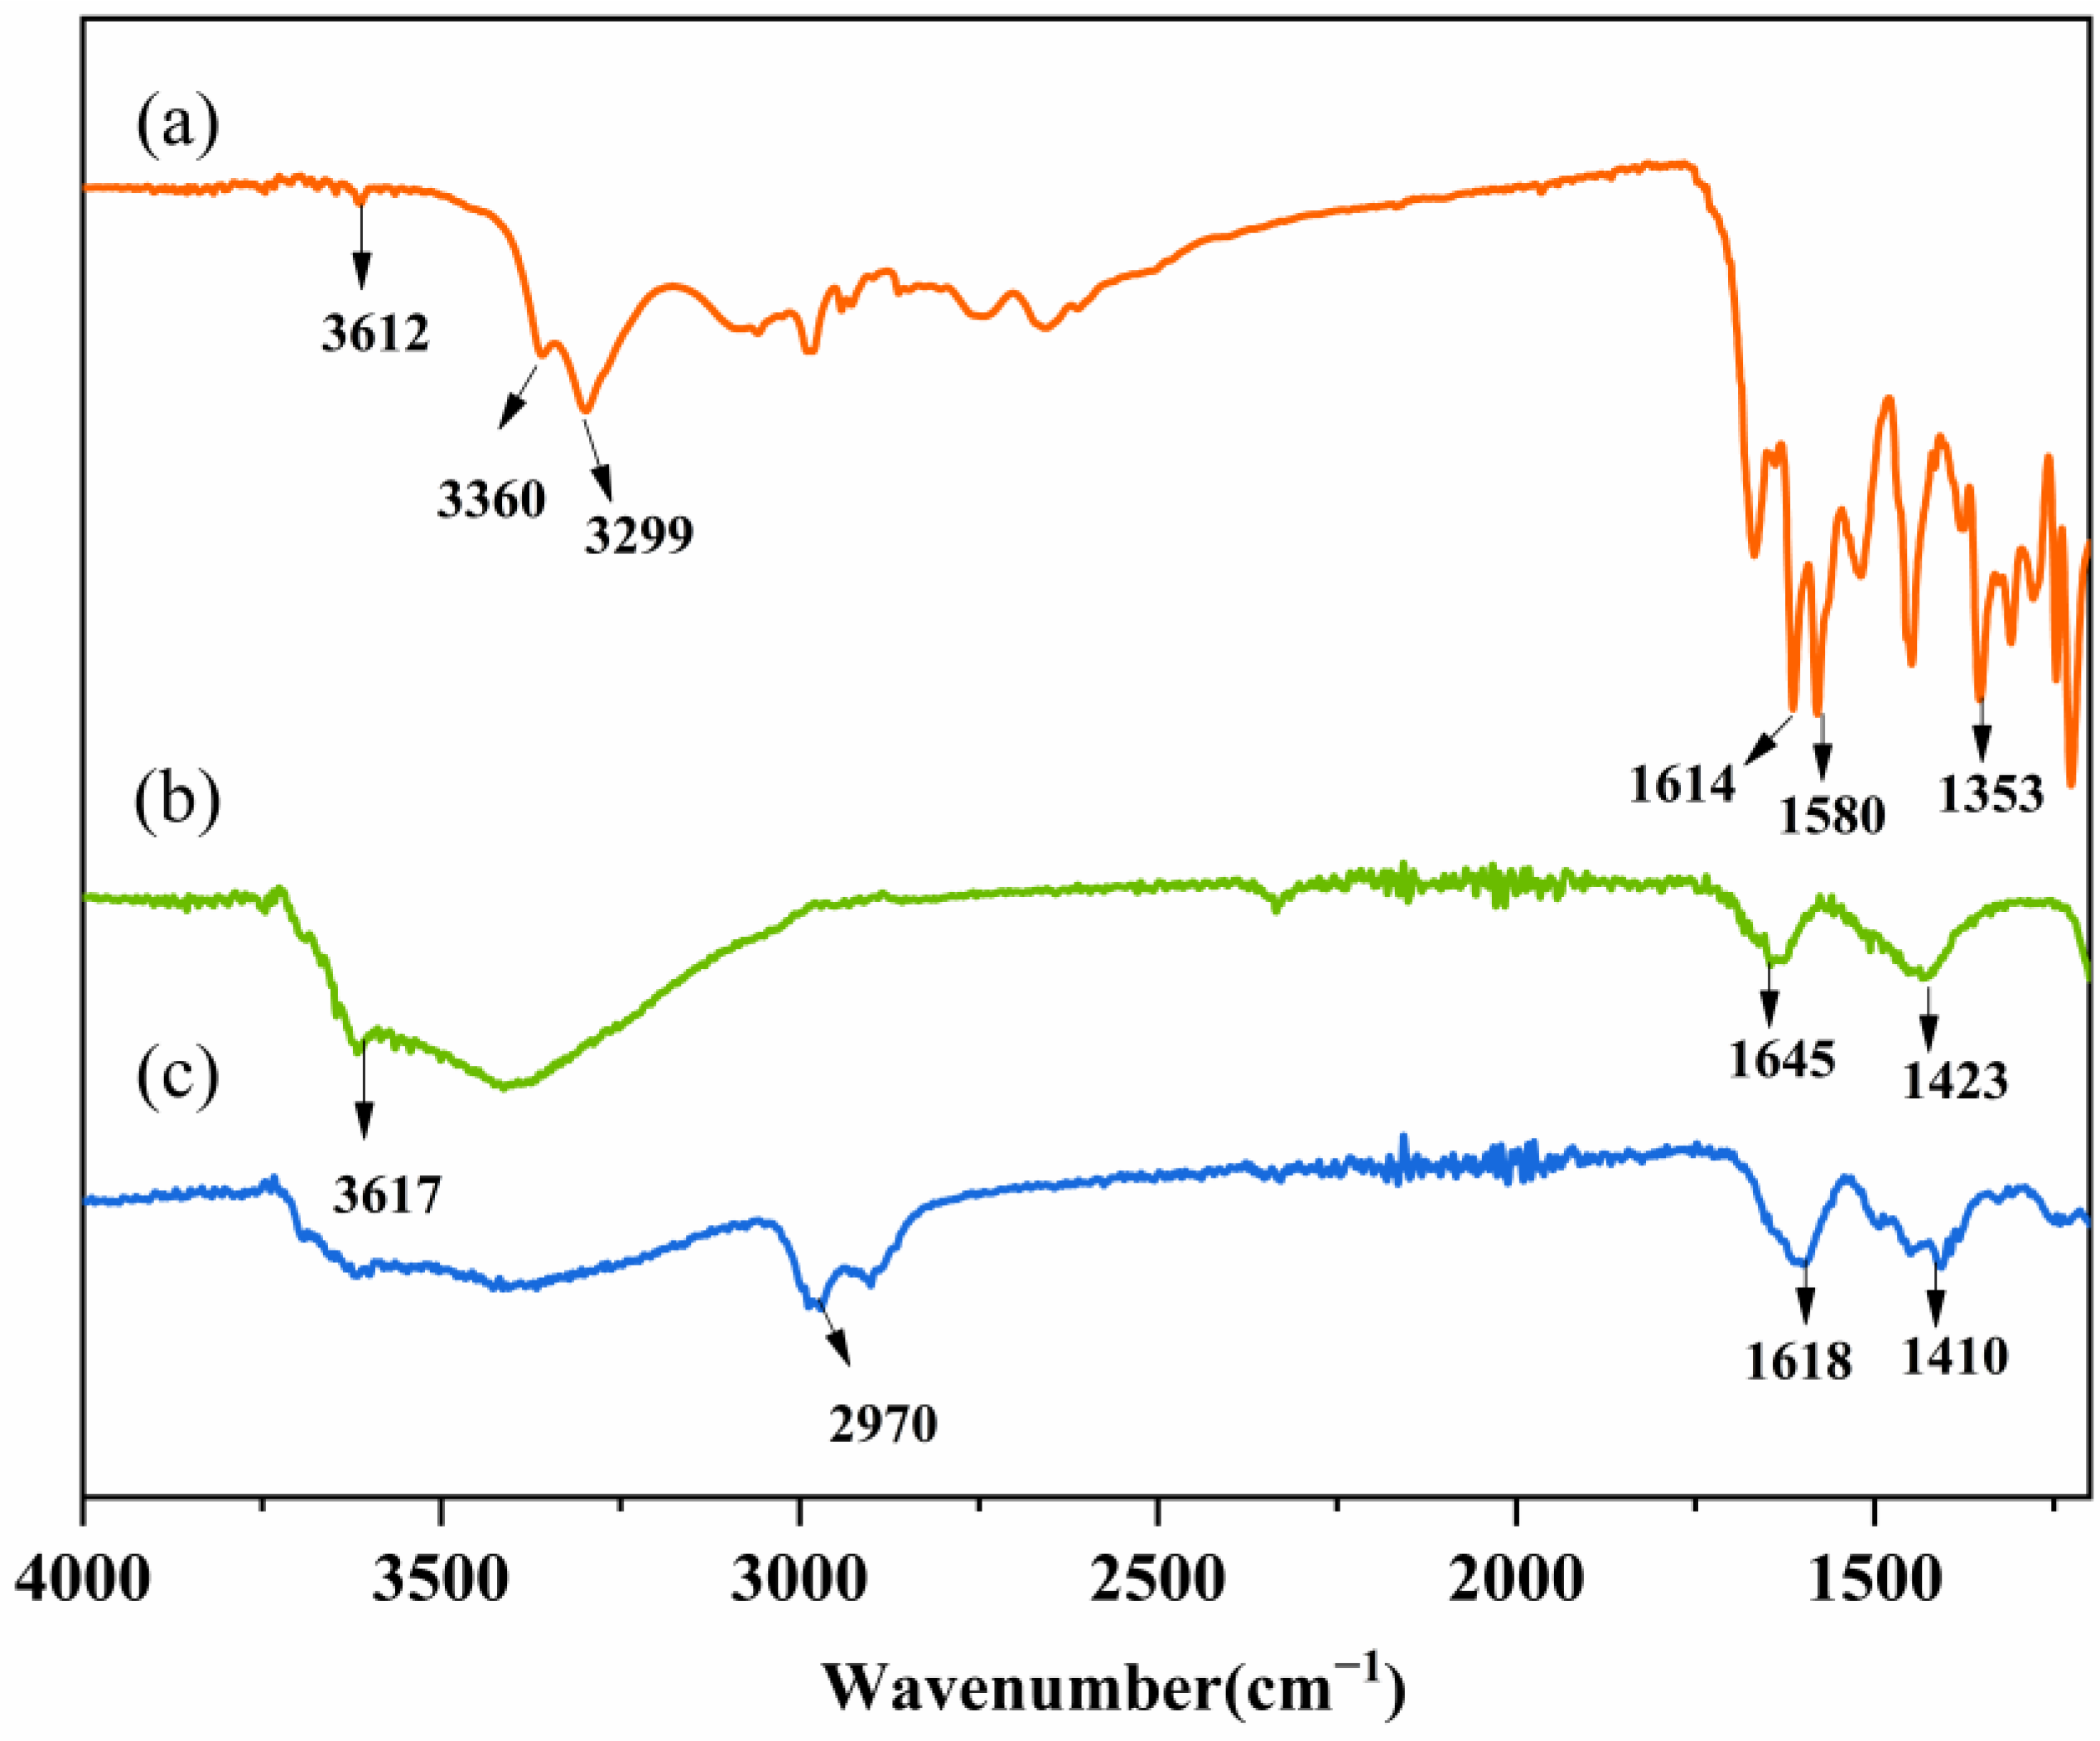
3.5. Fourier-Transform Infrared Analysis

Sediment M4 was selected to study the changes in FTIR spectra before and after TC adsorption on sediments. Figure 4a describes the FTIR spectra of tetracycline. The peaks of 3612 cm−1 and 3300 cm−1 were assigned to the hydroxyl (O–H) and amine groups [41]. The band at 1664 cm−1 was attributed to Amide I mode of the amide group, and the 1616 and 1579 cm−1 bands were attributed to carbonyl groups (C=O) [42]. Figure 4b shows the FTIR spectra of sediment M4. Various oxygen-containing functional groups, such as O-H, amide and C=O groups, showed peaks at 3617 cm−1, 1645 cm−1 and 1423 cm−1, respectively [21]. Figure 4c shows the FTIR spectra of TC-adsorbed sediment M4 at a pH of 7.0. Three changes were found after the adsorption of TC onto the sediment. First, a decrease in relative peak intensity of O–H at 3617 cm−1 was observed. Second, a new peak at 2970 cm−1 indicated the formation of a complex with TC. Finally, the band of amide shifted from 1645 cm−1 to a lower frequency of 1618 cm−1, and the C-O band shifted from 1423 cm−1 to 1410 cm−1, indicating that the oxygen-containing functional groups participated in hydrogen bonding.

3.6. Effect of Salinity on TC Adsorption

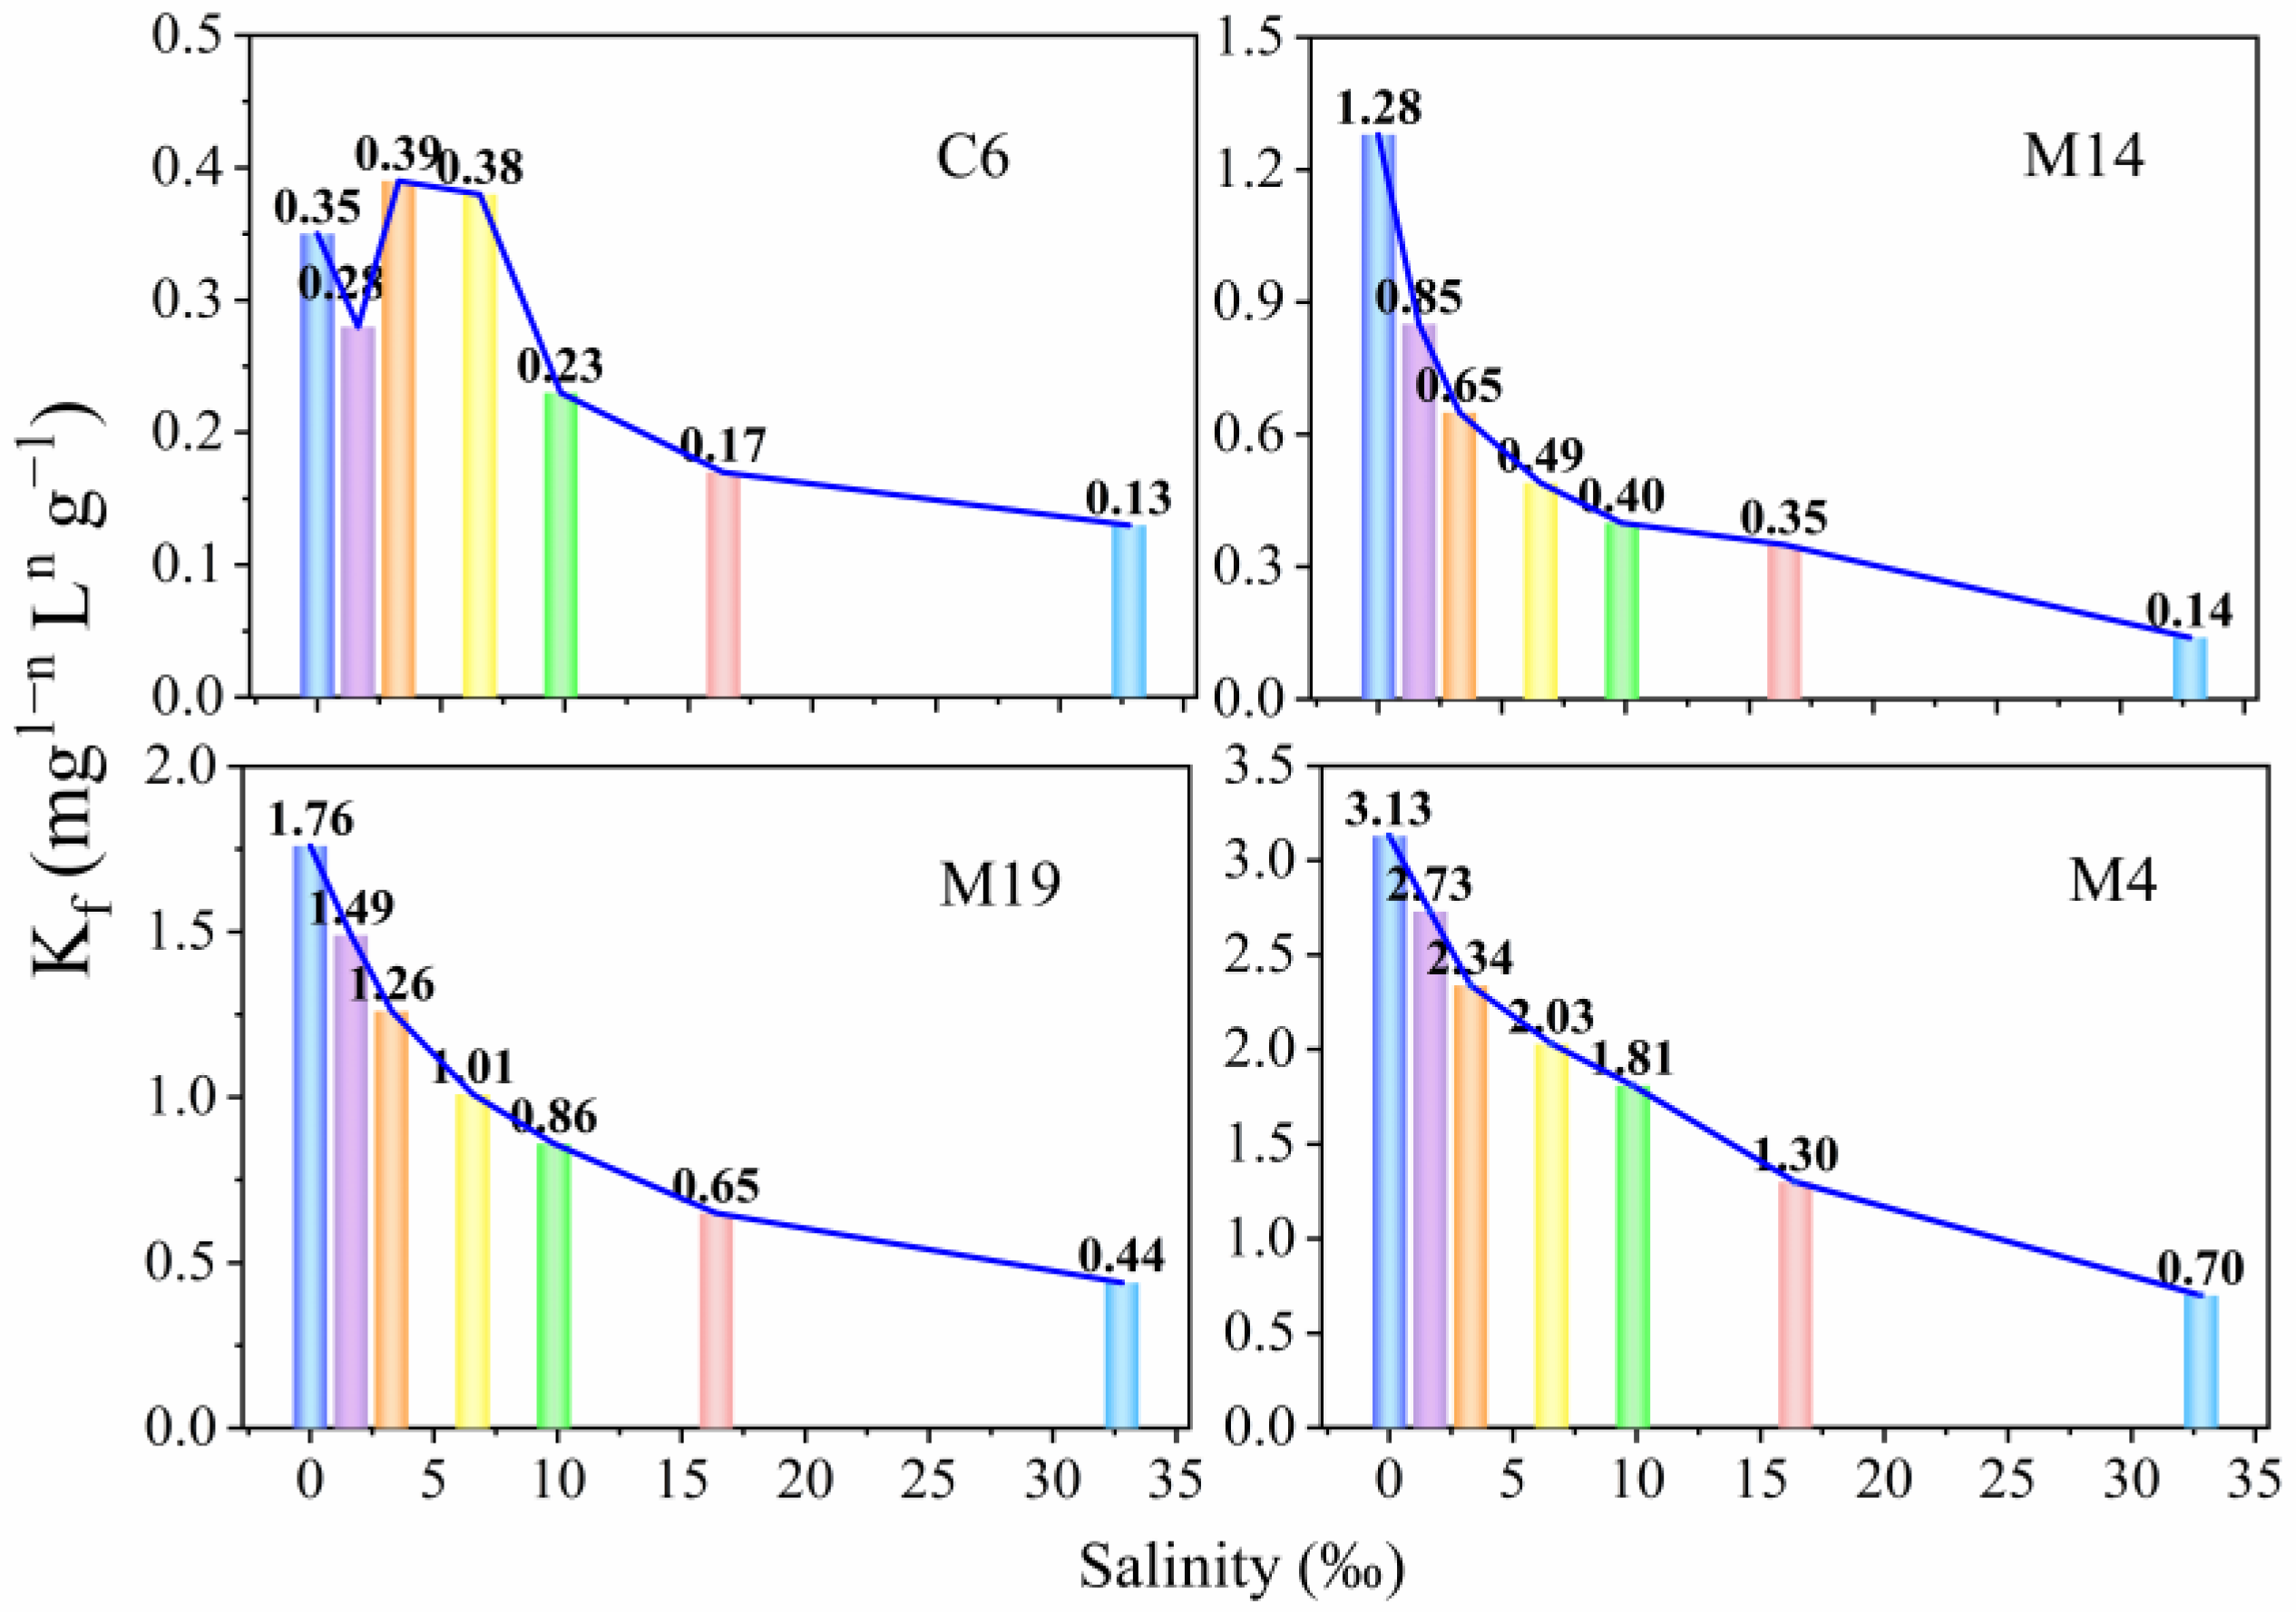
It is well known that salinity can affect the sorption behavior of organic pollutants in aquatic systems. Figure 5 shows the Freundlich coefficient Kf of TC for sediments C6, M14, M4 and M19 at different salinities. As a result, except for C6, the Kf values of sediments decreased along with the decrease in salinity. It is worth noting that, for the C6 sample, when the seawater salinity increased from 0 to 6.56‰, Kf decreased first and then increased. The seawater salinity increased from 6.56 to 32.79‰, whereas Kf decreased continuously. The reason for this phenomenon may be that C6 sample had a coarse particle size, most of which was sand, and the initial adsorption capacity was very low. When the salinity changed slightly, the results did not change much. For other samples, when the salinity increased by 50% (from 0 to 16.40‰), Kf decreased significantly from 1.28 to 0.35 mg1−nLng−1 for M14 (equivalent to 72.8%), from 1.76 to 0.65 mg1−nLng−1 for M19 (62.9%) and from 3.13 to 1.30 mg1−nLng−1 for M4 (58.6%), revealing that the samples with strong adsorption capacities were less affected by salinity. Moreover, when salinity increased 100% (32.79‰), the Kf values all reduced by more than 75%.
This phenomenon can be mainly explained by cation exchange [31]. With the increase in salinity, the sediment surface is negatively charged because of the homogeneous replacement of clay minerals and hydroxyl dehydrogenation, allowing the adsorption of a large number of hydrated K+ and Na+ ions in seawater. TC sorption by marine sediments decreased because this antibiotic competed with K+ and Na+ for ion-exchangeable sites. Furthermore, it was reported that, under high-ionic-strength conditions, hydrophilic interactions between antibiotic molecules may exceed the electrostatic repulsion, favoring the aggregation of antibiotic molecules [43]. Thus, it can be deduced that, when TC adsorbed particles are transported from rivers to estuary areas where seawater intersects, the increased salinity causes TC desorption and redissolving.

4. Conclusions

(a)
The TC adsorption capacity was closely related to the physical and chemical properties of sediments, varying with sediment location. Sediments in the B and M areas displayed a relatively high adsorption capacity, and sediments in the O area showed moderate adsorption capacity. In addition, sediments in the C area displayed the lowest adsorption capacity of the four studied areas.
(b)
The physicochemical properties (CEC, OM, Clay, Cu, Al, Fe and K) of sediments were positively correlated with Kd and negatively correlated with SiO2, quartz and D50. Among them, CEC and clay displayed the highest correlation coefficient, indicating that they play key roles in the adsorption behaviors of TC by these sediments.
(c)
The ten Kd models obtained in the present research provided the tools for predicting the Kd values of contaminants similar in structure to TC by sediments of the Yangtze River estuary and its adjacent aquatic ecosystems.
(d)
The adsorption capacity of TC by estuary and marine sediments decreased as salinity increased. Because of the low salinity and high adsorption capacity of the sediments, significant amounts of TC are adsorbed by sediment B in the estuary. Moreover, in the M area near the coast, TC adsorbed by suspended sediment particles flows into the seawater. However, most TC is continuously desorbed and released to seawater upon salinity changes. Therefore, antibiotic risk in the B and M areas needs to be focused.

Supplementary Materials

The following supporting information can be downloaded at https://www.mdpi.com/article/10.3390/w15040671/s1: Table S1: Values of physicochemical parameters of sediments from various regions of Yangtze River estuary; Table S2: Partition coefficients (Kd) and adsorption capacities (Qe) for three different initial TC concentrations (5, 10, 15, 20, 25 and 30 mg/L); Table S3: Comparison of Langmuir adsorption coefficients (Kl), maximum adsorption capacities (Qm), Freundlich adsorption coefficients (Kf) and characteristic constants (n) of different adsorbents for TC adsorption.

Author Contributions

Validation, methodology, software and writing—review and editing, H.C. and W.Z.; conceptualization, W.Z.; visualization, H.H., L.S. and H.C.; writing—original draft preparation, H.C.; data curation and investigation, W.L., H.C. and S.Z.; formal analysis, R.S., F.Z. and X.S.; resources, X.S.; supervision and funding acquisition, M.L. All authors have read and agreed to the published version of the manuscript.

Funding

This research was funded by the National Natural Science Foundation of China, grant number 21975127, and China Geological Survey, grant numbers DD 20190354 and DD 20221756.

Data Availability Statement

The data presented in this study are available upon request from the corresponding author or the first author.

Conflicts of Interest

The authors declare no conflict of interest.

References

  1. Sarmah, A.K.; Meyer, M.T.; Boxall, A.B. A global perspective on the use, sales, exposure pathways, occurrence, fate and effects of veterinary antibiotics (VAs) in the environment. Chemosphere 2006, 65, 725–759. [Google Scholar] [CrossRef] [PubMed]
  2. Zhang, Q.; Ying, G.; Pan, C.; Liu, Y.; Zhao, J. Comprehensive Evaluation of Antibiotics Emission and Fate in the River Basins of China: Source Analysis, Multimedia Modeling, and Linkage to Bacterial Resistance. Environ. Sci. Technol. 2015, 49, 6772–6782. [Google Scholar] [CrossRef] [PubMed]
  3. Luo, Y.; Xu, L.; Rysz, M.; Wang, Y.; Zhang, H.; Alvarez, P.J.J. Occurrence and Transport of Tetracycline, Sulfonamide, Quinolone, and Macrolide Antibiotics in the Haihe River Basin, China. Environ. Sci. Technol. 2011, 45, 1827–1833. [Google Scholar] [CrossRef] [PubMed]
  4. Wang, Z.; Du, Y.; Yang, C.; Liu, X.; Zhang, J.Q.; Li, E.H.; Zhang, Q.; Wang, X.L. Occurrence and ecological hazard assessment of selected antibiotics in the surface waters in and around Lake Honghu, China. Sci. Total Environ. 2017, 609, 1423–1432. [Google Scholar] [CrossRef] [PubMed]
  5. Liu, Y.; Feng, M.; Wang, B.; Zhao, X.; Guo, R.; Bu, Y.; Zhang, S.; Chen, J. Distribution and potential risk assessment of antibiotic pollution in the main drinking water sources of Nanjing, China. Environ. Sci. Pollut. Res. 2020, 27, 21429–21441. [Google Scholar] [CrossRef]
  6. Wei, R.; He, T.; Zhang, S.; Zhu, L.; Shang, B.; Li, Z.; Wang, R. Occurrence of seventeen veterinary antibiotics and resistant bacterias in manure-fertilized vegetable farm soil in four provinces of China. Chemosphere 2019, 215, 234–240. [Google Scholar] [CrossRef]
  7. Shi, H.; Yang, Y.; Liu, M.; Yan, C.X.; Yue, H.Y.; Zhou, J.L. Occurrence and distribution of antibiotics in the surface sediments of the Yangtze Estuary and nearby coastal areas. Mar. Pollut. Bull. 2014, 83, 317–323. [Google Scholar] [CrossRef]
  8. Liu, X.; Zhang, H.; Li, L.; Fu, C.; Tu, C.; Huang, Y.; Wu, L.; Tang, J.; Luo, Y.; Christie, P. Levels, distributions and sources of veterinary antibiotics in the sediments of the Bohai Sea in China and surrounding estuaries. Mar. Pollut. Bull. 2016, 109, 597–602. [Google Scholar] [CrossRef]
  9. Liu, K.; Yin, X.; Zhang, D.; Yan, D.; Cui, L.; Zhu, Z.; Wen, L. Distribution, sources, and ecological risk assessment of quinotone antibiotics in the surface sediments from Jiaozhou Bay wetland, China. Mar. Pollut. Bull. 2018, 129, 859–865. [Google Scholar] [CrossRef]
  10. Nava, A.R.; Daneshian, L.; Sarma, H. Antibiotic resistant genes in the environment-exploring surveillance methods and sustainable remediation strategies of antibiotics and ARGs. Environ. Res. 2022, 215, 114212. [Google Scholar] [CrossRef]
  11. Luo, Y.; Mao, D.Q.; Michal, R.; Zhou, Q.X.; Zhang, H.J.; Xu, L.; Alvarez, P.J.J. Trends in Antibiotic Resistance Genes Occurrence in the Haihe River, China. Environ. Sci. Technol. 2010, 44, 7220–7225. [Google Scholar] [CrossRef]
  12. Li, S.; Shi, W.; Liu, W.; Li, H.; Zhang, W.; Hu, J.; Ke, Y.; Sun, W.; Ni, J. A duodecennial national synthesis of antibiotics in China’s major rivers and seas (2005–2016). Sci. Total Environ. 2018, 615, 906–917. [Google Scholar] [CrossRef]
  13. Na, C.-J.; Yoo, M.-J.; Tsang, D.C.W.; Kim, H.W.; Kim, K.-H. High-performance materials for effective sorptive removal of formaldehyde in air. J. Hazard. Mater. 2019, 366, 452–465. [Google Scholar] [CrossRef]
  14. Conde-Cid, M.; Ferreira-Coelho, G.; Núñez-Delgado, A.; Fernández-Calviño, D.; Arias-Estévez, M.; Álvarez-Rodríguez, E.; Fernández-Sanjurjo, E.M.J. Competitive adsorption of tetracycline, oxytetracycline and chlortetracycline on soils with different pH value and organic matter content. Environ. Res. 2019, 178, 1–12. [Google Scholar] [CrossRef]
  15. Ji, L.; Zhao, T.; Deng, L.; Ashraf, M.A. Sorption of tetracycline, oxytetracycline and tylosin to eight surface sediments of Taihu Lake. J. Environ. Biol. 2016, 37, 1087–1095. [Google Scholar]
  16. Sassman, S.A.; Lee, L.S. Sorption of Three Tetracyclines by Several Soils: Assessing the Role of pH and Cation Exchange. Environ. Sci. Technol. 2005, 39, 7452. [Google Scholar] [CrossRef]
  17. Li, Y.; Pan, T.; Miao, D.; Chen, Z.; Tao, Y. Sorption–Desorption of Typical Tetracyclines on Different Soils: Environment Hazards Analysis with Partition Coefficients and Hysteresis Index. Environ. Eng. Sci. 2015, 32, 865–871. [Google Scholar] [CrossRef]
  18. Li, J.; Zhang, H. Adsorption-desorption of oxytetracycline on marine sediments: Kinetics and influencing factors. Chemosphere 2016, 164, 156–163. [Google Scholar] [CrossRef]
  19. Zhang, G.; Liu, X.; Sun, K.; Zhao, Y.; Lin, C. Sorption of tetracycline to sediments and soils: Assessing the roles of pH, the presence of cadmium and properties of sediments and soils. Front. Environ. Sci. Eng. China 2010, 4, 421–429. [Google Scholar] [CrossRef]
  20. Zhao, S.; Liu, X.; Cheng, D.; Liu, G.; Liang, B.; Cui, B.; Bai, J. Temporal–spatial variation and partitioning prediction of antibiotics in surface water and sediments from the intertidal zones of the Yellow River Delta, China. Sci. Total Environ. 2016, 569–570, 1350–1358. [Google Scholar] [CrossRef]
  21. Huang, Y.; Wang, Y.; Huang, Y.; Zhang, L.; Ye, F.; Wang, J.; Shang, J.; Liao, Q. Impact of sediment characteristics on adsorption behavior of typical antibiotics in Lake Taihu, China. Sci. Total Environ. 2020, 718, 137329. [Google Scholar] [CrossRef] [PubMed]
  22. Yan, C.; Yang, Y.; Zhou, J.; Liu, M.; Nie, M.; Shi, H.; Gu, L. Antibiotics in the surface water of the Yangtze Estuary: Occurrence, distribution and risk assessment. Environ. Pollut. 2013, 175, 22–29. [Google Scholar] [CrossRef] [PubMed]
  23. Xu, J.; Zou, H.; Wang, J. Pollution status and potential sources of main heavy metals in the main stream of the Yangtze River. East China Geol. 2021, 42, 21–28. [Google Scholar]
  24. Cong, J.; Hu, G.; Jonell, T.N.; Yuan, Z.; Kong, X.; Zhang, Y.; Wang, Y. Centurial Evolution of an Offshore Mud Deposition Area in the Changjiang (Yangtze) Estuary and Its Links to Environmental and Anthropogenic Activities. J. Ocean. Univ. China 2020, 19, 790–800. [Google Scholar] [CrossRef]
  25. Hu, L.; Shi, X.; Yu, Z.; Lin, T.; Wang, H.; Ma, D.; Guo, Z.; Yang, Z. Distribution of sedimentary organic matter in estuarine–inner shelf regions of the East China Sea: Implications for hydrodynamic forces and anthropogenic impact. Mar. Chem. 2012, 142–144, 29–40. [Google Scholar] [CrossRef]
  26. Liu, J.P.; Xu, K.H.; Li, A.C.; Milliman, J.D.; Velozzi, D.M.; Xiao, S.B.; Yang, Z.S. Flux and fate of Yangtze River sediment delivered to the East China Sea. Geomorphology 2007, 85, 208–224. [Google Scholar] [CrossRef]
  27. Wang, A.; Wang, Z.; Liu, J.; Xu, N.; Li, H. The Sr/Ba ratio response to salinity in clastic sediments of the Yangtze River Delta. Chem. Geol. 2021, 559, 119923. [Google Scholar] [CrossRef]
  28. Li, J.; Zhang, H. Factors influencing adsorption and desorption of trimethoprim on marine sediments: Mechanisms and kinetics. Environ. Sci. Pollut. Res. 2017, 24, 21929–21937. [Google Scholar] [CrossRef]
  29. Sumner, D.M.; Belaine, G. Evaporation, Precipitation, and Associated Salinity Changes at a Humid, Subtropical Estuar. Estuaries 2005, 28, 844–855. [Google Scholar] [CrossRef]
  30. Luo, Y.; Chen, J.; Wu, C.; Zhang, J.; Tang, J.; Shang, J.; Liao, Q. Effect of particle size on adsorption of norfloxacin and tetracycline onto suspended particulate matter in lake. Environ. Pollut. 2019, 244, 549–559. [Google Scholar] [CrossRef]
  31. Xu, X.; Li, X. Sorption and desorption of antibiotic tetracycline on marine sediments. Chemosphere 2010, 78, 430–436. [Google Scholar] [CrossRef]
  32. Teixidó, M.; Granados, M.; Prat, M.D.; Beltrán, J.L. Sorption of tetracyclines onto natural soils: Data analysis and prediction. Environ. Sci. Pollut. Res. 2012, 19, 3087–3095. [Google Scholar] [CrossRef]
  33. Conde-Cida, M.; Fernández-Calviño, D.; Nóvoa-Muñoz, J.C.; Núñez-Delgado, A.; Fernández-Sanjurjo, M.J.; Arias-Estévez, M.; Álvarez-Rodríguez, E. Experimental data and model prediction of tetracycline adsorption and desorption in agricultural soils. Environ. Res. 2019, 177, 108607. [Google Scholar] [CrossRef]
  34. Al-Wabel, M.I.; Ahmad, M.; Usman, A.R.A.; Sallam, A.S.; Hussain, Q.; Binyameen, R.B.; Shehu, M.R.; Ok, Y.S. Evaluating the efficiency of different natural clay sediments for the removal of chlortetracycline from aqueous solutions. J. Hazard. Mater. 2020, 384, 121500. [Google Scholar] [CrossRef]
  35. Wang, H.; Yao, H.; Sun, P.; Li, D.; Huang, C.-H. Transformation of Tetracycline Antibiotics and Fe(II) and Fe(III) Species Induced by Their Complexation. Environ. Sci. Technol. 2015, 50, 145–153. [Google Scholar] [CrossRef]
  36. Wang, H.; Yao, H.; Sun, P.; Pei, J.; Li, D.; Huang, C.-H. Oxidation of tetracycline antibiotics induced by Fe(III) ions without light irradiation. Chemosphere 2015, 119, 1255–1261. [Google Scholar] [CrossRef]
  37. Zhao, Y.; Geng, J.; Wang, X.; Gu, X.; Gao, S. Tetracycline adsorption on kaolinite: pH, metal cations and humic acid effects. Ecotoxicology 2011, 20, 1141–1147. [Google Scholar] [CrossRef]
  38. Bao, Y.; Zhou, Q.; Wang, Y. Adsorption characteristics of tetracycline by two soils: Assessing role of soil organic matter. Aust. J. Soil Res. 2009, 47, 286–295. [Google Scholar] [CrossRef]
  39. Kulshrestha, P.; Giese, R.F.; AGA, D.S. Investigating the Molecular Interactions of Oxytetracycline in Clay and Organic Matter: Insights on Factors Affecting Its Mobility in Soil. Environ. Sci. Technol. 2004, 38, 4097–4105. [Google Scholar] [CrossRef]
  40. Al-Khazrajy, O.S.A.; Boxall, A.B.A. Impacts of compound properties and sediment characteristics on the sorption behaviour of pharmaceuticals in aquatic systems. J. Hazard. Mater. 2016, 317, 198–209. [Google Scholar] [CrossRef]
  41. Wan, Y.; Bao, Y.; Zhou, Q. Simultaneous adsorption and desorption of cadmium and tetracycline on cinnamon soil. Chemosphere 2010, 80, 807–812. [Google Scholar] [CrossRef] [PubMed]
  42. Shanmukh, S.; Dluhy, R.A. 2D IR analyses of rate processes in lipid–antibiotic monomolecular films. Vib. Spectrosc. 2004, 36, 167–177. [Google Scholar] [CrossRef]
  43. Turku, I.; Sainio, T.; Paatero, E. Thermodynamics of tetracycline adsorption on silica. Environ. Chem. Lett. 2007, 5, 225–228. [Google Scholar] [CrossRef]
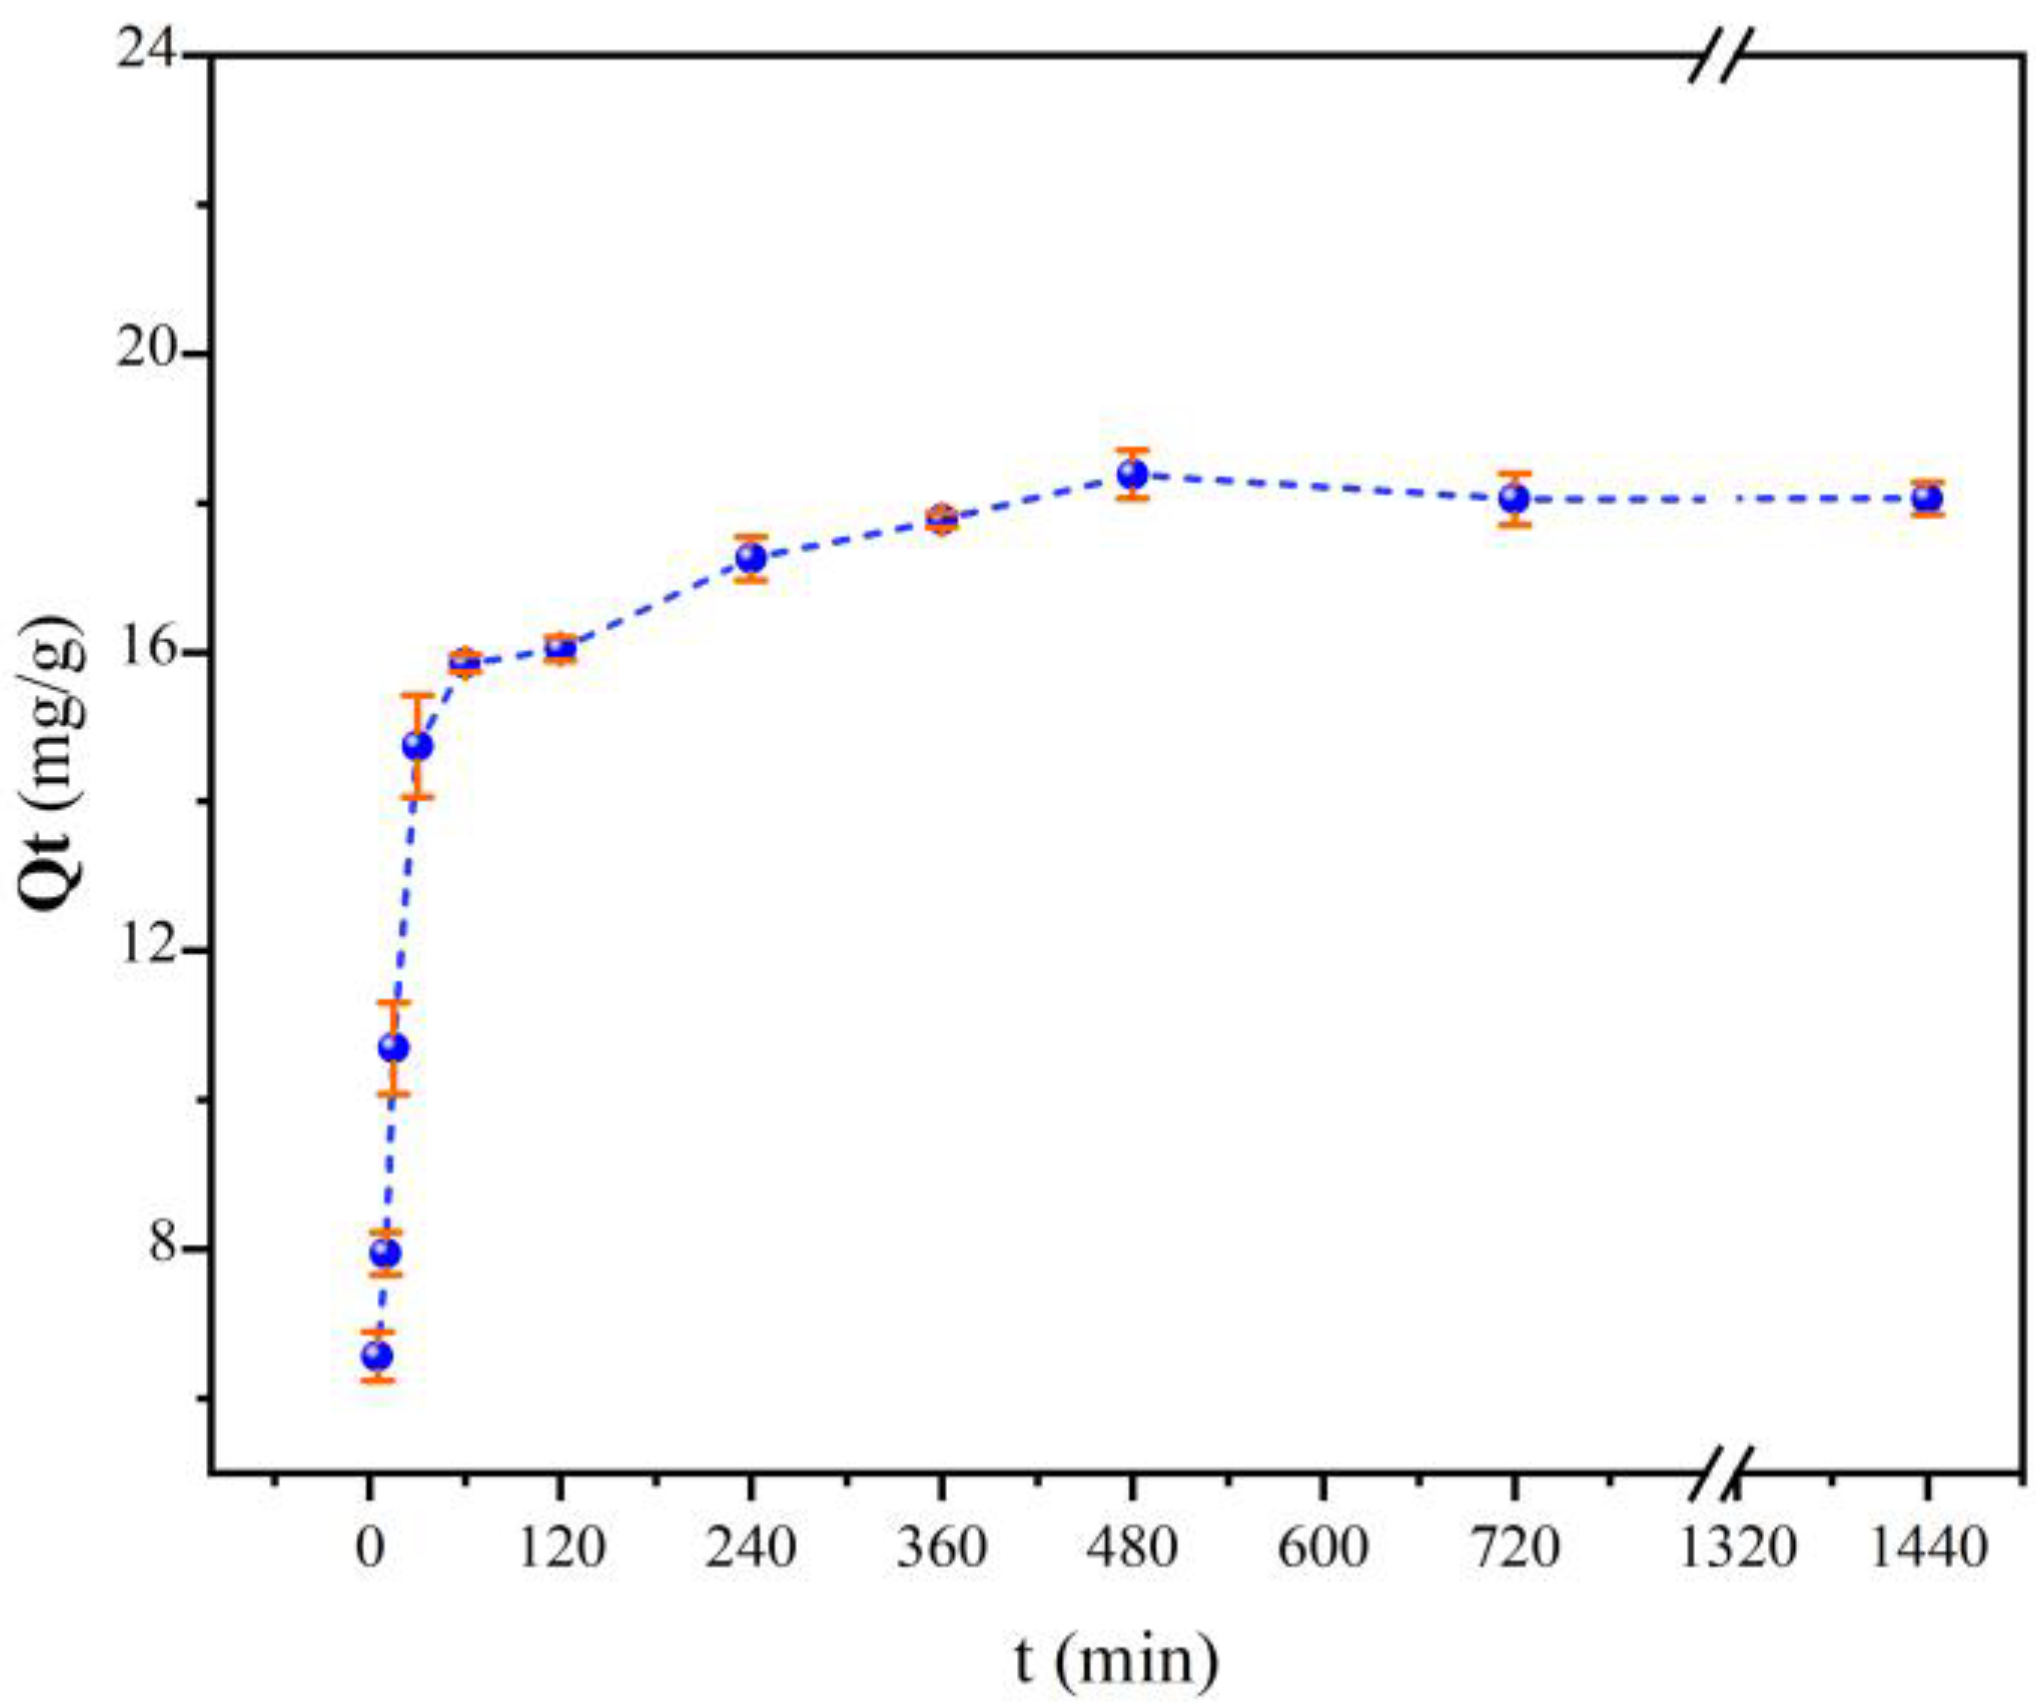
Figure 2. Sorption equilibration time of TC on sediments at 20 °C.
Water 15 00671 g002
Figure 3. Correlation between experimentally obtained Kd values and predicted Kd values.
Water 15 00671 g003
Figure 4. FTIR spectra of: (a) TC; (b) sediment M4; and (c) TC-adsorbed sediment M4.
Water 15 00671 g004
Figure 5. Freundlich coefficient Kf of TC for sediments C6, M14, M4 and M19 at different salinities.
Water 15 00671 g005
Table 1. Mean values of physicochemical parameters of sediments from various locations of Yangtze Estuary.
AreaCEC
(cmol/kg)
D50OMMineralogical Composition (%)Major Elements (%)Trace Elements
(µg/g)
(μm)(%)ClayQuartzOthersSiO2Al2O3Fe2O3K2OCuZnPb
B Area11.9836.350.9847.8629.7117.4357.2813.255.422.7630.0091.9927.19
C Area4.75130.710.4216.1456.0024.7165.899.244.122.1112.6158.3120.20
M Area14.1645.610.9341.0030.2023.3553.8213.095.452.8730.2290.9728.29
O Area7.36154.810.6121.8046.2029.0759.9810.143.962.4310.7659.8324.09
Others: calcite, feldspar, goethite, aragonite, augite; (D50) Particle diameter; Organic matter (OM); Cation exchange capacity (CEC); Mud area (M).
Table 2. Values of Langmuir and Freundlich parameters obtained in the present research.
SedimentsLangmuirFreundlichKd-mean (L/g)
Kl (L/mg)qm (mg/g)R2Kf (mg1−nLng−1)nR2
B10.07 ± 0.0114.37 ± 1.630.981.42 ± 0.170.60 ± 0.050.960.57
B20.17 ± 0.0212.76 ± 0.850.982.65 ± 0.350.46 ± 0.070.900.92
B30.03 ± 0.0144.63 ± 6.661.001.70 ± 0.170.82 ± 0.040.991.21
B40.07 ± 0.0123.96 ± 2.270.991.91 ± 0.130.71 ± 0.030.991.11
B50.49 ± 0.1213.05 ± 1.110.895.30 ± 0.630.30 ± 0.0600.821.70
B60.10 ± 0.0216.38 ± 1.500.981.99 ± 0.330.59 ± 0.060.960.88
B70.07 ± 0.0311.29 ± 1.880.961.06 ± 0.320.60 ± 0.100.920.44
C10.06 ± 0.023.76 ± 0.910.900.29 ± 0.080.62 ± 0.100.850.13
C20.03 ± 0.027.21 ± 3.140.930.29 ± 0.080.76 ± 0.110.910.15
C30.04 ± 0.015.45 ± 1.260.950.32 ± 0.080.68 ± 0.100.890.14
C40.31 ± 0.061.13 ± 0.070.900.45 ± 0.020.26 ± 0.020.970.07
C50.10 ± 0.033.03 ± 0.330.920.53 ± 0.150.43 ± 0.090.860.13
C60.09 ± 0.033.24 ± 0.390.940.48 ± 0.070.49 ± 0.050.960.14
C70.15 ± 0.0512.98 ± 1.520.952.46 ± 0.580.48 ± 0.090.910.89
M10.03 ± 0.0131.87 ± 6.260.981.24 ± 0.180.77 ± 0.060.980.77
M20.07 ± 0.0223.93 ± 4.030.972.07 ± 0.430.66 ± 0.090.941.07
M30.06 ± 0.0322.38 ± 6.150.921.80 ± 0.480.66 ± 0.110.900.88
M40.06 ± 0.0235.44 ± 8.690.972.41 ± 0.50.72 ± 0.090.951.51
M50.10 ± 0.0216.78 ± 1.840.982.03 ± 0.340.58 ± 0.070.960.91
M60.21 ± 0.0716.53 ± 3.230.943.20 ± 0.150.60 ± 0.040.981.75
M70.11 ± 0.0426.65 ± 4.310.963.69 ± 0.750.56 ± 0.080.941.77
M80.08 ± 0.0227.36 ± 4.200.972.58 ± 0.360.67 ± 0.070.941.37
M90.03 ± 0.0267.53 ± 56.510.951.88 ± 0.350.84 ± 0.090.961.41
M100.03 ± 0.0237.04 ± 21.60.931.32 ± 0.440.79 ± 0.130.930.85
M110.05 ± 0.0225.78 ± 5.430.971.56 ± 0.120.74 ± 0.040.980.93
M120.05 ± 0.0215.00 ± 4.390.911.05 ± 0.330.65 ± 0.120.890.49
M130.01 ± 0.0157.69 ± 31.310.980.84 ± 0.130.70 ± 0.090.980.69
M140.01 ± 0.0164.86 ± 44.80.980.86 ± 0.180.64 ± 0.040.980.63
M150.05 ± 0.0330.74 ± 11.870.911.97 ± 0.430.79 ± 0.050.941.18
M160.11 ± 0.0221.36 ± 1.810.992.50 ± 0.170.62 ± 0.110.981.33
M170.03 ± 0.0134.77 ± 6.910.991.39 ± 0.180.81 ± 0.030.990.89
M180.09 ± 0.0416.94 ± 4.610.881.79 ± 0.470.63 ± 0.060.860.71
M190.04 ± 0.0138.17 ± 5.590.991.55 ± 0.110.89 ± 0.060.991.08
M200.07 ± 0.0215.59 ± 1.990.981.44 ± 0.230.88 ± 0.070.970.65
O10.08 ± 0.0211.34 ± 1.370.981.21 ± 0.170.60 ± 0.060.960.53
O20.15 ± 0.0514.48 ± 1.990.903.06 ± 0.760.44 ± 0.100.820.94
O30.03 ± 0.0016.15 ± 1.281.000.75 ± 0.090.71 ± 0.040.990.37
O40.03 ± 0.0125.86 ± 3.900.990.83 ± 0.090.79 ± 0.040.990.53
O50.03 ± 0.0121.48 ± 3.780.981.02 ± 0.110.71 ± 0.040.990.54
O60.03 ± 0.0125.59 ± 5.150.990.94 ± 0.140.76 ± 0.050.990.56
O70.10 ± 0.026.64 ± 0.570.971.09 ± 0.110.48 ± 0.050.940.31
O80.11 ± 0.049.55 ± 1.500.861.75 ± 0.350.44 ± 0.080.820.51
O90.02 ± 0.0130.40 ± 15.010.970.69 ± 0.130.81 ± 0.070.980.45
O100.10 ± 0.0112.40 ± 0.920.981.78 ± 0.070.53 ± 0.020.990.65
O110.09 ± 0.029.83 ± 0.690.981.31 ± 0.180.52 ± 0.050.980.46
O120.03 ± 0.0216.78 ± 5.450.950.80 ± 0.160.72 ± 0.070.970.43
O130.04 ± 0.0313.01 ± 6.330.840.66 ± 0.250.71 ± 0.150.820.32
O140.08 ± 0.0312.64 ± 1.960.951.54 ± 0.430.55 ± 0.10.900.56
O150.07 ± 0.0320.05 ± 3.970.971.95 ± 0.420.63 ± 0.090.950.86
Kd -mean: mean Kd values for different initial concentrations of TC (5, 10, 15, 20, 25 and 30 mg/L).
Table 3. Correlation between adsorption parameters and physicochemical properties of sediments.
ParametersCECClayOMD50QuartzSiO2Al2O3Fe2O3K2OMgOCuPb
Kd-mean0.816 **0.795 **0.692 **−0.612 **−0.739 **−0.724 **0.750 **0.717 **0.713 **0.612 **0.751 **0.596 **
Kf0.558 **0.666 **0.528 **−0.380 **−0.577 **−0.528 **0.540 **0.506 **0.487 **0.401 **0.540 **0.445 **
Qm0.345 *0.322 *0.219−0.255−0.310 *−0.2520.299 *0.302 *0.346 *0.339 *0.2280.186
* Correlation is significant at the 0.05 level (two-tailed), ** Correlation is significant at the 0.01 level (two-tailed).
Table 4. Prediction models of TC adsorbed on estuary and marine sediments.
ModelsFitting EquationsPropertiesR2
Model 1Kd = −0.080 + 0.011Clay + 0.048CECClay, CEC0.726
Model 2Kd = 2.039 + 0.015Clay − 0.031SiO2Clay, SiO20.716
Model 3Kd = −0.052 + 0.014Clay + 0.016CuClay, Cu0.723
Model 4Kd = 0.307 + 0.018Clay − 0.001D50Clay, D500.657
Model 5Kd = −0.127 + 0.016Clay + 0.456OMClay, OM0.648
Model 6Kd = −0.593 + 0.014Clay + 0.076Al2O3Clay, Al2O30.698
Model 7Kd = −0.693 + 0.016Clay + 0.362K2OClay, K2O0.688
Model 8Kd = −0.480 + 0.015Clay + 0.154Fe2O3Clay, Fe2O30.691
Model 9Kd = 1.449 + 0.098Al2O3 − 0.030SiO2Al2O3, SiO20.634
Model 10Kd = 2.147 − 0.031SiO2 + 0.019CuSiO2, Cu0.628
Model 11Kd = −0.499 + 0.030CEC + 0.012Clay + 0.021PbClay, CEC, Pb0.764
Disclaimer/Publisher’s Note: The statements, opinions and data contained in all publications are solely those of the individual author(s) and contributor(s) and not of MDPI and/or the editor(s). MDPI and/or the editor(s) disclaim responsibility for any injury to people or property resulting from any ideas, methods, instructions or products referred to in the content.