Article

Influence of the Combined Magnetic Field and High Dilution Technology on the Intrinsic Emission of Aqueous Solutions

Institute of Cell Biophysics RAS, Federal Research Center “Pushchino Scientific Center for Biological Research of the Russian Academy of Sciences”, Pushchino 142290, Russia
Water 2023, 15(3), 599; https://doi.org/10.3390/w15030599
Submission received: 30 December 2022 / Revised: 27 January 2023 / Accepted: 31 January 2023 / Published: 3 February 2023

Abstract

:
Liquids prepared by sequential multiple dilutions with mechanical action (highly diluted or HD solutions) are able to influence certain properties of adjacent solutions without direct contact, which is mediated by their emission in the infrared (IR) frequency range. These properties do not manifest when HD solutions are prepared in a geomagnetic field-free chamber. Here we studied the influence of a magnetic field and the intensity of mechanical treatment on the intrinsic emission of HD solutions of antibodies (Ab) to IFNγ and their effect on the adjacent water. IR-emission spectra were recorded using a Fourier-transform IR spectrometer. Magnetic field treatment reduced the intrinsic emission intensity of all HD samples; non-contact incubation with HD Ab prepared with intense (iHD Ab) shaking or gentle (gHD Ab) mixing reduced the emission intensity of HD water as well. The emission intensity of intact water was affected only by iHD Ab. Pre-treatment of HD Ab with a magnetic field did not modify their non-contact effect on intact water. We confirmed the presence of a non-contact effect and determined what factors it depends on (treatment with a magnetic field and the intensity of shaking when preparing HD solutions). The intensity of water emission both in the presence of HD Ab and in the presence of a magnetic field changes in a similar way.

1. Introduction

Water possesses many unusual properties that distinguish it from other liquids. Physical parameters such as boiling and melting points, features such as shrinkage on melting, unusually low compressibility, etc., make this substance unique [1]. Physical influences (i.e., temperature, pressure, solutes, and external fields) have been found to alter water characteristics by disturbing or rearranging its hydrogen bond network. Besides that, due to the delocalization of electrons held among water molecules, water can interact with external fields, i.e., electric field, magnetic field (MF), and electromagnetic field (EMF). Subsequently, under the effect of external fields, the hydrogen bond network is reshaped, which can be detected by various methods [2]. For example, radiofrequency EMF treatment of distilled water has been shown to alter its power density spectrum for tens of minutes after exposure [3]. Chibowski et al. [4] revealed the effect of EMF on the rate of water evaporation and surface tension. The electric field, in turn, increases gas uptake and stabilizes nanobubbles in water [5]. Several studies have shown the effect of an MF on the physicochemical properties of aqueous solutions. For example, Sronsri et al. [6] found changes in electron distribution, molecular dipole moment, molecular polarization, heat capacity, and salt solubility upon application of an MF; Wu et al. [7] noted the effect of an MF on pH and electrical conductivity; and Wang et al. [8] determined a change in the thermodynamic characteristics of the boiling process.
The characteristics of external fields capable of exerting an effect on aqueous solutions can vary greatly. For example, impacts can be high-intensity [5] or super-weak [9], fields can be constant [10], variable [11], or even pulsating [12]. However, among a variety of field parameters, it is possible to single out some common characteristics. For example, special frequencies of a weak MF were revealed, which surprisingly coincided with the frequencies of the cyclotron resonance of various ions: Ca, K, Mg, etc. [13]. Even though the cyclotron resonance model raises serious doubts from the point of view of physics [14], no alternative versions have been presented in the literature. In addition, treatment of samples with an alternating MF with the cyclotron resonance frequency of H9O4+ is of interest, as this frequency was reported to change the refractive index of water, i.e., influence the structure of water [15]. Thus, water is sensitive to magnetic and electromagnetic field action, which may be due to the effect on the structural organization of water on clusters with a dipole moment or on bulk nanobubbles [16].
It is logical to assume that the above-mentioned alterations of physical or physicochemical properties of water and aqueous solutions, persisting for at least tens of minutes and even hours [3], also influence biological and biochemical processes taking place in an aqueous environment. Indeed, several studies have established the effect of EMF and MF on the physical characteristics of aqueous solutions of biological molecules [17,18] and on the functioning of ion channels [19]. Other works showed the influence of these fields on complex biological systems: cells, tissues, and multicellular organisms [20,21]. For example, MF-treated water was shown to have positive effects on microorganisms resulting in higher biogas production [22], on plants enhancing the germination of seeds, plant growth and development, the ripening and yield of field crops [23,24,25,26,27,28], and on animals [24,29,30,31,32]. However, Fesenko et al. [19] clearly showed that the main target of the fields (or one of the targets) is the water itself, through which the effect of the field on the biological object is realized.
Another process that modifies the properties of water is the technology of preparation of highly diluted (HD) solutions [33,34]. This technology utilizes a series of dilutions (up to concentrations below Avogadro’s limit) accompanied by mechanical stress application such as controlled hydrodynamic treatment/shaking (with defined amplitude and frequency). HD solutions are different from water used for their preparation in such physicochemical properties as electrical conductivity, pH, and surface tension [35]. Interestingly, HD solutions acquire specific biological properties that are inherent neither to the solvent nor to the diluted substance [33,34]. These unique properties of HD solutions found implementation in biomedicine and in pharmaceuticals [36,37,38,39]. In addition, the latest advances in this field seem to expand possible applications of HD solutions in materials science [40,41].
One of the enigmatic features attributed to HD solutions is their ability to influence certain properties of adjacent solutions without direct contact [42]. For example, immersion of a microtube with interferon-γ (IFN-γ) dissolved in phosphate-buffered saline into a vial filled with HD solution of antibodies (Ab) to IFN-γ alters the physicochemical properties of the former [43]. Nevertheless, no physical explanation of this phenomenon has been provided yet.
In a recent work, Novikov et al. [44] showed that HD solutions prepared in a geomagnetic field-free chamber do not acquire modifying properties. This fact considered together with the influence of an MF on aqueous solutions and non-contact influence property of HD solutions can hint that all the aforementioned phenomena may have a common nature. Therefore, it is plausible to assume that the ability of HD solutions to transfer properties to another solution without contact is at least partially due to electromagnetic radiation. If that is the case, it is expected to detect a non-contact effect of HD solutions on water, similar to the direct effect of a field on water.
IR-emission spectroscopy is a highly sensitive, reliable, and non-invasive method for recording emitted spectra, which has already made it possible to detect the specific emission of aqueous solutions that differ in solute concentration [42,43,44]. This work is a continuation of a previous study on the characterization of HD solutions, including HD solution of Ab to IFN-γ, also performed using IR-emission spectroscopy [43]. HD solution of Ab to IFN-γ was chosen as an object of investigation because a number of its characteristic properties have been described in previous works [45]. The information can be helpful in interpreting the study results.

2. Materials and Methods

2.1. Sample Preparation

To prepare all solutions, we used deionized water obtained from a Milli-Q purification system (Millipore, Germany) with a resistivity of 18.2 MΩ•cm at 25 °C. Affinity-purified rabbit polyclonal Ab (IgG) to recombinant human IFNγ (containing 144 amino acids) in glycine buffer (pH 7.2) at 2.3 mg/mL, 99% purity (AB Biotechnology, UK) were used for HD Ab solutions preparation.
The following types of aqueous solutions were prepared for comparison:
1. Highly diluted Ab made with intense shaking (iHD Ab).
Ab to IFNγ had undergone a gradual reduction of their initial concentration (2.3 mg/mL) under specific conditions. Namely, Ab to IFNγ was mixed with a solvent (water) at a ratio of 1:100 and shaken vigorously with impact by hand with a controlled frequency of about 4 Hz (21 strokes in about 4.8 s) to produce the first centesimal dilution. All subsequent dilutions consisted of one part of the previous dilution and 99 parts of the solvent, with vigorous shaking with impact between each dilution. Thus, the final solution contained a 12th centesimal dilution of antibodies to IFNγ. A theoretical concentration reduction of the original antibodies was at least 1024 times, i.e., the theoretical concentration of the Ab in the solution was 2.3 × 10⁻²⁴ mg/mL.
2. Highly diluted Ab made with gentle mixing (gHD Ab)
The preparation procedure for the gHD Ab was similar to that for the iHD Ab, except that gentle mixing (10 circular motions with a frequency of about 2 Hz) between each dilution was performed.
3. Highly diluted water made with intense shaking (HD water).
The method for preparing HD water was the same as for preparing iHD Ab to IFNγ, except that Milli-Q water was used instead of Ab solution.
4. Intact Milli-Q water.
All samples (1–4) were prepared by OOO “NPF “MATERIA MEDICA HOLDING” in sterile glass vials with screw caps (Glastechnik Gräfenroda, Germany) and stored in the dark at room temperature for no more than 2 weeks. Samples of the same type were stored together, and samples of different types were stored in separate boxes. The samples were tested blindly and decoded after the results have been obtained.

2.2. Experimental Setup for Magnetic Field Treatment

We assembled an installation consisting of a magnetically shielded chamber, two coaxial insulated solenoids, a control unit, and an electrical power generator. A magnetically shielded ZG-209 MuMETAL Zero Gauss Chamber (Magnetic Shield Corporation, Bensenville, IL, USA) consists of three coaxial cylinders with end caps made of permalloy (an alloy of nickel, iron, copper, and molybdenum or chromium), which has a high magnetic permeability for weak fields. Near the midpoint of the central axis of this setup (the area of sample placement), weak low-frequency MFs, as well as the geomagnetic field, are suppressed by more than 1400 times.
The installation has two coaxial insulated solenoids of equal length wound one over the other. Each solenoid is made from a single layer of polyester enameled copper wire (diameter 0.8 mm, coating thickness 0.1 mm) closely wound over a hollow cylinder of 160 mm external diameter and 152 mm internal diameter, with 675 mm winding length. The internal space of the hollow cylinder allows for placement of samples inside. One solenoid is connected to an E36312A DC power supply (Keysight, Santa Rosa, CA, USA) and used to generate a constant MF. Another solenoid is connected to a 33511B waveform generator (Keysight, Santa Rosa, CA, USA), which allows creating an alternating MF. In this work, a collinear combination of constant and alternating MFs was used to treat the samples. The value of the induction of a constant MF was chosen close to the Earth’s natural MF of 60 μT. The magnetic induction amplitude of an alternating (in the form of a harmonic signal) field was 0.15 μT with a frequency of 12.6 Hz. This corresponds to the cyclotron resonance frequency of the hydrated hydronium ion (H9O4+) in the constant MF of 60 μT [15].
For treatment with an MF of defined parameters, the sample was placed in the center of the installation (at the midpoint of the central axis of the hollow cylinder), since the distribution of the field was most stable in this area. The sample was kept in the MF for 1 h followed by the spectral analysis of the emitted radiation.

2.3. Non-Contact Effect

We studied the non-contact effect of Ab solutions (iHD Ab and gHD Ab—untreated and having undergone MF treatment). Thus, samples of water and HD of water acted as sensors of external influences, and Abs samples underwent various technological processing as effectors. Specifically, a 0.5 mL microcentrifuge polypropylene tube (Eppendorf, EU) with the sensor solution (water or HD water) was immersed in a glass vial (Glastechnik Gräfenroda, Geratal, Germany) with 5 mL of one of the effector solutions: iHD Ab or gHD Ab for 1 h at room temperature (21–23 °C) followed by the spectral analysis of the radiation emitted by the sensor solution. There was no direct contact between the sensor and effector solutions. They were separated from each other by the wall of the test tube, which was 0.45 mm thick. The experiment was repeated 9 times.

2.4. Emission Spectra Recording

A custom-built system for recording the spectra of intrinsic emission was assembled based on a vacuum IR spectrometer with Fourier transform Vertex 80 v (Bruker, Hamburg, Germany). The spectrometer was adjusted in such a way that the specimen, placed in the focus of the optical system from the outside, served as a radiation source. The necessary condition for detecting radiation from a specimen at ambient temperature is the presence of a cold background, which does not allow thermal radiation from the environment to enter the detector. For this, a black plate immersed in liquid nitrogen was placed behind the specimen. Thus, we replaced the background thermal radiation with blackbody radiation at a temperature of −196 °C. According to the Stefan-Boltzmann law, the integral emission intensity of a black body is proportional to the fourth power of the absolute temperature. Therefore, we managed to reduce the thermal background by more than 200 times [46].
To record emission, we used a highly sensitive mercury cadmium telluride (MCT) detector cooled with liquid nitrogen. Before measurements, the vacuum jacket of the detector was evacuated with a vCube Turbo Station turbomolecular vacuum pump (Turbo Vacuum, Orlando, FL, USA) to 10−6 Torr, and the vacuum integrity was checked after the experiment. In this work, we analyzed the emission spectra in the range from 400 to 3000 cm−1, with a spectral resolution of 4 cm−1. To operate the spectrometer with Fourier transform in this frequency range, a transparent KBr beam splitter was installed. The cell windows were made of KRS-5 material. An annular Teflon spacer was placed between the windows, which set the thickness of the liquid samples to 5 μm.
The details of the experimental setup used for measuring the intrinsic emission of solutions, as well as the scheme of the cuvette and the method for processing the spectra, have been described by us previously [43,47].
For each type of sample, 9 emission spectra were obtained.

2.5. Data Analysis and Statistics

The spectral region of 470–2000 cm−1 exhibiting the most pronounced emission was separated from the total absorption spectrum. This spectral region’s dimension was reduced to 3 dimensions using the principal component analysis (PCA) [48,49,50,51]. The spectra within the analyzed range (470–2000 cm−1) were separated in the principal component space using a K-means clustering algorithm. According to the elbow method, 5 clusters were chosen, as for a given number of clusters the best separation of the samples was observed. While samples belonging to the same cluster are suggested as similar, the method does not allow obtaining p-values for pairwise spectra comparison. To overcome this, a bootstrap-like procedure involving several steps was developed.
(1)
For each sample, a normality assumption, a mean, and a standard deviation of the distribution of repeated measurements for the given wavelength were assessed.
(2)
The assumption of the repeated measurements being distributed normally was not violated. This allows performing the generation of new spectra points at each wavelength, using the normal distribution with parameters obtained at the first step. By generating a curve point-by-point, a whole synthetic spectrum was obtained for each sample.
(3)
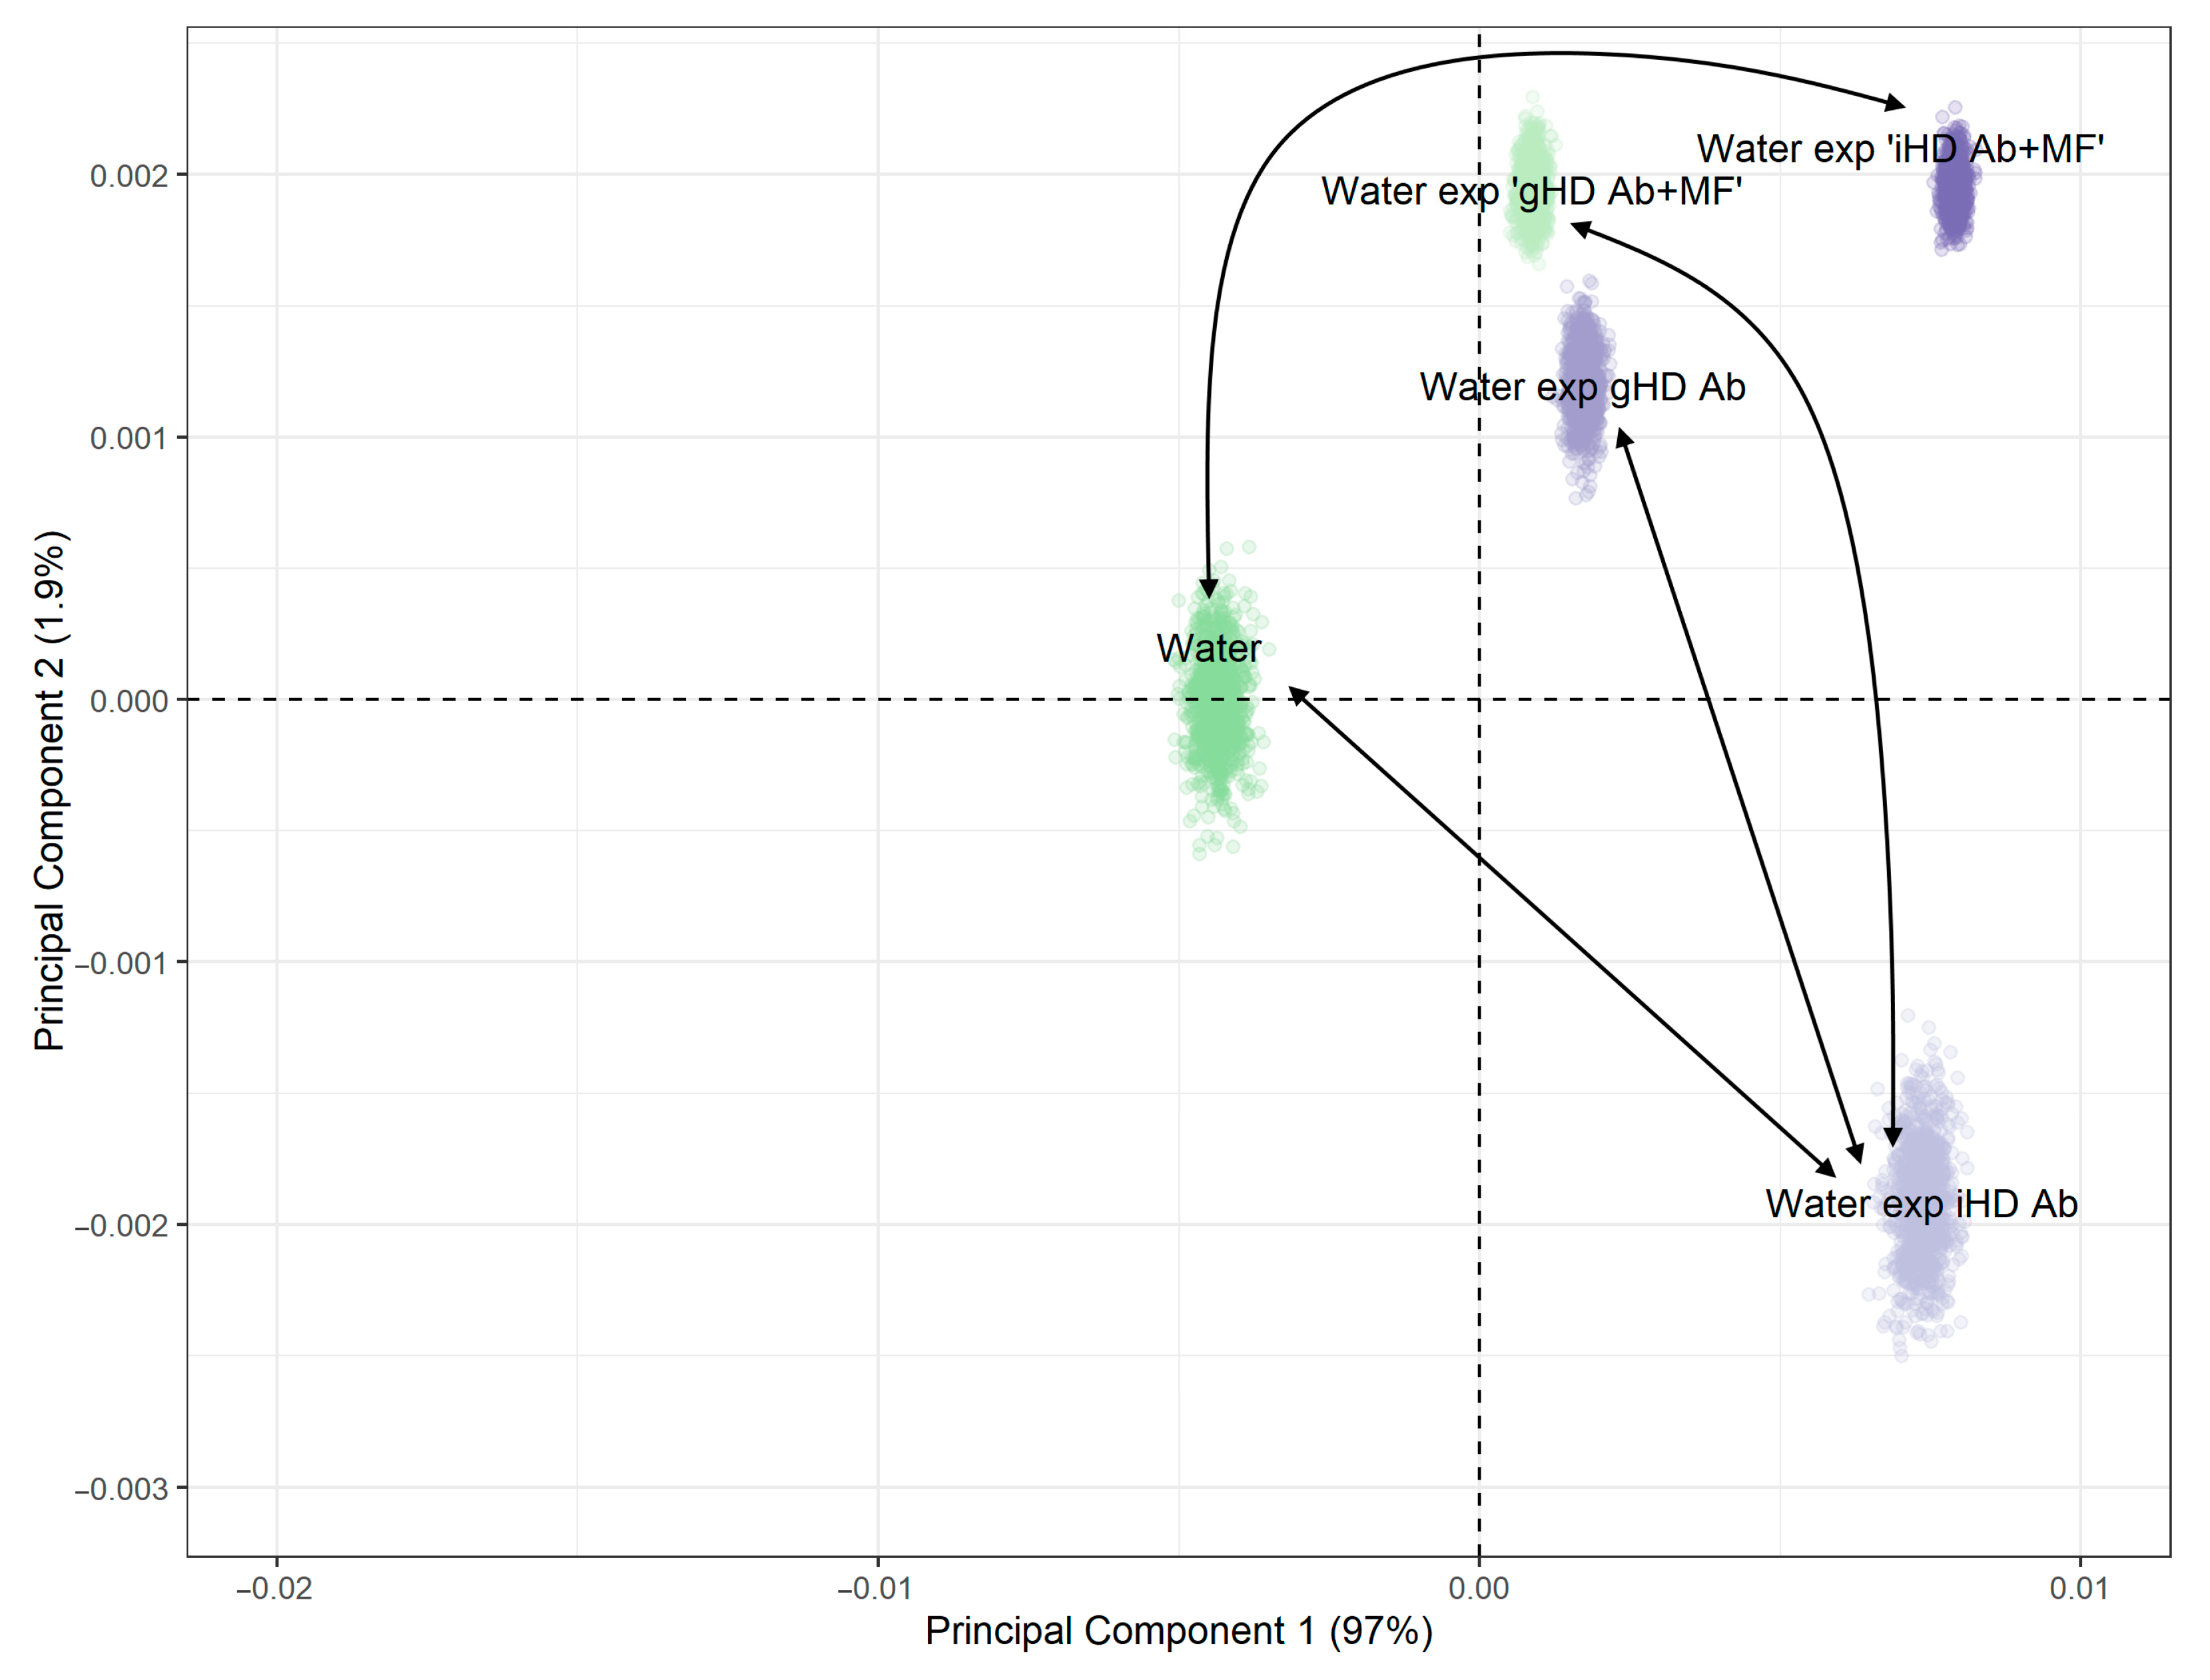
The generated batch of samples’ spectra were also processed with PCA and clustered by the K-means as the original spectra. For each pair of samples, their co-occurrence in the same cluster was recorded.
(4)
Steps 2 and 3 were repeated 1000 times.
(5)
For each pair of samples, the ratio of co-occurrence in one cluster [49,51] among the 1000 simulations was considered as a bootstrapped p-value. The pairwise comparison p-values were adjusted using Holm’s procedure for multiplicity of comparisons. Differences were considered statistically significant at p < 0.05.
The integral emission intensity was defined as the area under the spectral curve within a range of 470–2000 cm−1. The area under the curve was calculated using the trapezoidal rule.
The statistical significance of the differences between the samples in terms of the integral emission intensity was determined by pairwise comparison of areas using the Welch test with Holm’s correction for the multiplicity of comparisons. Differences were considered statistically significant at p < 0.05. Additionally, Cohen’s D effect size was calculated: a D-value above 0.8 was considered as a large effect size and above 1.2 as a very large effect size.
Statistical analysis was performed using R (version 4.0.2; R Core Team (2020). R: A language and environment for statistical computing. R Foundation for Statistical Computing, Vienna, Austria. URL: https://www.R-project.org/ (accessed on 1 January 2020)).

3. Results

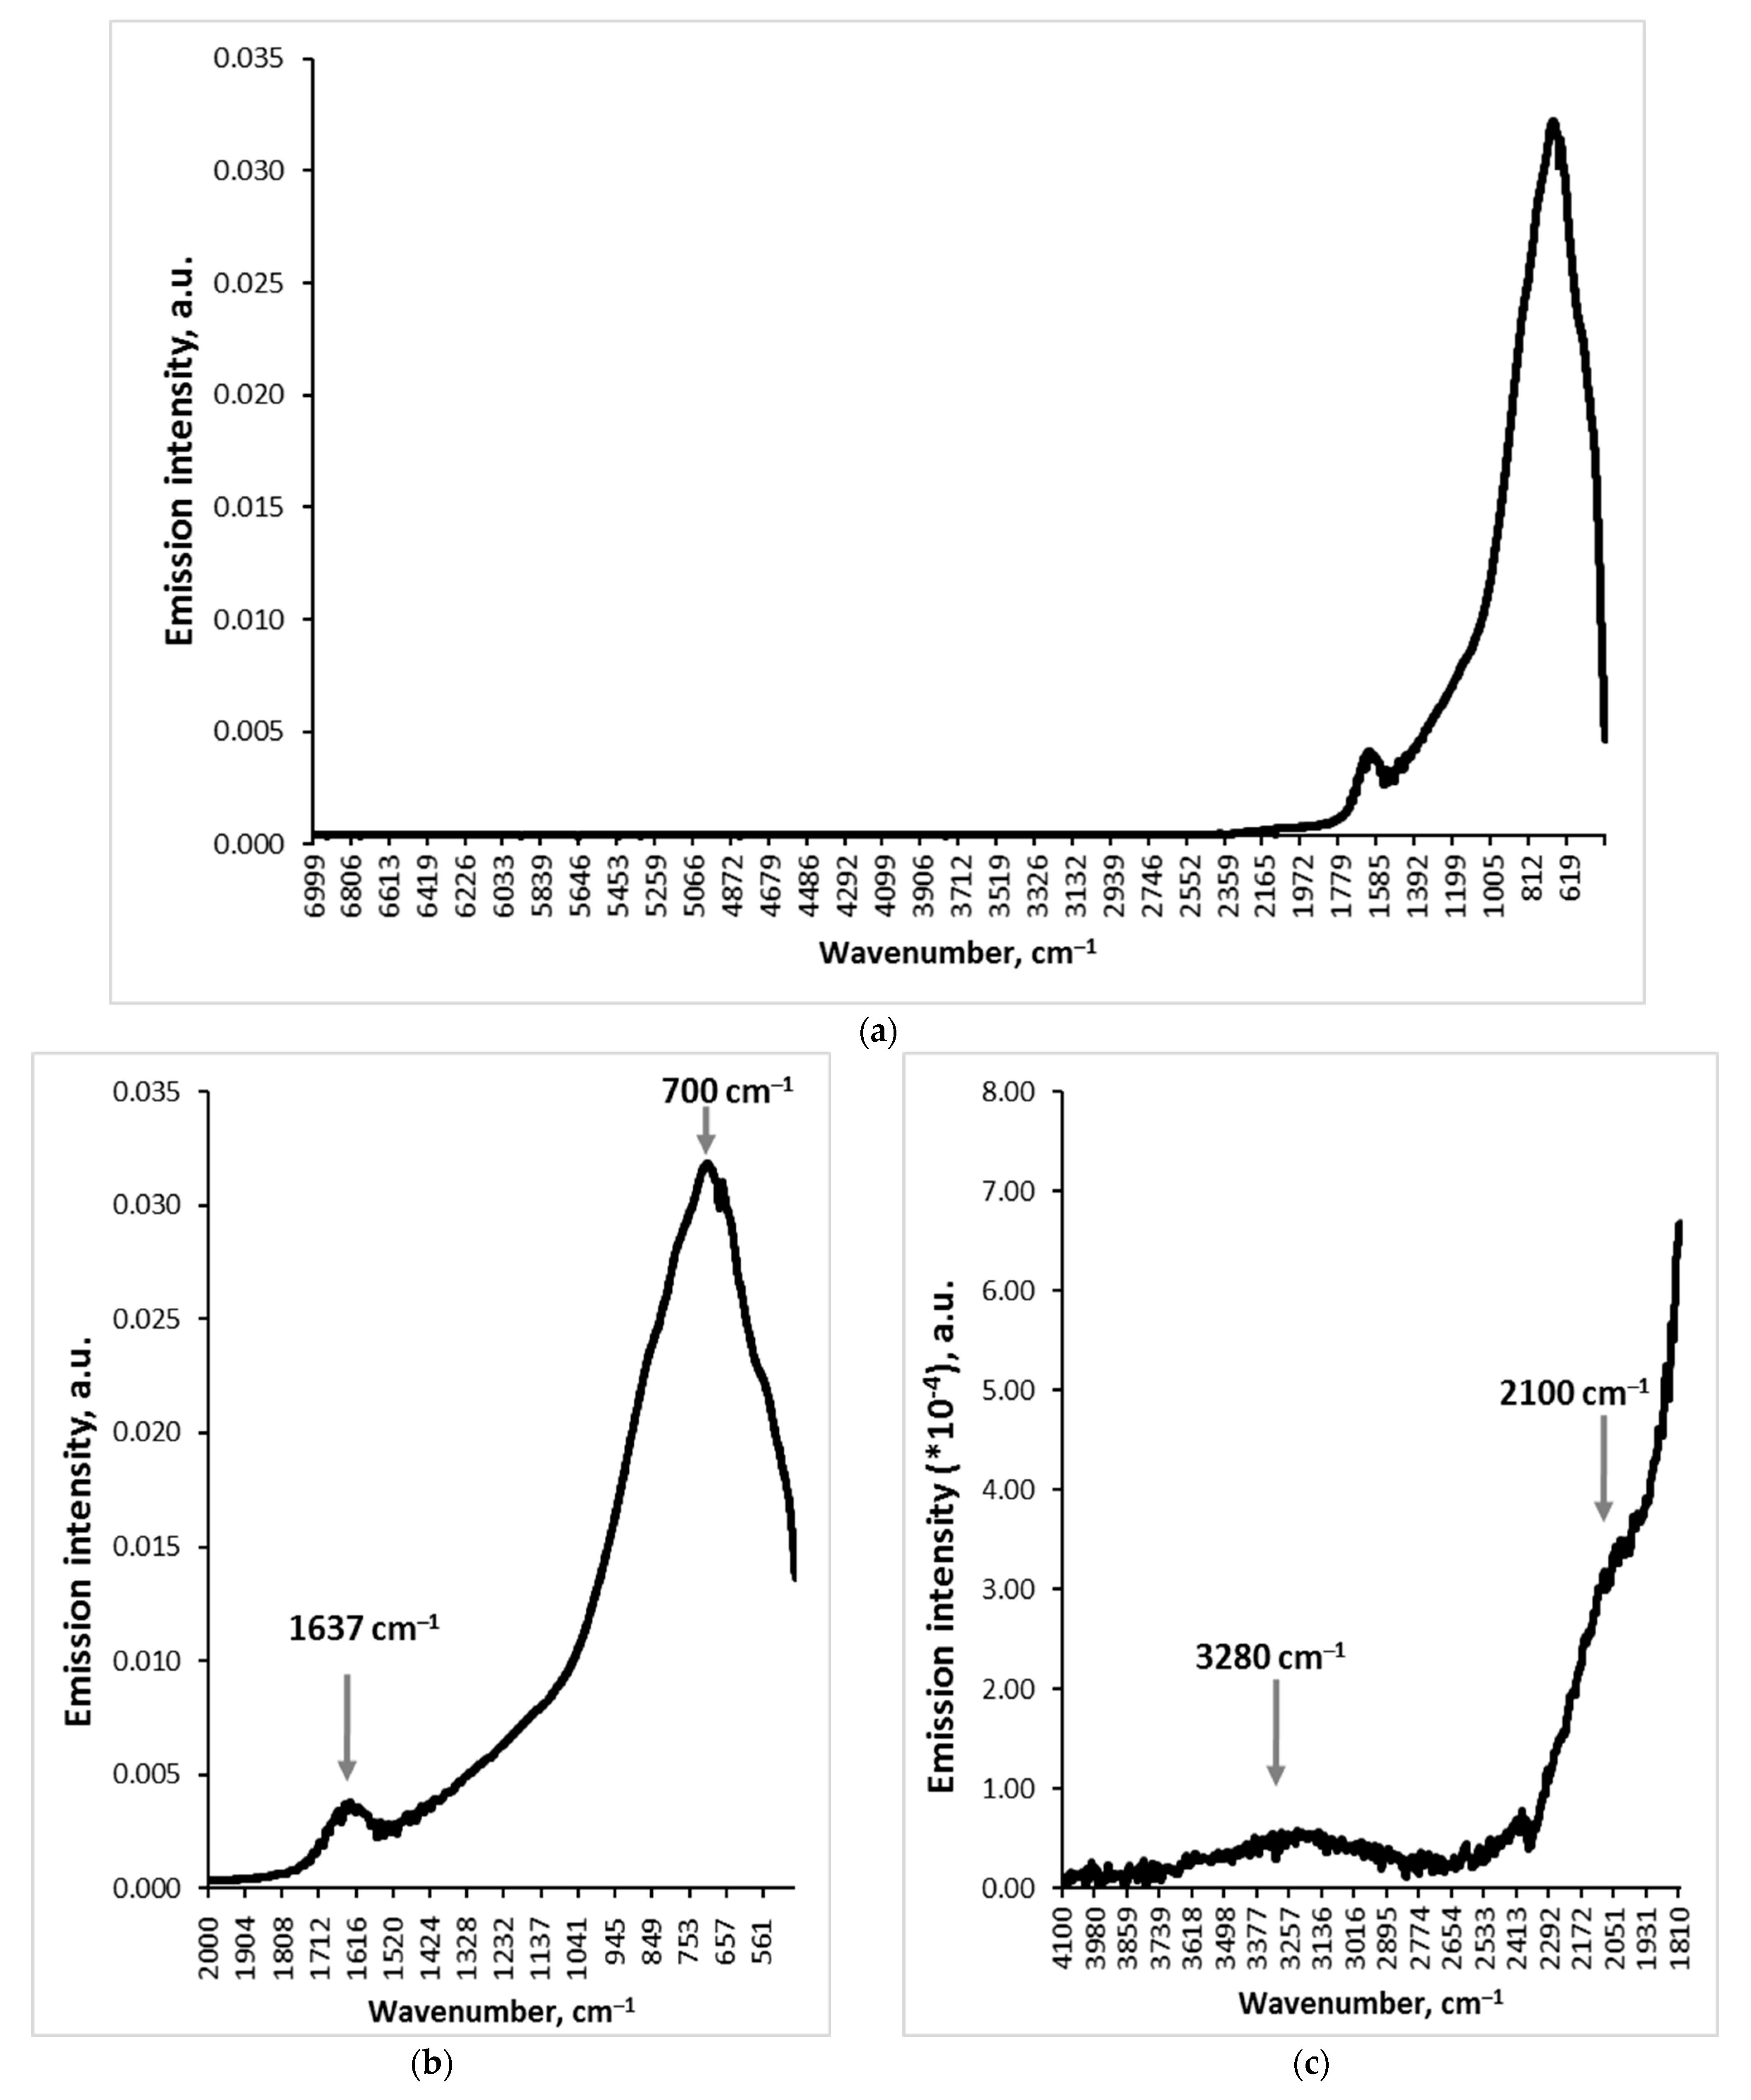
3.1. Emission Spectrum of Water in the Infrared Range

A characteristic spectrum of the intrinsic emission of water is shown in Figure 1. The spectra of the rest of the studied solutions were very similar. A typical emission spectrum contains two well-defined peaks at wave numbers of about 700 and 1637 cm−1. Each of these emission bands has a corresponding band in the absorption spectrum of water [52], reflecting librational (720 cm−1) and bending (1647 cm−1) modes of water molecules.
When zooming in on the spectra, two more weak emission bands can be observed at about 2100 and 3280 cm−1 (Figure 1c), which correspond to two bands in the absorption spectrum: the combination of librational and bending vibrations band (2200 cm−1) and the band of stretching vibrations of water molecules (3400 cm−1). However, in this work, the integral emission was analyzed only in the region of 470–2000 cm−1, including the band of librational and bending vibrations, where it is possible to record the spectrum with a sufficiently high signal-to-noise ratio.
In subsequent experiments, the following effects were assessed:
(1) MF effect on intrinsic emission of water, HD water, iHD Ab, and gHD Ab;
(2) Non-contact influence of iHD Ab and gHD Ab on intrinsic emission of water and HD water;
(3) Non-contact influence of HD Ab, treated with an MF, on intrinsic emission of water.

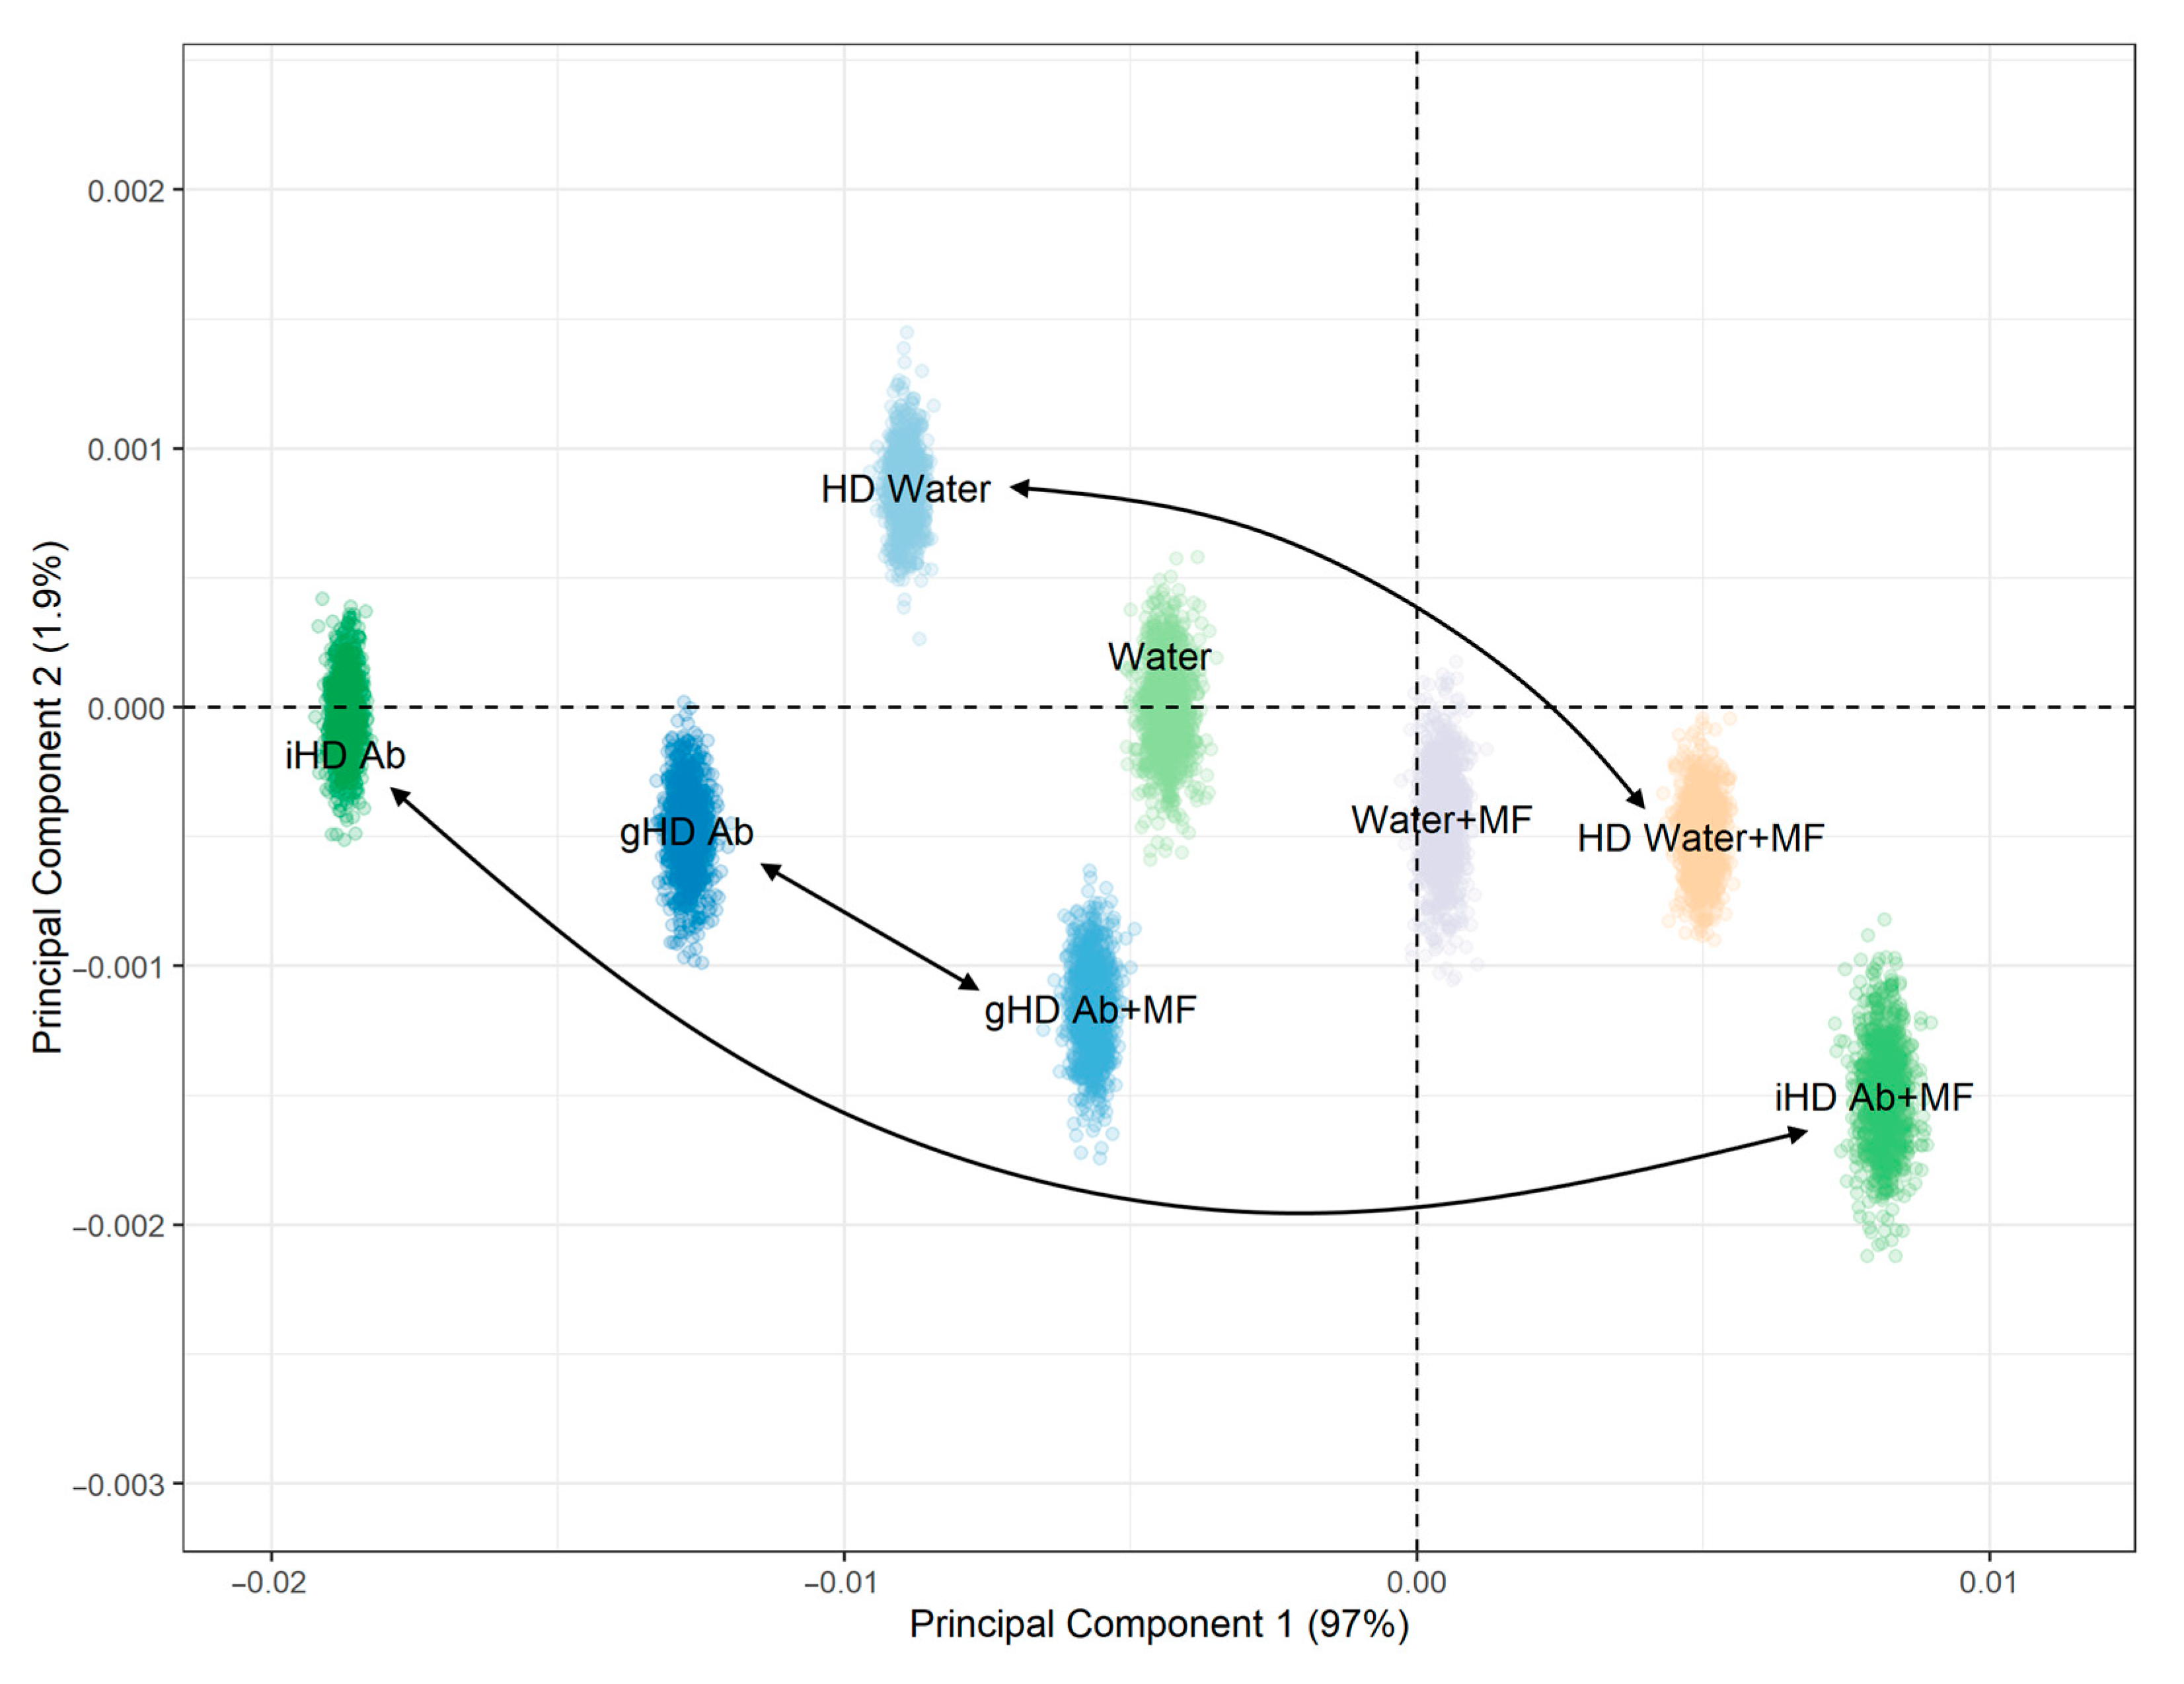
3.2. Impact of a Magnetic Field on Samples

Figure 2 shows the spectra of the samples recorded in the range of 470–2000 cm−1 before and after treatment with a magnetic field. We found that an MF had a greater effect on some samples than on others (Figure 2). The emission spectrum of iHD Ab to IFNg (Figure 2c) underwent the strongest changes after the action of an MF.
We determined the integral emission intensity of the samples, calculated from the area under the emission spectrum curve in the considered spectral range. The results are shown in Figure 3. A statistically significant decrease of 3% in the integral emission intensity of iHD Ab to IFNg sample after the action of an MF was found. At the same time, Cohen’s D-value was 1.3, which is considered as a very large effect size. Under the action of an MF, the intensity of the emission of HD water decreased by 2%, and in the remaining samples, it decreased by less than 1% (statistical significance was absent).
We assumed that despite the absence of statistically significant differences between the above-described samples before and after the MT treatment in terms of the integral intensity of their intrinsic emission, the shape of the emission spectra was likely to change. Therefore, to assess whether the shape of the emission spectrum changes after treatment of the sample with an MF, we applied the principal component analysis and grouped samples in the space of the principal components using K-means clustering followed by a bootstrap-like procedure to obtain the ratio of co-occurrence in one cluster (p-value) (Figure 4).
As can be seen in Figure 4, the distribution of spectra of samples in the space of the principal components is clearly different before and after treatment with an MF. The shape of the spectra of iHD Ab to IFNg and iHD Ab to IFNg samples treated with an MF differ statistically significantly (p < 0.05), and spectra are clearly separated in the space of the principal components. The shape of the spectra of HD water and gHD Ab to IFNg also differ significantly (p < 0.05) from the corresponding samples treated with an MF, but these groups are less separated in the space of the principal components. At the same time, the treatment of water with an MF does not affect the shape of the emission spectra because no statistically significant difference in the location of spectra in the space of the principal components was found.
Thus, based on the analysis of the distribution of spectra in the space of the principal components, it can be concluded that iHD Ab is the most sensitive sample, HD water and gHD Ab to IFNg are less sensitive, while water is insensitive to the MF of the specific characteristics used in this study. An analysis of the spectra indicates a change in the shape of the spectrum for the HD water and gHD Ab to IFNg samples treated with MF (Figure 4), while the evaluation of the integral emission intensity did not reveal such differences for these samples (Figure 3).

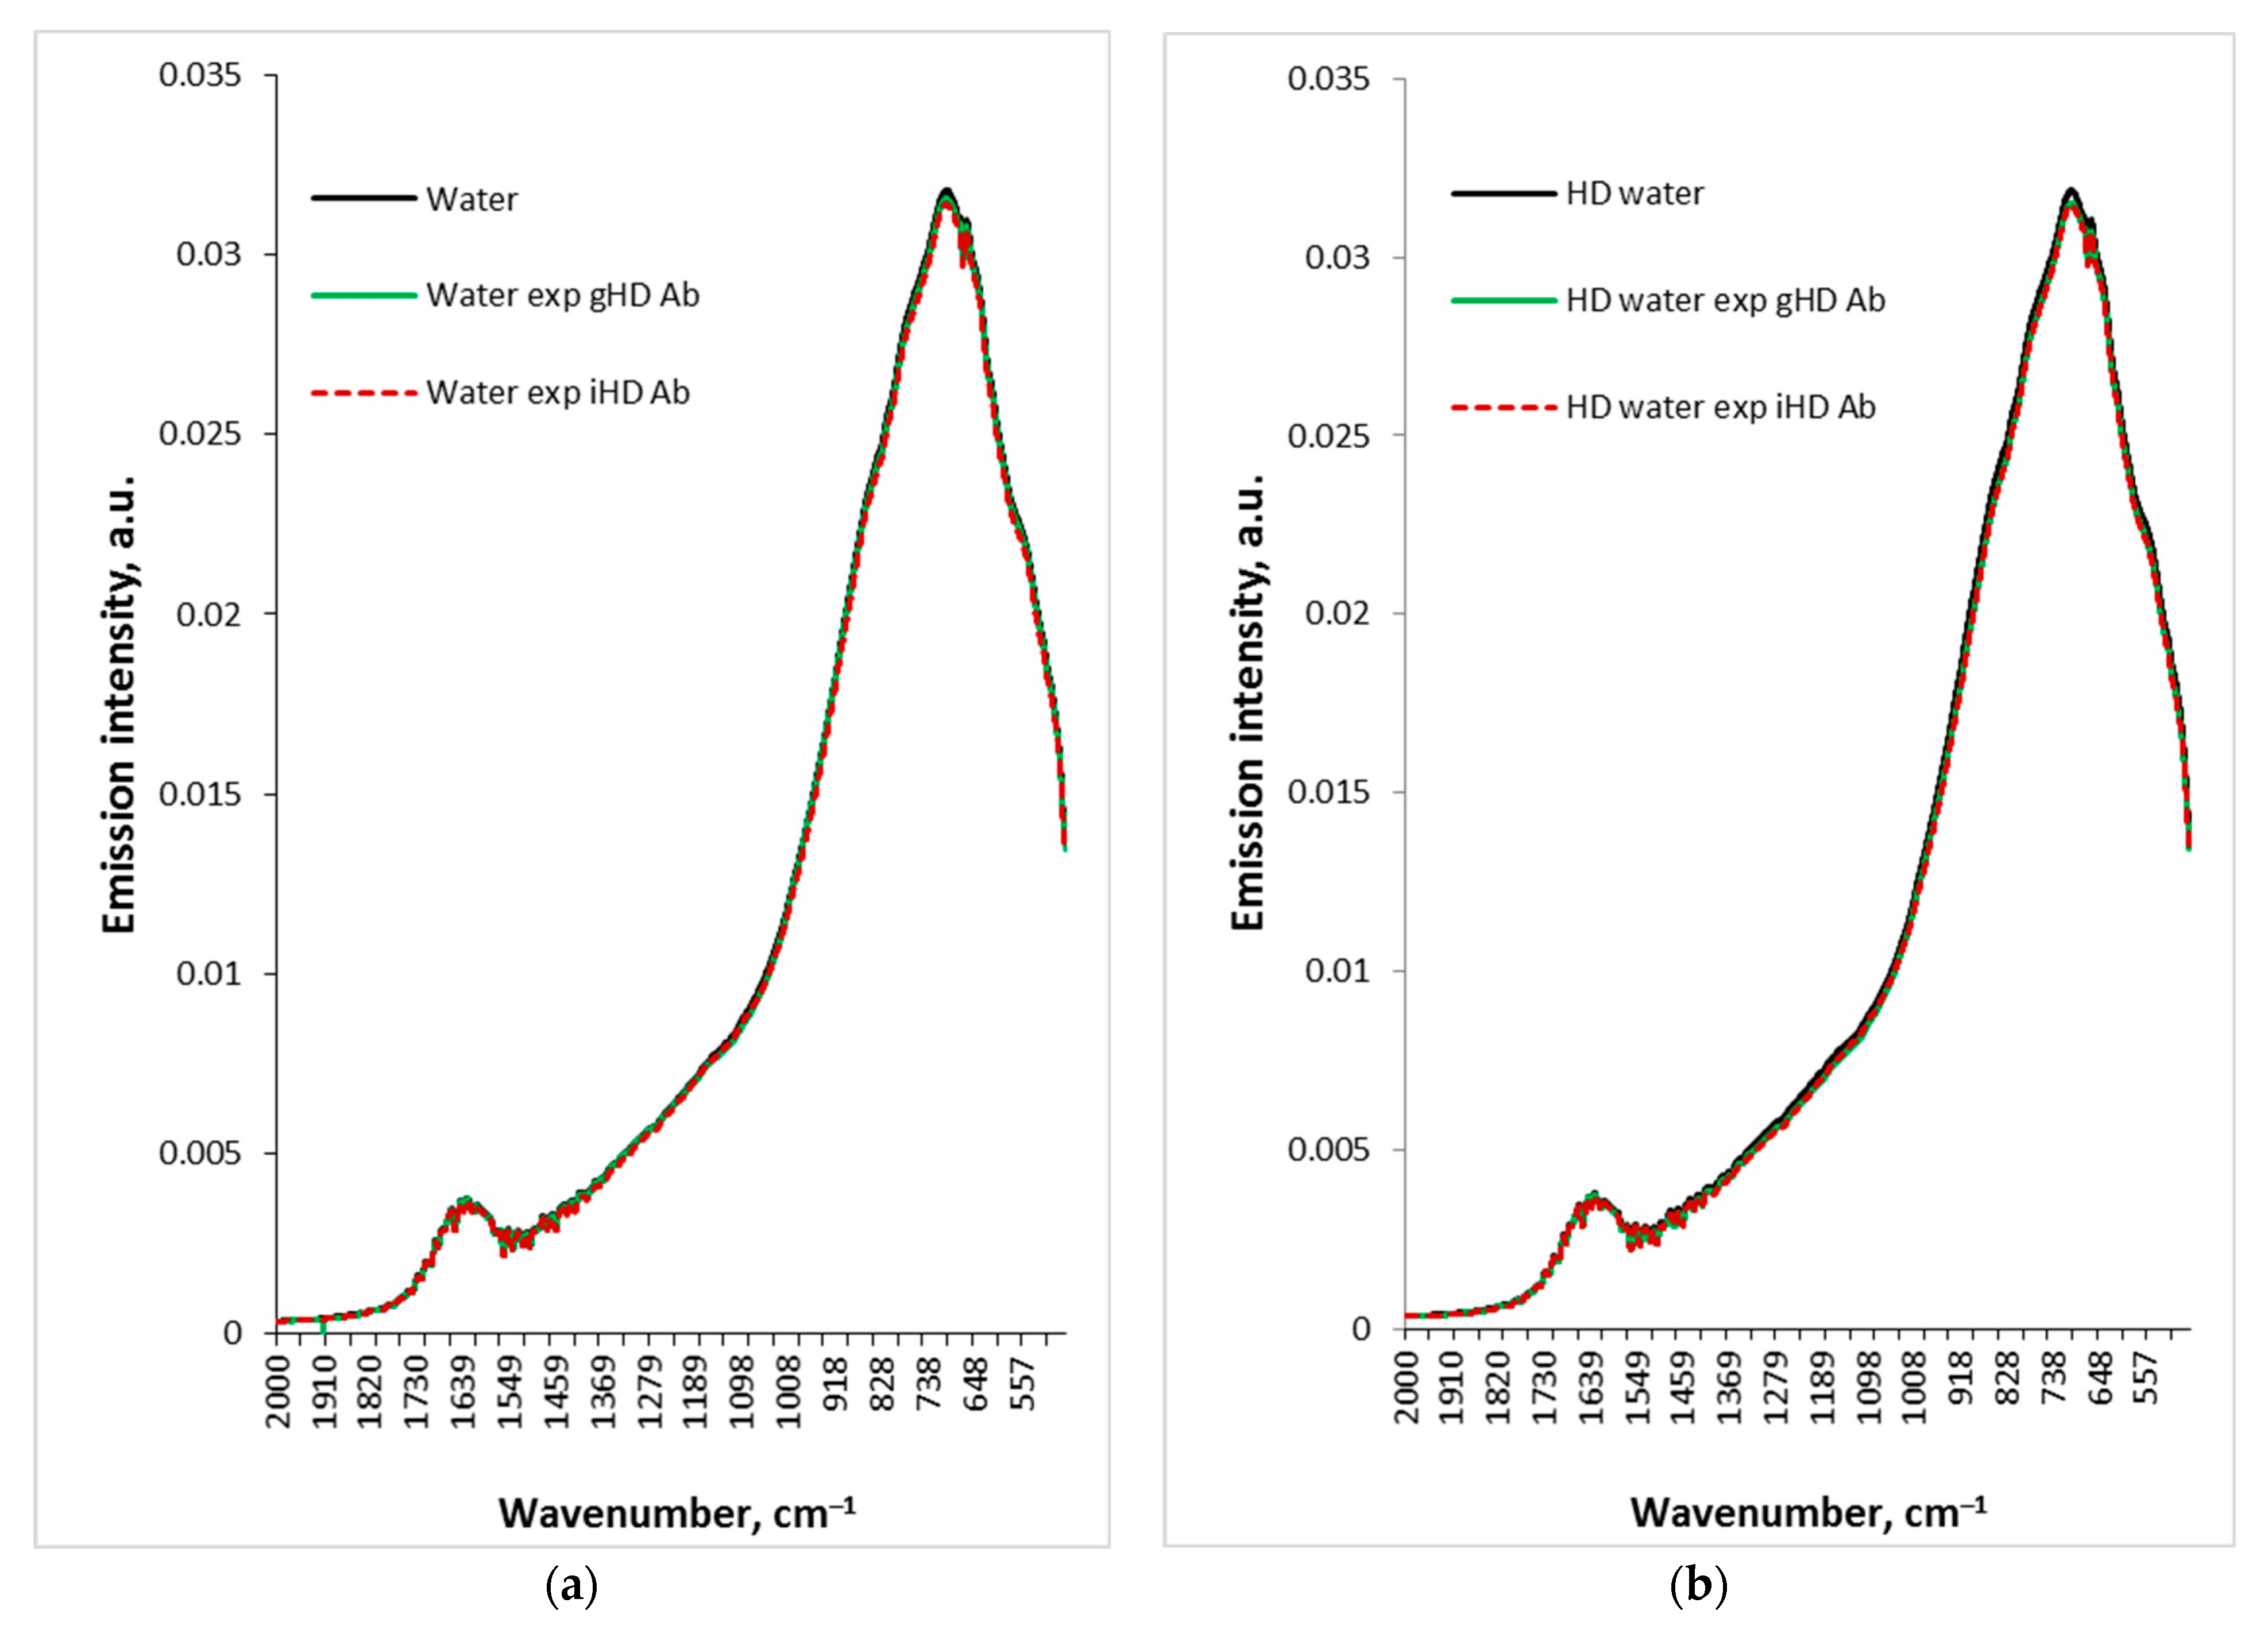
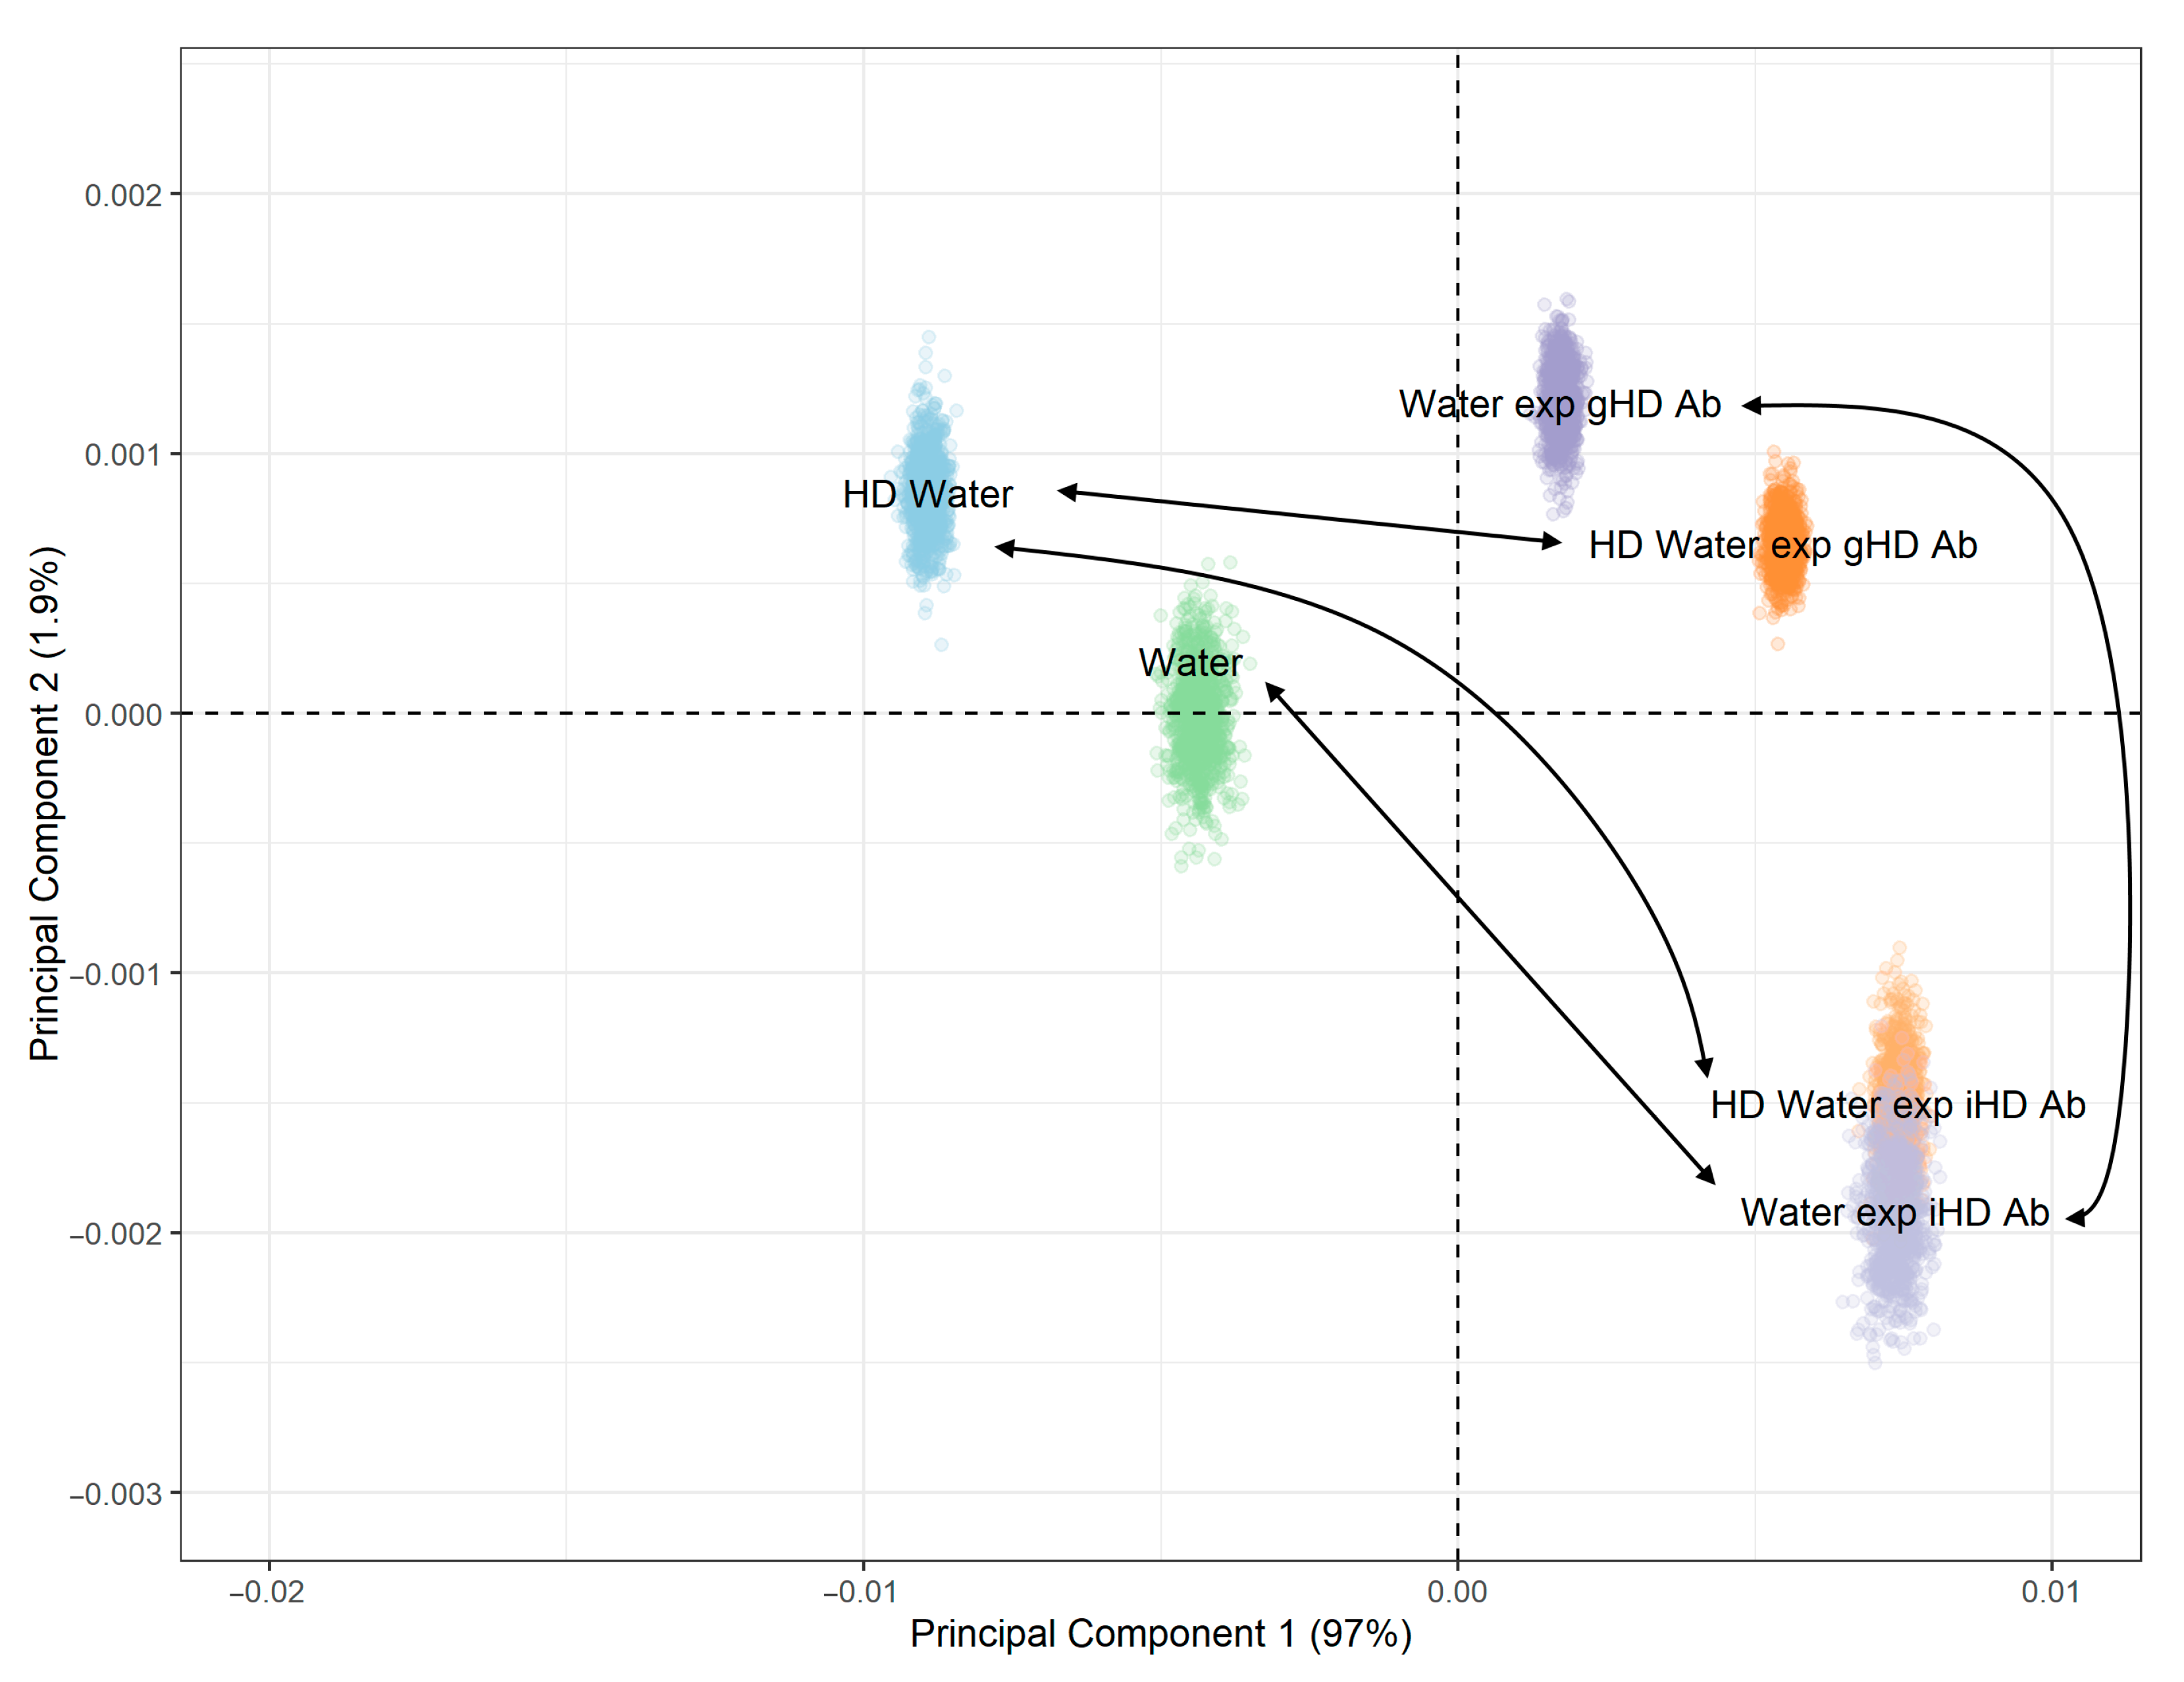
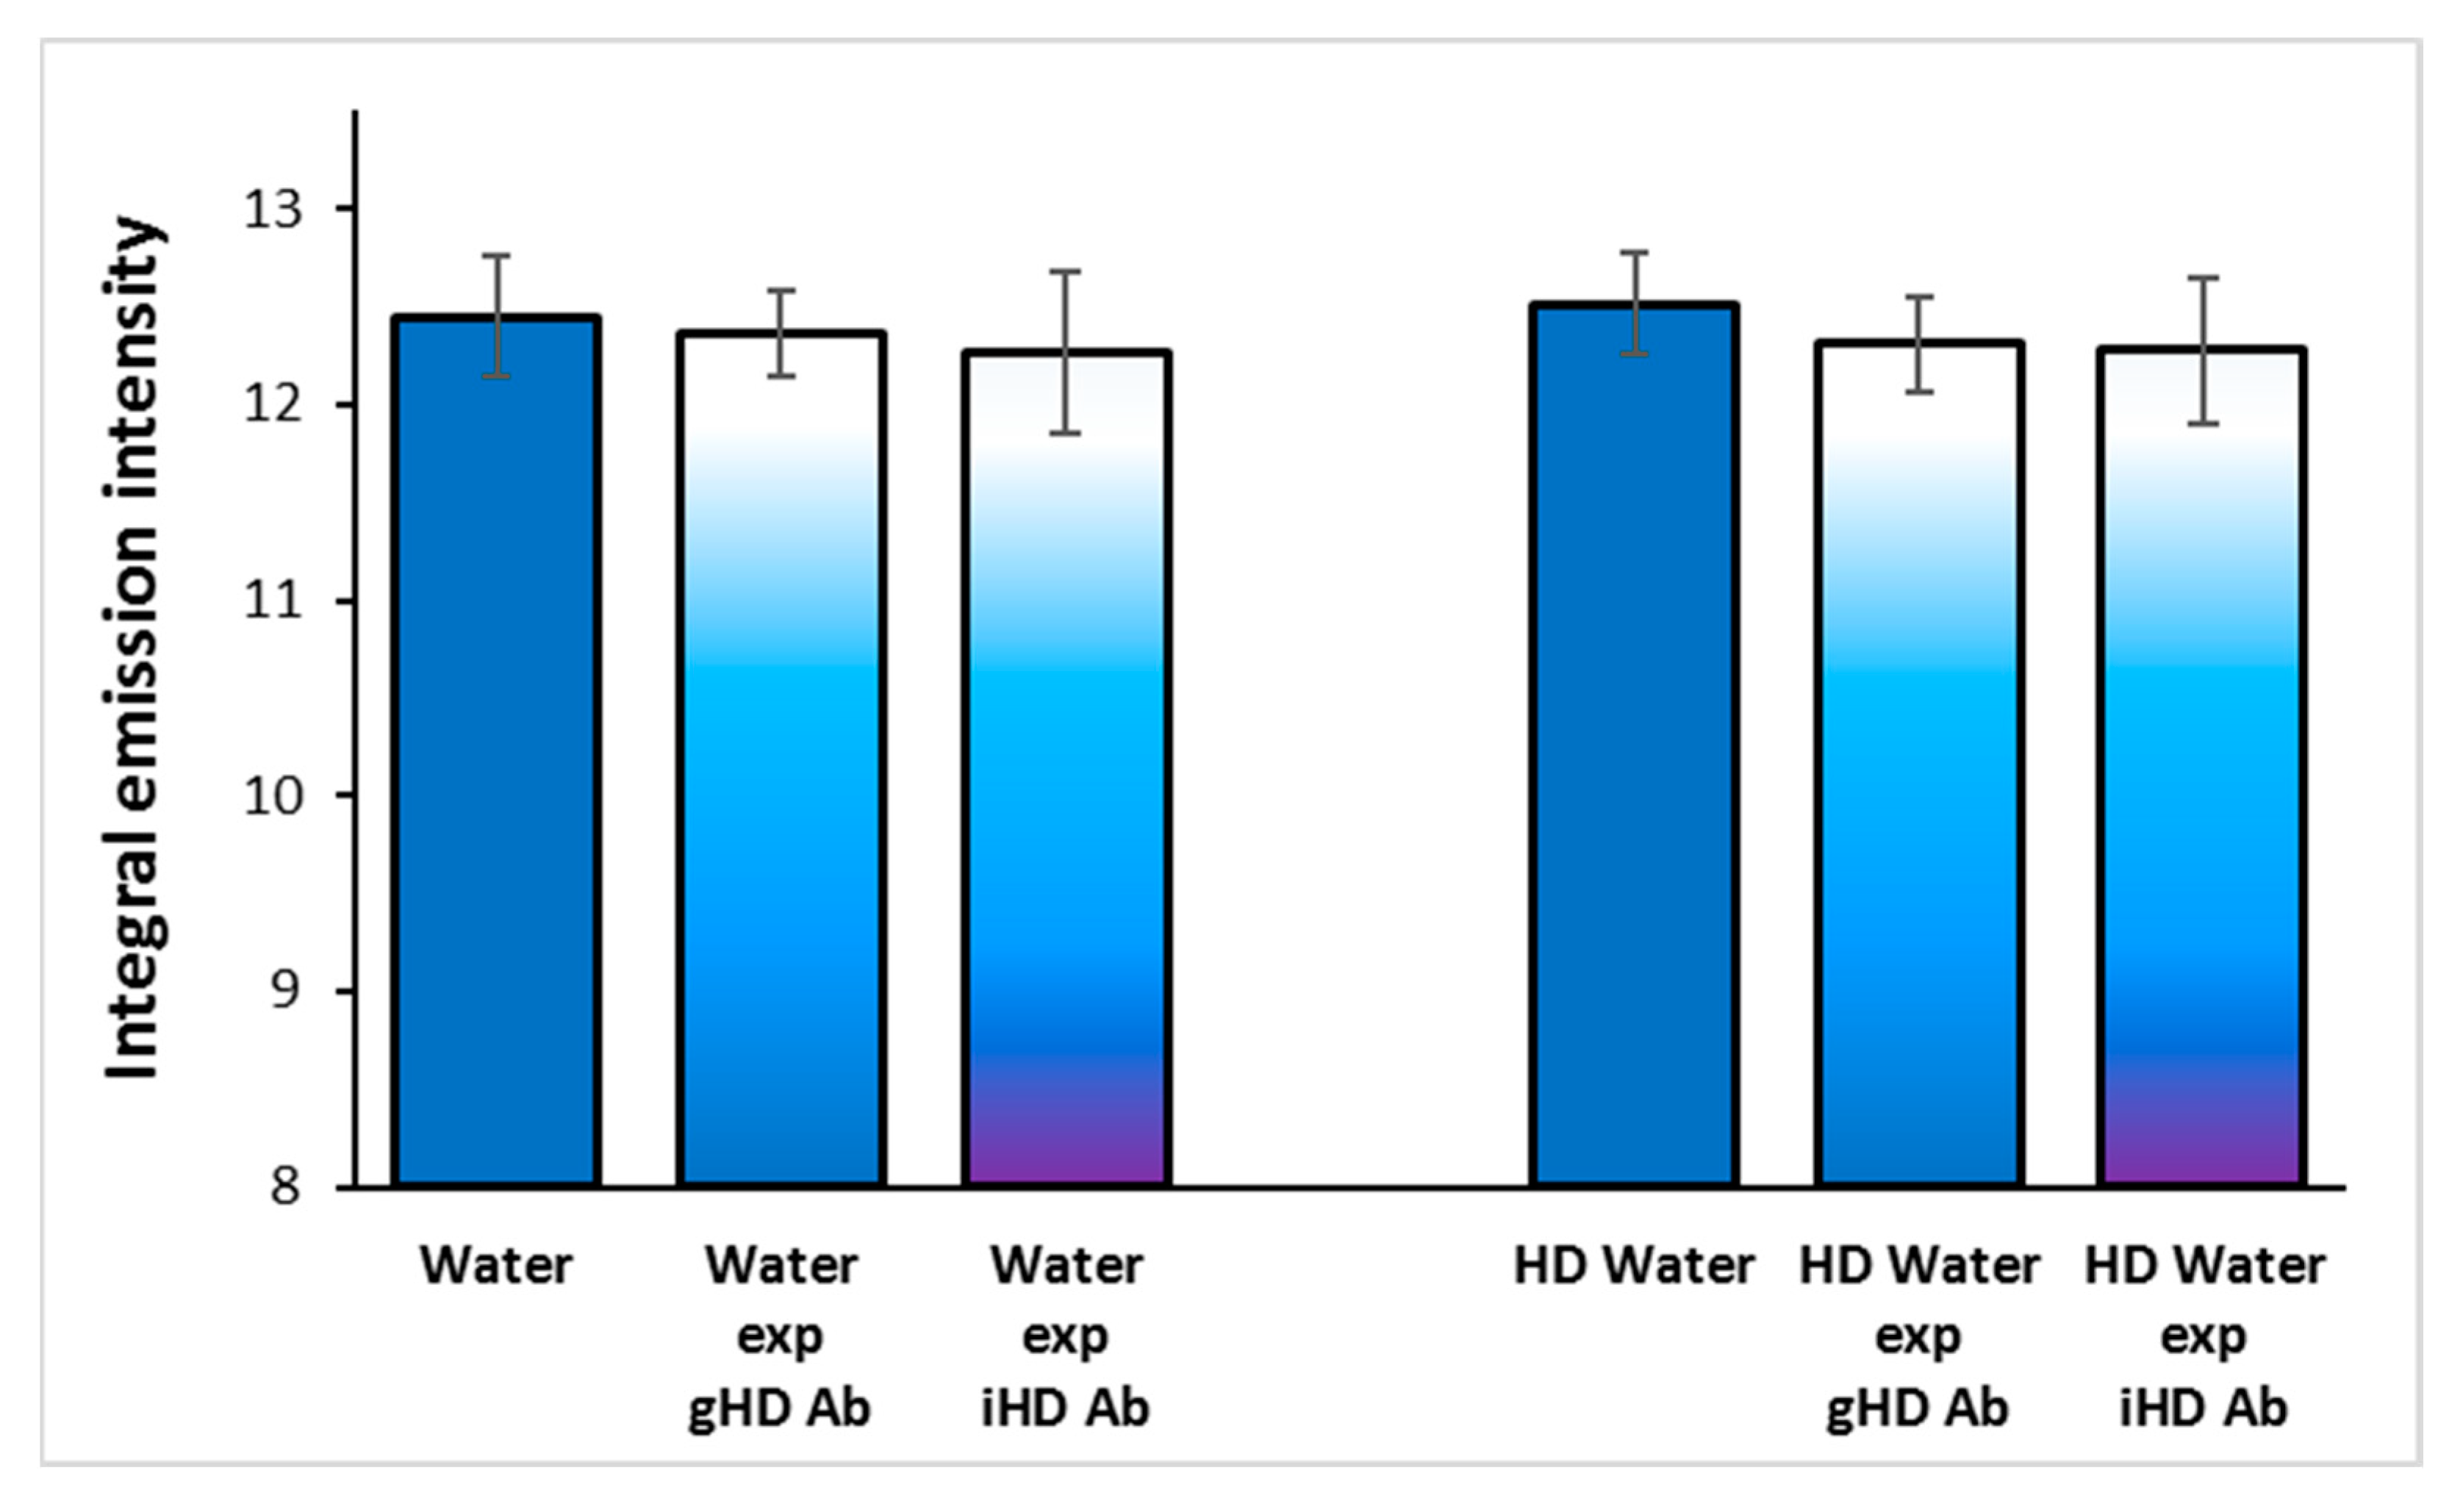
3.3. Non-Contact Effect of iHD Ab and gHD Ab on Water Samples and HD Water

Figure 5 shows the spectra of the samples before and after the non-contact action of iHD Ab and gHD Ab on water and HD water recorded in the range of 470–2000 cm−1.
We estimated the integral emission intensity of the samples in the studied range (Figure 6). Although both gHD Ab and iHD Ab reduced the integral emission intensities of both water (by less than 1% or about 1.5%, respectively) and HD water (by about 2% in both cases), these changes did not reach statistical significance (p > 0.05). However, when comparing HD water and HD water exposed to gHD Ab, Cohen’s D-value was 0.81, indicating a large effect size.
To evaluate the changes in the shape of the spectra after non-contact exposure to HD samples, we compared the spectra arrangement in the space of the principal components (Figure 7). The data indicate a change in the emission spectrum of water that has experienced a non-contact effect of iHD Ab, but not gHD Ab. At the same time, HD water emission spectrum after non-contact incubation with both iHD Ab and gHD Ab changed. Thus, we have shown that there is a non-contact effect on the properties of water and HD water samples, estimated by the shape of their emission spectra.

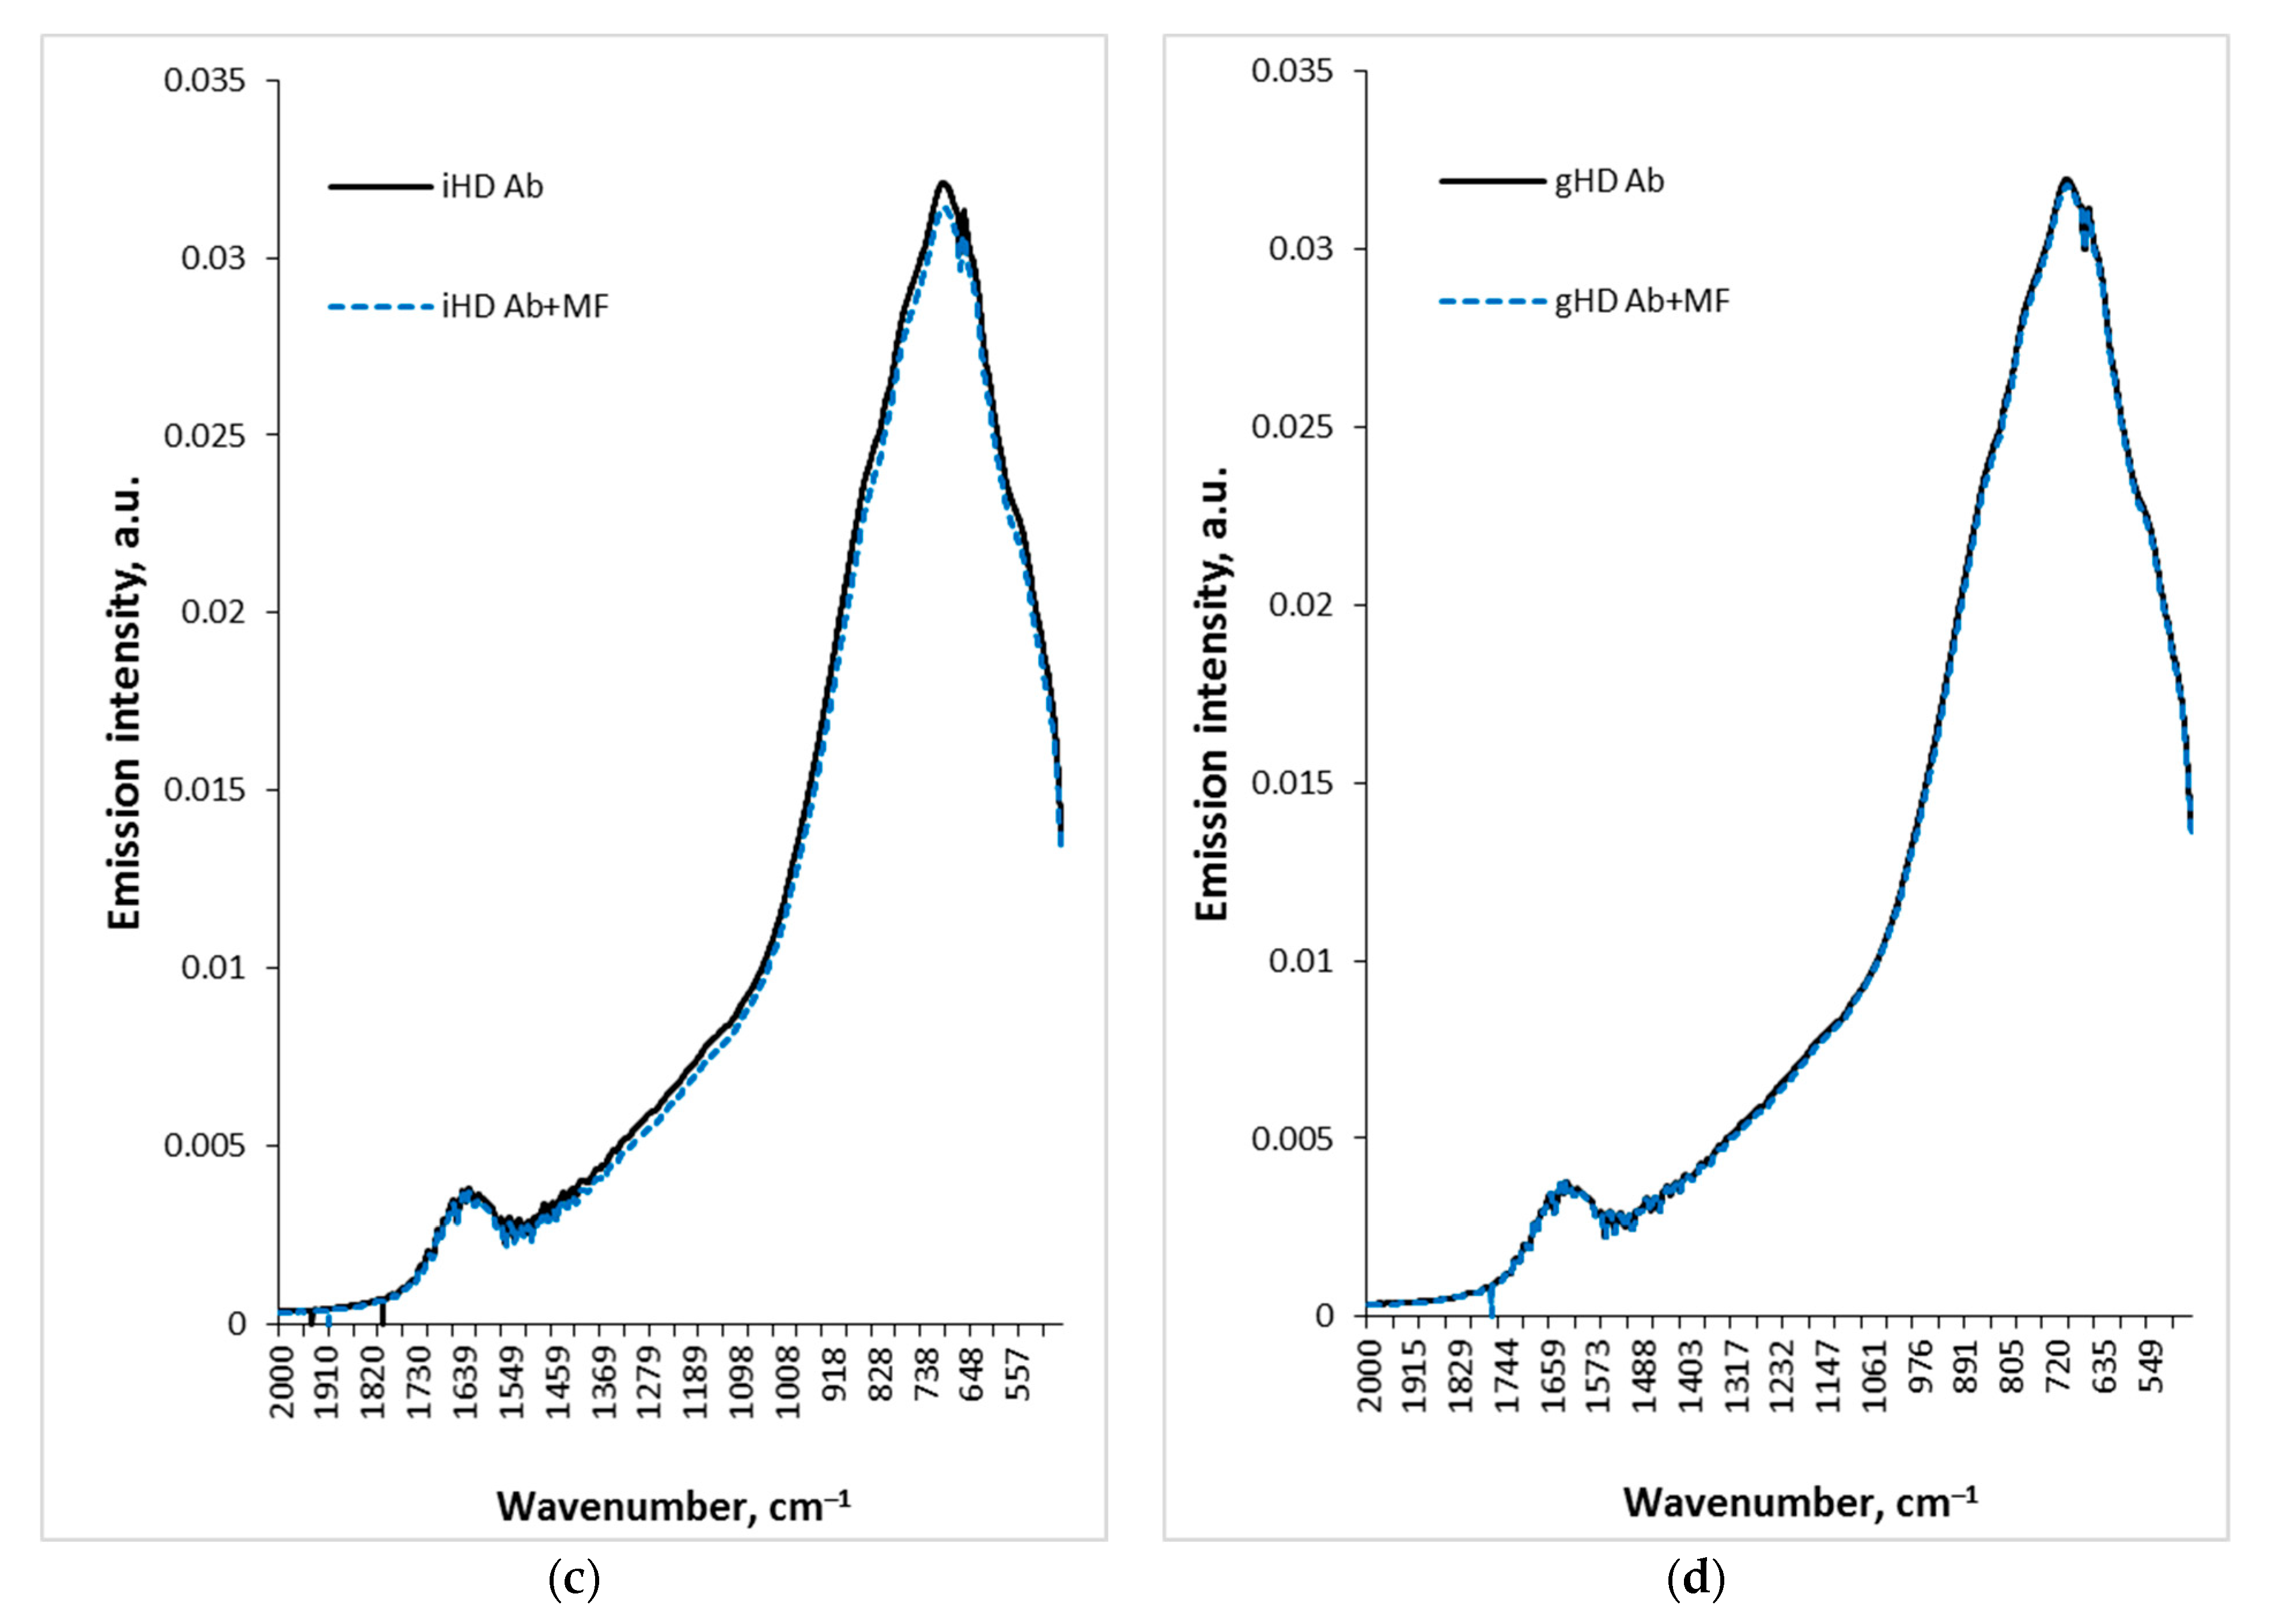
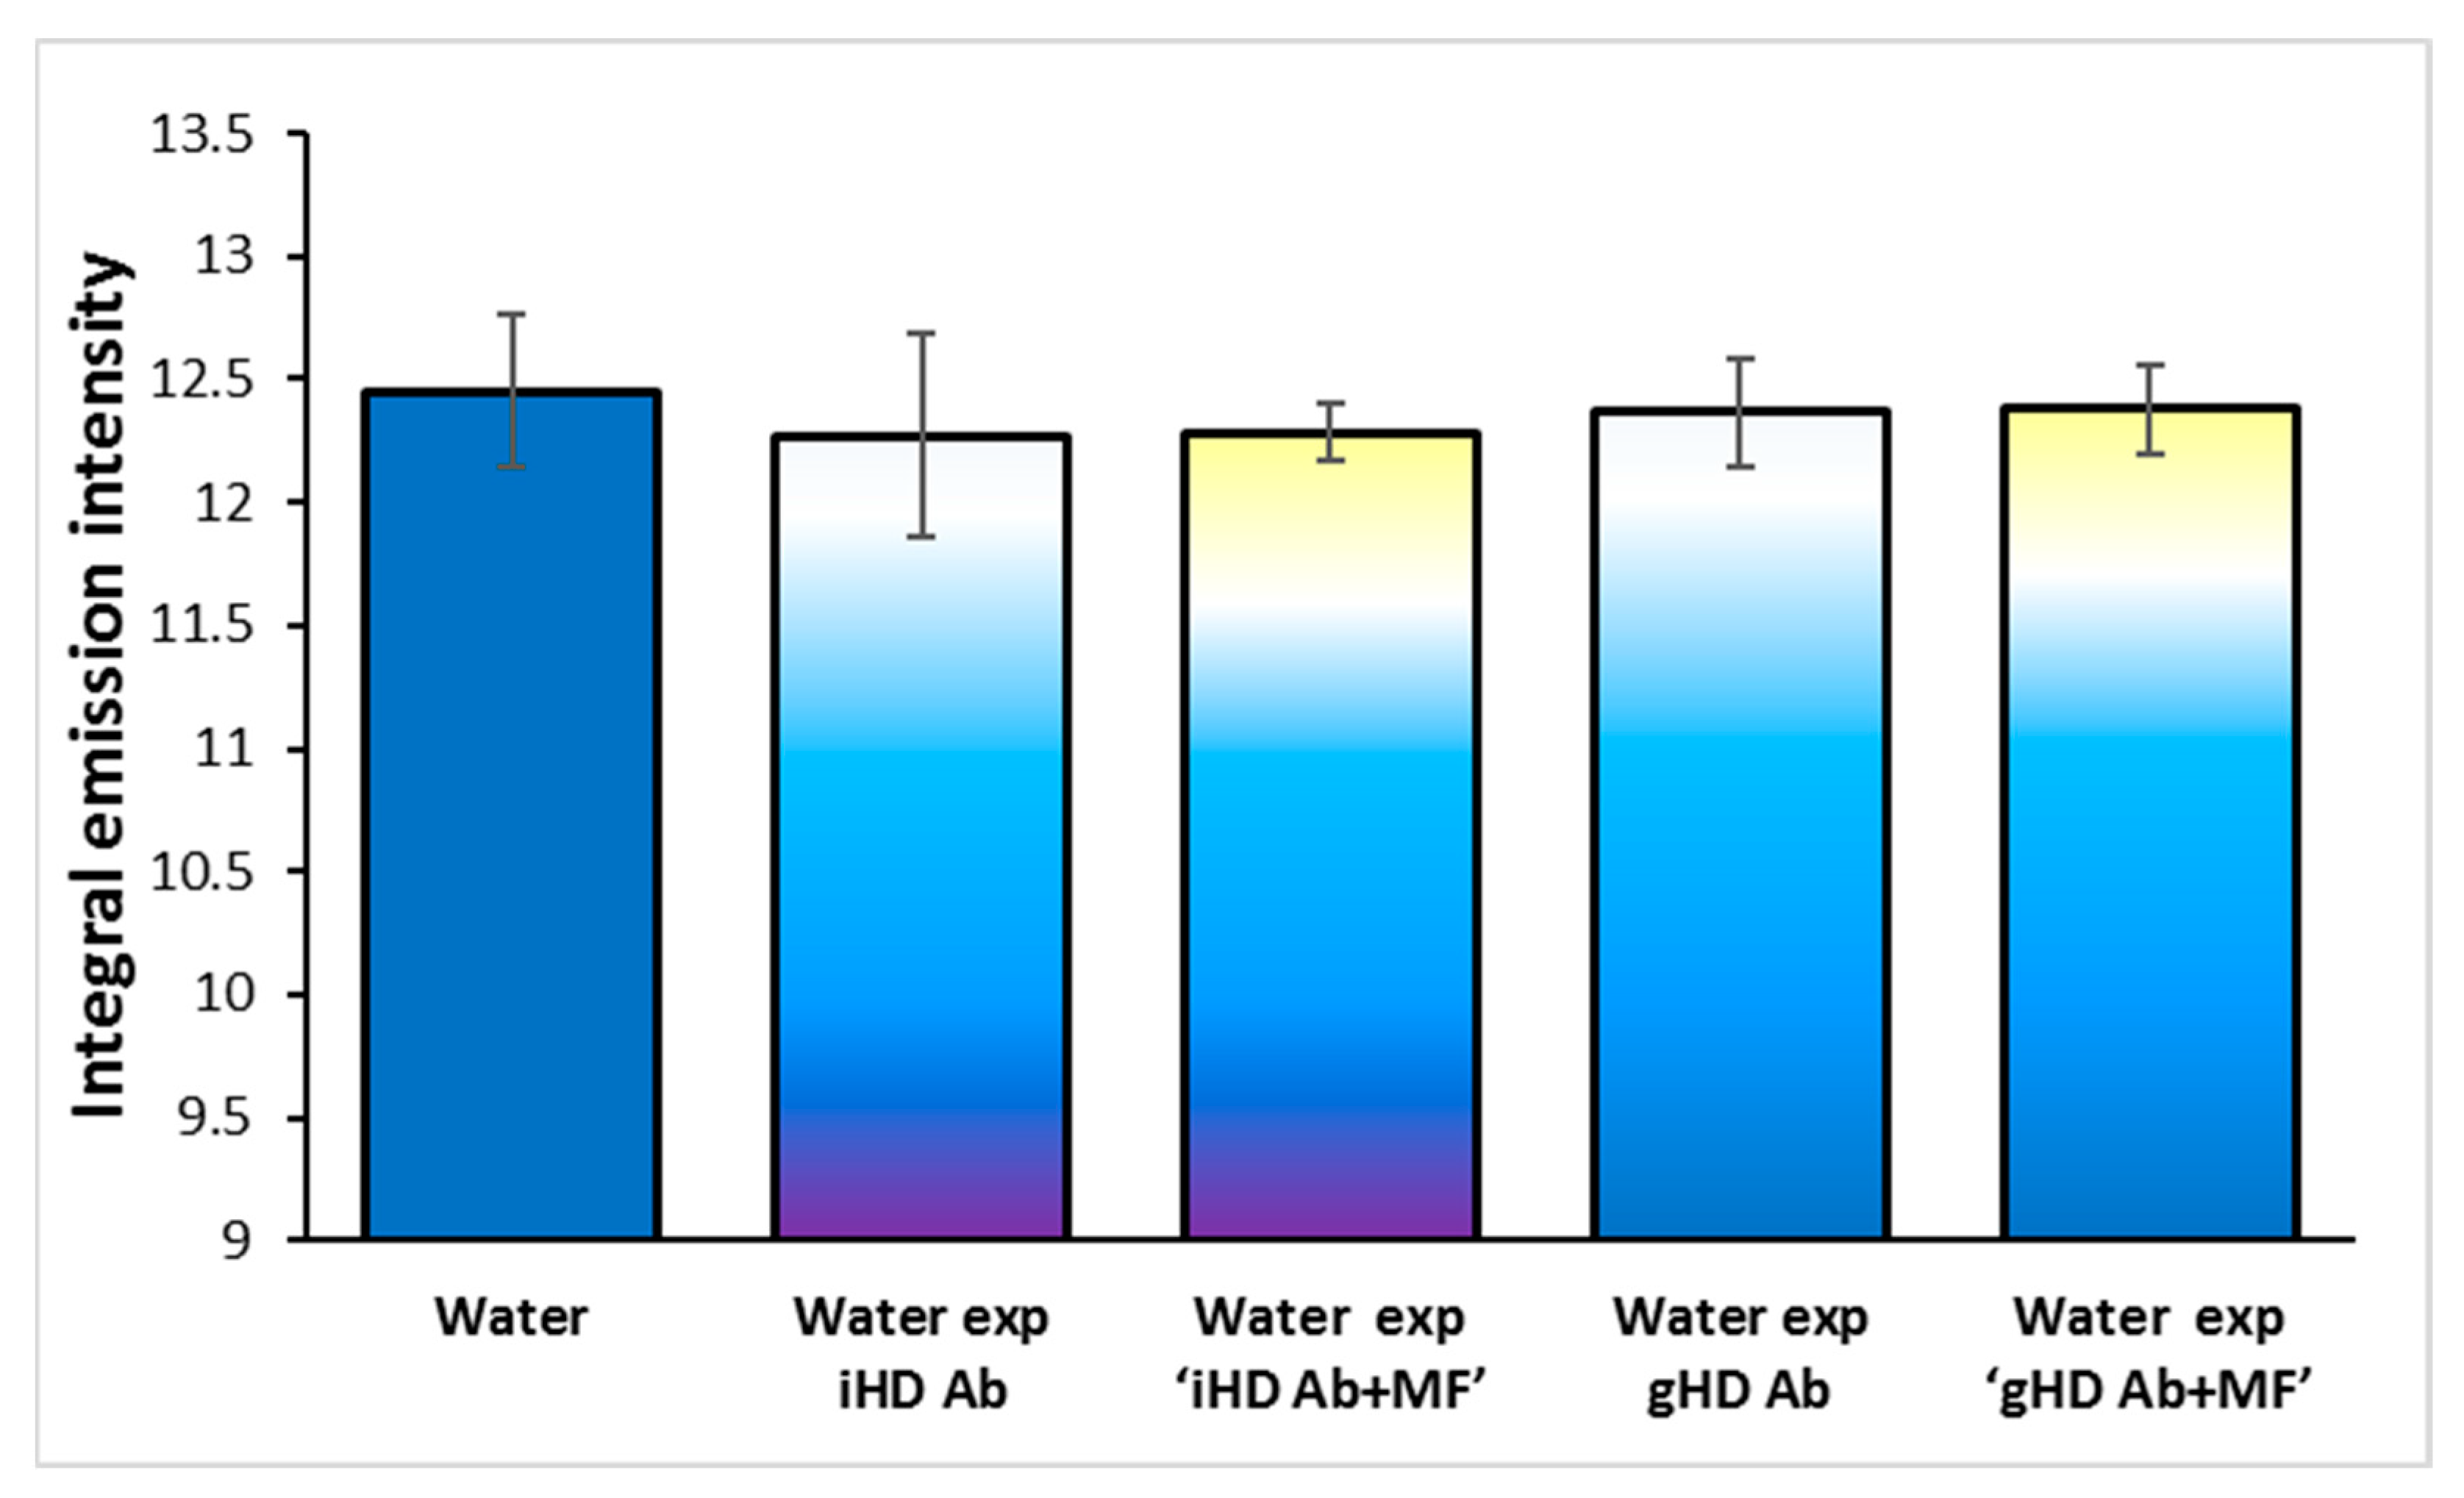
3.4. Non-Contact Effect of HD Ab Treated with a Magnetic Field on Water

In this section, we present the results of the determination of the integral emission intensities (in the range of 470–2000 cm−1) of samples of water after non-contact exposure to different effector solutions: iHD Ab and gHD Ab without and with their preliminary treatment with an MF (spectra not shown) (Figure 8), and the results of analysis of the shape of the spectra from the distribution of spectra in the space of the principal components (Figure 9).
As shown in Figure 8, iHD Ab treated with an MF (iHD Ab + MF) have a similar non-contact effect on water as iHD Ab; the integral emission intensity of water decreases (for 1 and 1.5%, correspondingly, p > 0.05). In this case, the shape of the spectra, compared to the distribution of samples in the space of the principal components, differ statistically significantly from the spectra of water (Figure 9).
The integral emission intensity of water after its non-contact incubation with gHD Ab or gHD Ab + MF decreased by less than 1% (p > 0.05). Based on the sample distribution data in the principal component space, it can also be concluded that neither gHD Ab nor gHD Ab + MF have a non-contact effect on the properties of water emission. Therefore, an MF does not have any effect on the ability of iHD Ab and gHD Ab to influence water in a non-contact manner.

4. Discussion

Currently, HD technology is successfully used in medicine [53,54] and technology [40,41], and other areas of its application are being pursued [55]. It is important to understand and consider the factors that affect the final characteristics of the product (such as activity, stability, etc.) during its development and production. Therefore, the properties of HD solutions must be carefully and comprehensively studied.
During the first stage of our work, we studied the influence of an MF on the properties of HD samples. We have shown that the influence of an MF on the spectrum and intensity of the intrinsic emission of the HD sample depends on the technology used in its preparation. In particular, the applied MF has a greater effect on the emission spectrum of the samples obtained by the repeated dilution procedure with intense mechanical action, and to a lesser extent on the spectrum of the samples obtained by the multiple dilution procedure with gentle mixing. This result is comparable with the conclusion of the work [56], which shows the dependence of the impedance measurement result not on the concentration of the dissolved substance, but on the procedure for sample preparation. Thus, the preliminary mechanical treatment of both an aqueous solution and the solvent itself (water) leads to a change in the investigated properties. The fact that an MF can affect the properties of HD samples must be considered during their production and quality control, and MF treatment should be applied to obtain HD solutions with desired characteristics.
Long-term (from tens of minutes to several days) effects of MF and EMF on the properties of solutions of complex molecules, electrolytes, and water are already known in the literature [3,19,57,58,59,60]. One of the mechanisms for realizing the effects of an MF is its influence on the structural organization of water: on clusters with a dipole moment or on bulk nanobubbles [16,60]. In [60] it is argued that the more complex the structure of water, the greater the influence of an MF. The long-term effects of mechanical action on water, which are expressed in a change in the level of water saturation with gas and a change in the formation of a submicron nanobubble phase, are shown in [61].
The results of our work are consistent with the conclusions of the above-mentioned studies: MF causes alterations in the aqueous structure of solutions. It is likely that intense shaking during the preparation of iHD Ab and HD water solutions leads to a more active formation of bulk nanobubbles, compared with gentle mixing during the preparation of gHD Ab. At least at the initial stages of the preparation, nucleating centers (molecules) are present in iHD Ab samples and absent in HD water solution. Such nucleating centers contribute to the formation of a larger number of inhomogeneities (nanobubbles, water clusters) in iHD Ab compared to water HD. Considering all of the above, we believe that it is water clusters, as well as the gas phase (represented by dissolved air molecules or stable bubbles formed as a result of mechanical action), that are the target for an MF. The change in the structural characteristics of water is the most likely reason for the change in its emissivity.
We have previously shown that HD solutions are capable of emission in the mid-IR range [47], which may determine their effect on the aqueous environment of the target without direct contact [42]. In a recent study, the presence of a distant effect of HD Ab to INFγ on the solution of INFγ was also demonstrated [62]. The authors showed that the non-contact effect of HD Ab to INFγ on the INFγ solution and water varies with different duration of their joint incubation, and also depends on the presence and parameters of the MF in which the sensor and effector samples are incubated. We assume that it is the emission of HD solutions, without their chemical interaction with the target, that determines their effects used in medicine and technology. In this regard, for the manufacturing process of products based on HD solutions, it is important to understand what factors will affect the implementation of their mechanism of action.
In continuation of this study, during the second stage of our work, we investigated the role of HD preparation technology in the implementation of the non-contact effect. In particular, we evaluated how the sensor sample emission changed after non-contact incubation with an effector sample prepared using different technologies. It turned out that the IR emission of HD water changed both after exposure to iHD Ab and to gHD Ab. At the same time, only iHD Ab but not gHD Ab changed intact water emission. Thus, solutions obtained using the multiple dilution procedure with intense mechanical action have a stronger non-contact effect on water than solutions obtained by multiple dilutions with gentle shaking. In addition, HD water is more sensitive to non-contact exposure than intact water. Therefore, for the manifestation of the non-contact effect, at least one of the solutions (sensor or effector) must undergo the HD procedure with intense shaking. This result must be considered both in the development and in the manufacturing of products based on HD solutions.
The fact that a system with a higher concentration of bulk nanobubbles (HD water), which are themselves susceptible to electromagnetic effects, is more sensitive to the non-contact effect of the effector solution, confirms the electromagnetic nature of the non-contact effect of the latter. Moreover, both the MF and the effector solution reduce the emission intensity of the sensor solutions.
The changes in IR-emission spectra are due to spontaneous transitions of molecules from excited vibrational energy levels with a nonzero population to the ground state. Thus, the possibility of emitting radiation by a substance at certain frequencies depends on the presence of the corresponding energy levels and their population. The position of vibrational energy levels is determined by the molecular structure of the substance, and their population depends on temperature according to the Boltzmann distribution:
N E N 0 = exp h ν k T
where NE—number of molecules at a level with energy E, N0—number of molecules at the ground state, ν—frequency of a photon emitted during the transition between these levels, h—Planck constant, k—Boltzmann constant, T—absolute temperature.
The presence of energy levels and their population determines the emissivity of the substance at the corresponding frequencies. Thus, the emission spectrum is completely determined by the molecular structure of the substance, which may differ for various solutions.
In this study, we consider the frequency range that corresponds to spontaneous transitions of water molecules from excited librational (440–1000 cm−1) and deformation (1550–1750 cm−1) levels. Librational vibrations are of an intermolecular nature, while deformation vibrations are intramolecular. It is important to note that intramolecular vibrations depend on intermolecular binding [52].
To interpret the obtained differences in the integral emission intensity of the samples, one can refer to the well-known two-structure model of water [1,63,64,65,66], according to which water can be divided into two fractions: low-density water (LDW) and high-density water (HDW). Summarizing the data obtained by different studies of water in the context of considering these two structures, it can be argued that their equilibrium coexistence is determined by fundamentally different thermodynamic criteria underlying their stability: the striving for the minimum enthalpy for LDW and the striving for the maximum entropy for HDW. Apparently, the observed changes in the emissivity of the analyzed solutions exposed to the MF and effector solutions are associated with a change in the ratio of these two fundamental phases of water.
Note that our data and conclusions about the effect of an MF and effector solutions on the water structure of the sensor solutions are consistent with data from other authors, in whose works the changes in the physical properties of water were found using various methods. For example, Liboff [15] described the change in the refractive index of water as a result of exposure to a weak MF of 0.05 μT with the cyclotron resonance frequency of the H9O4+ ion. In [67], the authors studied the effect of electric current passing through water with frequencies of 0.1–45 Hz and strength of the order of μA. Using an IR camera, a decrease in water temperature by 2 °K was registered after these impacts. It is known that alternating current, according to the Ampere–Maxwell law, generates an alternating MF. Therefore, the phenomena discussed by the authors belong to the same class as those discussed by us in this article. In [68], the authors also studied the effect of an MF on the structure of water. Based on theoretical and experimental data, it was concluded that the effect of an MF is limited to a redistribution of hydrogen bonds, namely, weakening of bonds within large cluster structures and strengthening of bonds within smaller structures.
During the third stage of our work, we evaluated the influence of an MF applied to the effector solution on the presence and magnitude of the non-contact effect. We demonstrated that an MF treatment did not affect the ability of iHD samples to cause a non-contact effect on water. In contrast, gHD samples, whether treated with an MF or not, had no detectable effect on water. The emission spectrum of iHD Ab or gHD Ab potentially has some specificity, which is not disturbed by the MF. The characteristics of the spectra of electromagnetic emission, which determine such specificity, have yet to be clarified. On the other hand, water itself seems to have a different sensitivity to exposure to electromagnetic radiation with a particular spectrum (i.e., exposure to different samples).
Future studies are needed to investigate other factors that could potentially affect the non-contact effect, namely whether it depends on the distance between the effector and the sensor solutions, on the area of contact between the effector and the sensor, and on the concentration of the sensor and the effector. In addition, it is important to determine for how long the changed properties of the sensor persist after the end of joint incubation with the effector, as well as whether the properties of the effector would change afterwards.

5. Conclusions

  • An MF with the cyclotron resonance frequency of H9O4+ changes the emission properties of highly diluted aqueous solutions.
  • Exposure to an MF and non-contact exposure to HD solution effectors similarly change the emission properties of solution sensors.
  • The manifestation of the non-contact effect of HD solutions depends on the technology of preparation of both the effector and sensor solutions. To implement the non-contact effect, at least one of the HD solutions must be prepared using intense shaking.
  • Pre-treatment of HD solution effectors with an MF does not affect the presence and magnitude of their non-contact effect on the IR-emission properties of water.

Funding

This research received no external funding.

Data Availability Statement

The data presented in this study are available on request from the corresponding author.

Acknowledgments

This work was performed in part on instruments of the Optical Microscopy and Spectrophotometry core facility, ICB RAS, Federal Research Center “Pushchino Scientific Center for Biological Research of the Russian Academy of Sciences” (https://www.pbcras.ru/services/tskp/). All samples for testing were provided by OOO “NPF “MATERIA MEDICA HOLDING” as a company for manufacturing drugs based on highly diluted antibodies.

Conflicts of Interest

Different versions of highly diluted antibodies to IFN-γ are the substances (single or one among other components) for commercial drugs produced by OOO “NPF “MATERIA MEDICA HOLDING”. Patents on this substance belong to OOO “NPF “MATERIA MEDICA HOLDING”. OOO “NPF “MATERIA MEDICA HOLDING” was not involved in the study design, collection, analysis, interpretation of data, the writing of this article, or the decision to submit it for publication. The author declares no other conflict of interest.

References

  1. Nilsson, A.; Pettersson, L.G. The structural origin of anomalous properties of liquid water. Nat. Commun. 2015, 6, 8998. [Google Scholar] [CrossRef]
  2. Zhao, L.; Ma, K.; Yang, Z. Changes of water hydrogen bond network with different externalities. Int. J. Mol. Sci. 2015, 16, 8454–8489. [Google Scholar] [CrossRef]
  3. Fesenko, E.E.; Gluvstein, A.Y. Changes in the state of water, induced by radiofrequency electromagnetic fields. FEBS Lett. 1995, 367, 53–55. [Google Scholar] [CrossRef]
  4. Chibowski, E.; Szcześ, A.; Hołysz, L. Influence of magnetic field on evaporation rate and surface tension of water. Colloids Interfaces 2018, 2, 68. [Google Scholar] [CrossRef]
  5. Ghaani, M.R.; Kusalik, P.G.; English, N.J. Massive generation of metastable bulk nanobubbles in water by external electric fields. Sci. Adv. 2020, 6, eaaz0094. [Google Scholar] [CrossRef]
  6. Sronsri, C.; U-yen, K.; Sittipol, W. Analyses of vibrational spectroscopy, thermal property and salt solubility of magnetized water. J. Mol. Liq. 2021, 323, 114613. [Google Scholar] [CrossRef]
  7. Wu, T.; Brant, J.A. Magnetic field effects on pH and electrical conductivity: Implications for water and wastewater treatment. Environ. Eng. Sci. 2020, 37, 717–727. [Google Scholar] [CrossRef]
  8. Wang, Y.; Wei, H.; Li, Z. Effect of magnetic field on the physical properties of water. Results Phys. 2018, 8, 262–267. [Google Scholar] [CrossRef]
  9. Sankin, G.N.; Teslenko, V.S. Slow variation of the electrical conductivity of water under weak permanent magnetic fields. Tech. Phys. 2000, 45, 351–352. [Google Scholar]
  10. Shcherbakov, I.A.; Baimler, I.V.; Gudkov, S.V.; Lyakhov, G.A.; Mikhailova, G.N.; Pustovoy, V.I.; Sarimov, R.M.; Simakin, A.V.; Troitsky, A.V. Influence of a constant magnetic field on some properties of water solutions. Dokl. Phys. 2020, 65, 273–275. [Google Scholar]
  11. Colic, M.; Morse, D. Mechanism of the long-term effects of electromagnetic radiation on solutions and suspended colloids. Langmuir 1998, 14, 783–787. [Google Scholar] [CrossRef]
  12. Dosar, A.A.; Srivastava, V. Improvement of hard water characteristics and scale formation under the effect of pulsating electromagnetic field. In Advances in Construction Materials and Sustainable Environment; Springer: Singapore, 2022; pp. 259–269. [Google Scholar]
  13. Liboff, A.R. The charge-to-mass icr signature in weak elf bioelectromagnetic effects. In Advances in Electromagnetic Fields in Living Systems; Springer: Boston, MA, USA, 2005; Volume 4, pp. 189–218. [Google Scholar]
  14. Halle, B. On the cyclotron resonance mechanism for magnetic field effects on transmembrane ion conductivity. Bioelectromagnetics 1988, 9, 381–385. [Google Scholar] [CrossRef]
  15. D’Emilia, E.; Ledda, M.; Foletti, A.; Lisi, A.; Giuliani, L.; Grimaldi, S.; Liboff, A.R. Weak-field H3O+ ion cyclotron resonance alters water refractive index. Electromagn. Biol. Med. 2017, 36, 55–62. [Google Scholar] [CrossRef]
  16. Colic, M.; Morse, D. The elusive mechanism of the magnetic ‘memory’ of water. Colloids Surf. A Physicochem. Eng. Asp. 1999, 154, 167–174. [Google Scholar] [CrossRef]
  17. Zhadin, M.N.; Novikov, V.V.; Barnes, F.S.; Pergola, N.F. Combined action of static and alternating magnetic fields on ionic current in aqueous glutamic acid solution. Bioelectromagnetics 1998, 19, 41–45. [Google Scholar] [CrossRef]
  18. Novikov, V.V.; Karnaukhov, A.V. Mechanism of action of weak electromagnetic field on ionic currents in aqueous solutions of amino acids. Bioelectromagnetics 1997, 18, 25–27. [Google Scholar] [CrossRef]
  19. Fesenko, E.E.; Geletyuk, V.I.; Kazachenko, V.N.; Chemeris, N.K. Preliminary microwave irradiation of water solutions changes their channel-modifying activity. FEBS Lett. 1995, 366, 49–52. [Google Scholar] [CrossRef]
  20. Grundler, W.; Kaiser, F.; Keilmann, F.; Walleczek, J. Mechanisms of electromagnetic interaction with cellular systems. Naturwissenschaften 1992, 79, 551–559. [Google Scholar] [CrossRef]
  21. Walleczek, J. Electromagnetic field effects on cells of the immune system: The role of calcium signaling. FASEB J. 1992, 6, 3177–3185. [Google Scholar] [CrossRef]
  22. Zieliński, M.; Zielińska, M.; Cydzik-Kwiatkowska, A.; Rusanowska, P.; Dębowski, M. Effect of static magnetic field on microbial community during anaerobic digestion. Bioresour. Technol. 2021, 323, 124600. [Google Scholar] [CrossRef]
  23. Yadollahpour, A.; Rashidi, S.; Fatemeh, K. Applications of magnetic water technology in farming and agriculture development: A review of recent advances. Curr. World Environ. 2014, 9, 695–703. [Google Scholar]
  24. Al-Hilali, A.H. Effect of magnetically treated water on physiological and biochemical blood parameters of japanese quail. Int. J. Poult. Sci. 2018, 17, 78–84. [Google Scholar] [CrossRef]
  25. Carbonell, M.V.; Martínez, E.; Díaz, J.E.; Amaya, J.M.; Flórez, M. Influence of magnetically treated water on germination of signalgrass seeds. Seed Sci. Technol. 2004, 32, 617–619. [Google Scholar] [CrossRef]
  26. Hozayn, M.; Elaoud, A.; El-Monem, A.A.A.; Salah, N.B. Effect of magnetic field on growth and yield of barley treated with different salinity levels. Arab. J. Geosci. 2021, 14, 701. [Google Scholar] [CrossRef]
  27. Elhindi, K.M.; Al-Mana, F.A.; Algahtani, A.M.; Alotaibi, M.A. Effect of irrigation with saline magnetized water and different soil amendments on growth and flower production of calendula officinalis L. plants. Saudi J. Biol. Sci. 2020, 27, 3072–3078. [Google Scholar] [CrossRef]
  28. Bashasha, J.A.; El-Mugrbi, W.S.; Imryed, Y.F. Effect of magnetic treatment in improve growth of three wheat cultivars irrigated with seawater. Multidiscip. Sci. Adv. Technol. 2021, 1, 24–32. [Google Scholar]
  29. El Sabry, M.I.; Abdelfattah, M.H.; Abdellatif, H.A.; Aggrey, S.E.; Elnesr, S.S. Physicochemical properties of magnetic water and its effect on egg production traits in hens at late laying period. J. Anim. Plant Sci. 2021, 31, 317–321. [Google Scholar]
  30. Lee, H.J.; Kang, M.H. Effect of the magnetized water supplementation on blood glucose, lymphocyte DNA damage, antioxidant status, and lipid profiles in stz-induced rats. Nutr. Res. Pr. 2013, 7, 34–42. [Google Scholar] [CrossRef]
  31. Al-Saffar, S.F.; Amer, N.; Zaki, L.S.; Faris, A.S.; Imran, N.J.; Nadhim, Z.F.; Jaafar, R.I. Effect of magnetized water on histological structure of heart, lung and spleen of albino rats. J. Al-Nahrain Univ. 2020, 16, 152–160. [Google Scholar] [CrossRef]
  32. Ahmed, N.H.; El-Hamed, N.N.B.A. Impact of magnetic water treatment technology on water parameters, growth performance and blood parameters of the nile tilapia (Oreochromis niloticus). Egypt. J. Aquat. Biol. Fish. 2020, 24, 645–655. [Google Scholar] [CrossRef]
  33. Gudkov, S.V.; Penkov, N.V.; Baimler, I.V.; Lyakhov, G.A.; Pustovoy, V.I.; Simakin, A.V.; Sarimov, R.M.; Scherbakov, I.A. Effect of mechanical shaking on the physicochemical properties of aqueous solutions. Int. J. Mol. Sci. 2020, 21, 8033. [Google Scholar] [CrossRef] [PubMed]
  34. Gudkov, S.V.; Baimler, I.V.; Uvarov, O.V.; Smirnova, V.V.; Volkov, M.Y.; Semenova, A.A.; Lisitsyn, A.B. Influence of the concentration of Fe and Cu nanoparticles on the dynamics of the size distribution of nanoparticles. Front. Phys. 2020, 8, 622551. [Google Scholar] [CrossRef]
  35. Ryzhkina, I.S.; Murtazina, L.I.; Kiseleva, Y.V.; Konovalov, A.I. Self-organization and physicochemical properties of aqueous solutions of the antibodies to interferon gamma at ultrahigh dilution. Dokl. Phys. Chem. 2015, 462, 110–114. [Google Scholar] [CrossRef]
  36. Don, E.; Farafonova, O.; Pokhil, S.; Barykina, D.; Nikiforova, M.; Shulga, D.; Borshcheva, A.; Tarasov, S.; Ermolaeva, T.; Epstein, O. Use of piezoelectric immunosensors for detection of interferon-gamma interaction with specific antibodies in the presence of released-active forms of antibodies to interferon-gamma. Sensors 2016, 16, 96. [Google Scholar] [CrossRef]
  37. Kardash, E.V.; Ertuzun, I.A.; Khakimova, G.R.; Kolyadin, A.N.; Tarasov, S.A.; Wagner, S.; Andriambeloson, E.; Ivashkin, V.T.; Epstein, O.I. Dose-response effect of antibodies to S100 protein and cannabinoid receptor type 1 in released-active form in the light-dark test in mice. Dose Response 2018, 16, 1559325818779752. [Google Scholar] [CrossRef]
  38. Castagne, V.; Lemaire, M.; Kheyfets, I.; Dugina, J.L.; Sergeeva, S.A.; Epstein, O.I. Antibodies to S100 proteins have anxiolytic-like activity at ultra-low doses in the adult rat. J. Pharm. Pharmacol. 2008, 60, 309–316. [Google Scholar] [CrossRef] [PubMed]
  39. Pschenitza, M.; Gavrilova, E.S.; Tarasov, S.; Knopp, D.; Niessner, R.; Epstein, O.I. Application of a heterogeneous immunoassay for the quality control testing of release-active forms of diclofenac. Int. Immunopharmacol. 2014, 21, 225–230. [Google Scholar] [CrossRef]
  40. Spitsin, A.I.; Bush, A.A.; Kamentsev, K.E. Piezoelectric and dielectric properties of Bi3TiNbO9 prepared by hot pressing from powders activated using the serial dilution method. Sci. Rep. 2020, 10, 22198. [Google Scholar] [CrossRef]
  41. Kamentsev, K.E.; Bush, A.A. The superconducting properties of YBa2Cu3Oy ceramics fabricated using ultrahigh dilution technology. Ceram. Int. 2022, 48, 32196–32204. [Google Scholar] [CrossRef]
  42. Penkov, N. Antibodies processed using high dilution technology distantly change structural properties of IFNγ aqueous solution. Pharmaceutics 2021, 13, 1864. [Google Scholar] [CrossRef]
  43. Penkov, N.; Penkova, N. Analysis of emission infrared spectra of protein solutions in low concentrations. Front. Phys. 2020, 8, 624779. [Google Scholar] [CrossRef]
  44. Novikov, V.V.; Yablokova, E.V.; Fesenko, E.E. The role of water in the effect of weak combined magnetic fields on production of reactive oxygen species (ROS) by neutrophils. Appl. Sci. 2020, 10, 3326. [Google Scholar] [CrossRef]
  45. Tarasov, S.A.; Gorbunov, E.A.; Don, E.S.; Emelyanova, A.G.; Kovalchuk, A.L.; Yanamala, N.; Schleker, A.S.S.; Klein-Seetharaman, J.; Groenestein, R.; Tafani, J.P.; et al. Insights into the mechanism of action of highly diluted biologics. J. Immunol. 2020, 205, 1345–1354. [Google Scholar] [CrossRef]
  46. Penkov, N.V.; Penkova, N.A. Infrared emission spectroscopy for investigation of biological molecules in aqueous solutions. Phys. Wave Phenom. 2021, 29, 164–168. [Google Scholar] [CrossRef]
  47. Penkov, N.; Penkova, N. Measurement of the emission spectra of protein solutions in the infrared range. Description of the method and testing using solution of human interferon gamma as an example. Front. Phys. 2020, 8, 615917. [Google Scholar] [CrossRef]
  48. Qin, B.; Li, Z.; Luo, Z.; Li, Y.; Zhang, H. Terahertz time-domain spectroscopy combined with PCA-CFSFDP applied for pesticide detection. Opt. Quantum Electron. 2017, 49, 244. [Google Scholar] [CrossRef]
  49. Zhang, N.; Leatham, K.; Xiong, J.; Zhong, J. PCA-K-means based clustering algorithm for high dimensional and overlapping spectra signals. In Proceedings of the 2018 Ninth International Conference on Intelligent Control and Information Processing (ICICIP), Wanzhou, China, 9–11 November 2018; pp. 349–354. [Google Scholar]
  50. Lima, R.P.D.; Marfurt, K.J. Principal component analysis and k-means analysis of airborne gamma-ray spectrometry surveys. In Seg Technical Program Expanded Abstracts 2018; Society of Exploration Geophysicists: Houston, TX, USA, 2018; pp. 2277–2281. [Google Scholar]
  51. Kamath, S.D.; Mahato, K.K. Optical pathology using oral tissue fluorescence spectra: Classification by principal component analysis and k-means nearest neighbor analysis. J. Biomed. Opt. 2007, 12, 014028. [Google Scholar] [CrossRef]
  52. Yukhnevich, G.V. Infrakrasnaya Spektroskopiya Vody (Infrared Spectroscopy of Water); Nauka: Moscow, Russia, 1973; p. 208. [Google Scholar]
  53. Mkrtumyan, A.; Ametov, A.; Demidova, T.; Volkova, A.; Dudinskaya, E.; Vertkin, A.; Vorobiev, S. A new approach to overcome insulin resistance in patients with impaired glucose tolerance: The results of a multicenter, double-blind, placebo-controlled, randomized clinical trial of efficacy and safety of subetta. J. Clin. Med. 2022, 11, 1390. [Google Scholar] [CrossRef]
  54. Geppe, N.A.; Blokhin, B.M.; Shamsheva, O.V.; Abdrakhmanova, S.T.; Alikhanova, K.A.; Myrzabekova, G.T. Efficacy and safety of Ergoferon in children from 6 months to 6 years old with acute respiratory viral infections in contemporary outpatient practice: A multicenter, double-blind, placebo-controlled randomized trial. Can. Respir. J. 2021, 2021, 5570178. [Google Scholar] [CrossRef]
  55. Chatterjee, A.; Paul, B.K.; Kar, S.; Das, S.; Basu, R.; Bhar, D.S.; Nandy, P.S. Effect of ultrahigh diluted homeopathic medicines on the electrical properties of PVDF-HFP. Int. J. High Dilution Res. 2016, 5, 10–17. [Google Scholar] [CrossRef]
  56. Lobyshev, V.I. Non-monotonous impedance patterns of diclofenac centesimal potentiated solutions and their evolution. Water 2022. [Google Scholar] [CrossRef]
  57. Bunkin, N.F.; Bolotskova, P.N.; Bondarchuk, E.V.; Gryaznov, V.G.; Gudkov, S.V.; Kozlov, V.A.; Okuneva, M.A.; Ovchinnikov, O.V.; Smoliy, O.P.; Turkanov, I.F. Long-term effect of low-frequency electromagnetic irradiation in water and isotonic aqueous solutions as studied by photoluminescence from polymer membrane. Polymers 2021, 13, 1443. [Google Scholar] [CrossRef]
  58. Szcześ, A.; Chibowski, E.; Hołysz, L.; Rafalski, P. Effects of static magnetic field on water at kinetic condition. Chem. Eng. Process. Process Intensif. 2011, 50, 124–127. [Google Scholar] [CrossRef]
  59. Coey, J.M.D.; Cass, S. Magnetic water treatment. J. Magn. Magn. Mater. 2000, 209, 71–74. [Google Scholar] [CrossRef]
  60. Gorlenko, N.P.; Safronov, V.N.; Abzaev, Y.A.; Sarkisov, Y.S.; Kugaevskaya, S.N.; Ermilova, T.A. Magnetic field as factor of control for structure and properties of cement systems. Part 1. Theoretical prerequisites for magnetic effect on physicochemical processes. Vestn. Tomsk. State Univ. Archit. Build. 2015, 3, 134–150. [Google Scholar]
  61. Penkov, V.N. Temporal dynamics of the scattering properties of deionized water. Phys. Wave Phenom. 2020, 28, 135–139. [Google Scholar] [CrossRef]
  62. Novikov, V.V.; Yablokova, E.V. Interaction between highly diluted samples, protein solutions and water in a controlled magnetic field. Appl. Sci. 2022, 12, 5185. [Google Scholar] [CrossRef]
  63. Huang, C.; Wikfeldt, K.T.; Tokushima, T.; Nordlund, D.; Harada, Y.; Bergmann, U.; Niebuhr, M.; Weiss, T.M.; Horikawa, Y.; Leetmaa, M.; et al. The inhomogeneous structure of water at ambient conditions. Proc. Natl. Acad. Sci. USA 2009, 106, 15214–15218. [Google Scholar] [CrossRef]
  64. Marechal, Y. The molecular structure of liquid water delivered by absorption spectroscopy in the whole IR region completed with thermodynamics data. J. Mol. Struct. 2011, 1004, 146–155. [Google Scholar] [CrossRef]
  65. Holten, V.; Anisimov, M.A. Entropy-driven liquid-liquid separation in supercooled water. Sci. Rep. 2012, 2, 713. [Google Scholar] [CrossRef]
  66. Russo, J.; Tanaka, H. Understanding water’s anomalies with locally favoured structures. Nat. Commun. 2014, 5, 3556. [Google Scholar] [CrossRef]
  67. Rad, I.; Pollack, G.H. Cooling of pure water at room temperature by weak electric currents. J. Phys. Chem. B 2018, 122, 7711–7717. [Google Scholar] [CrossRef] [PubMed]
  68. Toledo, E.J.L.; Ramalho, T.C.; Magriotis, Z.M. Influence of magnetic field on physical–chemical properties of the liquid water: Insights from experimental and theoretical models. J. Mol. Struct. 2008, 888, 409–415. [Google Scholar] [CrossRef]
Figure 1. The spectrum of intrinsic emission of water. (a) full recorded emission spectrum in the range of 430–7000 cm−1, (b) zoomed spectral region in the range of 470–2000 cm−1, and (c) zoomed spectral region in the range of 1810–4100 cm−1.
Water 15 00599 g001
Figure 2. Emission spectra of samples in the range of 470–2000 cm−1 before and after magnetic field treatment. ‘+MF’ indicates that the solution has been exposed to a magnetic field. (a) water, (b) HD water, (c) iHD Ab, and (d) gHD antibody.
Water 15 00599 g002aWater 15 00599 g002b
Figure 3. Emission intensities of samples in the spectral range of 470–2000 cm−1 before and after exposure to a magnetic field. ‘+MF’ indicates that the solution has been exposed to a magnetic field. Data are presented as mean ± SD. *—statistically significant difference in the integral emission intensity of the sample after the action of the magnetic field and the corresponding sample before the action of the magnetic field (p < 0.05, Welch test with the Holm correction).
Water 15 00599 g003
Figure 4. The influence of a magnetic field (+MF) on the distribution of spectra in the wavelength range of 470–2000 cm−1 in the space of the principal components. Double-sided arrows depict statistically significant differences in the emission spectra between the parenthetical groups (p < 0.05, comparison of the K-means with the Holm correction).
Water 15 00599 g004
Figure 5. Emission spectra of samples ((a) water, (b) HD water) before and after non-contact action of iHD Ab and gHD Ab in the range of 470–2000 cm−1. In sample labels, ‘exp’ means ‘ exposed to’.
Water 15 00599 g005
Figure 6. Integral emission intensities of water samples and HD water before and after the non-contact impact of iHD Ab and gHD Ab in the spectral range of 470–2000 cm−1. In sample labels, ‘exp’ means ‘exposed to’. Data are presented as mean ± SD.
Water 15 00599 g006
Figure 7. The influence of non-contact impact of iHD Ab and gHD Ab on the distribution of water and HD water samples spectra in the wavelength range of 470–2000 cm−1 in the space of the principal components. In sample labels, ‘exp’ means ‘exposed to’. Double-sided arrows depict statistically significant differences in the emission spectra between the parenthetical groups (p < 0.05, comparison of the K-means with the Holm correction).
Water 15 00599 g007
Figure 8. Integral intensity of emission in the range of 470–2000 cm−1 of samples of water and water exposed to iHD Ab and gHD Ab, without and with their preliminary treatment with a magnetic field. In sample labels, ‘exp’ means ‘exposed to’, ‘+MF’ means ‘treated with a magnetic field’. Data are presented as mean ± SD.
Water 15 00599 g008
Figure 9. The influence of non-contact impact of iHD Ab and gHD Ab treated with a magnetic field on the distribution of water samples spectra in the wavelength range of 470–2000 cm−1 in the space of the principal components. In sample labels, ‘exp’ means ‘exposed to’, ‘+MF’ means ‘treated with a magnetic field’. Data are presented as mean ± SD. Double-sided arrows depict statistically significant differences in the emission spectra between the parenthetical groups (p < 0.05, comparison of the K-means with the Holm correction).
Water 15 00599 g009
Disclaimer/Publisher’s Note: The statements, opinions and data contained in all publications are solely those of the individual author(s) and contributor(s) and not of MDPI and/or the editor(s). MDPI and/or the editor(s) disclaim responsibility for any injury to people or property resulting from any ideas, methods, instructions or products referred to in the content.

