
Integration of Transcriptomics and Metabolomics for Evaluating Changes in the Liver of Zebrafish Exposed to a Sublethal Dose of Cyantraniliprole

Abstract
1. Introduction
2. Materials and Methods
2.1. Reagents and Animals
2.2. Determination of LC50
2.3. Short-Term Exposure Test
2.4. Transcriptome and Metabolic Analysis
2.4.1. Transcriptome Analysis
2.4.2. Metabolic Analysis
2.5. Differential Gene and Metabolite Association Analysis
3. Results
3.1. LC50 Value
3.2. Liver Transcription Results
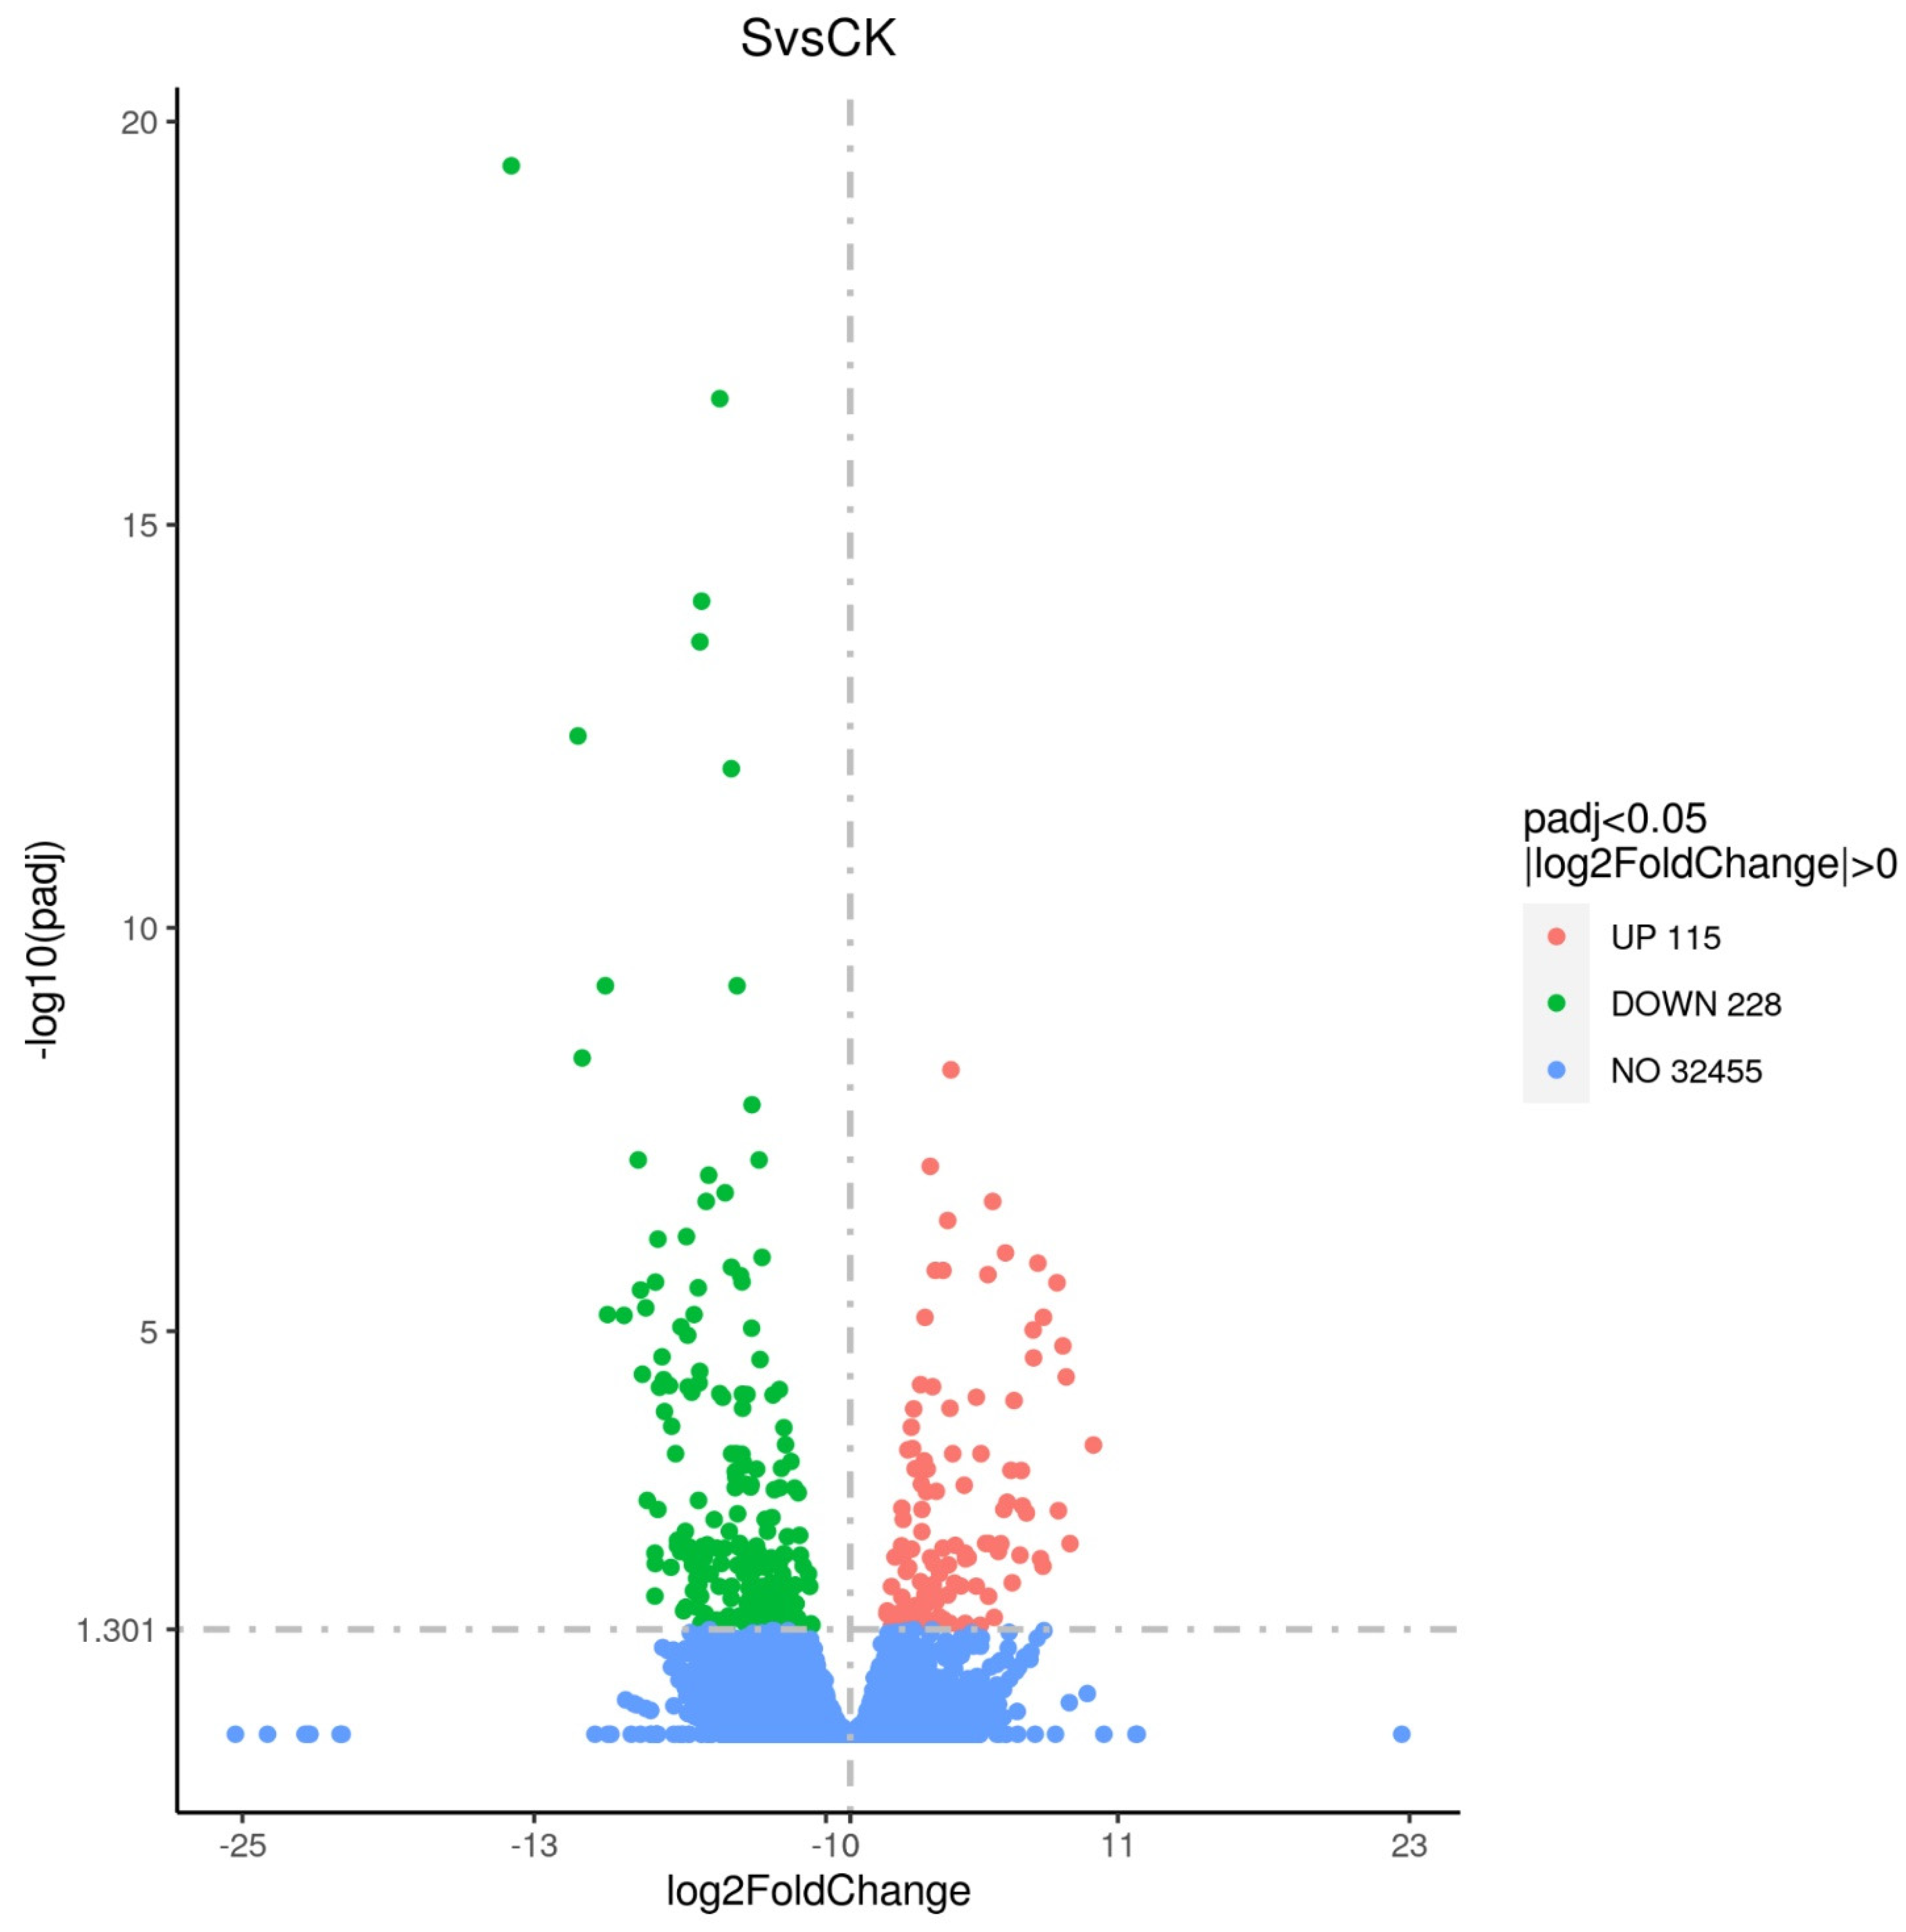
3.2.1. Differential Genes in Groups after Exposure to Cyantraniliprole
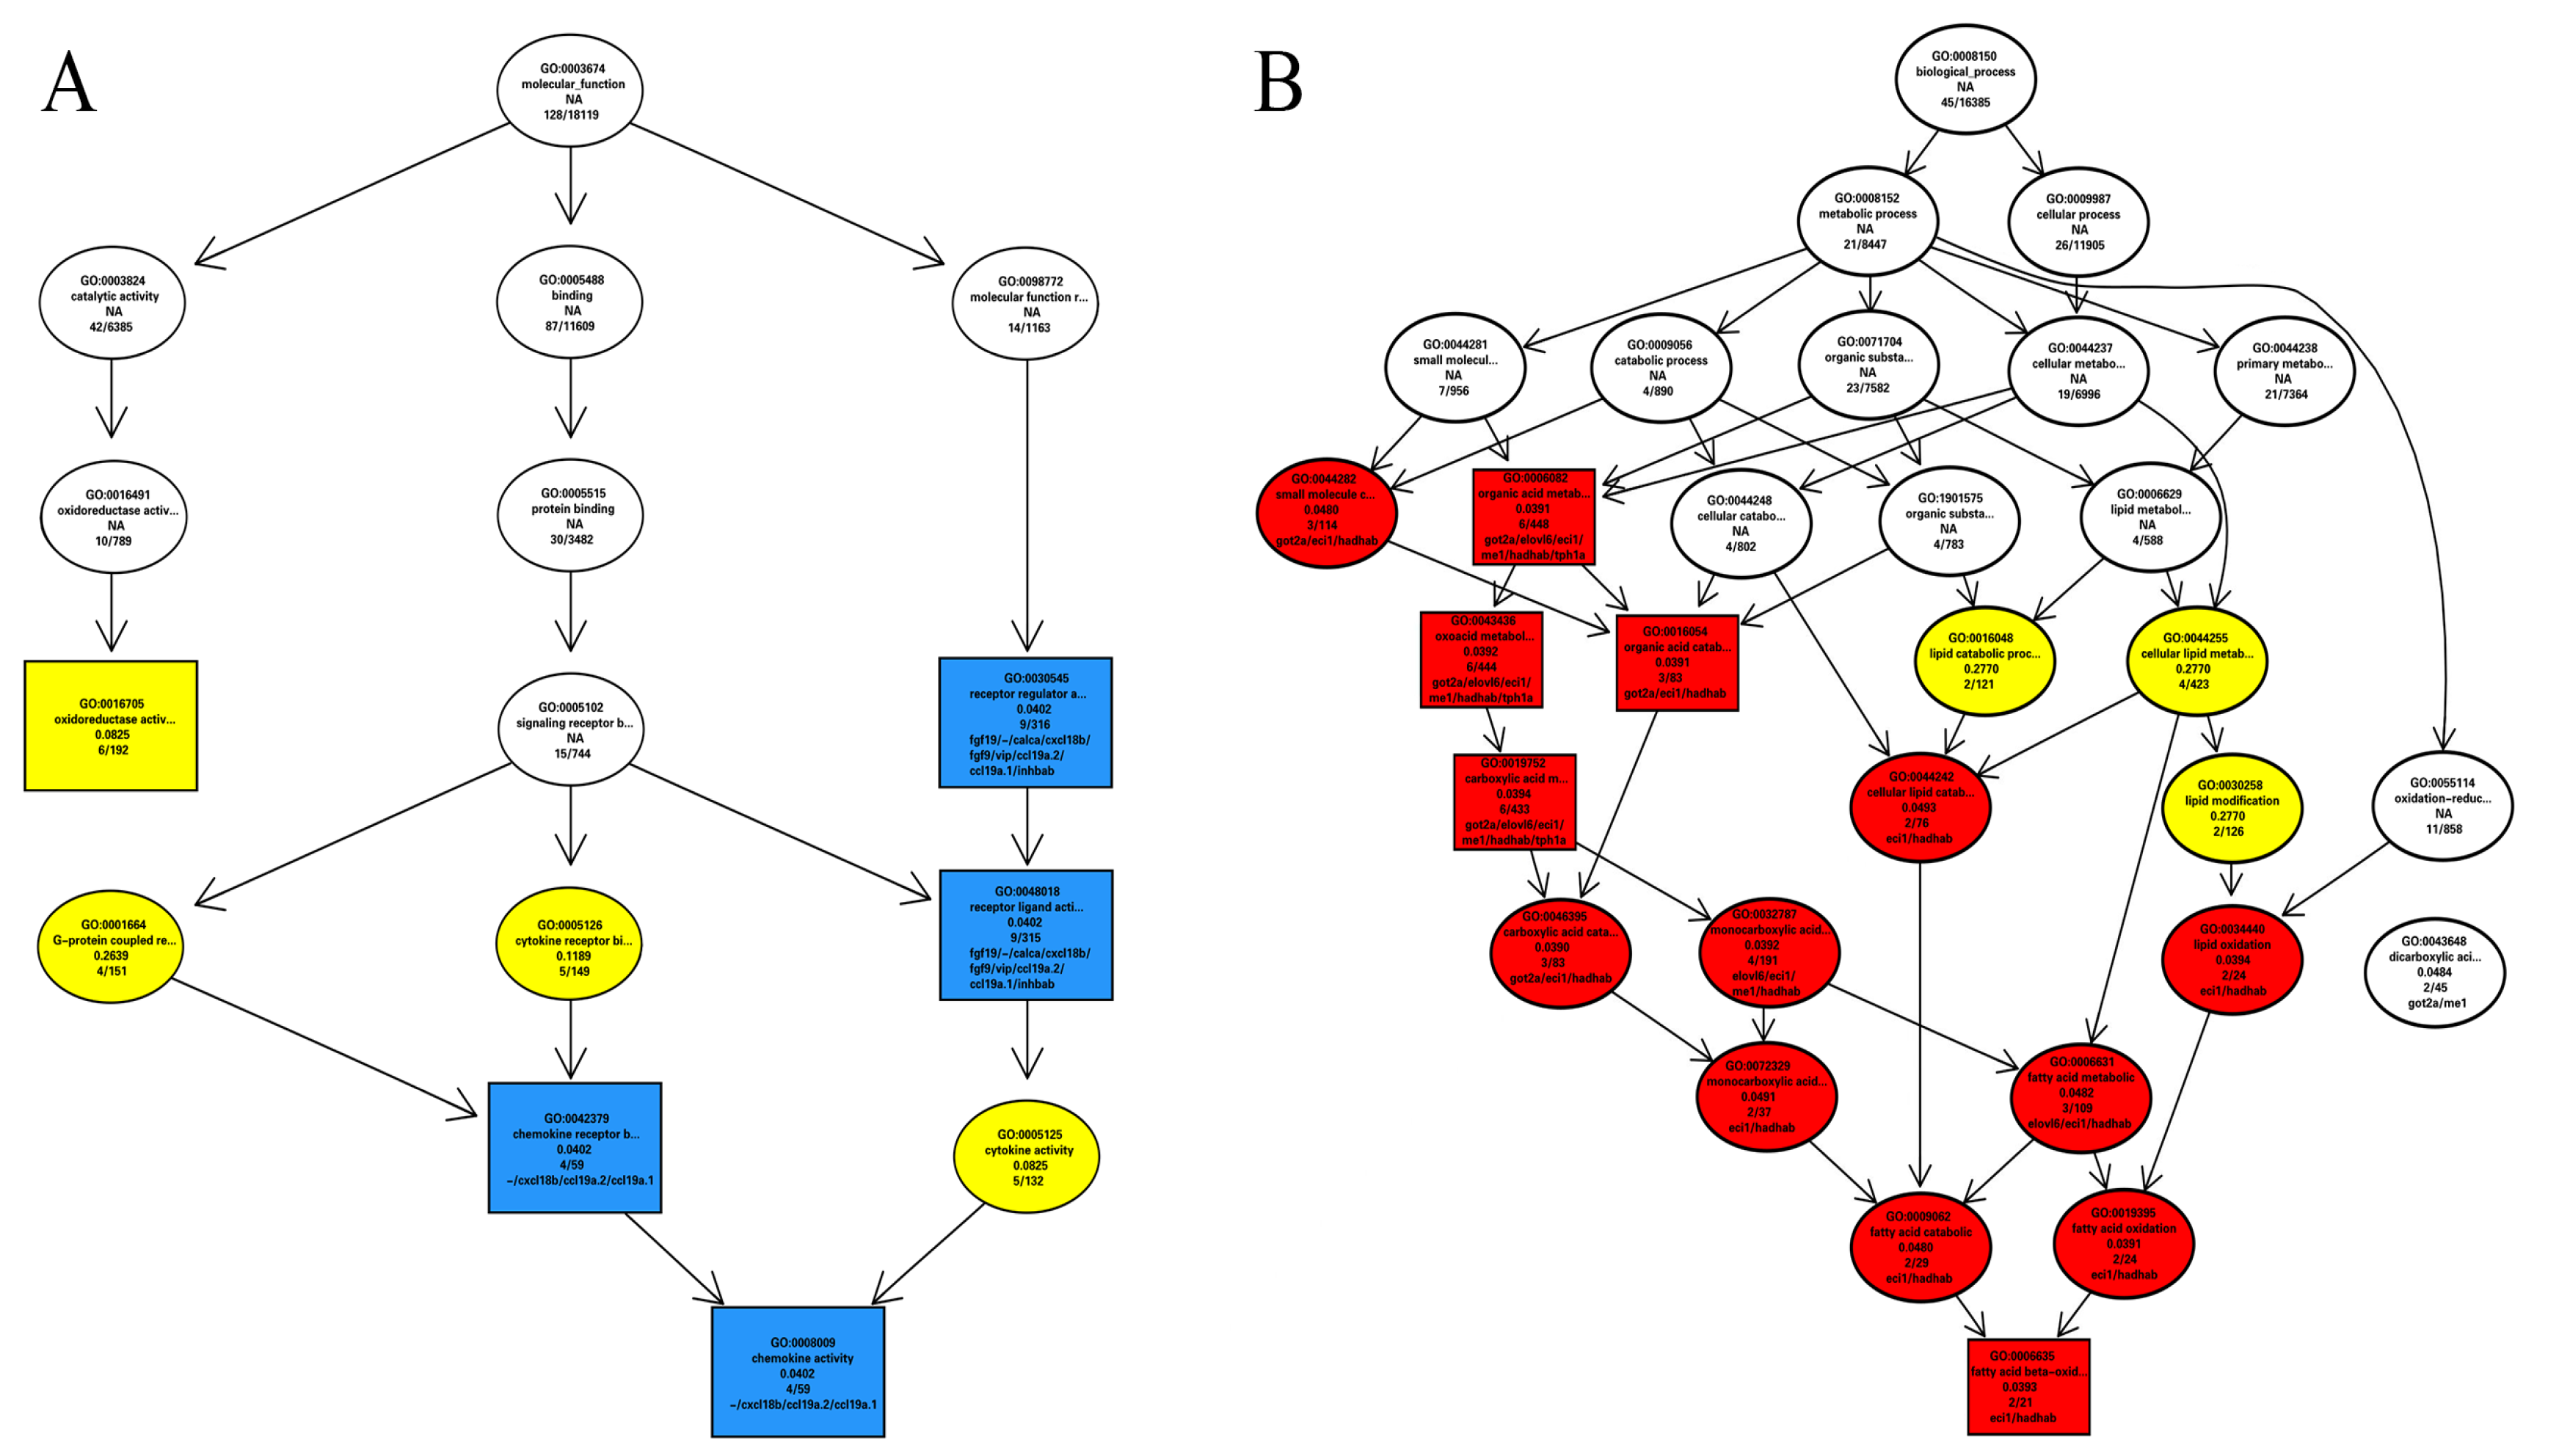
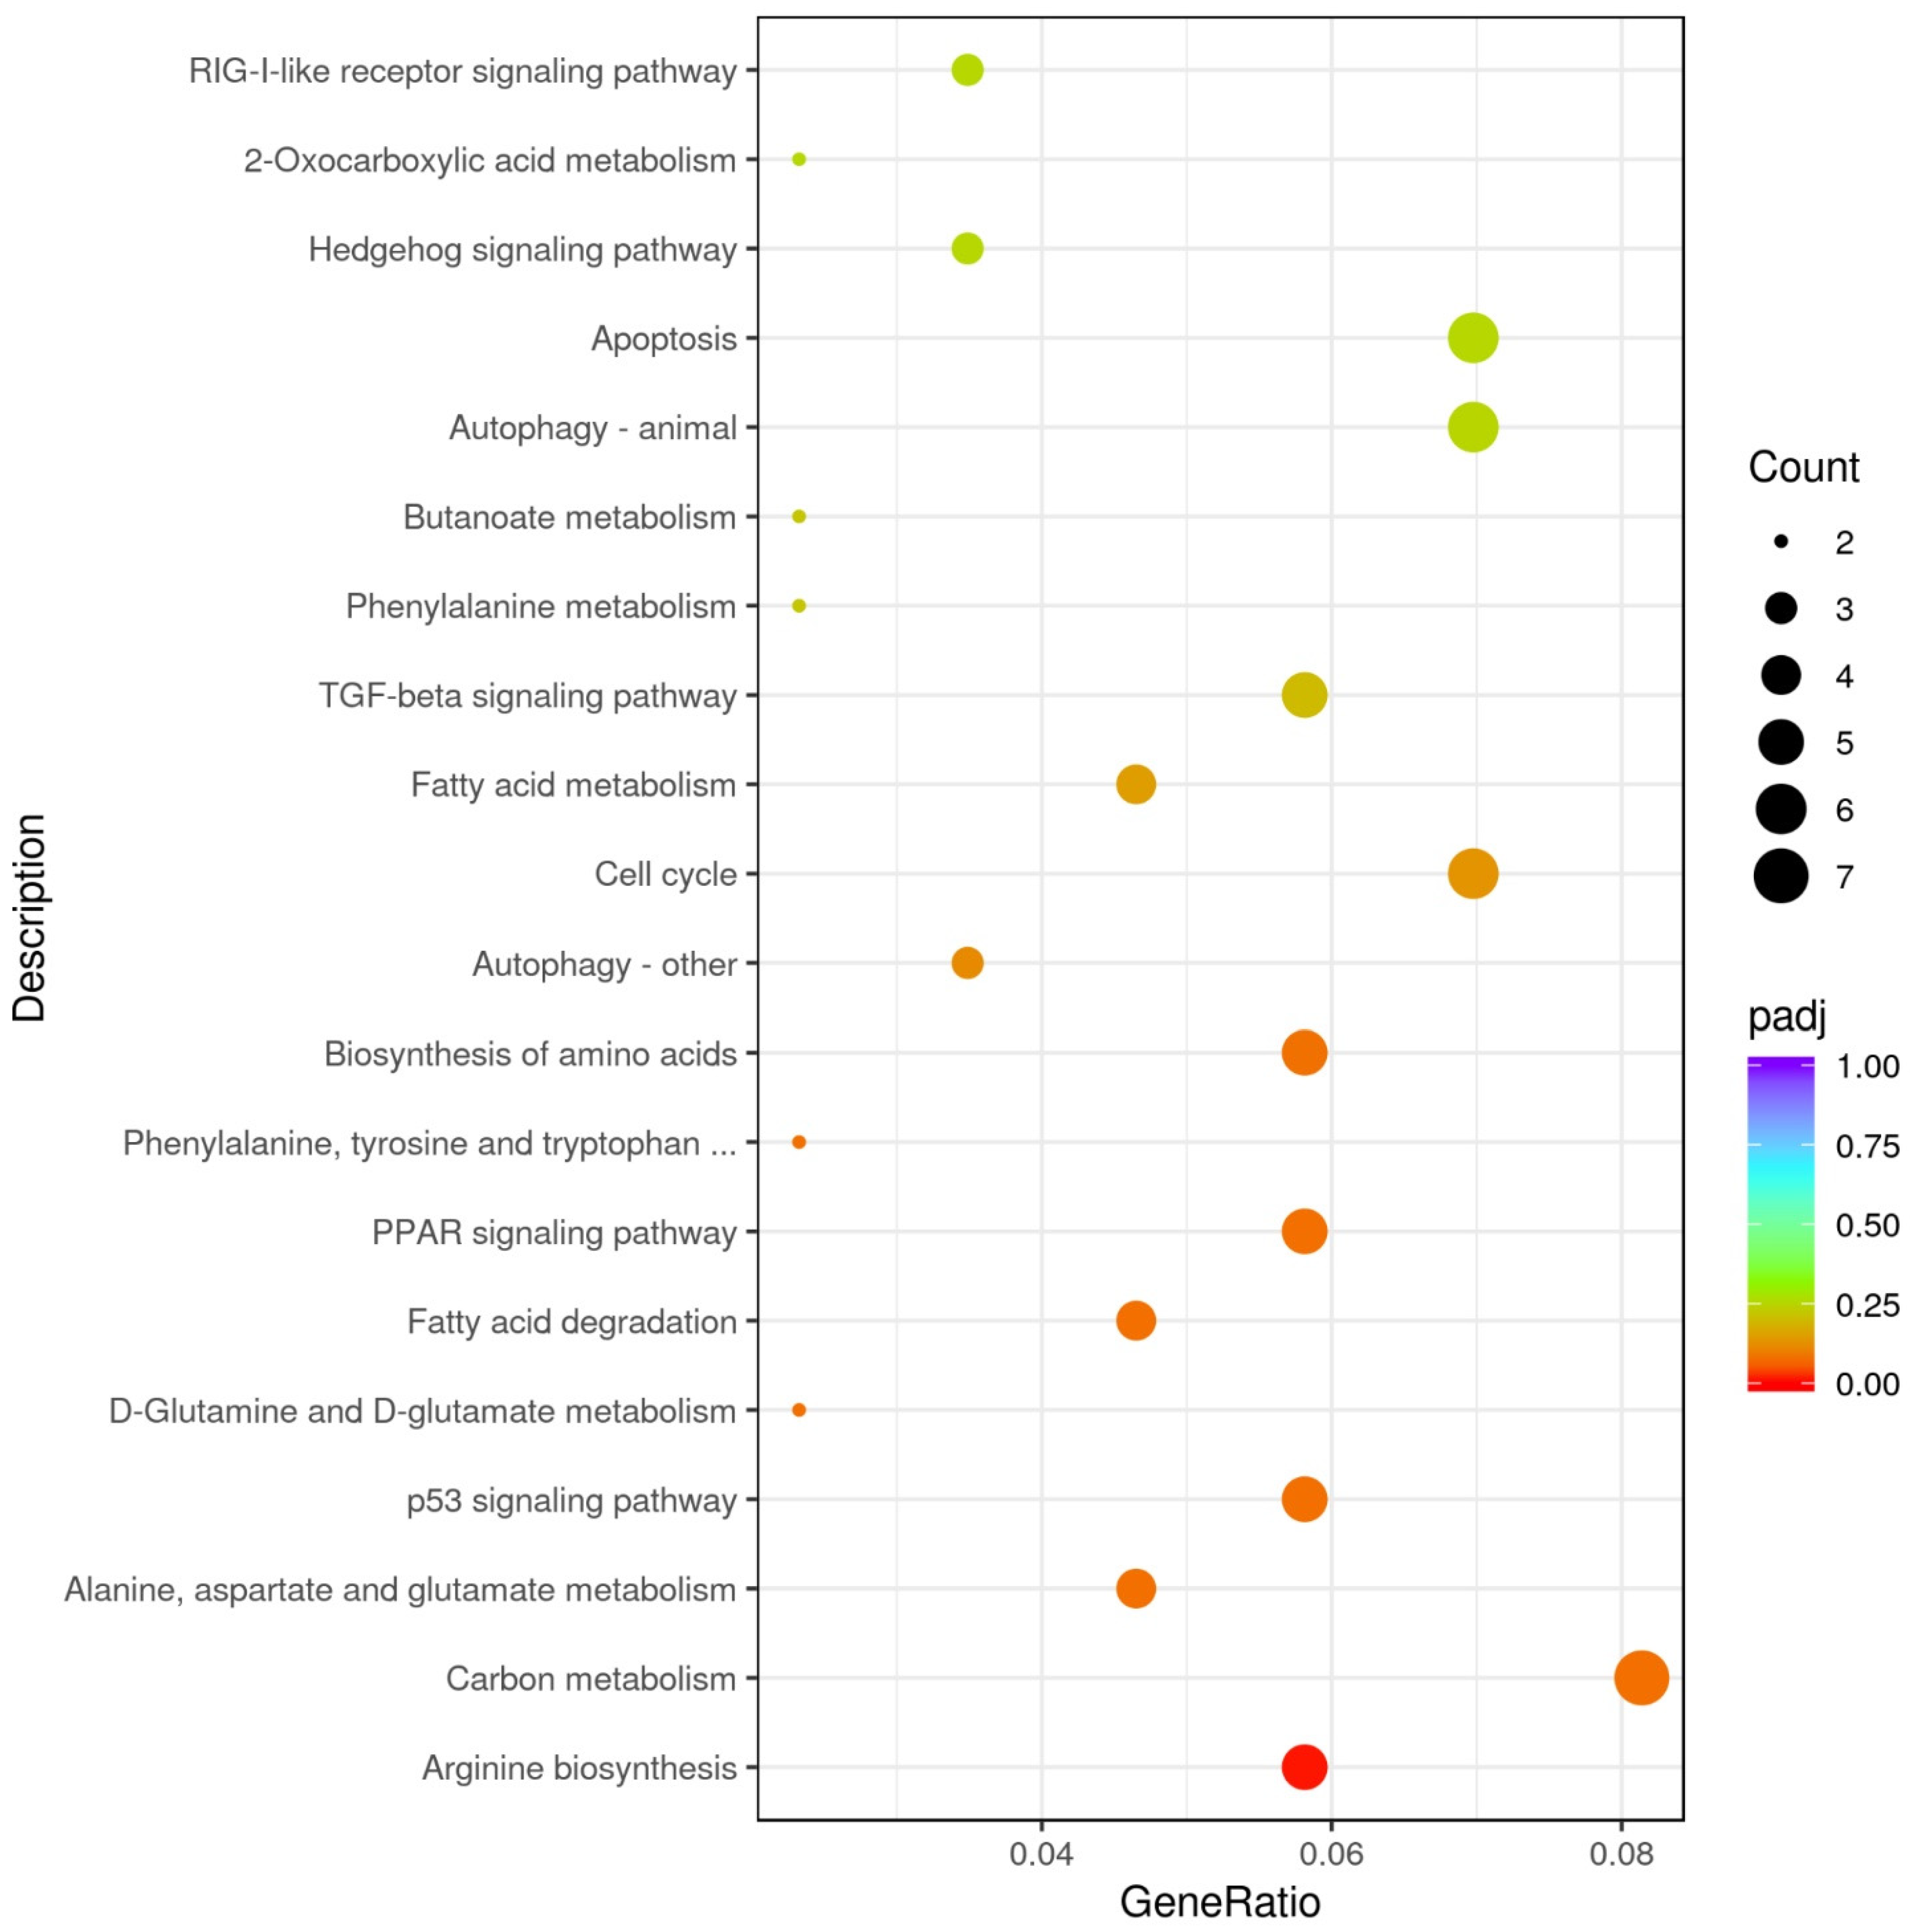
3.2.2. GO and KEGG Enrichment Results
3.3. Metabolites Analysis
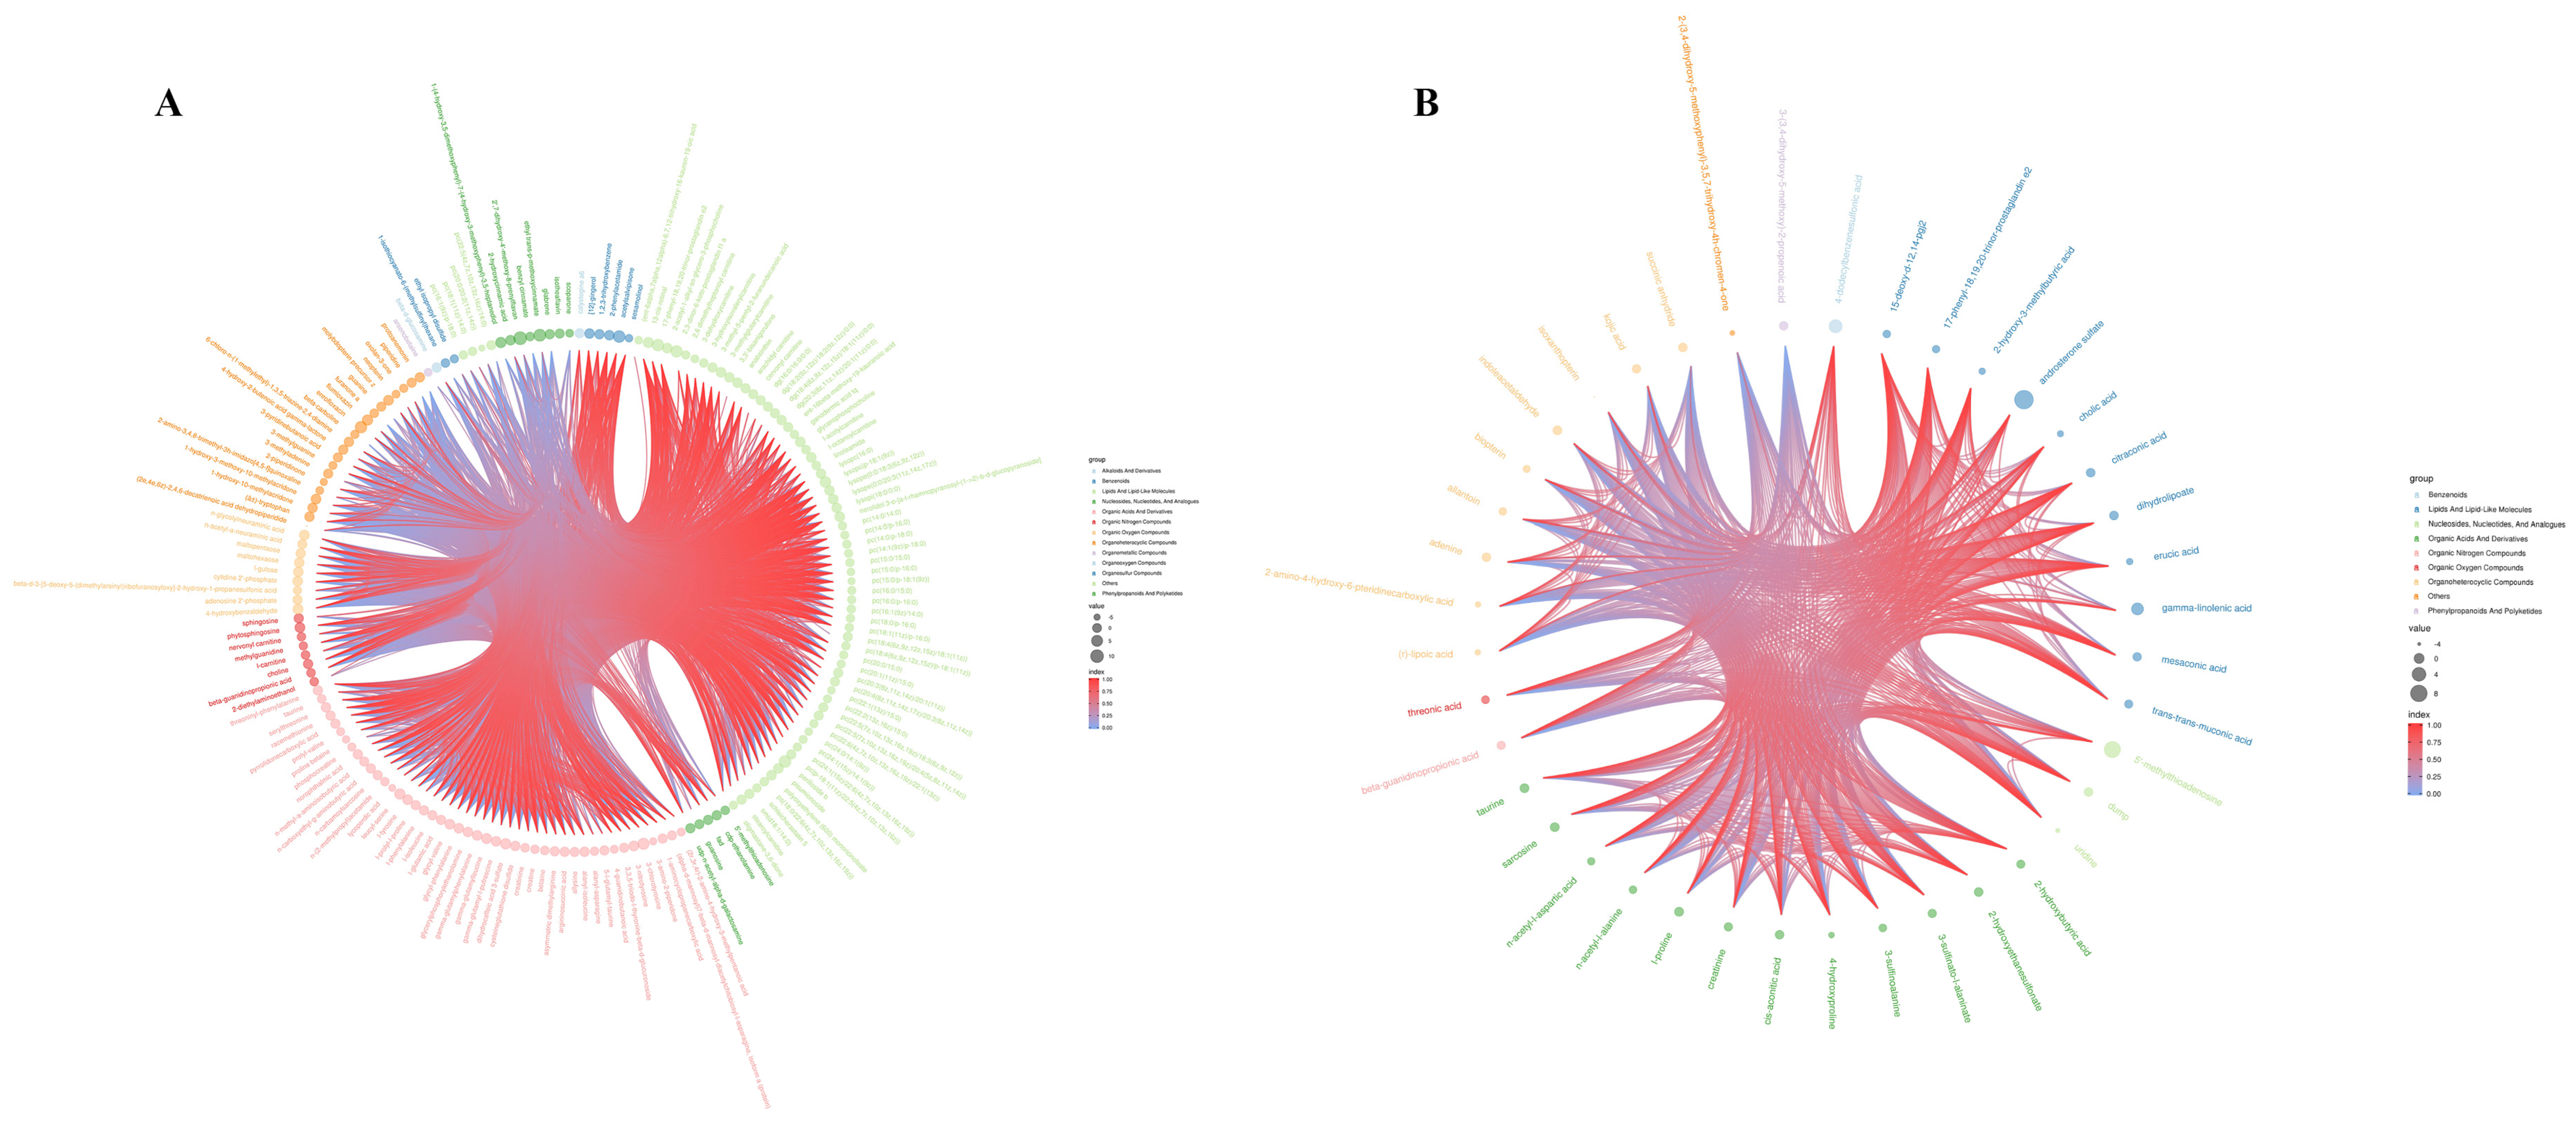
3.3.1. Differences in Metabolites in Groups Exposed to Cyantraniliprole
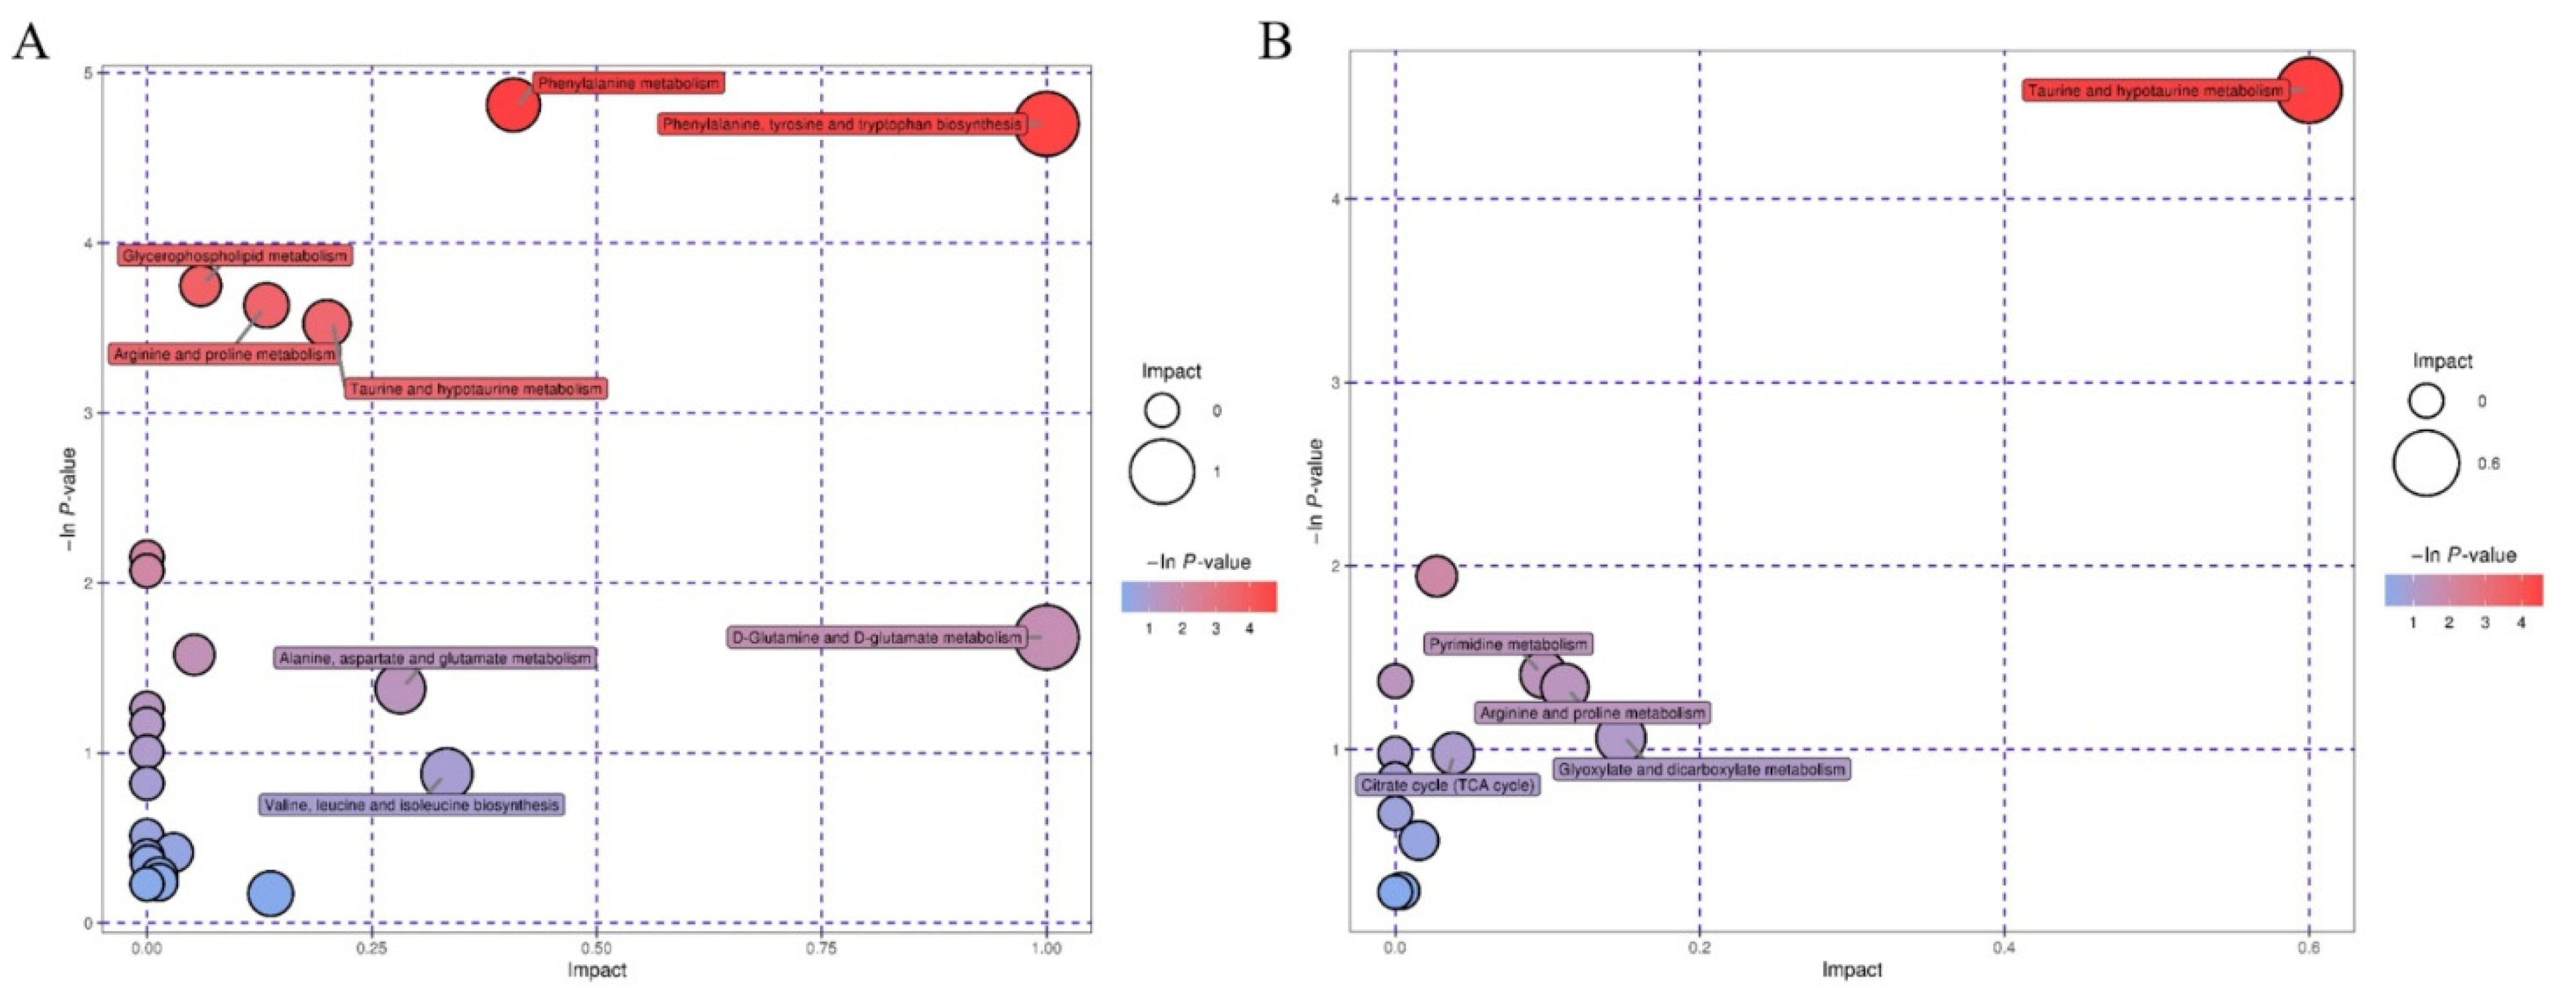
3.3.2. Pathway Analysis of Differential Metabolites
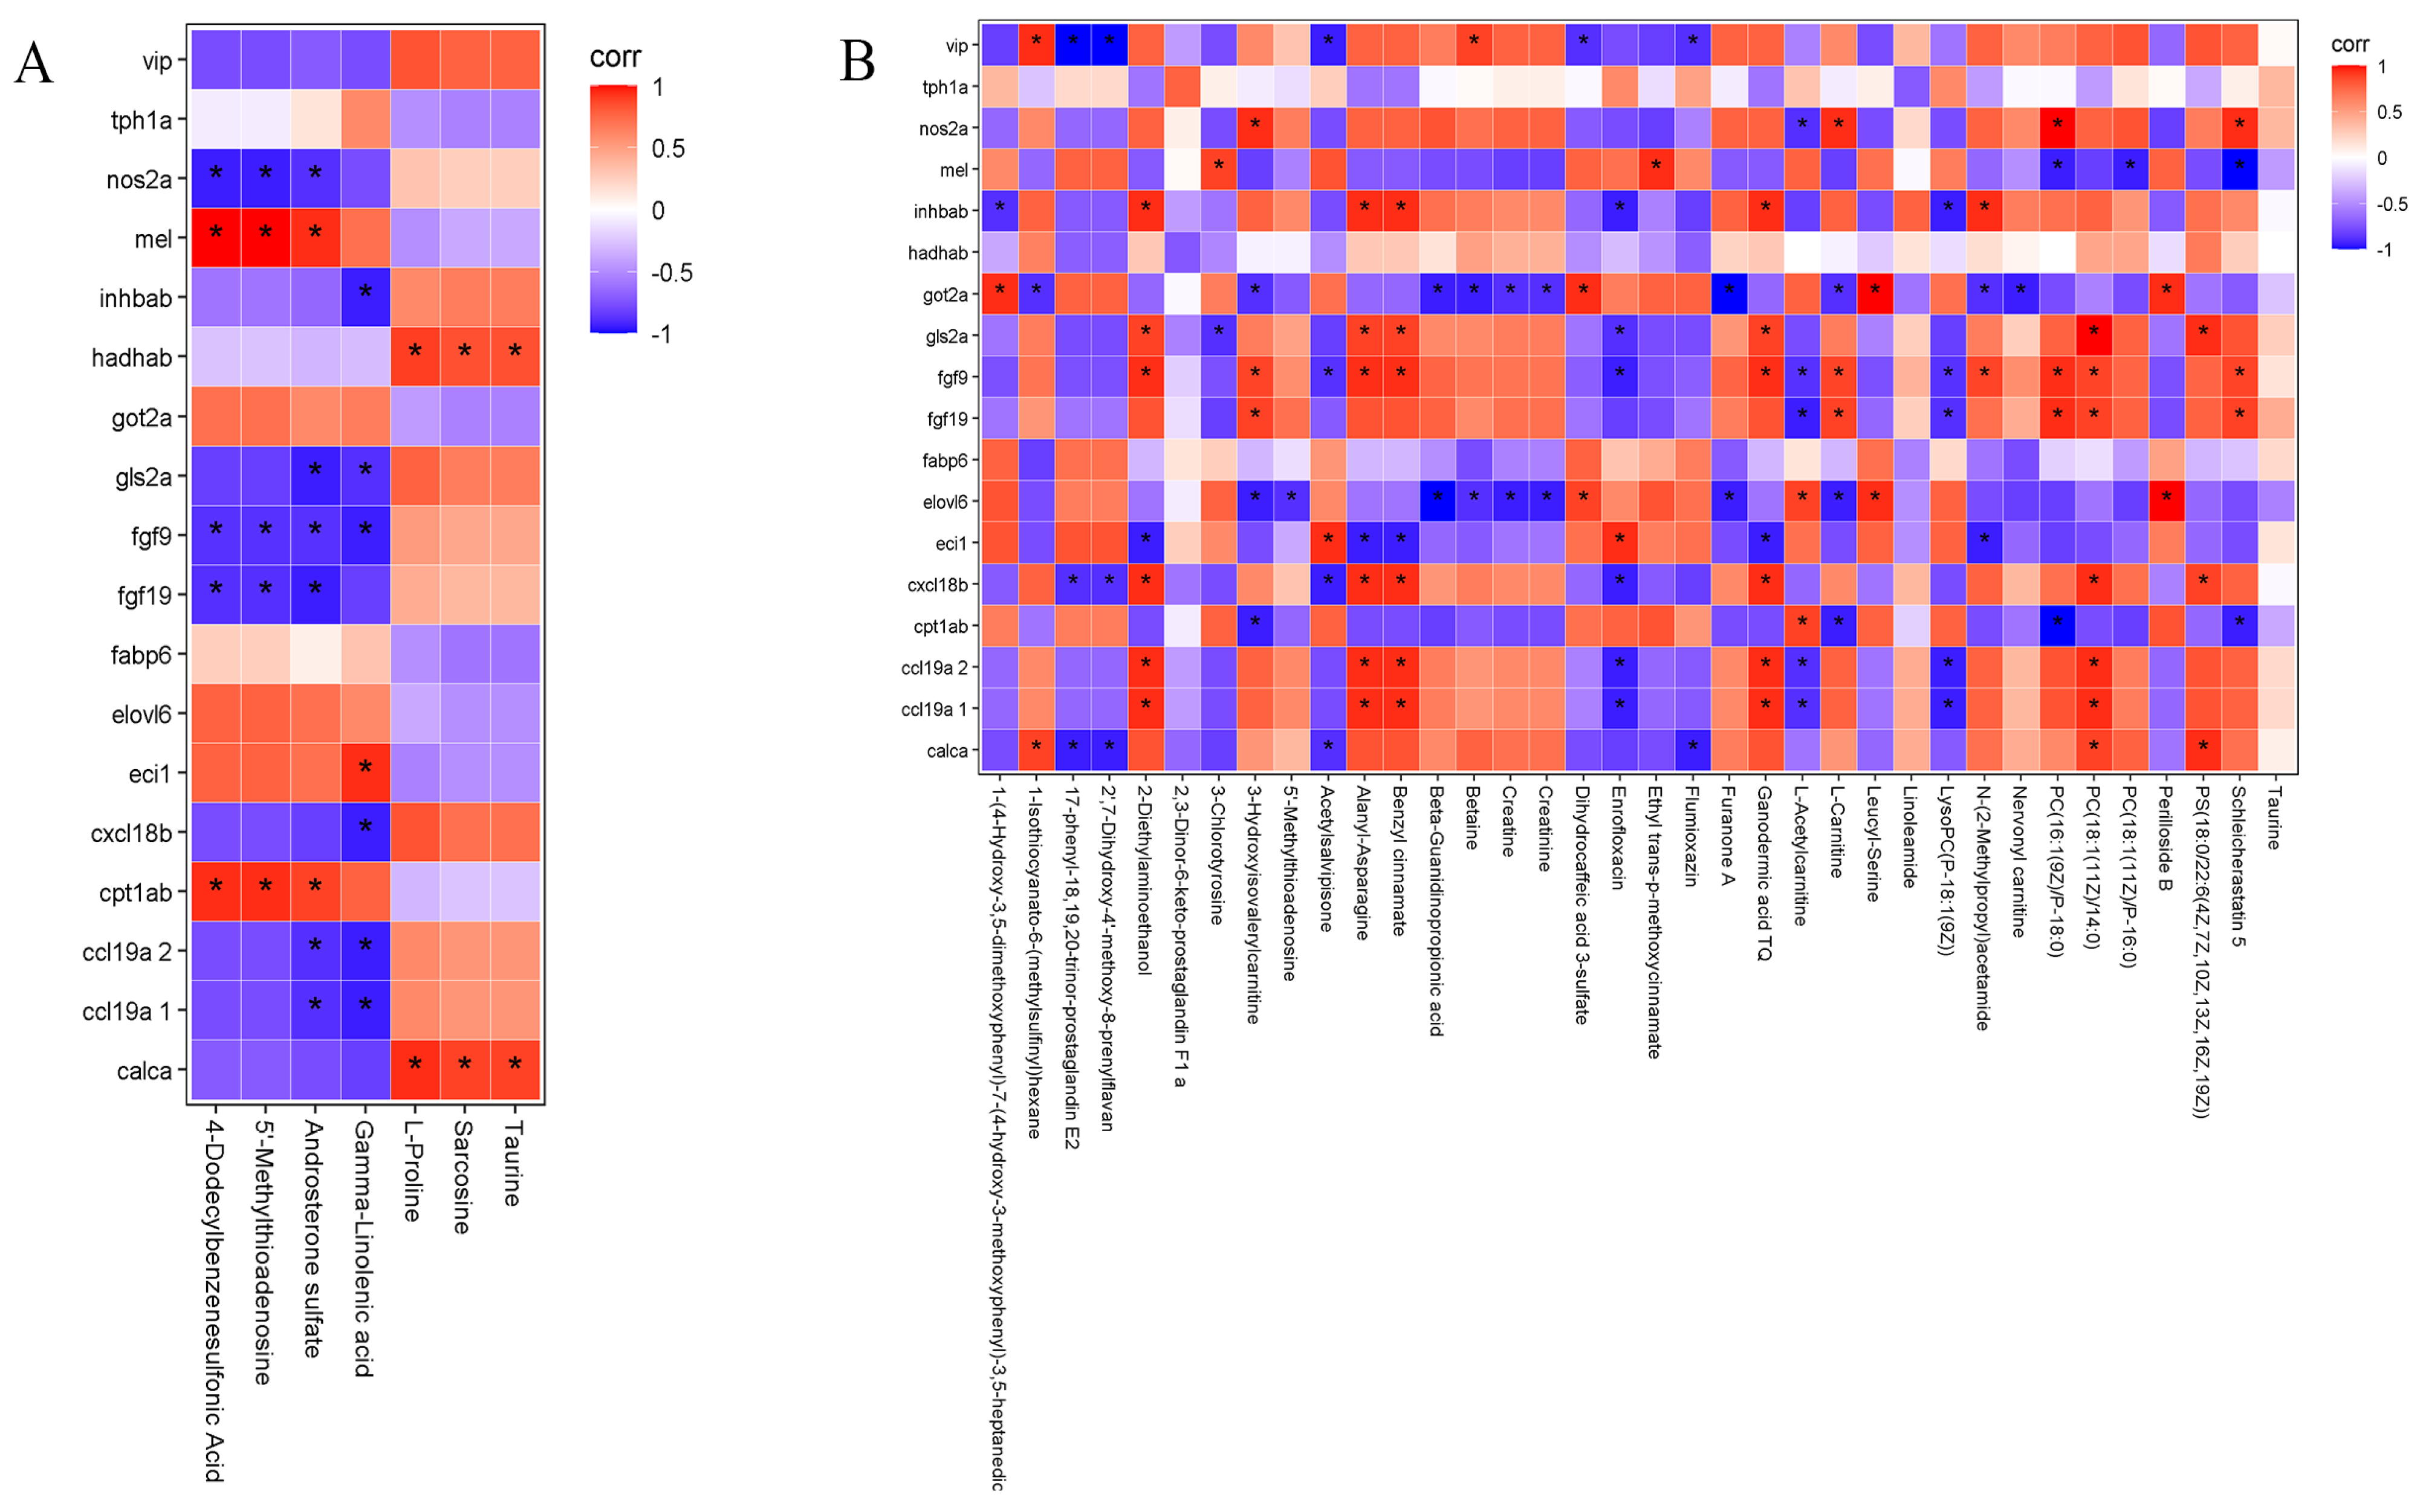
3.4. Correlation Analysis
4. Discussion
Supplementary Materials
Author Contributions
Funding
Data Availability Statement
Conflicts of Interest
References
- Wei, W.; Lijuan, X.; Yanping, Z.; Chenyan, L.; Wenwen, P.; Ziming, W.; Xugen, S. Screening of effective pesticides for control of important diseases and insect pests of double cropping rice in jiang xi. Plant Prot. 2022, 48, 312–319. [Google Scholar]
- Tiwari, S.; Stelinski, L.L. Effects of cyantraniliprole, a novel anthranilic diamide insecticide, against Asian citrus psyllid under laboratory and field conditions. Pest Manag. Sci. 2013, 69, 1066–1072. [Google Scholar] [CrossRef] [PubMed]
- Moreno, I.; Belando, A.; Grávalos, C.; Bielza, P. Baseline susceptibility of Mediterranean strains of Trialeurodes vaporariorum (Westwood) to cyantraniliprole. Pest Manag. Sci. 2018, 74, 1552–1557. [Google Scholar] [CrossRef] [PubMed]
- Zhang, R.; Jang, E.B.; He, S.; Chen, J. Lethal and sublethal effects of cyantraniliprole on Bactrocera dorsalis (Hendel) (Diptera: Tephritidae). Pest Manag. Sci. 2015, 71, 250–256. [Google Scholar] [CrossRef] [PubMed]
- Xu, C.; Ding, J.; Zhao, Y.; Luo, J.; Mu, W.; Zhang, Z. Cyantraniliprole at Sublethal Dosages Negatively Affects the Development, Reproduction, and Nutrient Utilization of Ostrinia furnacalis (Lepidoptera: Crambidae). J. Econ. Entomol. 2017, 110, 230–238. [Google Scholar] [CrossRef]
- Ares, A.M.; Valverde, S.; Bernal, J.L.; Toribio, L.; Nozal, M.J.; Bernal, J. Determination of flubendiamide in honey at trace levels by using solid phase extraction and liquid chromatography coupled to quadrupole time-of-flight mass spectrometry. Food Chem. 2017, 232, 169–176. [Google Scholar] [CrossRef] [PubMed]
- Ma, W.; Li, J.; Li, X.; Liu, H. Enrichment of diamide insecticides from environmental water samples using metal-organic frameworks as adsorbents for determination by liquid chromatography tandem mass spectrometry. J. Hazard. Mater. 2022, 422, 126839. [Google Scholar] [CrossRef]
- Wang, M.; Wang, K.; Liu, F.; Mu, W. Comparison of the bioactivity of cyantraniliprole and chlorantraniliprole against three important lepidopterous pests. Acta Phytophylacica Sin. 2014, 41, 360–366. [Google Scholar]
- Caballero, R.; Schuster, D.J.; Smith, H.A.; Mangandi, J.; Portillo, H.E. A systemic bioassay to determine susceptibility of the pepper weevil, Anthonomus eugenii Cano (Coleoptera: Curculionidae) to cyantraniliprole and thiamethoxam. Crop Prot. 2015, 72, 16–21. [Google Scholar] [CrossRef]
- Grout, T.G.; Stephen, P.R.; Rison, J.-L. Cyantraniliprole can replace malathion in baits for Ceratitis capitata (Diptera: Tephritidae). Crop Prot. 2018, 112, 304–312. [Google Scholar] [CrossRef]
- Jiang, J.; Wang, Y.; Mu, W.; Zhang, Z. Sublethal effects of anthranilic diamide insecticides on the demographic fitness and consumption rates of the Coccinella septempunctata (Coleoptera: Coccinellidae) fed on Aphis craccivora. Environ. Sci. Pollut. Res. Int. 2020, 27, 4178–4189. [Google Scholar] [CrossRef] [PubMed]
- Qiao, Z.; Yao, X.; Liu, X.; Zhang, J.; Du, Q.; Zhang, F.; Li, X.; Jiang, X. Transcriptomics and enzymology combined five gene expressions to reveal the responses of earthworms (Eisenia fetida) to the long-term exposure of cyantraniliprole in soil. Ecotoxicol. Environ. Saf. 2021, 209, 111824. [Google Scholar] [CrossRef] [PubMed]
- European Food Safety Authority. Conclusion on the peer review of the pesticide risk assessment of the active substance cyantraniliprole. EFSA J. 2014, 12, 3814. [Google Scholar]
- Sana, T.R.; Fischer, S.; Wohlgemuth, G.; Katrekar, A.; Jung, K.H.; Ronald, P.C.; Fiehn, O. Metabolomic and transcriptomic analysis of the rice response to the bacterial blight pathogen Xanthomonas oryzae pv. oryzae. Metab. Off. J. Metab. Soc. 2010, 6, 451–465. [Google Scholar] [CrossRef] [PubMed]
- Kamburov, A.; Cavill, R.; Ebbels, T.M.; Herwig, R.; Keun, H.C. Integrated pathway-level analysis of transcriptomics and metabolomics data with IMPaLA. Bioinformatics 2011, 27, 2917–2918. [Google Scholar] [CrossRef]
- Hirai, M.Y.; Yano, M.; Goodenowe, D.B.; Kanaya, S.; Kimura, T.; Awazuhara, M.; Arita, M.; Fujiwara, T.; Saito, K. Integration of transcriptomics and metabolomics for understanding of global responses to nutritional stresses in Arabidopsis thaliana. Proc. Natl. Acad. Sci. USA 2004, 101, 10205–10210. [Google Scholar] [CrossRef] [PubMed]
- Zhang, H.; Zhao, L. Influence of sublethal doses of acetamiprid and halosulfuron-methyl on metabolites of zebra fish (Brachydanio rerio). Aquat. Toxicol. 2017, 191, 85–94. [Google Scholar] [CrossRef]
- GB/T 31270.12-2014; Test No. 31270. 12: Test Guidelines on Environmental Safety Assessment for Chemical Pesticides―Part 12: Fish Acute Toxicity Test. General Administration of Quality Supervision, Inspection and Quarantine of the People’s Republic of China: Beijing, China; Standardization Administration of China: Beijing, China, 2014. (In Chinese)
- Organization for Economic Co-Operation and Development (OECD). Test No. 229: Fish Short Term Reproduction Assay; Organization for Economic Co-Operation and Development (OECD): Paris, France, 2012. [Google Scholar]
- Li, T.; Qin, S.; Sun, X.; Zhang, K.-X.; Ding, X.-Y.; Wang, X.-Y.; Li, M.-W. Transcriptome analysis reveals distinct innate immunity and ribosomal response at early stage of AcMNPV infection in haemocyte of silkworm resistant and susceptible strains. J. Asia Pac. Entomol. 2022, 25, 101938. [Google Scholar] [CrossRef]
- Chen, H.; Feng, W.; Chen, K.; Qiu, X.; Xu, H.; Mao, G.; Zhao, T.; Ding, Y.; Wu, X. Transcriptomic analysis reveals potential mechanisms of toxicity in acombined exposure to dibutyl phthalate and diisobutyl phthalate in zebrafish (Danio rerio) ovary. Aquat. Toxicol. 2019, 216, 105290. [Google Scholar] [CrossRef]
- Li, Y.; Li, X.; Xiong, L.; Tang, J.; Li, L. Comparison of phenotypes and transcriptomes of mouse skin-derived precursors and dermal mesenchymal stem cells. Differentiation 2018, 102, 30–39. [Google Scholar] [CrossRef]
- Weger, M.; Weger, B.D.; Görling, B.; Poschet, G.; Yildiz, M.; Hell, R.; Luy, B.; Akcay, T.; Güran, T.; Dickmeis, T.; et al. Glucocorticoid deficiency causes transcriptional and post-transcriptional reprogramming of glutamine metabolism. EBioMedicine 2018, 36, 376–389. [Google Scholar] [CrossRef] [PubMed]
- Feng, Y.H.; Chen, W.Y.; Kuo, Y.H.; Tung, C.L.; Tsao, C.J.; Shiau, A.L.; Wu, C.L. Elovl6 is a poor prognostic predictor in breast cancer. Oncol. Lett. 2016, 12, 207–212. [Google Scholar] [CrossRef] [PubMed]
- Muir, K.; Hazim, A.; He, Y.; Peyressatre, M.; Kim, D.Y.; Song, X.; Beretta, L. Proteomic and lipidomic signatures of lipid metabolism in NASH-associated hepatocellular carcinoma. Cancer Res. 2013, 73, 4722–4731. [Google Scholar] [CrossRef] [PubMed]
- Brown, C.W.; Houston-Hawkins, D.E.; Woodruff, T.K.; Matzuk, M.M. Insertion of Inhbb into the Inhba locus rescues the Inhba-null phenotype and reveals new activin functions. Nat. Genet. 2000, 25, 453–457. [Google Scholar] [CrossRef] [PubMed]
- Seder, C.W.; Hartojo, W.; Lin, L.; Silvers, A.L.; Wang, Z.; Thomas, D.G.; Giordano, T.J.; Chen, G.; Chang, A.C.; Orringer, M.B.; et al. INHBA overexpression promotes cell proliferation and may be epigenetically regulated in esophageal adenocarcinoma. J. Thorac. Oncol. 2009, 4, 455–462. [Google Scholar] [CrossRef] [PubMed]
- Lyu, S.; Jiang, C.; Xu, R.; Huang, Y.; Yan, S. INHBA upregulation correlates with poorer prognosis in patients with esophageal squamous cell carcinoma. Cancer Manag. Res. 2018, 10, 1585–1596. [Google Scholar] [CrossRef]
- Okano, M.; Yamamoto, H.; Ohkuma, H.; Kano, Y.; Kim, H.; Nishikawa, S.; Konno, M.; Kawamoto, K.; Haraguchi, N.; Takemasa, I.; et al. Significance of INHBA expression in human colorectal cancer. Oncol. Rep. 2013, 30, 2903–2908. [Google Scholar] [CrossRef]
- Grigoroiu, M.; Tagett, R.; Draghici, S.; Dima, S.; Nastase, A.; Florea, R.; Sorop, A.; Ilie, V.; Bacalbasa, N.; Tica, V.; et al. Gene-expression Profiling in Non-small Cell Lung Cancer with Invasion of Mediastinal Lymph Nodes for Prognosis Evaluation. Cancer Genom. Proteom. 2015, 12, 231–242. [Google Scholar]
- Liang, Z.; Bin, W.; Dongfeng, C. Bioinformatics analysis of expression and clinical significance of INHBA gene in gastric cancer. Chin. J. Gastroenterol. Hepatol. 2021, 30, 133–138. [Google Scholar]
- Probst, J.; Kölker, S.; Okun, J.G.; Kumar, A.; Gursky, E.; Posset, R.; Hoffmann, G.F.; Peravali, R.; Zielonka, M. Chronic hyperammonemia causes a hypoglutamatergic and hyperGABAergic metabolic state associated with neurobehavioral abnormalities in zebrafish larvae. Exp. Neurol. 2020, 331, 113330. [Google Scholar] [CrossRef]
- Peyrou, M.; Ramadori, P.; Bourgoin, L.; Foti, M. PPARs in Liver Diseases and Cancer: Epigenetic Regulation by MicroRNAs. PPAR Res. 2012, 2012, 757803. [Google Scholar] [CrossRef] [PubMed]
- Yujie, Y.; Lei, L.; Miao, X.; Xuehua, J. Significance of regulating liver transporters in the prevention and treatment of liver diseases. W. China J. Pharm. Sci. 2020, 35, 316–324. [Google Scholar]
- Canet, M.J.; Hardwick, R.N.; Lake, A.D.; Dzierlenga, A.L.; Clarke, J.D.; Cherrington, N.J. Modeling human nonalcoholic steatohepatitis-associated changes in drug transporter expression using experimental rodent models. Drug Metab. Dispos. Biol. Fate Chem. 2014, 42, 586–595. [Google Scholar] [CrossRef] [PubMed]
- Ogasawara, K.; Terada, T.; Katsura, T.; Hatano, E.; Ikai, I.; Yamaoka, Y.; Inui, K. Hepatitis C virus-related cirrhosis is a major determinant of the expression levels of hepatic drug transporters. Drug Metab. Pharmacokinet. 2010, 25, 190–199. [Google Scholar] [CrossRef]
- Raafat, N.; Abdel Aal, S.M.; Abdo, F.K.; El Ghonaimy, N.M. Mesenchymal stem cells: In vivo therapeutic application ameliorates carbon tetrachloride induced liver fibrosis in rats. Int. J. Biochem. Cell Biol. 2015, 68, 109–118. [Google Scholar] [CrossRef]
- Geier, A.; Kim, S.K.; Gerloff, T.; Dietrich, C.G.; Lammert, F.; Karpen, S.J.; Stieger, B.; Meier, P.J.; Matern, S.; Gartung, C. Hepatobiliary organic anion transporters are differentially regulated in acute toxic liver injury induced by carbon tetrachloride. J. Hepatol. 2002, 37, 198–205. [Google Scholar] [CrossRef] [PubMed]
- Januchowski, R.; Zawierucha, P.; Andrzejewska, M.; Ruciński, M.; Zabel, M. Microarray-based detection and expression analysis of ABC and SLC transporters in drug-resistant ovarian cancer cell lines. Biomed. Pharmacotherapy. 2013, 67, 240–245. [Google Scholar] [CrossRef]
- Lijuan, Z.; Fang, H.; Zhihua, H. Expression of Na+-taurocholate co-transporting peptide in liver of rats with acute intrahepatic cholestatic hepatic injury. J. Clin. Pediatr. 2009, 27, 922–925. [Google Scholar]
- Jingquan, J.; Huiying, Z.; Jiantao, J.; Lili, Z.; Yuxia, C.; Limin, W.; Xiaoxia, T.; Ming, F.; Zhongfu, Z.; Dewu, H. Role of 78 kD glucose-regulated protein in the development of liver cirrhosis promoted by intestinal endotoxemia in rats. Chin. J. Pathophysiol. 2010, 26, 2447–2452. [Google Scholar]
- Xiaoxia, T.; Huiying, Z.; Yunxia, C.; Xutong, L.; Limin, W.; Li, M.; Lina, L.; Zhongyang, Z.; Dewu, H. Effects of macrophage polarization during development of liver cirrhosis in rats. Chin. J. Pathophysiol. 2016, 32, 880–885. [Google Scholar]
- Ohashi, W.; Hattori, K.; Hattori, Y. Control of Macrophage Dynamics as a Potential Therapeutic Approach for Clinical Disorders Involving Chronic Inflammation. J. Pharmacol. Exp. Ther. 2015, 354, 240–250. [Google Scholar] [CrossRef] [PubMed]


| KEGGID | Description | padj | GeneID | GeneName | |
|---|---|---|---|---|---|
| dre00220 | Arginine biosynthesis | 0.005 | ENSDARG00000069095/ENSDARG00000039269/ENSDARG00000026925/novel.6825 | gls2a/arg2/nos2a/- | Down-regulated |
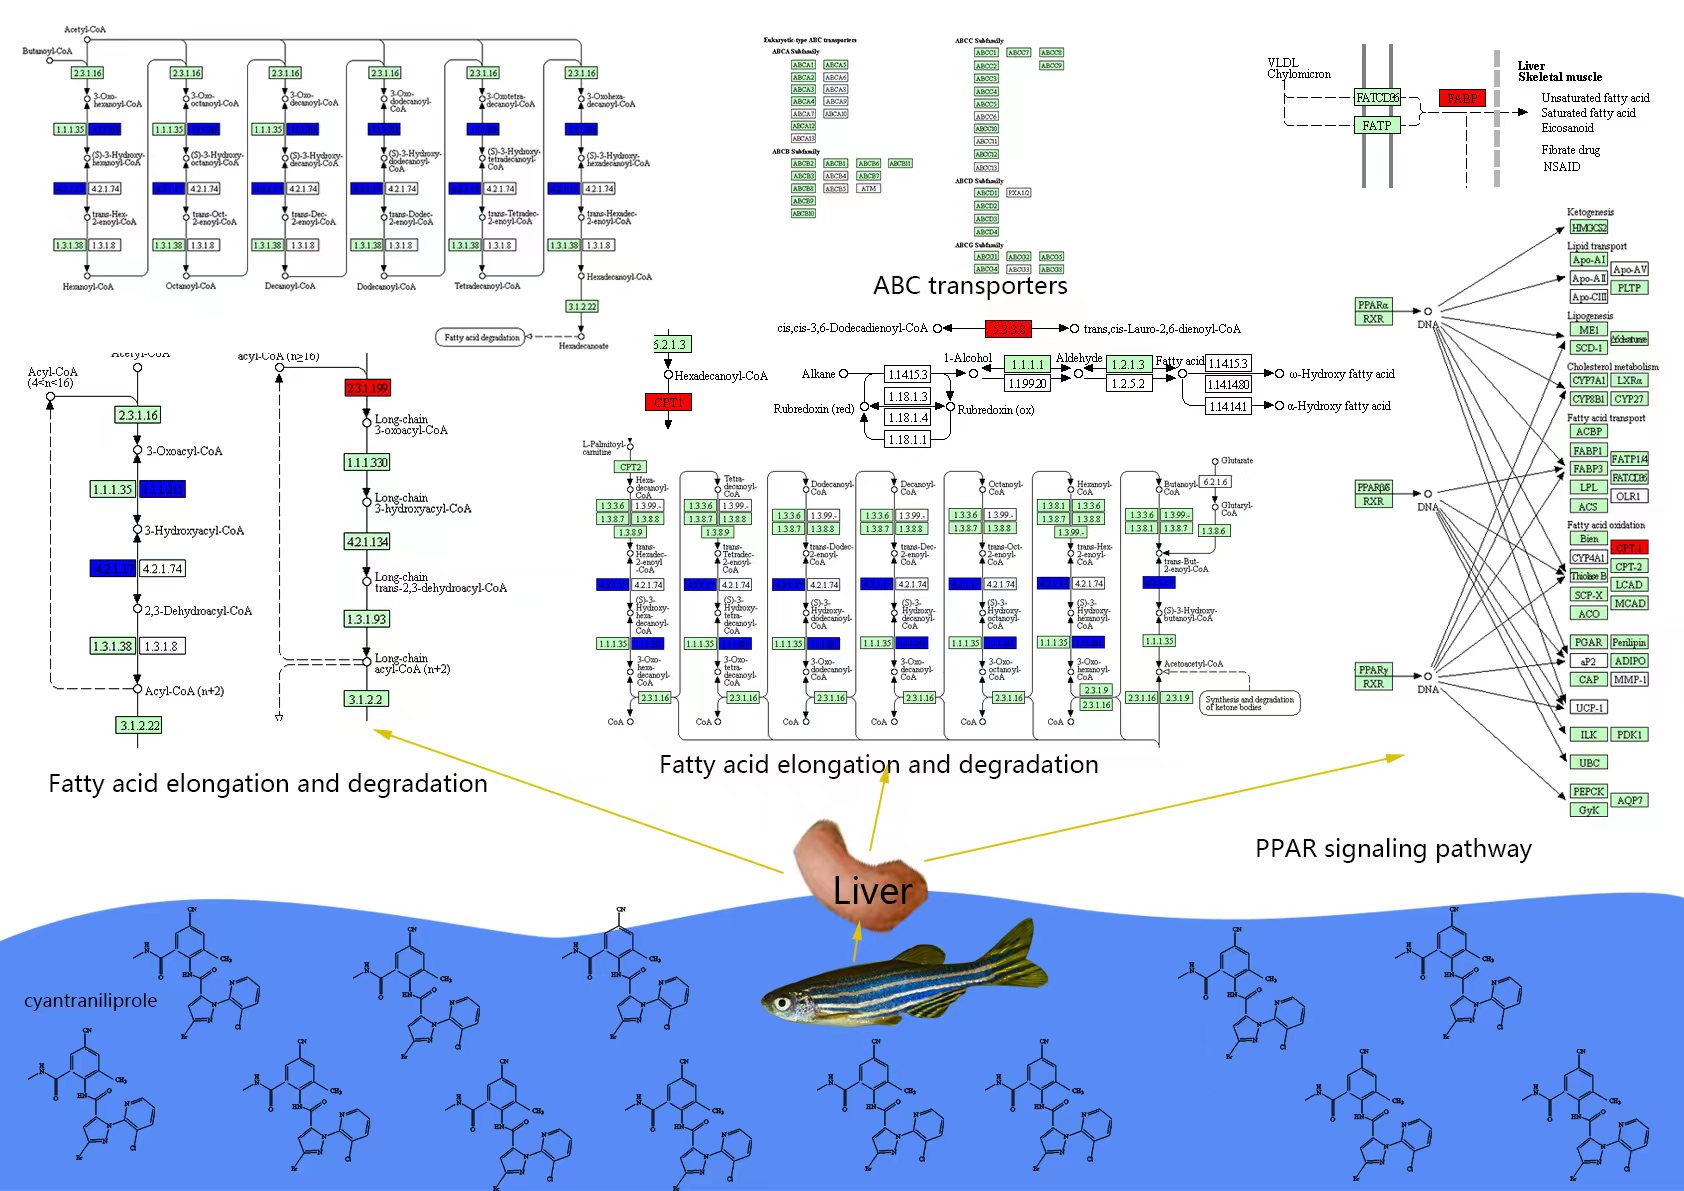
| dre00071 | Fatty acid degradation | 0.020 | ENSDARG00000062054/ENSDARG00000018002/ENSDARG00000060594/novel.4229 | cpt1ab/eci1/hadhab/- | Up-regulated |
| dre01212 | Fatty acid metabolism | 0.036 | ENSDARG00000062054/ENSDARG00000004402/ENSDARG00000060594/novel.4229 | cpt1ab/elovl6/hadhab/- | |
| dre03320 | PPAR signaling pathway | 0.041 | ENSDARG00000062054/ENSDARG00000044566/ENSDARG00000053215/novel.4229 | cpt1ab/fabp6/me1/- |
| Super Class | MS2 Name | Vip | p-Value | Old Change | |
|---|---|---|---|---|---|
| Organic acids and derivatives | Betaine | 1.1706 | 0.0290 | 0.8150 | ↓ |
| Creatine | 1.2810 | 0.0016 | 0.5706 | ↓ | |
| Creatinine | 1.3438 | 0.0348 | 0.7076 | ↓ | |
| Taurine | 1.2138 | 0.0083 | 0.6915 | ↓ | |
| N-(2-Methylpropyl) acetamide | 1.6595 | 0.0003 | 0.5217 | ↓ | |
| Alanyl-ssparagine | 1.4894 | 0.0019 | 0.5506 | ↓ | |
| L-carnitine | 1.3082 | 0.0095 | 0.7323 | ↓ | |
| Nervonyl carnitine | 1.1347 | 0.0396 | 0.5730 | ↓ | |
| Beta-guanidinopropionic acid | 1.5416 | 0.0003 | 0.7521 | ↓ | |
| 2-diethylaminoethanol | 1.2225 | 0.0400 | 0.6536 | ↓ | |
| Furanone A | 1.3682 | 0.0019 | 0.6856 | ↓ | |
| 1-isothiocyanato-6-(methylsulfinyl)hexane | 1.3442 | 0.0260 | 0.6996 | ↓ | |
| L-acetylcarnitine | 1.4341 | 0.0011 | 0.6890 | ↓ | |
| 3-hydroxyisovalerylcarnitine | 1.3427 | 0.0150 | 0.5635 | ↓ | |
| Leucyl-serine | 1.6092 | 0.0125 | 11.5661 | ↑ | |
| 3-Chlorotyrosine | 1.5789 | 0.0241 | 45.8652 | ↑ | |
| Dihydrocaffeic acid 3-sulfate | 1.7584 | 0.0004 | 11.6826 | ↑ | |
| Other | PC(18:1(11Z)/14:0) | 1.4287 | 0.0020 | 0.5528 | ↓ |
| PC(16:1(9Z)/P-18:0) | 1.3582 | 0.0074 | 0.5713 | ↓ | |
| Lipids and lipid-like molecules | PS(18:0/22:6(4Z,7Z,10Z,13Z,16Z,19Z)) | 1.4937 | 0.0014 | 0.7067 | ↓ |
| Schleicherastatin 5 | 1.2785 | 0.0223 | 0.5590 | ↓ | |
| Ganodermic acid TQ | 1.4614 | 0.0076 | 0.5426 | ↓ | |
| Linoleamide | 1.0443 | 0.0398 | 0.7566 | ↓ | |
| PC(18:1(11Z)/P-16:0) | 1.2649 | 0.0021 | 0.5305 | ↓ | |
| PS(18:0/22:6(4Z,7Z,10Z,13Z,16Z,19Z)) | 1.4937 | 0.0014 | 0.7067 | ↓ | |
| Perilloside B | 1.7006 | 0.0147 | 142.6186 | ↑ | |
| 2,3-dinor-6-keto-prostaglandin F1 a | 1.3067 | 0.0462 | 96.1260 | ↑ | |
| 17-phenyl-18,19,20-trinor-prostaglandin E2 | 1.7325 | 0.0143 | 101.8653 | ↑ | |
| LysoPC(P-18:1(9Z)) | 1.5407 | 0.0172 | 18.9561 | ↑ | |
| Nucleosides, nucleotides, and analogues | 5′-methylthioadenosine | 1.4422 | 0.0028 | 0.6312 | ↓ |
| Phenylpropanoids and polyketides | 2′,7-dihydroxy-4′-methoxy-8-prenylflavan | 1.7849 | 0.0105 | 1565.9867 | ↑ |
| 1-(4-hydroxy-3,5-dimethoxyphenyl)-7-(4-hydroxy-3-methoxyphenyl)-3,5-heptanediol | 1.5020 | 0.0028 | 10.0861 | ↑ | |
| Ethyl trans-p-methoxycinnamate | 1.7784 | 0.0035 | 213.7491 | ↑ | |
| Benzyl cinnamate | 1.3512 | 0.0105 | 0.6595 | ↓ | |
| Organoheterocyclic compounds | Enrofloxacin | 1.6447 | 0.0014 | 94.0261 | ↑ |
| Flumioxazin | 1.6558 | 0.0049 | 11.2860 | ↑ | |
| Benzenoids | Acetylsalvipisone | 1.6715 | 0.0130 | 121.9760 | ↑ |
| Super Class | Name (MS2) | Vip | p-Value | Fold Change | |
|---|---|---|---|---|---|
| Lipids and lipid-like molecules | Gamma-linolenic acid | 1.1277 | 0.0282 | 3.6790 | ↑ |
| Androsterone sulfate | 1.7047 | 0.0082 | 2726.9810 | ↑ | |
| Nucleosides, nucleotides, and analogues | 5′-methylthioadenosine | 1.7020 | 0.0427 | 169.6809 | ↑ |
| Benzenoids | 4-dodecylbenzenesulfonic acid | 1.5190 | 0.0079 | 9.1142 | ↑ |
| Organic acids and derivatives | Sarcosine | 1.1400 | 0.0230 | 0.5179 | ↓ |
| L-proline | 1.0763 | 0.0363 | 0.5444 | ↓ | |
| Taurine | 1.1467 | 0.0233 | 0.5079 | ↓ |
| KEGG Pathway | Genes and Metabolites |
|---|---|
| dre01040: biosynthesis of unsaturated fatty acids—Danio rerio (zebrafish) (2) | cpd: C06426 (6Z,9Z,12Z)-octadecatrienoic acid||dre:317738 elovl6: elongation of very long-chain fatty acids protein 6 |
| dre00062: fatty acid elongation—Danio rerio (zebrafish) (2) | dre:317738 elovl6||dre:793834 hadhab: mitochondrial trifunctional protein, alpha subunit |
| dre01212: fatty acid metabolism—Danio rerio (zebrafish) (3) | dre:317738 elovl6||dre:793834 hadhab: mitochondrial trifunctional protein, alpha subunit||dre:560000 cpt1ab: carnitine O-palmitoyltransferase 1, isoform X2 in liver |
| dre00071: fatty acid degradation—Danio rerio (zebrafish) (3) | dre:334101 eci1:eci1 enoyl-CoA delta isomerase 1, mitochondrial||dre:793834 hadhab: mitochondrial trifunctional protein, alpha subunit||dre:560000 cpt1ab |
| dre00564: glycerophospholipid metabolism—Danio rerio (zebrafish) (3) | cpd: C04230 1-acyl-sn-glycero-3-phosphocholine||cpd:C00157 phosphatidylcholine||cpd:C02737 phosphatidylserine |
| dre00260: glycine, serine, and threonine metabolism—Danio rerio (zebrafish) (3) | cpd: C00719 betaine||cpd:C00300 creatine||cpd:C02737 phosphatidylserine |
| dre00270: cysteine and methionine metabolism—Danio rerio (zebrafish) (2) | cpd: C00170 5′-methylthioadenosine||dre:406688 got2a: aspartate aminotransferase 2a |
| dre00330: arginine and proline metabolism—Danio rerio (zebrafish) (6) | cpd: C00213 sarcosine||cpd:C00148 L-proline||dre:406688 got2a: aspartate aminotransferase 2a||dre:404036 nos2a: nitric oxide synthase 2a, inducible||cpd:C00300 creatine||cpd:C00791 creatinine |
| dre00380: tryptophan metabolism—Danio rerio (zebrafish) (2) | dre:793834 hadhab:hadhab mitochondrial trifunctional protein, alpha subunit||dre:352943 tph1a: tryptophan 5-hydroxylase 1 |
| dre02010: ABC transporters—Danio rerio (zebrafish) (3) | cpd: C00148 L-proline||cpd:C00245 taurine||cpd: C00719 betaine |
| dre04080: neuroactive ligand–receptor interaction— Danio rerio (zebrafish)(3) | cpd: C00245 taurine||dre:436744 calca: calcitonin gene-related peptide 2 precursor||dre:795653 vip: VIP peptides |
| dre01200: carbon metabolism—Danio rerio (zebrafish) (2) | dre:406688 got2a:got2a aspartate aminotransferase 2a||dre:793834 hadhab: mitochondrial trifunctional protein, alpha subunit |
| dre03320: PPAR signaling pathway—Danio rerio (zebrafish) (2) | dre:415166 fabp6:fabp6 gastrotropin||dre:560000 cpt1ab |
Disclaimer/Publisher’s Note: The statements, opinions and data contained in all publications are solely those of the individual author(s) and contributor(s) and not of MDPI and/or the editor(s). MDPI and/or the editor(s) disclaim responsibility for any injury to people or property resulting from any ideas, methods, instructions or products referred to in the content. |
© 2023 by the authors. Licensee MDPI, Basel, Switzerland. This article is an open access article distributed under the terms and conditions of the Creative Commons Attribution (CC BY) license (https://creativecommons.org/licenses/by/4.0/).
Share and Cite
Zhao, L.; Zhang, H.; Niu, Z.; Wei, D.; Yan, S.; Bai, J.; Zhang, L.; Shi, X. Integration of Transcriptomics and Metabolomics for Evaluating Changes in the Liver of Zebrafish Exposed to a Sublethal Dose of Cyantraniliprole. Water 2023, 15, 521. https://doi.org/10.3390/w15030521
Zhao L, Zhang H, Niu Z, Wei D, Yan S, Bai J, Zhang L, Shi X. Integration of Transcriptomics and Metabolomics for Evaluating Changes in the Liver of Zebrafish Exposed to a Sublethal Dose of Cyantraniliprole. Water. 2023; 15(3):521. https://doi.org/10.3390/w15030521
Chicago/Turabian StyleZhao, Lijuan, Hong Zhang, Zhidan Niu, Dandan Wei, Suyue Yan, Jianhua Bai, Lei Zhang, and Xiaojing Shi. 2023. "Integration of Transcriptomics and Metabolomics for Evaluating Changes in the Liver of Zebrafish Exposed to a Sublethal Dose of Cyantraniliprole" Water 15, no. 3: 521. https://doi.org/10.3390/w15030521
APA StyleZhao, L., Zhang, H., Niu, Z., Wei, D., Yan, S., Bai, J., Zhang, L., & Shi, X. (2023). Integration of Transcriptomics and Metabolomics for Evaluating Changes in the Liver of Zebrafish Exposed to a Sublethal Dose of Cyantraniliprole. Water, 15(3), 521. https://doi.org/10.3390/w15030521