
Chemical Characteristics-Based Evolution of Groundwater in Tailan River Basin, Xinjiang, China


Abstract
:1. Introduction
2. Materials and Methods
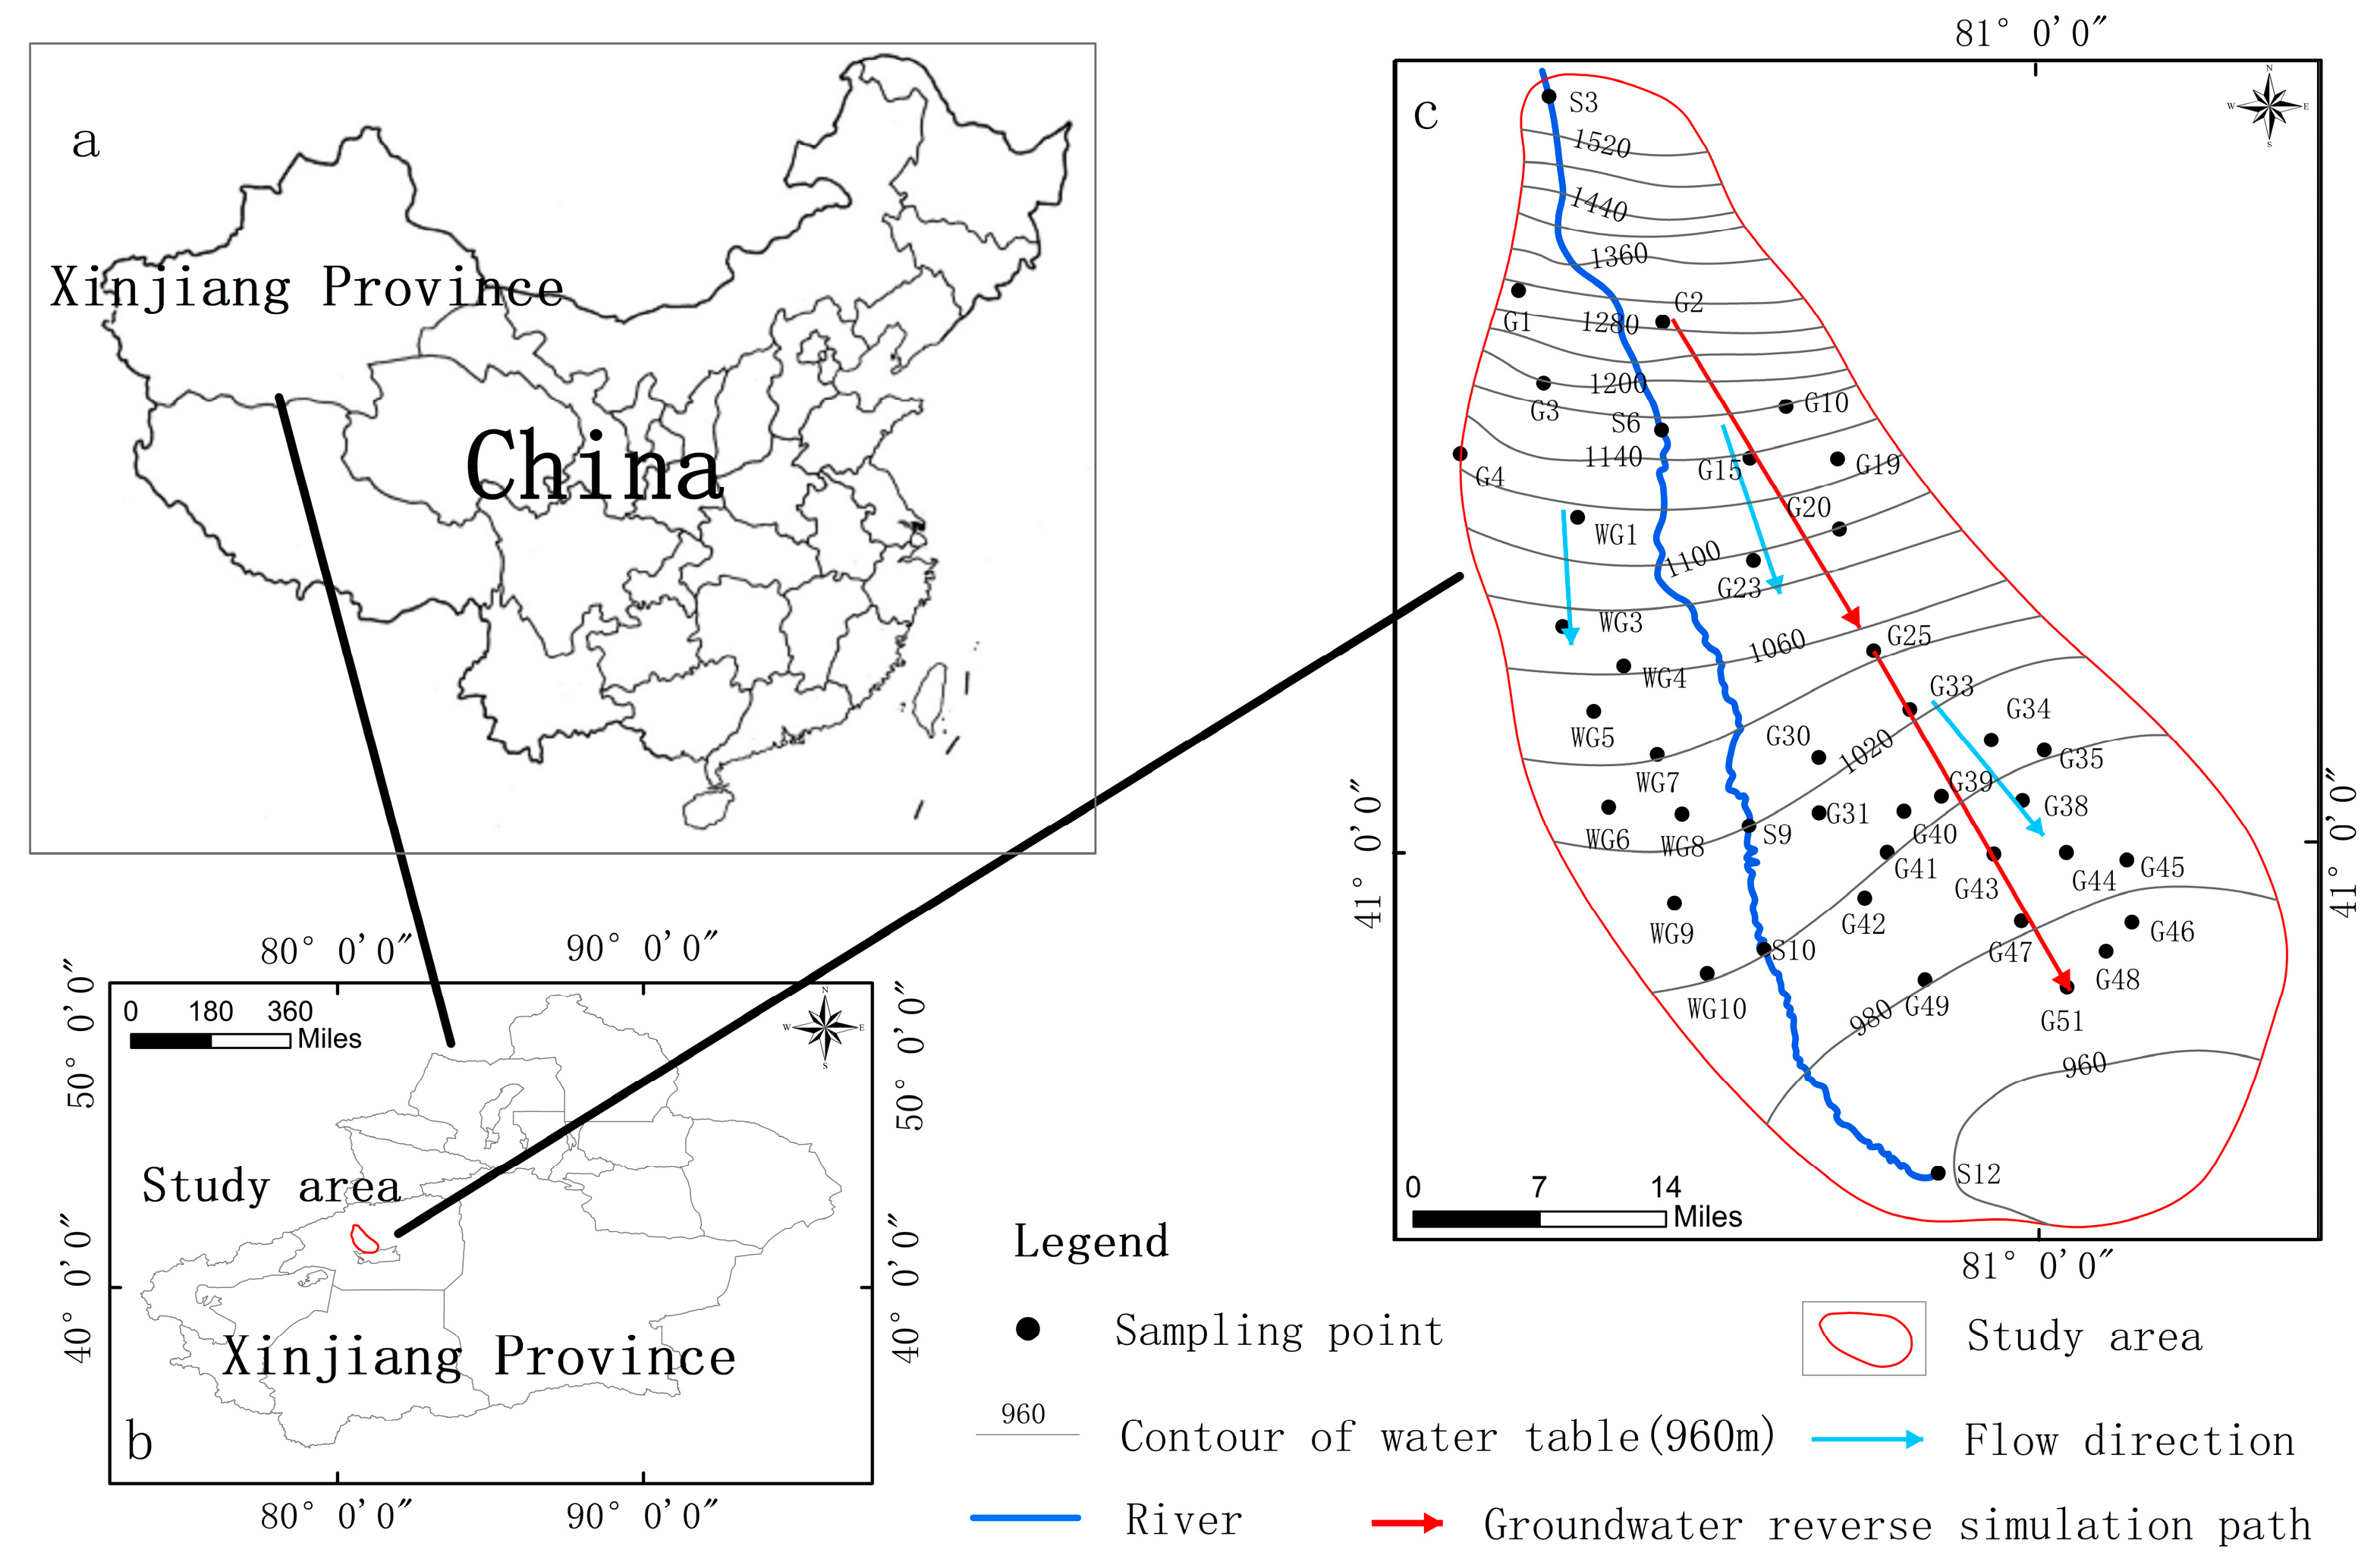
2.1. Study Area
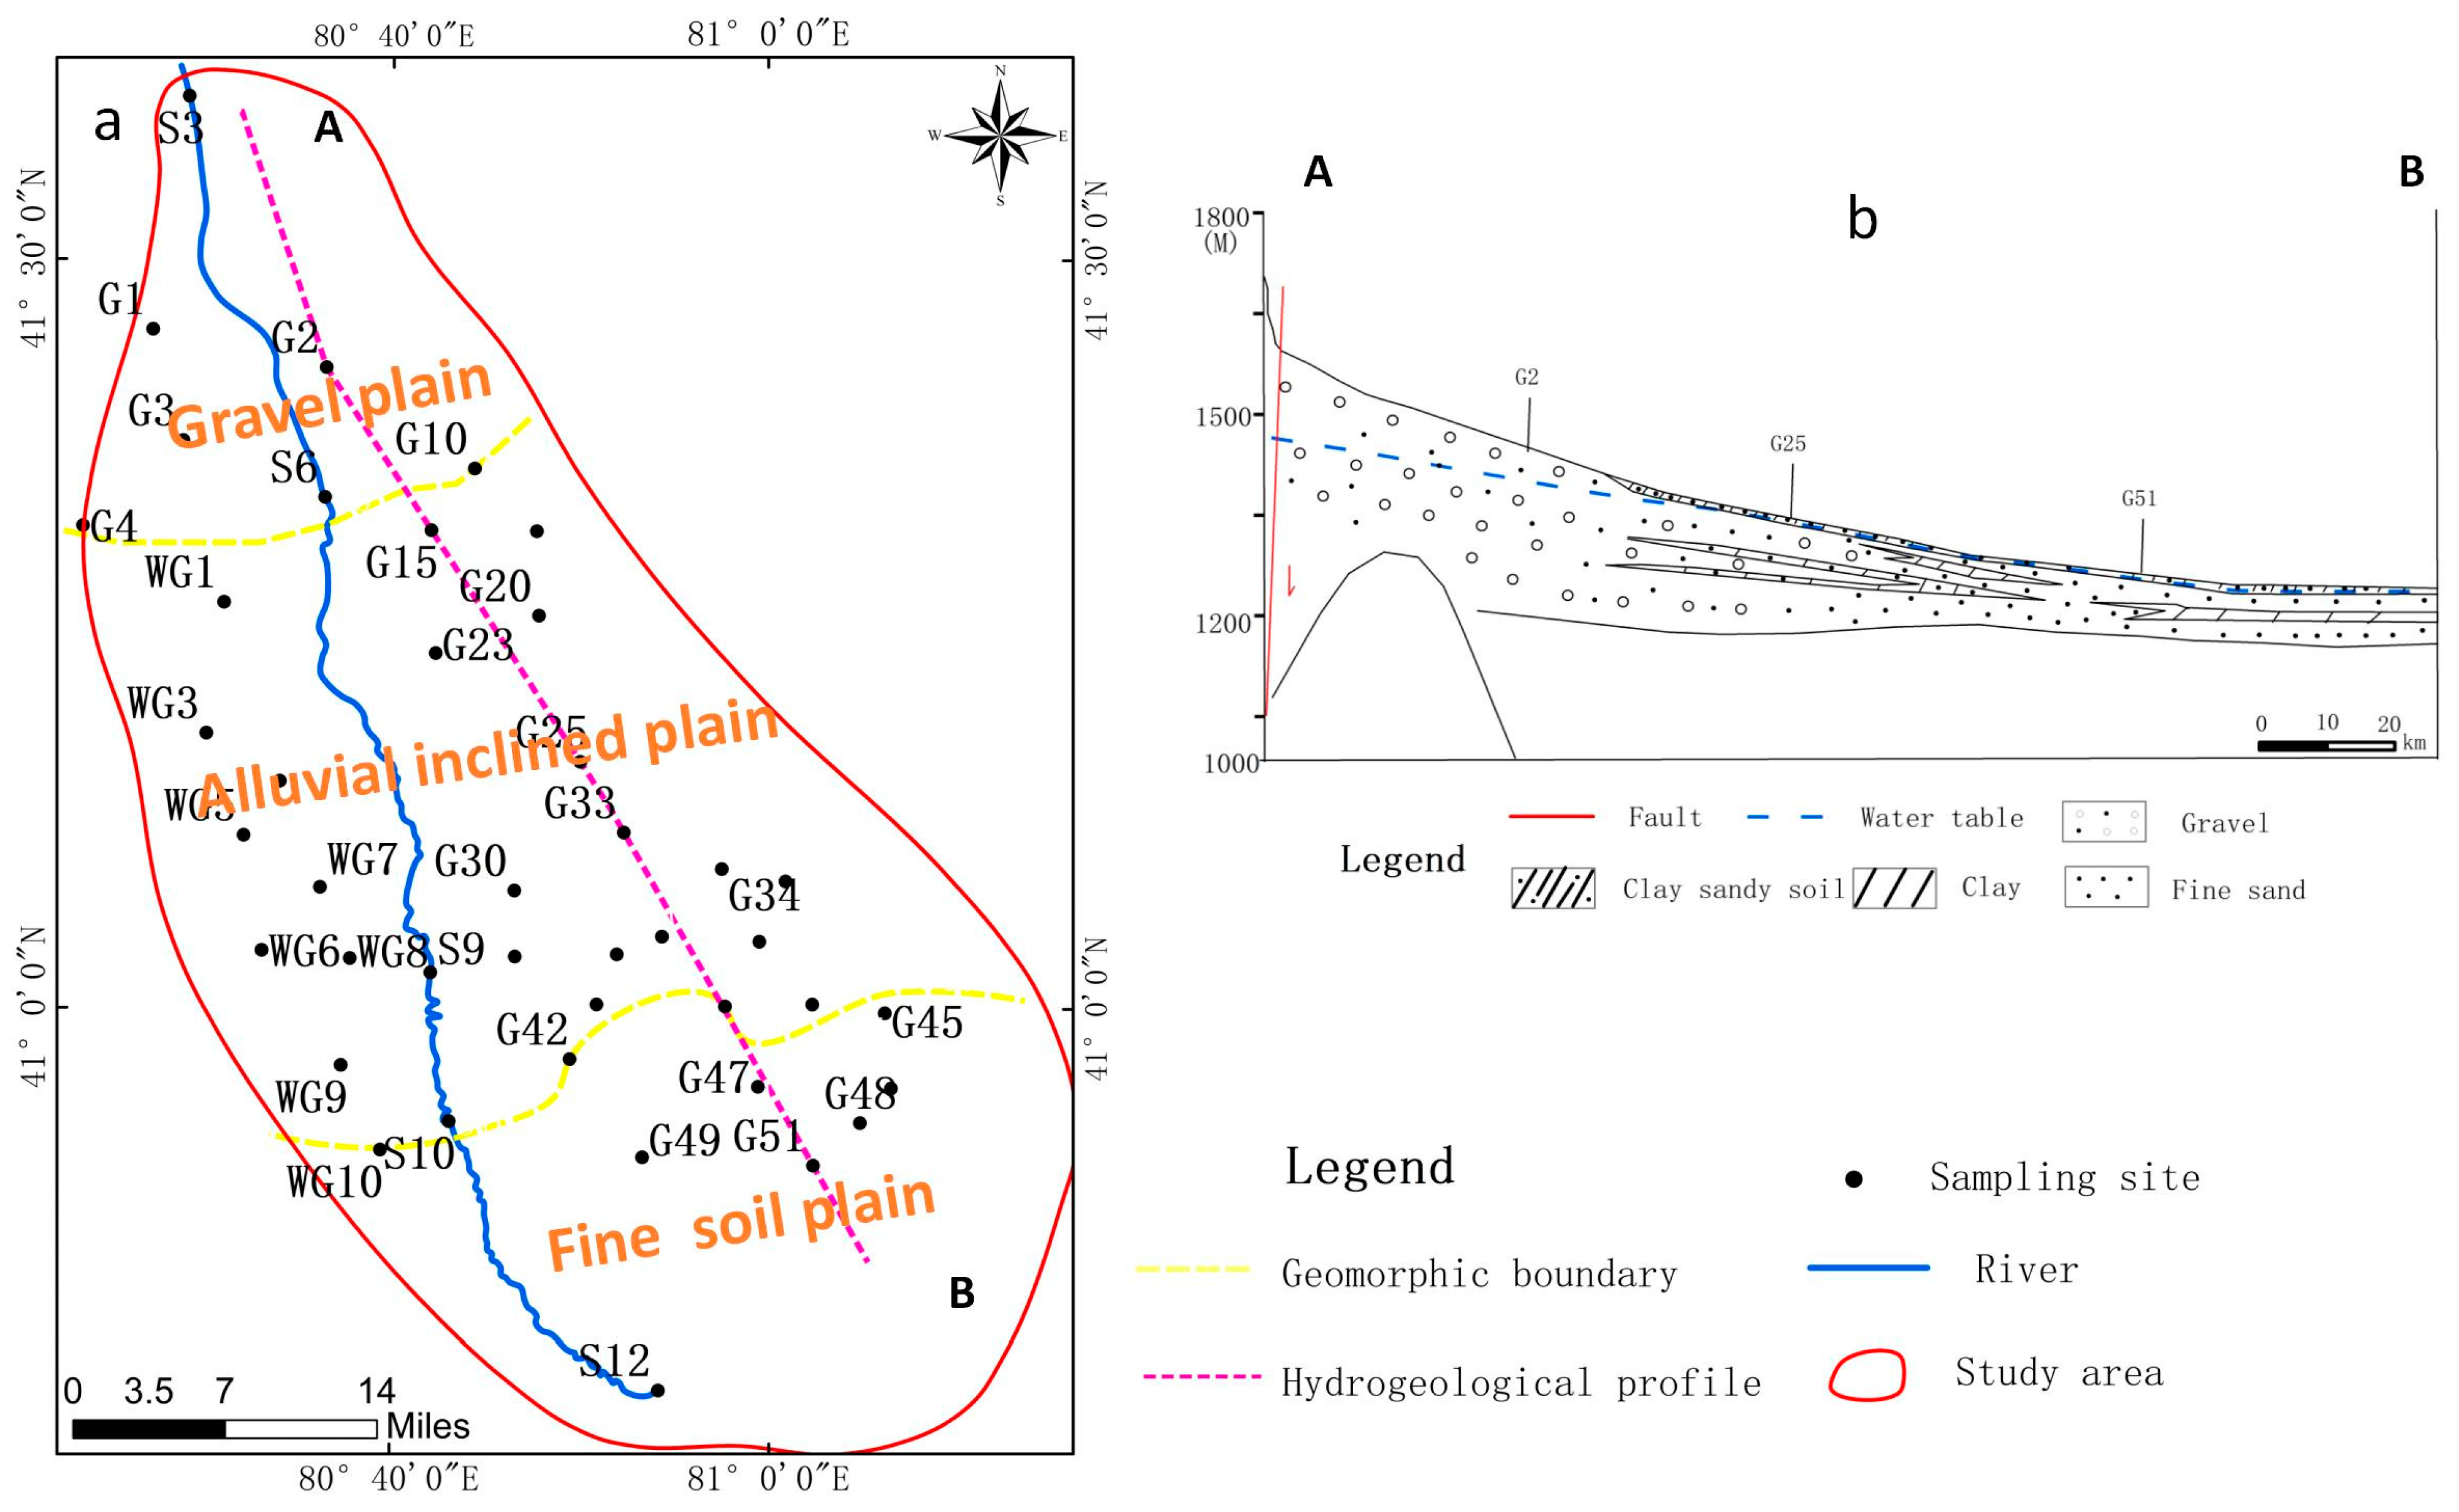
2.2. Hydrogeology
2.3. Sampling and Analysis
3. Results and Discussion
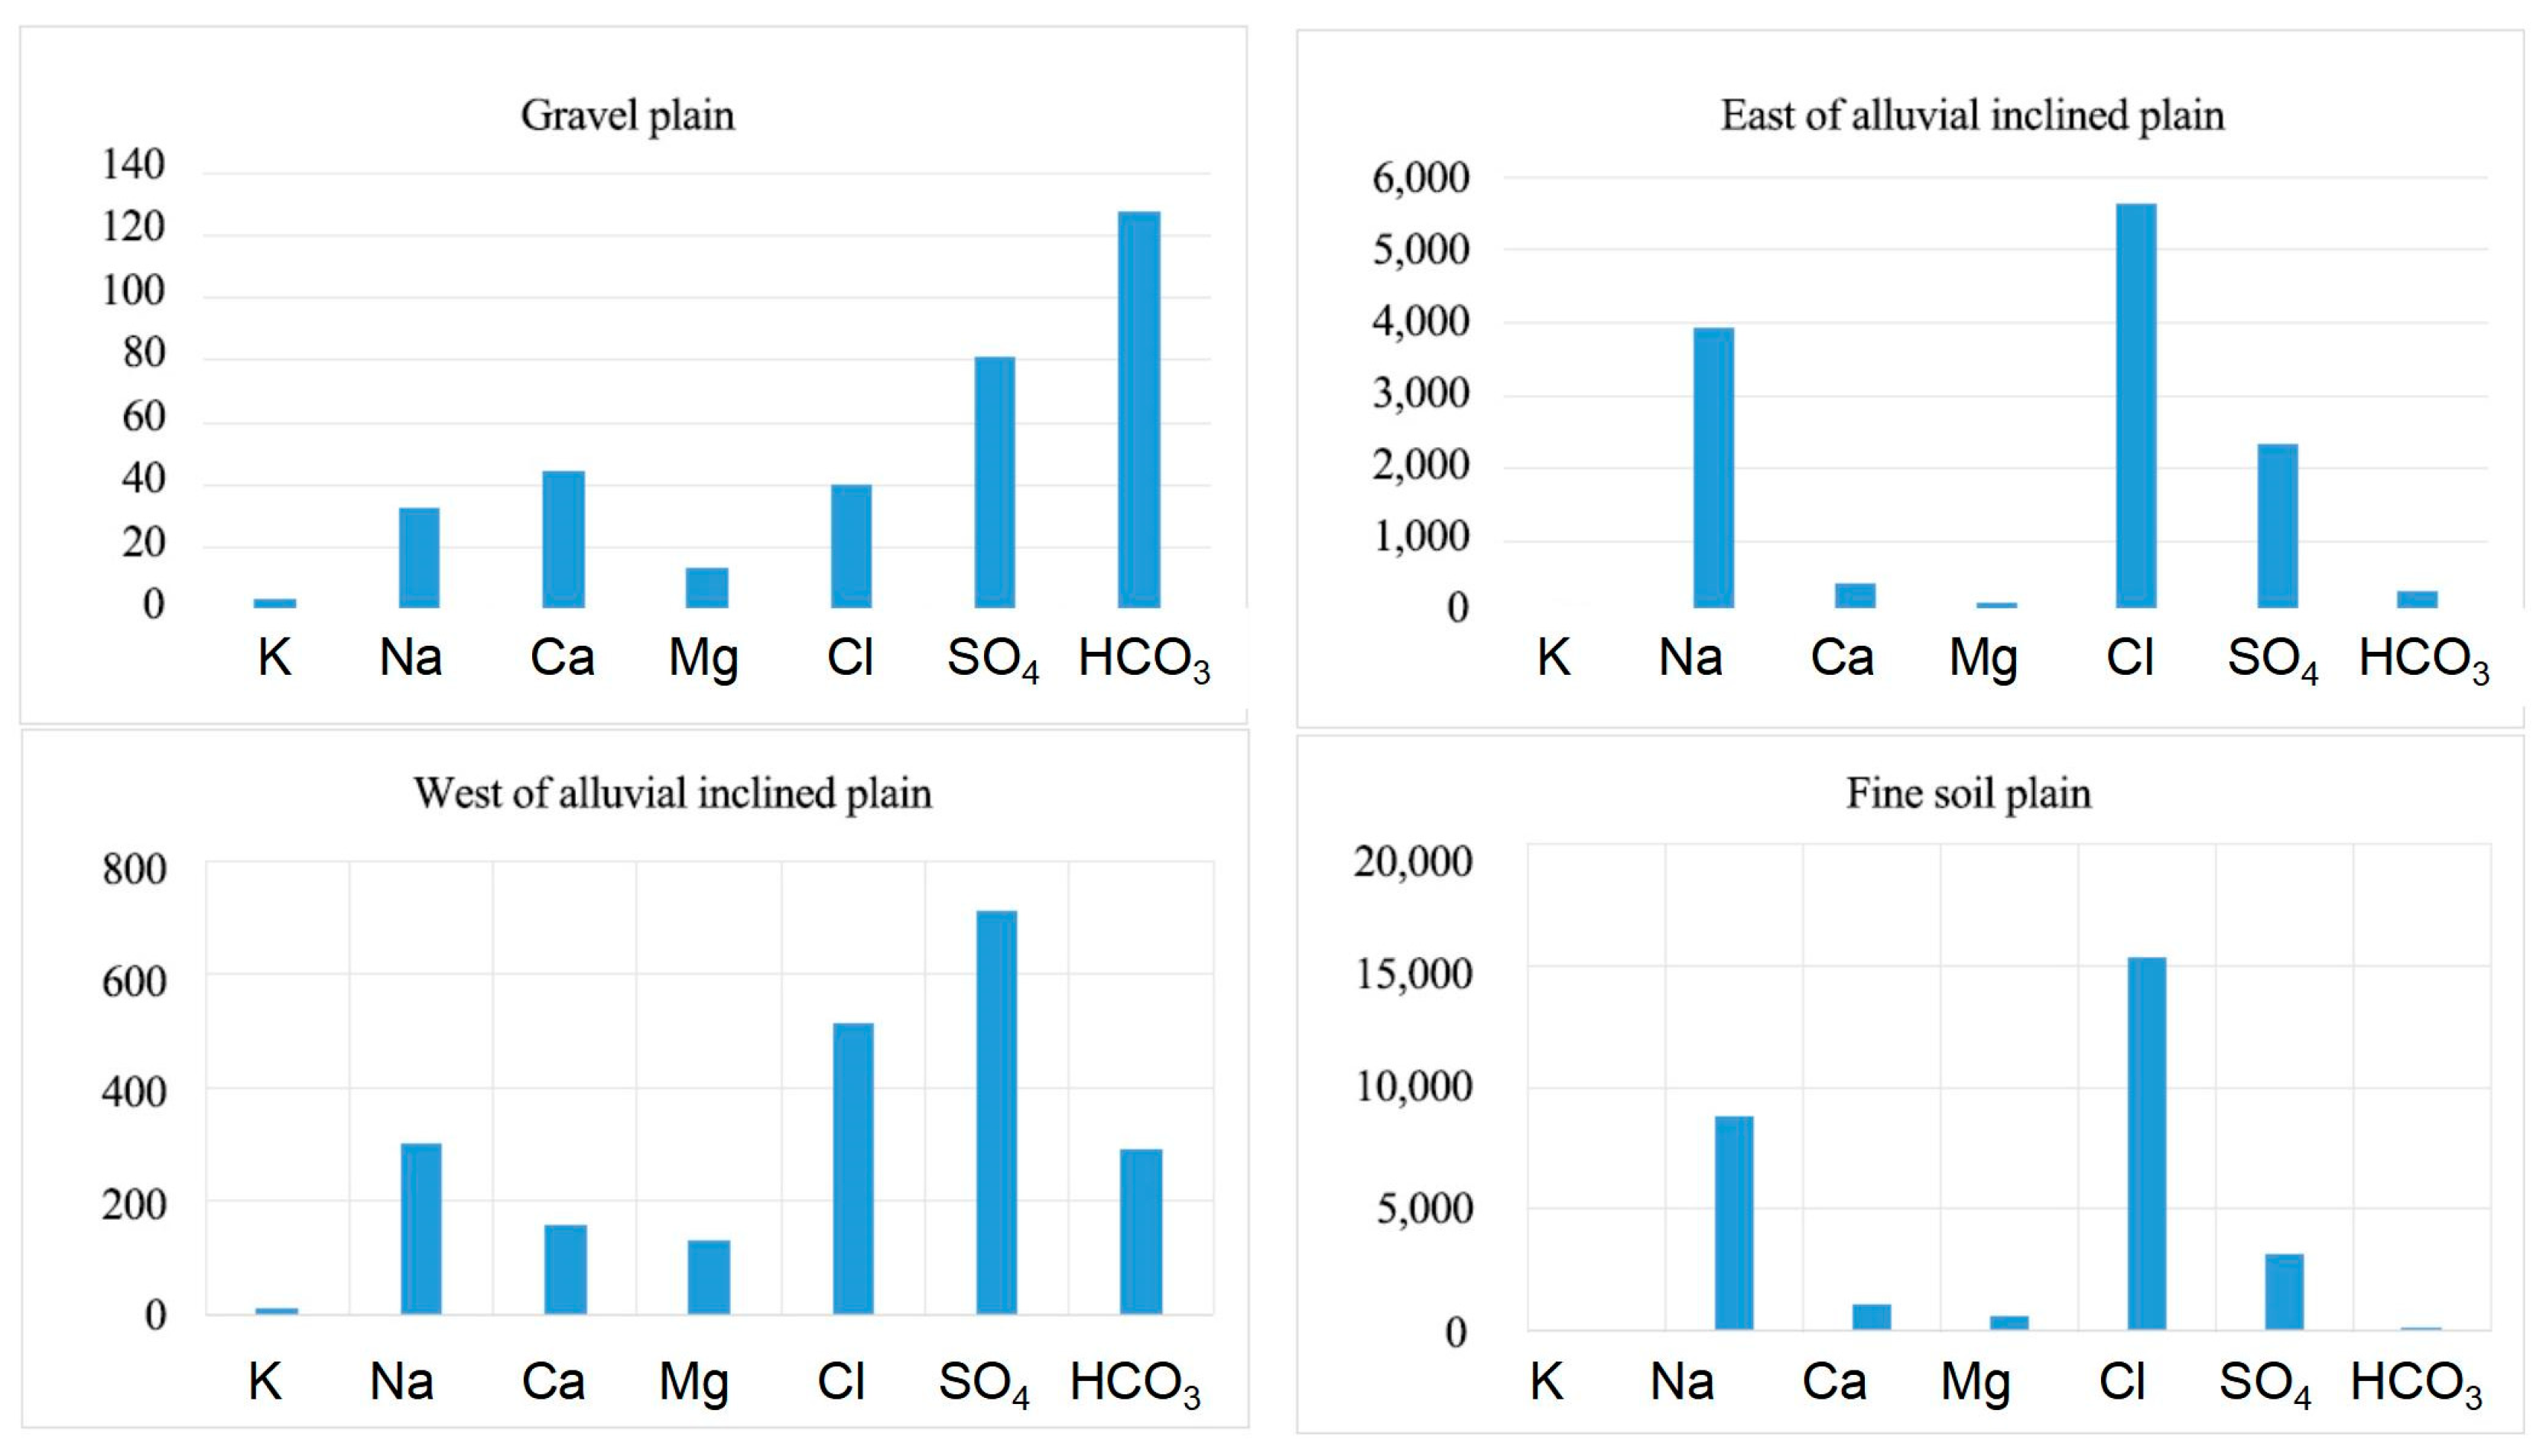
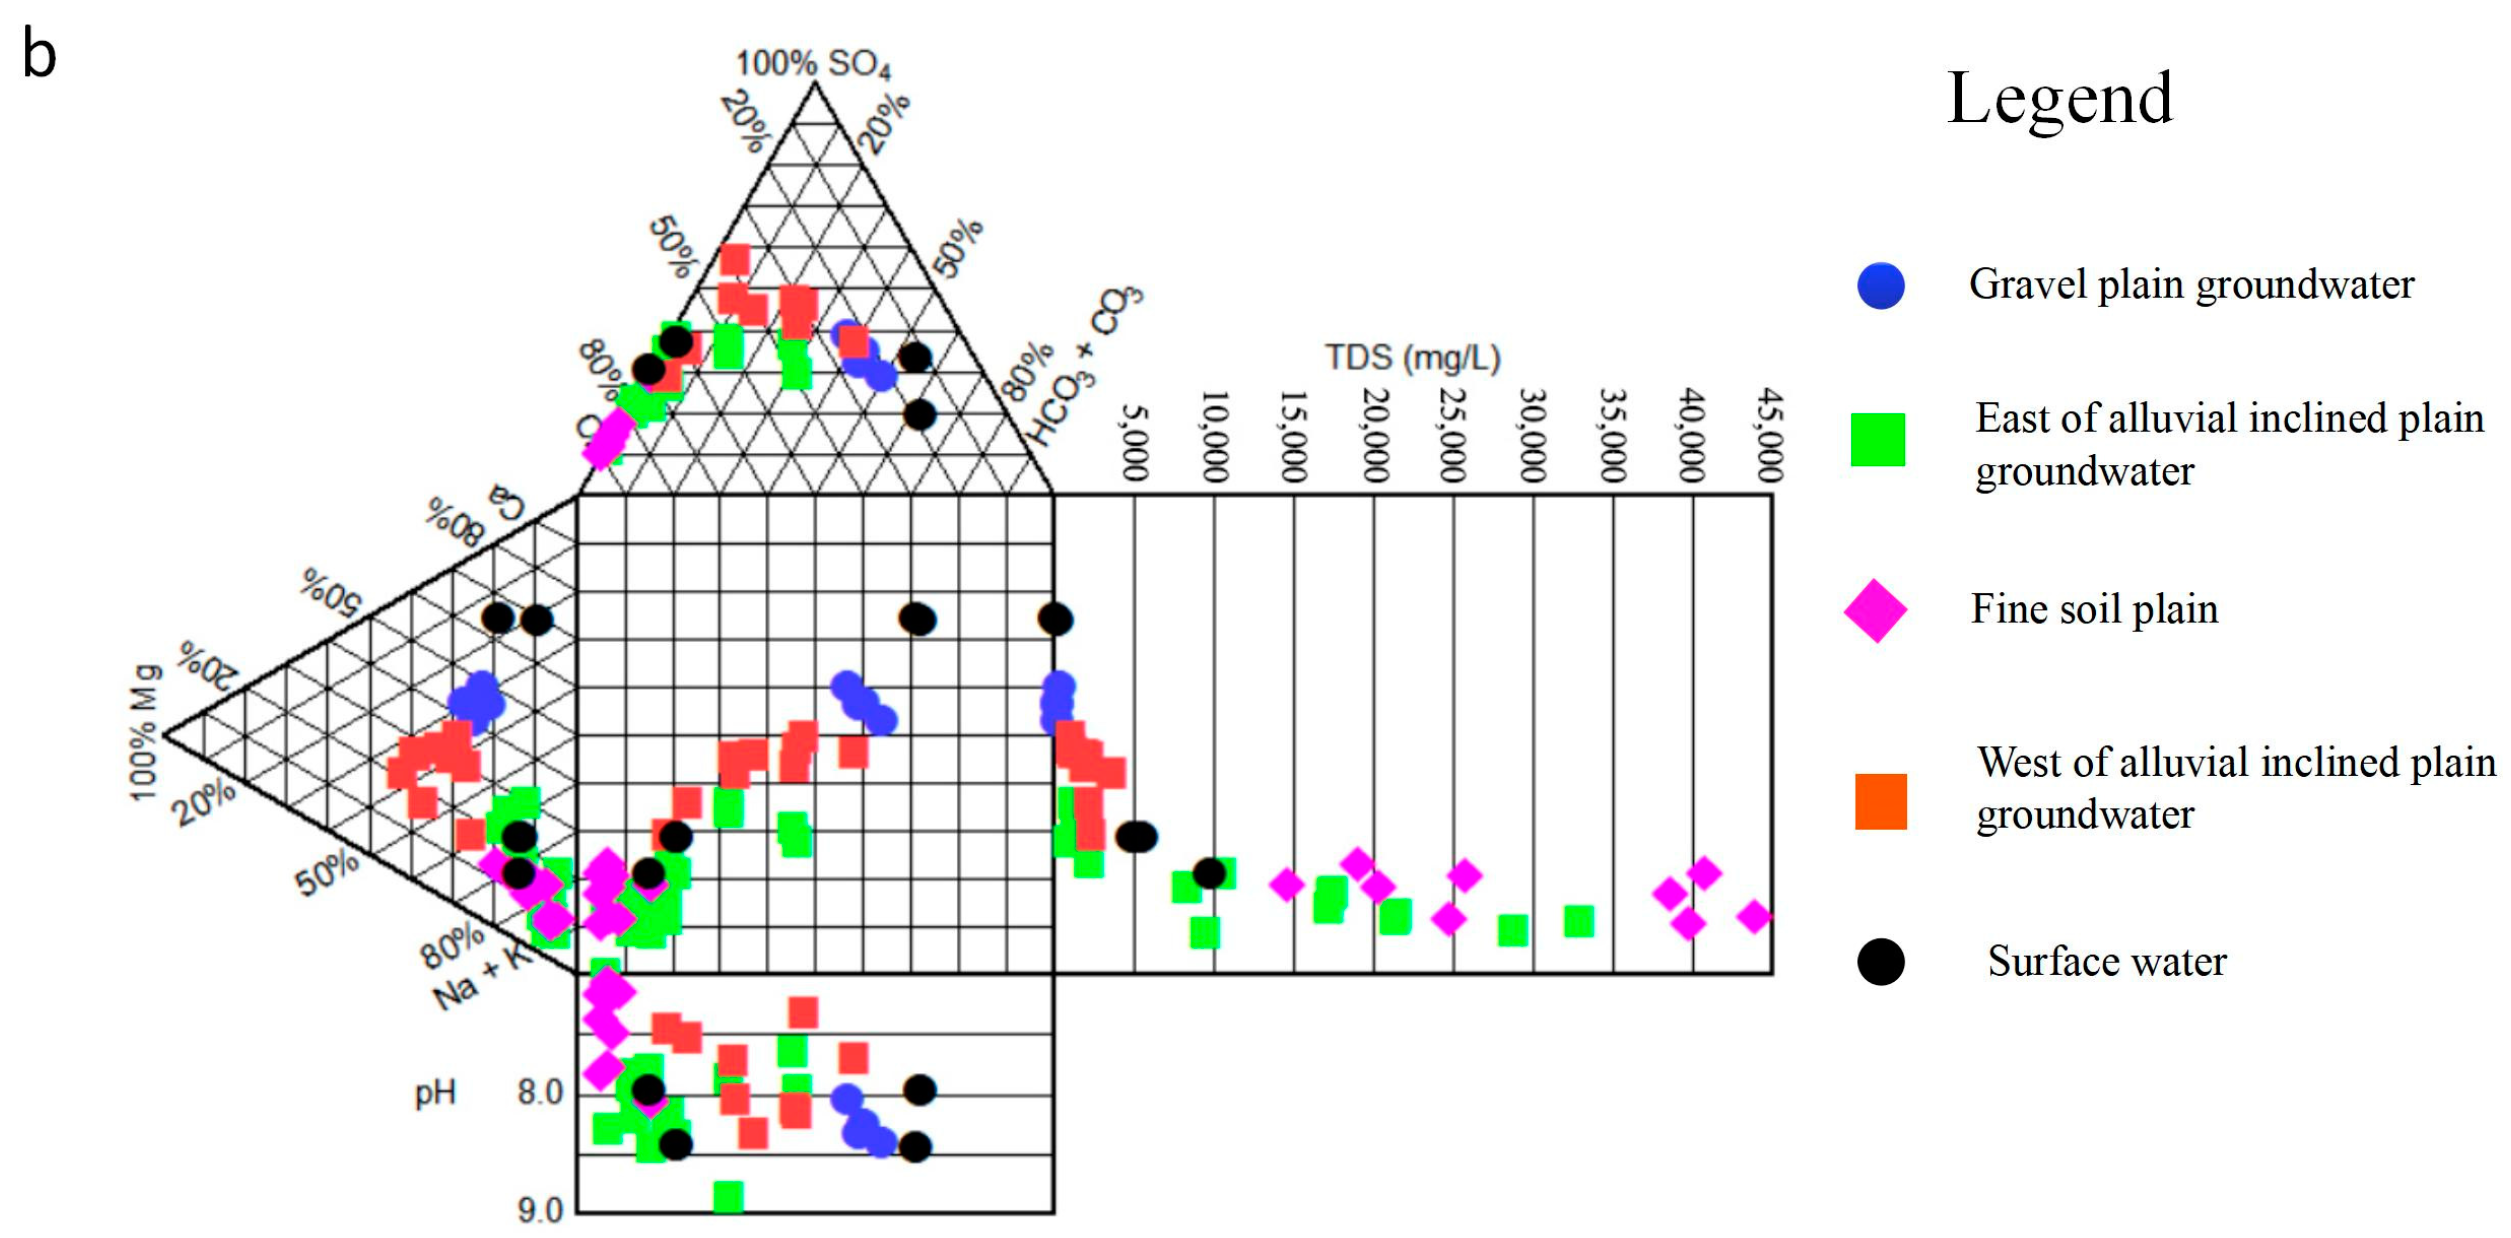
3.1. Water Chemical Characteristics
3.2. Spatial Distribution Characteristics of Water Chemistry
3.3. Hydrochemical Origin Analysis
3.3.1. Genetic Mechanism of Groundwater
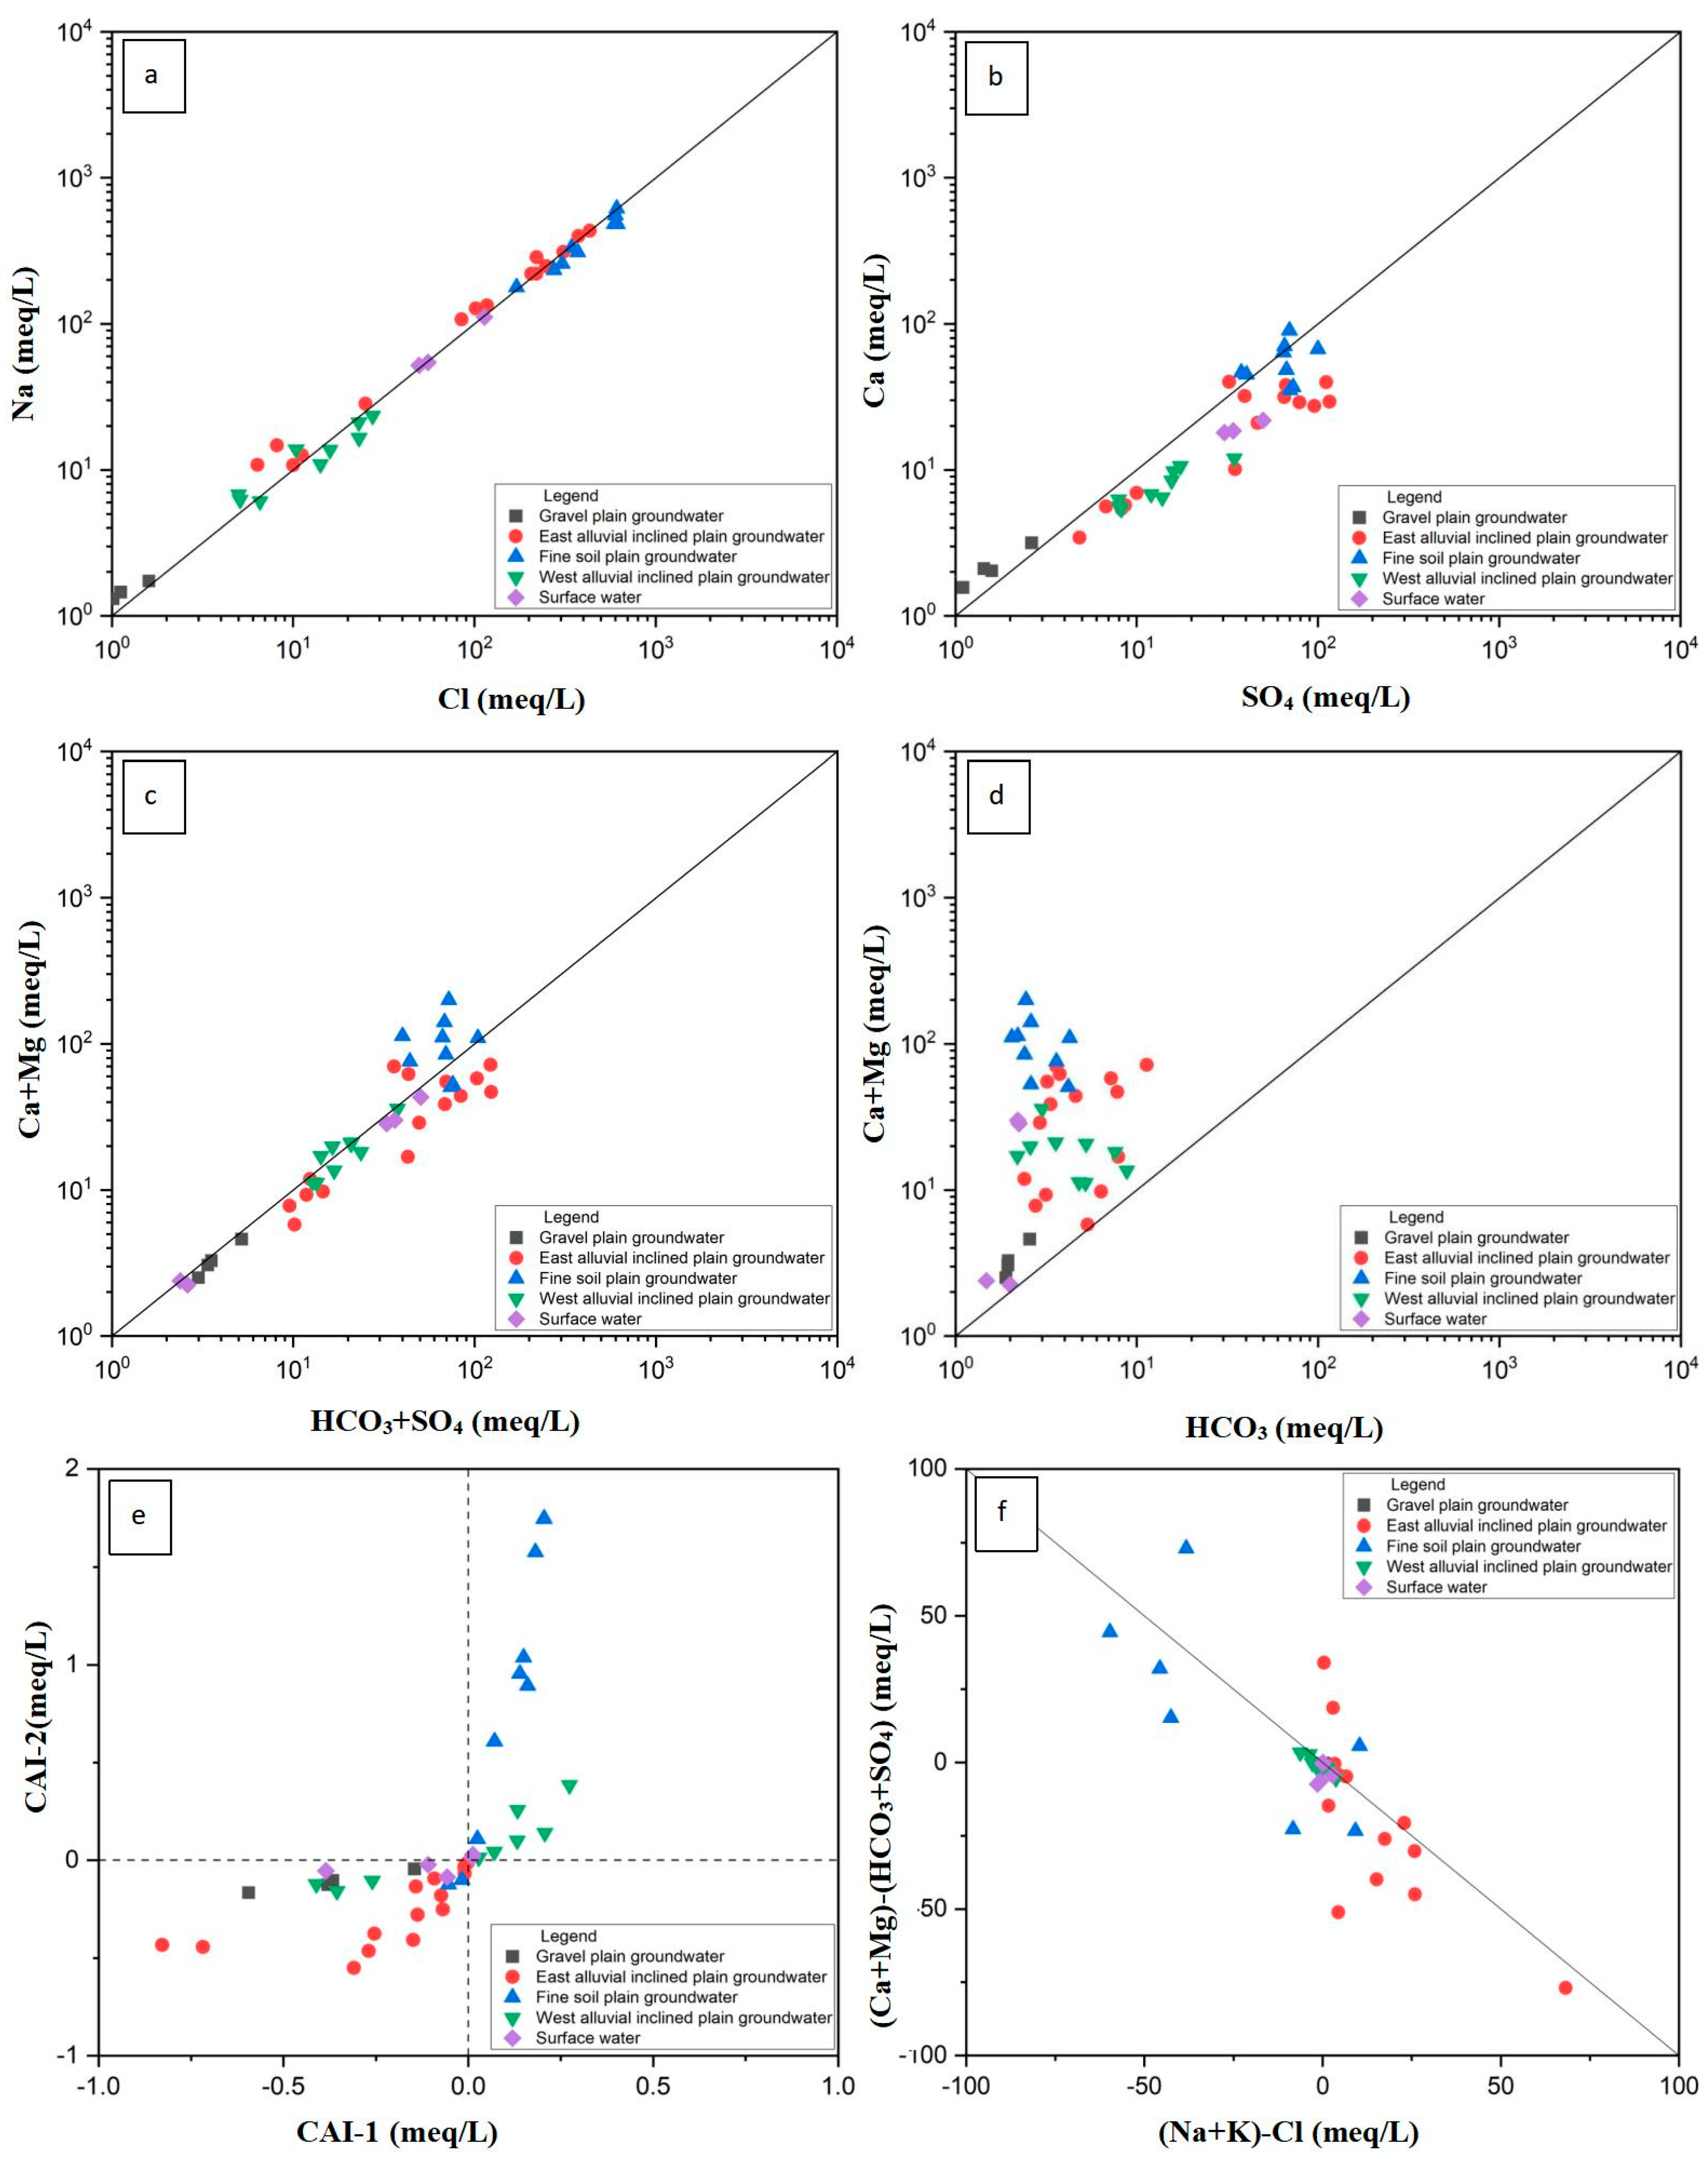
3.3.2. Major Ion Proportional Relationship
3.4. Hydrogeochemical Simulation Analysis
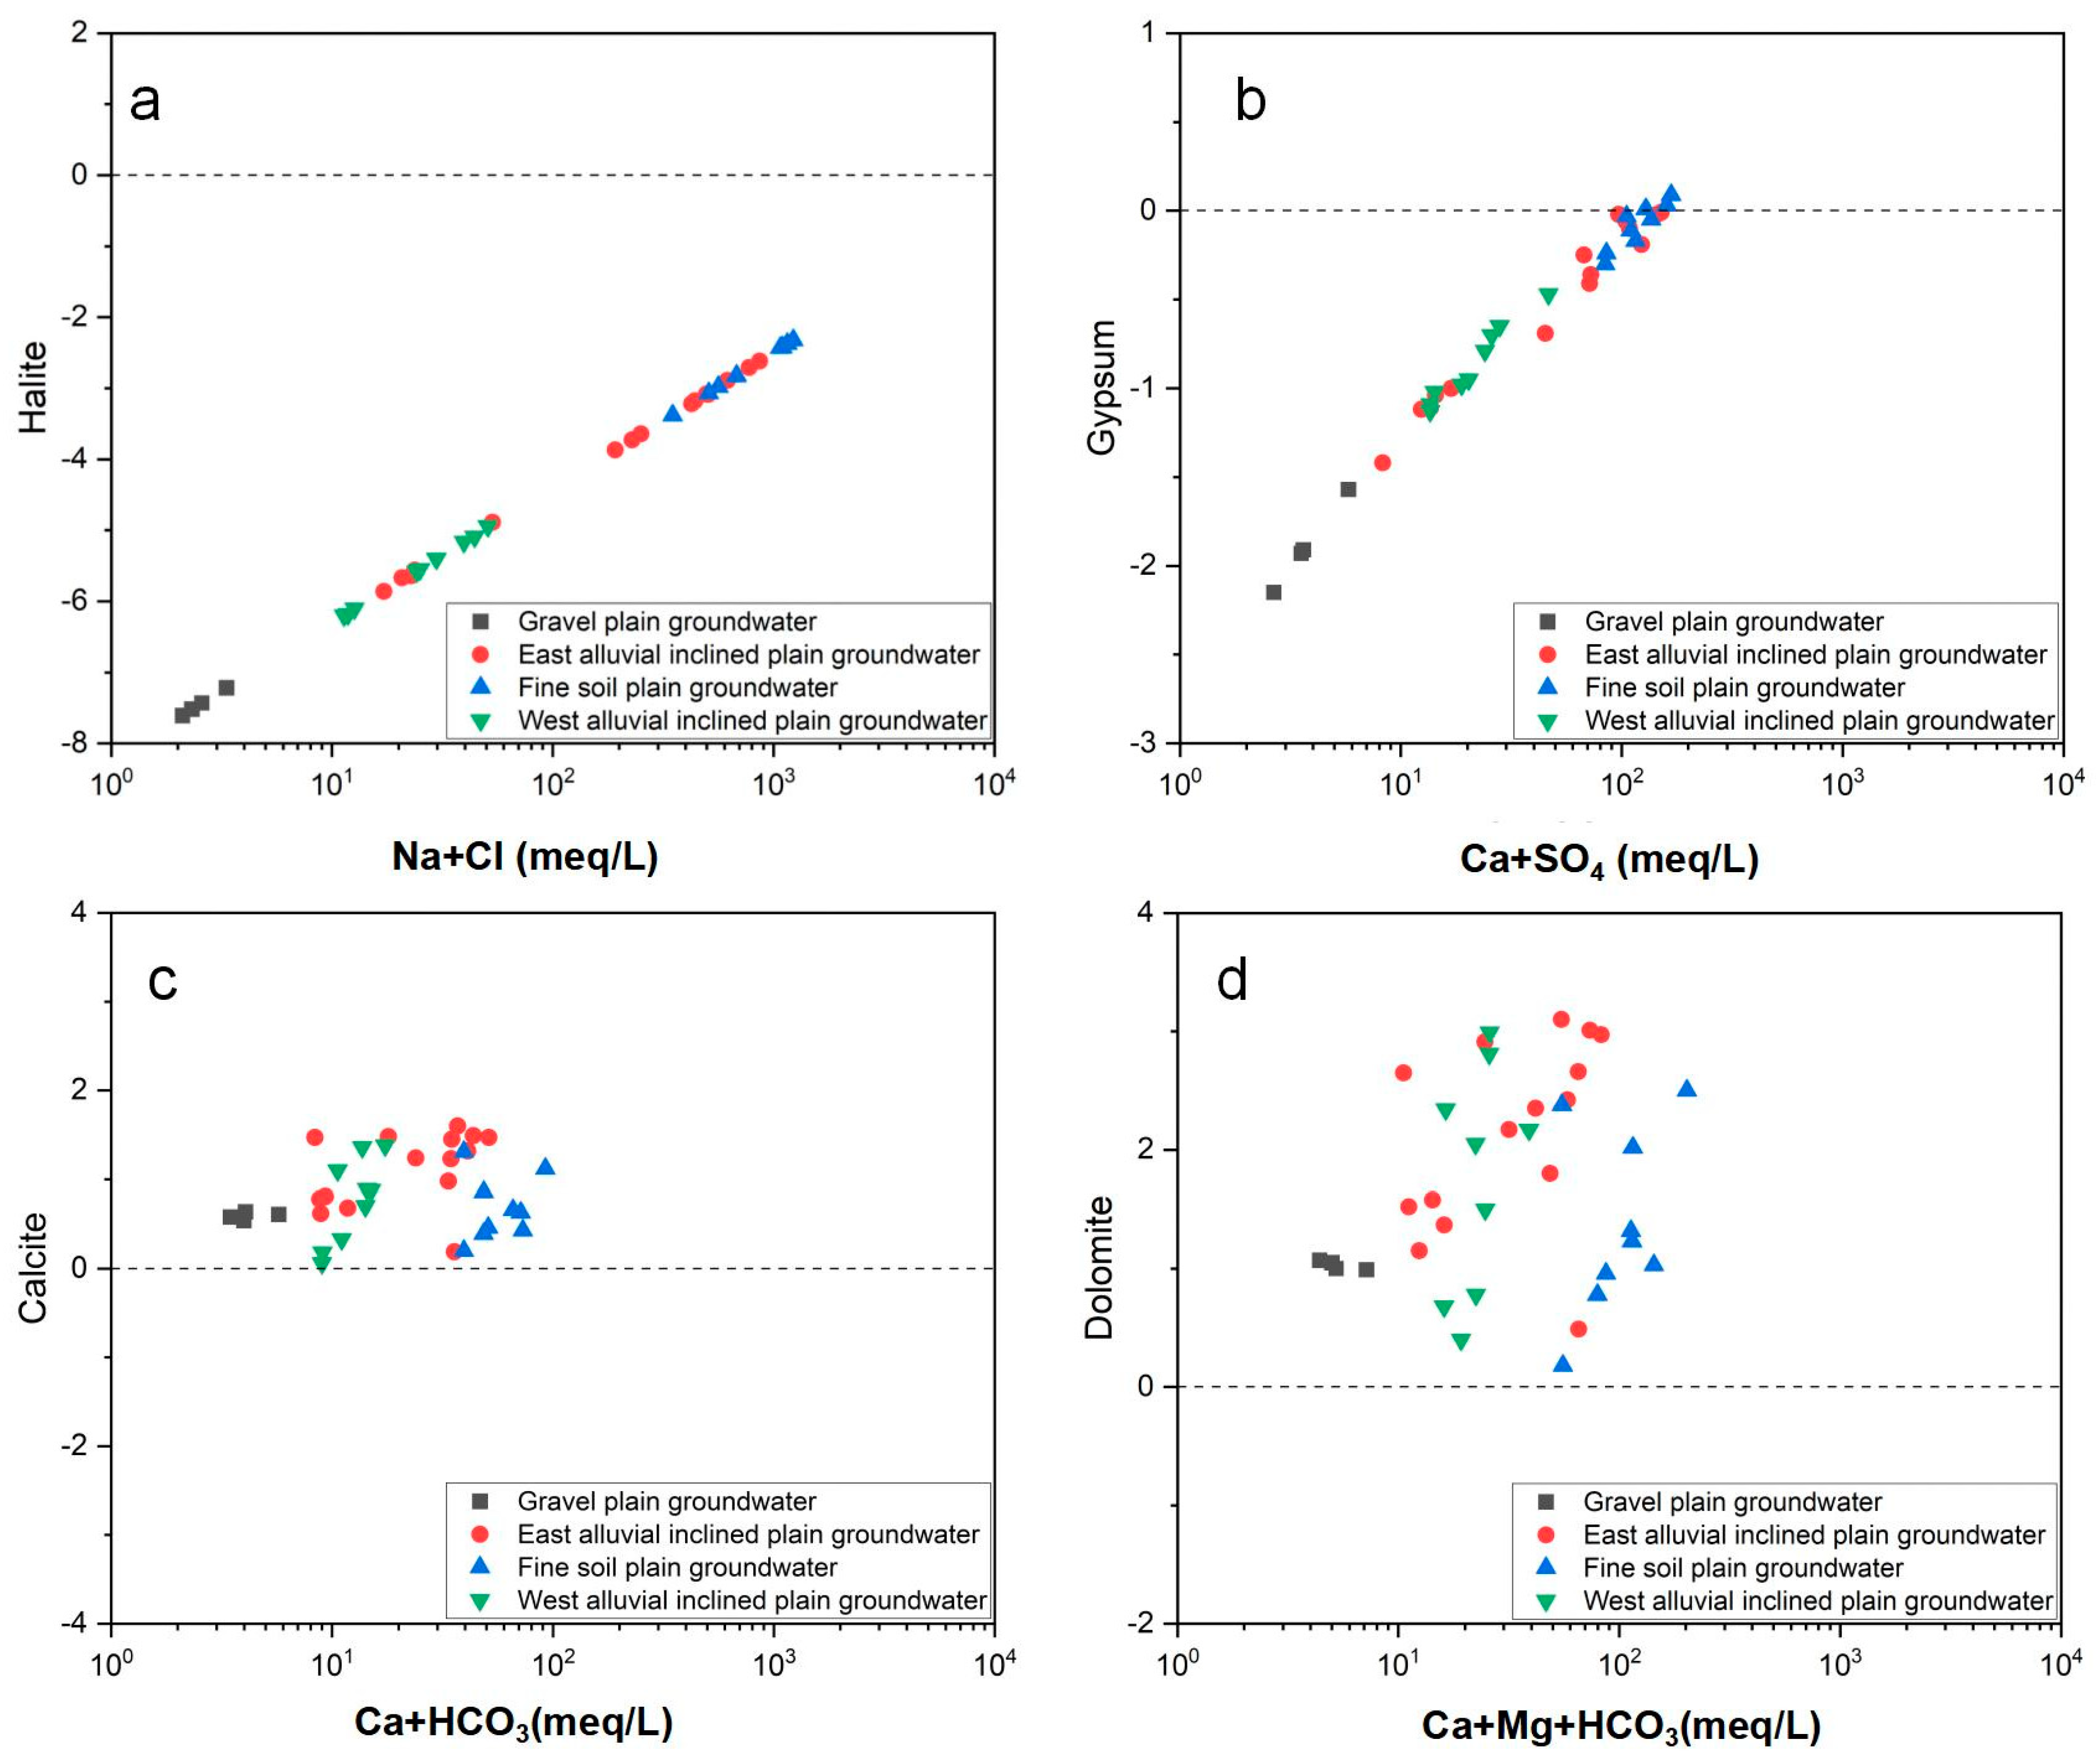
3.4.1. Mineral Saturation Index
3.4.2. Reverse Hydrogeochemical Modeling
- (1)
- G2–G25: Along the runoff from the gravel plain to the inclined plain, the main water–rock process that caused the change in groundwater chemical composition was calcite, with a precipitation of 1.31 × 10⁻² mmol/L. The dissolution amounts of halite, gypsum, and calcite were 4.18 × 10⁻², 8.36 × 10⁻², and 6.60 × 10⁻³ mmol/L, respectively. The positive cation exchange results were 1.69 × 10⁻² mmol/L Ca2+ leaving groundwater and 3.37 × 10⁻² mmol/L Na+ entering groundwater. The dissolved amount of CO2 was 9.61 × 10⁻⁵ mmol/L due to the precipitation of carbonate and the dissolved amount of halite and sulfate gypsum. At the same time, under the influence of positive cation exchange, Na+, Cl−, and SO42− were increased, and the hydrochemical type evolved from the HCO3·SO4-Ca-·Na type to the SO4·Cl-Na·Ca. Cl·SO4-Na type.
- (2)
- G25–G51: Along the runoff from the inclined plain to the fine soil plain, the following water–rock interactions mainly occurred between the two points: the precipitation of calcite occurred, and the precipitation amount was 1.32 × 10⁻¹ mmol/L; dolomite, halite, and gypsum were dissolved in 6.58 × 10⁻², 1.89 × 10⁻¹, and 2.38 × 10⁻² mmol/L, respectively. The negative cation exchange results were 9.45 × 10⁻² mmol/L Ca2+ entering groundwater and −1.89 × 10⁻¹ mmol/L Na+ leaving groundwater. Because both halite and gypsum are continuously dissolving, and halite has a higher dissolution capacity than gypsum, the TDS level rose as the amount of Na+ and Cl- in the groundwater increased. With this, the hydrochemical type changed from the Cl·SO4-Na type to the Cl-Na type.
4. Conclusions
- (1)
- The chemical types of groundwater in the study area have obvious zonation, which reflects the evolution of groundwater recharge, runoff, and discharge in arid inland basins. From the gravel plain to the fine soil plain, in the direction of runoff, the chemical type of groundwater changed from the HCO3·SO4-Ca Na type of fresh water to the SO4·Cl-Na·Ca, Cl· SO4-Na, and Cl-Na types of salt water. The medium particles of the aquifer in the gravel plain and inclined plain were relatively coarse, and the groundwater regeneration and alternations were relatively fast. In these plains, water–rock interaction and mainly positive cation exchange processes controlled hydrochemical components. The medium particles of the aquifer in the fine soil plain were relatively fine; the regeneration and alternation rate of groundwater was relatively slow; and the hydrochemical components were mainly affected by evaporation, concentration, and, more significantly, negative cation exchange.
- (2)
- The relationship between ion ratio and saturation index showed that the ion components of groundwater mineralization are mainly released from the dissolution of halite and gypsum, the precipitation of dolomite and calcite, and positive and negative cation exchange.
- (3)
- Based on the reverse hydrogeochemical simulation, the main water–rock interactions of groundwater in the direction of the runoff were the dissolution of halite and gypsum, precipitation of calcite and dolomite, cation exchange, and dissolution of carbon dioxide. In particular, the dissolution of halite and gypsum and positive cation exchange are the main interactions from the gravel plain to the inclined plain. The fine soil plain is dominated by negative cation exchange, and the simulation results quantitatively validated the results of qualitative analysis on the main water–rock interaction.
Author Contributions
Funding
Data Availability Statement
Acknowledgments
Conflicts of Interest
References
- Xiaomin, G.; Qiulan, Z.; Yali, C.; Jingli, S.; Yong, X.; Peng, Z.; Jinxing, L. Hydrogeochemistry and Genesis Analysis of Thermal and Mineral Springs in Arxan, Northeastern China. Water 2017, 9, 61. [Google Scholar]
- Aher, K.R.; Pathrikar, P.B.; Golekar, R.B.; Gaikwad, G.D.; Borgawkar, A.R.; Kathane, P.V. Application of Water Quality Index and Multivariate Statistical Analysis in the Hydrogeochemical Assessment of Shallow Groundwater in Part of Purna Basin, Maharashtra, India. Bull. Pure Appl. Sci. Sect. F Geol. Int. Res. J. Geol. Sci. 2020, 39F, 239–255. [Google Scholar] [CrossRef]
- Xiao, Y.; Shao, J.; Cui, Y.; Zhang, G.; Zhang, Q. Groundwater circulation and hydrogeochemical evolution in Nomhon of Qaidam Basin, northwest China. J. Earth Syst. Sci. 2017, 126, 26. [Google Scholar] [CrossRef]
- Zhang, Z.; Wang, Z.; Xu, Y.; Zhang, Y.; Tang, L. Quantitative Study on the Changes of Karst Groundwater Level and Hydrochemistry in Jinci Spring Catchment, Shanxi, China. Expo. Health 2020, 12, 513–525. [Google Scholar] [CrossRef]
- Zheng, Q.; Li, Y.; Zhang, Y.; Zhang, Z.; Wu, A.; Shi, H. Adsorption of sulfate from acid mine drainage in Northwestern China using Malan loess. Arab. J. Geosci. 2019, 12, 348. [Google Scholar] [CrossRef]
- Gui-Zhi, W.; De-Shan, T. Application of Improved GM(1,1) Model in Predicting of Water Diversion of Tai lan River Irrigation Area. Water Conserv. Sci. Technol. Econ. 2012, 18, 28–30. [Google Scholar]
- Bo, C. Research on Groundwater Resource Management in Aksu City. Energy Energy Conserv. 2017, 12, 93–94. [Google Scholar]
- Li, Q.; Jia, R.; Zhou, J. Chemical characteristics of high fluoride groundwater in Aksu Area, Xinjiang. J. Arid. Land Resour. Environ. 2013, 27, 87–92. [Google Scholar]
- Bai, C. Distribution and Water Quality Evaluation of Middle-Salinity Groundwater in Tarim Basin; Xinjiang Agricultural University: Urumqi, China, 2013. [Google Scholar]
- Xu, D. Study on the Characteristics and Controlling Factors of Groundwater Chemical Evolution in Suxian Mining Area; Hefei University of Technology: Hefei, China, 2017. [Google Scholar]
- Barbecot, F.; Marlin, C.; Gibert, E.; Dever, L. Hydrochemical and isotopic characterisation of the Bathonian and Bajocian coastal aquifer of the Caen area (Northern France). Appl. Geochem. 2000, 15, 791–805. [Google Scholar] [CrossRef]
- Sikdar, P.K.; Sarkar, S.S.; Palchoudhury, S. Geochemical evolution of groundwater in the Quaternary aquifer of Calcutta and Howrah, India. J. Asian Earth Sci. 2001, 19, 579–594. [Google Scholar] [CrossRef]
- Yang, M.; Lu, Y.; Zhang, F.; Zhang, S.; Yin, M.; Wu, G. Chemical evolution and geochemical simulation of karst water in Liulin Spring Basin. South–North Water Divers. Water Sci. Technol. 2018, 16, 127–134. [Google Scholar]
- Jiangtao, Z.; Jinlong, Z.; Chuan, L.; Zhong, Y.; Li, Q.; Zhengde, B. Reverse hydrogeochemical simulation of groundwater in the plain area of Yanqi Basin, Xinjiang. J. Arid. Land Resour. Environ. 2017, 31, 65–70. [Google Scholar]
- Wei, X.; Zhou, J.L.; Nai, W.H.; Zeng, Y.Y.; Fan, W.; Li, B. Chemical characteristics and evolution of groundwater in Kashi Delta, Xinjiang. Environ. Sci. 2019, 40, 4042–4051. [Google Scholar]
- Wu, Q.; Liang, Y.; Gao, F.; Du, M.; Wu, B.; Liu, J. Water chemical characteristics, distribution and origin analysis of brackish water in Alar City, Xinjiang. Arid. Land Geogr. 2021, 40, 737–745. [Google Scholar]
- Ding, Q.; Zhou, J.; Zeng, Y.; Lei, M.; Sun, Y. Analysis of groundwater hydrochemistry and its influencing factors based on multivariate statistical method in Barkol Basin, Xinjiang. Water Resour. Water Eng. 2011, 32, 78–83. [Google Scholar]
- Li, L. The transformation relationship between surface water and groundwater in Tarim River Basin. Soil Water Conserv. 2011, 41, 23–28. [Google Scholar] [CrossRef]
- Remi, Z.J.; Fan, W.; Zhang, J. Characteristics of groundwater chemical evolution in Aksu Plain, Xinjiang. Geol. Environ. 2020, 48, 602–611. [Google Scholar]
- Karunanidhi, D.; Subramani, T.; Roy, P.D.; Li, H. Impact of groundwater contamination on human health. Environ. Geochem. Health 2021, 43, 643–647. [Google Scholar] [CrossRef] [PubMed]
- Barzegar, R.; Moghaddam, A.A.; Adamowski, J.; Nazemi, A.H. Assessing the potential origins and human health risks of trace elements in groundwater: A case study in the Khoy plain, Iran. Environ. Geochem. Health 2019, 41, 981–1002. [Google Scholar] [CrossRef] [PubMed]
- Huh, Y.; Tsoi, M.Y.; Zaitsev, A.; Edmond, J.M. The fluvial geochemistry of the rivers of Eastern Siberia: I. Tributaries of the Lena River draining the sedimentary platform of the Siberian Craton. Geochim. Cosmochim. Acta 1998, 62, 1657–1676. [Google Scholar] [CrossRef]
- GB 8537-2018; National Food Safety Standard: Drinking Natural Mineral Water. National Health and Wellness Commission: Beijing, China, 2018.
- WHO. Guidelines for Drinking-Water Quality, 4th ed.; incorporating the 1st addendum; WHO: Geneva, Switzerland, 2017. [Google Scholar]
- Wang, J.; Liang, X.; Liu, Y.; Jin, M.; Knappett, P.S.K.; Liu, Y. Hydrogeochemical Evolution Along Groundwater Flow Paths in the Manas River Basin, Northwest China. Ground Water 2019, 57, 575–589. [Google Scholar] [CrossRef] [PubMed]
- Procesi, M.; Marini, L.; Cinti, D.; Sciarra, A.; Basile, P.; Mazzoni, T.; Zarlenga, F. Preliminary fluid geochemical survey in Tete Province and prospective development of geothermics in Mozambique. Geotherm. Energy 2022, 10, 2. [Google Scholar] [CrossRef]
- Huihui, D.; Jun, D.; Ning, Y.; Yang, D.; Ying, G.; Guoxiao, W.; University, L. Study of the evolution of hydrochemical properties of groundwater in Ulan Buh Desert in the north of the Helan Mountains. J. Glaciol. Geocryol. 2015, 37, 793–802. [Google Scholar]
- Xing, L.; Guo, H.; Zhan, Y. Groundwater hydrochemical characteristics and processes along flow paths in the North China Plain. J. Asian Earth Sci. 2013, 70, 250–264. [Google Scholar] [CrossRef]
- Zhu, B.; Yang, X.; Rioual, P.; Qin, X.; Liu, Z.; Xiong, H.; Yu, J. Hydrogeochemistry of three watersheds (the Erlqis, Zhungarer and Yili) in northern Xinjiang, NW China. Appl. Geochem. 2011, 26, 1535–1548. [Google Scholar] [CrossRef]
- Wang, H.; Jiang, X.W.; Wan, L.; Han, G.; Guo, H. Hydrogeochemical characterization of groundwater flow systems in the discharge area of a river basin. J. Hydrol. 2015, 527, 433–441. [Google Scholar] [CrossRef]
- Schoeller, H. Qualitative evaluation of groundwater resources. Methods Tech. Groundw. Investig. Dev. 1967, 33, 54–83. [Google Scholar]
- Helstrup, T.; Jrgensen, N.O.; Banoeng-Yakubo, B. Investigation of hydrochemical characteristics of groundwater from the Cretaceous-Eocene limestone aquifer in southern Ghana and southern Togo using hierarchical cluster analysis. Hydrogeol. J. 2007, 15, 977–989. [Google Scholar] [CrossRef]
- Apollaro, C.; Fuoco, I.; Gennaro, E.; Giuliani, L.; Iezzi, G.; Marini, L.; Radica, F.; Di Luccio, F.; Ventura, G.; Vespasiano, G. Advanced argillic alteration at Cave di Caolino, Lipari, Aeolian Islands (Italy): Implications for the mitigation of volcanic risks and the exploitation of geothermal resources. Sci. Total Environ. 2023, 889, 164333. [Google Scholar] [CrossRef]
- Apollaro, C.; Marini, L.; Rosa, R.D. Use of reaction path modeling to predict the chemistry of stream water and groundwater: A case study from the Fiume Grande valley (Calabria, Italy). Environ. Geol. 2007, 51, 1133–1145. [Google Scholar] [CrossRef]
- Lu, X.; Sun, J.; Liu, J.; Jin, S.; Liu, J. Groundwater evolution and geochemical simulation in Sandan water source. Yellow River 2014, 36, 84–88. [Google Scholar]
- Soumya, B.S.; Sekhar, M.; Riotte, J.; Audry, S.; Lagane, C.; Braun, J.J. Inverse models to analyze the spatiotemporal variations of chemical weathering fluxes in a granito-gneissic watershed: Mule Hole, South India. Geoderma 2011, 165, 12–24. [Google Scholar] [CrossRef]
- Yang, N.; Wang, G.; Shi, Z.; Zhao, D.; Jiang, W.; Guo, L.; Liao, F.; Zhou, P. Application of Multiple Approaches to Investigate the Hydrochemistry Evolution of Groundwater in an Arid Region: Nomhon, Northwestern China. Water 2018, 10, 1667. [Google Scholar] [CrossRef]
- Mayo, A.L.; Loucks, M.D. Solute and isotopic geochemistry and ground water flow in the central Wasatch Range, Utah. J. Hydrol. 1995, 172, 31–59. [Google Scholar] [CrossRef]
- Wanjun, J.; Dan, Z.; Guangcai, W.; Yonghai, G.; Chenglong, L.; Tao, Z.; Shufen, L.; Chenzhi, H.E. Hydro-geochemical Characteristics and Formation of Groundwater in Tu-Ha Basin, Xinjiang. Geoscience 2016, 30, 825–833. [Google Scholar]
- Wang, J. Numerical Simulation of Groundwater Flow Models and Typical Systems in Arid Inland Basins; China University of Geosciences: Wuhan, China, 2020. [Google Scholar]
- Xu, Y. Study on Groundwater Chemical Evolution and Water Cycle Characteristics in the Western Plain Area of Yili Valley, Xinjiang; North China University of Water Resources and Electric Power: Zhengzhou, China, 2020. [Google Scholar]


| Location | Sample Number | ρB/(mg/L) | pH | ||||||||||
|---|---|---|---|---|---|---|---|---|---|---|---|---|---|
| K | Na | Ca | Mg | Cl | SO4 | HCO3 | NO3 | Total Hardn | Total Alkal | TDSs | |||
| Gravel plain | G1 | 3.21 | 30.05 | 40.80 | 15.12 | 36.04 | 76.25 | 119.03 | 5.09 | 163.98 | 97.60 | 260.99 | 8.26 |
| G2 | 3.98 | 39.81 | 63.36 | 17.51 | 56.74 | 126.47 | 156.46 | 9.99 | 230.32 | 128.31 | 386.10 | 8.05 | |
| G3 | 3.44 | 33.46 | 42.27 | 11.51 | 39.66 | 68.86 | 118.55 | 2.59 | 152.85 | 97.21 | 261.28 | 8.34 | |
| G4 | 2.98 | 29.01 | 31.34 | 11.47 | 29.75 | 52.79 | 115.70 | 1.72 | 125.35 | 94.88 | 215.18 | 8.41 | |
| East of alluvial inclined plain | G10 | 6.46 | 338.11 | 108.33 | 52.95 | 288.38 | 395.95 | 387.85 | 57.80 | 487.82 | 318.05 | 1384.10 | 7.65 |
| G15 | 6.18 | 247.35 | 112.29 | 26.76 | 354.64 | 325.79 | 168.68 | 11.70 | 390.55 | 150.36 | 1164.56 | 8.86 | |
| G19 | 5.70 | 248.16 | 68.99 | 28.68 | 225.76 | 232.21 | 326.01 | 7.37 | 290.02 | 267.34 | 972.51 | 7.97 | |
| G20 | 7.16 | 289.68 | 114.71 | 42.95 | 396.78 | 415.63 | 192.83 | 3.25 | 462.80 | 158.13 | 1363.34 | 7.87 | |
| G23 | 9.14 | 651.85 | 138.85 | 60.19 | 890.85 | 480.19 | 146.29 | 0.86 | 593.83 | 119.96 | 2304.22 | 8.16 | |
| G25 | 33.95 | 2461.54 | 421.09 | 94.87 | 3014.46 | 2235.22 | 178.46 | 0.88 | 1442.02 | 152.36 | 8353.95 | 8.31 | |
| G30 | 93.19 | 7130.75 | 641.66 | 363.65 | 10976.16 | 1899.05 | 229.80 | 2.58 | 3099.33 | 188.45 | 21219.37 | 7.00 | |
| G31 | 57.41 | 5702.58 | 802.08 | 364.87 | 8830.58 | 1554.71 | 220.02 | 1.35 | 3504.90 | 180.43 | 17422.23 | 8.29 | |
| G33 | 30.09 | 2922.74 | 631.64 | 85.14 | 3617.35 | 3142.67 | 204.13 | 9.82 | 1927.70 | 173.42 | 10535.28 | 8.35 | |
| G34 | 101.22 | 6579.89 | 585.52 | 214.06 | 7819.85 | 5567.86 | 476.72 | 2.28 | 2343.28 | 390.94 | 21106.75 | 8.28 | |
| G35 | 58.14 | 5052.50 | 581.51 | 182.43 | 7305.62 | 3812.03 | 281.14 | 2.35 | 2203.08 | 230.55 | 17132.80 | 7.79 | |
| G38 | 41.34 | 3074.40 | 202.53 | 81.49 | 4158.18 | 1679.47 | 481.61 | 2.96 | 841.18 | 400.96 | 9481.80 | 8.44 | |
| G39 | 106.11 | 9997.17 | 800.08 | 385.54 | 15355.99 | 5354.00 | 691.85 | 4.23 | 3585.01 | 567.36 | 32344.82 | 7.83 | |
| G40 | 93.19 | 9188.35 | 547.42 | 373.38 | 13334.53 | 4604.28 | 440.05 | 2.67 | 2904.06 | 360.86 | 28361.18 | 7.94 | |
| G41 | 35.50 | 5077.54 | 759.97 | 207.98 | 7802.12 | 3199.28 | 195.58 | 3.26 | 2753.85 | 160.38 | 17180.17 | 8.19 | |
| Fine soil plain | G42 | 141.38 | 14196.20 | 1347.50 | 520.55 | 21650.88 | 4807.81 | 260.36 | 1.90 | 5507.70 | 213.51 | 42794.49 | 7.18 |
| G43 | 88.81 | 7656.58 | 739.92 | 195.81 | 12181.95 | 3513.10 | 158.91 | 3.68 | 2653.71 | 130.31 | 24455.62 | 7.15 | |
| G44 | 73.47 | 4101.01 | 707.84 | 188.52 | 6064.37 | 3359.32 | 255.47 | 1.88 | 2543.56 | 209.50 | 14622.26 | 8.07 | |
| G45 | 202.72 | 11128.89 | 1804.68 | 1337.85 | 21810.47 | 3345.62 | 149.13 | 3.07 | 10014.00 | 122.29 | 39704.80 | 7.84 | |
| G46 | 102.25 | 5385.18 | 931.42 | 809.40 | 9752.65 | 1816.87 | 134.46 | 2.11 | 5657.91 | 110.26 | 18864.99 | 7.78 | |
| G47 | 69.82 | 7130.75 | 1281.32 | 572.84 | 13174.94 | 3101.00 | 124.68 | 12.27 | 5557.77 | 102.24 | 25393.02 | 7.50 | |
| G48 | 117.69 | 12751.56 | 972.52 | 440.88 | 21278.51 | 3223.31 | 146.68 | 21.39 | 4243.43 | 120.29 | 38857.82 | 7.37 | |
| G49 | 50.10 | 5928.87 | 900.34 | 378.25 | 10807.71 | 1939.18 | 220.02 | 4.05 | 3805.32 | 180.43 | 20114.45 | 7.08 | |
| G51 | 100.32 | 11086.12 | 1411.66 | 856.23 | 20994.79 | 3146.42 | 158.91 | 1.51 | 7049.86 | 130.31 | 37674.99 | 7.16 | |
| West of alluvial inclined plain | WG1 | 11.66 | 139.73 | 108.28 | 70.05 | 232.65 | 395.52 | 317.81 | 5.00 | 558.78 | 260.62 | 1116.80 | 8.16 |
| WG3 | 11.62 | 251.19 | 169.44 | 148.74 | 501.82 | 749.00 | 320.26 | 0.98 | 1035.45 | 270.65 | 1996.75 | 8.34 | |
| WG4 | 6.94 | 143.45 | 125.69 | 61.11 | 180.54 | 381.74 | 292.42 | 0.91 | 564.66 | 239.79 | 1045.68 | 7.33 | |
| WG5 | 10.00 | 156.39 | 111.89 | 97.06 | 177.32 | 383.65 | 537.84 | 1.68 | 678.95 | 441.06 | 1205.23 | 7.71 | |
| WG6 | 13.13 | 316.52 | 195.71 | 102.16 | 368.83 | 767.69 | 464.49 | 1.23 | 909.27 | 380.91 | 1996.29 | 8.13 | |
| WG7 | 8.61 | 380.40 | 129.55 | 162.82 | 818.22 | 665.15 | 157.65 | 1.49 | 991.16 | 129.28 | 2243.58 | 7.53 | |
| WG8 | 9.04 | 487.27 | 240.62 | 291.41 | 817.09 | 1661.11 | 183.35 | 2.91 | 1800.52 | 150.36 | 3598.22 | 8.05 | |
| WG9 | 6.95 | 315.24 | 212.55 | 128.43 | 567.43 | 836.51 | 217.58 | 2.33 | 1059.48 | 178.43 | 2175.91 | 7.72 | |
| WG10 | 11.75 | 539.25 | 136.52 | 124.42 | 971.80 | 575.64 | 133.72 | 0.89 | 851.21 | 109.65 | 2426.24 | 7.45 | |
| Surface | S3 | 1.63 | 9.76 | 37.41 | 6.35 | 11.93 | 43.29 | 90.32 | 2.80 | 119.55 | 74.06 | 159.19 | 8.44 |
| S6 | 2.35 | 12.90 | 39.70 | 3.16 | 19.86 | 29.45 | 122.24 | 4.23 | 112.16 | 100.24 | 168.55 | 7.96 | |
| S9 | 19.89 | 1191.88 | 360.94 | 127.70 | 1755.48 | 1467.14 | 136.90 | 9.21 | 1427.00 | 112.27 | 4991.48 | 8.42 | |
| S10 | 21.09 | 1249.53 | 370.96 | 139.87 | 1968.26 | 1639.58 | 134.46 | 11.44 | 1502.10 | 110.26 | 5456.52 | 8.42 | |
| S12 | 44.76 | 2554.42 | 436.36 | 259.96 | 4029.85 | 2395.56 | 41.64 | 13.58 | 2156.32 | 34.15 | 9741.74 | 7.97 | |
| Location | Eigenvalue | Anhydrite | Aragonite | Calcite | Dolomite | Gypsum | Halite | Sylvite |
|---|---|---|---|---|---|---|---|---|
| Gravel plain groundwater | Min | −2.45 | 0.40 | 0.54 | 0.99 | −2.15 | −7.61 | −8.16 |
| Max | −1.87 | 0.49 | 0.64 | 1.07 | −1.57 | −7.22 | −7.78 | |
| Average | −2.19 | 0.45 | 0.59 | 1.03 | −1.89 | −7.45 | −8.00 | |
| Stdev | 0.24 | 0.04 | 0.04 | 0.04 | 0.24 | 0.17 | 0.16 | |
| East-sloping plain groundwater | Min | −1.73 | 0.04 | 0.19 | 0.49 | −1.42 | −5.86 | −7.06 |
| Max | −0.30 | 1.46 | 1.60 | 3.10 | −0.01 | −2.62 | −4.21 | |
| Average | −0.32 | 1.40 | 1.54 | 2.93 | −0.03 | −2.78 | −4.37 | |
| Stdev | 0.50 | 0.42 | 0.42 | 0.79 | 0.49 | 1.20 | 1.05 | |
| Fine soil plain groundwater | Min | −0.60 | 0.06 | 0.20 | 0.18 | −0.30 | −3.38 | −4.72 |
| Max | −0.19 | 1.16 | 1.31 | 2.50 | 0.09 | −2.32 | −3.79 | |
| Average | −0.38 | 0.53 | 0.67 | 1.38 | −0.09 | −2.74 | −4.27 | |
| Stdev | 0.13 | 0.36 | 0.36 | 0.77 | 0.13 | 0.37 | 0.32 | |
| West-sloping plain groundwater | Min | −1.43 | −0.09 | 0.06 | 0.40 | −1.13 | −6.20 | −7.08 |
| Max | −0.77 | 1.24 | 1.38 | 2.99 | −0.47 | −4.94 | −6.17 | |
| Average | −1.17 | 0.62 | 0.76 | 1.75 | −0.86 | −5.58 | −6.59 | |
| Stdev | 0.22 | 0.49 | 0.49 | 0.95 | 0.22 | 0.48 | 0.29 |
| Phase | Formula | G2–G25 (mmol/L) | G25–G51 (mmol/L) |
|---|---|---|---|
| CaX2 | CaX2 | −1.69 × 10⁻² | 9.45 × 10⁻² |
| Calcite | CaCO3 | −1.31 × 10⁻² | −1.32 × 10⁻¹ |
| CO2(g) | CO2 | 9.61 × 10⁻⁵ | 2.04 × 10⁻⁴ |
| Dolomite | CaMg(CO3)2 | 6.60 × 10⁻³ | 6.58 × 10⁻² |
| Gypsum | CaSO4:2H2O | 4.18 × 10⁻² | 2.38 × 10⁻² |
| Halite | NaCl | 8.36 × 10⁻² | 1.89 × 10⁻¹ |
| NaX | NaX | 3.37 × 10⁻² | −1.89 × 10⁻¹ |
| Sylvite | KCl | 7.8 × 10⁻⁴ | 1.81 × 10⁻³ |
Disclaimer/Publisher’s Note: The statements, opinions and data contained in all publications are solely those of the individual author(s) and contributor(s) and not of MDPI and/or the editor(s). MDPI and/or the editor(s) disclaim responsibility for any injury to people or property resulting from any ideas, methods, instructions or products referred to in the content. |
© 2023 by the authors. Licensee MDPI, Basel, Switzerland. This article is an open access article distributed under the terms and conditions of the Creative Commons Attribution (CC BY) license (https://creativecommons.org/licenses/by/4.0/).
Share and Cite
Liu, L.; Lu, Y.; Yin, L.; Yang, Z.; Bian, J.; Cui, L. Chemical Characteristics-Based Evolution of Groundwater in Tailan River Basin, Xinjiang, China. Water 2023, 15, 3917. https://doi.org/10.3390/w15223917
Liu L, Lu Y, Yin L, Yang Z, Bian J, Cui L. Chemical Characteristics-Based Evolution of Groundwater in Tailan River Basin, Xinjiang, China. Water. 2023; 15(22):3917. https://doi.org/10.3390/w15223917
Chicago/Turabian StyleLiu, Lei, Yudong Lu, Lihe Yin, Zhi Yang, Jiaxin Bian, and Liyang Cui. 2023. "Chemical Characteristics-Based Evolution of Groundwater in Tailan River Basin, Xinjiang, China" Water 15, no. 22: 3917. https://doi.org/10.3390/w15223917
APA StyleLiu, L., Lu, Y., Yin, L., Yang, Z., Bian, J., & Cui, L. (2023). Chemical Characteristics-Based Evolution of Groundwater in Tailan River Basin, Xinjiang, China. Water, 15(22), 3917. https://doi.org/10.3390/w15223917