Article

Causal Analysis of Fall Accidents in Hydraulic Engineering Based on Text Mining and Decision-Making Trial and Evaluation Laboratory and Interpretative Structural Modeling

1
Hubei Key Laboratory of Construction and Management in Hydropower Engineering, China Three Gorges University, Yichang 443002, China
2
College of Hydraulic & Environmental Engineering, China Three Gorges University, Yichang 443002, China
*
Author to whom correspondence should be addressed.
Water 2023, 15(21), 3810; https://doi.org/10.3390/w15213810
Submission received: 19 September 2023 / Revised: 9 October 2023 / Accepted: 16 October 2023 / Published: 31 October 2023

Abstract

:
Hydraulic engineering construction safety has become a major concern in engineering sustainability. Fall accidents, as a common type of accident during the hydraulic engineering construction process, have caused physical and fatal injuries and property losses on an individual and societal scale. With a sizable workforce, complex operational structures and demanding construction conditions, hydraulic engineering projects present more pronounced safety management challenges than other infrastructure initiatives. As a result, the risk of accidents, particularly fall accidents, is heightened in this domain. To prevent fall accidents and minimize losses, this study used the investigation reports of 389 cases of fall accidents as the analyzed corpus, and 16 contributing factors of fall accidents were extracted with the utilization of text mining. Accident feature terms were visualized through word clouds and ring bar graphs. The logical relationship among the influencing factors was quantified based on Decision-Making Trial and Evaluation Laboratory and Interpretative Structural Modeling (DEMATEL-ISM). The contributing factors and occurrence mechanism of fall accidents in hydraulic engineering were analyzed by establishing a multilevel hierarchical hybrid model. The results showed that the multilevel hierarchical hybrid model was divided into five levels. Thirteen causal chains were obtained. Chaotic security management, weak safety awareness and an inadequate safety system were the most critical factors, while the remaining eleven transitional factors and four surface factors also contributed significantly to the occurrence of accidents. Human and management factors dominated the overall factor transfer pathway. This study proposes countermeasures to the above-mentioned factors and provides a theoretical basis for the sustainable and safe construction of hydraulic engineering.

1. Introduction

In recent decades, China has ramped up construction and investment in the hydraulic engineering sector [1,2]. Hydraulic engineering remains central to China’s infrastructure, fueling its economic advancement. However, numerous safety issues have arisen with the development of these projects. Consequently, hydraulic engineering construction safety has taken center stage in research [3]. Hydraulic engineering is a crucial and integral component of urban infrastructure development [4]. Due to the vastness and complexity of hydraulic engineering construction environments, the urgency of on-site construction safety management and the dangers of working at height in hydraulic engineering, there is a significant risk of fall-related accidents [5,6]. These risks not only impede the proper conductance of the project but also endanger workers’ lives, affect the surrounding environment and hinder economic growth [7,8]. Data from the Ministry of Water Resources reveal that between 2003 and 2014, the hydraulic engineering sector experienced 41 fall accidents, constituting 24.41% of the total incidents. These accidents resulted in 47 fatalities, making up 20.98% of the total deaths relating to hydraulic engineering construction [9]. Fall occurrences involving hydraulic engineering projects frequently rank among the top accident categories, with a death rate that surpasses 90%. This underscores the heightened risk and significant fatality rate associated with fall accidents in the construction industry [10].
In recent years, the spread of the COVID-19 pandemic brought hydraulic engineering projects to a standstill, causing a noticeable decrease in accident occurrences. However, as the economy has started to recover and hydraulic engineering construction has increased in pace, there has been a growing trend in accident rates. Throughout the construction phase, risks related to fall accidents persist [11]. Despite China’s longstanding technical safety recommendations and protective measures to limit fall risks during construction, the incidence rate remains significantly high. This poses enormous challenges to the nation’s economic development. According to the regulations, any operation with a height datum of more than two meters is referred to as height work and poses a risk of falling from height. Five primary tasks in hydraulic engineering projects are closely linked to fall incidents. These are elevated edge work, elevated cave tasks, climbing work, suspended height work and operations on elevated platforms. Notably, elevated edge work and cave tasks tend to have a higher incidence of fall accidents [12]. The above discussion shows that it is extremely necessary to take timely preventive measures against fall accidents, which is of great significance to the sustainable and safe construction of hydraulic engineering projects in China [13].
Accident causation research is the first prerequisite for accident prevention, and effective accident prevention measures rely heavily on the study of historical accidents to provide a basis for after-action control [14,15,16]. At present, many national and international scholars have carried out significant amounts of research for the prevention of fall accidents in hydraulic engineering projects. Liu et al. [17] proposed the BERT-BILSTM hybrid deep learning model to deeply analyze the causes of hydraulic engineering construction accidents, and they verified through comparative experiments that the model can more accurately identify the causes of accidents caused by “falls from height”, which improves the efficiency of the analysis of the causes of accidents. Yan et al. [18] used BIM-RFID integration technology to identify hazardous factors at a hydraulic engineering project construction site and define the hazardous area, so as to determine whether the staff are at a risk of “fall from height” accidents, and they then implemented real-time warnings to reduce the probability of accidents. Sun et al. [19] adopted the HFACS model to analyze and investigate the human factors that trigger fall from height accidents in hydraulic engineering projects, and they quantitatively analyzed the human factors by establishing a DBN human factor risk evaluation model to obtain the probability of fall from height accidents in each time segment, so as to reasonably reduce the accident risk. Chen et al. [20] utilized the phrase extraction technique to mine the correlation relationships between construction safety hazards and the types of hazards in hydropower projects from unstructured text, and they found that fall from height accidents are very likely to occur at side slopes. Sun et al. [21] combined the fault tree model and a Bayesian network to quantitatively analyze the human factors of falls from height in hydraulic engineering projects, to obtain the importance degree of each human factor, and they proposed corresponding countermeasures according to the results. Zheng et al. [22] utilized the HFACS model to study the interplay of human factors leading to fall from height accidents in hydraulic engineering projects, and they made safety recommendations based on the study results. Jemal et al. [23] investigated the forms of occupational injuries sustained by hydropower dam construction workers in South-East Ethiopia and determined that fall from height accidents are the most common types of accidents that cause injuries to workers. Fall accidents include crane falls, scaffolding falls, elevator shaft falls and falls occurring from flooring gaps. Albert et al. [24] found that ethnic minorities are more prone to fall accidents than their local counterparts by analyzing the construction accidents occurring in the HZMB-HK project, which was a large-scale public infrastructure project in Hong Kong. They identified a number of contributing factors, including safety unawareness, language and communication barriers, inadequate safety training and insufficient organizational support.
According to the above available literature, human factors, such as insufficient safety awareness, a lack of professional knowledge and compromised physical fitness, are the key factors contributing to fall accidents. Moreover, the construction site and timing also favor accidents to a certain extent, such as high slopes and the flood season. Collectively, these factors exert an important influence on the occurrence of fall accidents. Refs. [16,17,19] demonstrated significant methodological innovations in accident causation mining based on accident reports, increased the efficiency of accident causation analysis and reduced the subjective errors caused by human text analysis, but the depth of the fall accident causation analysis is insufficient and the studies lack a logical analysis of the accident mechanism. Refs. [18,20,21,22,23] focused on the analysis of the human factors of hydraulic engineering project fall accidents based on accident reports and expert consultation, but they neglected factors such as machines, the environment and management. In conclusion, there is a lack of systematic and hierarchical research on the subject. In addition, the statistical approach of evaluating accident cases relies mostly on reading accident reports manually and recording the accidents’ causes, which is arduous, and the accuracy varies from person to person.
Text mining technology has been widely employed in various research disciplines, and the comparison of mining results in diverse fields has shown the importance of mining. Tan et al. [25] used text mining technology and a social network analysis method to reveal the distribution and the correlative relationships of the potential risks in coal accidents; the results confirmed the feasibility of applying text mining techniques to the analysis of text-based accident cases. Chen et al. [26] examined the causes of near-mid-air collisions based on text mining and produced a scientific decision-making model to accurately prevent near-mid-air collision occurrences based on the relevant data. Niu et al. [27] applied data mining to extract the causes of chemical production accidents based on accident texts. Zheng et al. [28] analyzed the underlying causes of strike accidents on a tower crane based on the DEMATEL-ISM method. Text mining has been used as an implicit information mining technique in the fields of coal, the chemical industry, aviation and other accident fields with great efficiency. In addition, the processed data mostly comprise huge quantities of unstructured text, and the relevant targets are mostly accident-prone fields. The combined use of DEMATEL-ISM serves as a beneficial tool for the analysis of factor relevance in accident analysis. According to the preceding analysis, it is apparent that merging DEMATEL and ISM can boost strengths of each. This approach not only speeds up the calculation but also optimizes the accident analysis process, highlighting the essential components of the incident contributing system. Past studies of accident causation have mostly placed an emphasis on defining causative elements and directly examining them empirically. However, they typically have not studied the intricate relationships between the factors and have not considered the stratified analysis of factor transmission. The depth and scope of our study distinguish it from the above similar research.
This study integrates the advantages of the causal mining methods of the existing studies stated above and compensates for the deficiencies of the preceding analysis of the causative variables of fall accidents in hydraulic engineering projects. The employment of text mining technology for accident causation extraction is more efficient and accurate compared to the mining of the BERT-BILSTM model in Ref. [16], which maximizes the elimination of human error in interpreting the text and saves a lot of time and labor. Based on the literature evaluation of combined accident analysis, the analysis of accident causes is more complete and systematic. This study quantitatively analyzes the interrelationships of each accident contributing factor, including human, machine, environment and management facotrs, inputting them into the accident system using DEMATEL-ISM, which allows us to visualize the logical relationships between the causal factors and understand the mechanisms of the accidents by building a multilevel hierarchical hybrid model. This compensates for the monolithic nature of the causal analyses of past studies and deepens the understanding of the causal transmission logic. Practically, the results of this study can assist us in detecting the key causes of accidents and curbing the trend of accidents at the source, which can limit the risk of accidents in practical work.

2. Materials and Methods

2.1. Data Preparation

Accident investigation reports are an important data source for accident analysis since they contain numerous types of information. The accident history and accident cause summary in the accident report are the crucial data that this study employs. Most of the construction accidents of hydraulic projects are large-scale casualties. After accidents, enterprises and local governments will perform extensive investigations and collect data on the number of victims, economic losses and social repercussions according to the real scenario, making these reports more representative than other texts. The original accident text language of this study was Chinese. We did not apply any analytical process; to reduce translation errors, two experts in the field of accident safety were invited to conduct comparison translations, and the similar accident words were standardized. In Table 1, we provide an example of a typical accident report text containing the description of the accident, the causes, the number of fatalities and serious injuries and the list of preventative and control measures. In total, 389 hydraulic engineering fall accident investigation reports, like that in Table 1, from 2010 to 2022, were collected from the internal case statistics of large hydraulic companies and the websites of the relevant administrative departments of various provinces and cities, as the corpus for text mining. The accident reports involved 25 provinces and 15 hydraulic projects, ensuring the accuracy and objectivity of the analysis results of the subsequent hydraulic engineering fall accident cause analysis.

2.2. Research Process

As shown in Figure 1, the research process of this study includes the following steps. Firstly, through Jieba text segmentation, hydraulic engineering fall accident investigation reports are accurately segmented to generate the preliminary test text corpus. Synonym merging and stop word filtering are applied to enable the term cleaning of hydraulic engineering fall accident text features. On this basis, the primary characteristic terms of fall accidents are extracted and the causative factors of accidents are determined through a summary of the characteristic accident terms. Secondly, DEMATEL is used to identify the causality and influence of each factor, which provides the basis for the development of the reachability matrix in the ISM model. Finally, a multilevel hierarchical structure model is created by ISM that can accurately disclose the causal factors’ transmission pathway in the system of hydraulic engineering fall accidents.

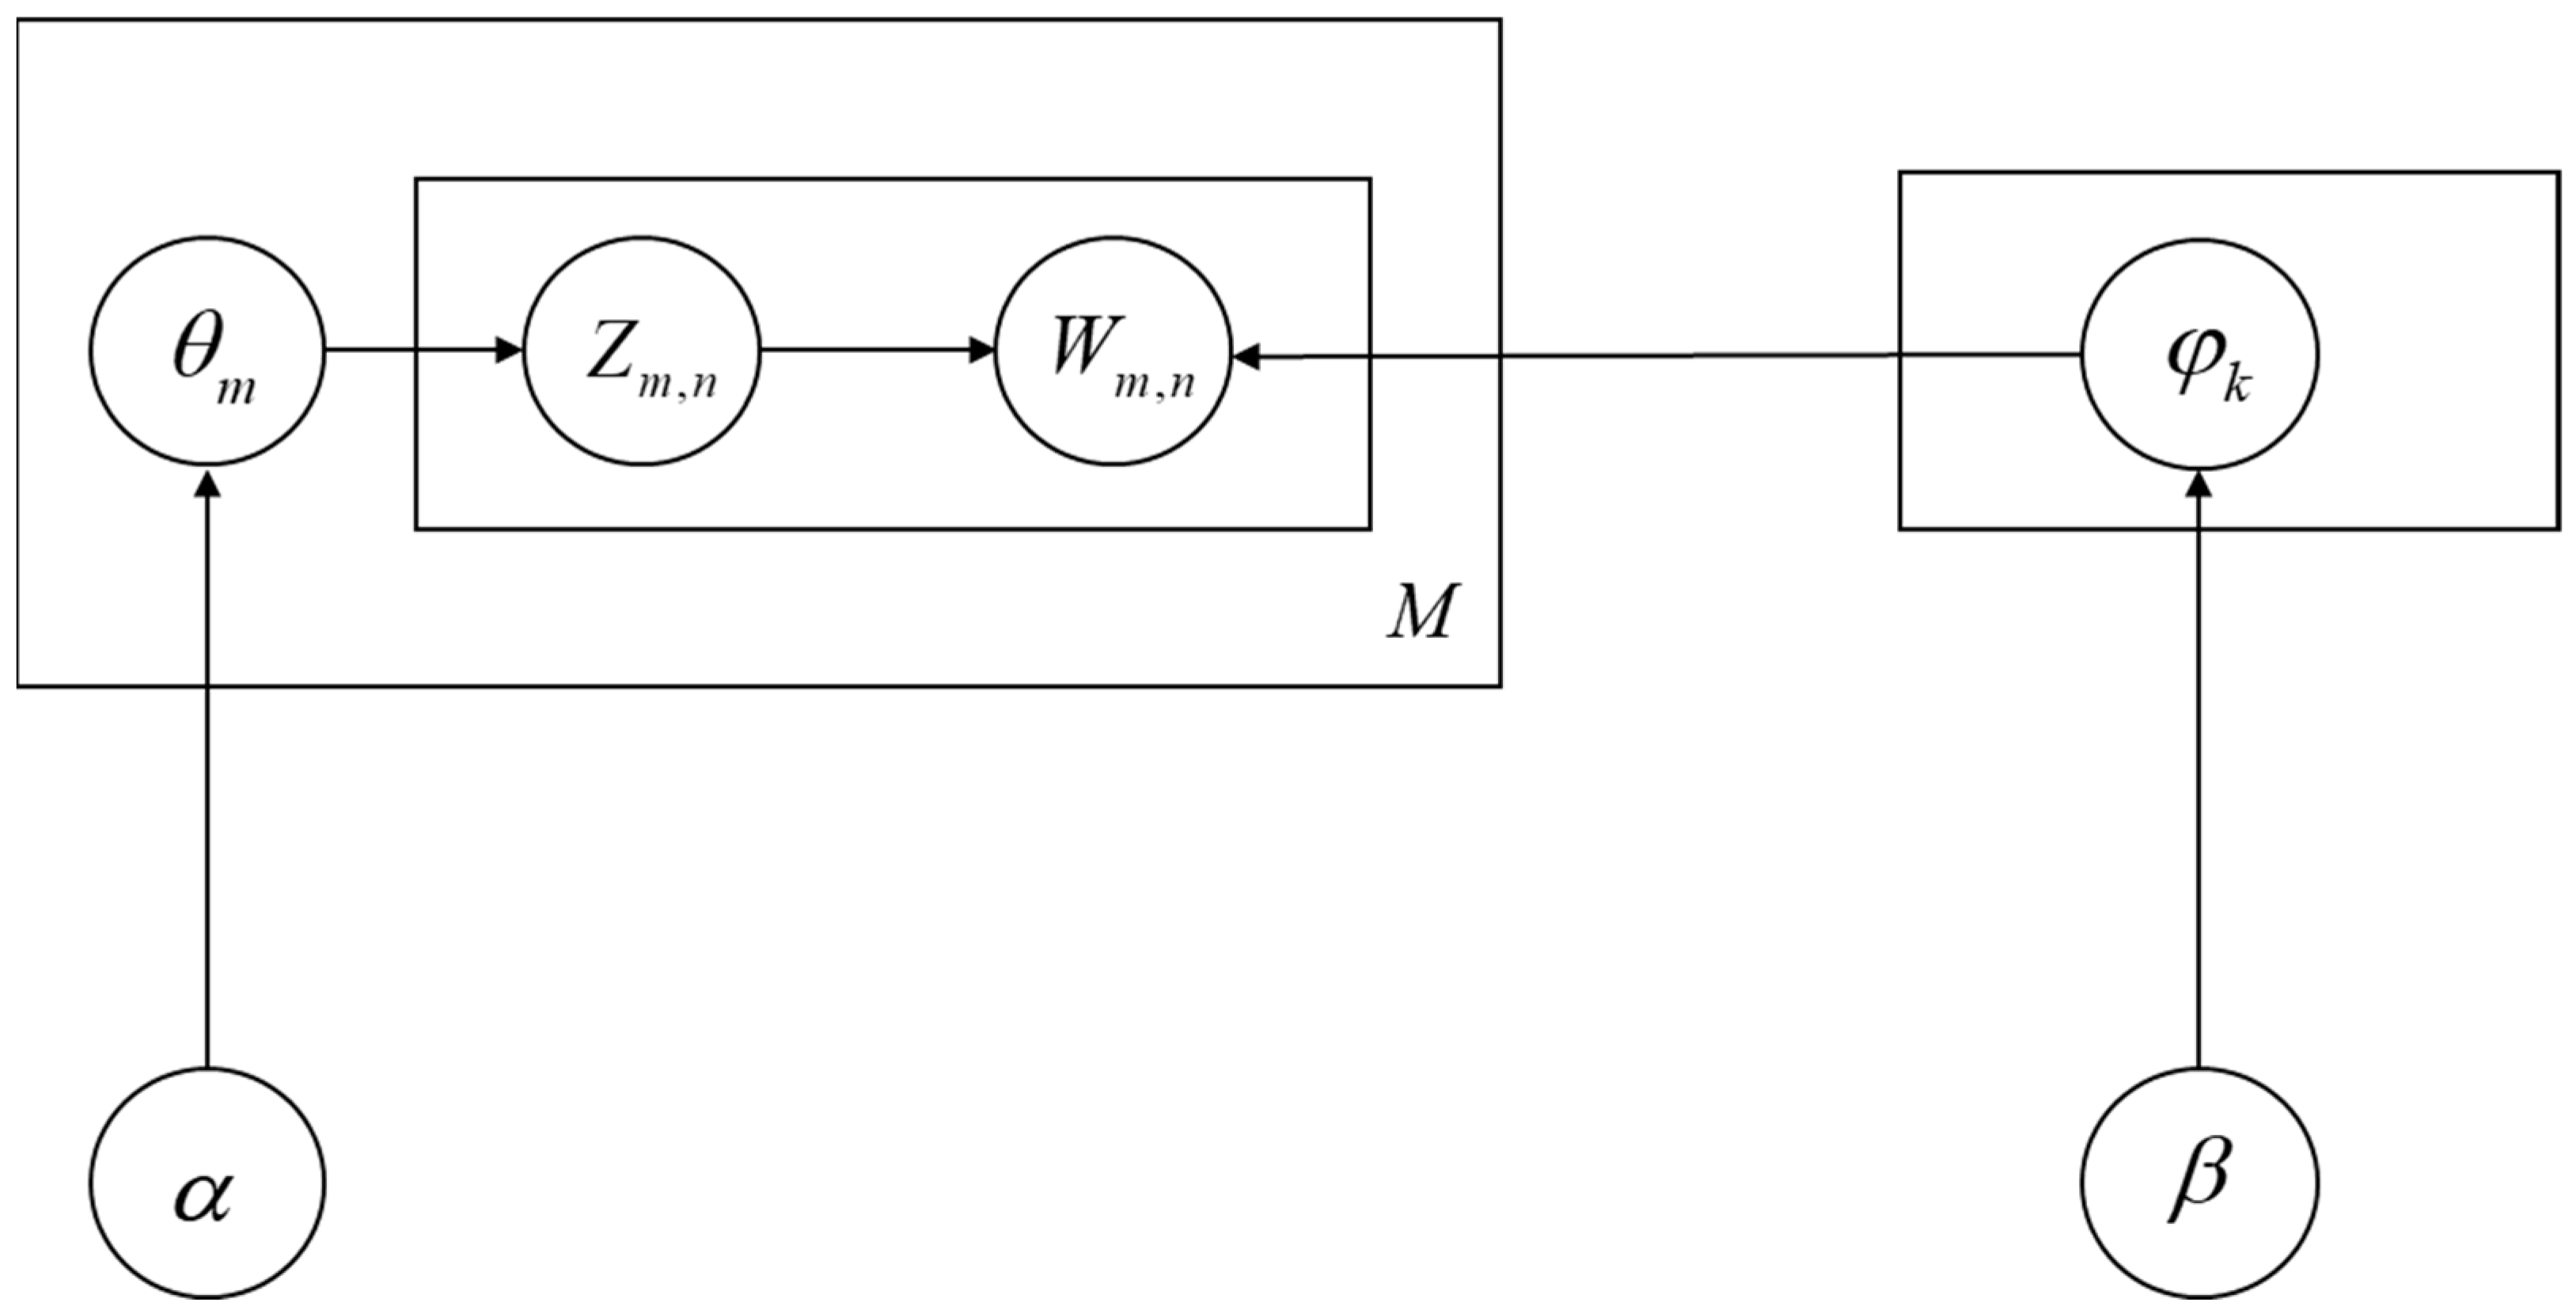
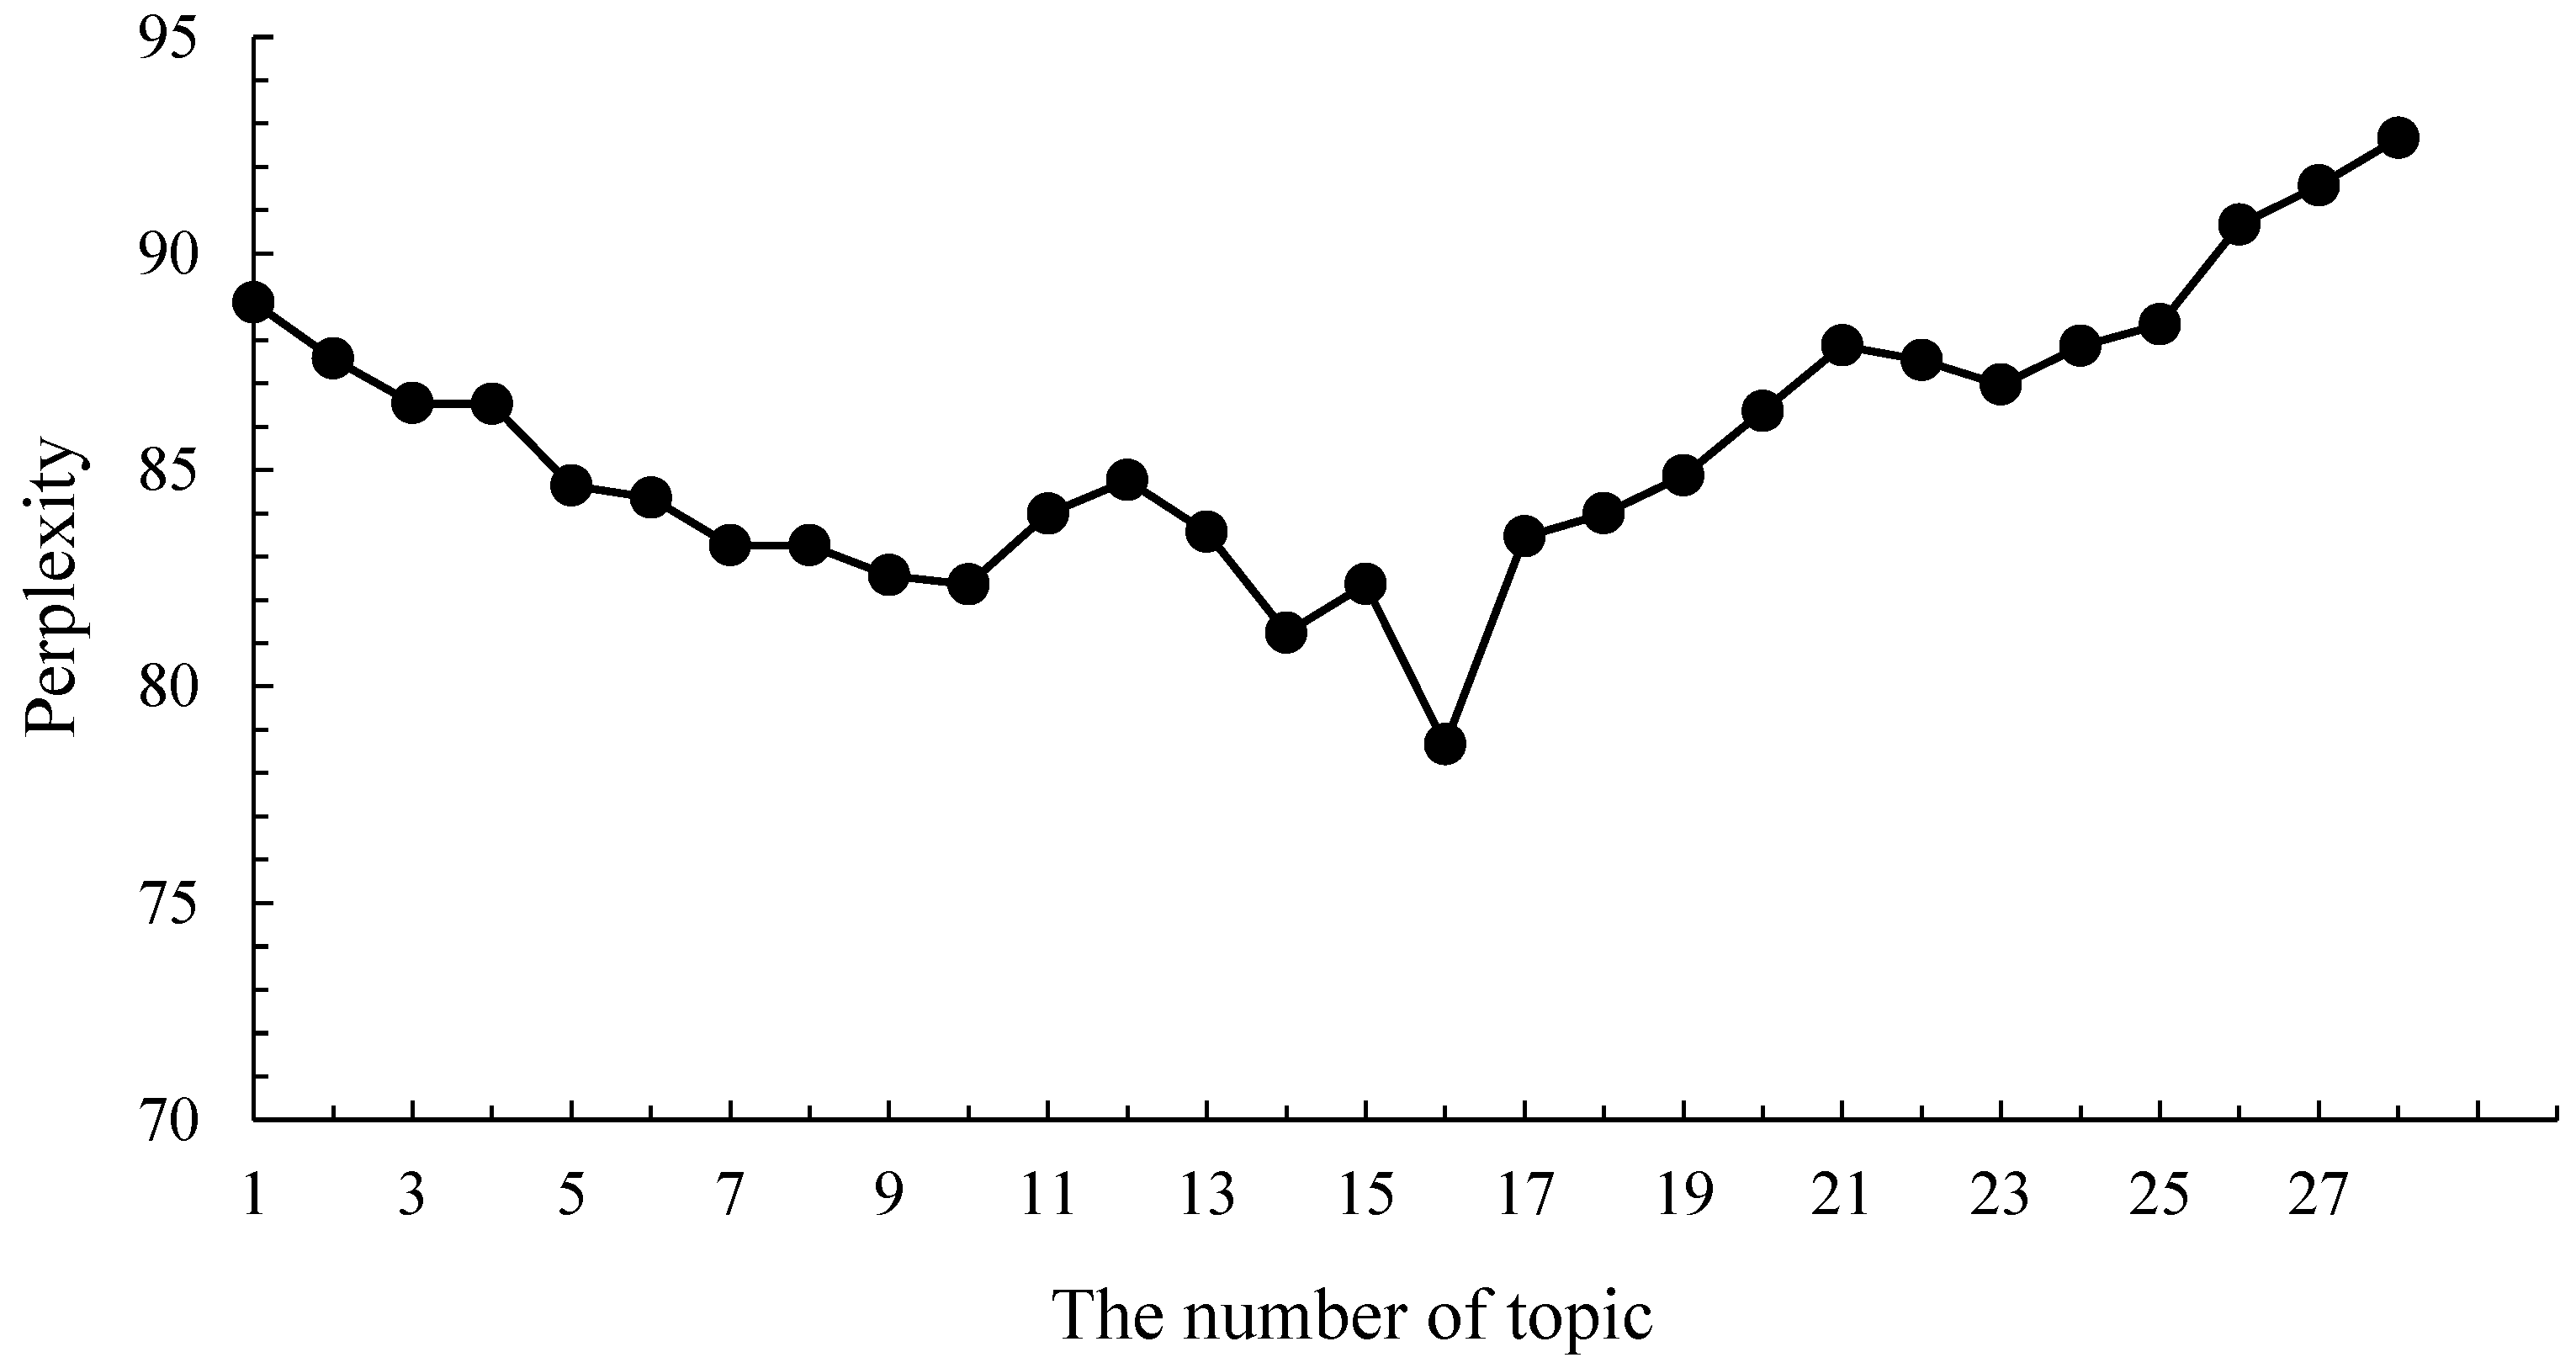
2.3. Construction of LDA Accident Topic Model

Using text mining to obtain relevant and useful information from unstructured text data is a very mature technical method, and an extensive analysis of accident reports can better help us to understand the causes of accidents. To a certain extent, it also improves the accuracy of accident prediction. It has been widely used in accident prediction and cause analysis in coal mines, transportation, construction collapse and other fields [29,30,31]. However, looking at the existing literature, there are very few studies on the causes of fall from height accidents in hydraulic engineering construction by text mining. Therefore, this study proposes to use the LDA topic model as a text mining method to extract characteristic accident terms and deeply mine the accident-causing factors.
The LDA topic model is a topic mining model used to extract topics from texts. It was first proposed by Blei in 2003, also known as the three-layer Bayesian probability model, including 3 layers: document, topic and word [32,33]. The basic process of LDA is to generate a topic probability distribution conditional on the document and a word probability distribution conditional on the topic, which can fully explore the potential connections between the word items of the document and help researchers to more efficiently obtain the potential topic or central idea in a large text corpus [34,35]. Thus, the text content is divided and categorized to achieve the purpose of quickly obtaining effective information. LDA is based on Bayesian modeling, which involves “prior distribution”, “data likelihood” and “posterior distribution”. In Bayesian theory, “prior distribution” + “data likelihood” = “posterior distribution” [36]. Any unknown quantity θ can be regarded as a random variable, and the unknown condition of θ should be described by a probability distribution, which is a probability statement that there is prior information about θ before the sampling, and this probability distribution is called the prior distribution. With the uncertainty of topic k , we assume that the prior distribution of all document topics is the Dirichlet distribution in LDA [37]. Afterwards, the Dirichlet distribution of M document topics is obtained, while the corresponding data have the multinomial distribution of M topic numbers. This forms the Dirichlet multi-conjugate distribution. Then, the posterior distribution is obtained based on the Dirichlet multi-conjugate distribution. Figure 2 shows the LDA model principle. The LDA topic model generation process is as follows.
Since the prior distribution of the subject obeys the Dirichlet distribution controlled by the parameter a , the subject distribution of document m can be expressed as
θ m = D i r i c h l e t ( a )
Choose any topic k from document m , where the word distribution in topic k also obeys the Dirichlet distribution controlled by parameter β , and the word distribution of topic k can be expressed as follows:
φ k = D i r i c h l e t ( β )
For the word n in the word distribution φ k of topic k of the document m , the topic number distribution Z m , n can be obtained from the topic distribution θ m , and the formula is as follows:
z m , n = M u l t i ( θ m )
For the given topic, the word probability distribution can be obtained by sampling φ k . The following equation can be derived based on the topic number k = Z m , n :
w m , n = M u l t i φ z m , n
In the establishment of the LDA topic model, the number of topics in the model needs to be set up in a scientific way. This study introduces the perplexity degree index to determine a reasonable number of topics. The definition of the perplexity degree can be understood as follows: the topic model for a particular document belongs to a certain topic of uncertainty; a smaller perplexity degree indicates that the model is of a higher degree of differentiation, with a better model structure and a more appropriate number of topics. The formula of the perplexity degree is as follows:
P e r p l e x i t y = e x p m = 1 M l o g P w m m = 1 M N m
where m represents the document m ; M represents the total number of documents; P w m represents the probability of each word of the document M ; N m represents the total number of lexical items in the document M .

2.4. DEMATEL-ISM Modeling Process

DEMATEL is a method that comprehensively uses graph theory and a matrix to analyze system elements, which can greatly simplify the analysis of a complex system [38,39]. By using a causal diagram to determine cause-and-effect relationships between the factors in complex problems, DEMATEL can solve core problems quickly and effectively to improve performance based on matrix operations [40]. ISM is a complex system analysis method developed by John N. Warfield in the United States in 1973; it is used to transform a system with complex relationships and an unclear structure into a concise multilayer hierarchical structure based on graph theory and Boolean functions. The results can be visualized in various ways, such as tree diagrams and directed graphs, and it plays an important role in assisting decision-making, goal optimization and cause analysis. In addition, ISM has the advantages of system operation, effectiveness, low data dependence and the clear handling of problems [41,42]. The DEMATEL-ISM model can make matrix calculations easier for complex systems through simplifying the calculation process of the ISM model. We set the threshold λ to transform the comprehensive influence matrix in DEMATEL into the reachability matrix used in ISM. The basic steps of the DEMATEL-ISM modeling process are as follows.
(1)
Determine of the set of safety risk factors. Factor r i R   ( i = 1 , 2 , 3 , , n ) , where n represents the number of safety risk factors and R represents the total set of construction safety risk factors. A total of Z relevant experts in the field of security were invited to conduct questionnaires.
(2)
Generate the direct impact matrix of accident safety risk factors. Determine the degree of influence between all factors and quantify them according to certain rules; the degree of influence can be determined based on the experience of experts. The influence of a factor is represented by a four-point scale, where 0 indicates no influence, 1 indicates a weak influence, 2 indicates a general influence, 3 indicates a strong influence and 4 indicates an extremely strong influence. The calculation of the integration of multiple expert opinions is generally done using the arithmetic mean method to eliminate subjective errors. The direct impact matrix M ( M = m i j n × n ) is as follows:
M = 1 Z k = 1 z M k
where Z represents the number of experts; M k represents the matrix k .
(3)
The direct impact matrix is normalized to obtain the normalized direct impact matrix G ( G = g i j n × n ) :
G = 1 max 1 i n j = 1 n M i , j M
where max 1 i n j = 1 n M i , j is the maximum value obtained by adding each row. After normalized treatment, we obtain 0 g i j 1 .
(4)
Calculate the comprehensive impact matrix T . The normalized direct influence matrix can be used to find the degree of indirect influence between the factors by matrix self-multiplication, and the values in the matrix tend towards zero after constant self-multiplication, which becomes the zero matrix. The direct impact and indirect shadow can be added to reflect the integrated degree of combined influence. The formula is as follows:
T = G + G 2 + G 3 + + G n = n = 1 G n = G I G 1
where I represents the unit matrix; T represents the comprehensive impact matrix.
(5)
Calculate the influencing degree f i and the influenced degree e i . The influencing degree f i is obtained by adding the row elements of the matrix T , and the influenced e i degree is obtained by adding the column elements of matrix T . The calculation formulas for the influencing degree f i and the influenced degree e i are as follows:
f i = j = 1 n t i j   ,                       ( i = 1 , 2 , 3 , , n )
e i = j = 1 n t j i   ,                       ( i = 1 , 2 , 3 , , n )
The larger the value of f i , the greater influence on other factors.
(6)
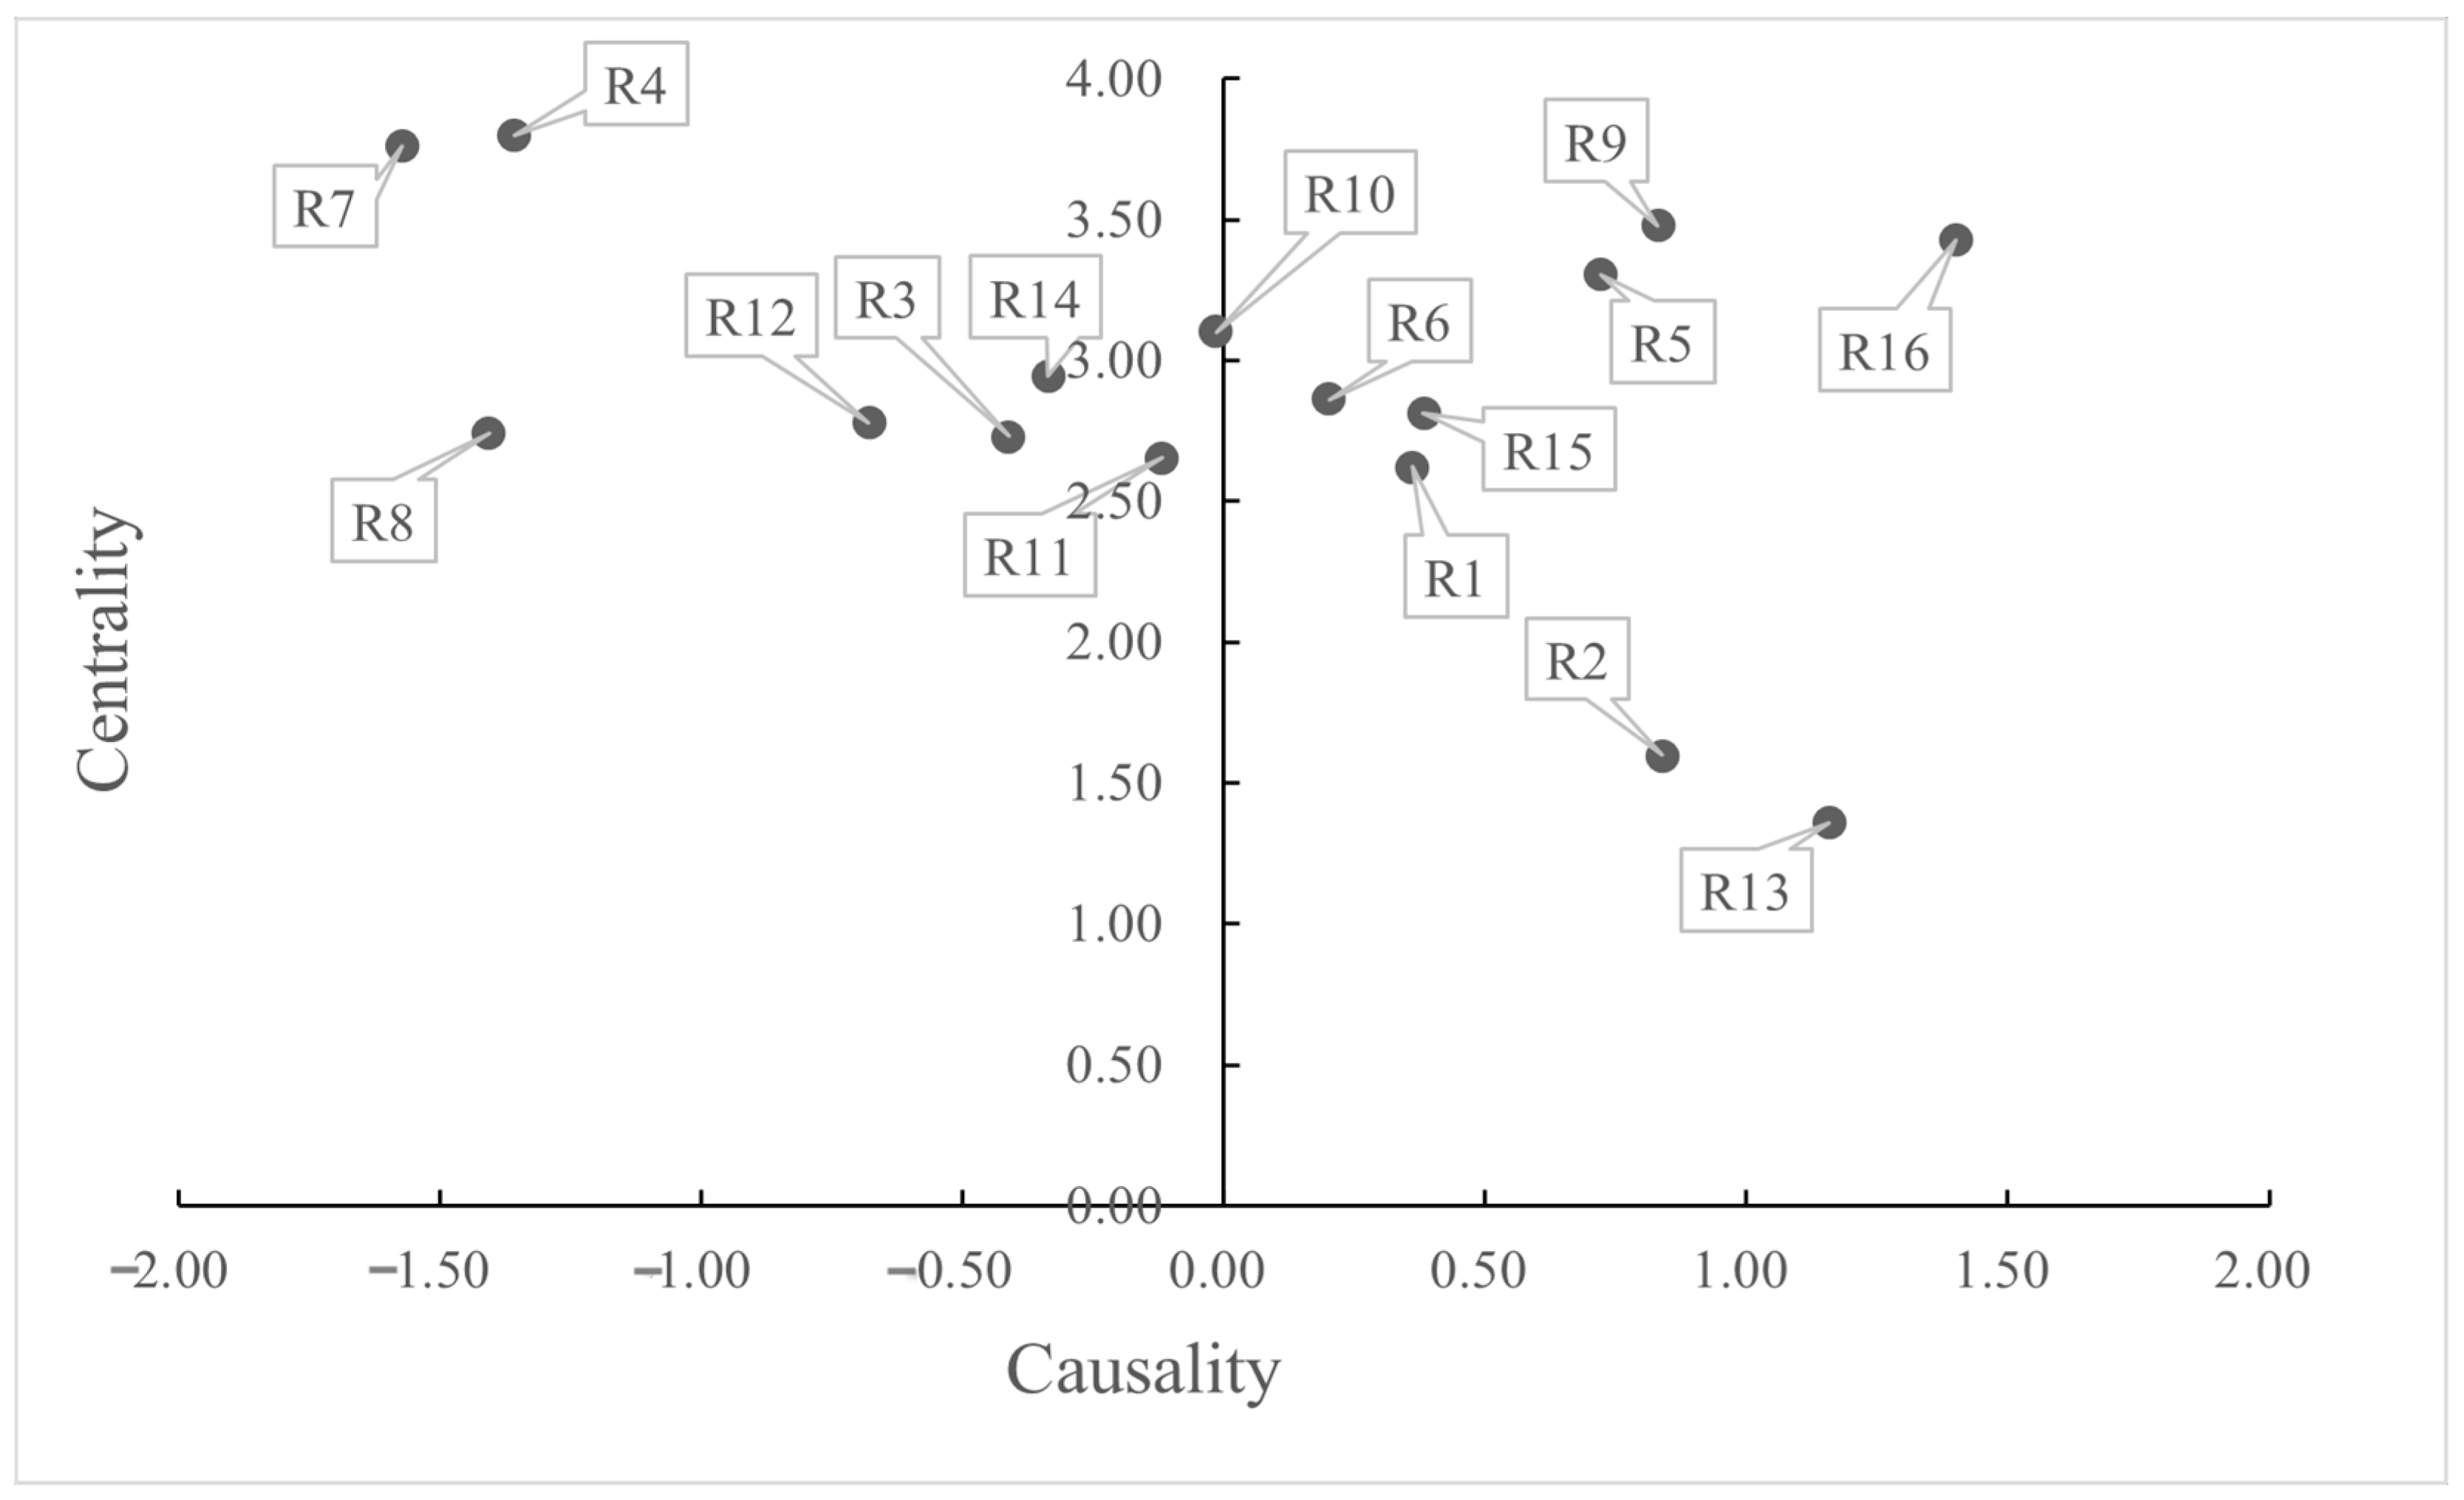
Calculate centrality and causality. Centrality is obtained by adding the influence and influenced degrees of the factor; causality is obtained by subtracting the influencing degree and the influenced degree by the factor. The formulas for the calculation of centrality m i and causation n i are as follows:
m i = f i + e i ,                       ( i = 1 , 2 , 3 , , n )
n i = f i e i ,                       ( i = 1 , 2 , 3 , , n )
(7)
Establish the causality–centrality diagram of the influence factor, which can visualize the causal attributes and influence degrees of each factor.
(8)
Calculate the reachable matrix K ( K = k i j n × n ) . Given a threshold λ, the matrix K is obtained by comparing the values in the overall impact matrix A ( A = a i j n × n ) with the threshold λ:
  A = I + T
k i j = 1 ,   if   a i j λ , i , j , 2 , , n
k i j = 0 ,   if   a i j λ , i , j , 2 , , n
The selection of the threshold λ size directly determines the subsequent calculation results; the threshold λ = σ + μ , where σ and μ represent the mean and standard deviation of all factors in the comprehensive impact matrix T .
(9)
Determine the reachable set S u i , the prior set Q u i and the common set Y based on the matrix K ; the calculation process is as follows:
S u i = u i | u i U , k i j = 1 i = 1 , 2 , , n
Q u i = u i | u i U , k j i = 1 i = 1 , 2 , , n
Y = u i | S u i Q u i = S u i i = 1 , 2 n
(10)
The factors contained in the set Y are in the same level in the ISM, and the rows and columns corresponding to the factors of this level in matrix K are crossed out to obtain a new matrix. Repeat the above steps until all factors are crossed out; then, according to the order of elimination of the factors, the multilevel hierarchical model of causal factors is constructed. The factors in Y obtained first are the top-level factors, and the factors in Y obtained later are the lower-level factors.
(11)
According to the identified factors at each level, combined with the influence relations of the factors in the reachability matrix, the influence relations are represented through the directed graph. Then, the multilevel hierarchical hybrid model of causality–centrality is established.

3. Results

3.1. Identification of Causes of Fall Accidents in Hydraulic Engineering

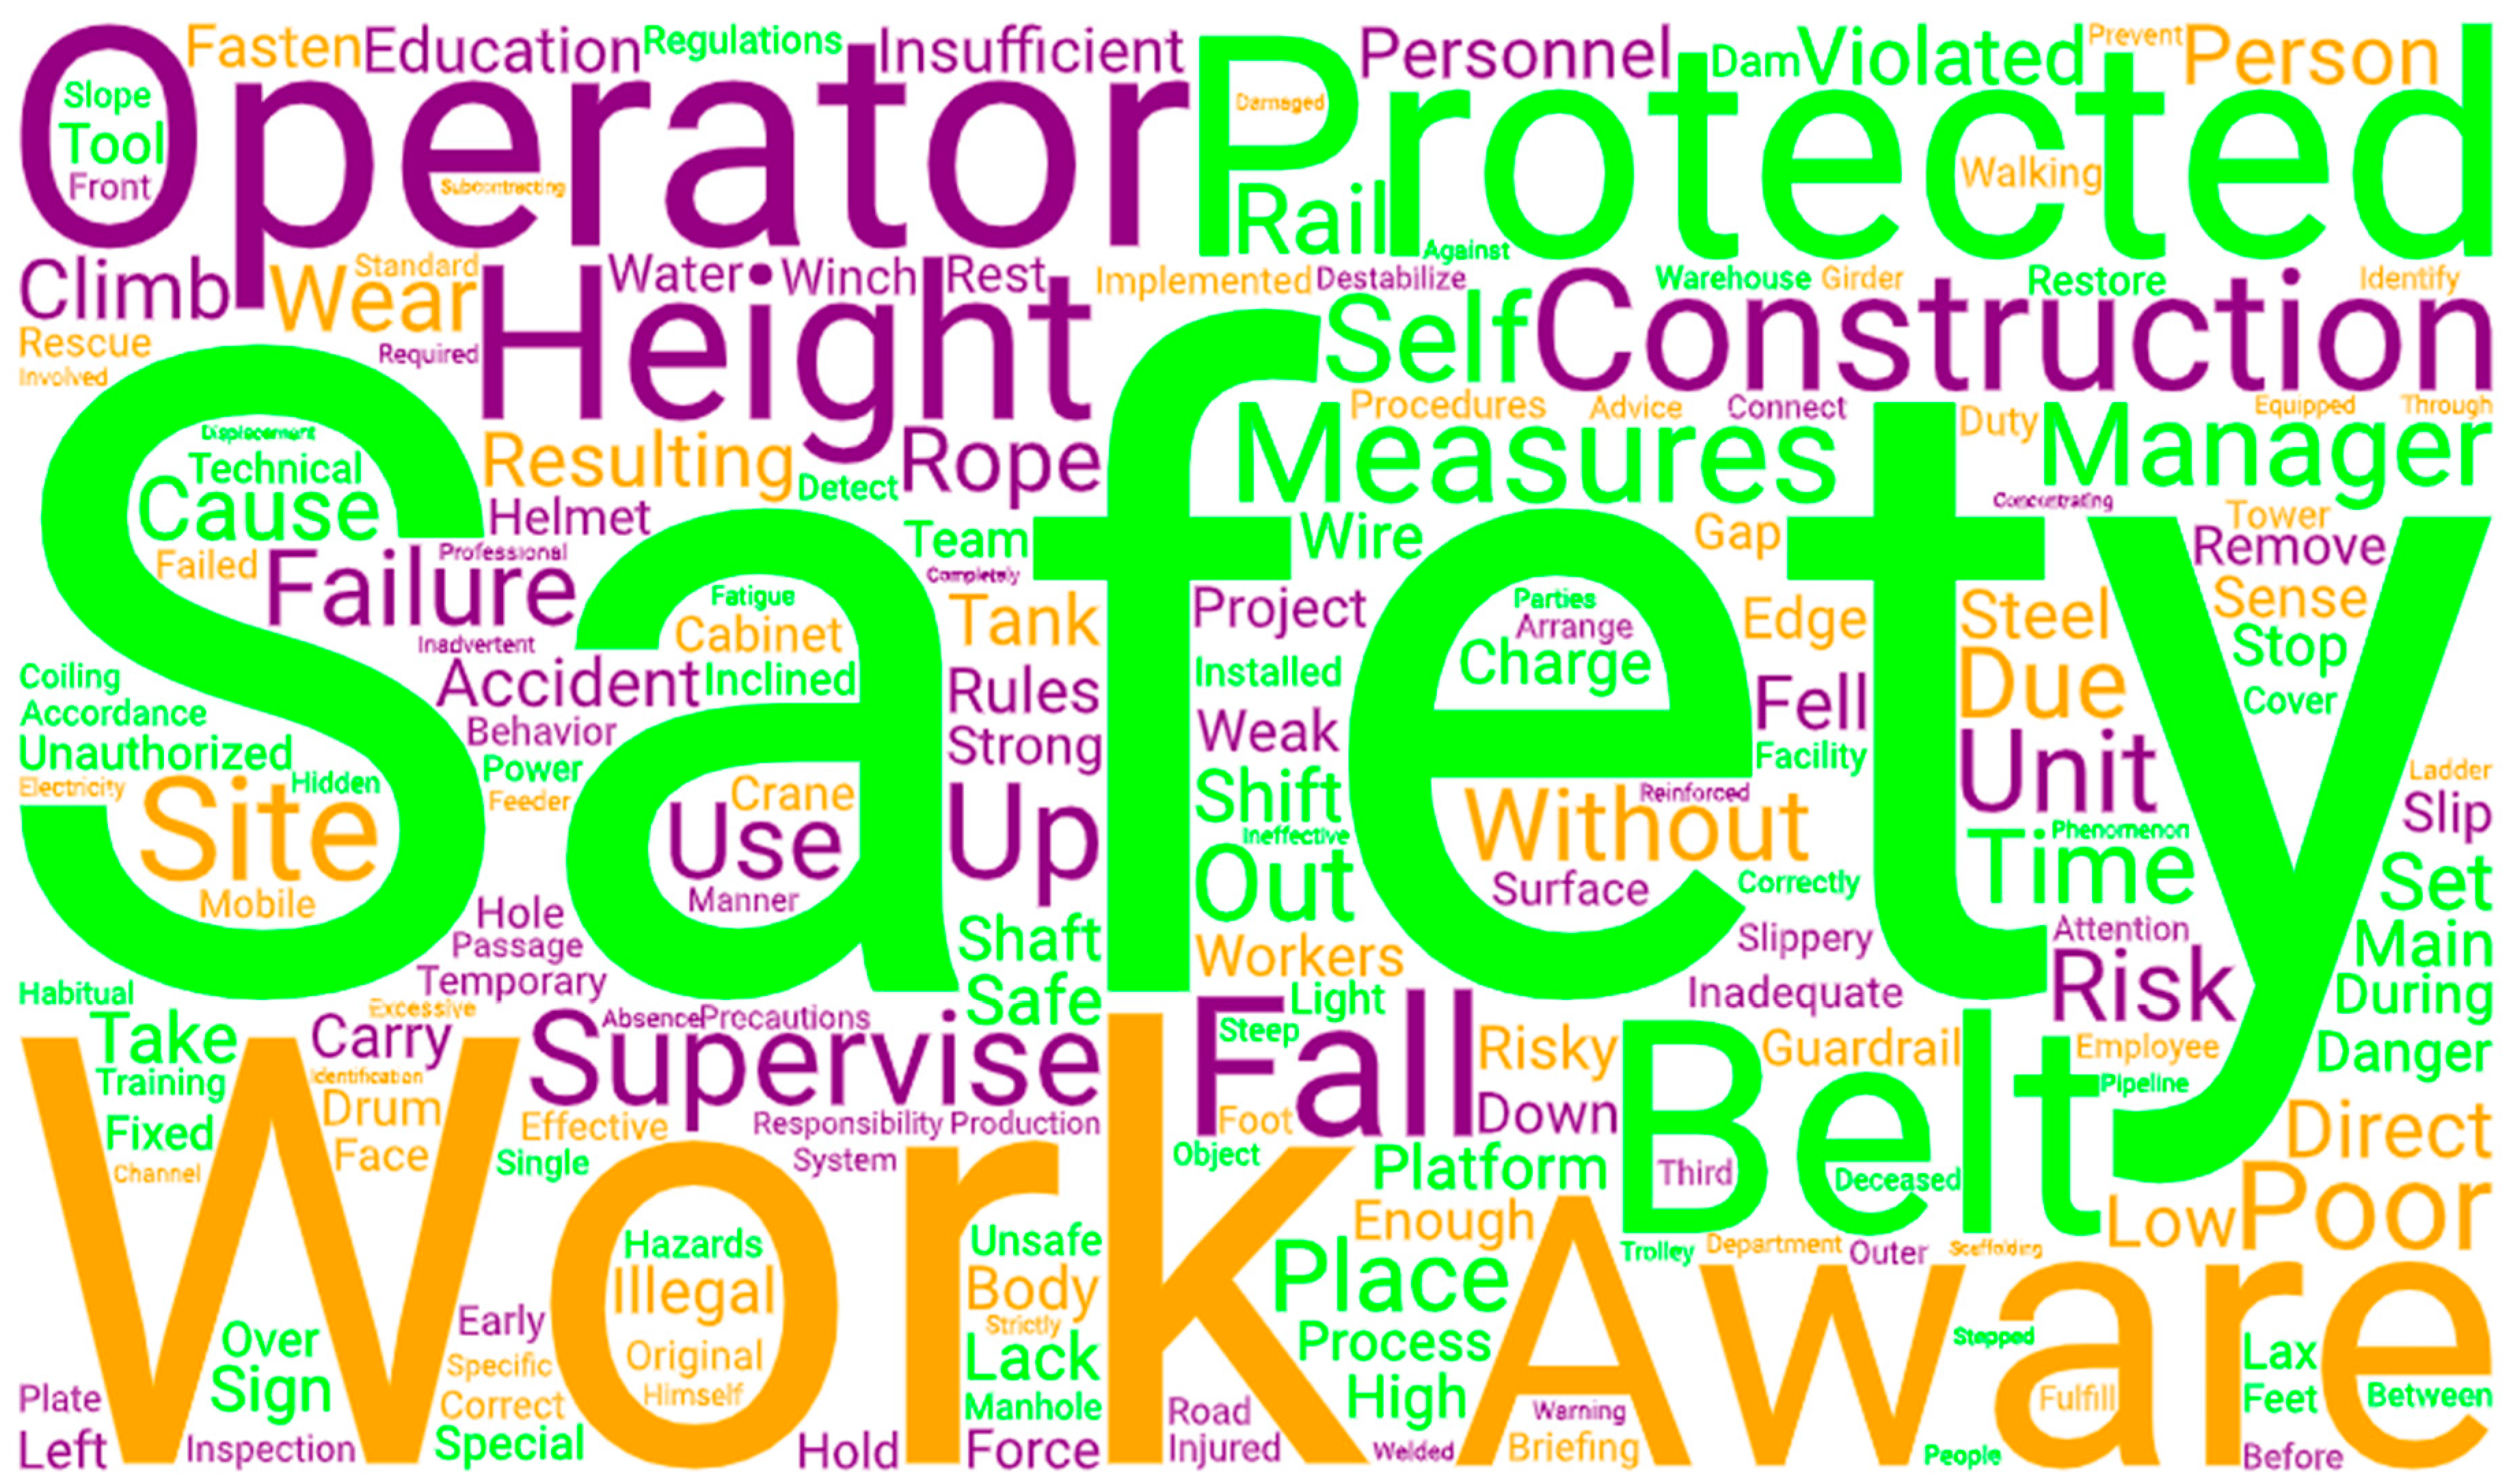
3.1.1. Extraction of Characteristic Accident Terms

Firstly, the text-preprocessed accident data were visualized using the Python Word-Cloud toolkit to obtain a word cloud map of fall accidents in hydraulic engineering, involving 200 high-frequency words related to accidents, as shown in Figure 3. The font size of the words in the word cloud is proportional to the frequency of the words, while, the closer a word is to others, the more connected they are.
Secondly, the optimal number of topics is obtained by computing the perplexity. The variation curve of the perplexity with the number of topics is shown in Figure 4. When the number of topics is 16, the topic model exhibits the least overlap, indicating that the model training effect is optimal in this model training scenario. Therefore, the optimal number of topics in this model is 16.
Finally, the LDA model is established to extract the topics associated with hydraulic engineering construction fall accidents and combined with the pyLDAvis toolkit to visualize the extraction results. In Figure 5, the size of the circle on the left side represents the frequency of the topic’s appearance, and the right side represents the representative thirty accident characteristic terms under each topic.

3.1.2. Determination of Causes of Fall Accidents

Due to the wide variety of accident characterization terms under each topic and the varying magnitudes of their frequency of occurrence under each topic, the most frequent and representative characteristic terms under each accident topic were used as the corpus for cause extraction, as shown in Figure 6, where the length of the word bar represents the frequency of occurrence of the word in the topic. Then, after combining the results of relevant previous literature reviews on the causal analysis of hydraulic accidents, combining causes with similar meanings into one cause and rationally determining the causes contributing to the accidents in accordance with the principle of comprehensive application, 16 contributing factors of fall accidents were obtained, as shown in Table 2.

3.2. Calculation of the Integrated DEMATEL-ISM Method

According to the above-determined fall accident factor set, we adopt the method of expert consultation to study the relevant influence relations of the 16 factors. A total of 22 experts participated in the questionnaire survey; they were from Wuhan University, China; the Three Gorges University; and the China Three Gorges Corporation. Finally, 20 valid questionnaires were collected for this study (the recovery rate was 91%). The matrix generation procedure involved in the DEMATEL-ISM modeling process is shown in Figure 7.
The questionnaire data were processed by the arithmetic mean method to eliminate subjective errors as much as possible, and the direct impact matrix M was formed:
M = 0 0 2.65 0.45 0.55 0.6 2.3 2.45 0.45 0.4 0.95 0.65 0 2.4 0.6 0.9 0.25 0 0.6 0.9 0.85 0.6 0.7 2.75 0.9 0.75 0.75 0.6 0.55 0.55 0.65 0.75 0.65 0.25 0 0.6 0.9 0.75 0.9 0.6 0.9 0.95 0.85 0.75 0 0.8 1 0.85 0.55 0.2 0.4 0 0.9 0.95 0.85 0.95 0.9 1.05 0.8 1.05 0 1.1 0.9 0.9 0.9 0.6 0.55 2.8 0 2.9 2.65 0.85 0.6 2.6 0.95 2.9 0 0.9 0.55 0.5 0.65 0 0.3 2.6 0.75 0 2.45 0.9 0.55 2.65 0.95 1.05 0 1 0.35 0.85 0.5 0.35 0.6 0.6 1.15 0.95 0 0.8 0.75 0.55 0.85 1.1 0 0.5 0.95 0.65 0.35 0 0.45 0.45 0.65 0.55 0.65 0 0.4 0.35 0.3 0.75 0.25 0.55 0.45 0.2 2.9 0.25 2.85 2.65 0.6 0.85 0.7 2.45 0 0.65 2.9 0.7 0.35 2.9 0.6 0.7 0.45 0.3 1.05 2.65 1.15 0.9 2.9 1.35 0.95 0 0.6 1.15 0 0.8 0.65 0.55 0.15 0 0.9 2.65 1.05 0.85 2.95 0.8 0.45 0.25 0 0.65 0 0.6 0.9 0.45 0.35 0 0.75 2.45 0.8 0.65 0.55 0.8 0.65 0.75 0.45 0 0 0.55 0.9 0.45 0.15 3.15 0.8 0.55 0.15 0 0.6 2.95 1.15 0.65 0.25 0.35 0 0.8 1.05 0.4 0.5 0 0.75 1.05 0.6 0.15 2.9 2.85 0.75 0.35 0.95 0.7 0 0 1.05 0.8 0.25 0 0.8 2.85 0.9 0.95 2.7 0.8 1.1 0.65 0.95 3.2 0 0.3 0 0.6 2.35 0 2.55 2.45 0.8 0.65 2.75 0.9 2.8 2.95 0.75 0.85 0 2.65 0.95 0
According to step 3, we normalized the direct influence matrix to obtain the normalized influence matrix G :
G = 0 0 0.11 0.02 0.02 0.03 0.1 0.1 0.02 0.02 0.04 0.03 0 0.1 0.03 0.04 0.01 0 0.03 0.04 0.04 0.03 0.03 0.12 0.04 0.03 0.03 0.03 0.02 0.02 0.03 0.03 0.03 0.01 0 0.03 0.04 0.03 0.04 0.03 0.04 0.04 0.04 0.03 0 0.03 0.04 0.04 0.02 0.01 0.02 0 0.04 0.04 0.04 0.04 0.04 0.04 0.03 0.04 0 0.05 0.04 0.04 0.04 0.03 0.02 0.12 0 0.12 0.11 0.04 0.03 0.11 0.04 0.12 0 0.04 0.02 0.02 0.03 0 0.01 0.11 0.03 0 0.1 0.04 0.02 0.11 0.04 0.04 0 0.04 0.01 0.04 0.02 0.01 0.03 0.03 0.05 0.04 0 0.03 0.03 0.02 0.04 0.05 0 0.02 0.04 0.03 0.01 0 0.02 0.02 0.03 0.02 0.03 0 0.02 0.01 0.01 0.03 0.01 0.02 0.02 0.01 0.12 0.01 0.12 0.11 0.03 0.04 0.03 0.1 0 0.03 0.12 0.03 0.01 0.12 0.03 0.03 0.02 0.01 0.04 0.11 0.05 0.04 0.12 0.06 0.04 0 0.03 0.05 0 0.03 0.03 0.02 0.01 0 0.04 0.11 0.04 0.04 0.13 0.03 0.02 0.01 0 0.03 0 0.03 0.04 0.02 0.01 0 0.03 0.1 0.03 0.03 0.02 0.03 0.03 0.03 0.02 0 0 0.02 0.04 0.02 0.01 0.13 0.03 0.02 0.01 0 0.03 0.13 0.05 0.03 0.01 0.01 0 0.03 0.04 0.02 0.02 0 0.03 0.04 0.03 0.01 0.12 0.12 0.03 0.01 0.04 0.03 0 0 0.04 0.03 0.01 0 0.03 0.12 0.04 0.04 0.12 0.03 0.05 0.03 0.04 0.14 0 0.01 0 0.03 0.1 0 0.11 0.1 0.03 0.03 0.12 004 0.12 0.13 0.03 0.04 0 0.11 0.04 0
According to step 4, we calculated the comprehensive influence matrix T :
T = 0.04 0.01 0.17 0.11 0.07 0.08 0.2 0.17 0.07 0.07 0.09 0.09 0 0.16 0.07 0.08 0.05 0.01 0.07 0.12 0.08 0.07 0.11 0.17 0.08 0.08 0.07 0.08 0.03 0.07 0.06 0.06 0.06 0.02 0.05 0.11 0.08 0.07 0.12 0.08 0.08 0.09 0.08 0.09 0 0.08 0.08 0.07 0.06 0.02 0.07 0.09 0.08 0.08 0.12 0.1 0.08 0.09 0.08 0.1 0 0.1 0.08 0.07 0.09 0.04 0.1 0.25 0.07 0.19 0.25 0.13 0.09 0.19 0.11 0.21 0 0.12 0.09 0.08 0.07 0.01 0.07 0.21 0.09 0.06 0.21 0.11 0.08 0.17 0.09 0.11 0 0.11 0.06 0.08 0.05 0.02 0.07 0.1 0.09 0.08 0.08 0.09 0.07 0.07 0.08 0.1 0 0.07 0.07 0.06 0.03 0.01 0.05 0.07 0.05 0.05 0.07 0.03 0.04 0.04 0.04 0.06 0.01 0.05 0.04 0.03 0.18 0.02 0.2 0.24 0.1 0.11 0.18 0.21 0.07 0.11 0.19 0.12 0.02 0.21 0.1 0.09 0.06 0.02 0.1 0.21 0.1 0.09 0.22 0.13 0.09 0.06 0.08 0.12 0 0.1 0.08 0.06 0.04 0.01 0.08 0.19 0.09 0.08 0.2 0.09 0.06 0.06 0.05 0.09 0 0.08 0.08 0.05 0.05 0.01 0.07 0.17 0.07 0.07 0.1 0.08 0.06 0.08 0.06 0.05 0 0.07 0.07 0.05 0.04 0.14 0.08 0.1 0.05 0.04 0.1 0.19 0.09 0.07 0.06 0.07 0.01 0.08 0.08 0.05 0.06 0.01 0.08 0.13 0.07 0.05 0.2 0.18 0.07 0.06 0.09 0.09 0 0.05 0.08 0.07 0.06 0.01 0.09 0.23 0.09 0.1 0.21 0.11 0.1 0.09 0.1 0.2 0 0.08 0.05 0.07 0.17 0.02 0.21 0.26 0.12 0.11 0.28 0.17 0.19 0.21 0.13 0.14 0.01 0.22 0.12 0.07
According to steps 5–6, we calculated the influencing degree, influenced degree, centrality and causality, as shown in Table 3. The “influencing degree” evaluates the overall impact of a factor on others. A greater value signifies a stronger influence on other factors. Conversely, the “influenced degree” assesses how much a component is impacted by others; a larger number implies higher vulnerability to external influences. “Centrality” highlights the connection intensity between a factor and the rest in the system. A greater centrality value shows that the component bears more significance compared to others. Lastly, “causality” determines a factor’s involvement in the system. A positive value indicates that the factor largely affects others, defining it as a cause-oriented factor. A negative value implies that it is more influenced by other factors, classifying it as a result-oriented factor.
According to step 7, we establish the causality–centrality diagram, as shown in Figure 8. Factors on the right side of the vertical coordinate are categorized as reason factors due to causality greater than zero; factors to the left of the vertical coordinate are categorized as result factors because causality is less than zero. Centrality determines the importance of the factor in the system.
According to step 8, thresholds λ are usually obtained by summing the mean and standard deviation of all factors in the comprehensive impact matrix T [45]. Finally, the threshold λ is taken as 0.1468 after calculation, and the reachable matrix K is obtained by transforming the comprehensive impact matrix T , as shown in (22).
According to steps 9–11, we retrieve the factor set of each layer by processing the reachable matrix. Then, the multilevel hierarchical hybrid model is established, as shown in Figure 9.
K = 1 0 1 0 0 0 1 1 0 0 0 0 0 1 0 0 0 1 0 0 0 0 0 1 0 0 0 0 0 0 0 0 0 0 1 0 0 0 0 0 0 0 0 0 0 0 0 0 0 0 0 1 0 0 0 0 0 0 0 0 0 0 0 0 0 0 0 1 1 1 1 0 0 1 0 1 0 0 0 0 0 0 0 1 0 1 1 0 0 1 0 0 0 0 0 0 0 0 0 0 0 0 1 0 0 0 0 0 0 0 0 0 0 0 0 0 0 0 0 1 0 0 0 0 0 0 0 0 1 0 1 1 0 0 1 1 1 0 0 0 0 1 0 0 0 0 0 1 0 0 1 0 0 1 0 0 0 0 0 0 0 0 0 1 0 0 1 0 0 0 1 0 0 0 0 0 0 0 0 1 0 0 0 0 0 0 0 1 0 0 0 0 0 0 0 0 0 0 0 1 0 0 0 0 1 0 0 0 0 0 0 0 0 0 1 1 0 0 0 0 0 1 0 0 0 0 0 1 0 0 1 0 0 0 0 1 0 0 1 0 1 0 1 1 0 0 1 1 1 1 1 0 0 1 0 1

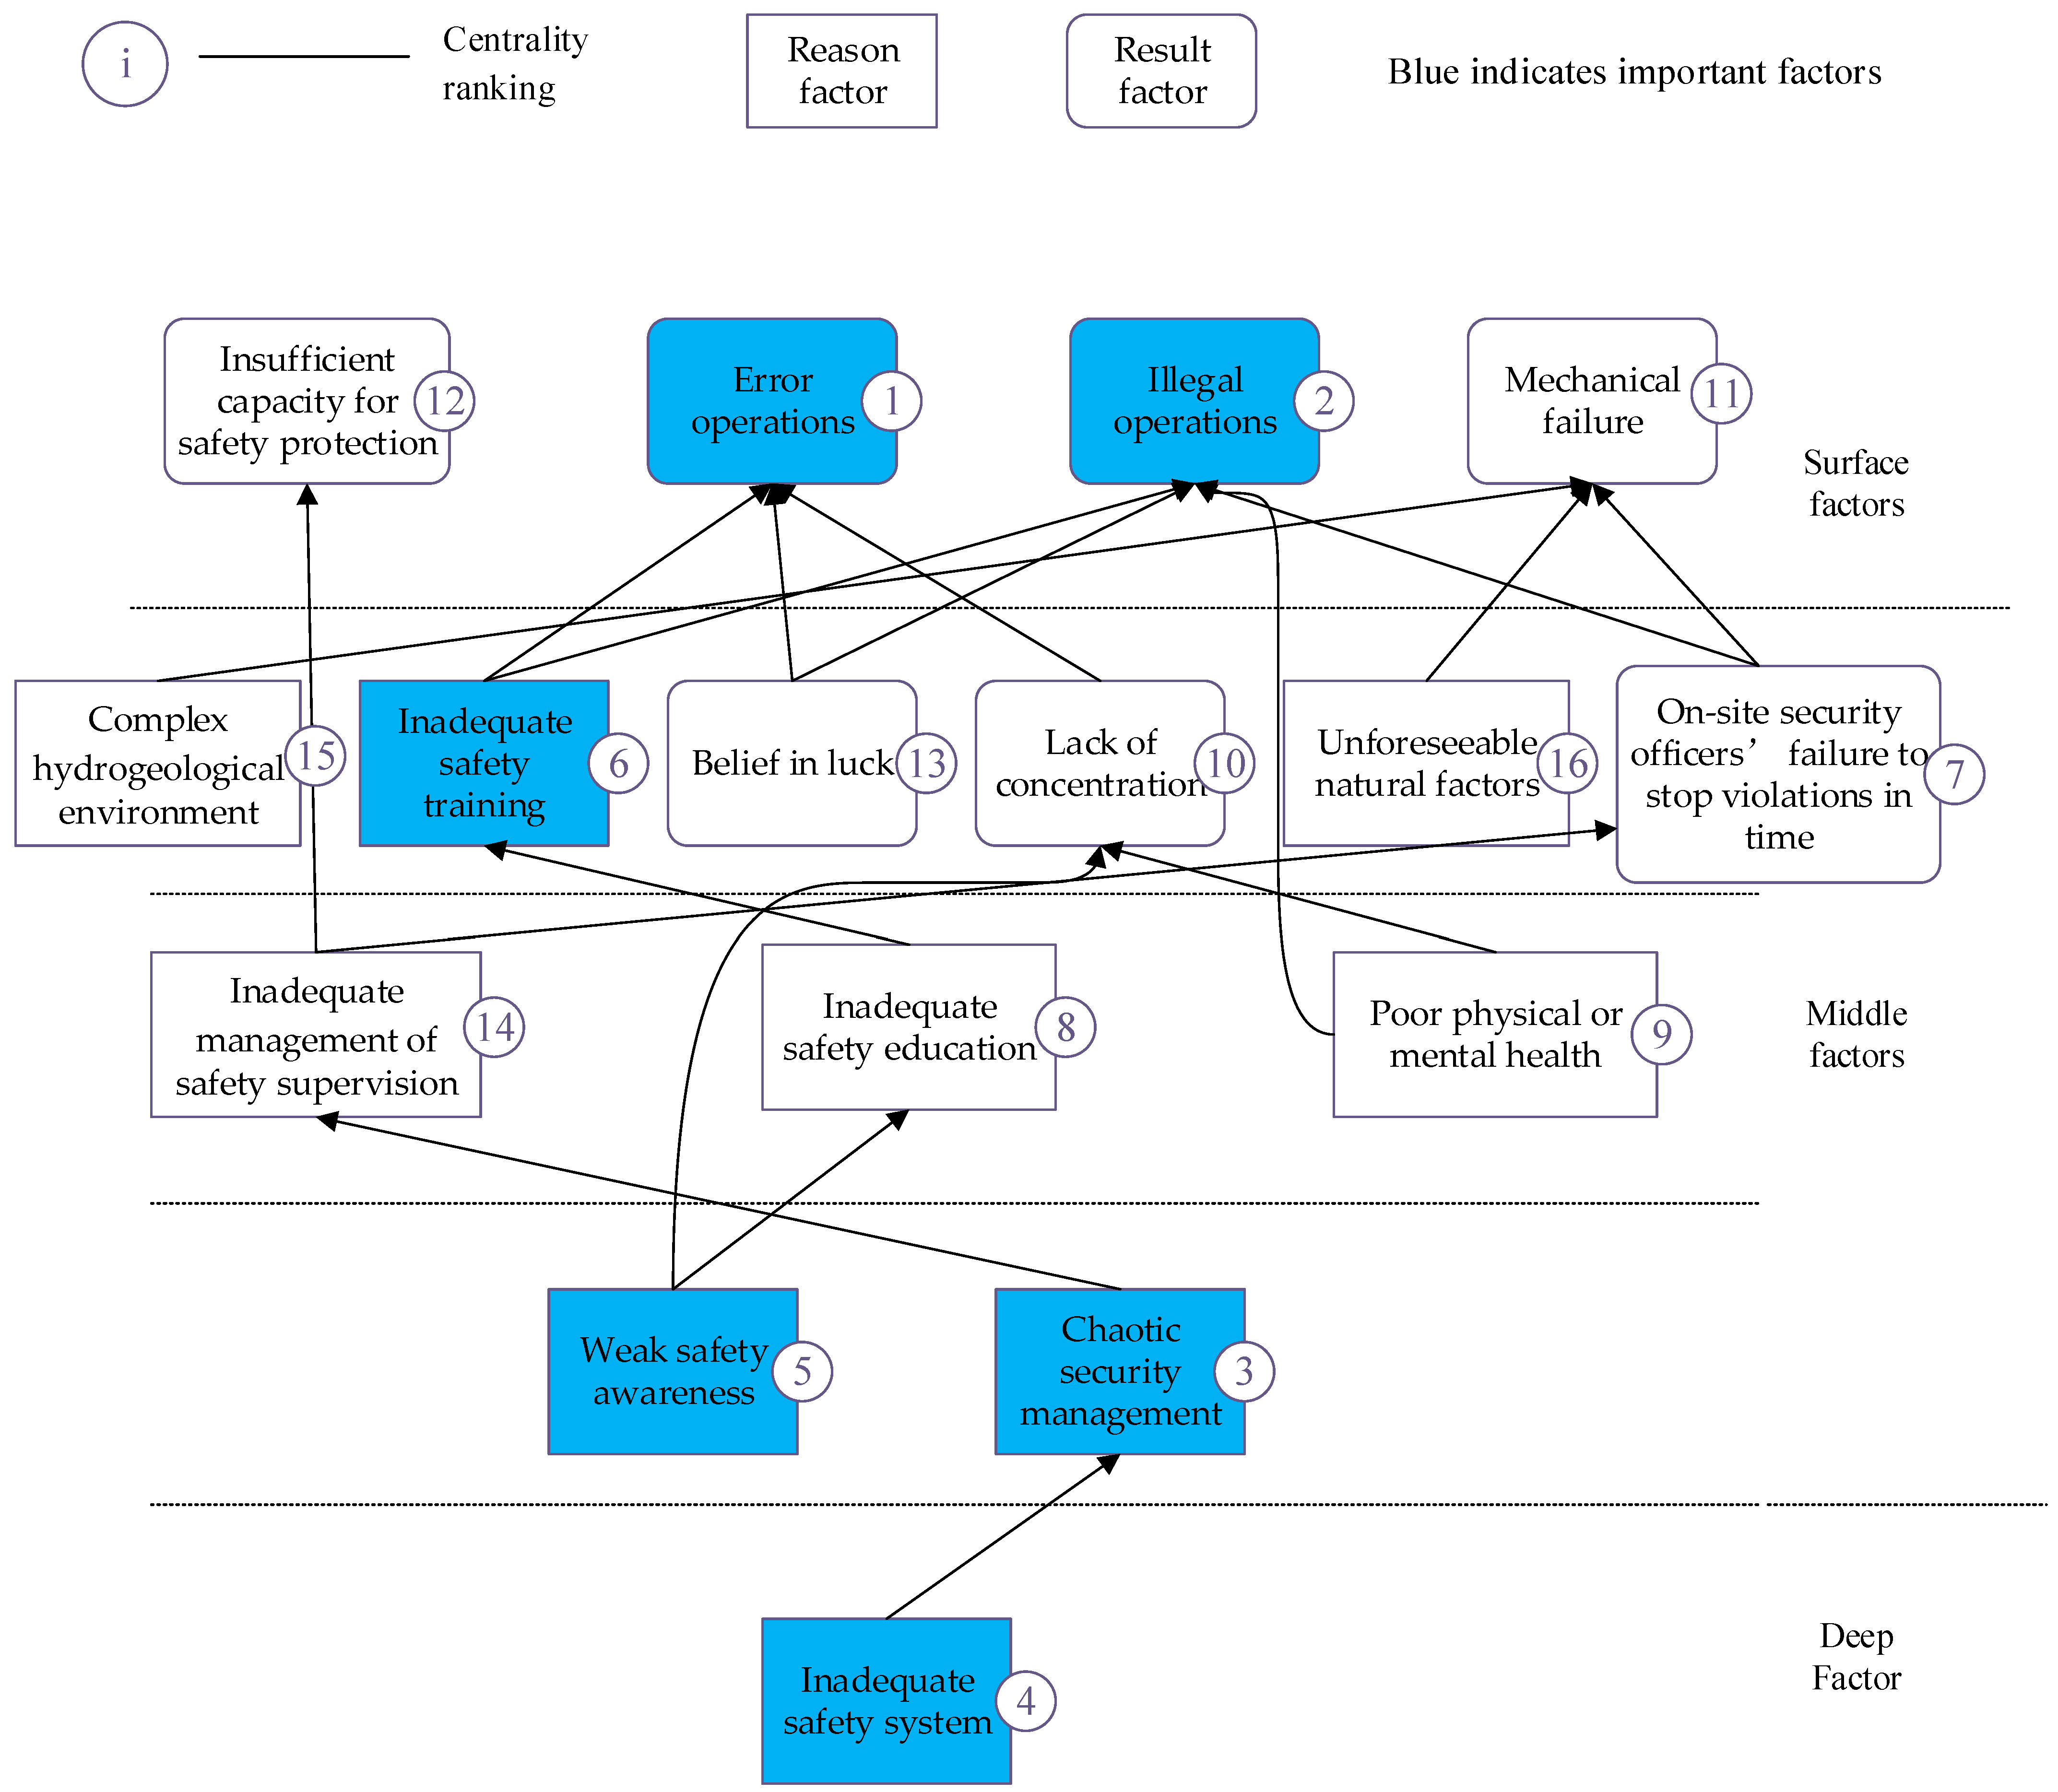
3.3. Analysis of the Mechanisms of Accident Causes

Of these factors, the inadequate management of safety supervision R 1 , a complex hydrogeological environment R 2 , weak safety awareness R 5 , inadequate safety education R 6 , chaotic security management R 9 , unforeseeable natural factors R 13 , poor physical or mental health R 15 and an inadequate safety system R 16 act as reason factors by potentially influencing other factors to cause fall accidents. In addition, among these factors, weak safety awareness R 5 , chaotic security management R 9 and an inadequate safety system R 16 have a larger influence and should be the most considered reason factors in hydraulic engineering construction. This also indicates that the improvement of human and management factors can improve the safety of the whole construction system. In terms of the influenced degree, error operations R 4 , illegal operations R 7 and mechanical failure R 8 are highlighted as the result factors, which indicates that these factors are susceptible to other factors and are proximal factors that lead to high vulnerability to accidents.
Centrality reflects the importance of factors in the system. As shown in Table 3, error operations R 4 is the most important, followed by illegal operations R 7 , chaotic security management R 9 , an inadequate safety system R 16 , weak safety awareness R 5 , inadequate safety training R 10 , on-site security officers’ failure to stop violations in time R 14 , inadequate safety education R 6 , poor physical or mental health R 15 , a lack of concentration R 12 , mechanical failure R 8 , insufficient capacity for safety protection R 3 , belief in luck R 11 , inadequate management of safety supervision R 1 , a complex hydrogeological environment R 2 and unforeseeable natural factors R 13 . Among all the factors, error operations R 4 , illegal operations R 7 , chaotic security management R 9 , an inadequate safety system R 16 , weak safety awareness R 5 , inadequate safety training R 10 , on-site security officers’ failure to stop violations in time R 14 , inadequate safety education R 6 and poor physical or mental health R 15 are especially important. However, a lack of concentration R 12 , mechanical failure R 8 , a complex hydrogeological environment R 2 and unforeseeable natural factors R 13 also play important roles that cannot be ignored. Accident causation analysis should be carried out comprehensively from the four aspects of man–machine–environment–management to achieve a systematic and accurate safety analysis. At present, from a system-wide perspective, management factors are the most important factors affecting the safety of hydraulic engineering construction, followed by human factors, mechanical equipment factors and environmental factors, which also play a significant role.
The multilevel hierarchical hybrid model is divided into five levels, where insufficient capacity for safety protection R 3 , error operations R 4 , illegal operations R 7 and mechanical failure R 8 are at the first level; a complex hydrogeological environment R 2 , inadequate safety training R 10 , belief in luck R 11 , a lack of concentration R 12 , unforeseeable natural factors R 13 and on-site security officers’ failure to stop violations in time R 14 are at the second level; inadequate management of safety supervision R 1 , inadequate safety education R 6 and poor physical or mental health R 15 are at the third level; weak safety awareness R 5 and chaotic security management R 9 are at the fourth level; and an inadequate safety system R 16 is at the fifth level;
In the multilevel hierarchical hybrid model, management factors such as an inadequate safety system R 16 are the deep factors, and the centrality is ranked fourth; chaotic security management R 9 is at the fourth level and the centrality is ranked third. The above illustrates the key role of management factors in the causal system. In addition, human factors such as weak safety awareness R 5 , poor physical or mental health R 15 , belief in luck R 11 and a lack of concentration R 12 deeply affect the transmission efficiency as the middle factors in the causal system. Inadequate safety education R 6 and inadequate safety training R 10 are characterized by influencing people’s behavior, demonstrating the importance of the role of the human factor in the transmission of contributing factors. As for environmental and machine factors, a complex hydrogeological environment R 2 and unforeseeable natural factors R 13 usually lead to mechanical failure R 8 and thus to accidents. Therefore, a good construction environment is a prerequisite to ensure the safe conductance of construction.
According to Figure 8, the top six factors for centrality are designated as key factors, namely error operations R 4 , illegal operations R 7 , chaotic security management R 9 , an inadequate safety system R 16 , weak safety awareness R 5 and inadequate safety training. From the multilevel hierarchical hybrid model, we can see that the key factors are spread across almost the entire causal hierarchy, and almost all of them are related to human and management factors.
Based on the above systematic analysis and actual construction situation, the following measures are proposed to prevent fall accidents in hydraulic engineering.
(1) Strengthen safety management and improve the operational efficiency of security management mechanisms and various safety management rules and regulations.
(2) Strengthen safety education and training. Use professional construction simulation software for on-site synchronous teaching. Improve self-rescue and danger identification abilities and enhance safety and disaster prevention awareness.
(3) Improve safety protection measures, such as replacing advanced safety protection equipment to reduce the probability of accidents.
(4) Strengthen the implementation of safety supervision. Enhance the safety responsibility awareness of relevant regulatory personnel.
(5) Improve the professional skills of staff, regularly organize professional learning and training and stimulate their enthusiasm for self-directed learning.
(6) Strengthen attention to the physical and mental health of staff and improve their physical fitness.
(7) Strengthen standardized and civilized construction to reduce the adverse impact of construction on the natural environment.

4. Discussion

Compared with the existing research on the causation of fall accidents in hydraulic engineering projects, this study focuses on the importance of and relationships between the causative factors at the human, machine, environment and management levels and obtains reasonable logical relationships. For instance, the most extensive causal chain identified in this research is R16–R9–R1–R14–R11. This chain contains three causative elements: human, mechanical and management. It holistically depicts the mechanisms underlying fall accidents. The outcomes of this research can be verified by the existing accident analyses in other domains. For example, in the sphere of transportation, human factors such as a lack of concentration, weak safety awareness and poor adaptability are the main factors of accidents. In the field of coal mining, human-related factors, including illegal operations, physical unease and a lack of experience, are the primary contributors to accidents, while issues such as mechanical failures play a secondary role. In the chemical industry, diminished alertness and focus rank highly among human-related causes of the frequent occurrence of accidents. Meanwhile, factors such as delayed equipment inspections, inadequate maintenance and insufficient safety precautions are the secondary factors.
Combined with the existing literature research, our work shows that the human factor has been the primary cause of accidents in different fields, so the safety awareness and physical condition of the workers should be the focus of our attention. In the construction sector, workers found to be physically unwell or workers who display a poor safety status should immediately stop their work. In this study, human factors such as weak safety awareness, poor physical or mental health and other human factors were also found to be significant factors that lead to fall accidents in hydraulic engineering projects, while an inadequate safety system, chaotic security management and other managerial factors are also major factors that lead to accidents in hydraulic engineering projects. Managerial factors are additional factors that act on human factors and lead to fall accidents; thus, safety management should focus on the leadership position in hydraulic engineering construction. Improving the management efficiency in construction, preventing concealment and misreporting and implementing transparent safety management will play a vital role.

5. Conclusions

Several factors contribute to fall accidents in hydraulic engineering. Drawing from system safety theory, the primary causes cover human, machine, environment and management interactions. This study utilized the fall accident reports of the hydraulic engineering sector to extract the main contributing factors using text mining technology. To provide a substantial theoretical foundation to boost the safety of hydraulic engineering construction projects, the DEMATEL-ISM method was applied to analyze the key factors and multilevel causal transmission channels in fall accidents. The primary conclusions are as follows.
(1) The contributing factors extracted by the text mining technique were divided into eight cause factors and eight result factors based on causal attributes. Weak safety awareness, chaotic security management and an inadequate safety system, as reason factors, have a greater impact on other contributing factors and should be the priority in terms of prevention and control in safe construction. Error operations, illegal operations and mechanical failure, as result factors, are more susceptible to other accident factors and they are also the surface factors that lead directly to fall accidents. The remaining ten accident causation factors had different effects on the occurrence of accidents due to the influencing and influenced degrees.
(2) ISM was used to divide the accident contributing factors into five hierarchical structures, involving one deep factor, eleven middle factors and four surface factors. The accident system consisted of thirteen causal chains, including four short and nine long causal chains. The analysis of the results suggests that human factors and management factors should be key control targets regarding fall accidents in hydraulic engineering.
(3) The contributing mechanism of fall accidents in hydraulic engineering is extraordinarily complex. All contributing factors should be considered comprehensively, especially the deeper factors that relate to proximal factors. It is crucial to reduce accident risks to a reasonable level to achieve sustainability in hydraulic engineering construction.
(4) For practitioners, increasing competence in hydraulic engineering construction, bolstering hazard detection capabilities and improving physical health will greatly lessen the accident risk. As for construction companies, intensifying safety training, enforcing supervisory responsibilities and refining safety management protocols can indirectly decrease the occurrence of accidents at the origin.

Author Contributions

Conceptualization, X.Z., Y.L. and B.S.; methodology, Y.L. and B.S.; software, Y.L.; validation, Y.L.; formal analysis, Y.L.; investigation, Y.L.; resources, Y.L. and B.S.; data curation, Y.L.; writing—original draft preparation, X.Z. and Y.L.; writing—review and editing, X.Z., Y.L. and B.S.; visualization, Y.L.; supervision, X.Z. and B.S. All authors have read and agreed to the published version of the manuscript.

Funding

This research received no external funding.

Institutional Review Board Statement

Not applicable.

Informed Consent Statement

Not applicable.

Data Availability Statement

Not applicable.

Conflicts of Interest

The authors declare no conflict of interest.

References

  1. De Vriend, H.J.; van Koningsveld, M.; Aarninkhof, S.G.; de Vries, M.B. Sustainable hydraulic engineering through building with nature. J. Hydro-Environ. Res. 2015, 9, 159–171. [Google Scholar] [CrossRef]
  2. Smiley, S.L.; Stoler, J. Socio-environmental confounders of safe water interventions. Wiley Interdiscip. Rev. Water 2020, 7, e1438. [Google Scholar] [CrossRef]
  3. Shkrebtii, T.; Cherkasov, A.; Nebozh, T.; Muraviev, A.; Taroev, R. Environmental safety in the field of construction and operation of hydraulic structures. In E3S Web of Conferences; EDP Sciences: Ulys, France, 2020; p. 11005. [Google Scholar]
  4. Hooimeijer, F.; Bricker, J.; Pel, A.; Brand, A. Multi-and interdisciplinary design of urban infrastructure development. Proc. Inst. Civ. Eng.-Urban Des. Plan. 2022, 175, 153–168. [Google Scholar] [CrossRef]
  5. Chanson, H.; Shi, J.Z. Environmental hydraulic engineering: A perspective. Environ. Fluid Mech. 2015, 15, 627–631. [Google Scholar] [CrossRef]
  6. Kang, Y.; Siddiqui, S.; Suk, S.J.; Chi, S. Trends of fall accidents in the US construction industry. J. Constr. Eng. Manag. 2017, 143, 04017043. [Google Scholar] [CrossRef]
  7. Zhang, S.; Hou, D.; Wang, C.; Pan, F.; Yan, L. Integrating and managing BIM in 3D web-based GIS for hydraulic and hydropower engineering projects. Automat. Constr. 2020, 112, 103114. [Google Scholar] [CrossRef]
  8. Zhou, J.-L.; Bai, Z.-H.; Sun, Z.-Y. A hybrid approach for safety assessment in high-risk hydropower-construction-project work systems. Saf. Sci. 2014, 64, 163–172. [Google Scholar] [CrossRef]
  9. Deng Sheng, H.L.; Liu, X.; Lu, J. Extension Evaluation Model of Safety Risk of Water Conservancy Project Falling. Guangdong Water Resour. Hydropower 2019, 1, 36–40. [Google Scholar]
  10. Nadhim, E.A.; Hon, C.; Xia, B.; Stewart, I.; Fang, D. Falls from Height in the Construction Industry: A Critical Review of the Scientific Literature. Int. J. Environ. Res. Public Health 2016, 13, 638. [Google Scholar] [CrossRef]
  11. Poon, L.; Goh, Y.M.; Zhou, Z. A Systematic Literature Review of Current Research on Prevention and Protection of Fall from Height; Achieving Sustainable Construction Health Safety: Lund, Sweden, 2014; pp. 628–639. [Google Scholar]
  12. Williams, O.S.; Hamid, R.A.; Misnan, M.S. Accident causal factors on the building construction sites: A review. Int. J. Built Environ. Sustain. 2018, 5, 78–92. [Google Scholar] [CrossRef]
  13. Shao, B.; Hu, Z.; Liu, Q.; Chen, S.; He, W. Fatal accident patterns of building construction activities in China. Saf. Sci. 2019, 111, 253–263. [Google Scholar] [CrossRef]
  14. Sari, M.; Duzgun, H.S.B.; Karpuz, C.; Selcuk, A.S. Accident analysis of two Turkish underground coal mines. Saf. Sci. 2004, 42, 675–690. [Google Scholar] [CrossRef]
  15. Chen, Y.; Zeng, Q.; Zheng, X.; Shao, B.; Jin, L. Safety supervision of tower crane operation on construction sites: An evolutionary game analysis. Saf. Sci. 2022, 152, 105578. [Google Scholar] [CrossRef]
  16. Yang, Y.; Shao, B.; Jin, L.; Zheng, X. Collaborative Governance of Tower Crane Safety in the Chinese Construction Industry: A Social Network Perspective. Buildings 2022, 12, 836. [Google Scholar] [CrossRef]
  17. Liu, T.; Zhang, S.R.; Wang, C. Text intelligent analysis for hydraulic construction accidents based on BERT-BiLSTM hybrid model. J. Hydroelectr. Eng. 2022, 41, 1–12. [Google Scholar]
  18. Yan, W.J.; Liu, Y.Q.; Xiao, J.L. Application of integrated BIM and RFIDT technology in safety management of water conservancy construction. Water Resour. Power 2018, 36, 117–121. [Google Scholar]
  19. Sun, K.C.; Li, Q.; Xu, X.F.; Yin, Z.W. Risk analysis on human factors in operation of high-risk construction based on dynamic Bayesian network. J. Hydroelectr. Eng. 2017, 36, 28–35. [Google Scholar]
  20. Chen, S.; Xi, J.; Wang, J.P.; Chen, Y. Mining association rules of near-misses of hydropower projects construction. China Saf. Sci. J. 2021, 31, 75–82. [Google Scholar]
  21. Sun, K.C.; Xu, X.F.; Zhang, G.; Yue, H.D. Analysis on importance of human factors to construction safety of hydraulic engineering. Yangtze River 2016, 47, 80–83. [Google Scholar]
  22. Zheng, X.; Zhou, J.; Wang, F.; Chen, Y. Routes to Failure and Prevention Recommendations in Work Systems of Hydropower Construction. J. Civ. Eng. Manag. 2018, 24, 206–222. [Google Scholar] [CrossRef]
  23. Hussen, J.; Dagne, H.; Yenealem, D.G. Factors Associated with Occupational Injury among Hydropower Dam Construction Workers, South East Ethiopia, 2018. Biomed Res. Int. 2020, 2020, 6152612. [Google Scholar] [CrossRef]
  24. Chan, A.P.C.; Yang, Y.; Darko, A. Construction Accidents in a Large-Scale Public Infrastructure Project: Severity and Prevention. J. Constr. Eng. Manag. 2018, 144, 05018010. [Google Scholar] [CrossRef]
  25. Tan, Z.L.; Chen, X.; Song, Q.Z.; Chen, X.C. Analysis for the potential hazardous risks of the coal mines based on the so-called text mining. J. Saf. Environ. 2017, 17, 1262–1266. [Google Scholar]
  26. Chen, F.S. Study on causes of near mid-air collision based on text mining. J. Saf. Environ. 2022, 22, 3280–3287. [Google Scholar]
  27. Niu, Y.; Fan, Y.X.; Gao, Y. Topic extraction on causes of chemical production accidents based on data mining. J. Saf. Sci. Technol. 2019, 15, 165–170. [Google Scholar]
  28. Zheng, X.Z.; Zhou, J.L. Causal analysis of strike accident of tower crane operating object based on D-I. China Saf. Sci. J. 2021, 31, 83–89. [Google Scholar]
  29. Reimann, P.; Schütze, A. Fire detection in coal mines based on semiconductor gas sensors. Sens. Rev. 2012, 32, 47–58. [Google Scholar] [CrossRef]
  30. Rachman, F.F.; Nooraeni, R.; Yuliana, L. Public Opinion of Transportation integrated (Jak Lingko), in DKI Jakarta, Indonesia. Procedia Comput. Sci. 2021, 179, 696–703. [Google Scholar] [CrossRef]
  31. Gadekar, H.; Bugalia, N. Automatic classification of construction safety reports using semi-supervised YAKE-Guided LDA approach. Adv. Eng. Inform. 2023, 56, 101929. [Google Scholar] [CrossRef]
  32. Blei, D.M.; Ng, A.Y.; Jordan, M. Latent dirichlet allocation. J. Mach. Learn. Res. 2003, 3, 993–1022. [Google Scholar]
  33. Jelodar, H.; Wang, Y.; Yuan, C.; Feng, X.; Jiang, X.; Li, Y.; Zhao, L. Latent Dirichlet allocation (LDA) and topic modeling: Models, applications, a survey. Multimed. Tools Appl. 2019, 78, 15169–15211. [Google Scholar] [CrossRef]
  34. Mo, Y.; Kontonatsios, G.; Ananiadou, S. Supporting systematic reviews using LDA-based document representations. Syst. Rev. 2015, 4, 172. [Google Scholar] [CrossRef] [PubMed]
  35. George, C.P.; Doss, H. Principled selection of hyperparameters in the latent Dirichlet allocation model. J. Mach. Learn. Res. 2017, 18, 5937–5974. [Google Scholar]
  36. Jiang, K.; Kulis, B.; Jordan, M. Small-variance asymptotics for exponential family Dirichlet process mixture models. Adv. Neural Inf. Process. Syst. 2015, 25, 114–117. [Google Scholar]
  37. Campbell, J.C.; Hindle, A.; Stroulia, E. Latent Dirichlet allocation: Extracting topics from software engineering data. In The Art and Science of Analyzing Software Data; Morgan Kaufmann: Burlington, MA, USA, 2015; pp. 139–159. [Google Scholar]
  38. Du, Y.; Li, X. Hierarchical DEMATEL method for complex systems. Expert Syst. Appl. 2021, 167, 113871. [Google Scholar] [CrossRef]
  39. Seleem, S.N.; Attia, E.A.; El-Assal, A. Managing performance improvement initiatives using DEMATEL method with application case study. Prod. Plan. Control 2016, 27, 637–649. [Google Scholar] [CrossRef]
  40. Tsai, S.; Zhou, J.; Gao, Y.; Wang, J.; Li, G.; Zheng, Y.; Ren, P.; Xu, W. Combining FMEA with DEMATEL models to solve production process problems. PLoS ONE 2017, 12, e0183634. [Google Scholar] [CrossRef]
  41. Lin, F.; Wu, P.; Xu, Y. Investigation of factors influencing the construction safety of high-speed railway stations based on DEMATEL and ISM. Adv. Civ. Eng. 2021, 2021, 9954018. [Google Scholar] [CrossRef]
  42. Xiahou, X.; Wu, Y.; Duan, T.; Lin, P.; Li, F.; Qu, X.; Liu, L.; Li, Q.; Liu, J. Analyzing critical factors for the smart construction site development: A DEMATEL-ISM based approach. Buildings 2022, 12, 116. [Google Scholar] [CrossRef]
  43. Chuang, J.; Manning, C.D.; Heer, J. Termite: Visualization techniques for assessing textual topic models. In Proceedings of the International Working Conference on Advanced Visual Interfaces, Naples, Italy, 22–26 May 2012; pp. 74–77. [Google Scholar]
  44. Sievert, C.; Shirley, K. LDAvis: A method for visualizing and interpreting topics. In Proceedings of the Workshop on Interactive Language Learning, Visualization, and Interfaces, Baltimore, MD, USA, 27 June 2014; pp. 63–70. [Google Scholar]
  45. Yu, S.; Geng, X.; He, J.; Sun, Y. Evolution analysis of product service ecosystem based on interval Pythagorean fuzzy DEMATEL-ISM-SD combination model. J. Clean. Prod. 2023, 421, 138501. [Google Scholar] [CrossRef]
Figure 1. Research process.
Water 15 03810 g001
Figure 2. LDA probability model.
Water 15 03810 g002
Figure 3. Word cloud map of fall accidents in hydroelectric engineering.
Water 15 03810 g003
Figure 4. Perplexity corresponding to different numbers of topics; perplexity is minimized when the number of topics is 16.
Water 15 03810 g004
Figure 5. Extraction results of topic k = 16 [43,44].
Water 15 03810 g005
Figure 6. Ring bar graph of accident characteristic words when topic k = 16.
Water 15 03810 g006
Figure 7. Flowchart of matrix formation.
Water 15 03810 g007
Figure 8. Causal diagram of accident contributing factors.
Water 15 03810 g008
Figure 9. Multilevel hierarchical hybrid model.
Water 15 03810 g009
Table 1. Fall accident investigation report.
Accident AttributeAccident Information
Accident process  On 22 March 2016, at the Huangdeng Hydropower Station, a fixed tower crane was set up at the water intake, and the installation proceeded as planned. Following a pre-shift meeting, six technicians undertook the crane installation, while two representatives from the project department oversaw and supervised the process. Around 11:00 p.m., as the installation crew prepared to end their shift and descended from the crane, an oversight occurred. One supervisor from the project department mistakenly stepped through a gap in the guardrail on the transition resting platform, plummeting to the tower crane’s base platform, which tragically resulted in a fatality
Accident cause  The accident’s immediate cause stemmed from the victim’s non-adherence to safety protocols while using the tower climbing ladder. His misstep on a slippery surface, combined with not holding the railing, led to his fall from a gap in the external protective barrier down to the tower’s foundation platform. Additionally, the tower installation unit did not adequately uphold their safety supervision and management responsibilities during the installation. Inadequacies were noted in risk identification, communication, education, training, and hazard detection. Their routine safety oversight was insufficient, and they failed to identify and mitigate risks promptly.
Accident prevention measure
  • Comprehensive and solid organization of hidden danger investigation, focusing on the investigation of special equipment, work at height, tunnel construction, lifting and hoisting, etc., to prevent the recurrence of various incidents.
  • To further strengthen the development of pre-shift safety activities, we should start from the standardization of pre-shift meetings, and control all kinds of irregularities in the pre-shift.
  • Adopt a variety of ways to strengthen the timeliness and relevance of safety training for front-line managers, operators and laborers, and improve the self-prevention awareness of operators and their ability to respond to emergencies.
  • Organize and carry out warning education to enhance the awareness of safety precautions for all staff members
Table 2. Contributing factors of fall accidents.
TopicAccident Characteristic TermsFactor
1management, personnel, safety, failure, supervision, institutionInadequate management of safety supervision R 1
2site, construction, place, risk, cracking, resultingComplex hydrogeological environment R 2
3rescue, timely, safety, inadequate, measure, protectionInsufficient capacity for safety protection R 3
4installation, operation, causing, error, resulting, damaged, fallError operations R 4
5poor, awareness, safety, attention, slippery, resulting, fallWeak safety awareness R 5
6safety, education, management, inadequate, accident, workInadequate safety education R 6
7unauthorized, work, operation, construction, safety, accidentIllegal operations R 7
8fault, machines, accident, operation, repair, tower crane, steelMechanical failure R 8
9random, management, inadequate, security, fall, accidentChaotic security management R 9
10safety, training, lack, personnel, accident, lossInadequate safety training R 10
11safety, ignore, self-confident, lucky, feeling, accidentBelief in luck R 11
12dangerous, attention, risk, focus, awareness, identificationLack of concentration R 12
13rain, construction, weather, slippery, odious, accidentUnforeseeable natural factors R 13
14security, timely, accident, on-site, personnel, construction, stopFailure to stop violations in time R 14
15health, poor, dizziness, physical, examination, weak, restPoor physical or mental health R 15
16safety, system, regulations, lack, loss, deficiency, insufficientInadequate safety system R 16
Table 3. DEMATEL parameter table.
FactorInfluencing DegreeInfluenced DegreeCentralityCausalityCentrality RankingFactor Attribute
R 1 1.4911.1302.6200.36114Reason factor
R 2 1.2170.3771.5950.84015Reason factor
R 3 1.1571.5692.726−0.41212Result factor
R 4 1.2212.5803.801−1.3581Result factor
R 5 2.0131.2913.3040.7225Reason factor
R 6 1.5311.3312.8620.2018Reason factor
R 7 1.0962.6673.763−1.5722Result factor
R 8 0.6672.0732.740−1.40611Result factor
R 9 2.1541.3233.4770.8313Reason factor
R 10 1.5441.5593.103−0.0156Result factor
R 11 1.2681.3862.654−0.11813Result factor
R 12 1.0511.7302.781−0.67910Result factor
R 13 1.2580.1001.3581.15816Reason factor
R 14 1.3041.6402.944−0.3367Result factor
R 15 1.5971.2142.8110.3839Reason factor
R 16 2.4131.0133.4261.4014Reason factor
Disclaimer/Publisher’s Note: The statements, opinions and data contained in all publications are solely those of the individual author(s) and contributor(s) and not of MDPI and/or the editor(s). MDPI and/or the editor(s) disclaim responsibility for any injury to people or property resulting from any ideas, methods, instructions or products referred to in the content.

