Article

Impact of Lockdown on the Surface Water Quality in Kelani River, Sri Lanka

by
Isuru Yapabandara
1,2,3,4,
Yuansong Wei
1,2,3,4,5,*,
Bimsara Ranathunga
1,2,3,4,
Suresh Indika
1,2,3,4,
K. B. S. N. Jinadasa
6,
Sujithra K. Weragoda
4,7,
Rohan Weerasooriya
5 and
Madhubashini Makehelwala
4
1
State Key Joint Laboratory of Environmental Simulation and Pollution Control, Research Center for Eco-Environmental Sciences, Chinese Academy of Sciences, Beijing 100085, China
2
Laboratory of Water Pollution Control Technology, Research Center for Eco-Environmental Sciences, Chinese Academy of Sciences, Beijing 100085, China
3
University of Chinese Academy of Sciences, Beijing 100049, China
4
China–Sri Lanka Joint Research and Demonstration Center for Water Technology, Ministry of Water Supply, Meewathura, Peradeniya 20400, Sri Lanka
5
National Institute of Fundamental Studies, Kandy 20000, Sri Lanka
6
Department of Civil Engineering, University of Peradeniya, Peradeniya 20400, Sri Lanka
7
National Water Supply and Drainage Board, Katugastota 20800, Sri Lanka
*
Author to whom correspondence should be addressed.
Water 2023, 15(21), 3785; https://doi.org/10.3390/w15213785
Submission received: 3 August 2023 / Revised: 15 October 2023 / Accepted: 24 October 2023 / Published: 29 October 2023

Abstract

:
The COVID-19 lockdown has been regarded as a catalyst for the restoration of natural water bodies worldwide. Therefore, this study aims to investigate the impacts of the lockdown on the water quality of the Kelani River, Sri Lanka. The water quality downstream of the Kelani River Basin was greatly improved during the lockdown season, The concentration of biological oxygen demand (BOD) decreased downstream by ~46% during the lockdown, while that in the middle and upstream reduced by 7.1% and 5.0%, respectively. The concentration of chemical oxygen demand (COD) was diminished by around 65%, 52%, and 43% in downstream, middle stream, and upstream, respectively, in the lockdown season. However, in post-lockdown season, upstream showed the highest spatial variation in nitrate concentration, which may be due to excessive use of fertilizers in that region. Many industries temporarily shut down or scaled back operations during the lockdown, which allowed for a large reduction in the discharge of pollutants, particularly in the river’s downstream region. The river’s water quality showed a significant improvement as a result of temporarily suspending human activities.

1. Introduction

The widespread COVID-19 pandemic has affected all regions in the world. The lockdowns imposed to control the virus had significant effects on economic activities and the environment. The implementation of COVID-19 lockdowns has been shown in numerous studies from around the world to have positive benefits for the environment, i.e., water quality [1]. The longest freshwater lake in India is called Vembanand, the suspended particulate matter has been reduced to more than 15% in the month of April 2020 due to the lockdown [2]. Colombo is the commercial capital of Sri Lanka and is situated downstream of the Kelani River Basin. A total of 80% of the drinking water used by residents in the area of Colombo City comes from the Kelani River, which is also utilized for transportation, fishing, sand mining, and hydroelectricity generation [3]. Gampaha and Colombo, two rapidly industrializing and densely populated urban areas, as well as the two major industrial parks of Biyagama and Seethawaka, are all located along the downstream section of the Kelani River, and 25% of the country’s total population resides in these two districts [3,4]. Previous studies [3,4] suggested that water quality in the Kelani River Basin is deteriorating year by year, especially, near the Colombo region accounts for the “Poor” water quality. Major rivers’ declining water quality as a result of rapid industrial and urban expansion has become a significant challenge in developing nations constructing infrastructure facilities. It takes longer to support this expansion than population growth and financial growth [5], resulting in the insufficient capacity of wastewater treatment and drinking water supplies. Surface water is seriously endangered in both water quality and resources by such insufficient sewage treatment systems.
Sri Lanka imposed a lockdown all over the country starting from March 2020 to the beginning of August 2020. An ample opportunity to study the effects of pollution reduction on water quality and the possible advantages of more strict discharge standards is presented by the temporary closure of these discharges during Sri Lanka’s COVID-19 lockdown. Therefore, the goal of this study was to evaluate the impacts of the lockdown measures on the water quality of Kelani River through comparing before and after the lockdown, and historical data on the water quality parameters. The study used the water quality index (WQI) to acquire an understanding of the spatial and temporal fluctuations in the water quality of the Kelani River. This is the first comprehensive study that investigates the impacts of the COVID-19 lockdown on water quality in the entire basin of Kelani River to the best of our knowledge.

2. Materials and Methods

2.1. Study Area

The Kelani River starts from the central hills near Horton Plains National Park and Peak Wilderness Sanctuary, with area of 2292 km2 at 145 km in length and approximately 2250 m above mean sea level [6]. Its elevation varies from 0 to 2346 m above mean sea level (Figure 1). The Kelani River Basin is situated between the latitudes of 6°47’ and 7°05’ in the north and 79°52’ and 80°13’ in the east [7]. The Kelani River flows through five districts, including Colombo. Recent studies have shown that the water quality in the Kelani River has significantly deteriorated, even though it supplies 80% of the drinking water to the people living in the Colombo region [3]

2.2. Field Sampling and Water Quality Analysis

In this study, 60 sampling sites were selected (Figure 1 and Table S1) covering the downstream, middle stream, and upstream of the Kelani River including some points selected in the branches that directly flow to the Kelani River. Two field investigations were conducted during the lockdown (at the beginning of June 2020) and after the lockdown period (post-lockdown at the end of September 2020). For comparison purposes, historical water quality data in sampling sites (Table S2) along the Kelani River were collected from Central Environmental Authority (CEA), Sri Lanka and it was used as pre-lockdown water quality data. The sampling and analysis of various physico-chemical parameters like BOD, and COD were conducted following the standard procedures as detailed in standard procedures [8].
Until water samples were sent to a lab for chemical analysis, all of the samples were kept at 4 °C. After sampling, samples were taken back to the National Institute of Fundamental Studies (NIFS), Sri Lanka for further analysis. As onsite measurements, the pH, electrical conductivity (EC), and water temperature were measured with field probes (Eutech 01X099414, Thermo Scientific Eutech 01X099414 Inc., Waltham, MA, USA). All the heavy metals were determined by an inductively coupled plasma optical emission spectrophotometer (iCAP7000Series ICP-OES, Thermo Fisher Scientific, Waltham, MA, USA) in the NIFS-Sri Lanka. Using the Hach Alkalinity test kit, total alkalinity was measured (TNTplus Vials, Loveland, CO, USA). The Piper diagram was used to analyze the major ion composition in terms of milli-equivalent percentage (mEq %) and determine the hydrochemical facies and water types. A multivariate statistical analysis of principal component analysis (PCA) was used to investigate the association between hazardous elements and possible sources of pollution.
The concentrations of Na, K, Ca, and Mg were analyzed by an inductively coupled plasma emission spectrophotometer (Optima 8300, Perkin Elmer, Houston, TX, USA). The anion concentrations were measured using ion chromatography (ICS1000, Metrohm, Switzerland). Equation (1) was used to determine the total hardness (CaCO3) by considering the concentrations of Ca2+ and Mg2+ in each sample [9].
Total Hardness [mg/L] = 2.497 [Ca, mg/L] + 4.118 [Mg, mg/L]
The analysis of dissolved organic carbon (DOC) concentrations in the water samples was conducted using a Shimadzu TOC Analyzer (Elementra, Langenselbold, Germany), at the Environmental Lab, University of Peradeniya, Sri Lanka.

2.3. Statistical Analysis

Data processing and statistical analysis were conducted using Minitab 15 software, USA SPSS 26 software, USA and ORIGIN PRO 8.5 software.

2.4. Water Quality Index (WQI)

Water quality and its appropriateness for drinking purposes can be inspected by deciding its water quality index (WQI) [10,11,12,13] by different water quality parameters with correspondence weightage and using standard water quality parameters.
WQI was calculated by following equation as described [13].
W Q I = i = 1 n W i q i
where Wi is the relative weight and qi is the quality rating of each parameter. Based on calculated WQI values [13] scale rating can be categorized (Table S3). Each chemical parameter assigned weightage mean based on Sri Lankan water quality standards (SLS614:2013) [14] (Table S4).

2.5. GIS Thematic Mapping

Spatial geographic maps were prepared using Esri (ArcGIS 10.5 software Inc., USA). Mapping techniques available in the Spatial Analyst tool of Esri, ArcGIS 10.5 software from the USA were utilized for data interpretation in this study.

3. Results

3.1. Spatio-Temporal Variations of Water Quality in Kelani River Sri Lanka

3.1.1. Water Quality of Key Parameters

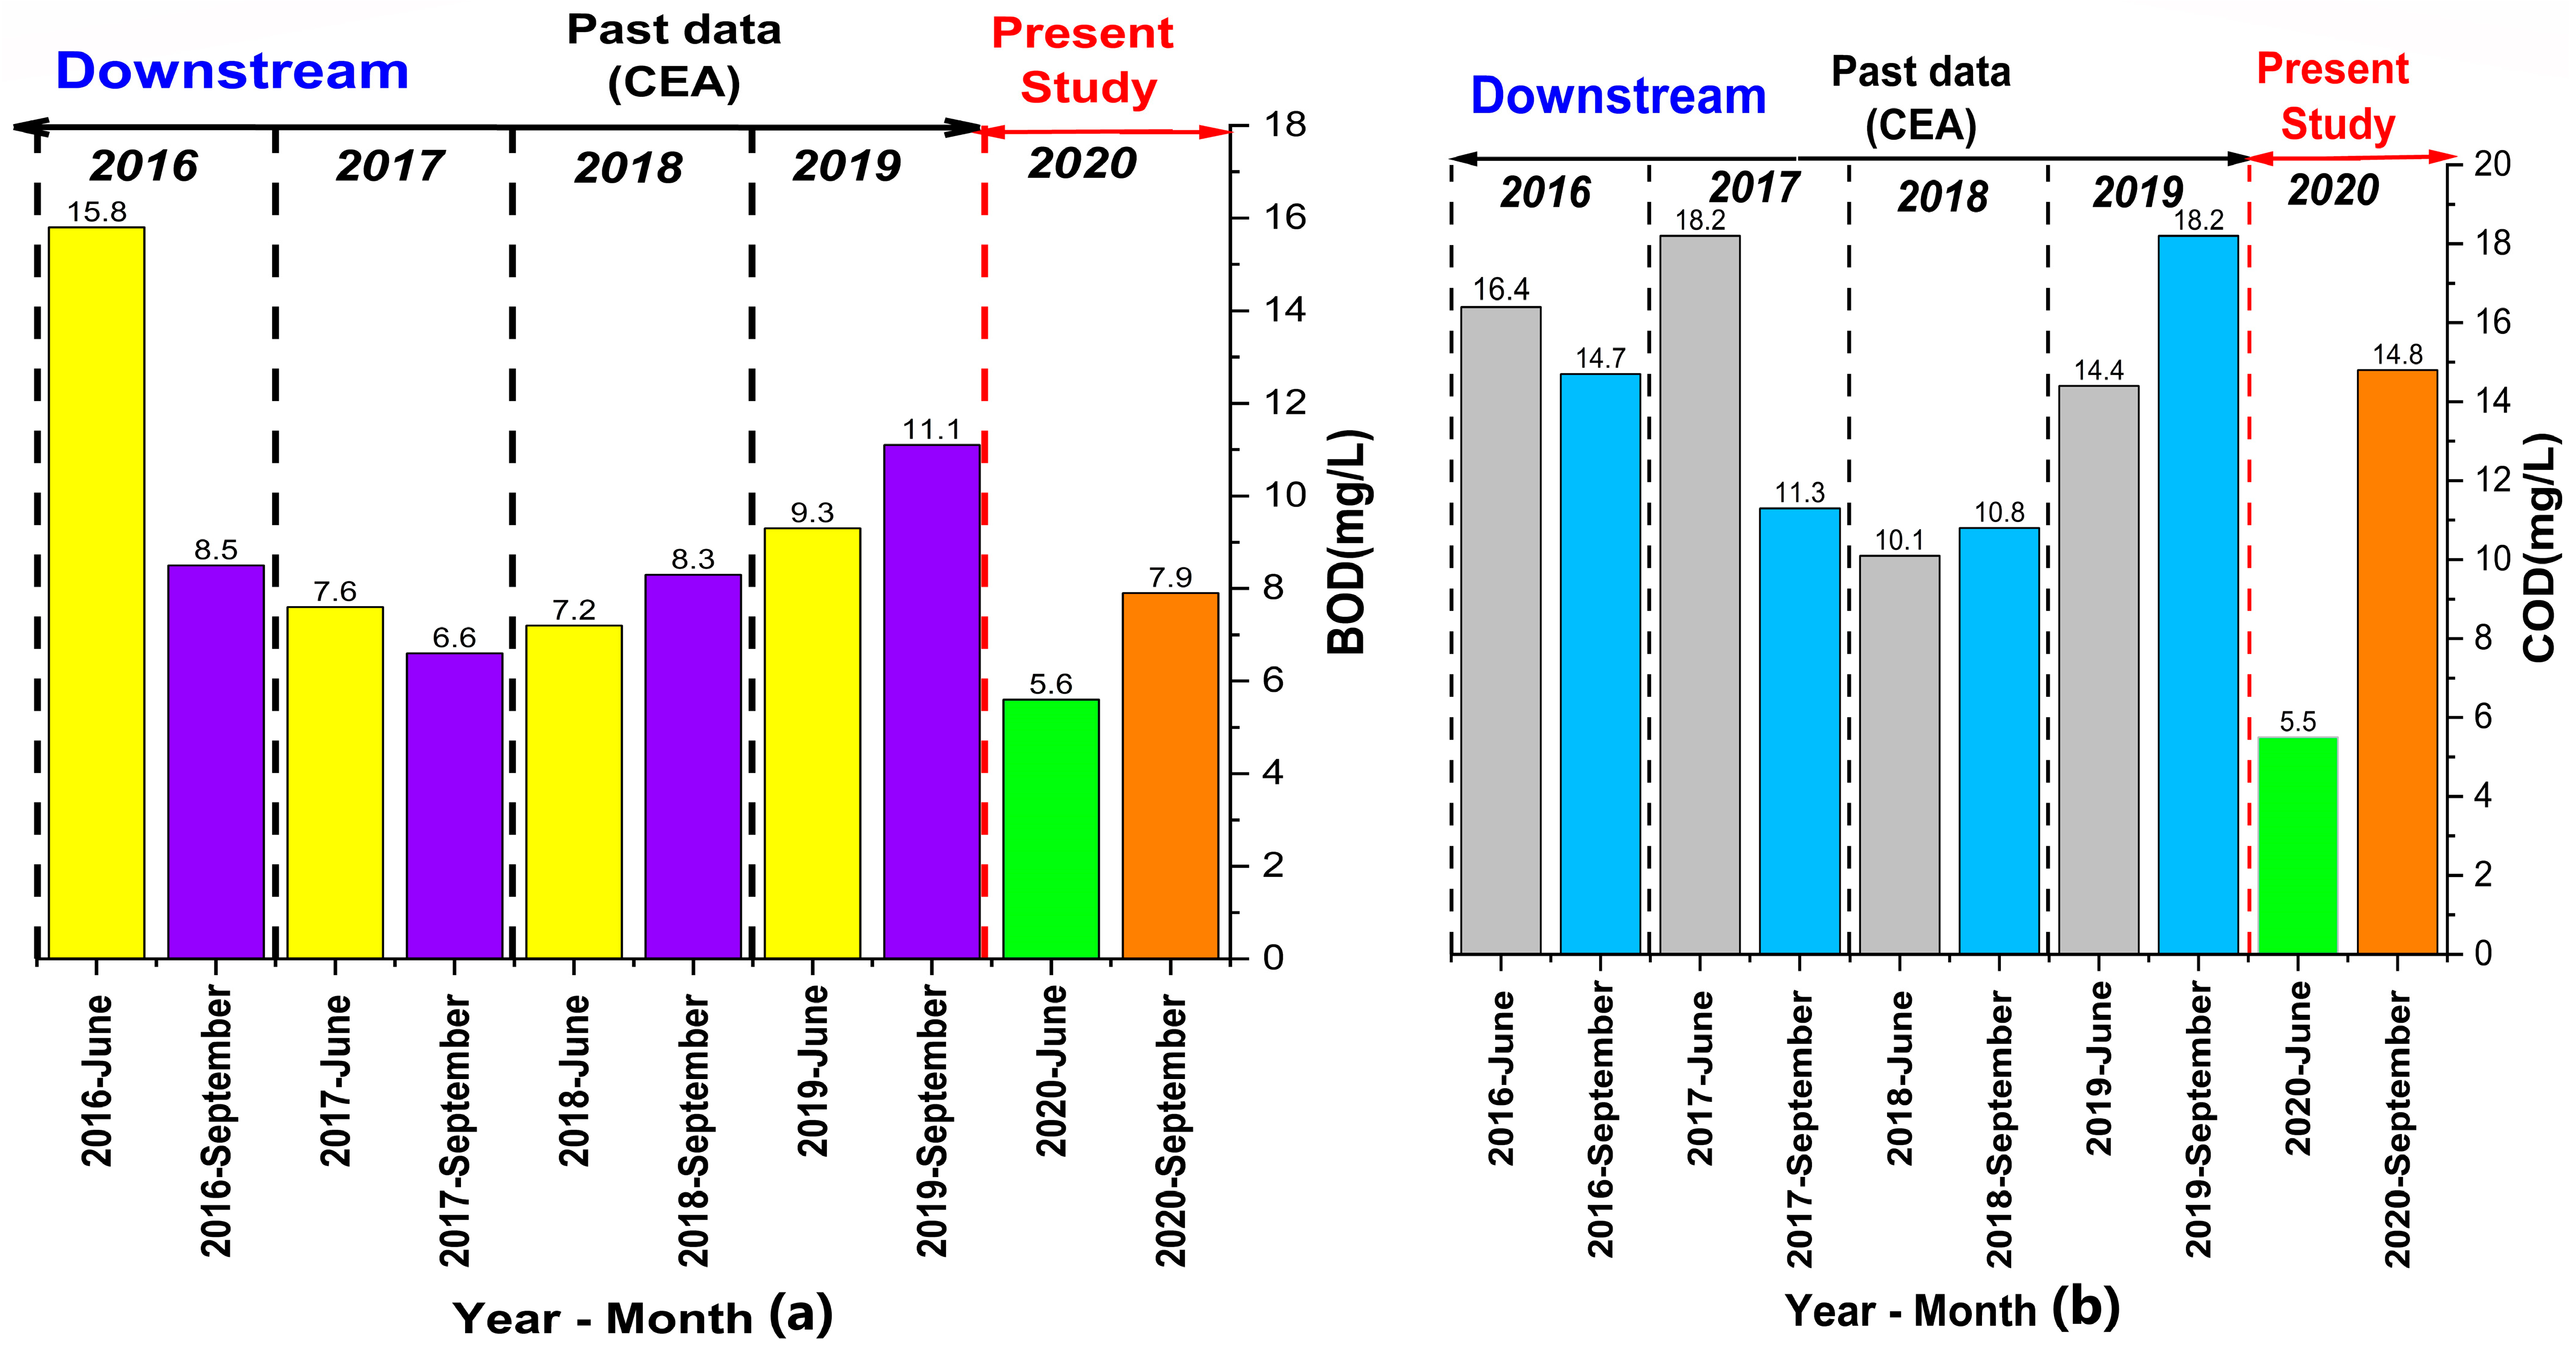
According to the Sri Lankan Standard for portable water (SLS 614:2013) [14] COD desired value should be 10 mg/L. In the lockdown period, the COD values reported from all locations were lower than 10 mg/L, the maximum value of 9.8 mg/L of COD was reported in the Kollonawa Ela (S13) located downstream, which is in close proximity to the Central Colombo district. In the post-lockdown season, COD concentrations were raised up to more than 20 mg/L in some points which exceeded the limit of desired value, especially downstream. Similarly, the highest values of BOD reported in the near Colombo area were just below 10 mg/L during lockdown season and rose up to 14 mg/L in the post-lockdown period. (Figure 2a,b). When considering the historical water quality variation patterns, in the corresponding lockdown month (June) in the past four years of 2016–2019 the average COD values downstream per year were in the range of 7.2–15.6 mg/L. However, the average COD value in the lockdown period of 2020 was reported at 5.6 mg/L as the minimum value for the last five years, indicating the reduction of contaminant load due to the lockdown. The lower average value of COD downstream was also reported in the post-lockdown period (September month) compared to the previous 5 years while breaking the increasing trend of COD from 2017 to 2019 (Figure 3). Historical BOD levels downstream confirm that the lowest values from the past 5 years of 2016–2020 were recorded in the 2020 lockdown period corresponding same month. Considering that there have been no recorded cases of temporary improvements in water quality in the Kelani River of Sri Lanka, we can conclude that the sudden improvement in water quality was directly attributed to the period of lockdown.
In the lockdown period, the maximum value of electroconductivity (EC) reported downstream near the Colombo area was 451 µS/cm. In the post-lockdown period, its highest value was at 581.58 µS/cm. In the downstream, it showed a much higher value compared to the middle stream and upstream (Figure 2c,d). Also, seawater intrusion may affect the EC values, especially in the sampling points located the near ocean area.
Post-lockdown period turbidity showed higher values (Figure 2e,f), which may be due to the high rainfall in September when compared to May and June.
In most of the sample sites in the middle stream and upstream, pH values were in the desired pH range according to WHO standards (Figures S1 and S2). The pH of the water samples varied from 6.00–6.50 at different times. River waters with a pH of 5.5 and below are particularly at risk [15]. The pH was considerably lower downstream of the basin, which may be due to microbial activity on the heavy loads of COD and BOD that originate from the different sewage and waste stream canals that join with the Kelani River, special in stagnate nature near the Colombo region.
General water quality indicators such as hardness and alkalinity that exceed (Table S5) the maximum accessible limits (MAL) given by WHO at a considerable number of sampling sites in Kelani River were observed. Trace metals were not observed in unexpected levels in the majority of surface water sampling sites except Fe, which exceeded the (MAL) of Fe, according to SLS standards.

3.1.2. Water Quality Index (WQI)

WQI can be considered as the measure of the quality of surface water and its spatial variation can be depicted by the mapping technique from the software ARCGIS 10.5 [16].
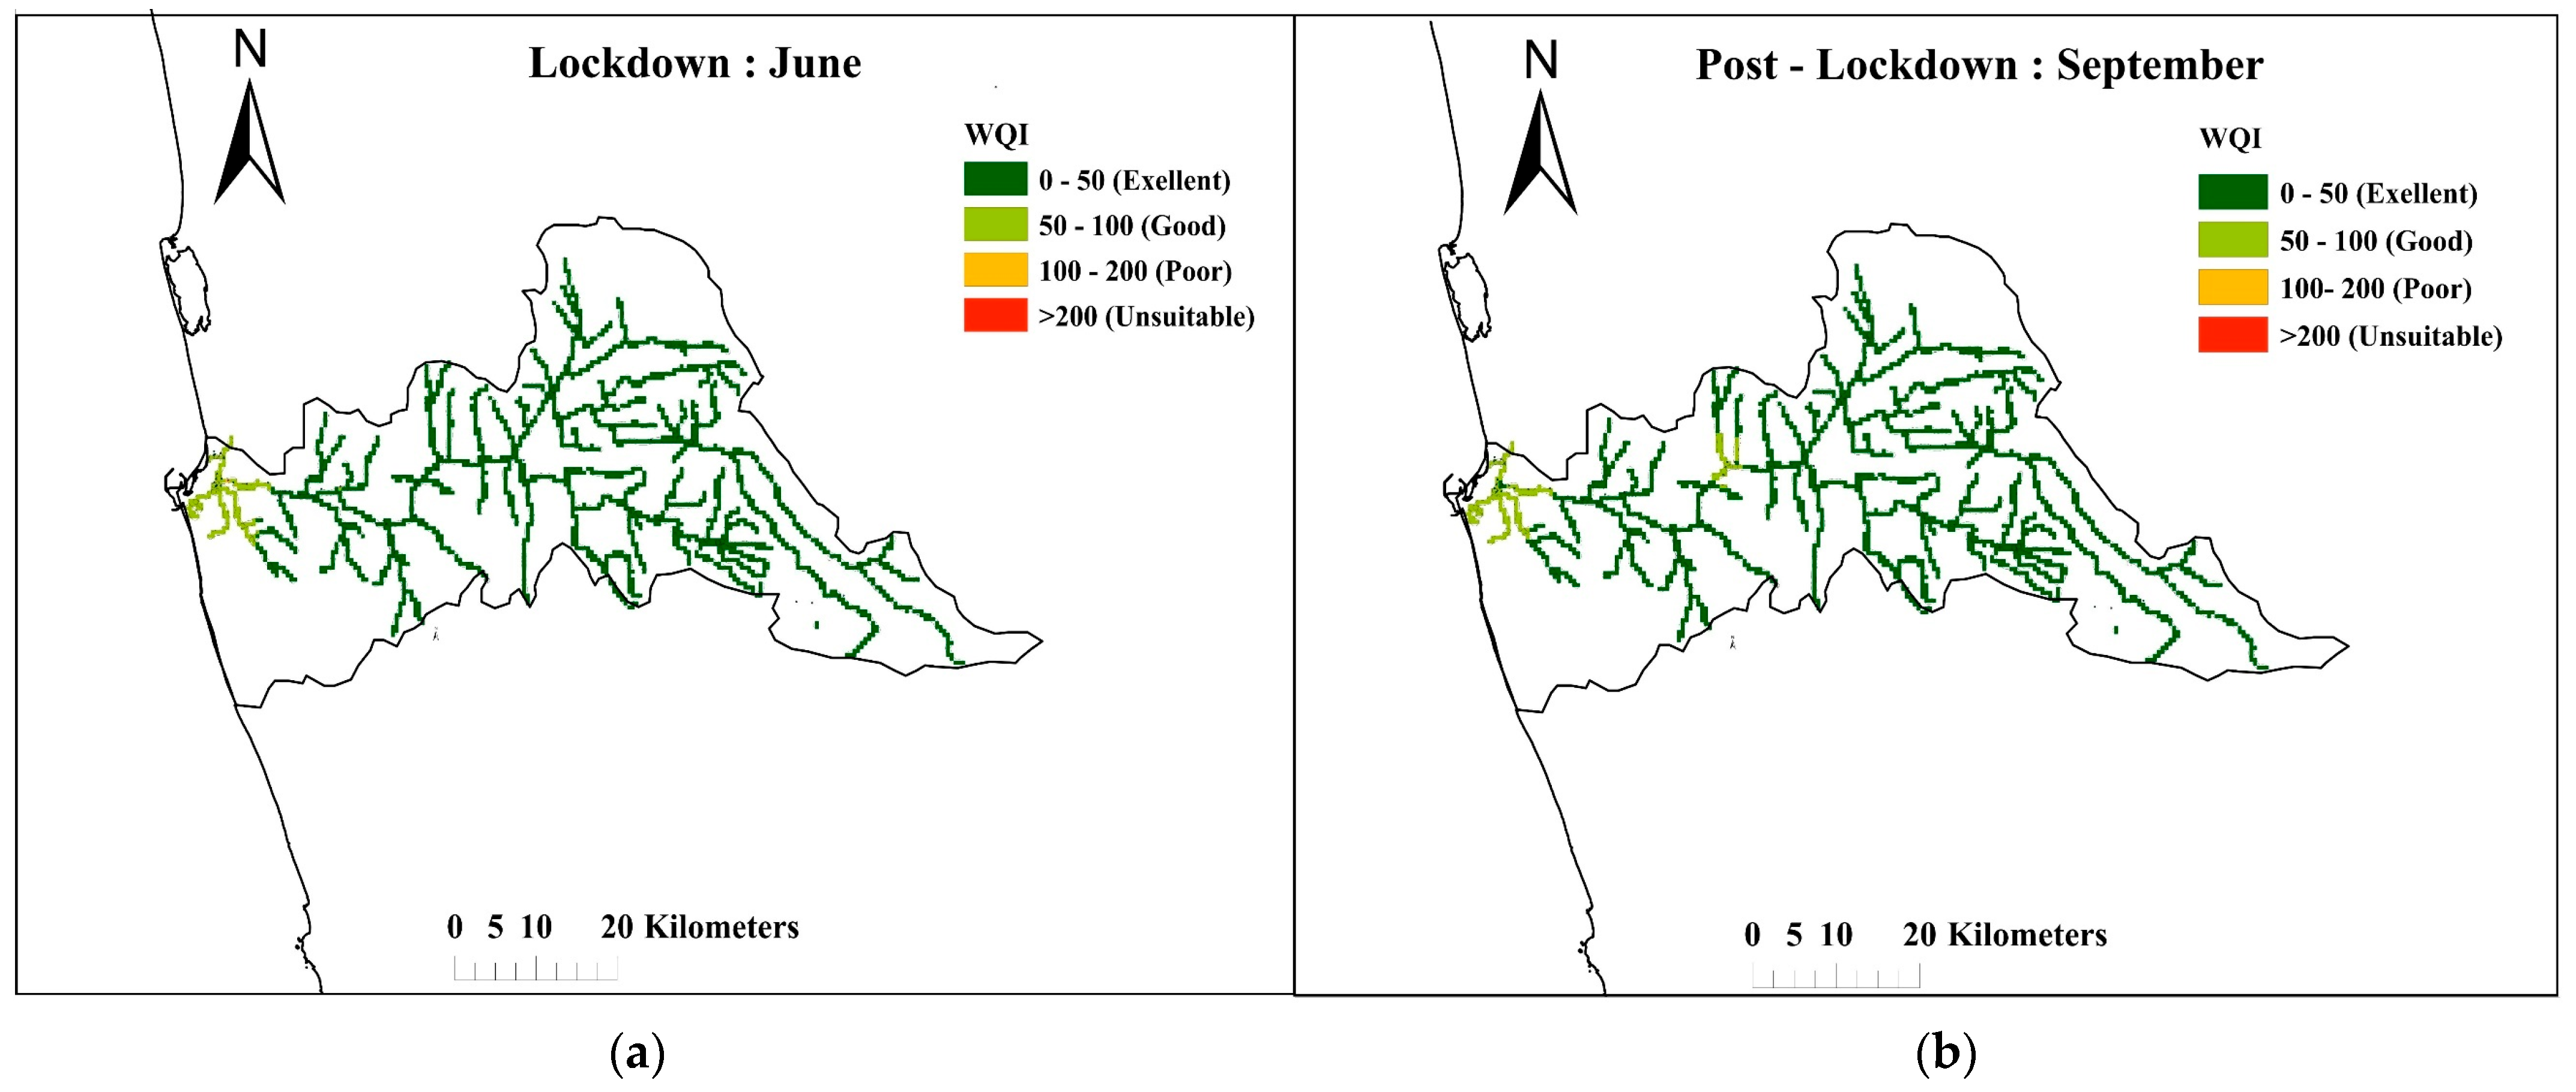
The WQI values Kollonawa Ela (S13) showed the highest WQI values in both seasons, whereas that of Nallathaniya (S60) located upstream of the Kelani River showed the lowest WQI values in both lockdown and post-lockdown seasons, respectively. We estimated that the near Colombo region had 18% progressively degrading water quality in the whole stretch of Kelani River after the lockdown period. The water quality of Kollonawa Ela, Japanese Friendship bridge (S6) in Mattakkuliya region was classified as poor water quality (WQI ranges of 76–100). The water near the prominent industrial zone called Seethawaka Export Processing Zone, Sri Lanka similarly fell into the category of “Poor” water quality in the middle stream of the Kelani River Basin. Moreover, it was a huge perception that regardless of the water quality of Kelani River Basin, the majority of the areas were of good quality, especially in the upstream area, but WQI values in the downstream and the middle stream were seen as extremely near bad water quality. As shown in Figure 4, the water quality of Kollonawa Ela, Biyagama export processing zone, and Seethawaka export processing zone showed poor quality (WQI ranges 76–100) and that at Kollonawa Ela and many sub-branches near the Colombo area were evaluated as unsuitable for human drinking (WQI over 100). In the Kelaniya town area, the waterway is isolated into two streams and the streams’ flow is somewhat low.

3.1.3. Hydro-Chemical Type

Most of the samples showed a dominance of Ca2+ and Na+, K+ ions, as indicated by their location in the lower center of the triangle in the cation section (Figure 5). However, some samples from the tributaries showed higher levels of Na+ concentration. This can generally be attributed to local human activities contributing to the increased Na+ concentrations in the water bodies [17]. Furthermore, Ca2+ and Mg2+ concentrations notably increased during the lockdown, possibly caused by the lower concentrations of K+ and Na+ ions, which consistently signified the reduction of anthropic inputs in the lockdown season (Figure 5).
As shown in Figure 5, the anion section depicts most of the water samples during lockdown in the bottom left corner near the HCO3 section, but most of the water samples after the lockdown contained some Cl, showing a lot of human activity around the Kelani River, especially near the end of the river. The diamond in the center shows that there are similar amounts of one type of salt (Na+) and another type of salt (Ca2+) but there are more strong acids (Cl and SO42−) than weak acids (HCO3).
Furthermore, the highest levels of Cl in the central urban areas of the Colombo region can be attributed to the discharge of solid and liquid waste from nearby settlements, cremation sites, and religious sites in Sri Lanka [3]. In the lockdown season, samples can be classified as follows: 71% Ca-HCO3 type, 19% Ca-Cl type, and 10% Na-Cl-SO42− type (Figure S3). In the post-lockdown season, water samples were characterized by a mixture of 60% Ca-Cl type, 30% Ca-Mg-Cl, and 10% Ca-Cl-SO42− type. In the lockdown season, 5% of the sampling points downstream of the Kelani River moved to the intrusion range, whereas in the post-lockdown season, 20% of samples moved to the intrusion level.

3.1.4. Sodium Adsorption Ratio (SAR) Analysis

Irrigation water is divided into four groups based on SAR values (low, medium, high, very high), representing water quality conditions that are completely suitable, moderately suitable, marginally suitable, and unsuitable for agriculture, respectively [18,19], e.g., high SAR values mean there is a greater risk for crops and drinking water. The Wilcox diagram (Figure S3) was used to depict the water quality more accurately [20]. A total of 92% of sampling sites of the mainstream of the Kelani River were in C1S1 and C2S1 sections indicating the water was completely suitable for irrigational purposes in the Kelani River Basin because most of the samples during lockdown and post-lockdown seasons were categorized in the C1S1 section and the C2S1 section, respectively.

3.2. Impacts of Lockdown on Water Quality

3.2.1. Water Quality Changes in the Kelani River in Pre-Lockdown, Lockdown, Post-Lockdown Seasons

During the lockdown period, there were fewer human interventions in the river system due to the imposed restrictions all over the country, and the water quality in the Kelani River Basin was improved correspondingly as shown in Figure 6. As a result, the concentrations of biological oxygen demand (BOD) and chemical oxygen demand (COD) exhibited significant variations both spatially and temporally in the Kelani River Basin. The average concentration of BOD downstream during the pre-lockdown season was nearly 10.85 mg/L and suddenly dropped to 5.6 mg/L in the lockdown season and rose to 7.94 mg/L during the post-lockdown season, respectively (Figure 6). Furthermore, BOD values of the middle stream and upstream also showed a similar downward trend in the lockdown season when compared to other seasons, but there was not a significant change like that in the downstream. The average COD concentration downstream decreased from 15.38 mg/L in the pre-lockdown to 5.45 mg/L in the lockdown period and rose to 14.8 mg/L in the post-lockdown season, respectively, and COD was compared to the downstream. The highest concentrations of COD and BOD were observed from the highly populated areas of the Kelani River Basin especially in the Kollonawa area and near the Biyagama Export processing zone where a dense population and several industries are located in Sri Lanka. These results provide strong evidence of large-scale water contamination in the Kelani River Basin due to organic waste and industrial effluents.
As shown in Figure 6 and Figure S4, the EC dropped downstream indicating a significant decrease in the concentration of dissolved substances in the river water during the lockdown season, but it rose to a higher value in the post-lockdown season indicating water quality deterioration. Based on the mean values (mg/L), the cationic dominance pattern in the Kelani River Basin followed a specific order of Ca2+ > Na+ > Mg2+ > K+. During the pre-lockdown period, the combined contribution of Ca2+ and Na+ accounted for approximately 65% of the total cationic concentration. In the post-lockdown period, their combined contribution increased to around 76% of the total cationic concentration. The concentrations of total dissolved solids (TDS) in both the Kelani River and its tributaries were found to be significantly lower during the lockdown (p ≤ 0.05) than those during the pre-lockdown (Figure S4). This decrease in TDS can be attributed to reduced pollutant discharge during the lockdown period. Overall, the water quality in the Kelani River Basin was found to be poor, particularly in the downstream areas, when compared to the guidelines set by the World Health Organization (WHO). The pH values of the Kelani River are in the range of 6.5–8.5, meeting with requirements of the Sri Lankan Water Quality [14] and WHO Drinking Water Guidelines (4th edition) [21], though a slight increase in pH suggested a reduced presence of chemicals during the lockdown. The turbidity value had noticeably decreased to 12.18 NTU in the lockdown season and rose to 34.10 NTU in the post-lockdown season in the downstream Kelani River (Figure S4).

3.2.2. Statistical Analysis

The significance of water quality parameters, including COD and BOD, was analyzed using the non-parametric Kruskal–Wallis test across three regions: upstream, middle stream, and downstream. The results indicated notable differences between the downstream and middle stream, suggesting that the presence of wastewater-generating industries in the Kelani River Basin, following the uplift of COVID-19 lockdown measures, directly impacted water quality in the downstream region (Table S6).
Pearson correlation revealed that during the lockdown season, there is a strong positive relationship between turbidity and EC, as well as a strong relationship between turbidity and BOD, Ca and Mg, Ca and Sr, Al and Cl, Mn and Cl, Ba and Sr in both seasons. This may be due to anthropogenic activities and major surface runoff.
There were many research articles on water quality analysis using multivariate statistical analysis [22,23,24]. The results of PCA during the lockdown period can be seen in Figures S6 and S7. The correlation matrix was also examined to validate the results of PCA and understand the relationships among the hazardous elements [24]. Three principal components, namely PC1, PC2, and PC3, were extracted for the Kelani River water samples from upstream to downstream. The initial PC1 had positive loadings for pH, Br, Cl, and F, indicating their high influence on water quality. The presence of Ni and Cd in the PC1 loadings during the lockdown period suggested contamination from human activities, such as wastewater discharge from homes and industries, contributing to water pollution [25].

3.3. Changes in Halides and Nitrate

3.3.1. Cl/Br Ratio in the Kelani River Basin in Lockdown and Post-Lockdown Seasons

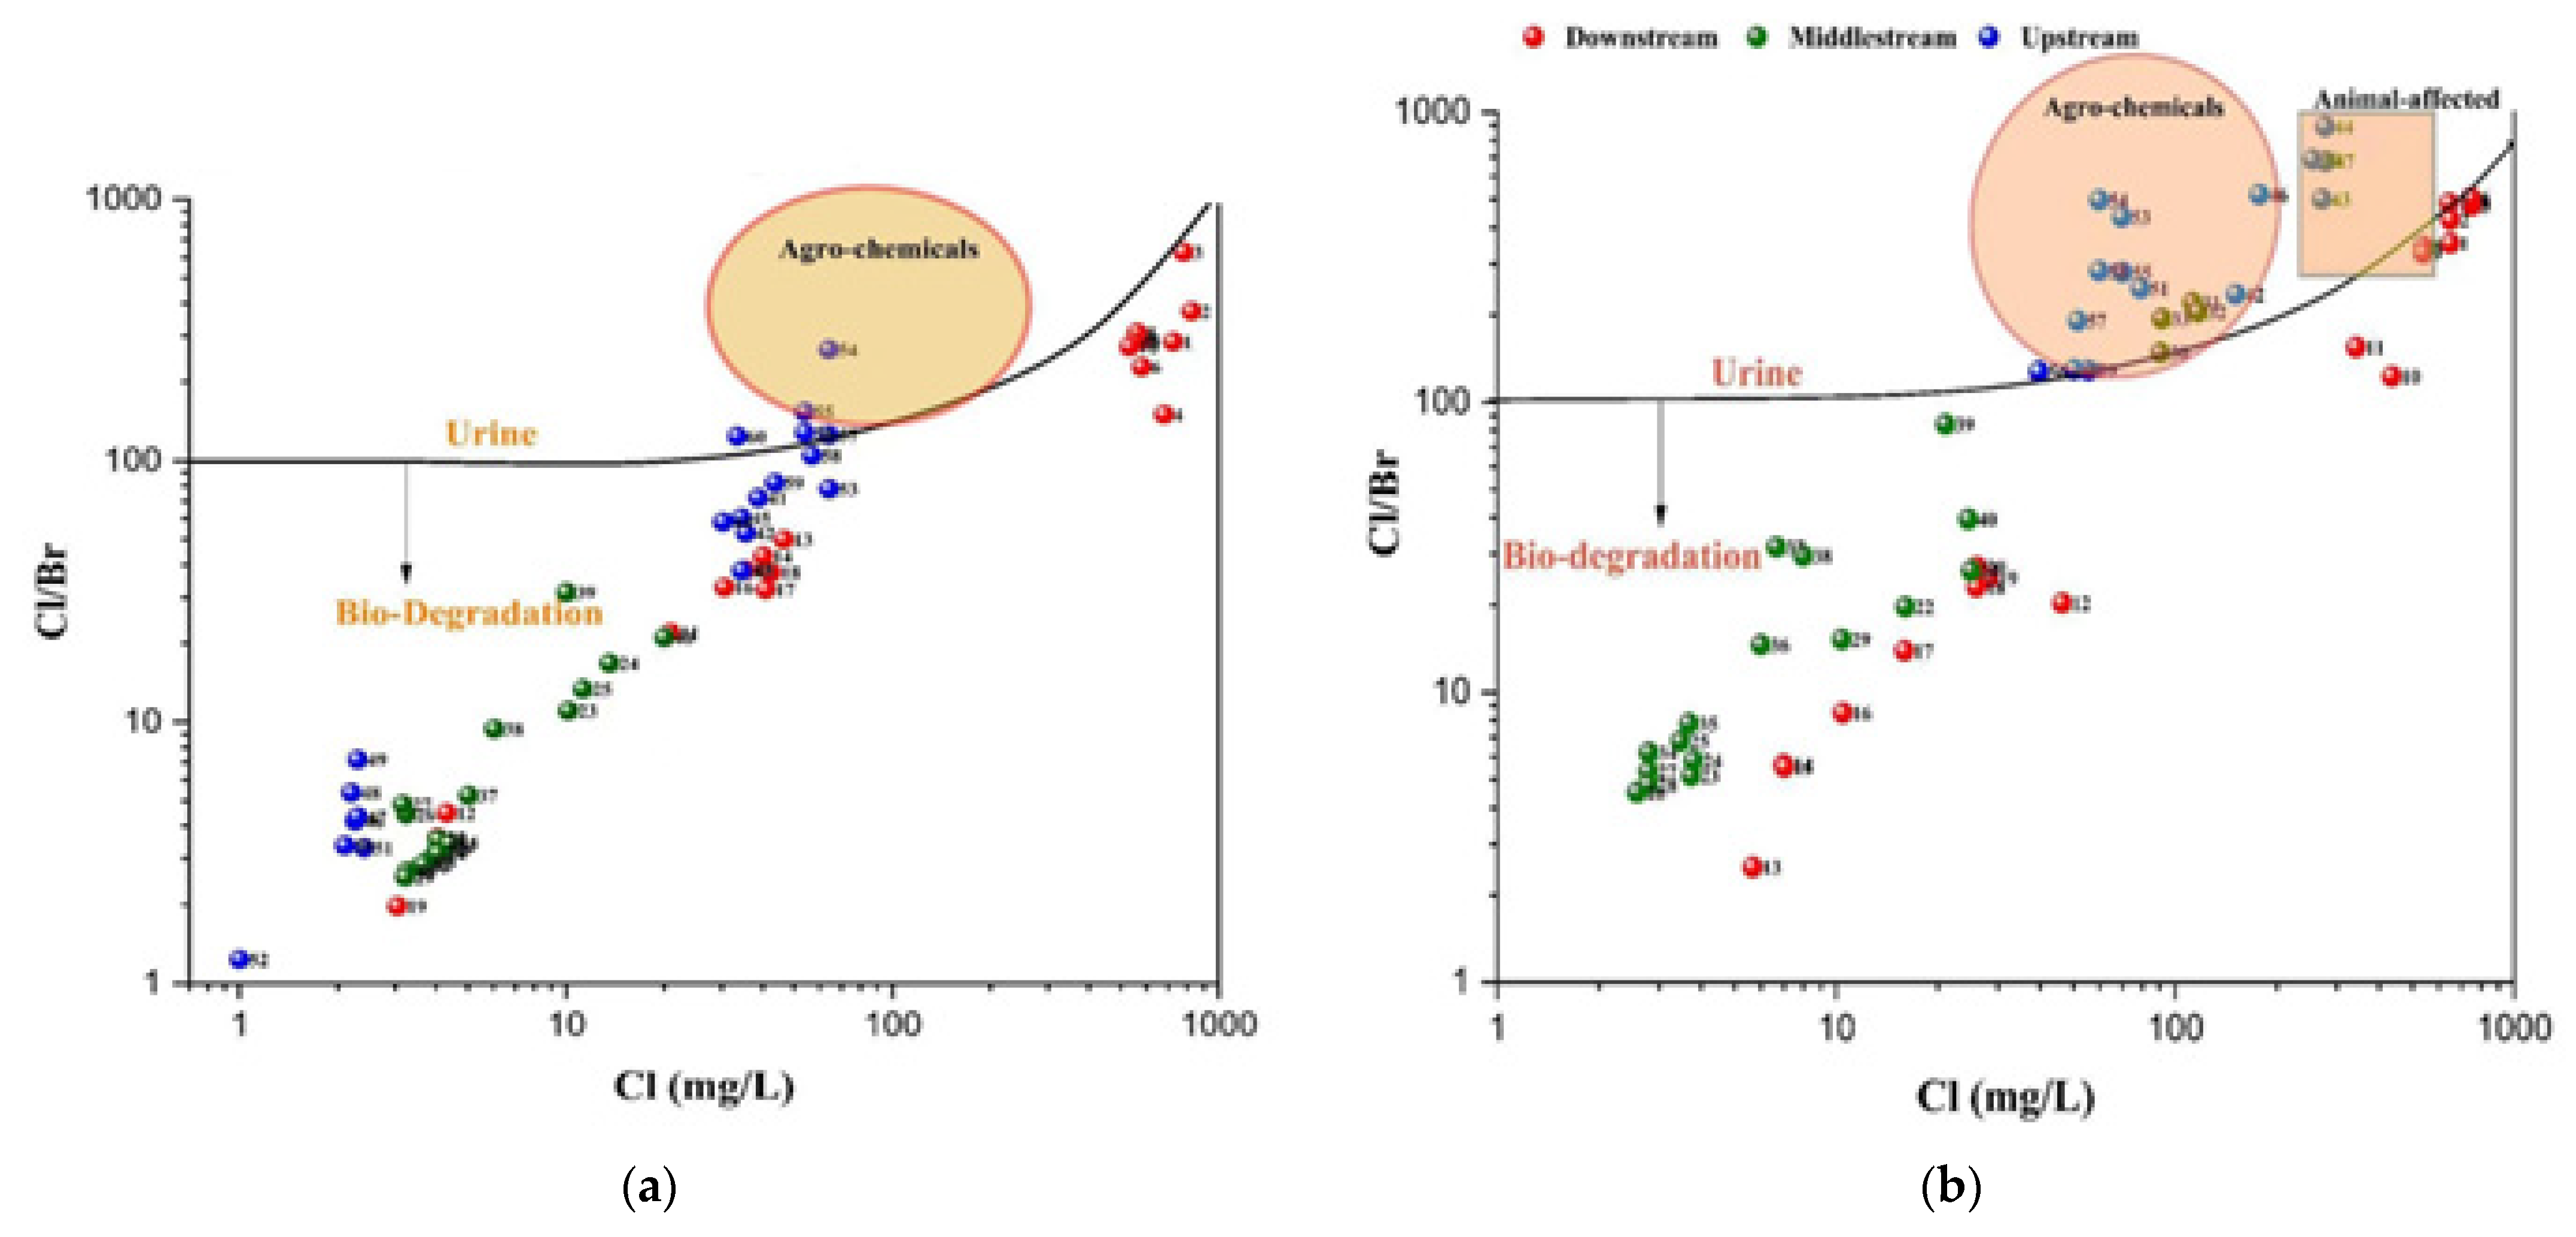
The ratio of Cl/Br has been used in numerous studies as a way to track wastewater pollution [26,27,28,29]. However, this ratio can be influenced by various factors that differentiate from one region to another [26]. For example, inland water has Cl/Br proportions in the range of 75–200, domestic and industrial wastewater in the range of 300–600 for Arizona, and in the range of 410–870 for Israel [30]. Whereas values for biodegradation fall under values below 100. Proportions for halite change are somewhere in the range of 1000–10,000 [27], while agrochemicals produce values somewhere in the range of 100–1200 with landfill leachates, animal impact, and agrochemicals [28].
Proportions of Cl/Br in surface water in the Kelani River Basin were compared with its proportion of Standard Mean Ocean Water (SMOW). The Cl versus Cl/Br ratio of surface water from the near Colombo district was impacted via seawater interruption in view of the Cl/Br proportion is around 288 (seawater convergence of Cl = 19,352 mg/L and Br = 67.3 mg/L). Surface water with Cl/Br proportion like that of SMOW is impacted via seawater interruption [31]. Surface water with a Cl/Br ratio higher than that of SMOW is probably determined by the blending of domestic wastewater, and assuming this ratio is beneath SMOW, it is obtained from the rural exercises. According to the downstream locations of the Kelani River Basin, the Cl/Br ratios of sampling locations from 1–10 are compatible with the SMOW ratio (Figure S5). According to the values suggested by [28], sampling sites 2 and 3 (Figure 7a) located downstream of the river near the Kelaniya area were under the category of domestic wastewater whereas sampling sites S54, S55, and S51 located upstream were under the agro-chemicals category. In the lockdown season, only sites of S2 and S3 fell to the agro-chemical pollutant ratio level. However, in the post-lockdown season (Figure 7b), many sampling sites were under ratio (Cl/Br ratio > 300) of the domestic wastewater, agro-chemicals, and industrial effluents due to the industry operation and anthropogenic activities. According to these values, Kelani River water was contaminated hugely by many effluents. A number of the samples shifted to the industrial/domestic wastewater region in the post-lockdown season in comparison to the lockdown season in the Kelani River. According to the values in the middle stream in both seasons, most of the sampling sites fall under the bio-degradation and inland rainwater ratio. Only very few sampling points were above the bio-degradation in the post-lockdown season region due to few industries in that region. The upstream region of the Kelani River Basin located in the hill country region falls under bio-degradation and inland rainwater region in lockdown season. However, in the post-lockdown season, the Cl concentration in sampling points rose to a higher level, and there was significant variation in ratios with respect to the lockdown season. Most of the values fall under the agro-chemical, animal leachate wastewater region. In Sri Lanka, most of the land in hill country is used for tea and crop production and those effluents from many inorganic fertilizers and insecticides may directly run off to surface water in the post-lockdown season because these activities in lockdown season were banned [30].

3.3.2. Nitrate and the Ratio of Cl/NO3

Based on mean values, the order of anionic concentrations was observed to be Cl > SO42− > NO3 > PO43−. The dominant anion in the water samples was chloride (Cl) which accounted for 64% during the pre-lockdown period and decreased to 52% and 45% during the lockdown and post-lockdown periods, respectively. The higher Cl concentration in the downstream zone as compared to the middle stream and upstream could be due to various reasons such as sewage discharge, agricultural runoff, and seawater intrusion. The concentrations of NO3 and SO42− were found to be much higher in the downstream area, possibly caused by sewage discharge and agricultural runoff. The PO43− was found as the least abundant anion throughout the basin in terms of downstream, middle stream, and upstream. This study found that changes in the chemicals in the Kelani River downstream were mostly caused by human activities, and the lower concentrations of hydro-chemical parameters observed during the lockdown season clearly depict the effects of the lockdown in the central urban area.
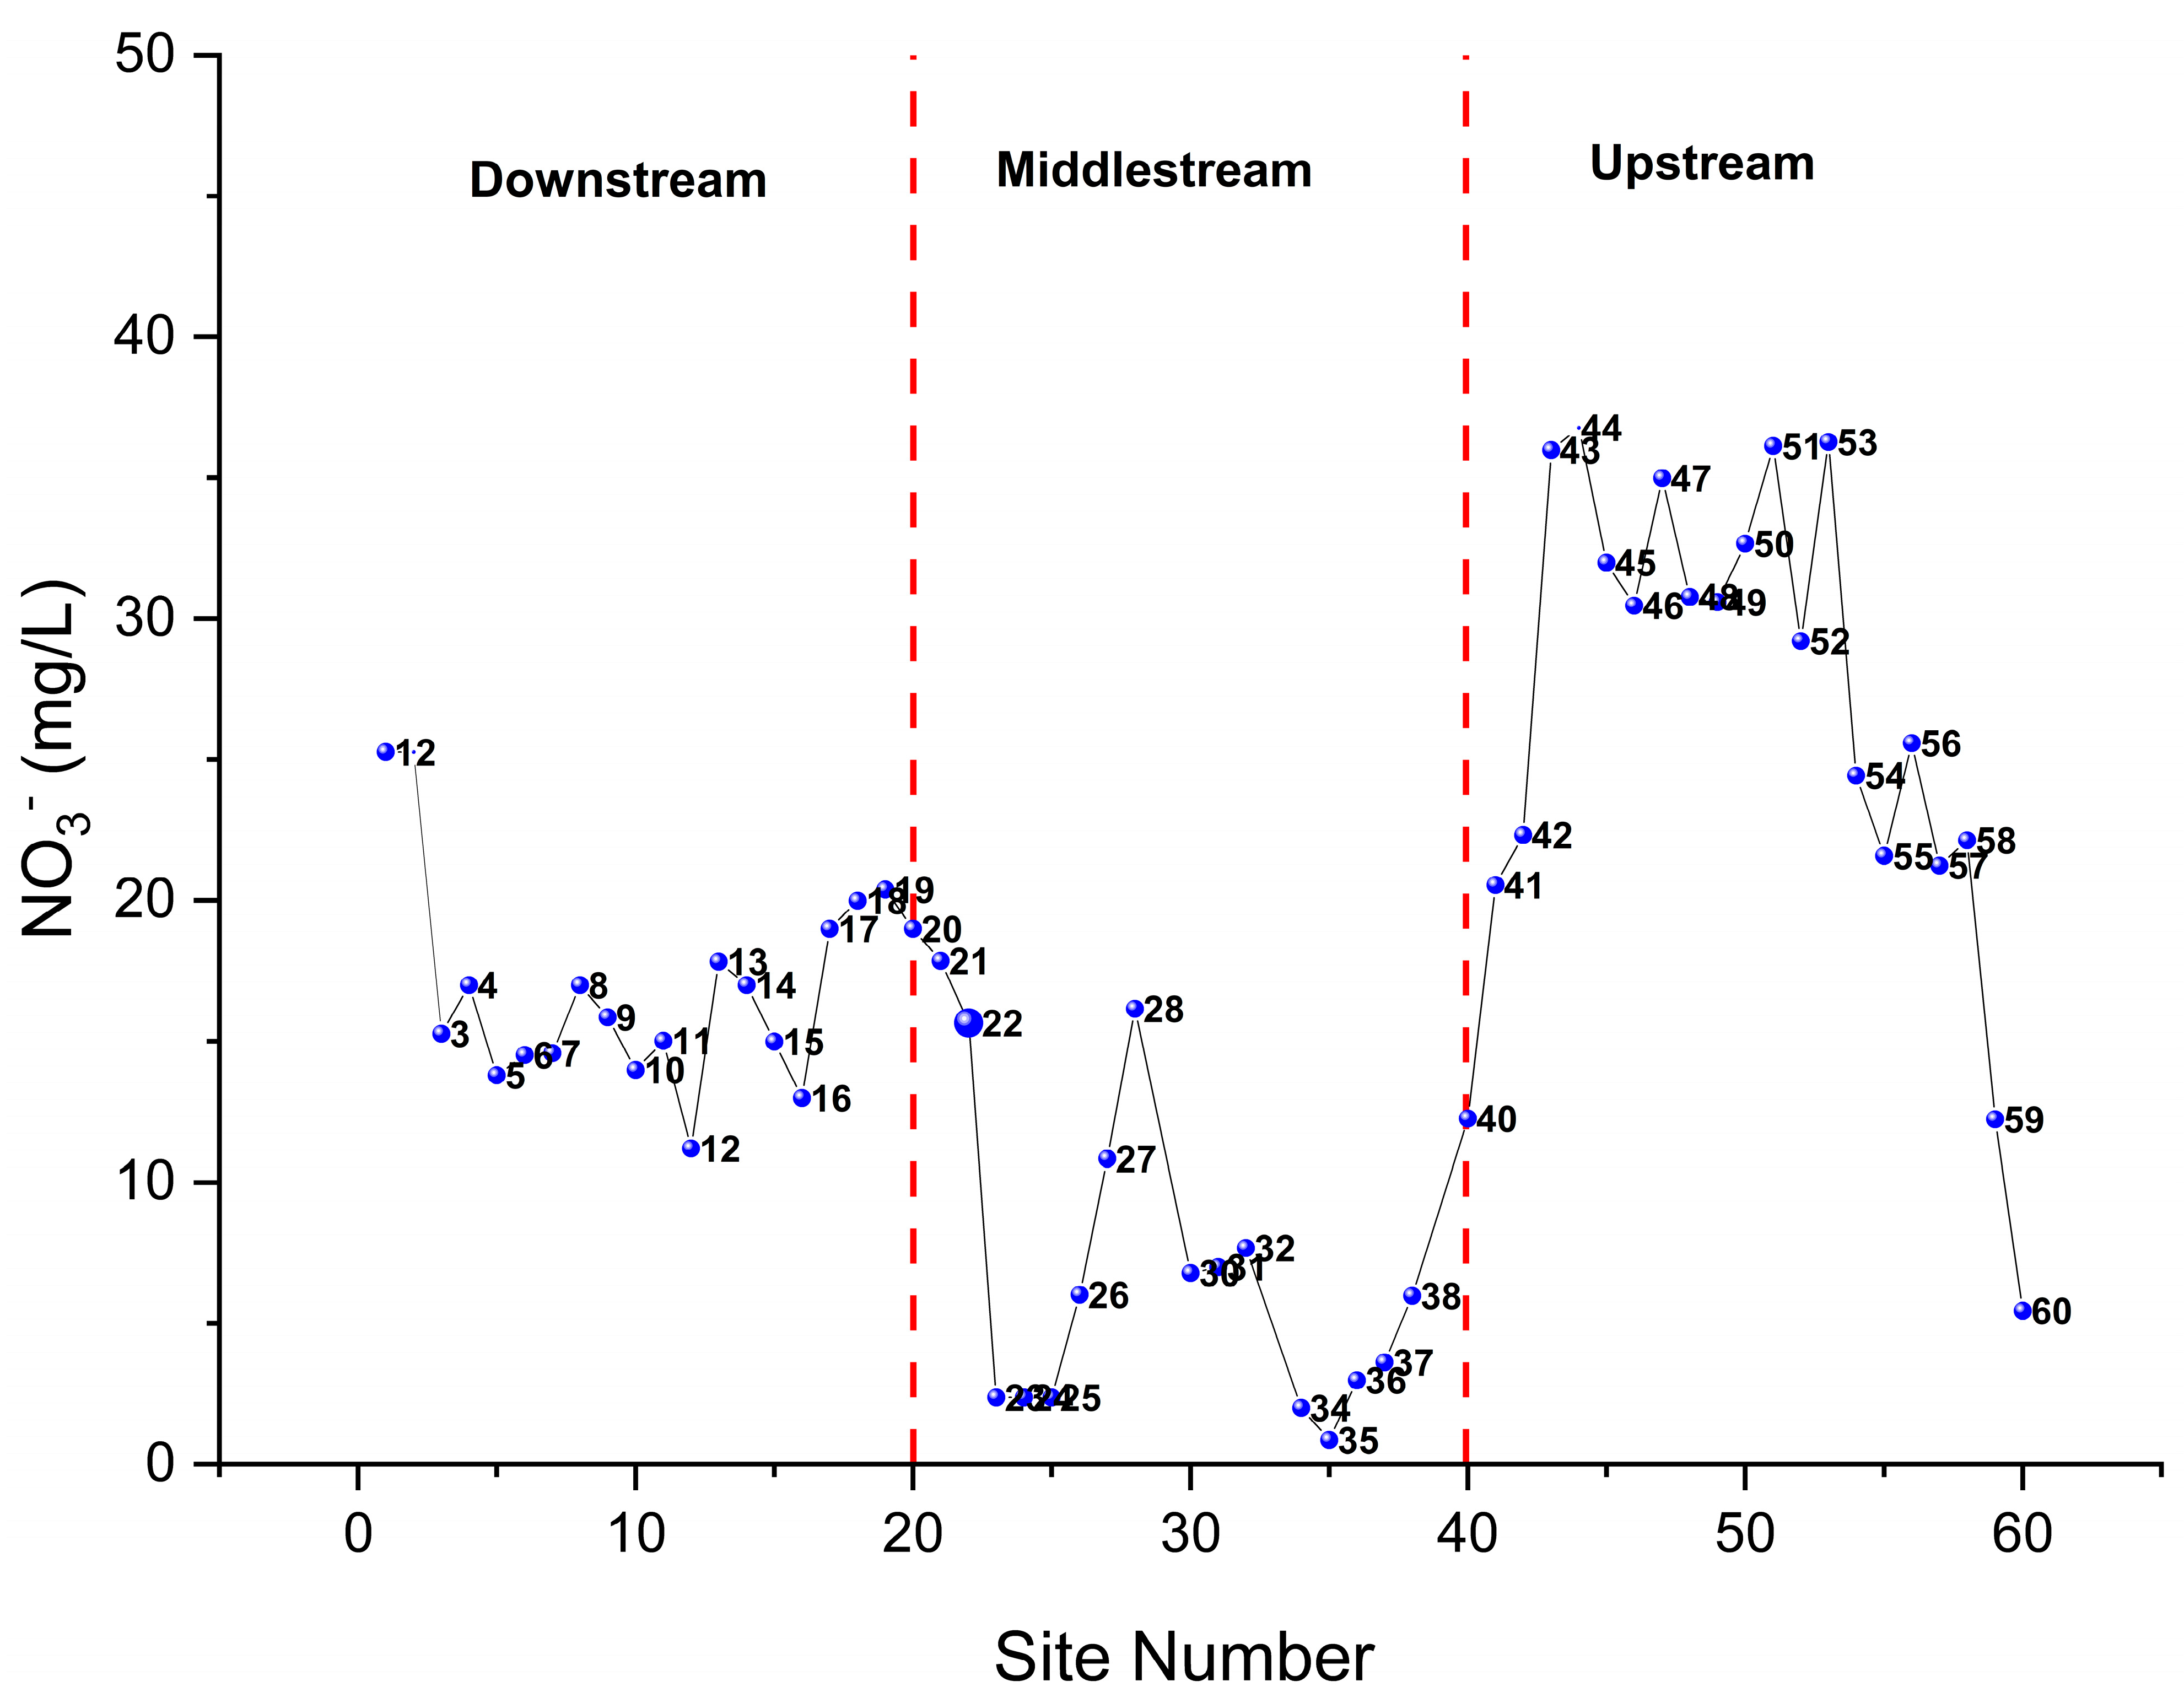
The ratio of Cl to NO3 is of significant importance when identifying pollutant sources for the river. The sampling points (Site 51, 52, 53) in the upstream region of Kelani River exhibited the highest concentrations of nitrate, surpassing the standards set by the World Health Organization (WHO) [21] (Figure 8). It can be noted that this may be due to the excessive use of fertilizers and insecticides in that hill country region in Sri Lanka. Nitrate contamination occurs mostly through the surface runoff of insecticides, fungicides, and agricultural fertilizers in surface water [32]. According to the land use pattern in the Kelani River Basin (Figure S8), the upstream region is mostly used for tea cultivation, and nitrate leaching to the water bodies through surface runoff can occur [33]. Further, investigation is needed in the future to depict the reasons for the observed lowest nitrate concentration downstream.
When considering the correlation of nitrate and chloride concentration as suggested by the previous study [34], along the basin, upstream shows moderate correlation with the nitrate and chloride with respect to Pearson correlation (P = 0.496). Nitrate pollution can occur in various locations, including groundwater and surface water such as lakes and rivers. It can result from various sources, such as leaky septic tanks, the use of fertilizers in farming, improper waste disposal in garbage dumps, leaks in sewer pipes, the runoff of animal waste from farms, and the use of animal manure in home gardens [35].The study observed a close relationship between NO3 (nitrate) and Cl (chloride) in the studied area, as shown in Figure S9. This suggests that nitrate found in surface water may originate from sources such as animal and human waste, as well as agricultural activities. Another research study indicated that higher nitrate levels are associated with increased chloride levels, primarily due to the presence of septic tanks [36].

4. Discussion

4.1. Water Quality Changing Patterns in the Downstream of the Kelani River

4.1.1. Poor Water Quality in the Downstream of the Kelani River

The water quality index (WQI) is a numerical expression used to assess the overall quality of water in a particular area or location. It provides a standardized and simplified way to measure and communicate the water quality from various sources such as rivers, lakes, reservoirs, and groundwater. These results revealed that downstream of the Kelani River is more vulnerable and more sensitive to contamination while showing the highest COD and BOD values in both periods. Deteriorated water with elevated levels of COD and BOD in the Colombo region (downstream) in both lockdown and post-lockdown periods, could be due to the proximity of oil storage facilities and petroleum waterways near the Kollonawa Canal region, as well as instances of oil spills into the surface water. The WQI values of two sampling points, namely Hamilton Canal and Kollonawa Canal, fell into the “poor” category after the lockdown season. During the lockdown season, 95% of the downstream sampling points fell into the “Good” category, whereas in the post-lockdown season, 82% of the sampling points fell into the “Good” category. However, WQI values of almost all locations rose to higher values in the post-lockdown season. The population near the Kollonawa Canal area was very high and petroleum storage tanks were very close to this Kollonawa Canal; this may be the reason for poor water quality in this canal.
Additionally, leakages from numerous dump sites in the canal areas, as well as the direct discharge of untreated domestic and industrial wastewater into the waterway, may contribute to this situation [12,34]. So industrial activity is straightforwardly associated with the contamination level of the river. The lowest DO was found at Kollonawa Ela (0.60 mg/L) because of high BOD and COD concentrations. Hence, aquatic life would be threatened by the lower DO level originated due to the higher organic load. It could be harmful to the economy of regional communities depending on the Kelani River fish harvesting and aquaculture. Thus, controlling the anthropogenic release of COD and BOD load would be sustainable. The hydrochemistry of the Kelani River Basin during the lockdown season can be classified as the Ca–HCO3 type. However, a notable shift was observed in the hydro-chemical facies of the Kelani River water samples during the post-lockdown season. The water samples were characterized by a mixture of Ca-Mg-Cl and Ca-Cl types, indicating that anthropogenic activities had a significant influence on the major ion composition.
In the post-lockdown period, especially in the downstream region, Ni and Cd had the highest loadings in PC1 (0.701 and 0.768, respectively), indicating that their sources did not decrease during the lockdown. The highest loading in PC3 for Pb, As, and Cu remained consistent throughout the study (Figures S6 and S7), suggesting diverse sources of pollution. Urban waste leachates, including nickel–cadmium batteries from vehicle workshops, battery recycling, smelting facilities, and other sources could contribute to lead contamination in aquatic water. EC and hardness were decreased in the lockdown season, 6.54–651.2 µS/cm, 43.07–1721.25 mg/L, but rose to 6.87–651.2 µS/cm and 77.26–2463.11 mg/L, respectively, in the post-lockdown season. Essential hotspots for conductivity and TDS may be due to land use patterns, private overflow, and point source water contamination released from businesses like battery assembling and elastic and calfskin ventures [5]. Also, seawater intrusion may cause the highest level of EC. The water quality in Kollonawa Ela and Hamilton Canal region downstream (Site 13,1) was poor for drinking due to high concentrations of pH, BOD, COD, EC, and TDS because they are situated in the most promoted and industrialized region in Colombo and the huge population living around here utilize this surface water hotspot for their day-to-day exercises.
The poor water quality can be attributed to various factors such as stagnant water, agricultural runoff, cattle washing, open defecation, and disposal of animal remains. Our study suggested that the downstream water quality was below standard and not suitable for drinking water use.

4.1.2. Water Quality Changing Patterns in the Middle Stream and the Upstream of the Kelani River

Nallathanniya and Seethagangula sampling sites in the upstream region (Site 59,60) are source water areas situated in the head region close to the Adams Peak Mountain range encompassing with tea state. During the blustery season, composts and pesticides blend in with downpour water and filter through the dirt into the spring water. The Norwood sampling point (Site 55) is a water supply source that is utilized for drinking and used for hydropower purposes. Maskeliya (Site 56), situated in the upstream region, is also a natural water source. It serves water for approximately 300 households to meet their daily water requirements and activities. Further, Norton (Site 54) recorded the lowest pH (6.01) and total dissolvability [37] along these lines.

4.2. Possible Reason for Water Quality Improvements during Lockdown Season

Less Human Activities

Human activities have a significant impact on the water quality in Sri Lanka. Modern activities play a significant role in introducing NH4+ and COD into numerous waterways. Therefore, the COVID-19 lockdown resulted in a unique period where numerous human activities were reduced. Industries were shut down, people stayed at home, and railway transportation decreased leading to improved water quality by reducing sewage discharges. Several studies confirmed that environmental pollution decreased during the lockdown season in countries such as China and India [32,38].

4.3. Policy Suggestions to Alleviate Water Pollution

Studying water quality during the COVID-19 lockdown helps us find ways to improve it in extreme and normal economic conditions. Strategies to reduce pollutants can be targeted to address water quality issues. (1) More consideration should be paid to the decrease in waste releases in thickly populated regions like Colombo and Gampaha. Areas with higher population density within Colombo city in terms of NH4+-N and COD received more pollutants from human activities compared to less densely populated areas like the middle stream and upstream of the Kelani River. Therefore, it is essential to decrease waste releases in rapidly urbanizing areas and prioritize the construction of sewer and wastewater treatment plants in order to protect river water quality. (2) Different regions should use different pollution reduction methods based on their development and the size of the population. While the impact of pollution reduction during the COVID-19 lockdown on various water quality indicators was mixed, pH, DO, and COD returned to normal levels after the lockdown in June 2020. This can be partly explained by some regions ending their lockdowns before May, and in some cases as early as late August. Additionally, the quick economic recovery resulted in the release of a significant amount of wastewater as lockdown measures were lifted.

5. Conclusions

This study investigated the impacts of the lockdown on the Kelani River Basin in Sri Lanka, regarding the significant global impacts of the COVID-19 pandemic. The outcomes showed an improvement in the water quality in the Kelani River Basin during the lockdown stage when contrasted with the post-lockdown status. It can be noted that water quality downstream of the Kelani River Basin was greatly improved during the lockdown season, and the poor water quality changed into moderately better quality in both the mainstream and tributaries during the lockdown season. This study presents a unique and invaluable opportunity for researchers and scientists to comprehensively understand the magnitude and extent of the impact of human activities on natural water bodies effortlessly. Typically, it is challenging to suspend human activities in a heavily urbanized area of such a large scale solely for the purpose of studying river water quality without human intervention. The COVID-19 lockdown unexpectedly gave researchers a unique opportunity to study water quality without significant human activities. This situation allows them to understand the real impact of human actions on natural water bodies without deliberate intervention. Similarly, the water quality of the Kelani River Basin was found currently safe in both lockdown and post-lockdown periods from the irrigational point of view by the SAR analysis. However, even after the post-lockdown improvements, the water in the downstream area of the Kelani River Basin is still not safe for drinking. The COVID-19 lockdown did contribute to some restoration of water quality, but more efforts are needed to make the water suitable for consumption.
Overall, it is possible to quickly restore highly polluted river systems by reducing human activities and interventions. Efficient management of wastewater and solid waste, impartial government involvement, and the effective implementation of policies are crucial in addressing practical challenges. Additionally, incorporating new urban development plans that prioritize mitigating water pollution in natural water bodies is essential.

Supplementary Materials

The following supporting information can be downloaded at: https://www.mdpi.com/article/10.3390/w15213785/s1, Figure S1: pH change of the Kelani River basin in Sri Lanka in the lockdown season; Figure S2: pH change of the Kelani River basin in Sri Lanka in the post-lockdown season; Figure S3: Wilcox diagram of two seasons of the Kelani River basin in Sri Lanka; Figure S4: Water quality of key parameters of Kelani River during lockdown and post lockdown seasons; Figure S5: Sea water intrusion in Kelani River in lockdown season; Figure S6: 3D scatter plot of values obtained by PCA analysis (Lockdown period); Figure S7: 3D scatter plot of values obtained by PCA analysis (Post lockdown period); Figure S8: Land use pattern map of the Kelani River basin in Sri Lanka; Figure S9: Corelation between chloride and nitrate in the upstream region of the Kelani River basin in post lockdown season; Figure S10: Spatial Variation of Rainfall in the Kelani River basin in May-September 2020; Table S1: Sampling sites of Kelani River basin; Table S2: CEA sampling sites in the Kelani River Basin; Table S3: Classification of surface water according to WQI values; Table S4: Assigned and relative weight for WQI computation with Sri Lankan standards; Table S5: Comparison of surface water quality with the WHO and SLS drinking water standards; Table S6: Statistical comparison of pre lockdown, lockdown and post lockdown seasons.

Author Contributions

Conceptualization, Y.W. and I.Y.; methodology, I.Y.; software, S.I.; formal analysis, I.Y.; investigation, I.Y., S.I. and B.R.; writing—original draft preparation, I.Y.; writing—review and editing, S.I. and Y.W.; supervision, Y.W., K.B.S.N.J., R.W., S.K.W. and M.M.; project administration, Y.W.; funding acquisition, Y.W. All authors have read and agreed to the published version of the manuscript.

Funding

This research was funded by the Joint Research Program of the National Natural Science Foundation of China and the National Science Foundation of Sri Lanka (NSFC-NSF SL) (21861142020); the Alliance of International Science Organizations Collaborative Research Program (ANSO-CR-KP-2020-05); the Master Fellowship Program (Fellowship No. 2019BRF040); the Program of China–Sri Lanka Joint Center for Water Technology Research and Demonstration by the Chinese Academy of Sciences (CAS); and the China–Sri Lanka Joint Center for Education and Research by the CAS.

Data Availability Statement

Data is contained within the article or Supplementary Materials.

Acknowledgments

The administrative staff of the education department of RCEES, especially Shan Fu and Hui Zhong are thanked for their various inputs during the study.

Conflicts of Interest

The authors declare no conflict of interest.

References

  1. Saadat, S.; Rawtani, D.; Hussain, C.M. Environmental perspective of COVID-19. Sci. Total Environ. 2020, 728, 138870. [Google Scholar] [CrossRef]
  2. Yunus, A.P.; Masago, Y.; Hijioka, Y. COVID-19 and surface water quality: Improved lake water quality during the lockdown. Sci. Total Environ. 2020, 731, 139012. [Google Scholar] [CrossRef] [PubMed]
  3. Mahagamage, Y.; Mahagamage, M.G.Y.L.; Manage, P.M. Water Quality Index (CCME-WQI) Based Assessment Study of Water Quality in Kelani River Basin, Sri Lanka. 2014. Available online: https://www.researchgate.net/publication/281223991 (accessed on 2 November 2022).
  4. Mahagamage, M.; Chinthaka, S.; Manage, P.M. Assessment of water quality index for groundwater in the kelani river basin, sri Lanka. Int. J. Agric. Environ. Res. 2016, 2, 1158–1171. [Google Scholar]
  5. Qadir, A.; Malik, R.N.; Husain, S.Z. Spatio-temporal variations in water quality of Nullah Aik-tributary of the river Chenab, Pakistan. Environ. Monit. Assess. 2008, 140, 43–59. [Google Scholar] [CrossRef]
  6. Mahagamage, M.G.Y.L.; Pathirage, M.V.S.C.; Manage, P.M. Contamination Status of Salmonella spp., Shigella spp. Water 2020, 12, 2178. [Google Scholar] [CrossRef]
  7. Kottagoda, S.D.; Abeysingha, N.S. Morphometric analysis of watersheds in kelani river basin for soil and water conservation. J. Natl. Sci. Found. Sri Lanka 2017, 45, 273–285. [Google Scholar] [CrossRef]
  8. APHA. Standard Methods for the Examination of Water and Wastewater; American Public Health Association (APHA); American Water Works Association (AWWA); Water Environment Federation (WEF): Washington, DC, USA, 2012; p. 1496. [Google Scholar]
  9. Indika, S.; Wei, Y.; Hu, D.; Ketharani, J.; Ritigala, T.; Cooray, T.; Hansima, M.A.C.K.; Makehelwala, M.; Jinadasa, K.B.S.N.; Weragoda, S.K.; et al. Evaluation of performance of existing RO drinking water stations in the north central province, Sri Lanka. Membranes 2021, 11, 383. [Google Scholar] [CrossRef]
  10. Prasad, B.; Sangita, K. Heavy metal pollution index of ground water of an abandoned open cast mine filled with fly Ash: A case study. Mine Water Environ. 2008, 27, 265–267. [Google Scholar] [CrossRef]
  11. Prasad, B.; Kumari, P.; Bano, S.; Kumari, S. Ground water quality evaluation near mining area and development of heavy metal pollution index. Appl. Water Sci. 2014, 4, 11–17. [Google Scholar] [CrossRef]
  12. Tiwari, A.K.; Singh, P.K.; Singh, A.K.; De Maio, M. Estimation of Heavy Metal Contamination in Groundwater and Development of a Heavy Metal Pollution Index by Using GIS Technique. Bull. Environ. Contam. Toxicol. 2016, 96, 508–515. [Google Scholar] [CrossRef]
  13. Cooray, T.; Wei, Y.; Zhong, H.; Zheng, L.; Weragoda, S.K.; Weerasooriya, R. Assessment of groundwater quality in CKDu Affected areas of Sri Lanka: Implications for drinking water treatment. Int. J. Environ. Res. Public. Health 2019, 16, 1698. [Google Scholar] [CrossRef] [PubMed]
  14. SLS 614:2013; Sri Lanka Standard Specification for Potable Water. Sri Lanka Standards Institution: Colombo, Sri Lanka, 2013. [CrossRef]
  15. Sulochanan, B.; Muniyandi, K. Hydrographic parameters off Gulf of Mannar and Palk Bay during an year of abnormal rainfall. J. Mar. Biol. Assoc. India 2005, 47, 198–200. [Google Scholar]
  16. Olbert, M.G.; Uddin, A.; Nash, S. A review of water quality index models and their use for assessing surface water quality. Ecol. Indic. 2021, 122, 107–218. [Google Scholar] [CrossRef]
  17. Pant, R.R.; Zhang, F.; Rehman, F.U.; Wang, G.; Ye, M.; Zeng, C.; Tang, H. Spatiotemporal variations of hydrogeochemistry and its controlling factors in the Gandaki River Basin, Central Himalaya Nepal. Sci. Total Environ. 2018, 622–623, 770–782. [Google Scholar] [CrossRef] [PubMed]
  18. Alavi, N.; Zaree, E.; Hassani, M.; Babaei, A.A.; Goudarzi, G.; Yari, A.R.; Mohammadi, M.J. Water quality assessment and zoning analysis of Dez eastern aquifer by Schuler and Wilcox diagrams and GIS. Desalin. Water Treat. 2016, 57, 23686–23697. [Google Scholar] [CrossRef]
  19. Bishwakarma, K.; Pant, R.R.; Pal, K.B.; Ghimire, A.; Thapa, L.B.; Saud, P.; Joshi, S.; Panthi, K.P. Water quality and land use/cover changes in the Phewa Watershed, Gandaki Province, Nepal. Nepal J. Environ. Sci. 2019, 7, 31–39. [Google Scholar] [CrossRef]
  20. Jiang, L.; Hu, X.; Xu, T.; Zhang, H.; Sheng, D.; Yin, D. Prevalence of antibiotic resistance genes and their relationship with antibiotics in the Huangpu River and the drinking water sources. Shanghai, China. Sci. Total Environ. 2013, 458–460, 267–272. [Google Scholar] [CrossRef]
  21. WHO. Guidelines for Drinking-Water Quality: Fourth Edition Incorporating the First and Second Addenda; WHO: Geneva, Switzerland, 2022. [Google Scholar]
  22. Nishiyama, E.; Higashi, K.; Mori, H.; Suda, K.; Nakamura, H.; Omori, S.; Maruyama, S.; Hongoh, Y.; Kurokawa, K. The relationship between microbial community structures and environmental parameters revealed by metagenomic analysis of hot spring water in the kirishima area, Japan. Front. Bioeng. Biotechnol. 2018, 6, 202. [Google Scholar] [CrossRef] [PubMed]
  23. Lira, F.; Vaz-Moreira, I.; Tamames, J.; Manaia, C.M.; Martínez, J.L. Metagenomic analysis of an urban resistome before and after wastewater treatment. Sci. Rep. 2020, 10, 8174. [Google Scholar] [CrossRef]
  24. Gu, Y.G.; Gao, Y.P. Bioaccessibilities and health implications of heavy metals in exposed-lawn soils from 28 urban parks in the megacity Guangzhou inferred from an in vitro physiologically-based extraction test. Ecotoxicol. Environ. Saf. 2018, 148, 747–753. [Google Scholar] [CrossRef]
  25. Kumar, S.; Islam, A.R.M.T.; Hasanuzzaman; Salam, R.; Islam, S.; Khan, R.; Rahman, M.S.; Pal, S.C.; Ali, M.M.; Idris, A.M.; et al. Potentially toxic elemental contamination in Wainivesi River, Fiji impacted by gold-mining activities using chemometric tools and SOM analysis. Environ. Sci. Pollut. Res. 2022, 29, 42742–42767. [Google Scholar] [CrossRef] [PubMed]
  26. Nissenbaum, A.; Magaritz, M. Bromine-rich groundwater in the Hula Valley, Israel. Naturwissenschaften 1991, 78, 217–218. [Google Scholar] [CrossRef]
  27. Davis, A.P.; Shokouhian, M.; Sharma, H.; Minami, C. Water Quality Improvement through Bioretention Media: Nitrogen and Phosphorus Removal. Water Environ. Res. 2006, 78, 284–293. [Google Scholar] [CrossRef] [PubMed]
  28. Panno, S.; Hackley, K.; Hwang, H.; Greenberg, S.; Krapac, I.; Landsberger, S.; O’Kelly, D. Characterization and identification of Na-Cl sources in ground water. Ground Water 2006, 44, 176–187. [Google Scholar] [CrossRef]
  29. Alcalá, F.J.; Custodio, E. Using the Cl/Br ratio as a tracer to identify the origin of salinity in aquifers in Spain and Portugal. J. Hydrol. 2008, 359, 189–207. [Google Scholar] [CrossRef]
  30. Vengosh, A.; Pankratov, I. Chloride/bromide and chloride/fluoride ratios of domestic sewage effluents and associated contaminated ground water. Ground Water 1998, 36, 815–824. [Google Scholar] [CrossRef]
  31. Richter, B.C.; Kreitler, C.W. Geochemistry of Salt Water Beneath the Rolling Plains, North-Central Texas. Groundwater 1986, 24, 735–742. [Google Scholar] [CrossRef]
  32. Bauwens, M.; Compernolle, S.; Stavrakou, T.; Müller, J.-F.; Van Gent, J.; Eskes, H.; Levelt, P.F.; Van Der A, R.; Veefkind, J.P.; Vlietinck, J.; et al. Impact of Coronavirus Outbreak on NO2 Pollution Assessed Using TROPOMI and OMI Observations. Geophys. Res. Lett. 2020, 47, e2020GL087978. [Google Scholar] [CrossRef] [PubMed]
  33. Oh, K.; Kato, T.; Li, Z.-P.; Li, F.-Y. Environmental Problems From Tea Cultivation in Japan and a Control Measure Using Calcium Cyanamide. Pedosphere 2006, 16, 770–777. [Google Scholar] [CrossRef]
  34. Kim, K.H.; Yun, S.T.; Kim, H.K.; Kim, J.W. Determination of natural backgrounds and thresholds of nitrate in South Korean groundwater using model-based statistical approaches. J. Geochem. Explor. 2015, 148, 196–205. [Google Scholar] [CrossRef]
  35. Karunanidhi, D.; Aravinthasamy, P.; Subramani, T.; Wu, J.; Srinivasamoorthy, K. Potential health risk assessment for fluoride and nitrate contamination in hard rock aquifers of Shanmuganadhi River basin. South India. Hum. Ecol. Risk Assess. 2019, 25, 250–270. [Google Scholar] [CrossRef]
  36. Wu, B.; Zhao, D.Y.; Jia, H.Y.; Zhang, Y.; Zhang, X.X.; Cheng, S.P. Preliminary risk assessment of trace metal pollution in surface water from Yangtze River in Nanjing section. China Bull. Environ. Contam. Toxicol. 2009, 82, 405–409. [Google Scholar] [CrossRef] [PubMed]
  37. Wei, X.; Viadero, R.C.; Buzby, K.M. Recovery of iron and aluminum from acid mine drainage by selective precipitation. Environ. Eng. Sci. 2005, 22, 745–755. [Google Scholar] [CrossRef]
  38. Zhao, H.; Xiao, Q.; Miao, Y.; Wang, Z.; Wang, Q. Sources and transformations of nitrate constrained by nitrate isotopes and Bayesian model in karst surface water. Guilin, Southwest China. Environ. Sci. Pollut. Res. 2020, 27, 21299–21310. [Google Scholar] [CrossRef]
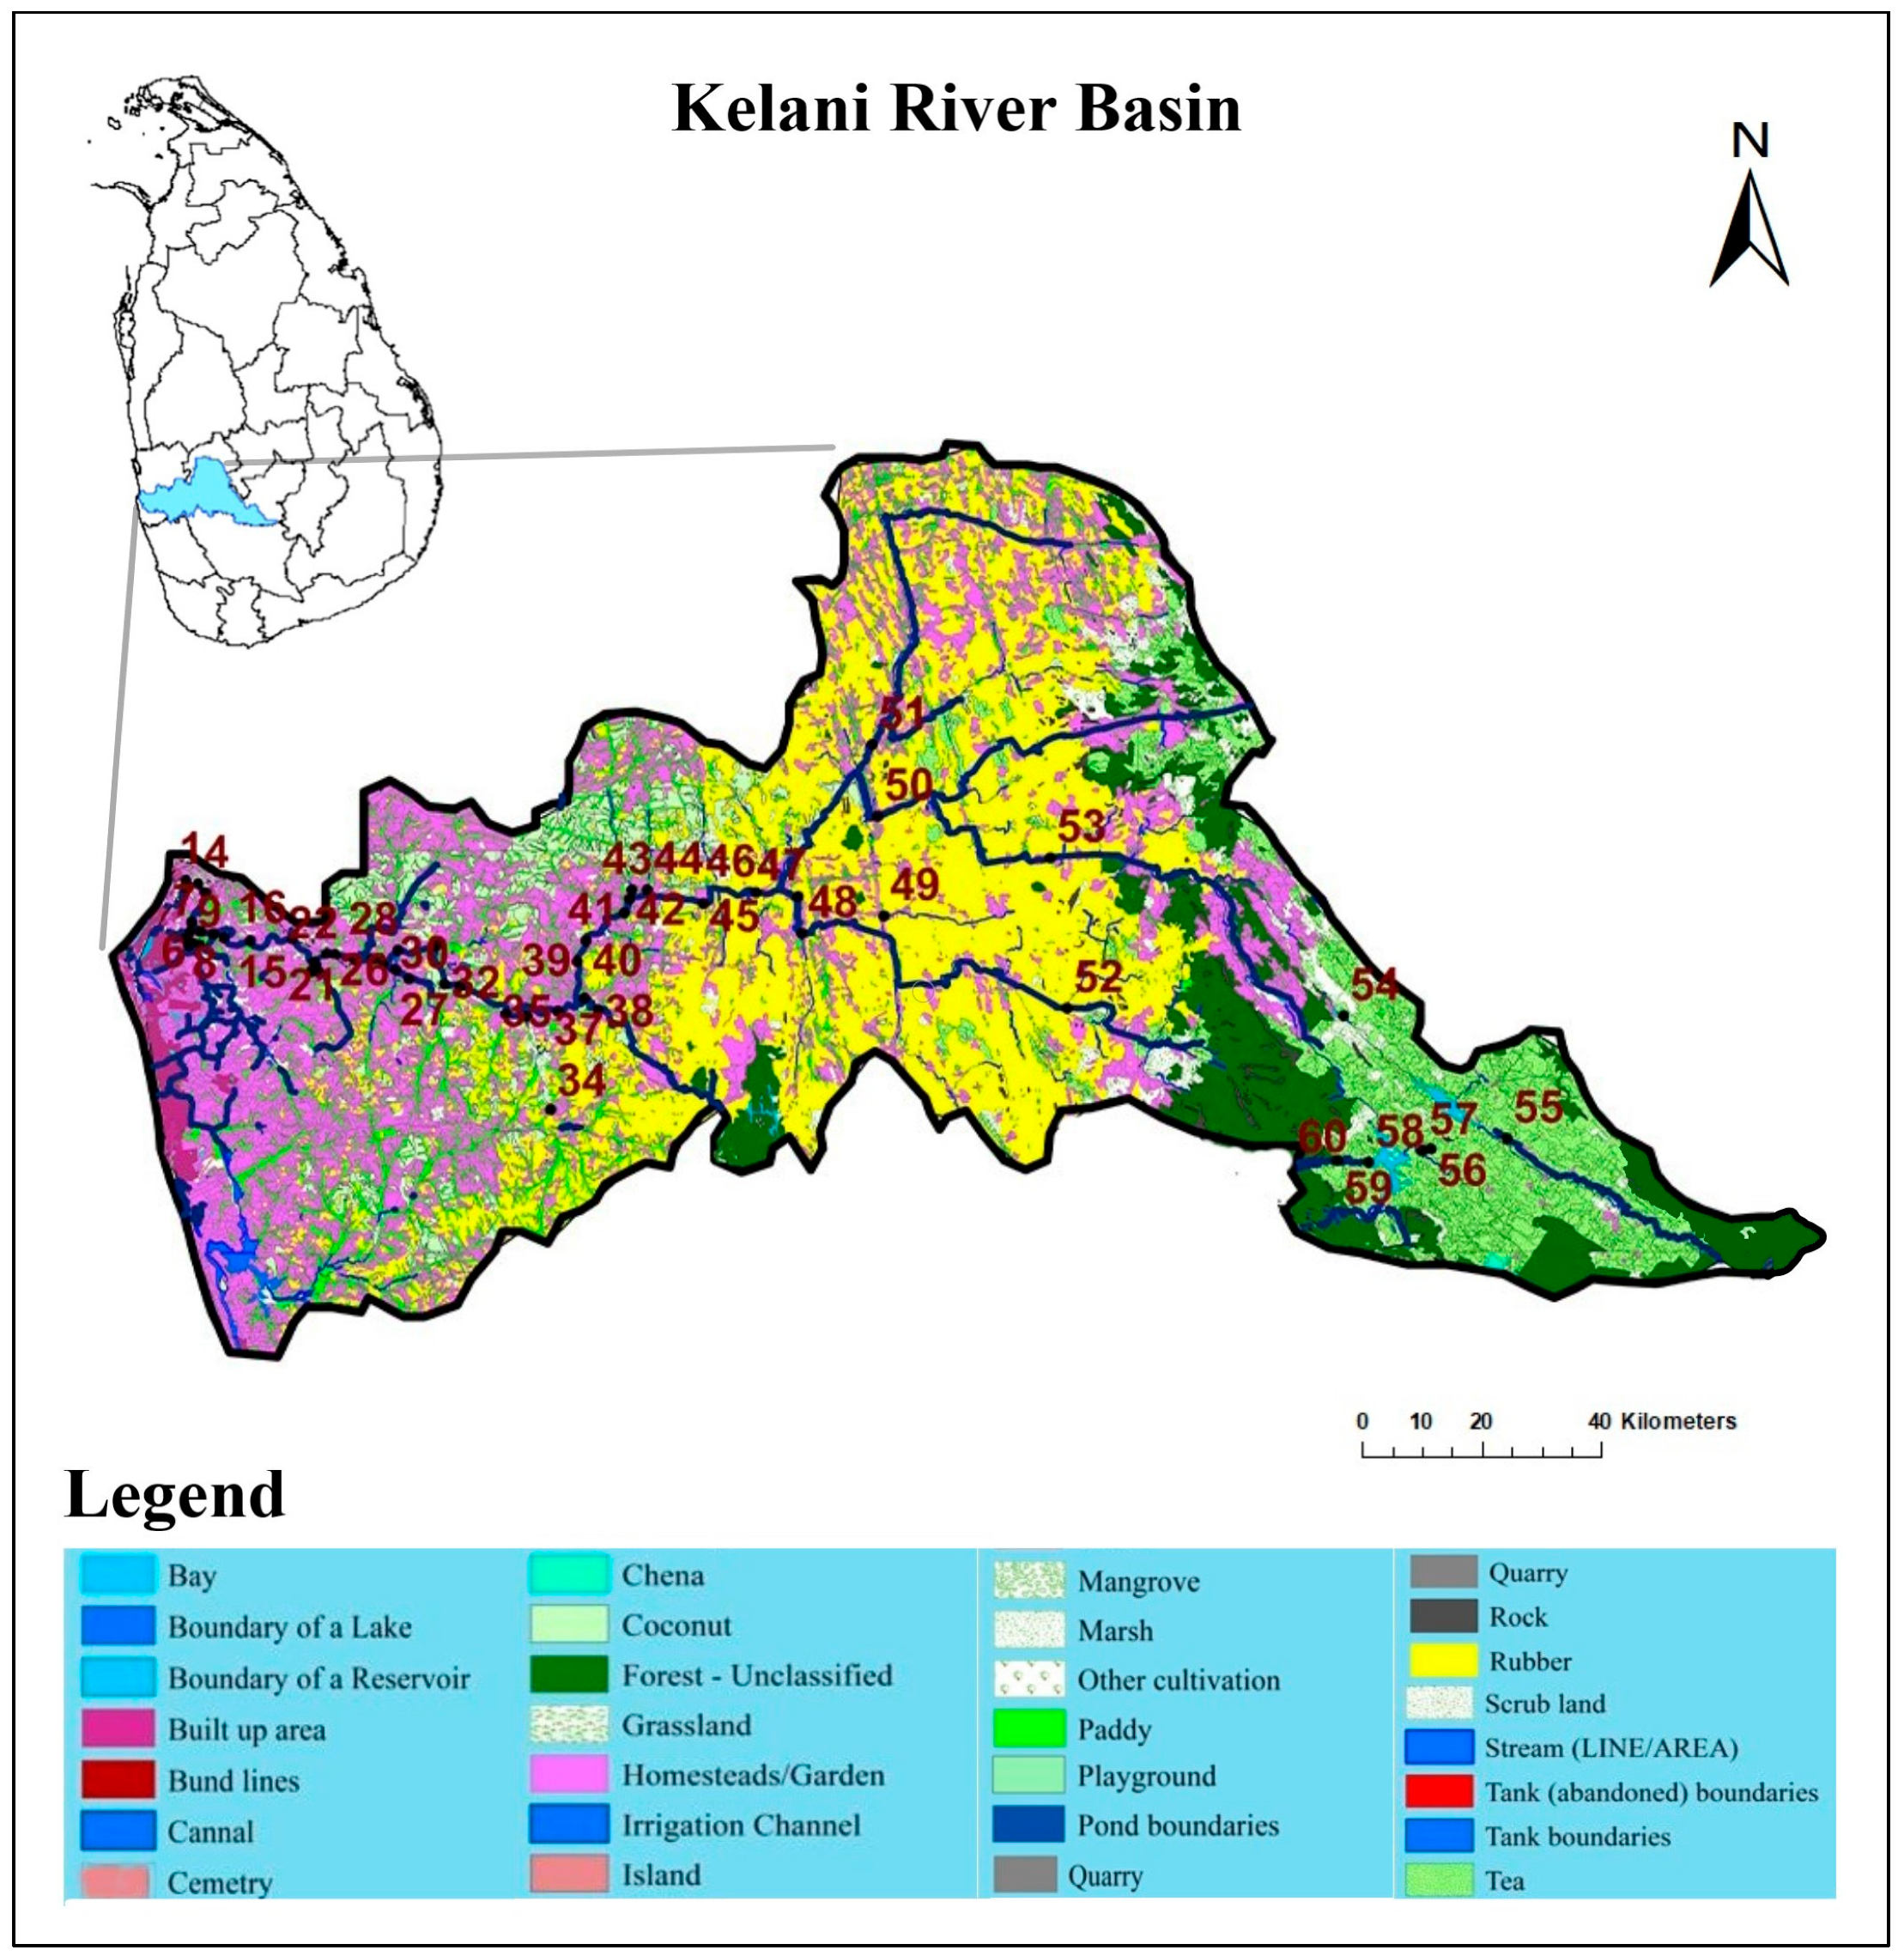
Figure 1. Sampling sites along the Kelani River Basin.
Water 15 03785 g001
Figure 2. Spatial variation of COD, EC, turbidity in the Kelani River Basin: (a,c,e) during lockdown season; (b,d,f) during the post–lockdown season.
Water 15 03785 g002
Figure 3. (a) BOD (b) COD variation downstream of the Kelani River, Sri Lanka in 2016–2020.
Water 15 03785 g003
Figure 4. WQI map of two seasons: (a) lockdown season; (b) after lockdown season.
Water 15 03785 g004
Figure 5. Piper diagrams of major ions in Kelani River during lockdown and post-lockdown seasons.
Water 15 03785 g005
Figure 6. Water quality changes in Kelani River in pre-lockdown, lockdown, post-lockdown seasons.
Water 15 03785 g006
Figure 7. Halide variation in Kelani River: (a) lockdown season, (b) post-lockdown season.
Water 15 03785 g007
Figure 8. Nitrate variation in the Kelani River in the post−lockdown season.
Water 15 03785 g008
Disclaimer/Publisher’s Note: The statements, opinions and data contained in all publications are solely those of the individual author(s) and contributor(s) and not of MDPI and/or the editor(s). MDPI and/or the editor(s) disclaim responsibility for any injury to people or property resulting from any ideas, methods, instructions or products referred to in the content.