Article

Study on Unsteady Flow Characteristics of Cooling Water Pump for Nuclear Power Plant Equipment under Low Flow Rate Conditions

1
Research Center of Fluid Machinery Engineering and Technology, Jiangsu University, Zhenjiang 212013, China
2
China Nuclear Power Engineering Co., Ltd., Beijing 100840, China
*
Author to whom correspondence should be addressed.
Water 2023, 15(21), 3780; https://doi.org/10.3390/w15213780
Submission received: 25 September 2023 / Revised: 19 October 2023 / Accepted: 20 October 2023 / Published: 29 October 2023

Abstract

:
During the operation of cooling water pumps, it is necessary to operate them under conditions of low flow rate. In order to improve the unstable performance of the cooling water pump under low flow rate conditions. Taking the cooling water pump as the research object, the internal flow and pressure pulsation characteristics of the cooling water pump under 0.4Q to 0.6Q conditions were investigated, and the influence of different operating conditions on the performance and vibration of the cooling water pump was analyzed. The ANSYS CFX 2022 software and the SST k-ω turbulence model were used to perform a three-dimensional numerical simulation of the cooling water pump. After analyzing the simulation results, the velocity and pressure cloud and streamline diagram within the semi-spiral suction casing and impeller were obtained. The internal flow state of the cooling water pump was then analyzed in detail under low flow rate conditions. At the same time, a series of monitoring points were set up within the impeller, and the pressure pulsation within the impeller was analyzed using the frequency domain diagram and the radial force polar coordinate diagram. The results show that at flow rates between 0.4Q and 0.6Q, a certain amount of vortex has been generated in the suction casing, which affects the flow state when entering the impeller. Furthermore, significant vortices have been generated in the middle and back part of the blade and mainly concentrated in the pump cover of the mid-open pump. At the same time, when in low flow rate conditions, the primary frequency of pressure pulsation is mainly the axial frequency, with three times the axial frequency and blade frequency following. The amplitude of the pressure surface (PS) of the blade is greater than that of the suction surface (SS) and increases as the flow rate decreases. The internal radial force corresponds with the result of pressure pulsation and exhibits a certain pattern. This study outlines the coolant pump’s internal flow and pressure pulsation characteristics under low-flow conditions. It proposes a solution to stabilize the cooling water pump at low flow rates and provides theoretical guidance for optimizing its design.

1. Introduction

The cooling water pump for nuclear power plant equipment, also known as the double suction centrifugal pump, has been widely used because of its high efficiency, large flow, and good axial force balance. In recent years, the scale of pipeline water transmission projects has continually expanded, together with the development of large-scale pumps. As a result, there has been an increased focus on the stability of double-suction centrifugal pumps, with particular attention paid to studying their instability under low flow rate conditions [1].
Flow variation and cavitation can result in an unstable internal flow of the centrifugal pump, which is primarily demonstrated through external dynamic characteristics [2,3]. At the same time, under low flow rate conditions, the pump will generate rotary stall, reflux, and a viscous wake, as well as rotor-stator interaction, particularly during partial load conditions [4,5,6]. Li, et al. [7] found that, according to their visual research, the interaction between the stall vortex and the mainstream in the flow channel resulted in a significant blockage area. This ultimately had the most detrimental effect on the head reduction of the mixed-flow pump, while at the same time, strengthening the interference effect between the tip leakage flow and the stall vortex. Zhang [8] et al.’s research showed that the pressure fluctuation first increased and then decreased along the flow direction, and the maximum value was near the inlet of the diffuser. In general, the pressure fluctuation was more significant under the condition of low flow rate, and the fluctuation period was relatively irregular. Wang et al. [9] confirmed that separation and eddy currents in blade channels can also lead to pressure fluctuations, vibration and noise intensification.
Pedersen et al. [10] and Byskov et al. [11] studied the flow characteristics of the impeller of a centrifugal pump under design and non-design conditions. At a 25% load, a notable disparity was observed between the two nearby impeller channels. Specifically, one channel exhibited a significant stall in the entry segment. Zhao et al. [12] analyzed the mechanism of pressure fluctuation and stall propagation caused by a low flow rate. They discovered that flow separation took place close to the leading edge (LE) of the pressure surface (PS) and subsequently spread along the channel. Jia [13] studied the transient fluid excitation force induced by unsteady flow in centrifugal pumps. In conditions of low flow rates, the internal flow loss predominantly occurred in the impeller runner close to the volute tongue. The unsteady flow caused low-frequency vibration, which was highly responsive to subtle changes in the flow rate. Ni [14] discovered that the main cause was the coupling of the rotor-stator interaction with the collision of the fluid discharged from the diffuser with the circulating flow to the bottom of the housing was the main cause. Zheng et al. [15] discovered that the amplitude of pressure fluctuation’s main frequency at the impeller inlet increased as the flow rate increased. In contrast, the trend was the opposite in the gap region of the wear ring. Gao et al. [16] discovered that altering the trailing edge (TE) of the impeller blade significantly decreased the pressure pulsation. Wang et al. [17] discovered that the centrifugal pump impeller’s pressure pulsation was significantly influenced by flow rate and speed. They also observed that the pressure pulsation was higher at lower speeds than at high speeds. Huang [18] examined how varying flow rates affect pressure fluctuations in the pump. The study discovered that the amplitude of the rotor-stator interaction frequency decreased continuously, with each frequency attenuation concentrated mainly in the diffuser region.
The research on the initiation and propagation of rotary stalls in pumps remains a focal point in low flow rate conditions. To illustrate the origin of rotational stalls, Lucius [19] studied rotational stalls in centrifugal pumps, identifying stall frequencies in both stationary and moving frames. In contrast, Zhang et al. [20] and Zhou et al. [21] relied on pressure fluctuations to detect rotational stall frequency. Gao et al. [22] focused on the effects of the measuring position and operating conditions on pressure pulsation characteristics in low-specific velocity centrifugal pumps. The study also revealed pressure fluctuations and rotational stalls through experimental data. The intricate interactions of centrifugal pumps under stall conditions are expounded through various explanations [23,24,25,26] in both compressors and pumps. Furthermore, studies have been undertaken regarding pressure fluctuation in the centrifugal pump [27,28,29].
In summary, both domestic and international researchers have utilized experiments and numerical simulations to investigate the internal flow characteristics and pressure pulsation characteristics of pumps under low flow rate conditions. Additionally, they have examined the unsteady state characteristics of different types of pumps under low flow rate conditions. The cooling water pump has been operating under standard conditions for an extended period. However, it requires operation at a low flow rate for certain periods. The instability of the cooling water pump under low flow rate conditions can significantly impact internal bearings, mechanical seals, brackets, and other components of the pump. This destabilization may even pose a threat to the pump’s safety and reliability of the pump during operation. In order to explore the unstable flow characteristics inside the impeller and casing of the cooling water pump under low flow rate conditions, this paper took a cooling water pump (i.e., double suction pump) for nuclear power plant equipment as the research object. Numerical simulation through CFD technology was used, and experimental verification was conducted. The head error at the point of highest efficiency is 3.7%, with an efficiency error of 1.1%, thus verifying the numerical simulation’s reliability. The investigation also discovered more vortices in the impeller outlet’s flow channel, and the amplitude of the impeller blade’s pressure surface was decidedly larger than that of the suction surface. The study investigated the variances in internal flow characteristics between the double suction pump and the normal centrifugal pump, particularly under low flow rate situations. Consequently, the causes of such fluctuations were analyzed, and an improvement idea was determined. The study aims to address the issue of equipment cooling water pump instability during low flow rate conditions.

2. Experimental System and Model Pump

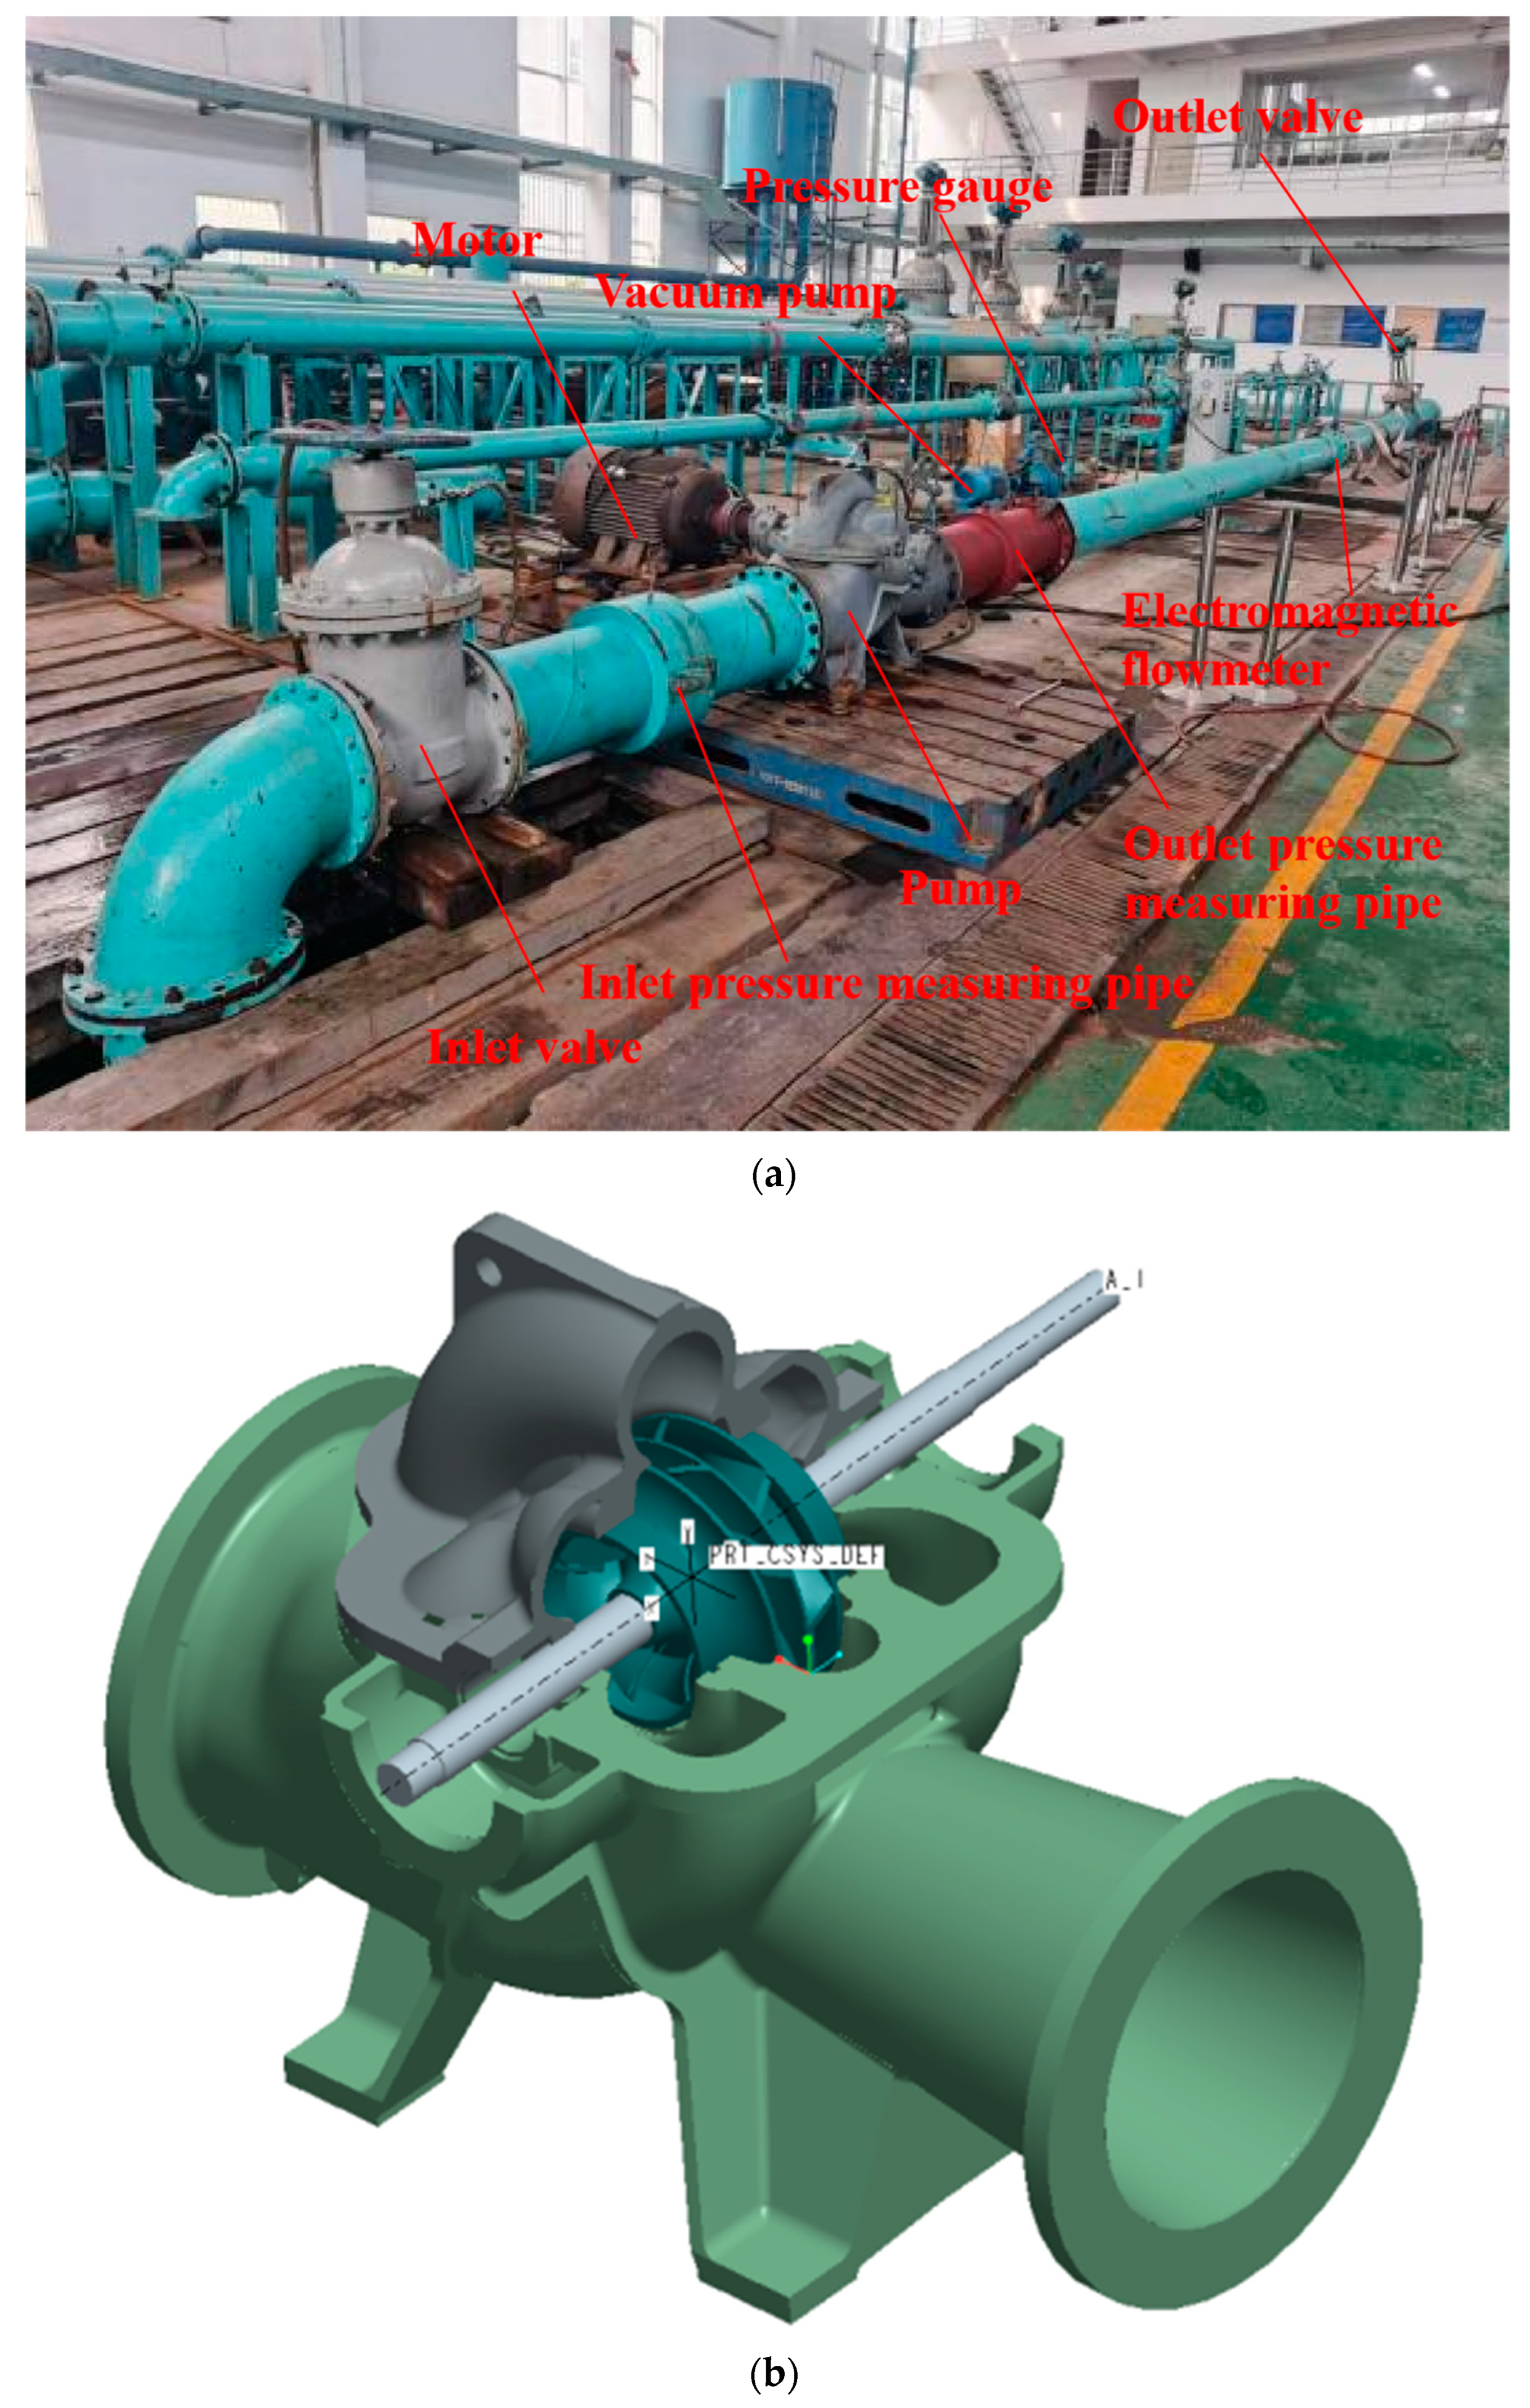
2.1. Experimental System

The prototype pump functions as a cooling water pump for equipment at a nuclear power plant. The technical specifications of the pump are shown in Table 1. In order to verify the performance of the prototype pump, it is necessary to scale it, as indicated in Table 2. According to the standard, the Reynolds number needs to be greater than 5 × 10⁶, and there are two sizes of dormitories that meet this requirement. However, based on the experimental requirements, we have selected an inlet pipe diameter of 350 mm and adopted the first scaling ratio.
Figure 1 shows a schematic of the model pump experiment. The experiment is carried out on an open platform, which is composed of two valves, a flowmeter, a pressure measuring pipe, a pressure gauge, etc. The motor is a two-stage motor that keeps the speed of the model pump at 1480 r/min. The valve is equipped with a water seal to prevent any leakage at the packing position. An electromagnetic flow meter is used for measuring the flow rate, while the inlet pressure gauge has a range of −0.1 Mpa to 1 Mpa and the outlet pressure gauge has a range of 0 to 0.4 Mpa. The data is then compiled into TPA system species, with a test accuracy range of 0.1 to 0.2 grade. The experiment involved pumping water with a vacuum pump, beginning with a low flow rate. The outlet valve was then adjusted to achieve the desired flow rate. To ensure the reliability of the results, two measurements were taken during the experiment.

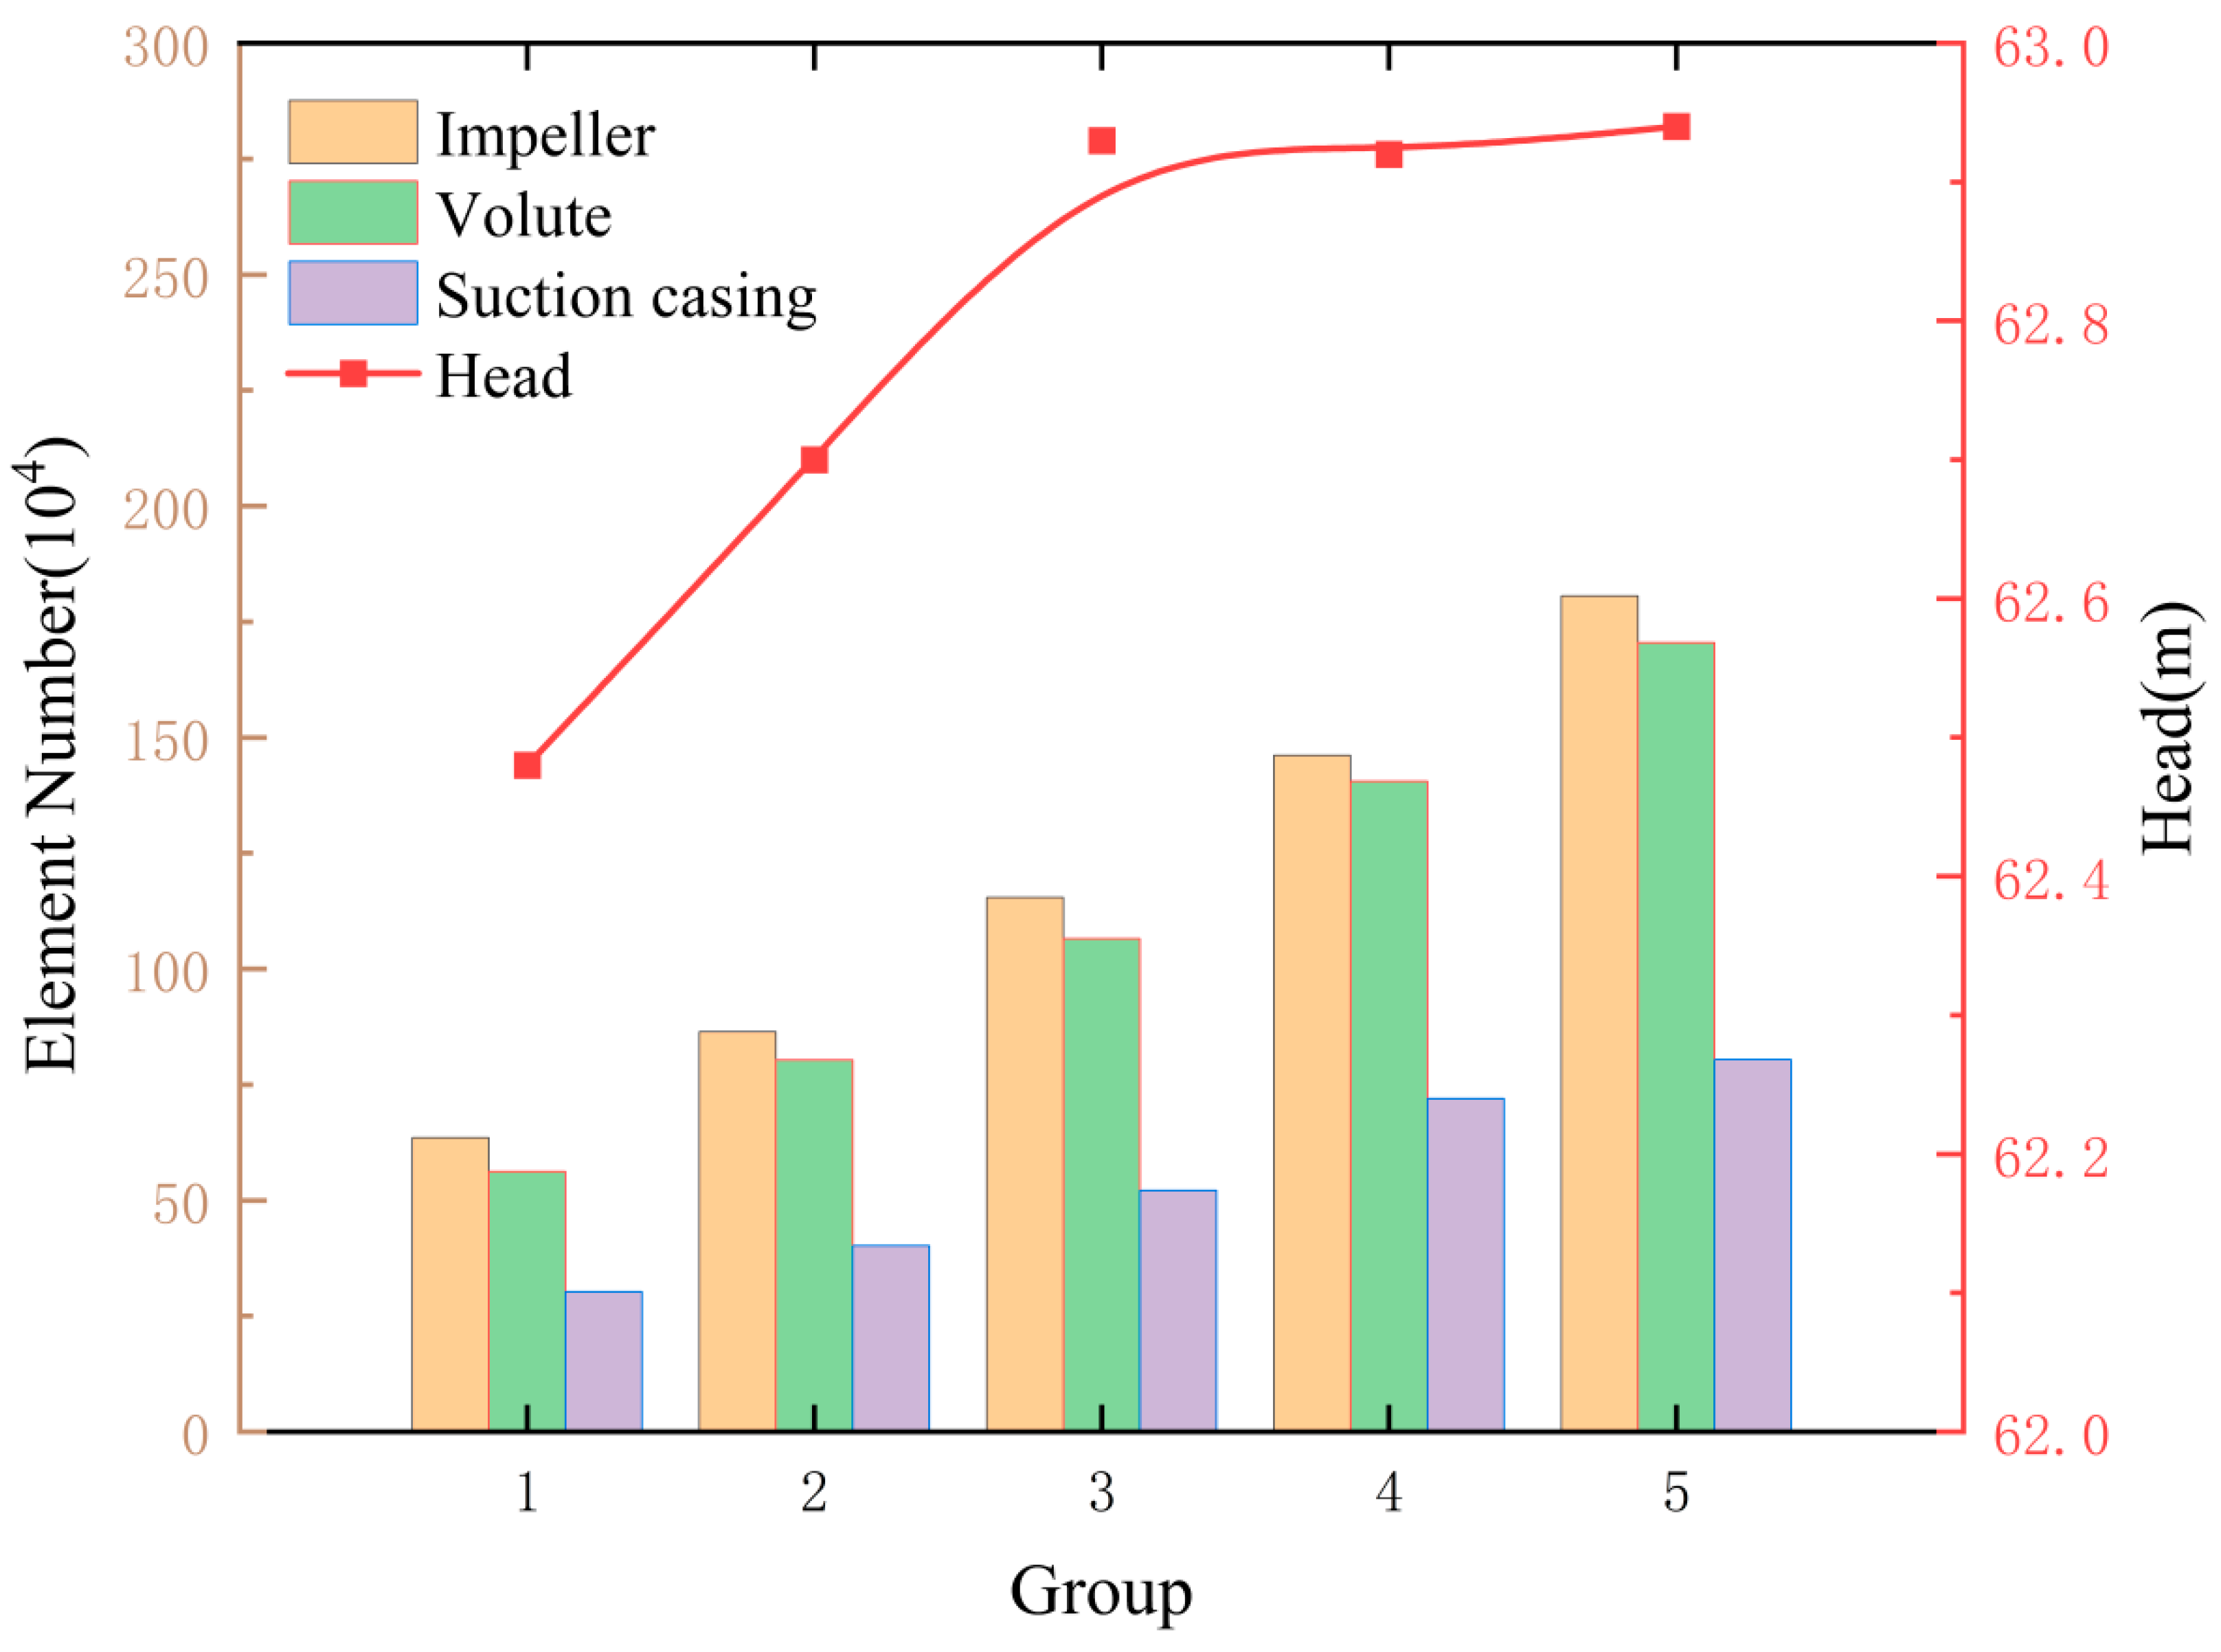
2.2. Mesh Generation

As shown in Figure 2, the interior of the pump is modeled using Pro/E 5. 0 software and then meshed. Because of the significance of the rotating components, a structured grid is used for the impeller, and a hexahedral grid is used for the other hydraulic components. Figure 3 shows five grid schemes, using different numbers of grids to calculate and monitor their heads. When the difference between the heads of two adjacent grids becomes small, the quantity of grids meets the error criterion. Considering the calculation efficiency and accuracy, at the same time, in order to capture a more refined flow field structure as much as possible, the selected mesh number is the third group. Among them, the grid number of the impeller is 1,154,260, the grid number of the casing is 1,065,352, the grid number of the suction casing is 521,603, the inlet extension section is 342,513, and the outlet extension section is 332,563. The total number of grids reaches 3.416 million. The y+ value of the wall surface of the fluid domain is shown in Table 3 to ascertain and establish whether the influence of Reynolds stress or viscous stress holds more significance. Therefore, the turbulence model is selected and the computational fluid dynamics (CFD) software CFX is used for numerical simulation.

2.3. Governing Equation and Turbulence Model

Details of the values are presented in Table 4. The mass and momentum equations are solved under isothermal conditions in the governing equation. The transient analysis considers the time change term, as opposed to the steady-state analysis. The convergence condition is 1.0 ×10⁻⁴ and the wall surface is “No Slip Wall”. For weak separation levels and their inception, the recommended model is the k-ω-based shear stress transport (SST) standard model. Thus, this study applies the SST standard model.

2.4. Boundary Conditions

The model pump is numerically calculated using CFX 2021 software. In the steady calculation, the inlet boundary condition is set as velocity inlet. The outlet boundary condition is set to the pressure outlet. The dynamic and stationary interface between the inlet of the suction casing and the inlet of the impeller, and between the outlet of the impeller and the inlet of the casing is set as Frozen Rotor. In the unsteady calculation, the transient rotor-stator method is used to observe the flow pattern in the whole channel. The dynamic and stationary interface is altered to Transient Frozen Rotor. The total time of a rotation is about 0.041 s, and the transient data is obtained every 4 degrees.

3. Results and Discussions

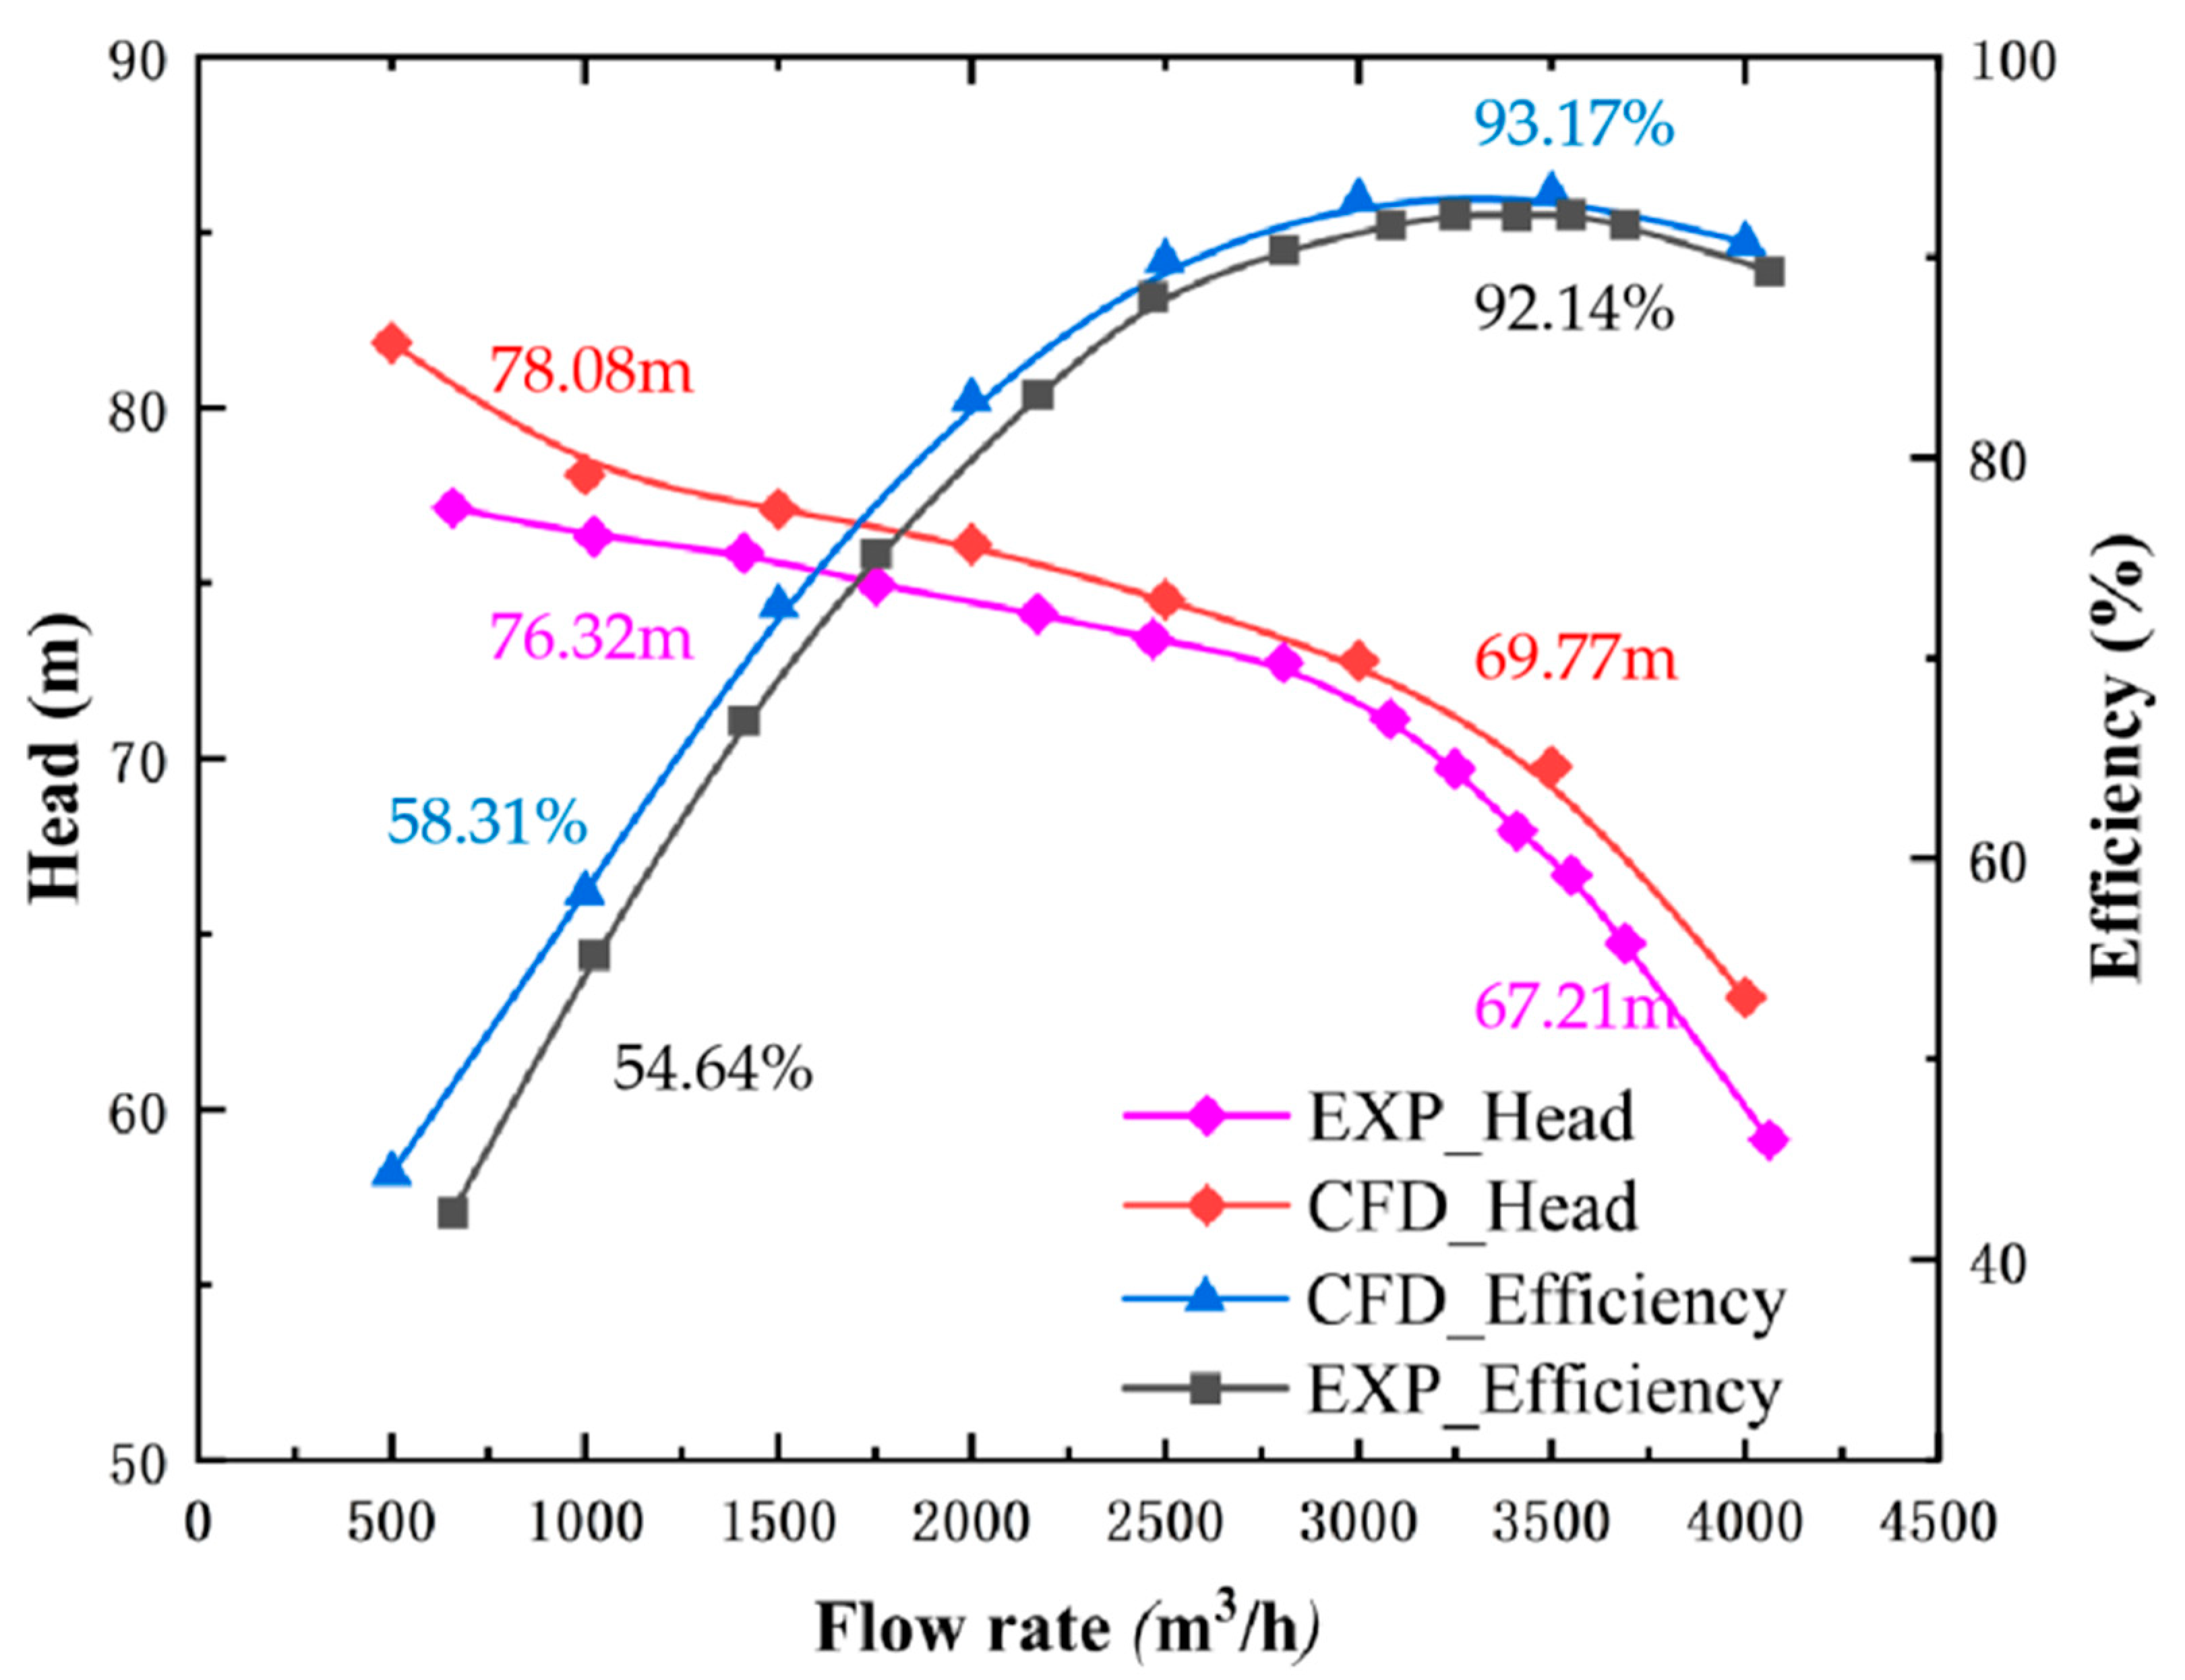
3.1. Pump Performance Analysis

Figure 4 shows the performance curve of the prototype. The result of the numerical simulation is higher than that of the experiment. At the same time, the difference between simulation and experiment increases with a decrease in flow, especially under low flow rate conditions. This could be attributed to the limited precision of numerical techniques for intricate flows, including flow separation and backflow in low flow rate simulations. In addition, at low flow rates, there may be occurrences of rotational stalls and induced cavitation in the impeller, which can reduce the accuracy of the simulation. To select the simulation method that is closest to the experimental results, various turbulence models and boundary conditions are compared.
The experiment measured the outlet and inlet pressure values, flow rate (Q), shaft power, and other relevant measurements. Subsequently, the head and efficiency were computed using the provided formula. From the performance curve, the simulation efficiency is higher than the experimental efficiency, yet the overall trend is similar, the difference lies mainly in the slope of the head near the dead head; the simulation data is obviously steeper, whereas the remaining observations exhibit similarity. Furthermore, at the point of maximum efficiency, the experiment and simulation efficiencies are closest, with an error of 1.1% and a head error of 3.7%. At 0.3Q, the efficiency error is the largest, with an error value of 6.3% and a head error of 2.5%, which is within the error range of the relevant literature, which proves the reliability of the simulation.

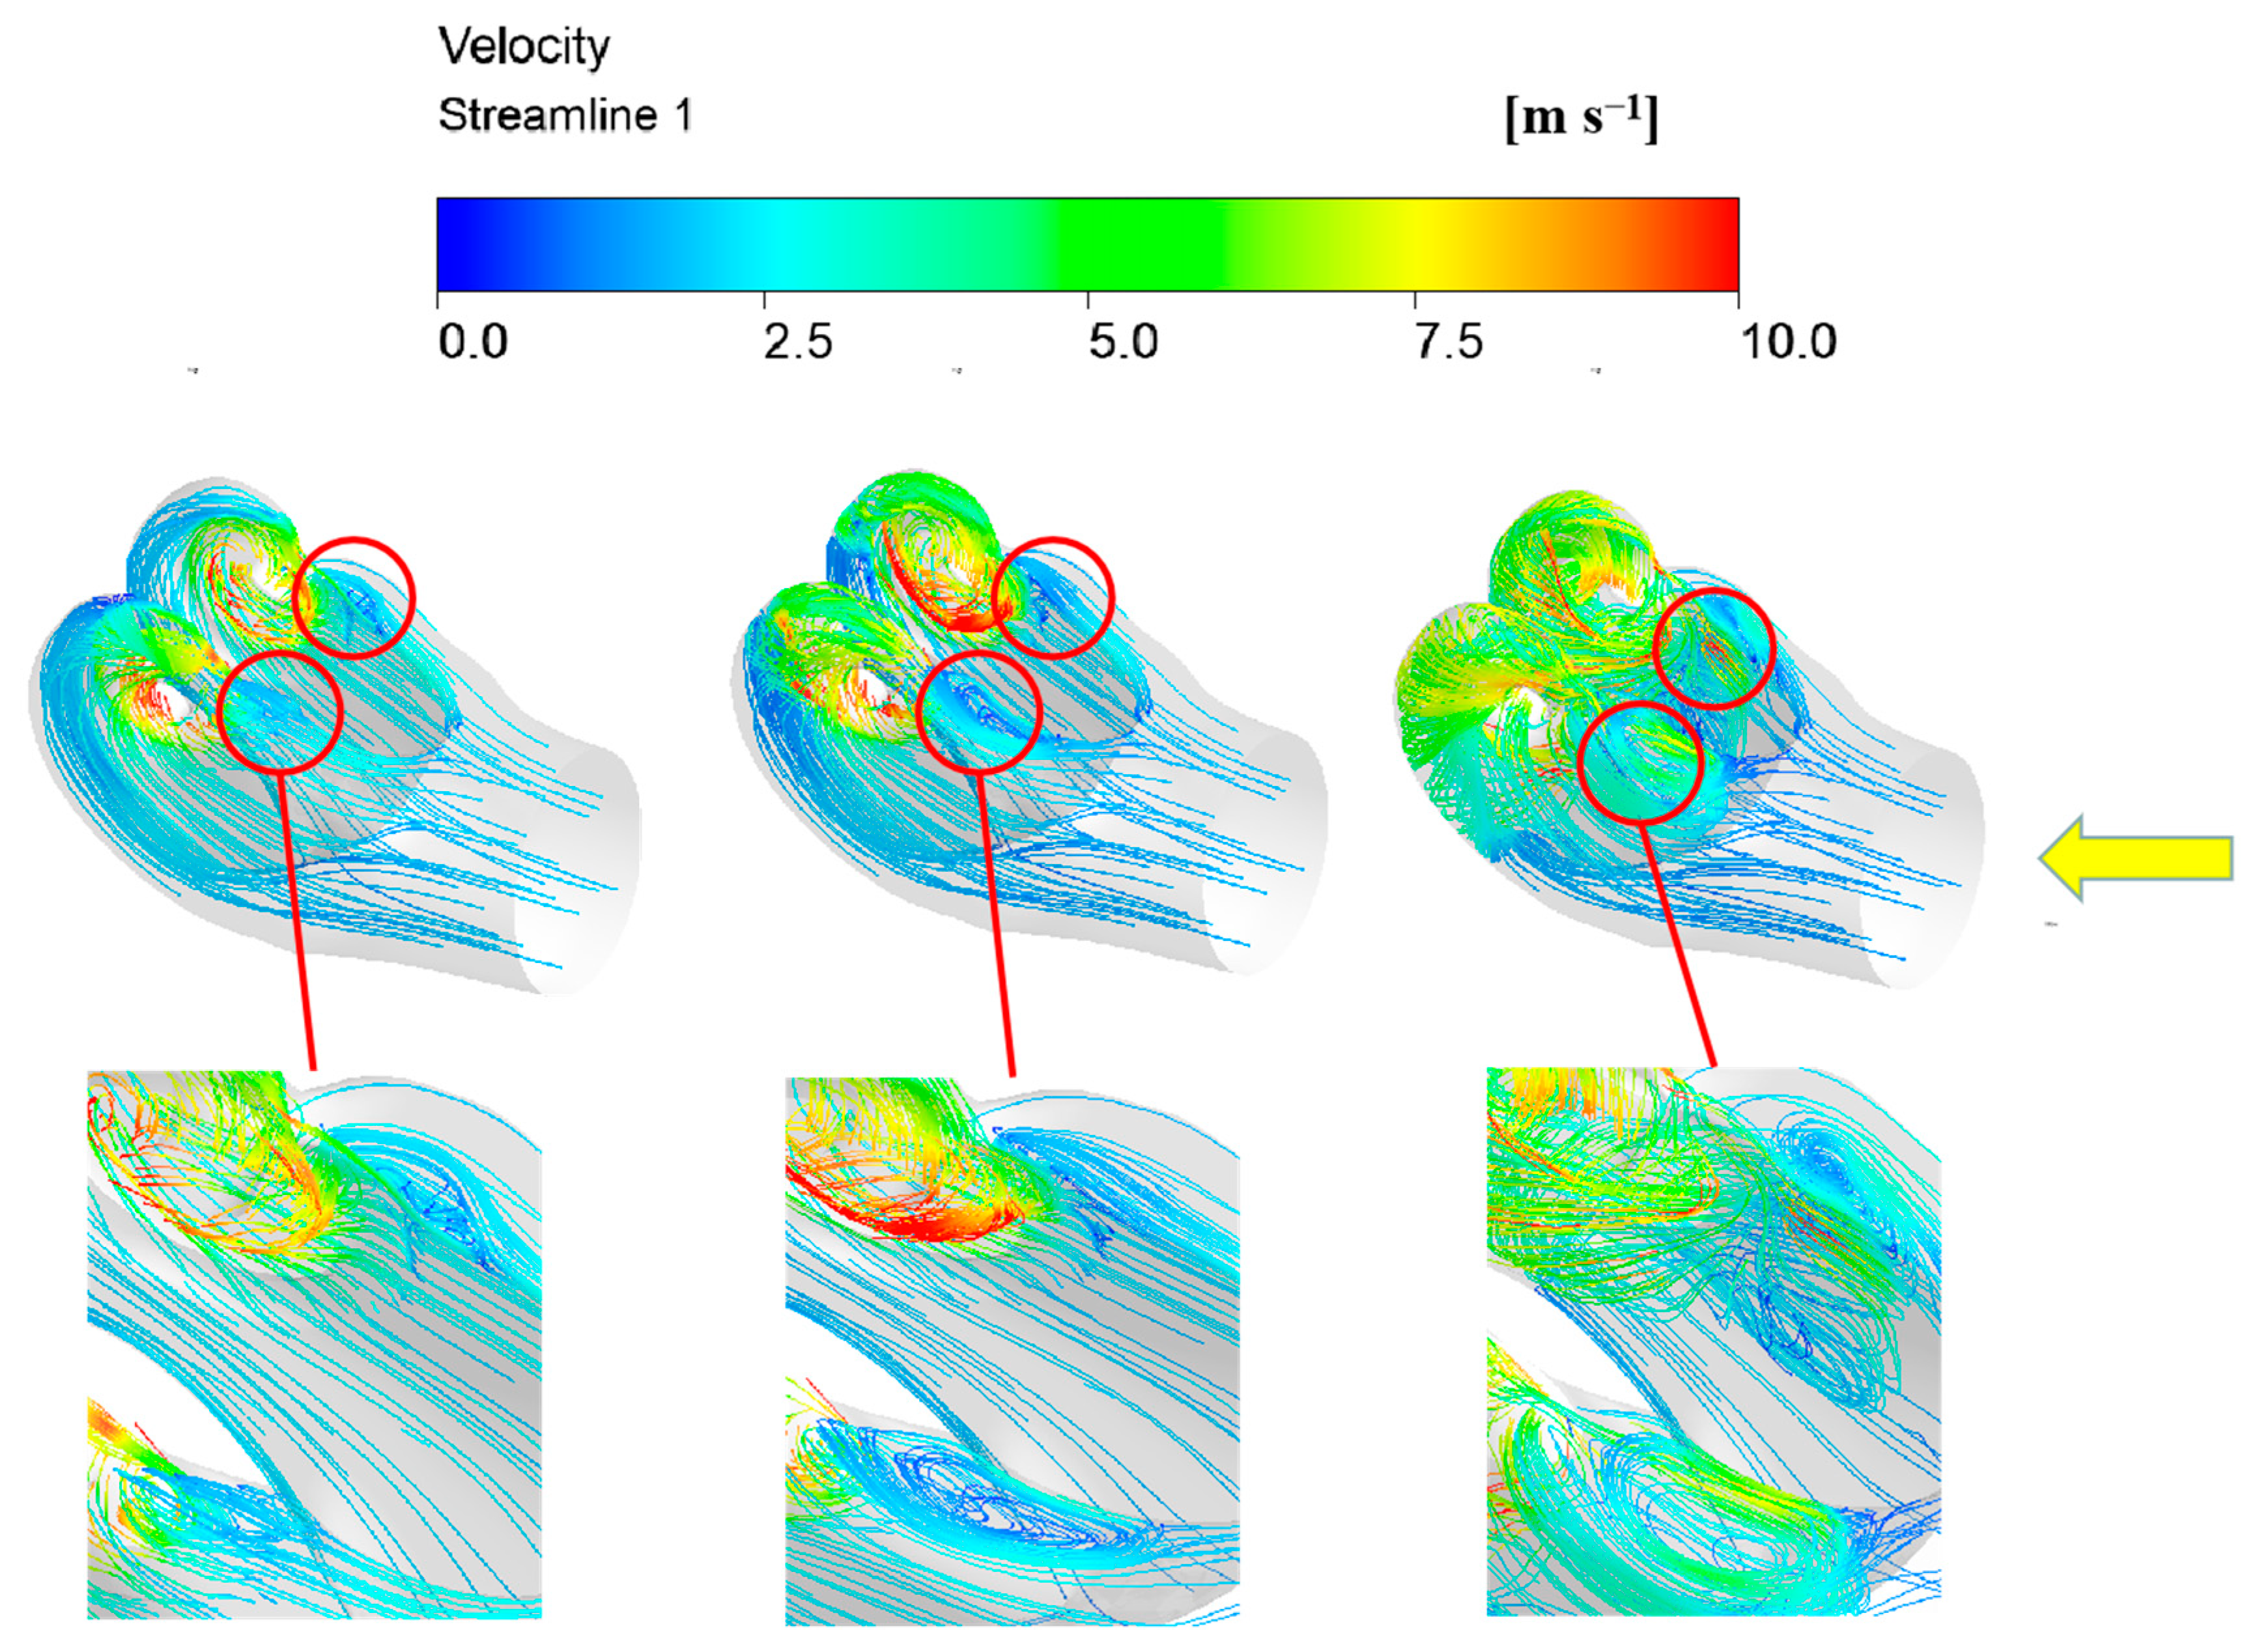
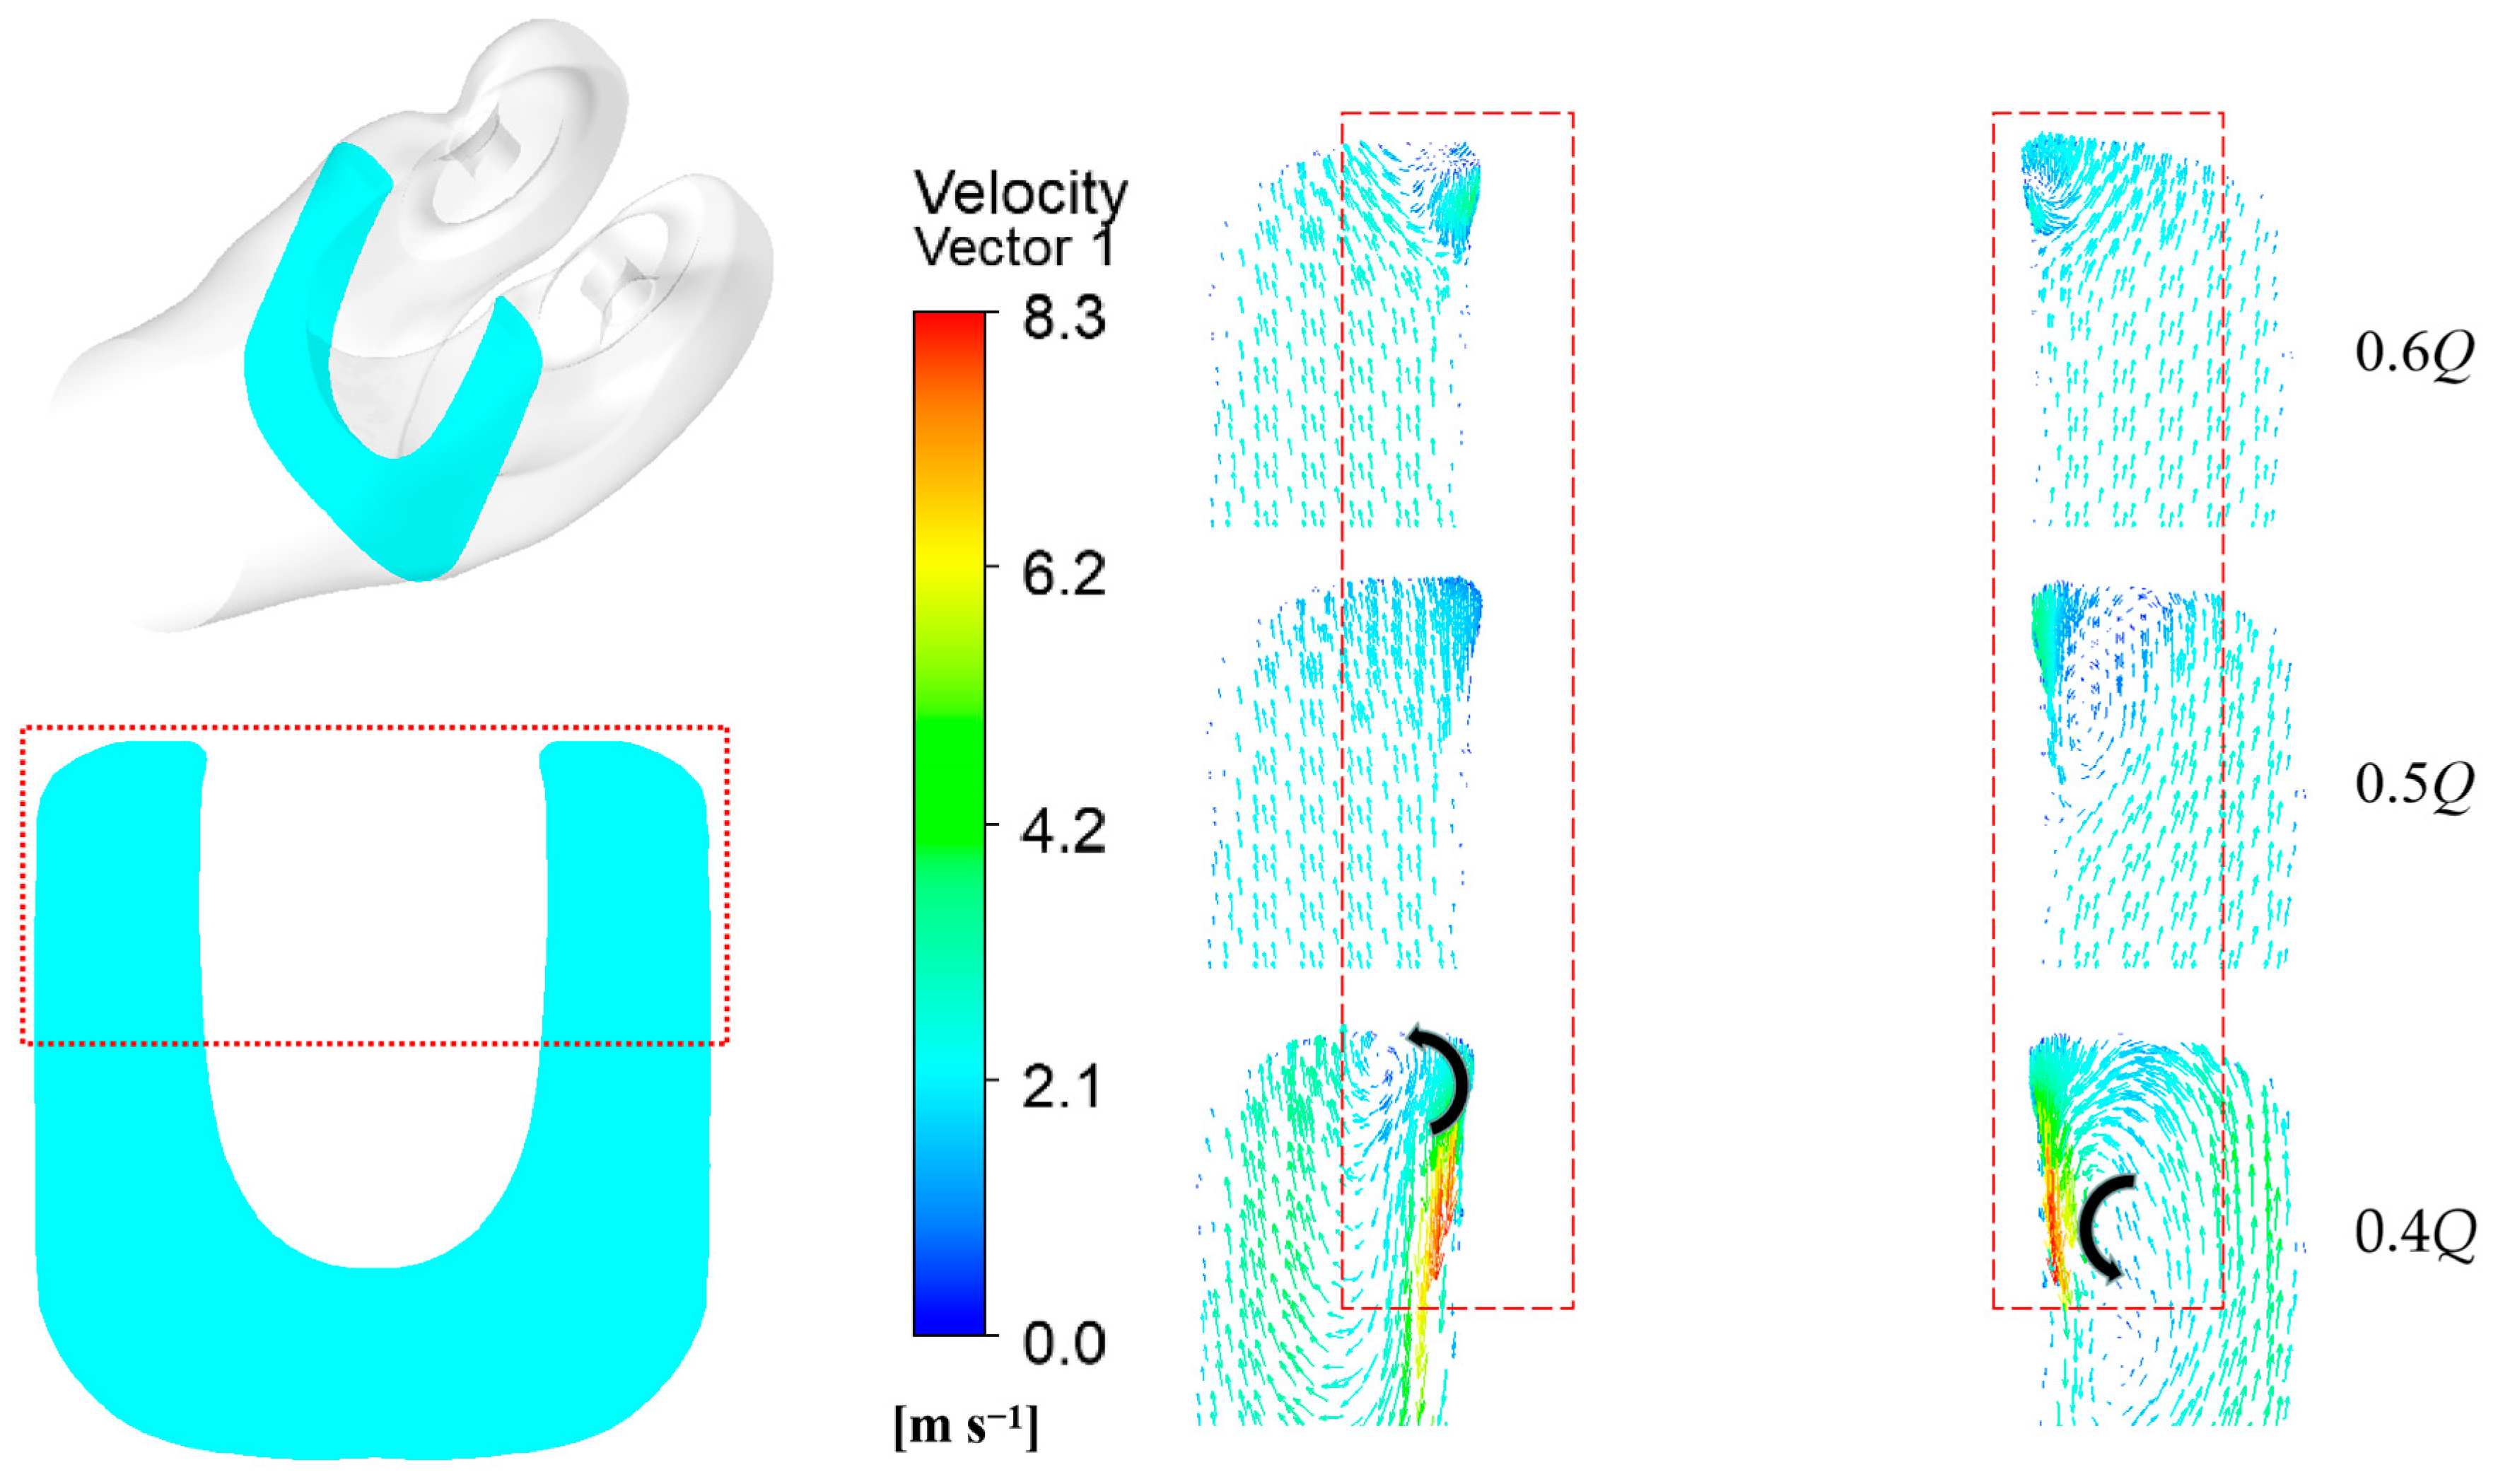
3.2. Analysis of Internal Flow in Suction Casing

Suction casing refers to the flow part of the inlet flange of the pump to the inlet of the impeller. The function of the suction casing is to introduce the liquid to the impeller in line with relevant conditions. The speed in the suction casing is low, so the hydraulic loss is much lower than that in the casing. The flow within the impeller is significantly impacted by the flow state in the suction casing, ultimately affecting the pump’s efficiency and cavitation performance. The suction casing must meet certain criteria. These include ensuring that the impeller inlet has the necessary speed distribution, with uniform flow and an appropriate size. Figure 5 shows the flow diagram of the suction casing with different flow rates from left to right. At a flow rate of 0.6Q, a vortex initially occurs in the center of the suction casing (indicated by the red circle in the diagram), and then the vortex gradually increases as the flow rate decreases. At the same time, the semi-spiral suction casing is used, and its function is to introduce the liquid to the impeller according to the required conditions to ensure that there is a uniform velocity field at the impeller inlet. Therefore, the flow rate within the suction casing should be low, resulting in minor hydraulic losses compared to those experienced within the casing. However, there is a higher velocity at 0.4Q flow than at 0.6Q, creating a disturbance in the internal velocity gradient and causing a subsequent increase in losses.
Figure 6 shows the velocity vector diagram of the cross-section at the suction casing vortex. The figure illustrates the two flow channels, located on the left and right sides of the suction casing. It can also be found that major vorticity clusters are concentrated here, and the diffusion direction gradually fills the entire flow channel, expanding in multiple directions. The left and right sides of the figure are the two flow channels of the suction casing. The formation of vortices may exhibit inconsistency when the flow rate is low, which is potentially influenced by an asymmetric flow generated by the left and right impellers. However, it can also be found that the vortices in the suction casing start from the upper side of the flow channel and subsequently spread to occupy the entire flow channel.

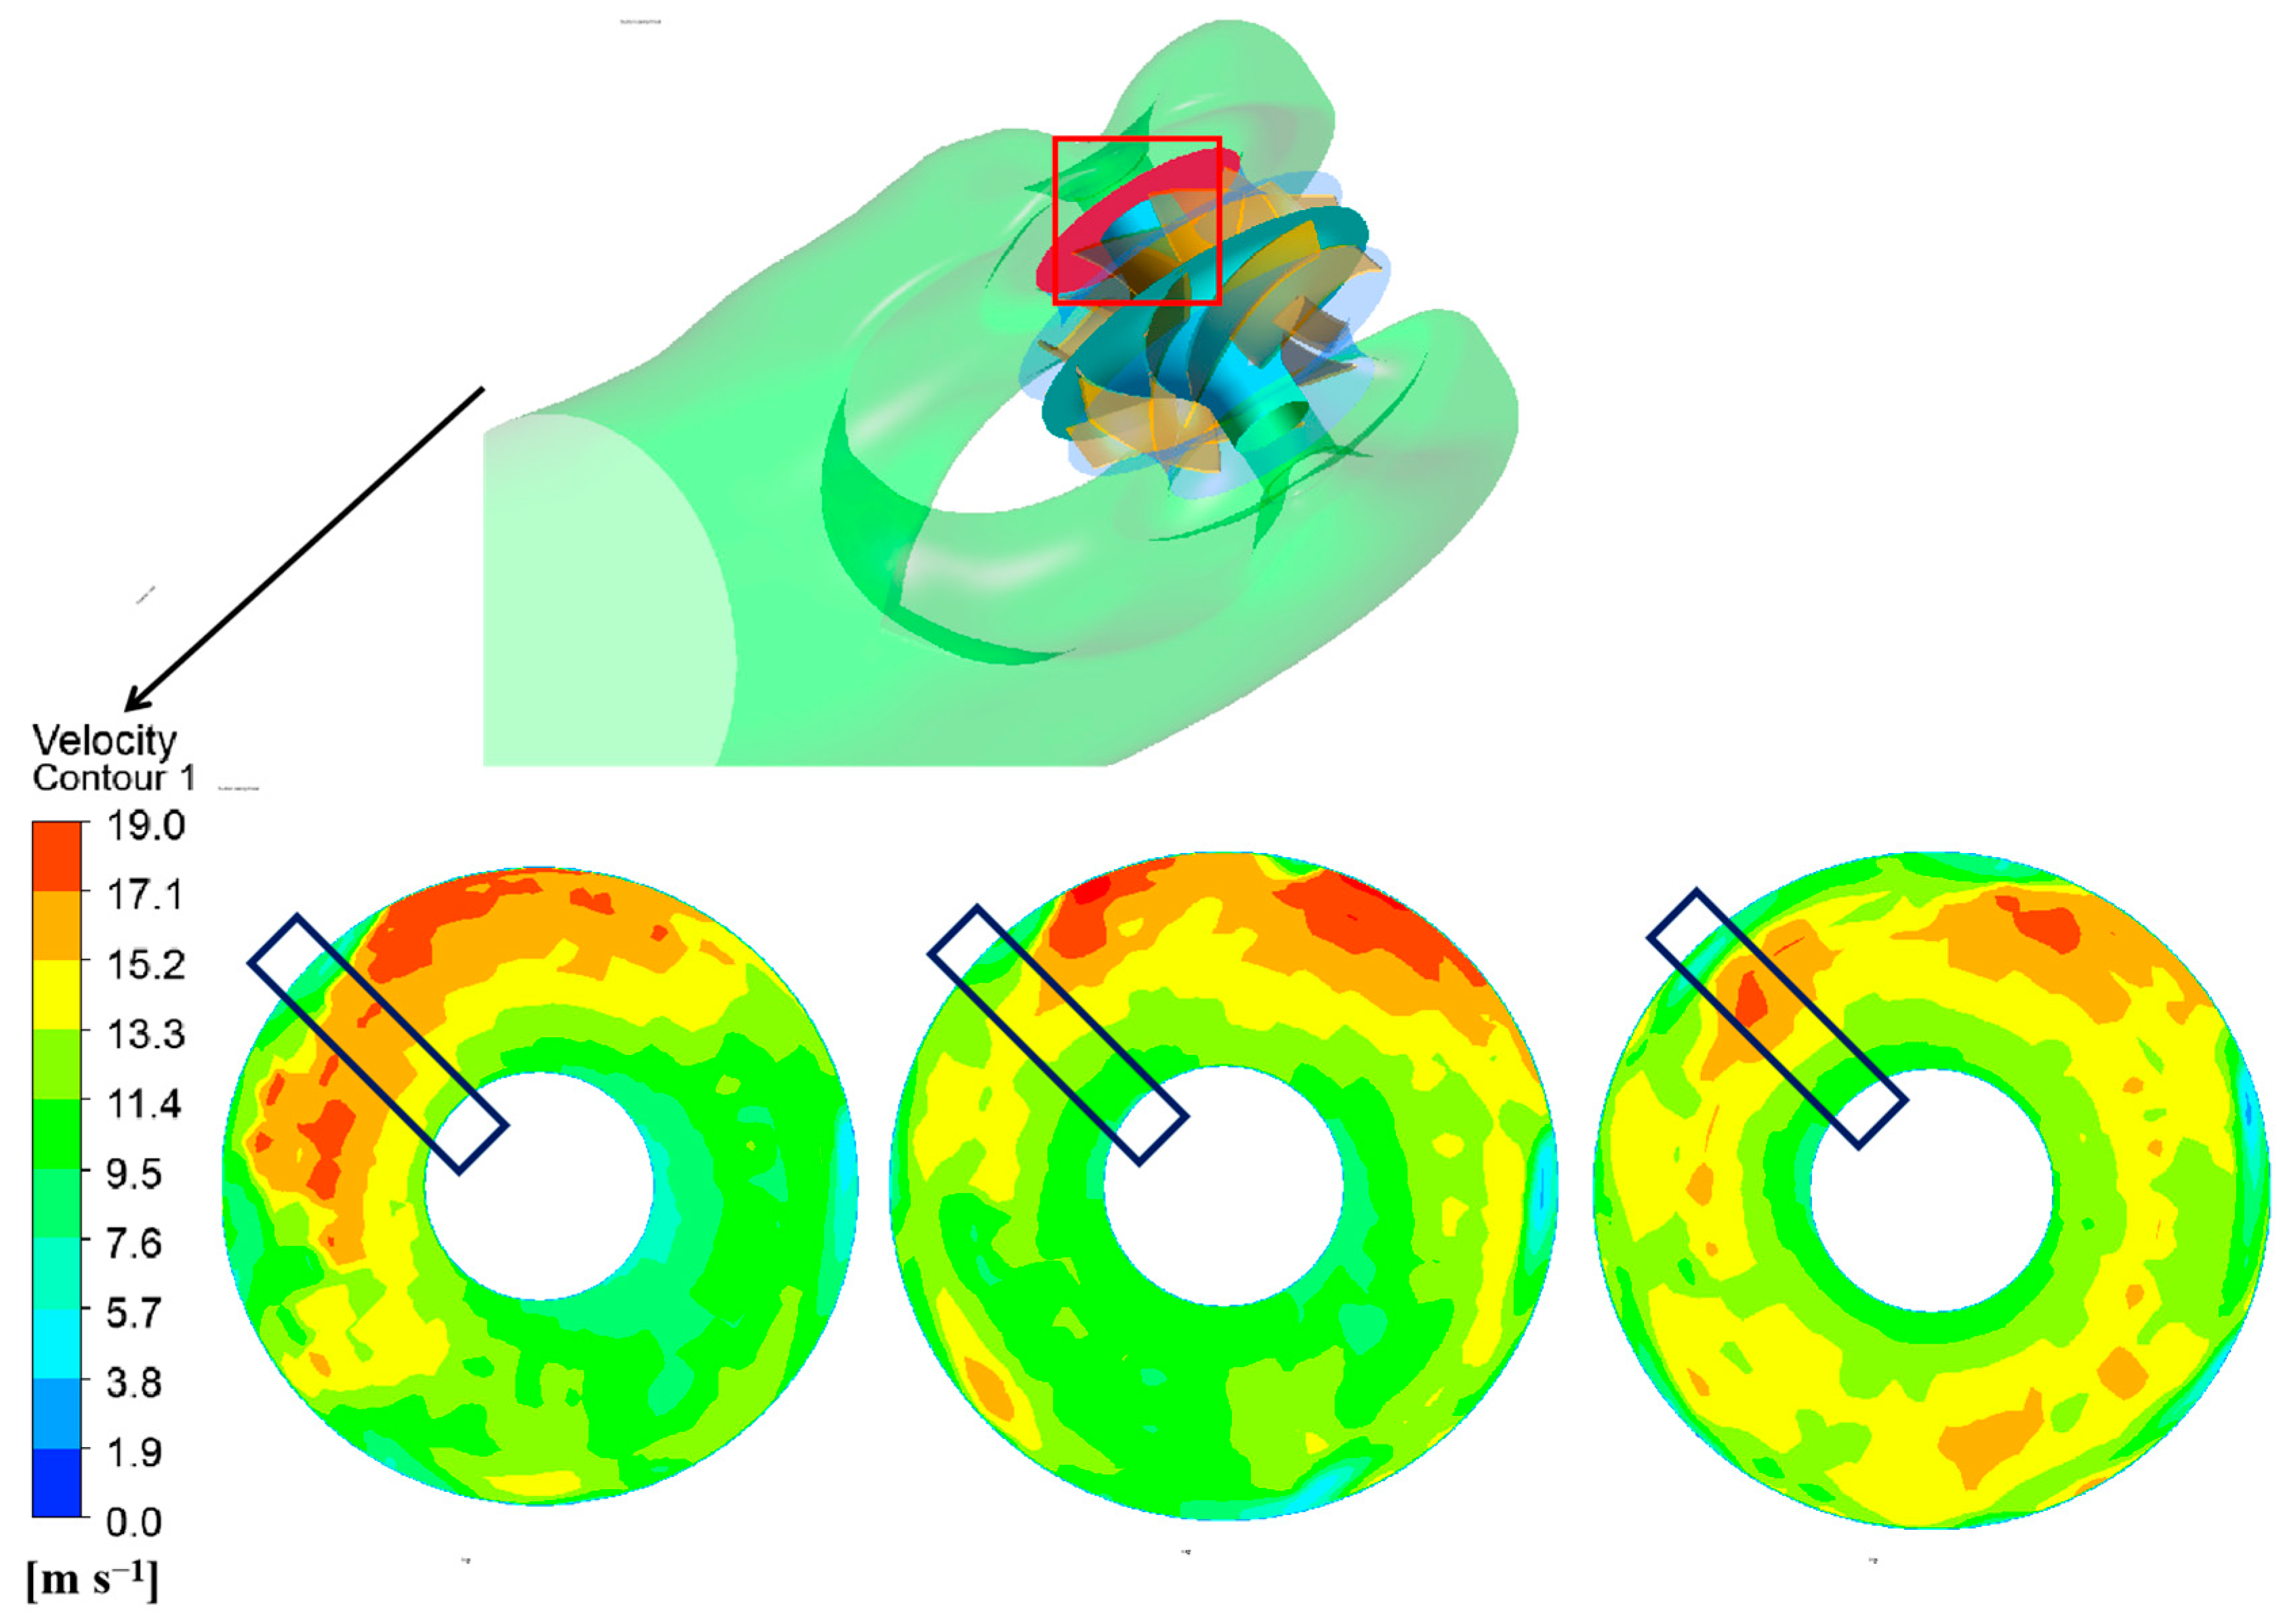
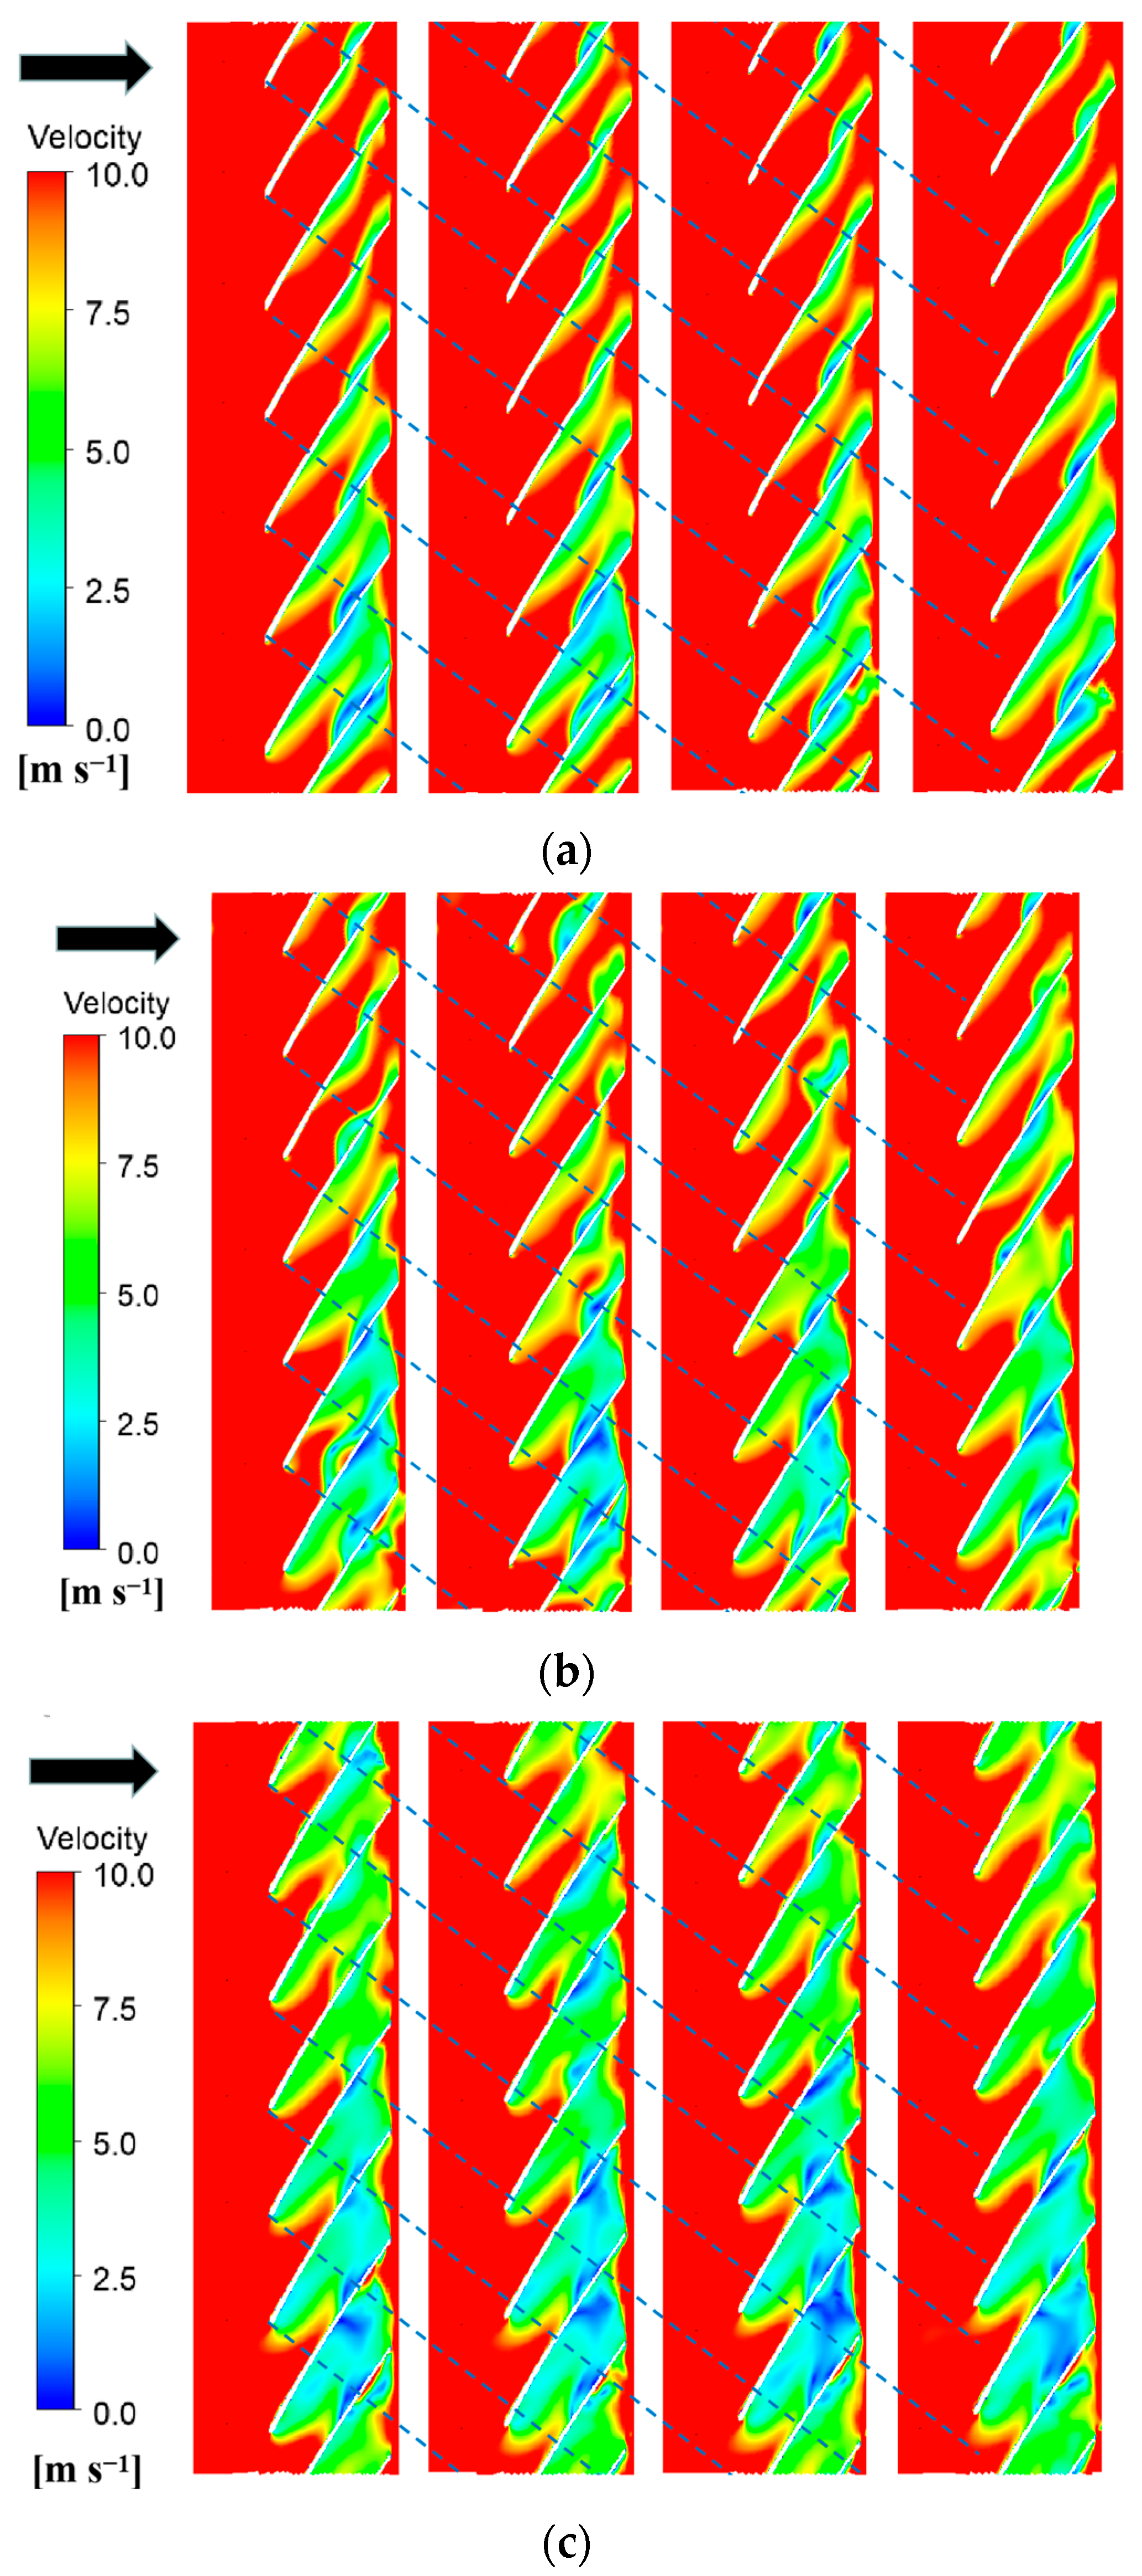
3.3. Analysis of Velocity Shape in the Impeller

Figure 7 displays a velocity cloud for the cross-section located at a distance of 10 mm from the impeller inlet. The black line is the tongue of the suction casing. It can be seen in the figure that as the flow rate decreases, the change in velocity gradient at the inlet gradually increases. At 0.6Q, except for the spiral section of the suction casing, the speed changes evenly, and at 0.4Q, the inlet has a more obvious change. Meanwhile, the suction casing’s tongue region has an elevated velocity due to the intersection of two water streams, thereby creating pressure within the low-pressure zone. The main reason is that the suction casing has produced chaotic vortices, which then enter the impeller and affect the rotating state of the blade.
Figure 8 shows the blade numbers. It provides a reference for the subsequent discussion of the vortex position.
Figure 9 shows the blade-to-blade expansion speed diagram inside the impeller, span = 0.5. When the flow rate gradually decreases, the speed in the impeller also gradually decreases, which seriously affects the internal flow pattern. This results in the low-speed zone occupying most of the blade’s interior, causing a decrease in efficiency. Meanwhile, at 0.6Q, the main low-speed zone is between blade 4 and blade 5, while at 0.4Q, except between blade 7 and blade 1, the other flow channels are covered by the low-speed zone.
Figure 10 shows the pressure cloud image and flow diagram of the impeller, with partial amplification. From the flow diagram, it can be seen that there are multiple obvious vortices in the inner blades, and the vortices gradually increase as the flow rate decreases. Vortex groups A, C, and D are more obvious. At 0.6Q, vortexes are generated, indicating that the internal vortex generated at low flow rates is the main influence on the compression of the water flow. The B vortex is generated at 0.5Q and becomes larger at 0.4Q. At 0.6Q, the C vortex group on the working surface of blade No.4 is the main influence on the internal flow. While the A and D vortex groups are in the newly generated stage and gradually expand, which is very obvious at 0.4Q. The B vortex group is generated on the back of blade 2, and the positions of the vortex group are located in the middle and back of the blade. The dense flow lines are visible in the darker area of the figure. The main reason is that the vortices between the blades affect the flow channels and result in compression of the flow at the blade exit. A comparison can be made between the blade exits at 0.4Q and 0.

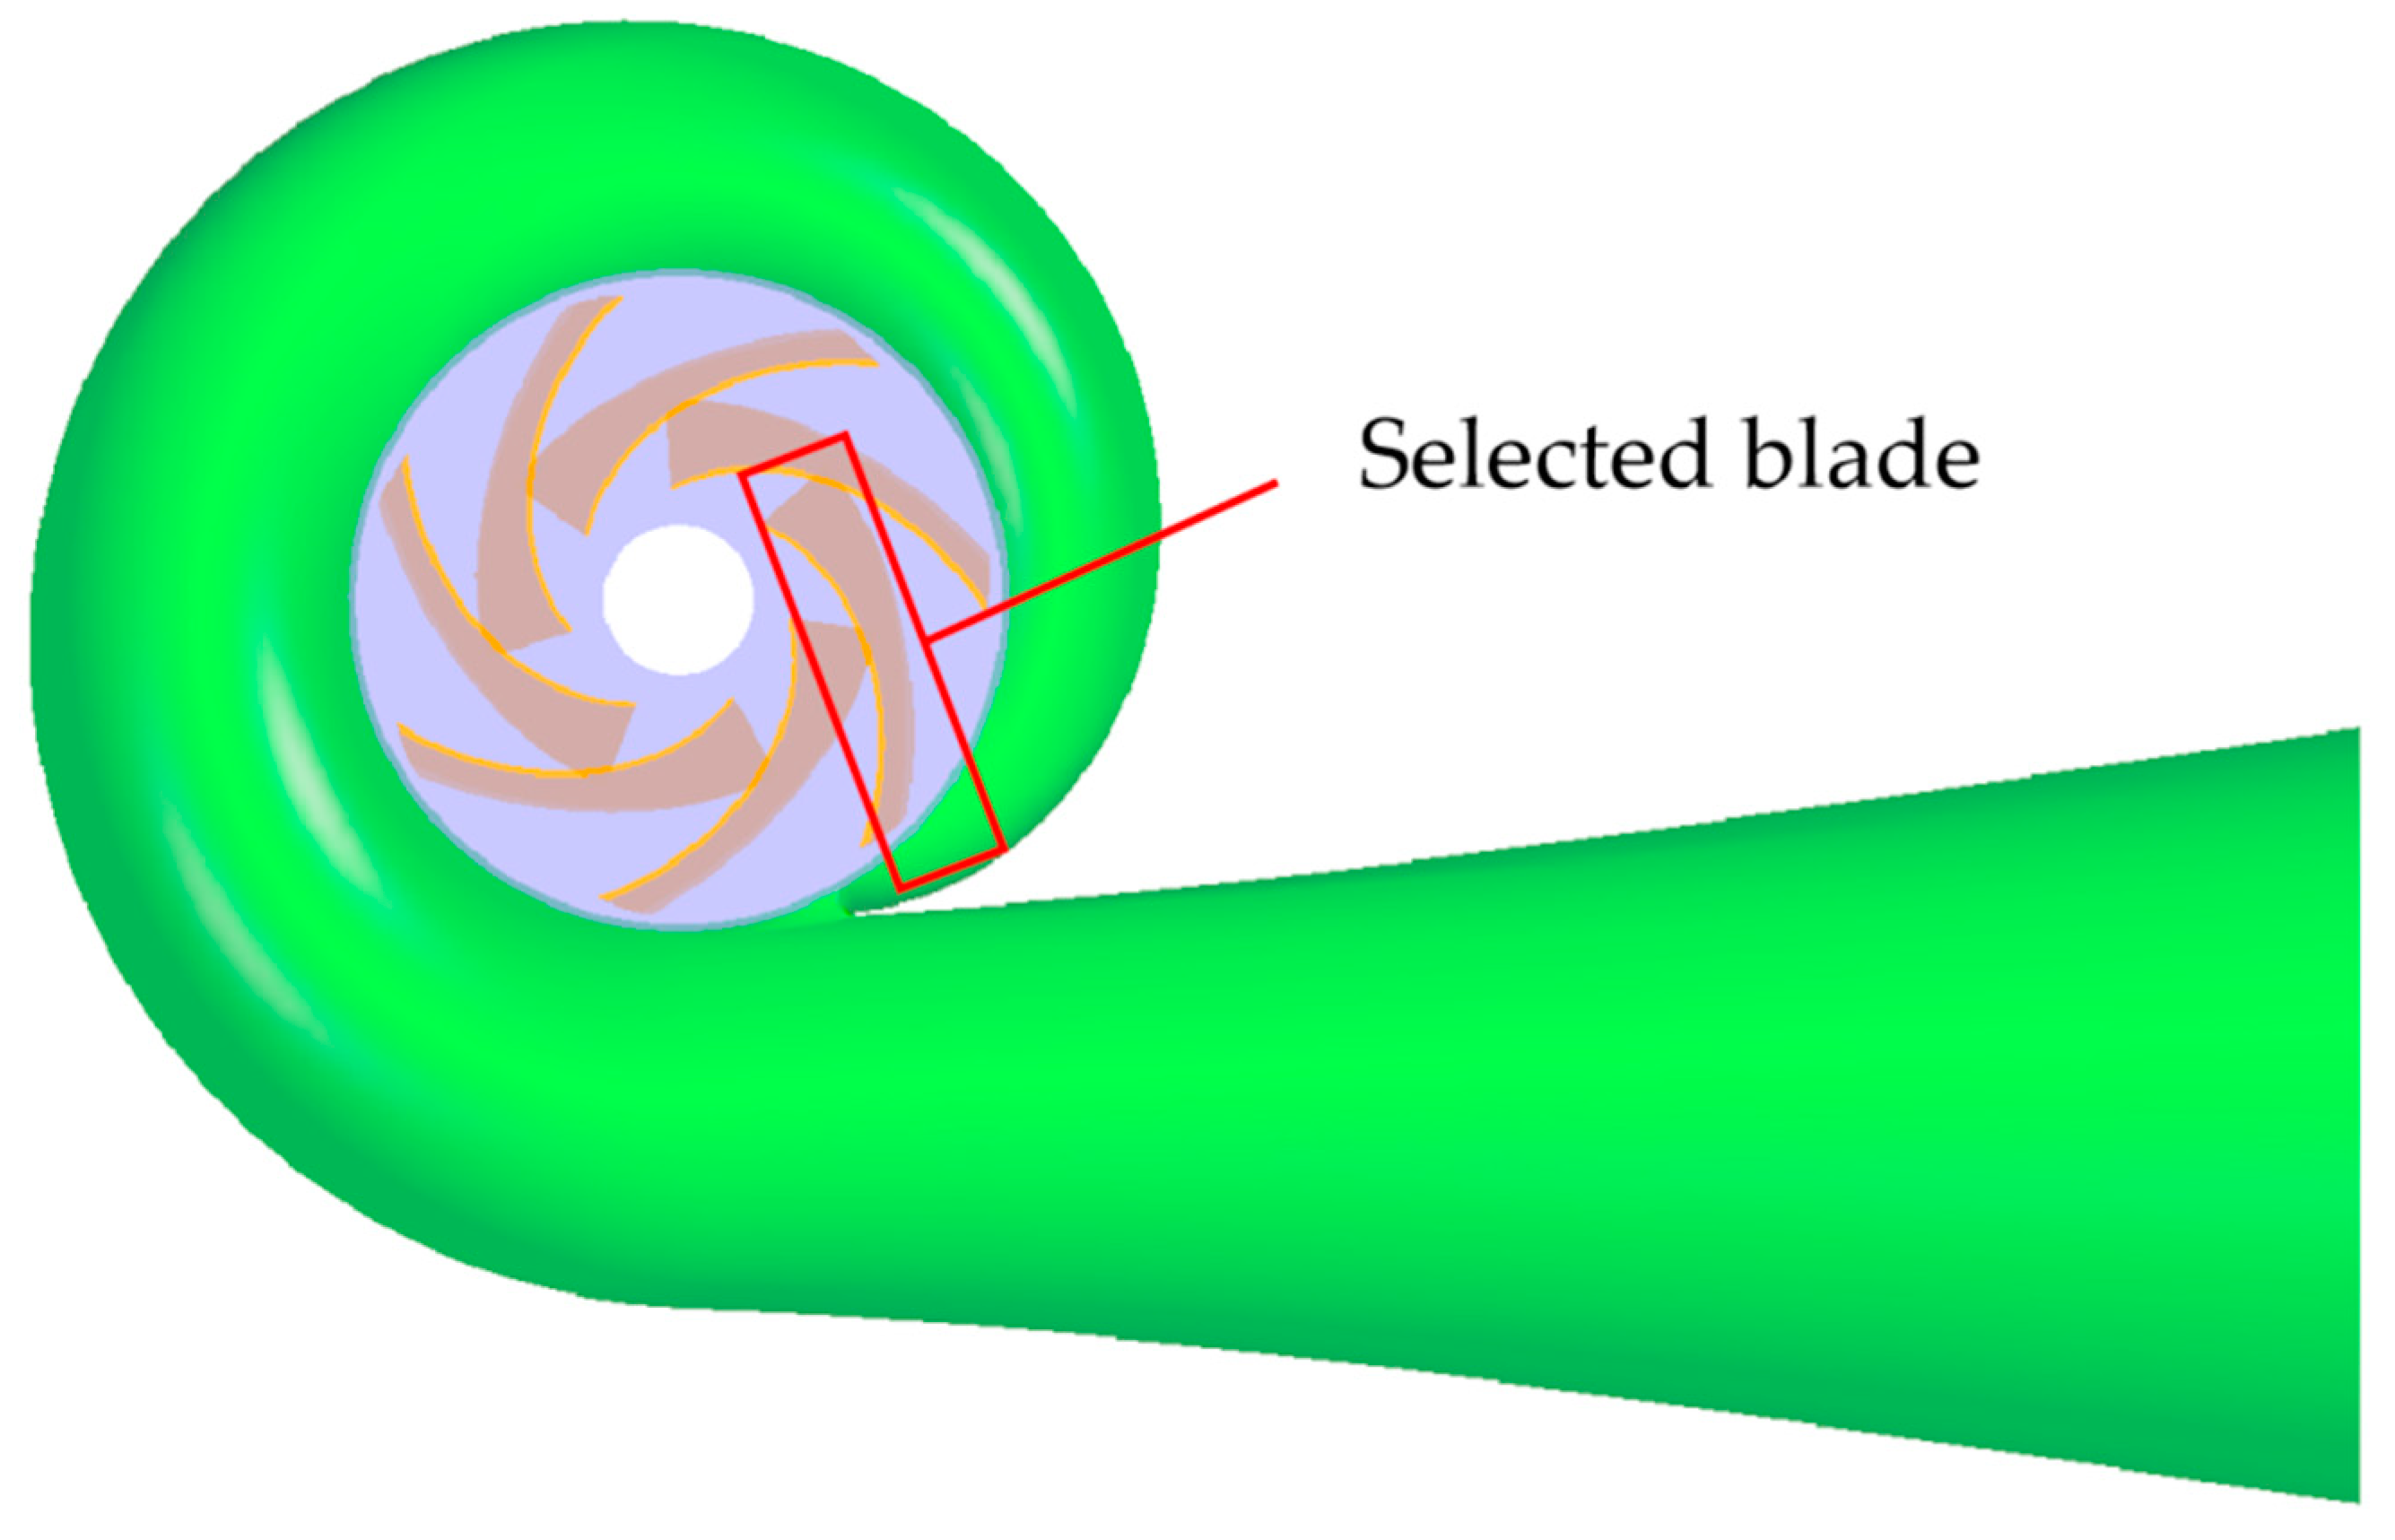
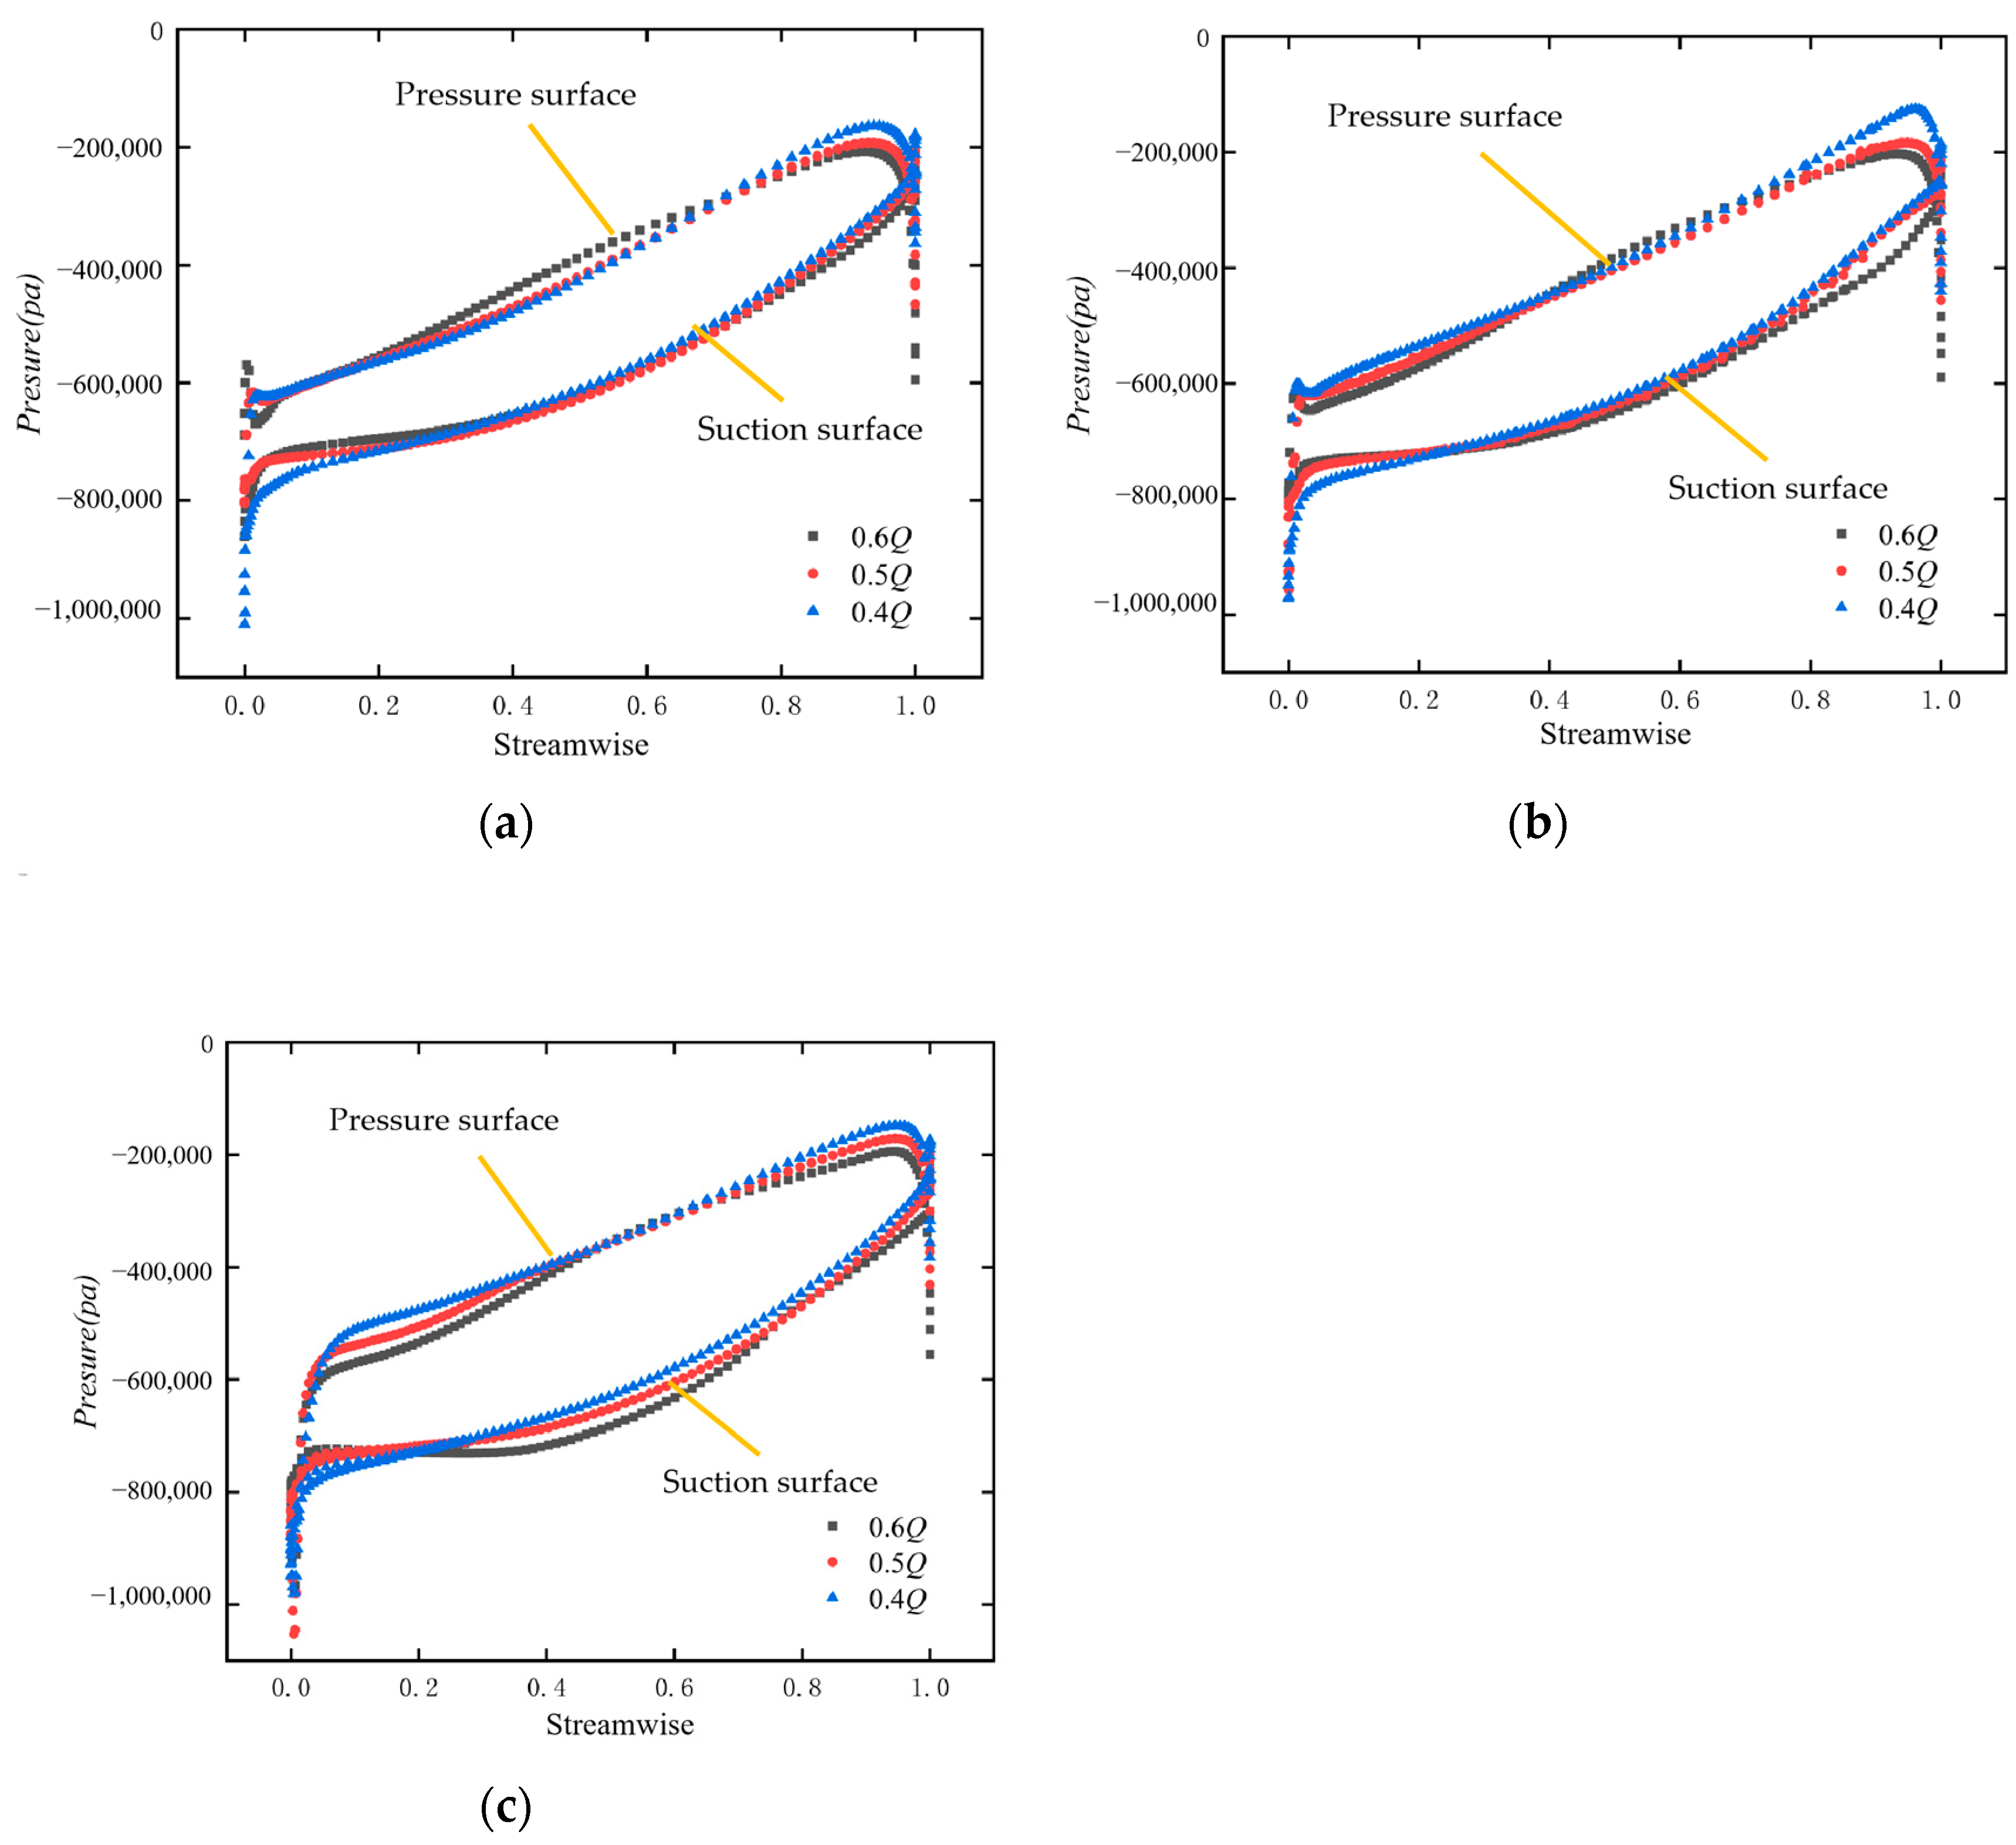
3.4. Blade Load Analysis

Through the above research, it is understood that there are a large number of stall vortices in the blade, so it is necessary to explore whether they affect the blade and cause structural damage. Therefore, the single-blade load can be calculated. Figure 11 shows the selected blade position. The outlet is close to the casing tongue causing a more turbulent flow resulting in a greater change of load borne by the blade.
Figure 12 shows the blade load diagram. They are the blade loads at different positions. The vertical coordinate is the pressure, the horizontal coordinate is the streamwise, 0 represents the blade inlet, and 1 represents the blade outlet. In summary, under the condition of a low flow rate, the slope of the pressure curve on the blade is greater, which means that from the inlet to the outlet, more stalling vorticity will continuously impact the blade under a low flow rate. Especially in Figure 12b,c, the suction surface and pressure surface showed a more obvious trend. When span = 0.5, at the exit of the blade. When span = 0.9, at the entrance of the blade, this is because the water flow into the casing has just been received through the rear cover plate, rather than the inlet of the impeller. At the same time, the load trend of 0.5Q and 0.6Q is similar, with a significant deviation at 0.4Q Therefore, after obtaining the simulation results, it is necessary to consider the situation where the blade load will suddenly increase below 0.4Q in the actual design.

3.5. Research on Unsteady Flow in Impeller

Figure 13 illustrates the unsteady calculation of velocity cloud imagery between the blades in distinct periods, revealing the internal flow within the blade channel. Each blade is numbered from #1 to #7, diagonally drawn and connected to the other blades. The liquid flows from the left to the right, demonstrating four flow attributes in a single cycle.
In Figure 13a, there are fewer low-speed zones, along with noticeable inhomogeneity in the reflux near each blade during a specified time period, even over time. Since the position of the rotational stall shown in Figure 9 also matches the result of the 4/4T period in the unsteady calculation, it can be determined that the main positions prone to vortices are located in the upper part of the spiral section of the suction casing, which is concentrated in the low-pressure area near the blade passage.
In Figure 13b,c, it can be found that the main vortex is still located at the pump cover and gradually becomes larger as the flow rate decreases. Meanwhile, a large number of low-speed zones are also gradually generated in other blades, which is confirmed by the stall in Figure 9. Especially at the flow rate of 0.4Q, in 2/4T, it is evident that the front and back surfaces of the impeller blades have experienced varying degrees of stall. Over time, this has slightly improved but has had an impact on the impeller outlet during rotation.
Figure 14 shows the internal vortices of the impeller at 0.4Q (span = 0.5). For every 20° selection, you can see the internal vortex situation. It can be found that the vorticity rises between 60° and 160° and peaks around 100°, thereby confirming that the dominant location of the vorticity is focused on the pump cover (the upper section of the casing). At the same time, the high-speed vortices are mainly concentrated at the inlet of the blade and the back of the blade outlet. Also, irregular internal flow creates high-speed vortices at the impeller outlet, influencing the volute’s flow state.

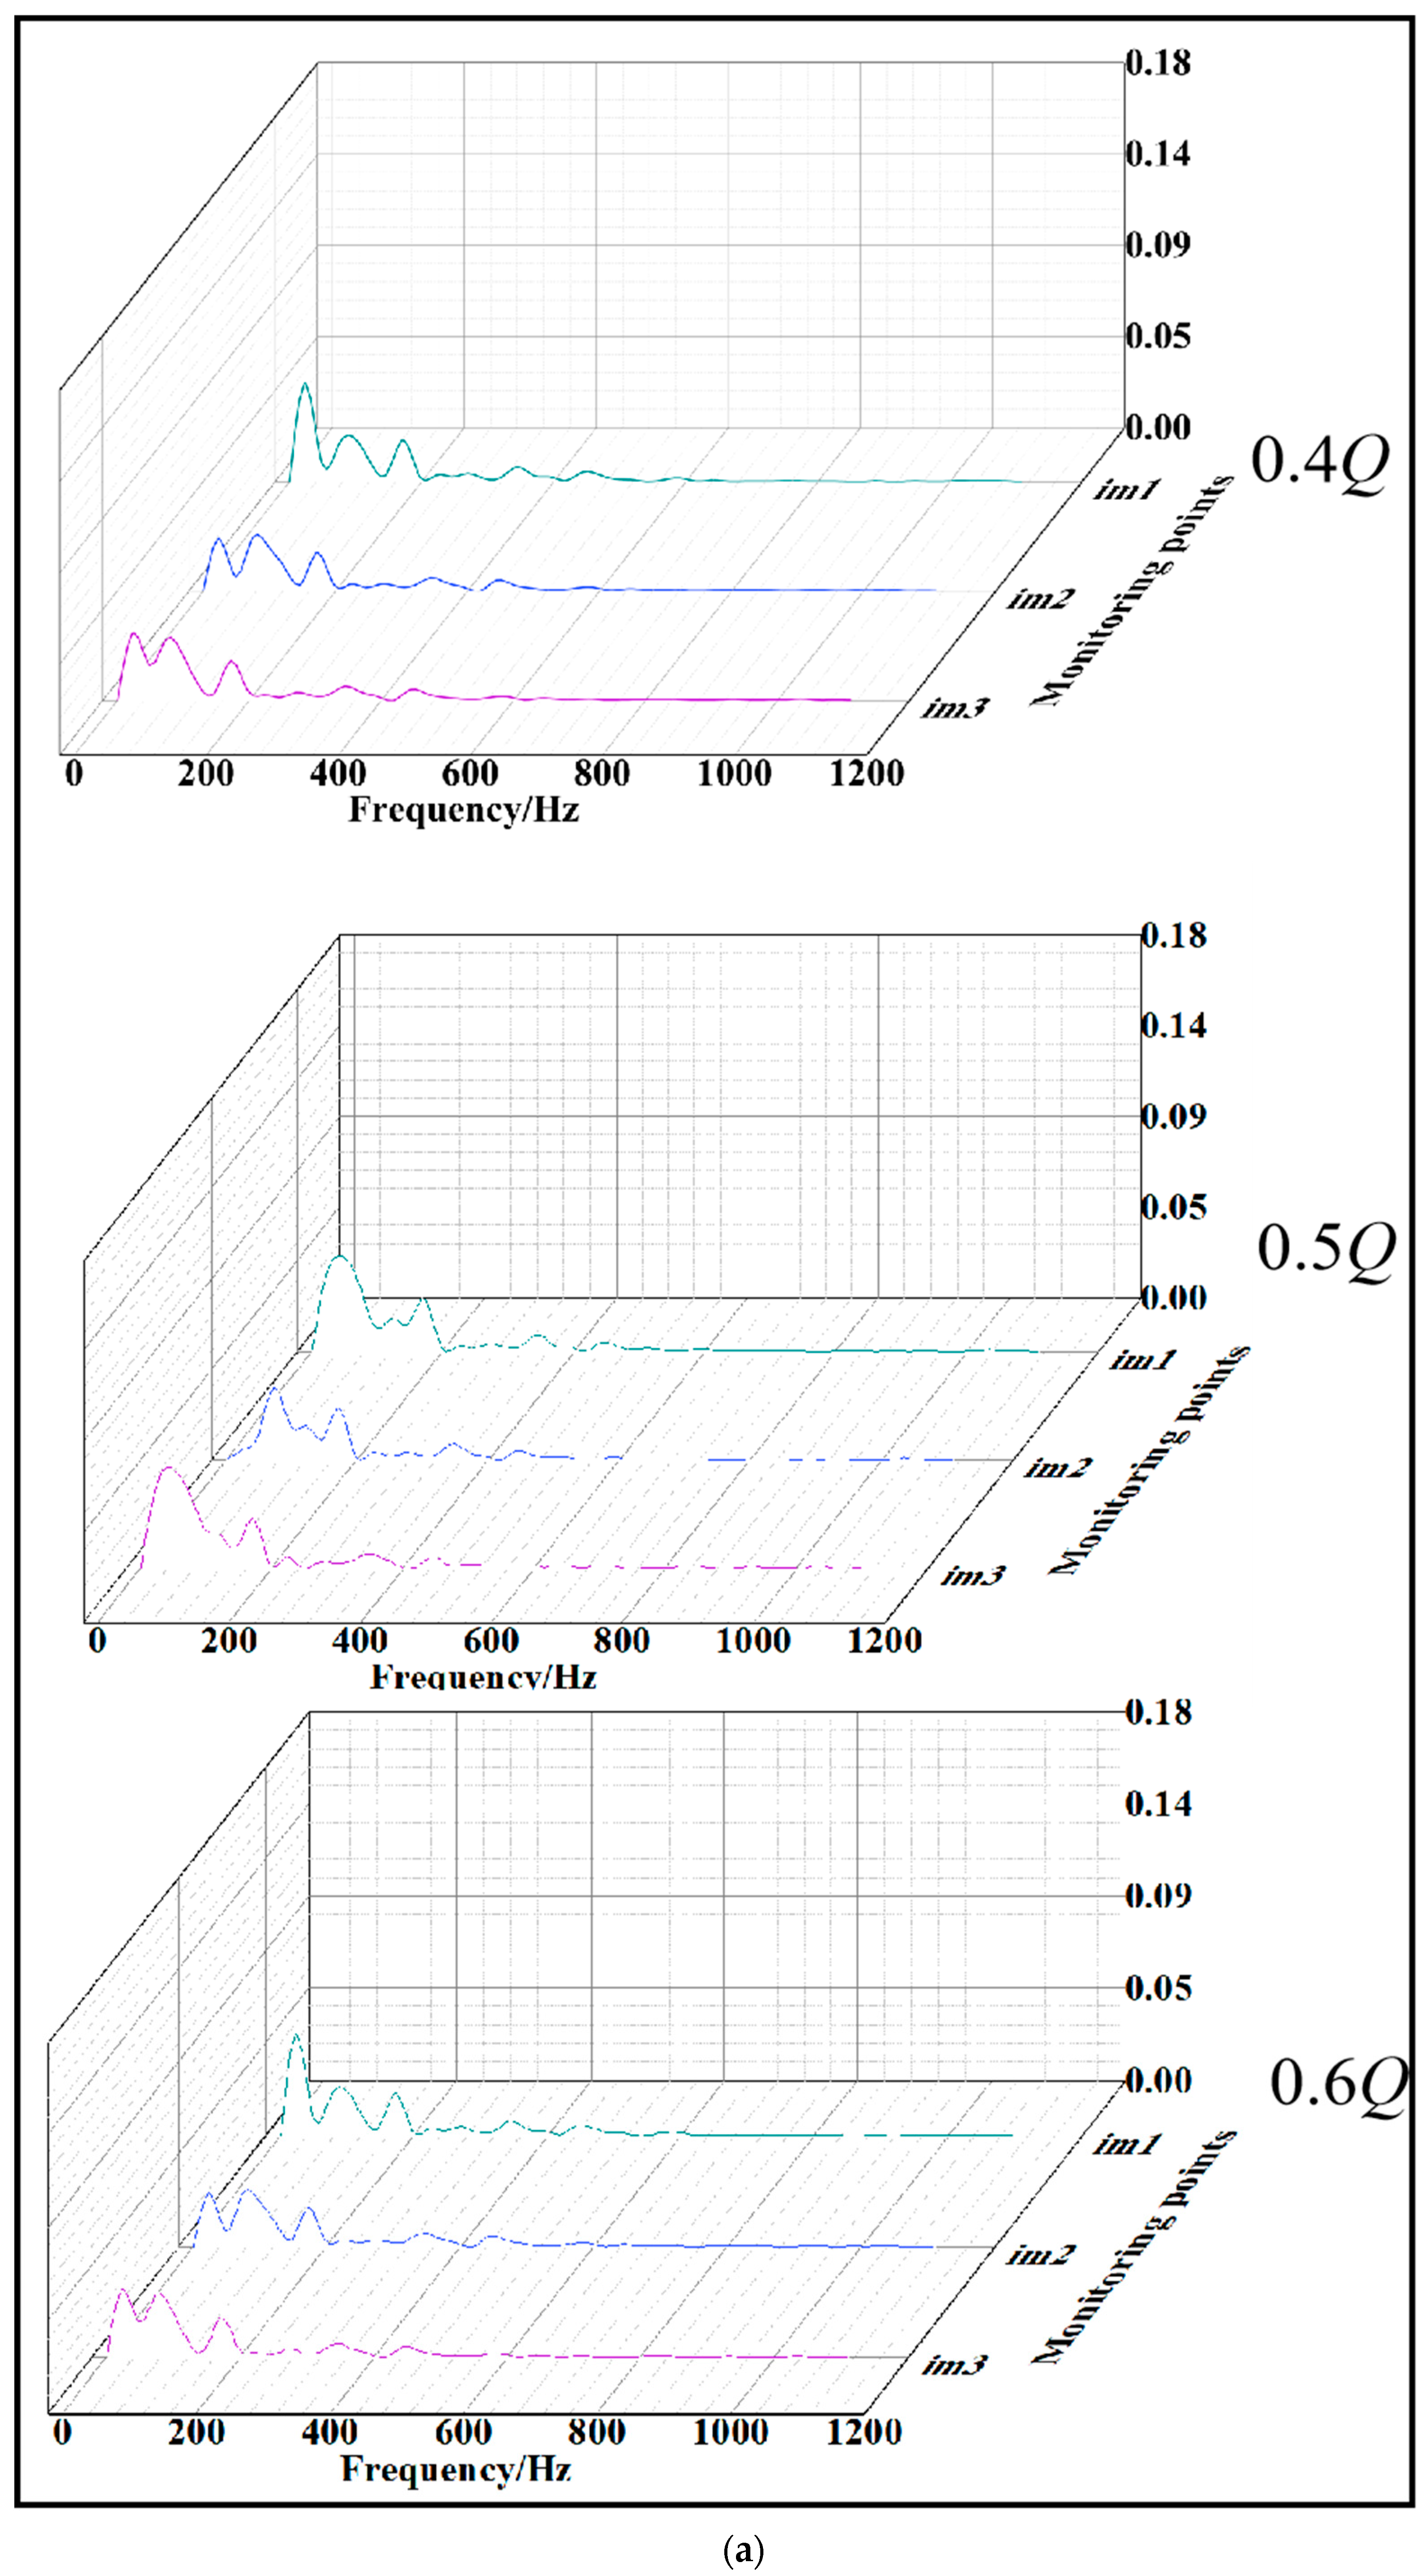
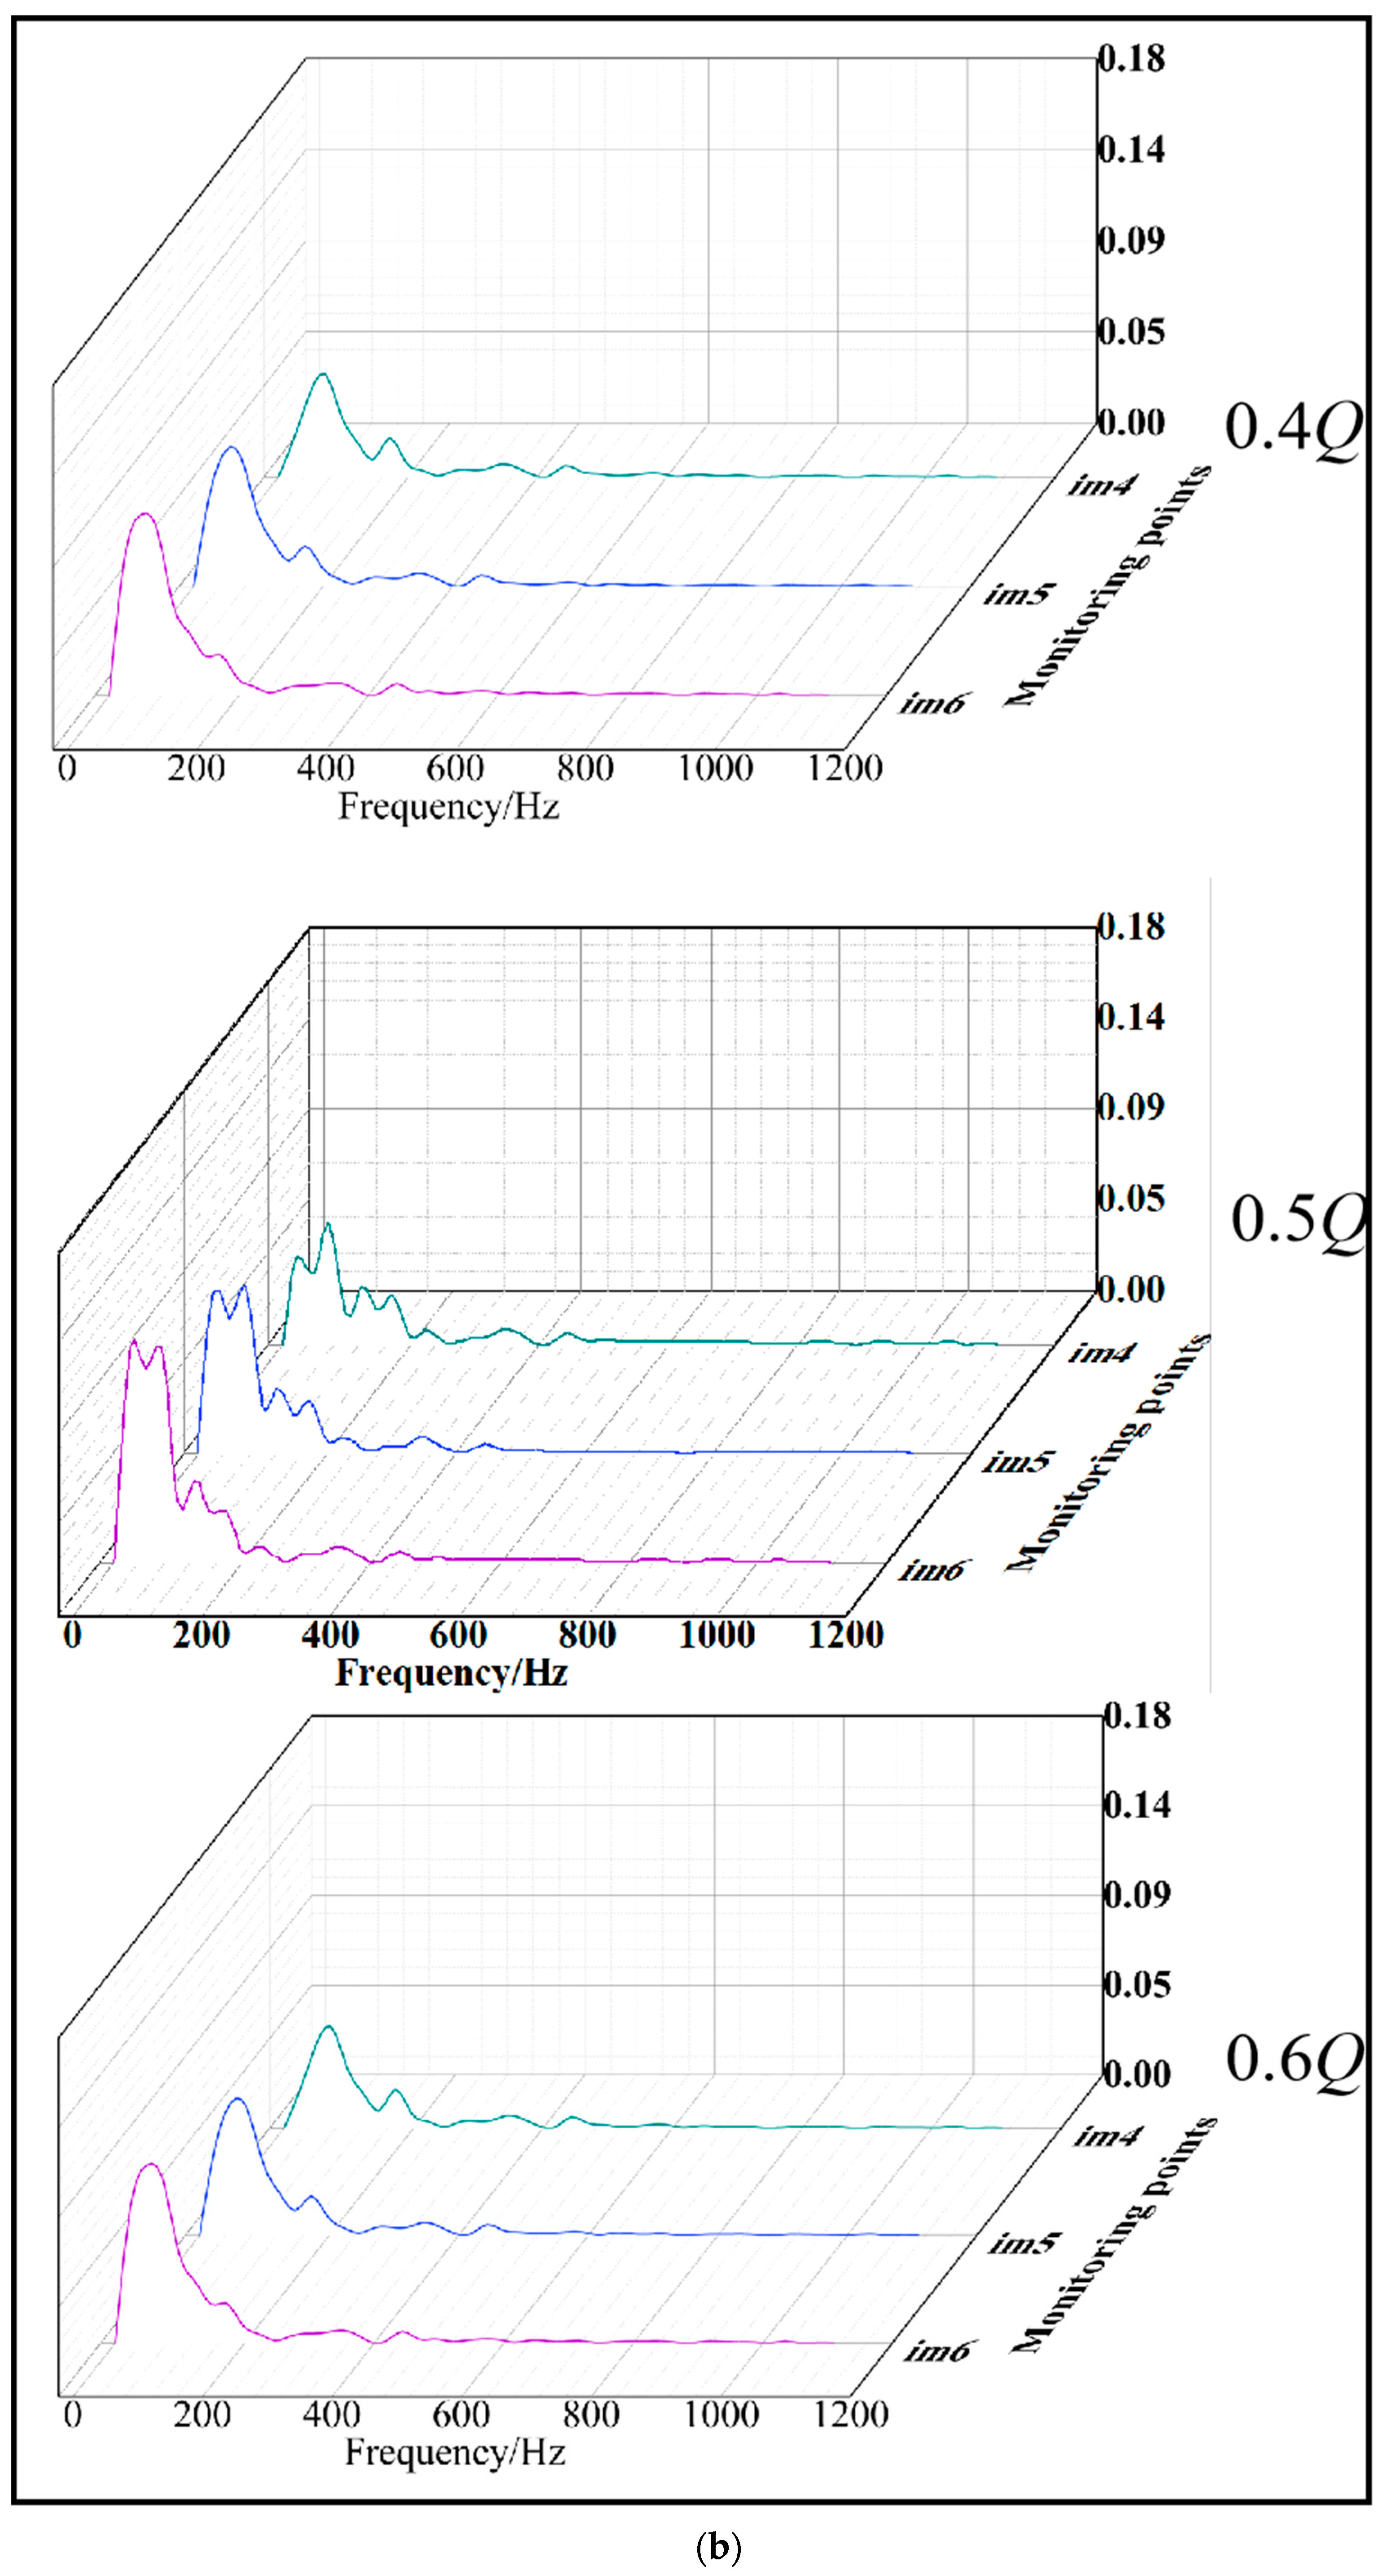
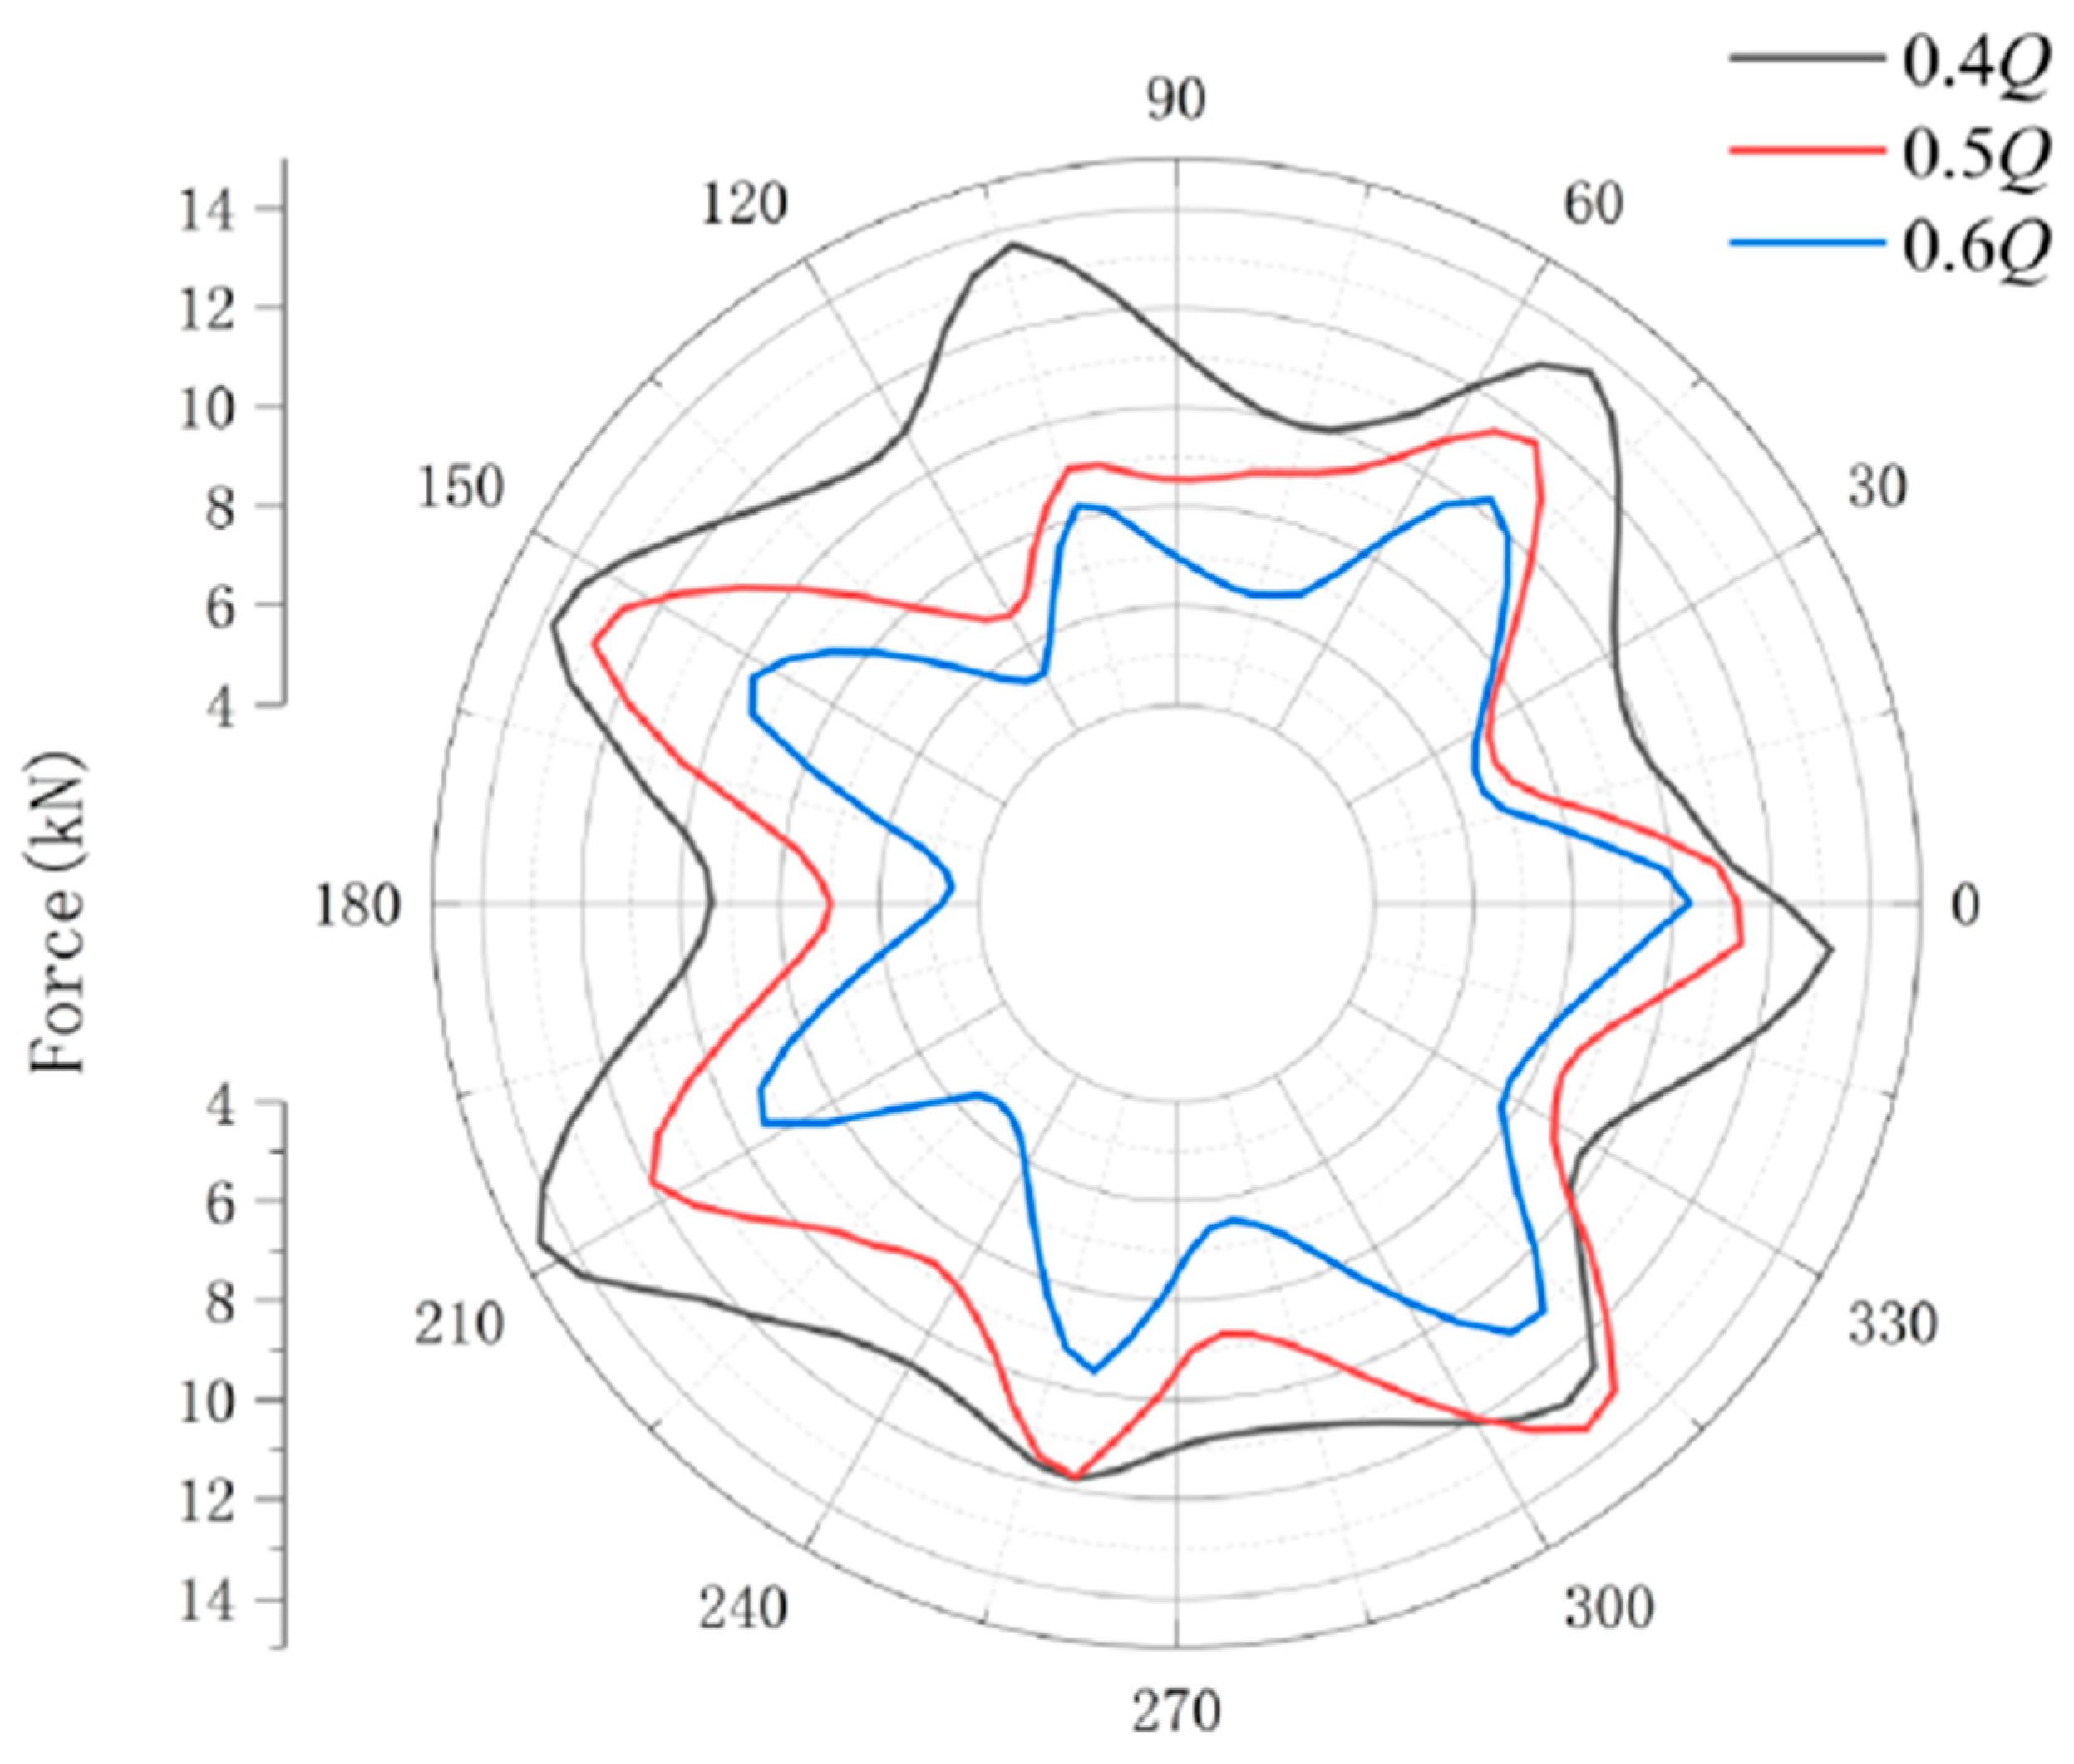
3.6. Research on Impeller Pressure Pulsation and Internal Radial Force

In order to analyze the pressure distribution and pulsation in the pump, monitoring points are set at different positions, as shown in Figure 15. The monitoring points in the impeller are distributed at 3 different radii from the inlet to the outlet of the blade, that is, the inlet, the outlet, and 0.5 times the length of the blade, and are distributed on the middle section of the impeller. At the same time, the flow state on the pressure surface, the middle of the flow channel, and the suction surface of the blade are observed.
Figure 16 shows the inner frequency domain characteristics of the impeller at different flow rates and positions. The frequency domain data of the time domain signal is obtained using the Fourier transform (FFT). It can be seen from the figure that under the same flow rate, there is a similar pressure pulsation law between 0.5 times the blade length and the inside of the blade outlet, while the blade inlet is different, mainly due to the problems of backflow caused by fluid impact on the leading edge of the blade.
The main frequency of each monitoring point is the axial frequency (24.67 Hz), followed by the triple axial frequency (74.01 Hz) and the blade frequency (172.69 Hz). This suggests that the pressure pulsation on the impeller at this moment is mainly caused by the rotating movement of the shaft, which also conforms to the pulsation characteristics of the centrifugal pump at low flow rate conditions. Especially in the low-frequency segment, the problems of impeller backflow and secondary flow will cause pressure pulsation in the flow field.
Figure 17 shows amplitude changes of different monitoring points under the same flow rate. It can be found that under the same flow rate, there is an increase in the amplitude of pressure fluctuation in the low-frequency range from the impeller’s inlet to its outlet. The intensity of these fluctuations also increases as the outlet gets closer, which in turn corresponds to greater turbulence in the flow field. These findings suggest that the instability phenomenon in the flow field is amplified. Moreover, the closer to the outlet of the impeller, the more obvious the dynamic and stationary interference of the impeller, so the amplitude of pressure pulsation at the blade frequency of the monitoring point at the outlet is higher than that at other locations. Additionally, as the flow reduces at the same monitoring point, the pulsation amplitude increases and the flow becomes even more turbulent.
The force formula of the impeller in x direction and y direction is edited by the formula editor in CFX 2022. The radial force of the impeller is monitored by the edited formula, and the transient radial force distribution of the centrifugal pump impeller is obtained. Figure 18 shows the comparison of radial forces on the impeller under three flow rate conditions. It can be seen from the figure that because the pump body operates under low flow rate conditions, the flow rate of each flow channel of the pump impeller and the pressure distribution of the impeller outlet are asymmetrically distributed. The variation of radial force under low flow rate conditions still presents a certain regularity, and the closer to the design condition, the smaller the radial force on the impeller.

4. Conclusions

This study conducted simulation and experimental research on the double suction pump under three low flow rate conditions, explored the law of internal flow, and studied the possible instability phenomenon. The findings of this analysis are summarized below.
(1) At 0.6Q, the performance is significantly reduced. This is mainly due to the fact that the suction casing has produced a certain amount of vortices, which directly affects the flow pattern of water when it enters the impeller. The main vortex is located on the cover side of the medium-open double-suction pump and gradually fills the flow channel as the flow rate decreases.
(2) Under low flow rate conditions, the water flows into the impeller and then gradually produces a vortex, and the position is concentrated in the middle and back of the blade. Through the transient study, it is found that the low-speed zone is also concentrated on the side of the pump cover, which seriously affects the flow state at the impeller outlet. At the same time, below 0.4Q, there will be a sudden increase in blade load.
(3) The pressure pulsation at low flow rate conditions, especially at 0.4Q, has a significantly larger amplitude and does not have obvious periodicity. In addition, under the same flow rate conditions, the vibration rules of the blade suction surface, pressure surface, and the middle of the flow channel are consistent under the same radius, especially at 0.5 times the blade length. The pressure surface of the blade has a larger amplitude, and then gradually decreases to the suction surface. The frequency domain diagram also proved that that the main frequency is the axis frequency (24.67 Hz), followed by the triple axis frequency (74.01 Hz) and blade frequency (172.69 Hz), indicating that the pressure pulsation on the impeller at this moment is mainly caused by the rotating movement of the shaft, and the closer the outlet is, the greater the amplitude of the pressure pulsation is, the more chaotic the flow channel is.
(4) The radial force on the impeller increases with a decrease in the flow rate, and shows a certain regularity. The main frequency of the radial force is axial frequency, followed by blade frequency, which is consistent with the structure of pressure pulsation.

Author Contributions

Conceptualization, J.Z.; Methodology, Q.F.; Software, D.Y.; Validation, W.S.; Investigation, W.S.; Resources, Q.F. and R.Z.; Writing—original draft, D.Y. All authors have read and agreed to the published version of the manuscript.

Funding

This research was funded by [Natural Science Foun-dation of China (Grant No. 51906085, Grant U20A20292)].

Data Availability Statement

Not applicable.

Conflicts of Interest

The authors declare no conflict of interest.

References

  1. Jin, F.; Yao, Z.; Li, D.; Xiao, R.; Wang, F.; He, C. Experimental Investigation of Transient Characteristics of a Double Suction Centrifugal Pump System during Starting Period. Energies 2019, 12, 4135. [Google Scholar] [CrossRef]
  2. Botero, F.; Hasmatuchi, V.; Roth, S.; Farhat, M. Non-intrusive detection of rotating stall in pump-turbines. Mech. Syst. Signal Process 2014, 48, 162–173. [Google Scholar] [CrossRef]
  3. Lu, J.; Yuan, S.; Luo, Y.; Yuan, J.; Zhou, B.; Sun, H. Numerical and experimental investigation on the development of cavitation in a centrifugal pump. Proc. Inst. Mech. Eng. Part E J. Process Mech. Eng. 2014, 230, 171–182. [Google Scholar] [CrossRef]
  4. Li, D.; Qin, Y.; Zuo, Z.; Wang, H.; Liu, S.; Wei, X. Numerical simulation on pump transient characteristic in a model pump turbine. J. Fluid Eng. 2019, 141, 111101. [Google Scholar] [CrossRef]
  5. Feng, J.; Ge, Z.; Yang, H.; Zhu, G.; Li, C.; Luo, X. Rotating stall characteristics in the vaned diffuser of a centrifugal pump. Ocean Eng. 2021, 229, 108955. [Google Scholar] [CrossRef]
  6. Cui, B.L.; Zhang, Y.B.; Huang, Y.K. Analysis of the pressure pulsation and vibration in a low-specific-speed centrifugal pump. J. Fluid Eng. 2020, 143, 021201. [Google Scholar] [CrossRef]
  7. Li, W.; Ji, L.; Li, E.; Shi, W.; Agarwal, R.; Zhou, L. Numerical investigation of energy loss mechanism of mixedflow pump under stall condition. Renew. Energy 2021, 167, 740–760. [Google Scholar] [CrossRef]
  8. Zhang, W.; Zhu, B.; Yu, Z.; Yang, C. Numerical study of pressure fluctuation in the whole flow passage of a low specific speed mixed-flow pump. Adv. Mech. Eng. 2017, 9, 1–11. [Google Scholar] [CrossRef]
  9. Wang, K.; Zhang, Z.; Xia, C.; Liu, Z. Experimental investigation of pressure fluctuation, vibration, and noise in a multistage pump. Shock. Vib. 2018, 2018, 2784079. [Google Scholar] [CrossRef]
  10. Pedersen, N.; Larsen, P.S.; Jacobsen, C.B. Flow in a Centrifugal Pump Impeller at Design and Off-Design Conditions: Particle Image Velocimetry (PIV) and Laser Doppler Velocimetry (LDV) Measurements. J. Fluids Eng. 2003, 125, 61–72. [Google Scholar] [CrossRef]
  11. Byskov, R.K.; Jacobsen, C.B.; Pedersen, N. Flow in a Centrifugal Pump Impeller at Design and Off-Design Conditions: Large Eddy Simulations. J. Fluids Eng. 2003, 125, 73–83. [Google Scholar] [CrossRef]
  12. Zhao, X.; Xiao, Y.; Wang, Z.; Luo, Y.; Cao, L. Unsteady Flow and Pressure Pulsation Characteristics Analysis of Rotating Stall in Centrifugal Pumps Under Off-Design Conditions. J. Fluids Eng. 2017, 140, 021105. [Google Scholar] [CrossRef]
  13. Jia, X.-Q.; Zhu, Z.-C.; Yu, X.-L.; Zhang, Y.-L. Internal unsteady flow characteristics of centrifugal pump based on entropy generation rate and vibration energy. Proc. Inst. Mech. Eng. 2018, 233, 456–473. [Google Scholar] [CrossRef]
  14. Ni, D.; Zhang, N.; Gao, B.; Li, Z.; Yang, M. Dynamic measurements on unsteady pressure pulsations and flow distributions in a nuclear reactor coolant pump. Energy 2020, 198, 117305. [Google Scholar] [CrossRef]
  15. Zheng, L.L.; Chen, X.P.; Zhang, W.; Zhu, Z.C.; Cheng, C. Investigation on characteristics of pressure fluctuation in a cen-trifugal pump with clearance flow. J. Mech. Sci. Technol. 2020, 34, 3657–3666. [Google Scholar] [CrossRef]
  16. Gao, B.; Zhang, N.; Li, Z.; Ni, D.; Yang, M. Influence of the Blade Trailing Edge Profile on the Performance and Unsteady Pressure Pulsations in a Low Specific Speed Centrifugal Pump. J. Fluids Eng. 2016, 138, 051106. [Google Scholar] [CrossRef]
  17. Wang, Z.; Qian, Z.; Lu, J.; Wu, P. Effects of flow rate and rotational speed on pressure fluctuations in a double-suction cen-trifugal pump. Energy 2018, 170, 212–227. [Google Scholar] [CrossRef]
  18. Huang, P.; Xiao, Y.; Zhang, J.; Cai, H.; Song, H. The Influence of Flow Rates on Pressure Fluctuation in the Pump Mode of Pump-Turbine with Splitter Blades. Appl. Sci. 2020, 10, 6752. [Google Scholar] [CrossRef]
  19. Lucius, A.; Brenner, G. Numerical simulation and evaluation ofvelocity fluctuations during rotating stall of a centrifugal pump. J. Fluids Eng. Trans. ASME 2011, 133, 081102. [Google Scholar] [CrossRef]
  20. Zhang, N.; Yang, M.; Gao, B.; Li, Z.; Ni, D. Unsteady pressure pulsation and rotating stall characteristics in a centrifugal pump with slope volute. Adv. Mech. Eng. 2014, 6, 710791. [Google Scholar] [CrossRef]
  21. Zhou, P.; Wang, F.; Mou, J. Investigation of rotating stall characteristics in a centrifugal pump impeller at low flow rates. Eng. Comput. 2017, 34, 1849–1873. [Google Scholar] [CrossRef]
  22. Gao, B.; Guo, P.; Zhang, N.; Li, Z.; Yang, M. Unsteady pressure pulsation measurements and analysis of a low specific speed centrifugal pump. J. Fluids Eng. Trans. ASME 2017, 139, 071101. [Google Scholar] [CrossRef]
  23. Gyarmathy, G.; Inderbitzen, A.; Staubli, T. Visualization of rotating stall in a full size water model of a single-stage centrifugal compressor. Houille Blanche 2001, 87, 40–45. [Google Scholar] [CrossRef]
  24. Maeda, H.; Jittani, Y. Unstable head-flow characteristic generation mechanism of a low specific speed mixed flow pump. J. Therm. Sci. 2006, 15, 115–120. [Google Scholar]
  25. Berten, S. Hydrodynamics of High Specific Power Pumps for Off-Design Operating Conditions. Ph.D. Thesis, École Polytechnique Fédérale de Lausanne, Lausanne, Switzerland, 2010. [Google Scholar] [CrossRef]
  26. Pacot, O. Large Scale Computation of the Rotating Stall in a Pump-Turbine using an Overset Finite Element Large Eddy Simulation Numerical Code PAR. 6183. Ph.D. Thesis, École Polytechnique Fédérale de Lausanne, Lausanne, Switzerland, 2014. [Google Scholar] [CrossRef]
  27. Fu, D.-C.; Wang, F.-J.; Zhou, P.-J.; Xiao, R.-F.; Yao, Z.-F. Impact of impeller stagger angles on pressure fluctuation for a double-suction centrifugal pump. Chin. J. Mech. Eng. 2018, 31, 10. [Google Scholar] [CrossRef]
  28. Cheng, W.; Song, W.; Wan, L. Analysis of pressure fluctuation characteristic in the volute tongue of centrifugal pump. Water Power 2018, 44, 59–61. [Google Scholar]
  29. Cao, R.; Si, Q.; Sheng, G.; Lin, G. Influence of the oblique trimmed impeller on pressure fluctuations in centrifugal pump at low flow rate. In Proceedings of the International Conference on Mechanical Design, ICMD 2017 The19th Annual Conference on Mechanical Design, Beijing, China, 13–15 October 2017; pp. 239–251. [Google Scholar]
Figure 1. Model pump and Experimental site diagram: (a) Experimental site; (b) Model pump internal structure.
Water 15 03780 g001
Figure 2. Mesh of the computational domain.
Water 15 03780 g002
Figure 3. Grid independence verification.
Water 15 03780 g003
Figure 4. Comparison of experiment and simulation results.
Water 15 03780 g004
Figure 5. Flow diagram of the suction casing.
Water 15 03780 g005
Figure 6. Velocity vector diagram of cross section at the vortex of the suction casing.
Water 15 03780 g006
Figure 7. Velocity cloud image of the impeller inlet section.
Water 15 03780 g007
Figure 8. Blade numbers.
Water 15 03780 g008
Figure 9. Streamwise velocity contour on a blade-to-blade plane of 0.5 span.
Water 15 03780 g009
Figure 10. Pressure cloud image and flow diagram on blade-to-blade plane of 0.5 span. #A–#D indicates the number of each vortex position; The yellow box shows the partial enlargement.
Water 15 03780 g010
Figure 11. Blade position.
Water 15 03780 g011
Figure 12. Blade loading diagram: (a) 0.1 span; (b) 0.5 span; (c) 0.9 span.
Water 15 03780 g012
Figure 13. Streamwise velocity contour on the blade-to-blade plane of 0.5 span in different degrees: (a) 0.6Q; (b) 0.5Q; (c) 0.4Q.
Water 15 03780 g013
Figure 14. 0.5 span of impeller internal vortex structure diagram.
Water 15 03780 g014
Figure 15. Pressure pulsation monitoring point in the impeller.
Water 15 03780 g015
Figure 16. Frequency domain characteristics of the impeller with different flow rates and positions (a) blade inlet; (b) 0.5 times blade outlet; (c) blade outlet.
Water 15 03780 g016aWater 15 03780 g016bWater 15 03780 g016c
Figure 17. Amplitude changes of different monitoring points under the same flow rate.
Water 15 03780 g017
Figure 18. Radial force on the impeller under different flow rates.
Water 15 03780 g018
Table 1. Specifications of the investigated pump.
Specific speedns162
Design flow rateQopt3400 m3/h
Rotating speedn1480 r/min
Diameter of impeller inletD1324 mm
Diameter of impeller outletD2496 mm
Number of impeller bladesZ7
Table 2. Model conversion.
Correlation ParameterPrototype PumpModel Pump
Scale
0.5830.5670.550.5
Inlet pipe diameter D (mm)600350340330300
Nominal diameter D2 (mm)486283.5275.4267.3243
Flow rate Q (m3/h)3400675618565425
Head H (m)6522.1220.8719.6516.25
Circumferential velocity u (m/s)38.722.622.021.319.4
Reynolds number Re × 10620.126.856.466.085.03
Compliance with criteria (Yes/No)YesYesYesNoNo
Table 3. Grid y+ value of the main components of the double suction pump.
ComponentMinimum ValueMaximum ValueAverage Value
Impeller21.441375.81690.50
Volute24.675342.502954.30
Suction casing17.745043.212621.40
Table 4. Details of numerical setup.
Governing equationReynolds-averaged Navier-Stokes (RANS)
Discretizationfinite volume method (FVM)
Advection schemehigh-resolution, second-order approximation
Root mean square (RMS) residualsbelow 1.0 × 10⁻⁴
Turbulence modek-ω-based shear stress transport (SST) standard
Wall functionautomatic with smooth and non-slip conditions
Disclaimer/Publisher’s Note: The statements, opinions and data contained in all publications are solely those of the individual author(s) and contributor(s) and not of MDPI and/or the editor(s). MDPI and/or the editor(s) disclaim responsibility for any injury to people or property resulting from any ideas, methods, instructions or products referred to in the content.

