Article

Research on Timing Sequence Update Strategy Decision of Project Portfolio Based on Coupling Benefits in Strategic Period

Business School, Hohai University, Nanjing 211100, China
*
Author to whom correspondence should be addressed.
Water 2023, 15(21), 3769; https://doi.org/10.3390/w15213769
Submission received: 19 September 2023 / Revised: 10 October 2023 / Accepted: 12 October 2023 / Published: 27 October 2023

Abstract

:
The Chinese government’s substantial investment in water restoration has created numerous lucrative opportunities for commercial environmental restoration enterprises. Accordingly, this research study seeks to address the primary challenge faced by enterprise managers: selecting projects that fulfill both strategic imperatives and maximize economic returns. To tackle this issue, we segmented the overarching strategic period into multiple phases and studied the project portfolio from a holistic strategic period perspective. We introduced a decision model for the dynamic, sequential updating of the portfolio throughout the strategic period, emphasizing the combined benefits at each phase. This model guides the strategic selection of projects at any decision-making stage to optimize the benefits across the entire strategic duration. The multi-agent Nash Q-learning algorithm was employed for portfolio construction and updating strategies. This approach yields an optimal project portfolio for each phase of the strategy. Unlike traditional methods that predominantly focus on cumulative returns and find it challenging to accommodate strategic shifts, our proposed technique prioritizes intertwined strategic returns. It promotes project choices in tune with strategic contexts and supports ongoing adjustments to project strategies, providing invaluable guidance for decision makers. A comparison of our proposed method with other optimization strategies validated its superior performance. Furthermore, the case study described in this study confirms that our method promotes project choices in tune with strategic contexts and supports ongoing adjustments to project strategies, providing invaluable guidance for decision makers.

1. Introduction

In recent years, due to the severe degradation of the Yangtze River’s ecological environment, China has prioritized the restoration of this ecosystem. To this end, the Chinese government has supported a cohort of commercial enterprises dedicated to the conservation of the Yangtze River. These firms are chiefly responsible for ecological conservation and the establishment of a range of comprehensive water environment management projects. Consequently, the decision-making processes within these companies must adhere to both commercial logic and the national strategic imperatives for water environment management. In this context, determining how these companies should construct a project portfolio from a myriad of potential projects so that the resulting portfolio not only aligns with environmental conservation objectives but also maximizes commercial profits within the strategic period has emerged as a novel and valuable research topic.
With the acceleration of economic globalization and integration processes and the consequent intensification of international competition, strategy plays an increasingly important role in competition. Although there are many kinds of organizational strategies, their basic attributes are the same. The organization forms a holistic and long-term plan through regular strategic planning. Many scholars have focused on how to develop a scientific and effective competitive strategy in the competitive market and put forward a relatively systematic theoretical framework and a large number of technical methods. These strategic theories form the theoretical jungle of organizational competitive strategy, which greatly promote people’s understanding of organizational strategic positioning and formation methods. However, there are not many publications in the literature on how to implement organizational strategies directly, and the existing literature mostly focuses on the specific implementation of functional strategies. There are few studies on how to effectively implement and control the strategies outlined by organizations and even fewer on scientific and effective systematic analysis methods. With the introduction and application of project management by many enterprises and organizations at home and abroad, they have realized that the concept and way of project management can bring about beneficial changes. Project management has been used by enterprises or organizations as a powerful weapon to cope with the complex and changeable market environment, maintain continuous innovation, and obtain competitive advantages in the market. The two important aspects of strategic management are strategy formulation and strategy implementation [1]. The research hotspots in the existing literature mostly concern strategy formation, and although the related research on strategy implementation has received attention and emphasis, compared with the research on strategy formation, it is still much scarcer. Relevant studies point out that strategy formation and strategy implementation are two closely related processes [2]. Strategy formation focuses on “doing the right thing”, which reflects the thinking process of organizational decision making based on certain scientific procedures and methods and emphasizes comprehensive analysis skills. Strategy implementation focuses on “doing things right”, embodies the course of action to achieve results, emphasizes a contingency approach, and requires motivation and leadership.
However, from the perspective of enterprises, based on the aim of meeting strategies, we also need to consider the profitability of each project. In practice, to better achieve strategic objectives and improve the effectiveness of investment, it is usually necessary to carry out portfolio management for multiple projects. The traditional project management of a “single project” focuses on the final selection of “one project” [3]. This mainly relies on the subjective judgment of policy makers, who are not within the scope of the entire organization, to allocate resources for unified management, obtaining key resources from multiple projects while reducing conflict and disputes. Project portfolio management research and applications have been well established, but in practice, the effect of project portfolios on the implementation of organizational strategies is not optimistic. Kaplan and Norton pointed out in their survey that about 60–80% of organizations fail to achieve the expected benefits of their project, leading to strategic failure [4]. The UK Office of Government Commerce (OGC) has suggested that 30–40% of project systems fail to deliver any value [5]. Mohagheghi proposed that about 65% of industrial large-scale project clusters fail to achieve their strategic objectives [6].
As stated above, there are few studies on how to effectively implement and control the strategies outlined by organizations and even fewer on scientific and effective systematic analysis methods. There is a lack of research on the implementation process of project portfolios, and the chain from goal to achievement is broken and separated. Moreover, most scholars conduct research from a qualitative perspective, but many have not conducted in-depth research on the decision-making process of project portfolio implementation from a quantitative perspective. In addition, in terms of portfolio research methods, traditional operation research optimization and heuristic algorithms are the main methods to solve portfolio selection problems, according to the relevant literature.
The contributions of this paper are as follows:
(1)
In this study, we advocate for the adoption of strategic period coupling benefits as the foundational criterion for project portfolio selection. Contrary to solely focusing on enterprise benefits, coupling benefits encompass both the alignment of a project with enterprise strategies and the economic advantages of each project. This approach more effectively realizes enterprise strategic objectives and offers a novel perspective on project portfolio selection.
(2)
In recognition of the extended duration over which the selected portfolio will be implemented, we introduce a decision model for the sequential strategic updating of portfolios that is rooted in the concept of coupling benefits over the strategic period. Viewing the entirety of the strategic period, it is segmented into distinct phases. This approach facilitates the strategic selection of projects at any decision-making juncture within the overarching strategic period.
(3)
Regarding research methodologies, traditional operation research optimization algorithms encounter challenges in addressing the dynamic project combination problems presented in this study. While multi-agent reinforcement learning (MSA) is an algorithm that was only recently introduced, it remains underexplored in the realm of project portfolio optimization. In this study, we employ the multi-agent reinforcement learning algorithm to investigate project portfolio selection and monitor the implementation of decision-making processes.
The remainder of this paper is organized as follows: Section 2 offers a comprehensive literature review on relevant topics. In Section 3, we establish the model for coupling benefits in project portfolio selection during a strategic period. Section 4 introduces the timing sequence strategy for portfolio updates, aiming to maximize coupling benefits over the strategic period. Section 5 employs the Nash Q-learning algorithm to address the project portfolio update strategy. Lastly, Section 6 presents a case study, providing a detailed examination of a specific instance.

2. Literature Review

The concept of portfolio selection originated in the investment sector. However, as times have evolved and both internal and external environments have shifted, there has been a growing consensus among scholars regarding the importance of aligning portfolio selection with the strategic imperatives of enterprises. Petit et al. [7] integrated dynamic capability theory into portfolio selection, taking into account the uncertainties in the strategic implementation environment. Wang et al. [8] argued that shifts in organizational-level strategies would lead to corresponding changes in strategic demand indicators, influencing the outcomes of the project portfolio. Drawing on the “strategic bucket” model, Song et al. [9] assigned projects to strategic buckets hierarchically based on project priorities. Beyond qualitative analyses, several researchers have delved into quantitative examinations of the alignment between projects and strategies. For instance, Jafarzadeh et al. [10] introduced the concept of the “strategic closeness degree”, merged QFD theory with project portfolio challenges, and employed the strategic closeness degree as a metric to gauge the alignment between portfolio plans and overarching strategies. Exploiting the disturbed membership interval, Bai et al. [11] devised a methodology to calculate the similarity of strategic contributions and filtered projects accordingly. Nonetheless, the majority of these studies revolve around one-time portfolios driven by strategic necessities, primarily focusing on the initial stages of portfolio choices. When choosing portfolios, an undue emphasis on either strategic requirements or revenue often results in the selected projects fulfilling only a singular objective.
The conventional academic thought in portfolio research posits that once a project is chosen, it should proceed to completion. However, in real-world applications, there is a necessity not only to select projects at the portfolio’s inception but also to actively monitor the chosen project portfolio throughout its execution, making adjustments as needed. Recognizing this, several scholars have explored the topic. Ansari et al. [12] noted that an absence of dynamic management can result in issues like non-value-added projects and deviations from intended strategic goals during the portfolio’s execution. Kester et al. [13] argued that the portfolio management system is intricate; when strategy is used as an input, it can be iteratively transformed into portfolio outputs, encompassing both initial project selection and subsequent decisions on project continuation or suspension.
Anderson et al. [14] posited that project failures arise not just from shortcomings in the initial preparation stage of the project portfolio but predominantly from inadequacies during post-selection portfolio control. Su et al. [15] explored the selection of transnational project portfolios, taking into account the modification of ongoing projects under stochastic parameters. They concluded that a dual consideration of both new and ongoing projects optimizes budget utilization, yielding higher investment returns. Bai et al. [16] pioneered the integration of catastrophe theory into project portfolio issues, thereby devising a model aimed at optimizing system efficiency. Mohagheghi et al. [17] observed that projects exhibit diverse life cycles. In instances where projects initiated in a given period are not concluded, they spill over into subsequent periods. They analyzed this ‘multi-phase rolling’ characteristic of projects and established a corresponding project portfolio selection model. Nevertheless, a review of the literature reveals a research gap concerning the execution process of project portfolios, with a noticeable disconnect between set objectives and their realization. Notably, while the majority of investigations adopt a qualitative approach, there exists a discernible dearth of comprehensive quantitative studies on the decision-making intricacies of project portfolio implementation.
In addition, in terms of portfolio research methods, traditional operation research optimization and heuristic algorithms are the main methods to solve portfolio selection problems, according to the relevant literature. Wang et al. [18] established an optimal selection model based on mixed integer nonlinearity to solve the problem of project portfolio selection in uncertain scenarios. Tavana et al. [19] proposed the artificial colony combination optimization algorithm to optimize a dual-objective project portfolio that met the maximum benefit and minimum risk. Ning et al. [20] used the Pareto genetic algorithm to make multi-objective decisions for project portfolios. Ghannad et al. [21] proposed a two-layer decision model in which the improved ant colony algorithm was adopted at the top level to realize portfolio selection and the heuristic algorithm was adopted at the bottom level to realize project scheduling to provide references for decision making. Based on this structure, Xu et al. [22] proposed a cuckoo algorithm for multi-project portfolio investment from the perspective of enterprise application, starting from the idea of improving the solution algorithm. Wang et al. [23] solved the problem of a project portfolio with a large number of candidate projects and interaction between projects and proposed an improved particle swarm optimization algorithm to prevent the algorithm from falling into local optimization. Yan et al. [24] improved the multi-objective coevolution algorithm to solve the combination problem of budget constraints. Guo et al. [25] combined the Longhorn must search algorithm with particle swarm optimization (BAS-PSO) and verified the effectiveness of solving portfolio problems. As can be seen from the above-mentioned studies in the relevant literature, when solving portfolio problems, most scholars use traditional operations research methods or meta-heuristic methods, meaning that their application scenarios still have certain limitations. The application of popular intelligent algorithms in recent years is fairly nascent; based on the use of the multi-agent reinforcement learning algorithm of machine learning, we aimed to explore newer problems in project portfolios.
This study introduces a novel approach for project portfolio selection and implementation that is rooted in the concept of strategic period coupling benefits. The scope of this approach extends beyond the initial selection of the project portfolio to encompass the entirety of the portfolio’s implementation process. Recognizing that the chosen portfolio spans an extended strategic period, we put forward a decision model designed for timely sequential updates to the portfolio that is rooted in the benefits derived during the strategic period. This strategic period is segmented into distinct phases, facilitating decisions on project selection at each phase to optimize the cumulative returns. To address the challenges of project portfolio selection and supervise its implementation, we employed the multi-agent reinforcement learning algorithm.

3. Construction of Coupling Benefits Model for Project Portfolio Selection in Strategic Period

3.1. Strategic Matching Degree of Project Portfolio Based on Compound Fuzzy Matter–Element Theory

To better achieve the requirements of the strategy, the project’s alignment with the strategic objectives of the enterprise needs to be measured, but this problem has a certain ambiguity [26]. Fuzzy matter–element theory was developed based on rough set theory and matter–element analysis theory. It is used to deal with fuzzy incompatible problems [27]. This method is introduced to measure the matching degree between the project and strategic objectives outlined in this paper. The larger the strategic matching degree is, the more the project meets the strategic requirements [28]. Suppose there are n proposed alternative projects, numbered as N j ( j = 1 , 2 , , n ) , and the strategic dimension of the alternative projects is expressed as P i ( i = 1 , 2 , , m ) . The fuzzy value corresponding to each strategic dimension and project is denoted as e .The ordered fuzzy matter–element composed of alternative projects, strategic attributes, and quantitative values is expressed as E = ( N , P , e ) ; then, the strategic attribute matrix of the alternative project is expressed as the following matrix (1):
N 1 N 2 N n E = P 1 P 2 P m e 11 e 12 e 1 n e 21 e 22 e 2 n e m 1 e m 2 e m n
In the above matrix, e i j represents the fuzzy value corresponding to the P i strategic dimension of the N j project. Based on the principle of optimality, the standard strategy attribute matrix is composed of the maximum value of each quantity. The difference square fuzzy matrix U is composed of the difference square between the strategic attribute matrix and the standard strategic attribute matrix [29], as shown in matrix (2). It can be calculated according to the formula: u i j = ( 1 e i j ) 2 .
N 1 N 2 N n U = P 1 P 2 P m u 11 u 12 u 1 n u 21 u 22 u 2 n u m 1 u m 2 u m n
According to rough set theory, the importance degree η N N j ( N j ) of the alternative project N j in the evaluation process of strategic matching degree can be expressed as follows:
η N N j ( N j ) = 1 C a r d [ P o s N N j ( D ) ] C a r d [ P o s N ( D ) ]
Equation (3) (above) represents the strategic matching degree of the project N j , where N = N 1 , , N j ( j = 1 , 2 , 3 , , n ) . Item set D is a subset from item set N under some rule. P o s N ( D ) is the region value occupied by subset D , and C a r d [ ] is the number of items in the subset D . After normalization, the calculation formula of the strategic matching degree value of project N j can be expressed as follows:
λ N j = η N N j ( N j ) j = 1 n η N ( N j )
According to rough set theory, Equations (3) and (4) are extended, and the strategic matching degree of project portfolio N k , , N j is as follows:
λ N k , , N j = η N ( N k , , N j ) ( N k , , N j ) k = 1 n j = 1 n η N ( N k , , N j ) ( N k , , N j ) ( k j )
In the above formula, η N ( N k , , N j ) ( N k , , N j ) = 1 C a r d [ P o s N ( N k , , N j ) ( D ) ] P o s N ( D ) . k is the project number randomly selected from the alternative projects, and its value is not equal to j . The numerator of the above formula represents the strategic matching degree of project portfolio N k , , N j , the denominator represents the total strategic matching degree value of all possible project portfolios, and P o s N ( N k , , N j ) ( D ) represents the positive region value occupied by subset D .

3.2. Project Portfolio Selection Model Based on Coupling Benefits Maximization in Strategic Period

Considering that ecological environmental protection projects should not only meet strategy requirements but also meet enterprise profit requirements, this paper combines the two to facilitate a quantitative analysis of the coupling benefits of each project in the strategic period, which can alleviate the problem of the selection projects according to one aspect (as described in previous studies) and improve the scientific aspects of the project portfolio [30]. Assuming that the strategic period is T years, the optional action space of project N j ( j = 1 , 2 , , n ) in the strategic period at the beginning of each year is denoted as A j = E , M , R = expansion , maintenance , termination . Different projects have different benefits when choosing different actions. Assume that the total project budget is I and the project portfolio coupling benefit is V by the end of the strategic period. The selection rule is to select the project portfolio that maximizes the overall coupling benefit under financial constraints. The mathematical model is constructed as follows:
max V = t = 1 T j = 1 n λ ( N k , , N j ) R t ( N k , , N j ) Y j t
s . t . j = 1 n C ( N k , , N j ) Y j I
Y j 0 , 1 , j = 1 , 2 , , n ,   t = 1 , 2 , , T
k j
w ( N k , , N j ) = w
In the above formula, the objective function is the maximum coupling benefit of the project portfolio in the strategic period. λ ( N k , , N j ) is the strategic matching degree value of project portfolio ( N k , , N j ) ; R t ( N k , , N j ) is the joint return income of portfolio ( N k , , N j ) at stage t . w ( N k , , N j ) is the number of projects in the portfolio, and w is the maximum number of projects that the enterprise can execute simultaneously for human resources and other considerations. Y j t is the decision variable, and the values are as follows:
Y j t = 1 , When   alternative   project   j   is   selected   a t   s t a g e   t 0 , When   alternative   project   j   is   not   selected   a t   s t a g e   t

4. Portfolio Timing Sequence Strategy Update Decision under Coupling Benefits Maximization in Strategic Period

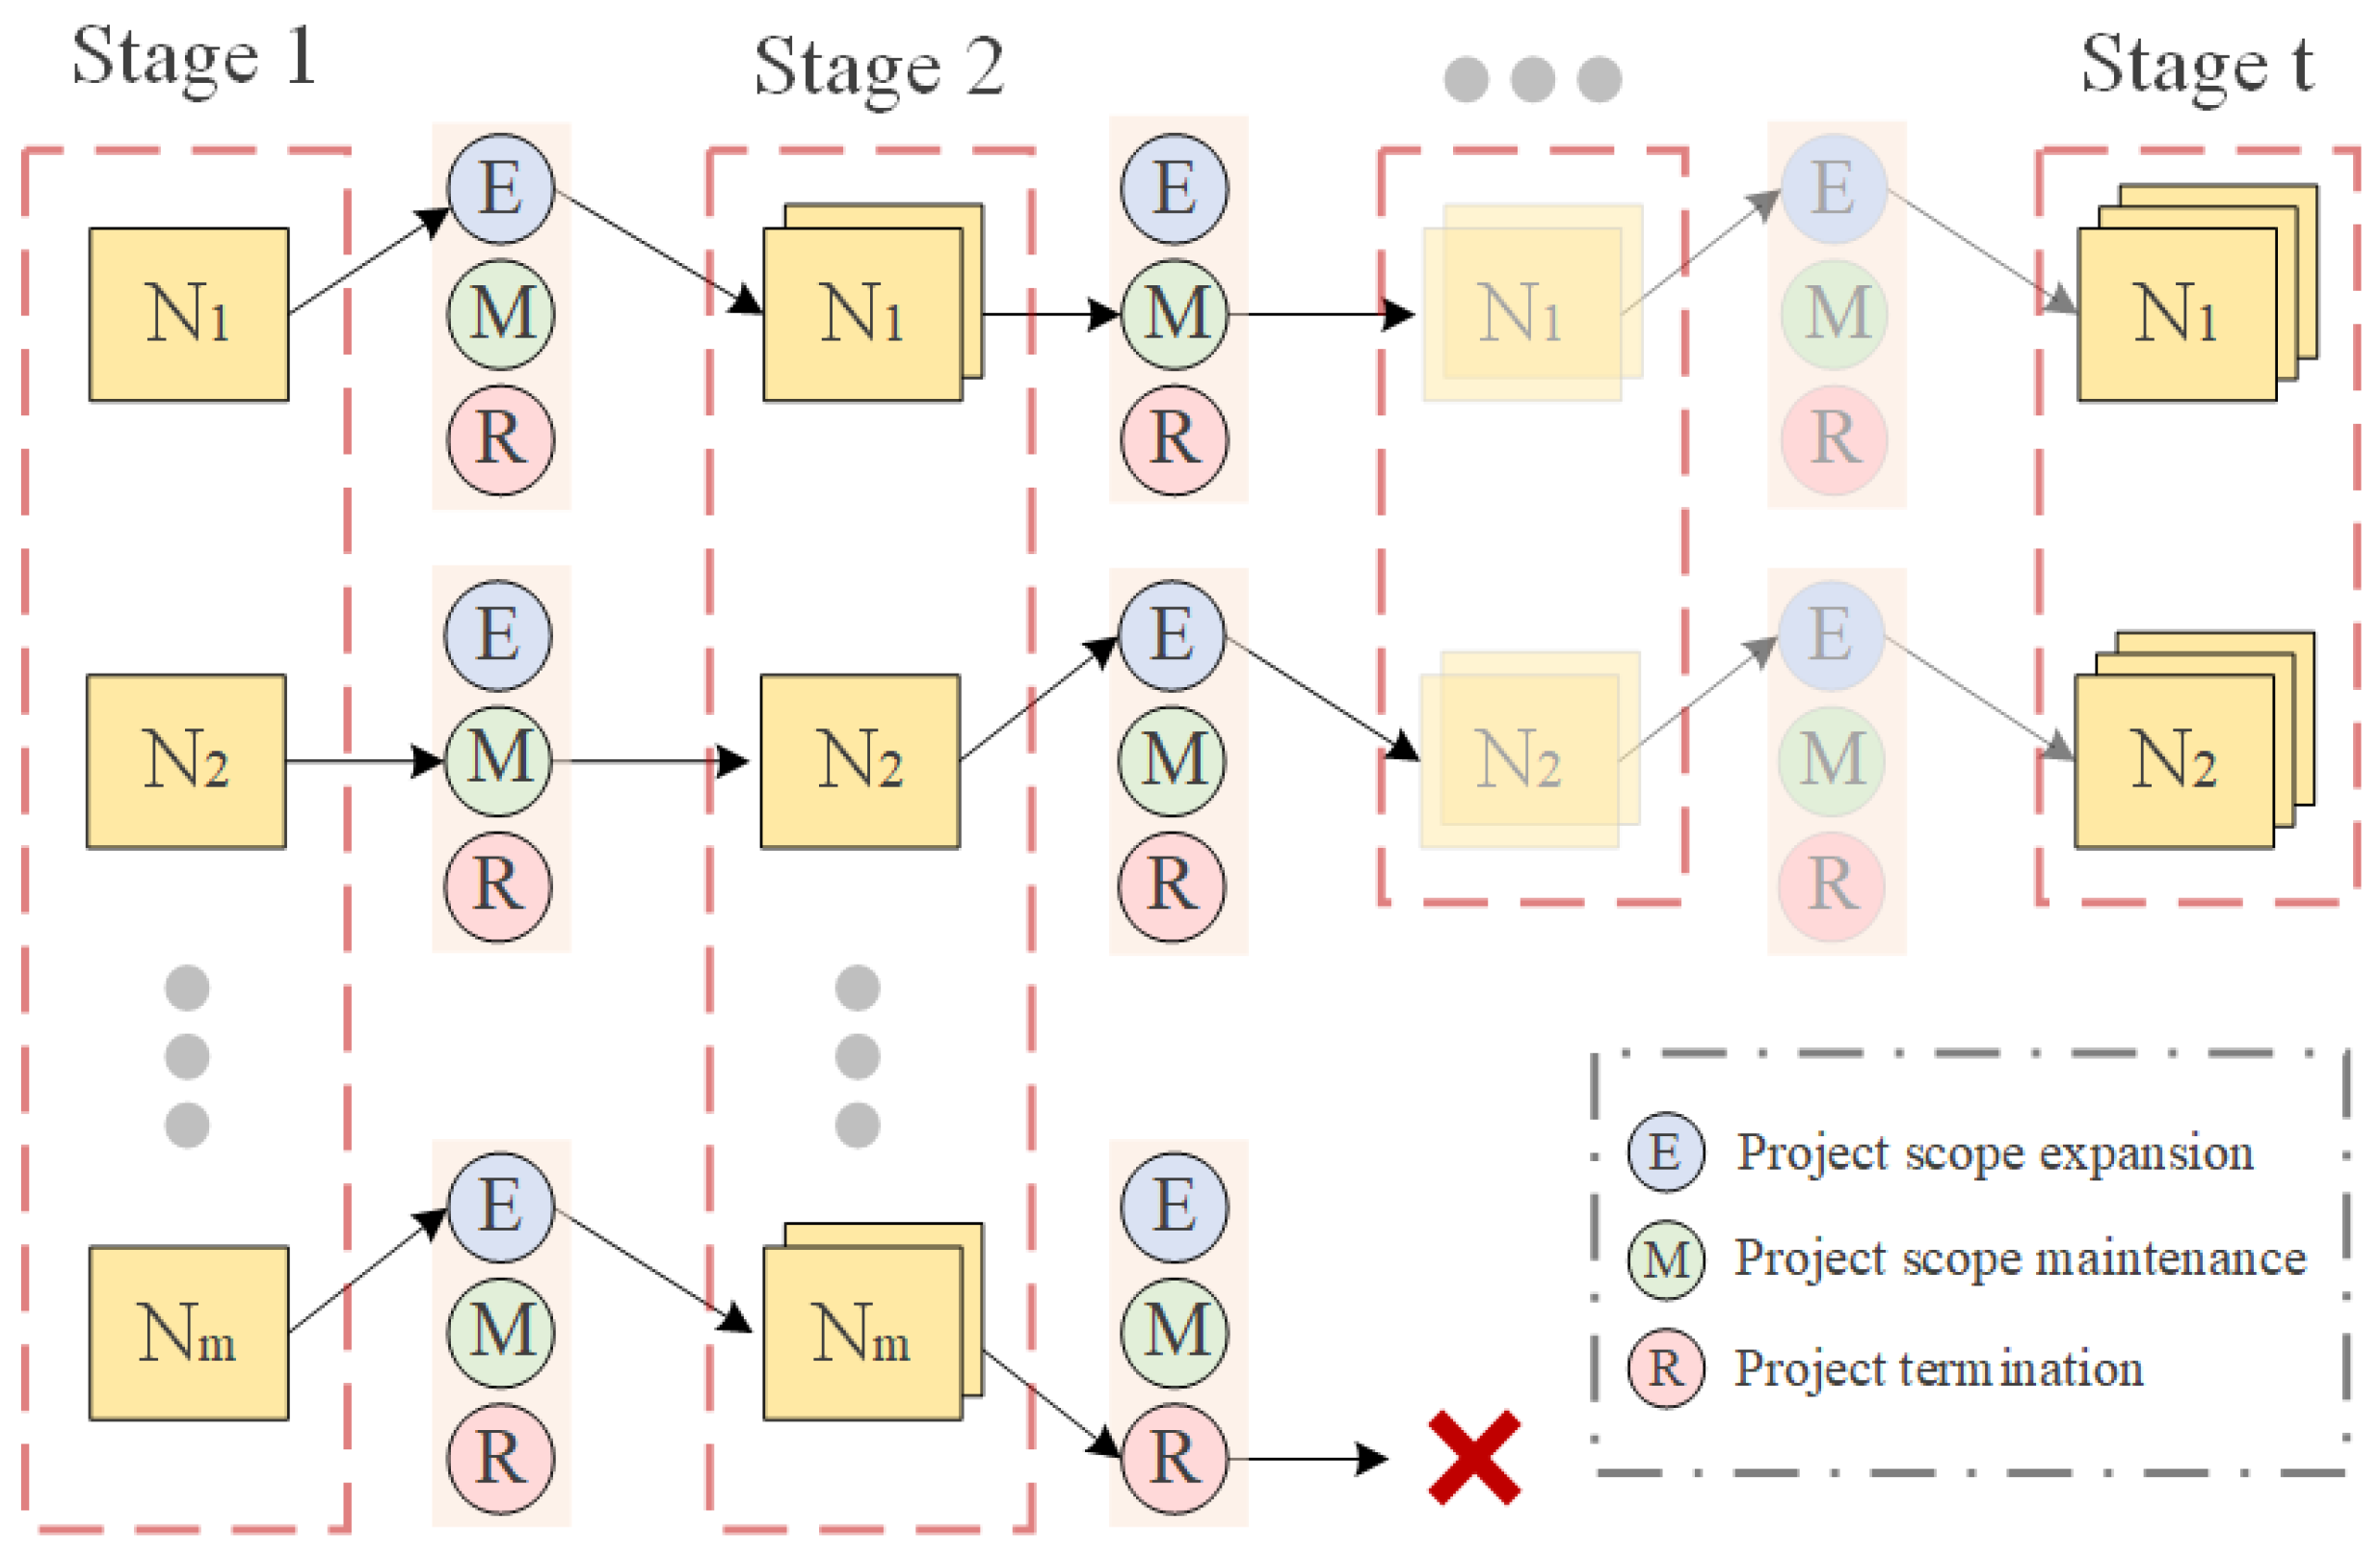
4.1. Multi-Stage Decision Analysis of Project Portfolio Timing Sequence Strategy Update

By segmenting the strategic period into distinct phases, this section elucidates the methodology for updating project strategies in each phase of the strategic period to optimize the coupling benefits throughout the strategic period. When numerous planning phases exist, achieving optimality in each phase may not ensure overall optimality throughout the entire strategic period [31]. Consequently, individual phase projects should not be viewed in isolation; it is imperative to harmonize selection strategies across all phases for holistic optimization. Enterprise project portfolio analyses should encompass not only the pre-operational status of a project but also its ongoing monitoring [32]. Most project portfolio research focuses on singular decisions made at specific decision points, overlooking the need for strategic adjustments to projects that substantially deviate from enterprise strategy or yield unsatisfactory benefits over an extended strategic duration. For this section, we segmented the strategic period into distinct phases, undertaking a comprehensive coupling benefit analysis and strategizing appropriately. Projects at different phases can be perceived as unique states, with each warranting specific actions. Thus, determining the optimal action strategy for each project during every planning phase to amplify the coupling benefit was the primary focus of our work.

4.2. Portfolio Timing Sequence Strategy Update Problem Description

According to the above assumption, the company has a total of N j alternative projects to choose from, and the strategic period is T . The strategic goal is decomposed into m specific strategic demand indicators, which are P i ( i = 1 , 2 , , m ) . The total coupling benefit of each project to the end of the strategic period is V . By dividing the strategy period into t phases, decision makers can decide at the beginning of each phase whether to hold, stop, or expand the projects. The optional actions of each project at each stage are expressed as follows: A j = E , M , R = expansion , maintenance , termination .
When the “termination” action is chosen in a particular phase, it signifies the cessation of the project for the remainder of the strategic period, preventing its selection in subsequent phases. The goal of the timing sequence strategy update for multi-stage project portfolios is to delineate the evolving strategy across different phases, optimizing the cumulative benefits by the strategic period’s conclusion. Timing sequential strategy updates entail the concurrent strategic decision-making processes for each project, beginning from the initial phase of the strategic period, with potential actions such as expansion, maintenance, or termination. This strategic decision making persists through each phase and extends until the strategic period’s culmination. Consequently, project strategies throughout the strategic period are dynamic, evolving based on the specificities of each phase. A visual representation of this strategy update process can be found in Figure 1.

4.3. Construction of Project Portfolio Sequential Strategy Updating Model under Coupling Benefit Maximization in Strategic Period

The strategic period is T ; the decision makers need to make decisions on each stage of the strategic period, and the project portfolio timing strategy update problem is described as a 5-tuple: E = S A P R γ .
In the above formula, S = { S 1 , S 2 , S 3 , , S T } can be expressed as the state space of different stages, A j = E , M , R = expansion , maintenance , termination refers to the action space of each project in each stage of the strategic period, P = { P 1 , P 2 , , P T 1 } , P t is the state transition matrix of the t stage. R is the return value that can be obtained when the action is taken from a state in this stage to a state in the next stage. γ is the discount factor. According to the portfolio selection model established above, the sequential strategy update of the portfolio is the corresponding strategy of each project in each stage of the strategic period when the portfolio coupling benefit value is the maximum. Therefore, portfolio timing strategy updates can be expressed as follows:
π ( S j 1 ) = arg max A j V ( S j 1 , A j )

5. Timing Sequence Strategy Update of Project Portfolio Based on Nash Q-Learning Algorithm

5.1. Update Decision Analysis of Project Portfolio Timing Sequence Strategy Based on Multi-Agent Nash Q-Learning Algorithm

The refinement of the project portfolio timing strategy encompasses a sequential challenge in decision making. Traditional numerical iterative solution methods might not adequately reflect reality due to dimensional constraints. Reinforcement learning, which mimics human learning behavior, seeks the optimal action sequence derived from past experiences. This approach exhibits robust sustainability in multi-stage scenarios. In our proposed method, decision makers prioritize cumulative benefits. We modeled the multi-stage project portfolio timing strategy update decision as a Markov decision process. Here, we represent each project as an agent and introduce a sequential strategy update methodology based on the Nash Q-learning algorithm. The primary objective of our method is to ascertain a globally optimal strategy.

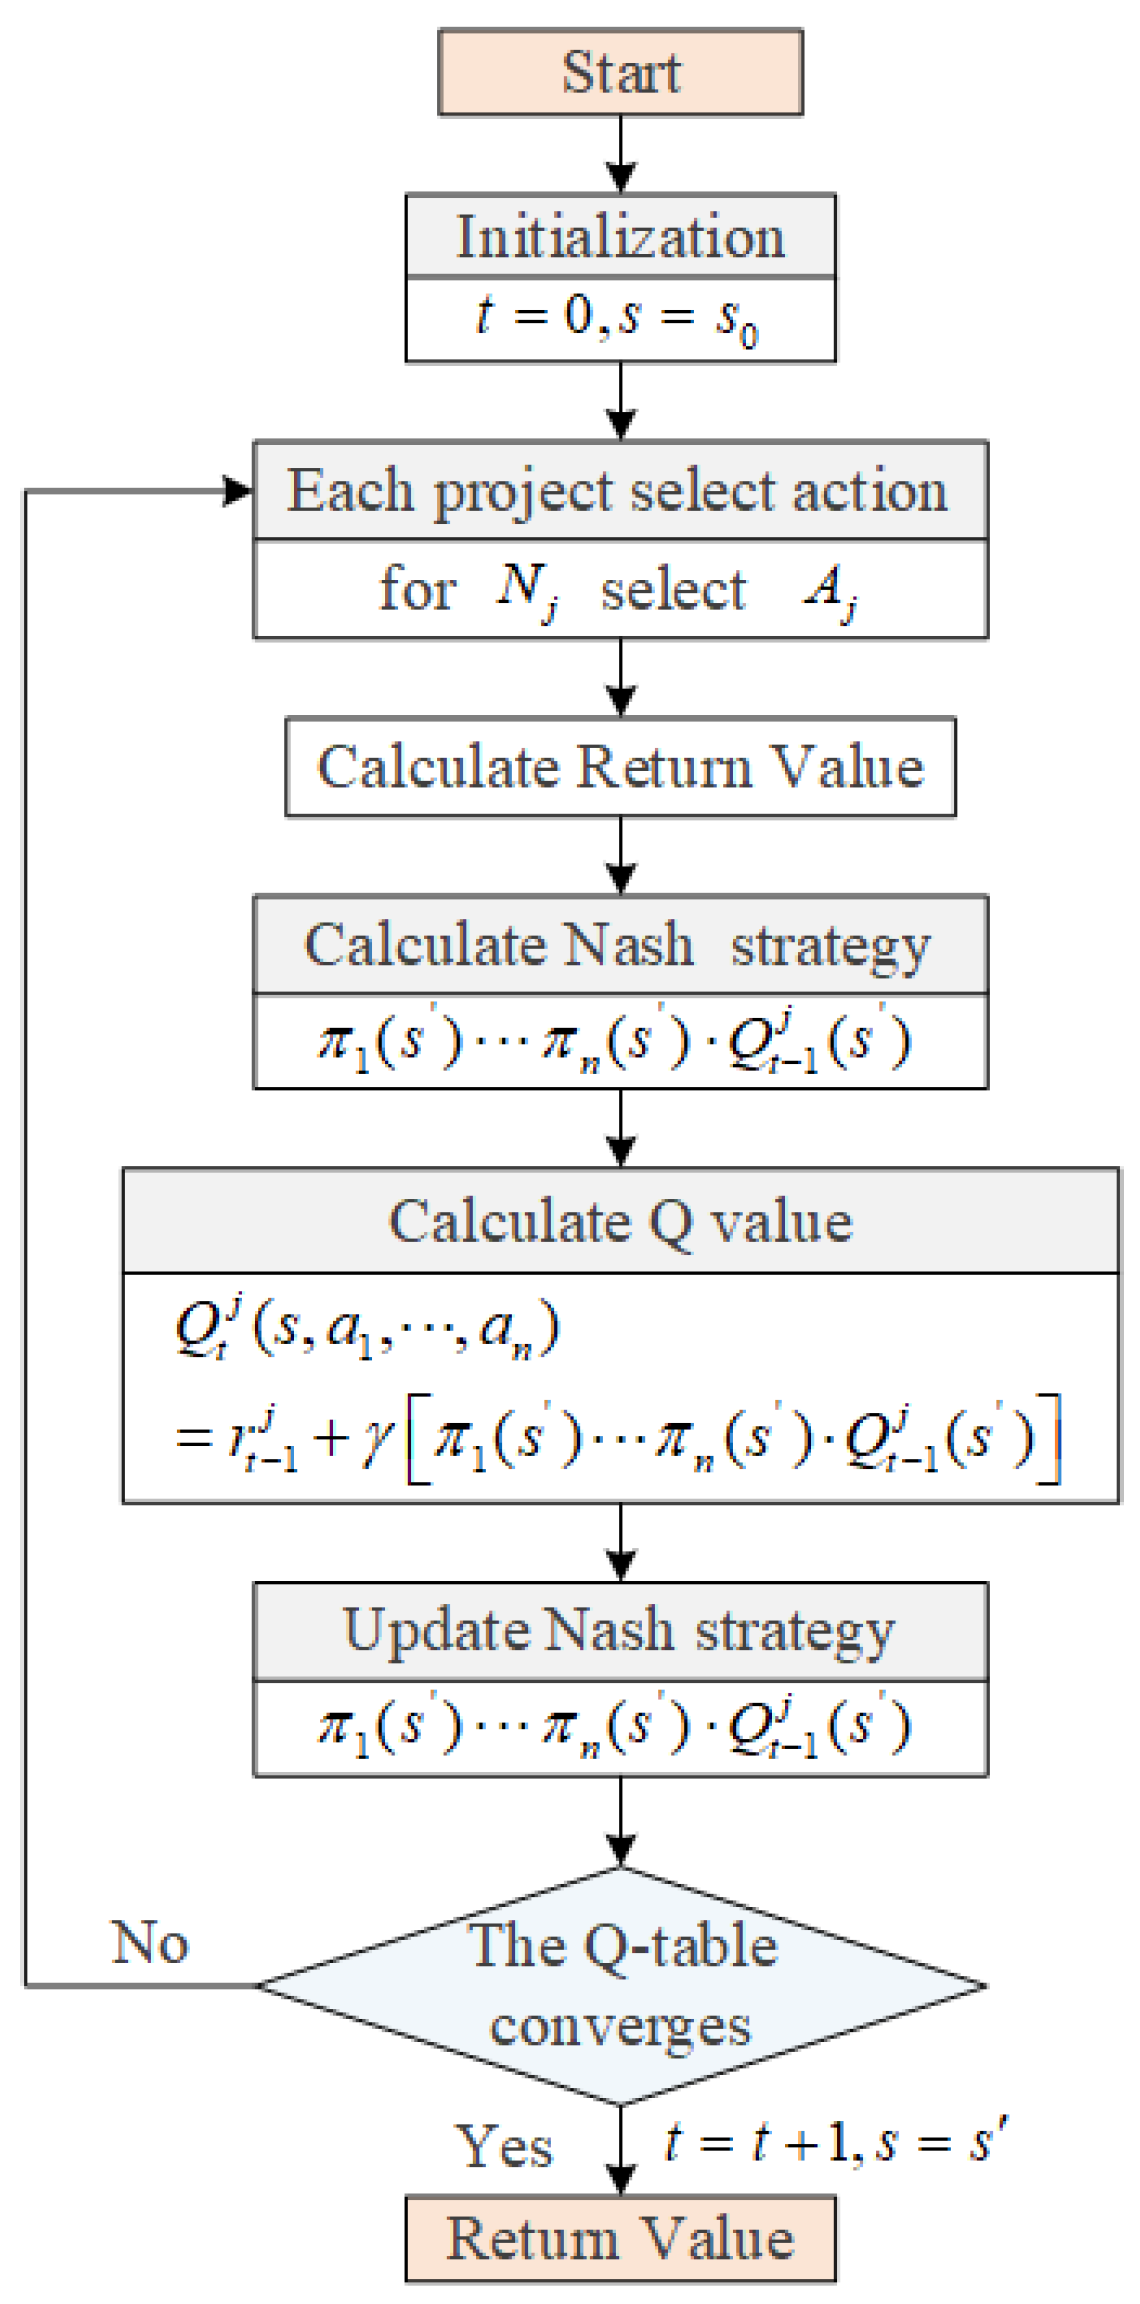
5.2. The Principle of Portfolio Sequential Strategy Updating Based on the Nash Q-Learning Algorithm

Reinforcement learning is based on the concept that a decision maker interacts with the environment and, through a trial-and-error approach, estimates the reward value for various actions within a given environmental state. The decision maker then chooses actions that yield the maximum reward value to progressively refine the strategy [33]. The Q - l e a r n i n g algorithm is a method suitable for single agents in reinforcement learning, and the updating of Q value is based on the agent’s maximum benefit. In this paper, the state action value function Q ( s , a ) is selected as the evaluation function. Q ( s , a ) represents the profit value that can be obtained when action a is taken in state s . The environment will feedback the corresponding return value according to the actions selected by the agent, so the core idea of the algorithm is to build a Q table using the state-action value function, as shown in Table 1. During each iteration, every action should be considered in the action space; then, the action sequence that can obtain the maximum return according to the value in the Q table should be selected, and the final Q value of the learning process should be ensured to allow for convergence.
The basic iterative formula of the Q learning algorithm is as follows:
Q ( s , a ) = r + γ max a Q ( s , a )
In this study, we adopt the state-action value function Q ( s , a ) as the valuation function. Q ( s , a ) represents the expected return when action a is taken in state s . In the given equation, r denotes the reward obtained after transitioning from state s to state s , while γ is the discount factor. The optimal policy π can be defined as the action a that maximizes the Q value in state s .
When multiple projects are involved, the system environment is more complex, so multi-agent reinforcement learning should be used for research. The Nash Q -learning algorithm is suitable for multi-agent algorithms, and its Q value update is based on the Nash equilibrium income of each agent. In this case, an agent needs to observe its own reward and that of other agents. The state transition and reward of the multi-agent are established under the condition of joint action. If the reinforcement learning process of the multi-agent is described by a random game, it can be expressed as a tuple ( n , S , A 1 , , A n , L , γ , R 1 , , R n ) . The letter n refers to the number of participating agents, and S refers to the joint system state achieved by multiple agents. The state transition function L refers to the probability of transferring to the next state when given the current state and its joint behavior. The return function R is denoted as R j ( s , a 1 , , a n , s ) , and its specific connotation is the return value obtained when the state of agent j changes from s to s after taking the joint action ( a 1 , , a n ) . In this paper, Q ( s , a 1 , , a n ) is used to represent the Q function of any agent, where a j refers to the action of agent j when the state is s Q j is defined as the Nash Q function of agent j . When all agents adopt the Nash equilibrium strategy, the Nash Q function is the sum of the current return of agent j and its future return, which can be obtained as follows:
Q j ( s , a 1 , , a n ) = r j ( s , a 1 , , a n ) + γ s S p ( s | s ) v j ( s , π 1 , , π n )
In Equation (13), p ( s | s ) refers to the transition probability when the state s is transferred to s ; r j ( s , a 1 , , a n ) refers to the stage return value of agent j under joint action ( a 1 , , a n ) . In this paper, the set of joint Nash equilibrium strategies of all agents is denoted as ( π 1 , , π n ) . At this point, under the joint Nash equilibrium strategy, the sum of discount returns of agent j after the infinite stage game is denoted as v j ( s , π 1 , , π n ) . Combined with the concept of Nash equilibrium, the strategy adopted by each agent under Nash equilibrium is the best choice for other agents. Nash equilibrium is composed of n strategies ( π 1 , , π n ) . The update strategy of the Nash Q-learning algorithm is mainly based on the selection of the Nash equilibrium strategy. For all s S and j = 1 , 2 , , n , the following formula exists:
v j ( s , π 1 , , π n ) v j ( s , π 1 , , π n )
From a dynamic perspective, if the stage game in which an agent participates is ( T 1 , , T t ) , then the joint strategy ( π 1 , , π n ) of the above equation constitutes the Nash equilibrium of stage game ( T 1 , , T t ) . Initialize Q to 0 at t = 0. There exists any stage t , at which agent j can select actions according to its own state and then enter the next state s by observing its own available returns and the actions of other agents and their returns. Based on the above description, agent j can calculate Nash equilibrium (denoted as ( π 1 ( s ) , , π n ( s ) ) ) through a multi-stage game ( Q t 1 ( s ) , , Q t j ( s ) ) and update Q values according to Equation (11):
Q t + 1 j ( s , a 1 , , a n ) = r t j + γ π 1 ( s ) π n ( s ) Q t j ( s )

5.3. Calculation Steps of Project Portfolio Timing Strategy Update Solution Based on Nash Q-Learning Algorithm

According to the above analysis, when solving the portfolio strategy, the alternative projects are represented by N j ( j = 1 , 2 , , n ) A j = E , M , R = expansion , maintenance , termination represents the actions of each alternative project at each stage t ( t = 1 , 2 , , T ) in the strategic period. At each stage of the strategy period, project N j determines the actions of the current phase based on its own actions and those of other projects in t 1 . The algorithm takes the reward discount, phase number, and action space of each item N j ( j = 1 , 2 , , n ) as inputs and takes the portfolio sequential update balancing strategy ( π 1 ( s ) , , π n ( s ) ) as an output. Firstly, the corresponding state s 0 at stage t = 0 is set as the initial state of the system; in the subsequent stage t , item N j selects its actions from A j with a probability of p . Then, according to the joint action randomly selected by each project, the state s of the next stage can be obtained. Then, according to the return function Q t i ( s ) of state s , the Nash equilibrium existing in the current stage can be obtained. When the sum of coupling benefits of all projects reaches the maximum, the Nash equilibrium strategy of the project portfolio at this time is ( π 1 ( s ) , , π n ( s ) ) , and the corresponding benefits are Q t i ( s ) . Finally, the Q values and strategy can be updated according to Equation (15). By iterating the aforementioned learning process, the final portfolio timing update strategy can be obtained once the coupling revenue stabilizes; the update process of the project portfolio timing strategy is illustrated in Figure 2.

6. Case Study

6.1. Case Background

Following the introduction of China’s “Yangtze River protection” strategy, the China Three Gorges Corporation established the Yangtze Ecology and Environment Co., Ltd., Beijing, China (YEEC). This enterprise focuses on the provinces and cities along the river, formulating and executing comprehensive ecological solutions. The corporation aims to maximize its strategic objectives by embracing a multi-project portfolio management approach. With a projected total investment of CNY 455 million and limited funds, not all projects can be pursued simultaneously, necessitating astute project portfolio selection. The strategic period for the group spans five years, with the company’s decision makers assessing ongoing projects at the start of each year. Each project can employ various strategies: expansion, maintenance, or termination. The YEEC’s primary goal is to optimize the return on its investment portfolio while meeting its strategic objectives over this five-year strategy period.

6.2. Alternative Project Description

The YEEC (Yangtze Ecology and Environment Co., Ltd., Beijing, China) has put forward an alternative project set composed of 10 projects, and the project number is N = { N j | j = 1 , 2 , , 10 } . The maximum number of projects that the company can execute at the same time is four. The strategic period of the company is 5 years, which is divided into five periods. The total investment budget of the project is CNY 455 million. The required investment budget of each project and annual income after investment are shown in the following table. If the project is reformed in the strategic period, it needs to follow up the investment cost, and the net cash flow can be increased after the corresponding transformation is completed, as shown in Table 2 below.
The strategic objectives of ecological and environmental protection projects are different from those of projects aimed at profit making. Ecological projects have certain responsibilities relating to public welfare [34]. In addition to pursuing economic benefits, creating ecological benefits and providing public services are the core objectives of ecological and environmental protection project construction. According to the current strategic positioning of Yangtze Ecology and Environment Co., Ltd., Beijing, China and the characteristics of eco-environmental protection projects, this paper summarizes the levels and indicators contained in the income index system of scholars and sets up the strategic evaluation indicators of eco-environmental protection projects. With strategic objectives at its center [35], the assessment index system is constructed by decomposing the objectives into five dimensions: economic benefit, ecological benefit, public service, organizational growth, and internal process. The evaluation indicators of strategic needs are determined as shown in Table 3. The specific evaluation indicators are as follows:

6.3. Evaluation of Project Portfolio Strategy Matching

This paper invited 25 senior decision makers and project managers to evaluate the strategic matching degree of each alternative project based on the characteristics of the alternative project, the actual situation of the enterprise, and their experiences with similar projects. Since the indexes in the system are difficult to measure, the corresponding evaluation comment set was set to measure each index. Assuming that the weights of all indicators in all dimensions are equal, the expert evaluation method is adopted to determine the fuzzy value [26], and the value is set in the interval [0, 5]. After averaging all expert evaluation values, the matrix E can be obtained.
E = N 1 N 2 N 3 N 4 N 5 N 6 N 7 N 8 N 9 N 10 P 1 4.5 3.0 2.0 3.5 1.5 2.0 2.5 3.5 3.0 3.5 P 2 3.0 3.5 3.0 4.0 2.5 4.5 3.5 3.0 4.0 2.5 P 3 4.5 4.0 2.0 3.5 1.5 2.0 2.5 3.5 3.0 3.5 P 4 3.0 3.5 3.0 4.0 2.5 4.5 3.5 3.0 4.0 2.5 P 5 4.5 4.0 2.0 3.5 1.5 2.0 2.5 3.5 2.0 3.5
The difference square compound fuzzy matter–element U is calculated as follows:
U = N 1 N 2 N 3 N 4 N 5 N 6 N 7 N 8 N 9 N 10 P 1 0.01 0.16 0.36 0.09 0.49 0.36 0.25 0.09 0.16 0.09 P 2 0.16 0.09 0.16 0.04 0.25 0.01 0.09 0.16 0.04 0.25 P 3 0.01 0.04 0.36 0.09 0.49 0.36 0.25 0.09 0.16 0.09 P 4 0.16 0.09 0.16 0.04 0.25 0.01 0.09 0.16 0.04 0.25 P 5 0.01 0.04 0.36 0.09 0.49 0.36 0.25 0.09 0.36 0.09
According to Equations (3)–(5) and rough set theory, the normalized strategic matching degree of each project portfolio can be obtained. Due to the large number of project portfolios and the constraints regarding funds and the number of projects that can be carried out at the same time, Python programming was used to solve the qualified project portfolios. The results are described below.

6.4. Project Portfolio Selection and Sequential Strategy Updating Solution under Coupling Benefit Maximization

This section mainly solves the project portfolio with the maximum coupling benefit in the strategic period under the condition of compliance with constraints and gives the timing strategy update of each project in each stage of the strategic period. The letter T represents the strategic period, B represents the expand action, H represents the hold action, and P represents the stop action. When the project is subjected to the “hold” action, the annual revenue value is unchanged, as shown in Table 4. When it is decided that the project should “expand”, the corresponding costs will be invested and annual revenue will be increased in the next stage of the strategic period after the completion of the corresponding expansion. When a project stops at a certain stage of the strategic period, the residual income of the project is discounted in the last year of the project life cycle, which is all 30 years. Project N 10 is randomly selected, and the return value matrix of project N 10 is constructed and analyzed. Since there are three actions when making decisions at each stage of the strategic period, the return value matrix can be formed, as shown in the following table. According to our previous analysis, the horizontal axis of the matrix can be viewed as states and the vertical axis can be viewed as selected actions. The letters represent actions, and the numbers represent the strategic stage. For example, T 1 B indicates that action B is selected in the first stage, and other analogs are used. - L Indicates that a connection does not exist. It can be assumed that the hold action is selected at the beginning; in that case, the project N 10 return value matrix is shown as follows:
According to the above calculation rules, each project can construct a return value matrix, and a total of 10 alternative projects can be obtained. Then, the project joint return value matrix is constructed according to the return value matrix of the 10 alternative projects. The following uses the joint return matrix of the N 3 , N 7 , N 9 , and N 10 projects as examples. Due to space limitations, only part of the joint return matrix of four projects from the first stage to the second stage is listed, and the remaining stages are similar. The joint return matrix is shown in Table 5 below:

6.5. Results Analysis

We used Python 3.8.2 programming to achieve the intelligent calculation of all possible combinations of the situation. Firstly, the Q table of the joint returns of the four projects in all phases is initialized into an all-zero matrix. In the initial state, the hold action is selected by default. Starting from stage 1, the calculation is carried out by the analysis step in 4.3 until the Q table converges. Running the program in the Python 3.8.2 programming environment, the discount factor value is 0.8. When the sum of all Q values in a Q table tends to be constant, the Q table is considered to converge. According to the running results, the project portfolios that meet the constraints are as follows:  N 3 , N 7 , N 9 , N 10 , N 4 , N 7 , N 9 , N 10 , N 6 , N 7 , N 8 , N 10 , N 6 , N 7 , N 9 , N 10 , N 6 , N 8 , N 9 , N 10 , N 7 , N 8 , N 9 , N 10 . The normalized weight coefficient, strategic matching degree, and total benefits of each project portfolio were calculated, and the results are shown in Table 6 below.
According to the previous method, after the total benefits are obtained, the project portfolio is selected according to the maximum total benefits value. If this method is used, the selected project portfolio is N 3 , N 7 , N 9 , N 10 . However, based on the above analysis and the method of this paper, the strategic matching degree of each project portfolio and the coupled benefits in the strategic period can be obtained, as shown in Table 7 below.
Through comparative analysis, we can see that the coupling benefit is not the maximum value when the total benefit of the project portfolio is the maximum value. The matching degree value of the project portfolio strategy selected according to the maximum total benefit in the strategic period is smaller than that selected according to the maximum coupling benefit in the strategic period, which does not conform to the scenario adapted by the model in this paper. The deep-seated reason is that the project is not immutable after the selection but dynamically adjusted with each stage of the strategic period. Therefore, according to the principle of maximum coupling benefits in the strategic period, the selected project portfolio is N 6 , N 8 , N 9 , N 10 . Meanwhile, the timing strategies of the four selected projects in each stage of the strategic period can be updated as shown in Table 8 below.
In the Q table iteration shown in Figure 3, the aim is to maximize the coupled returns of the strategic period rather than focusing on the total returns. The coupled returns account for strategic alignment, thus facilitating a more rigorous and logically reasoned selection that aligns with strategic imperatives. As illustrated in Figure 3, the Q value stabilizes within a certain range, with convergence observed after 483 iterations. At this point, it can obtain the strategic coupled returns for the entire strategic span. Using the Q table, the optimal sequence update strategy for the project portfolio across each strategic period stage can be achieved. The practicality of this method was validated via a case study on the YEEC. The insights in this study provide novel methods to enterprise leaders when making portfolio decisions throughout the strategic period.
To further validate our method’s performance, we contrasted it with three leading algorithms: the Improved Grey Wolf Optimizer (IGWO), the Crow Search Algorithm (CSA), and the Flow Direction Algorithm (FDA). While these algorithms aim to achieve the same objective as our method, they cannot set a detailed strategy for each project during the optimization process. The results of the performance comparison are shown in Figure 3. By integrating the Nash Q-Learning algorithm, our method achieved a superior return value of 6504.727, outperforming the IGWO, CSA, and FDA by 38.141%, 20.319%, and 20.827%, respectively.

7. Conclusions

The Yangtze River Comprehensive Protection strategy and its associated organizational execution unit strategy pose new challenges to project portfolio management theories and methods. A single project investment no longer meets the needs for strategy fulfillment; rather, a project portfolio has become an effective means to achieve strategic objectives. Consequently, how to scientifically allocate investments across multiple projects under constrained funds, ensuring both the alignment with strategic objectives and the maximization of cumulative returns throughout the strategic period, is a pivotal concern for enterprise managers. To address this, our study leverages the principle of maximizing coupled returns during the strategic period for portfolio formulation. By segmenting the strategic period, we address the portfolio decision-making process at any given planning phase. The Nash Q-learning algorithm was employed, yielding project portfolio recommendations and providing sequential strategy updates for each phase of the strategic period, thus offering insights for decision makers. The key conclusions that can be derived from this study are as follows:
(1) This study proposes that project selection and implementation should be grounded in coupled returns during the strategic period, taking into account both strategic alignment and economic benefits. A selected project portfolio consists of N 6 , N 8 , N 9 , N 10 . Comparative analyses suggest that this approach ensures that selected projects are strategically aligned. Compared to solely considering economic returns, coupled benefits better address the strategic needs of enterprises.
(2) We have deduced a decision-making schema for updating sequential strategies under the principle of maximizing coupled returns. Specifically, the updating strategy for project N 6 throughout the strategic period is {M, E, M, M, M}. For N 8 , it is {M, M, M, R, -}; for N 9 , it is {M, M, E, M, M}, and for N 10 , it is {M, M, M, M, M}. The portfolio decisions made during one phase shape the project set available for the subsequent phase. Optimizing each phase independently may not guarantee overall optimality for the entire strategic period. Hence, after determining the project portfolio, we leveraged a model for sequential strategy updates, deriving dynamically updatable strategies for each phase, ensuring optimal benefits over the strategic period.
(3) Through introducing the multi-agent Nash Q-learning algorithm to the field of project portfolio selection, we were able to treat each project as an individual agent, abstracting the problem into a Markov Decision Process. This algorithm effectively tackles portfolio decision-making at any planning phase within the strategic period, expanding the method’s applicability in the management domain. Future research studies should delve deeper into the project portfolio selection issue and focus on constraint setting in particular.
Our proposed method possesses inherent limitations. Specifically, the impact of various sub-projects within the overarching project on the optimal solution requires additional examination. Furthermore, the prospect of integrating these issues with other multi-agent reinforcement algorithms or game-theoretic strategies merits further investigation.

Author Contributions

K.W.: Software, Writing an original draft. J.F.: Investigation and Conceptualization. S.L.: Methodology. K.Z.: Methodology. D.H.: Methodology. All authors contributed equally to this work. All authors wrote, reviewed and commented on the manuscript. All authors have read and agreed to the published version of the manuscript.

Funding

This research was funded by the Postgraduate Research & Practice Innovation Program of Jiangsu Province (Grant No. KYCX23_0647) and the China Scholarship Council (CSC).

Data Availability Statement

Data generated or analyzed during the study are available from the corresponding author upon request.

Conflicts of Interest

The authors declare that they have no known competing financial interests or personal relationships that could have appeared to influence the work reported in this paper.

References

  1. Clegg, S.; Killen, C.P.; Biesenthal, C.; Sankaran, S. Practices, projects and portfolios: Current research trends and new directions. Int. J. Proj. Manag. 2018, 36, 762–772. [Google Scholar] [CrossRef]
  2. Meskendahl, S. The influence of business strategy on project portfolio management and its success—A conceptual framework. Int. J. Proj. Manag. 2010, 28, 807–817. [Google Scholar] [CrossRef]
  3. Martinsuo, M.; Geraldi, J. Management of project portfolios: Relationships of project portfolios with their contexts. Int. J. Proj. Manag. 2020, 38, 441–453. [Google Scholar] [CrossRef]
  4. Kock, A.; Heising, W.; Gemuenden, H.G. A Contingency Approach on the Impact of Front-End Success on Project Portfolio Success. Proj. Manag. J. 2016, 47, 115–129. [Google Scholar] [CrossRef]
  5. Marcondes, G.; Leme, R.C.; Carvalho, M.M. Framework for Integrated Project Portfolio Selection and Adjustment. IEEE Trans. Eng. Manag. 2019, 66, 677–688. [Google Scholar] [CrossRef]
  6. Mohagheghi, V.; Mousavi, S.M.; Antuchevičienė, J.; Mojtahedi, M. Project portfolio selection problems: A review of models, uncertainty approaches, solution techniques, and case studies. Technol. Econ. Dev. Econ. 2019, 25, 1380–1412. [Google Scholar] [CrossRef]
  7. Petit, Y.; Hobbs, B. Project portfolios in dynamic environments: Sources of uncertainty and sensing mechanisms. Proj. Manag. J. 2010, 41, 46–58. [Google Scholar] [CrossRef]
  8. Wang, L.; Kunc, M.; Bai, S.-J. Realizing value from project implementation under uncertainty: An exploratory study using system dynamics. Int. J. Proj. Manag. 2017, 35, 341–352. [Google Scholar] [CrossRef]
  9. Song, S.; Yang, F.; Xia, Q. Multi-criteria project portfolio selection and scheduling problem based on acceptability analysis. Comput. Ind. Eng. 2019, 135, 793–799. [Google Scholar] [CrossRef]
  10. Jafarzadeh, H.; Akbari, P.; Abedin, B. A methodology for project portfolio selection under criteria prioritization, uncertainty and projects interdependency–combination of fuzzy QFD and DEA. Expert Syst. Appl. 2018, 110, 237–249. [Google Scholar] [CrossRef]
  11. Bai, L.; Han, X.; Wang, H.; Zhang, K.; Sun, Y. A method of network robustness under strategic goals for project portfolio selection. Comput. Ind. Eng. 2021, 161, 107658. [Google Scholar] [CrossRef]
  12. Ansari, R.; Shakeri, E.; Raddadi, A. Framework for aligning project management with organizational strategies. J. Manag. Eng. 2015, 31, 04014050. [Google Scholar] [CrossRef]
  13. Kester, L.; Hultink, E.J.; Lauche, K. Portfolio decision-making genres: A case study. J. Eng. Technol. Manag. 2009, 26, 327–341. [Google Scholar] [CrossRef]
  14. Anderson, D.K.; Merna, T. Project Management Strategy—Project management represented as a process-based set of management domains and the consequences for project management strategy. Int. J. Proj. Manag. 2013, 21, 387–393. [Google Scholar] [CrossRef]
  15. Huang, X.; Su, X.; Zhao, T. Optimal multinational project adjustment and selection with random Parameters. Optim. J. Math. Program. Oper. Res. 2014, 63, 1583–1594. [Google Scholar] [CrossRef]
  16. Bai, L.; Zhang, R.; Bai, S.; Du, Q. Competition congestion of shared resources for project portfolio based on catastrophe theory. J. Ind. Eng. Eng. Manag. 2020, 34, 205–212. [Google Scholar]
  17. Mohagheghi, V.; Mousavi, S.M. A new multi-period optimization model for resilient-sustainable project portfolio evaluation under interval-valued Pythagorean fuzzy sets with a case study. Int. J. Mach. Learn. Cybern. 2021, 12, 3541–3560. [Google Scholar] [CrossRef]
  18. Wang, B.; Feng, Z.; Feng, J.; Yu, P.; Cui, L. Decision making on investments in photovoltaic power generation projects based on renewable portfolio standard: Perspective of real option. Renew. Energy 2022, 189, 1033–1045. [Google Scholar]
  19. Tavana, M.; Khosrojerdi, G.; Mina, H.; Rahman, A. A New Dynamic Two-Stage Mathematical Programming Model under Uncertainty for Project Evaluation and Selection. Comput. Ind. Eng. 2020, 149, 678–692. [Google Scholar] [CrossRef]
  20. Ning, Y.; Kwak, Y.H. How Do Consulting Firms with Different Project Experience Configure Dynamic Capabilities? J. Manag. Eng. 2022, 38, 267–276. [Google Scholar] [CrossRef]
  21. Ghannad, P.; Lee, Y.-C.; Friedland, C.J.; Choi, J.O.; Yang, E. Multiobjective Optimization of Postdisaster Reconstruction Processes for Ensuring Long-Term Socioeconomic Benefits. J. Manag. Eng. 2020, 36, 04020038. [Google Scholar] [CrossRef]
  22. Xu, X.; Wang, Q.; Lu, Y. Research on Optimal Decision of Multi-project Portfolio Investment Based on RWCS Search Algorithm. Sci. Technol. Ind. 2019, 19, 69–76. [Google Scholar]
  23. Wang, Y.; He, Z.; Kerkhove, L.-P.; Vanhoucke, M. On the performance of priority rules for the stochastic resource constrained multi-project scheduling problem. Comput. Ind. Eng. 2017, 114, 223–234. [Google Scholar] [CrossRef]
  24. Yan, L.; Wu, J. Dynamic population size coevolution algorithm for multi-objective portfolio optimization problem. Math. Pract. Underst. 2019, 49, 9–17. [Google Scholar]
  25. Guo, Q.; Li, J.; Zou, C.; Guo, Y.; Yan, W. A class of multi-period semi-variance portfolio for petroleum exploration and development. Int. J. Syst. Sci. 2012, 43, 1883–1890. [Google Scholar] [CrossRef]
  26. Zhang, B.; Bai, L.; Zhang, K.; Kang, S.; Zhou, X. Dynamic assessment of project portfolio risks from the life cycle perspective. Comput. Ind. Eng. 2023, 176, 108922. [Google Scholar] [CrossRef]
  27. Li, X.; Wang, Y.; Yan, Q.; Zhao, X. Uncertain mean-variance model for dynamic project portfolio selection problem with divisibility. Fuzzy Optim. Decis. Mak. 2019, 18, 37–56. [Google Scholar] [CrossRef]
  28. Fang, C.D.; Cheng, J.H.; Zhao, P.D. Temporal and spatial evolution of Mineral-Economic-Environment coordination degree in the Yangtze River Economic Belt under the Great Protection Strategy. China Popul. Resour. Environ. 2019, 29, 65–73. [Google Scholar]
  29. Beseiso, M.; Kumar, G. A fuzzy computational approach for selecting interdependent projects using prioritized criteria. J. Intell. Fuzzy Syst. 2021, 40, 11341–11354. [Google Scholar] [CrossRef]
  30. Fang, Z.; Liu, Y.; Lu, Q.; Pitt, M.; Hanna, S.; Tian, Z. BIM-integrated portfolio-based strategic asset data quality management. Autom. Constr. 2022, 134, 104070. [Google Scholar] [CrossRef]
  31. Nowak, M.; Trzaskalik, T. A trade-off multiobjective dynamic programming procedure and its application to project portfolio selection. Ann. Oper. Res. 2022, 311, 1155–1181. [Google Scholar] [CrossRef]
  32. Han, R.; Shen, Z.; Li, X. A Two-Stage Method for Strategy-Oriented Dynamic Project Portfolio Selection Considering Project Substitution. IEEE Trans. Eng. Manag. 2023. [Google Scholar] [CrossRef]
  33. Mnih, V.; Kavukcuoglu, K.; Silver, D.; Rusu, A.A.; Veness, J.; Bellemare, M.G.; Graves, A.; Riedmiller, M.; Fidjeland, A.K.; Ostrovski, G.; et al. Human-level control through deep reinforcement learning. Nature 2015, 518, 529–533. [Google Scholar] [CrossRef]
  34. Jung, W.; He, S.H.; Lee, K.W. Country Portfolio Solutions for Global Market Uncertainties. J. Manag. Eng. 2012, 28, 372–381. [Google Scholar] [CrossRef]
  35. Mohammadnazari, Z.; Mousapour Mamoudan, M.; Alipour-Vaezi, M.; Aghsami, A.; Jolai, F.; Yazdani, M. Prioritizing post-disaster reconstruction projects using an integrated multi-criteria decision-making approach: A case study. Buildings 2022, 12, 136. [Google Scholar] [CrossRef]
Figure 1. Evolution process of portfolio timing sequence strategy update selection.
Water 15 03769 g001
Figure 2. Update process of project portfolio timing strategy via Nash Q-learning algorithm.
Water 15 03769 g002
Figure 3. Optimization results of the comparison methods.
Water 15 03769 g003
Table 1. Standard form of Q table.
Q T a b l e a 1 a 2 a n
s 1 Q ( s 1 , a 1 ) Q ( s 1 , a 2 ) Q ( s 1 , a n )
s 2 Q ( s 2 , a 1 ) Q ( s 2 , a 2 ) Q ( s 2 , a n )
s n Q ( s n , a 1 ) Q ( s n , a 2 ) Q ( s n , a n )
Table 2. Investment required for each project and annual project revenue. Unit: Ten thousand CNY.
Project   N j The Initial Investment
C j
Annual Revenue
R j
The Cost of Expanding the ProjectNet Cash Flow to Be Increased after Expansion of the Project
Project N 1 27,00023961350+405
Project N 2 21,78019121089+326.7
Project N 3 16,5451428827.25+248.18
Project N 4 14,7831551739.15+221.75
Project N 5 20,61918961030.95+309.29
Project N 6 13,5201049676+202.8
Project N 7 9875832493.75+148.13
Project N 8 12,9101143645.5+193.65
Project N 9 10,200985510+153
Project N 10 8090797404.5+121.35
Table 3. Index and description of strategic demand rating of ecological environmental protection project portfolios.
Strategic DimensionsObjectiveEvaluation Index p
Economic benefit dimensionThe benefits are optimal in the
strategic period
Rate of return on investment p 1
Ecological benefit dimensionEcological restoration benefitEcological service value completion rate p 2
Public service dimensionsImproved public satisfactionPublic satisfaction index p 3
Organizational growth dimensionDegree of perfection of enterprise informatizationLevel of informatization application p 4
Internal process dimensionProject fund managementThe effective utilization rate of water conservancy investment p 5
Table 4. Project N 10 return value matrix. Unit: Ten thousand CNY.
T 1 B T 1 H T 1 P T 2 B T 2 H T 2 P T 3 B T 3 H T 3 P T 4 B T 4 H T 4 P T 5 B T 5 H T 5 P
T 1 B -L-L-L-L-L-L-L-L-L-L-L-L-L-L-L
T 1 H -L-L-L−404.57971078.66-L-L-L-L-L-L-L-L-L
T 1 P -L-L-L-L-L-L-L-L-L-L-L-L-L-L-L
T 2 B -L-L-L-L-L-L−404.5918.35849.45-L-L-L-L-L-L
T 2 H -L-L-L-L-L-L−404.5797809-L-L-L-L-L-L
T 2 P -L-L-L-L-L-L-L-L-L-L-L-L-L-L-L
T 3 B -L-L-L-L-L-L-L-L-L−404.51039.65566.3-L-L-L
T 3 H -L-L-L-L-L-L-L-L-L−404.5797539.33-L-L-L
T 3 P -L-L-L-L-L-L-L-L-L-L-L-L-L-L-L
T 4 B -L-L-L-L-L-L-L-L-L-L-L-L−404.51161.15283.14
T 4 H -L-L-L-L-L-L-L-L-L-L-L-L−404.5797269.66
T 4 P -L-L-L-L-L-L-L-L-L-L-L-L-L-L-L
T 5 B -L-L-L-L-L-L-L-L-L-L-L-L-L-L-L
T 5 H -L-L-L-L-L-L-L-L-L-L-L-L-L-L-L
T 5 P -L-L-L-L-L-L-L-L-L-L-L-L-L-L-L
Table 5. Partial joint return matrix for each project in phases 1 to 2.
Stage 1–2 B 3 B 7 B 9 B 10 B 3 B 7 B 9 H 10 B 3 B 7 H 9 B 10 B 3 B 7 H 9 H 10 B 3 H 7 B 9 B 10 ……
B 3 B 7 B 9 B 10 −406.46−165.93−178.46133.7121.17……
B 3 B 7 B 9 H 10 −406.46−188−185.81111.63113.82……
B 3 B 7 H 9 B 10 −406.46−165.94−178.46105.8893.35……
B 3 B 7 H 9 H 10 −406.46−188−185.8283.8286……
B 3 H 7 B 9 B 10 −406.46−165.94−178.46105.8893.35……
……………………………………
Table 6. Strategic matching degree and total benefits of each project portfolio.
Project PortfolioNormalized Strategic
Matching Degree
Strategic Period
Total Benefits
N 3 N 7 N 9 N 10 0.09263,360
N 4 N 7 N 9 N 10 0.18253,263.4
N 6 N 7 N 8 N 10 0.18261,312
N 6 N 7 N 9 N 10 0.09245,436
N 6 N 8 N 9 N 10 0.18263,350
N 7 N 8 N 9 N 10 0.18241,992
Table 7. Strategic matching degree and coupling benefits of each project portfolio.
Project PortfolioNormalized Strategic
Matching Degree
Strategic Period
Coupling Benefits
N 3 N 7 N 9 N 10 0.096503.273
N 4 N 7 N 9 N 10 0.186246.982
N 6 N 7 N 8 N 10 0.183228.727
N 6 N 7 N 9 N 10 0.096063.273
N 6 N 8 N 9 N 10 0.096504.727
N 7 N 8 N 9 N 10 0.185974.545
Table 8. Update strategies of selected projects at each stage of the strategy period.
Stage T 1 T 2 T 3 T 4 T 5
Project
N 6 M E M M M
N 8 M M M R -
N 9 M M E M M
N 10 M M M M M
Disclaimer/Publisher’s Note: The statements, opinions and data contained in all publications are solely those of the individual author(s) and contributor(s) and not of MDPI and/or the editor(s). MDPI and/or the editor(s) disclaim responsibility for any injury to people or property resulting from any ideas, methods, instructions or products referred to in the content.

