Article

Heavy Metal Content in Fish of the Barguzin River (Eastern Cisbaikalia) and Assessment of Potential Risks to Human Health

by
Selmeg V. Bazarsadueva
1,*,
Valentina G. Shiretorova
1,
Elena P. Nikitina
1,
Svetlana V. Zhigzhitzhapova
1,
Vasilii V. Taraskin
1,
Tcogto Zh. Bazarzhapov
1,2,3,
Suocheng Dong
2,3,* and
Larisa D. Radnaeva
1
1
Baikal Institute of Nature Management, Siberian Branch of the Russian Academy of Sciences, 670047 Ulan-Ude, Russia
2
Institute of Geographic Sciences and Natural Resources Research, Chinese Academy of Sciences, Beijing 100101, China
3
University of Chinese Academy of Sciences, Beijing 100049, China
*
Authors to whom correspondence should be addressed.
Water 2023, 15(21), 3710; https://doi.org/10.3390/w15213710
Submission received: 21 September 2023 / Revised: 13 October 2023 / Accepted: 20 October 2023 / Published: 24 October 2023

Abstract

:
In this paper, the levels of nine heavy metals in the organs and tissues of six commercially important fish species from the Barguzin River (Eastern Cisbaikalia, Russia), bream Abramis brama, roach Rutilus rutilus, crucian carp Carassius carassius, common carp Cyprinus carpio, perch Perca fluviatilis and northern pike Esox lucius, were investigated. The distribution of HMs in the fish organs and tissues was unequal and was determined by both their physiological functions and routes of entry. The study also characterized the environmental habitats, including water and sediments, and conducted an assessment of potential risks to human health associated with fish consumption. The results showed that the levels of Fe, Zn, Cu, Ni, Cd, Pb, Cr and Hg in the muscle tissue of fish from the Barguzin River were generally low and did not exceed the maximum allowable concentrations established in Russia and worldwide. However, Mn levels in a number of samples exceeded the corresponding maximum allowable concentrations, which may be attributed to its elevated presence in the habitat. The calculated fish condition factor K showed good health status of fish from the Barguzin River. The highest Metal Pollution Index values were recorded for northern pike scales (5.9), which, however, corresponded to a low level of contamination. The other metal pollution index values for fish organs and tissues were all below five, indicating either no or very low contamination. Risk to human health was assessed using target hazard quotients and hazard index. None of these indices, both for each fish species studied and for each of the nine heavy metals, exceeded one. This indicated that consumption of the fish species studied did not pose an excessive risk of non-carcinogenic health effects to humans. The data on the content of nine heavy metals in the main commercially caught fish species from the Barguzin River indicated a low level of tissue and organ contamination by heavy metals and the absence of health risks to humans associated with their consumption as food.

1. Introduction

The safety of aquatic ecosystems is of vital importance to humanity, as these ecosystems play a central role in providing water and food to people, and are also the habitat of many aquatic organisms [1,2]. In recent decades, the condition of aquatic ecosystems has sharply deteriorated due to industrialization, climate change, and urbanization associated with the influx of various organic and inorganic pollutants, including heavy metals (HMs) [3,4]. HM pollution is a global problem, and depending on the region and time, its sources and trends differ [5,6]. The toxicity, persistence, non-degradability, bioaccumulation, and the ability to enter and bioaccumulate through the food chain of HMs have led to them being considered as critical contaminants in aquatic ecosystems, causing global concern [2,7,8]. Ongoing contamination of rivers, lakes and reservoirs with HMs through atmospheric emissions, wastewater discharges, and solid waste leads to their accumulation in ecosystems and in the fish tissues and organs, which is a major concern [9].
Due to their high nutritional quality, fish are a crucial part of a healthy human diet, so the fishery product safety assessing is critical to maintaining consumer health [10]. In addition, fish can serve as bioindicators of surface water pollution, allowing the assessment of the ecological status of aquatic systems [11,12].
Unlike organic compounds, HMs can persist in aquatic ecosystems for long periods of time by transitioning from ionic to various ligand-bound forms. As a result, HMs accumulate in hydrobionts at levels significantly higher than their ambient concentrations, posing an even greater toxic threat to living organisms across trophic levels [13,14]. Metals such as manganese, copper, zinc and iron play an essential role in the regulation of metabolic processes in living organisms, with their balance being maintained through intake from food and water [15]. These metals accumulate in various organs and tissues of organisms and are utilized as needed in physiobiological processes. Information on the level and pattern of HM accumulation in fish muscle tissue can be used to assess metal migration within aquatic ecosystems to indicate the degree of HMs contamination [16,17] and to monitor their levels in fish-derived foods [18]. Elevated concentrations of HMs in fish organisms indicate their high levels in the aquatic environment, accumulation in food chains, and functional disturbances at all levels of the ecosystem [19].
The excessive intake of HMs into organisms of hydrobionts can lead to their accumulation in organs and tissues, exceeding the permissible limits. This, in turn, adversely affects the health of both the fish themselves and humans who eat fish-based foods through the food chain [20,21,22]. Globally, there has been an increase in health risks caused by consumption food from aquatic ecosystems that are contaminated with heavy metals [23,24,25,26]. Metal toxicity has been reported to cause health risks that include neurological disorders, endocrine disruption, skeletal and kidney damage, various cancers and others [27,28]. Global guidelines have been established to comprehend and reduce the potential health risks linked to HMs and to guide the safe consumption of fish [29]. Although there is increasing evidence of HMs pollution in water ecosystems worldwide, there are still limited data on the levels of HMs in fish and the potential health risks to humans from their daily consumption. The objective of this article is to determine the levels and distribution patterns of HMs in the organisms of major commercial fishes from the Barguzin River and to assess the health risks to humans associated with consumption of these fishes as food.

2. Materials and Methods

2.1. Study Area

The headwaters of the Barguzin River are at the junction of the Ikatsky and the Yuzhno-Muisky Ranges. Further downstream, the river flows not only through areas of mountainous relief, but also through flat terrain located in the Barguzin rift basin, which is rich in mineral water outcrops and soda-salt lakes, and saline areas are abundant [30,31,32]. At a distance of 10 km downstream from the settlement of Barguzin, there is a large rapid Shamansky in the riverbed. When the water level rises, it causes significant flooding of the basin, accompanied by intense influx of mineral substances from the saline areas [33]. The river flows as a single stream into the Barguzinsky Bay of Lake Baikal, about 1.5 km from the settlement of Ust-Barguzin, bringing numerous silt and sand deposits into the lake.
The climate of the Barguzin Valley is dry, sharply continental, with a high number of sunny days per year and significant variations in both annual and daily temperatures. Winters are cold and long, while summers are hot but short. The average temperature in January is around −40 °C, while in July it reaches +25 °C. The average annual rainfall does not exceed 260 mm.
Livestock farming is developed in the catchment area and fishing dominates in the lower reaches, while irrigated agriculture is less developed. Since the mid-19th century, gold has been mined in the upper reaches of the Barguzin River. Mercury and cyanide methods were used to develop the gold deposits until 1990 [34,35]. In the second half of the 20th century, the river basin was actively engaged in extensive logging and land cultivation, along with the development of irrigated agriculture. However, in the 2000s, with the decline of agriculture, the withdrawal of river water for irrigation purposes decreased significantly. Nevertheless, logging activities and numerous forest fires continue to have a negative impact on the water quality of the Barguzin River. There is no organized wastewater discharge into the river. The population of the largest settlements along the river, such as Kurumkan, Barguzin, and Ust-Barguzin, ranges from 4850 to 6200 people. The river’s water quality is influenced by natural climatic factors and unregulated discharge of wastewater from settlements and other sources.

2.2. Water and Sediments Sampling

Water and sediments were collected to assess heavy metal (HM) contamination in middle and lower reaches of the Barguzin River (Figure 1). A total of 12 water samples and 12 sediments were collected during the subglacial (March) and open-water (May and July) periods in 2022 (1 sample of water and 1 sample of sediment in each sampling point in each period—March, May, July). Geographic coordinates of sampling stations are presented in Table 1.
The samples of surface water were collected in polypropylene bottles and then filtered through Sartorius one-off MCE filters (0.45 µm) in order to further determine the forms of dissolved metals. Filtered solutions were acidified until pH = 2 with HNO3 (67%, distilled without boiling) and stored in high-density polyethylene bottles. The filtered and fixed water samples were transported to the laboratory at 1–3 °C in a refrigerated box within two days.
Sediment samples were taken from the surface layer of bottom sediments using a Petersen dredge (area of grabbing—0.025 m2) and then packed in polyethylene bags. Approximately 1 kg of each point was collected.

2.3. Fish Sampling

Fish samples, including roach Rutilus rutilus (n = 15), bream Abramis brama (n = 6), crucian carp Carassius carassius (n = 12), common carp Cyprinus carpio (n = 7), perch Perca fluviatilis (n = 5), and northern pike Esox lucius (n = 6), were purchased from local fishermen licensed to catch in the Barguzin River (the lower reaches) which is the main fishing place (Figure 1) in July 2022. Fish samples were frozen at −18 °C immediately and transported to the laboratory for analysis within 3–7 days. Each fish was measured in terms of its total length and body weight.

2.4. Laboratory Analyses

Sediments Digestion. To prevent mercury loss, sediments were dried at room temperature and then ground in an agate mortar. The sediments were digested before bulk elemental analysis according to the EPA Method 3052 [36]. A detailed description of the sediment preparation is given in a previously published article [37].
Tissues Digestion. The determination of microelements, including HMs, in the tissues and organs of the studied fish was performed using a digestion technique for the preparation of organic matrix objects for the analysis of mercury and other toxic elements [38]. The fish organs and tissues (muscle, gills, scale, liver, heart, kidneys, spleen and gonads) were removed separately according to FAO methods [39]. Fish tissue samples (1 g) were rinsed with distilled water and then immediately placed in an XP-1500 Teflon vessel (CEM Corp., Matthews, NC, USA) with a reagent mixture, containing 4 mL of HNO3 (67%, distilled without boiling), 2 mL of H2O2 (30%), and 4 mL of H2O. The digestion process was carried out in a MARS 6 microwave system (CEM Corp., Matthews, NC, USA). The instrument settings were in accordance with the recommendations in the manufacturer’s manual. At the end of the microwave program (heating up to 180 ± 5 °C for 15 min, maintenance at 180 ± 5 °C for 15 min), the vessels were cooled to 18–20 °C. The samples were then transferred to the 50 mL volumetric flask and diluted with ultrapure water to the mark.
Atomic Absorption Spectrometry. Then, the contents of HMs (Fe, Mn, Zn, Ni, Cd, Cr, Cu, and Pb) in water, digested samples of sediments and fish were analyzed using an atomic absorption spectrometer (AAS) (Solaar M6, Thermo Scientific., San Diego, CA, USA) coupled with a flame and electro thermic atomizers. The concentrations of Hg in sediments and fish were established by the cold vapor method using an AAS-coupled VP-100 generator. Calibration curves were prepared by using standard metal solutions to determine each metal in the sample. The calibration curves were linear within the range of HM contents (R ≥ 0.999). The detection limits of HMs in samples by spectrophotometric analysis were for Ni (0.06 μg/L), Pb, Cr, Fe (0.02 μg/L), Mn, Cd (0.01 μg/L), and Cu, Zn (0.03 μg/L). The instrument settings were followed as recommended in the manufacturer’s manual.
Quality Assurance and Quality Control. For quality assurance and quality control, blank reagents, Certified Reference Materials (Sediment from Lake Baikal BIL-2 (GSO 7176-95) (A.P. Vinogradov Institute of Geochemistry SB RAS, Irkutsk, Russia), and European Reference Material Fish muscle ERM®-BB422 (Institute for reference materials and measurements, Geel, Belgium)) were used with each batch of samples (1 blank and 1 standard sample per 10 samples). Recoveries of HMs ranged from 91 to 102% of the certified content (Table 2). The preparation of blanks was performed using the same protocol (reagents only). The use of analytical-reagent-grade chemicals was consistent throughout the study. All chemical vessels used in the study were pre-washed with nitric acid and then rinsed with deionized water. To prepare all the reagents and the standard, deionized water (18.2 MΩ⋅cm) prepared using Direct-Q3 Ultrapure Water Systems (Millipore, Molsheim, France) was used.

2.5. Calculation of Accumulation Levels

2.5.1. Contamination Factor for HMs in the Sediments

We used the method of comparing the obtained concentrations of HMs in the study area (Cmetal) with the Clarke value for background freshwater sediments (Cclark) [40]. The value of the sediment contamination factor (CF) was defined as
CF = Cmetal/Cclark,
where CF values were interpreted as suggested by Hakanson [41]: CF < 1 means low contamination, 1 < CF < 3—moderate contamination, 3 < CF < 6—significant contamination, and CF > 6—very high contamination.

2.5.2. Metal Pollution Index (MPI) of Fish Organs and Tissues

Metal Pollution Index (MPI) was defined to estimate the summary HM accumulation in different tissues as follows [42,43,44]:
MPI = (M1 × M2 × M3 × Mn)1/n,
where Mn is the amount of the nth metal in the sample (mg/kg).

2.6. Human Health Risk Assessment

2.6.1. Fish Condition Factor

The Fulton Condition Factor (K) for each fish species was calculated using equation [45,46,47]
K = 100 × W/L3,
where W is weight (g) and L is total length (cm) of the fish.

2.6.2. Target Hazard Quotient

The Target Hazard Quotient (THQ) assesses the non-carcinogenic health risk to consumers from ingestion of potentially toxic elements in fish taking into account the oral reference dose [22,48]:
T H Q = E F r × E D × F i R × C R f D × B W × T A × 10 3 ,
where EFr—exposure frequency (365 days/year); ED—exposure duration (30 year for noncancer risk as used by USEPA [48]); FiR—the Fish Ingestion Rate (60 g/person/day [49]); C—the average concentration of HMs in fish (mg/kg w.w); RfD—the oral reference dose (mg/kg/day) [48]; BW—the average body weight of local residents (70 kg); TA—the average exposure time (EFr × ED) (365 days/year for 30 year).
Fish consumption has a health benefit and the consumer is safe if the THQ is <1, while THQ >1 indicates a high probability of adverse human health risks.

2.6.3. The Hazard Index

The Hazard Index (HI) sums up the THQs for each metal assessed for fish [22]. According to the HI, consuming fish would lead to exposure to multiple potentially toxic elements simultaneously. The cumulative effect of consumption may cause adverse health effects, even if the individual THQs for the food elements are less than 1. The possibility of adverse non-cancer health effects arises when the HI is above 1. The equation that determines the HI is
H I = N = 1 i T H Q n .

2.7. Principal Component Analysis

To obtain a visual representation of the differences in metal composition between fish species, their organs and tissues, the data were subjected to multivariate analysis using the Sirius 8.5 software package [50,51,52]. Relative metal amounts were logarithmically transformed to avoid the dominance of the most abundant metals. Principal component analysis (PCA) was carried out by placing the samples in a two-dimensional space defined by the variables (metals).
New coordinates, Principal Components (PCs), were established through the centroids of the samples, with Principal Component 1 (PC1) representing the direction of the greatest variance among the samples and Principal Component 2 (PC2), orthogonal to PC1, representing the second greatest variation. The original variables (metals) were plotted alongside the samples, resulting in a biplot that visualized the correlation between samples and metals. Metals farther from the source contributed the most to sample variation. In addition, samples located closer to a metal on a plot along the major component contained relatively higher amounts of that metal compared to samples located in the opposite direction.

3. Results and Discussion

3.1. Heavy Metal Content in Water and Sediments of the Barguzin River

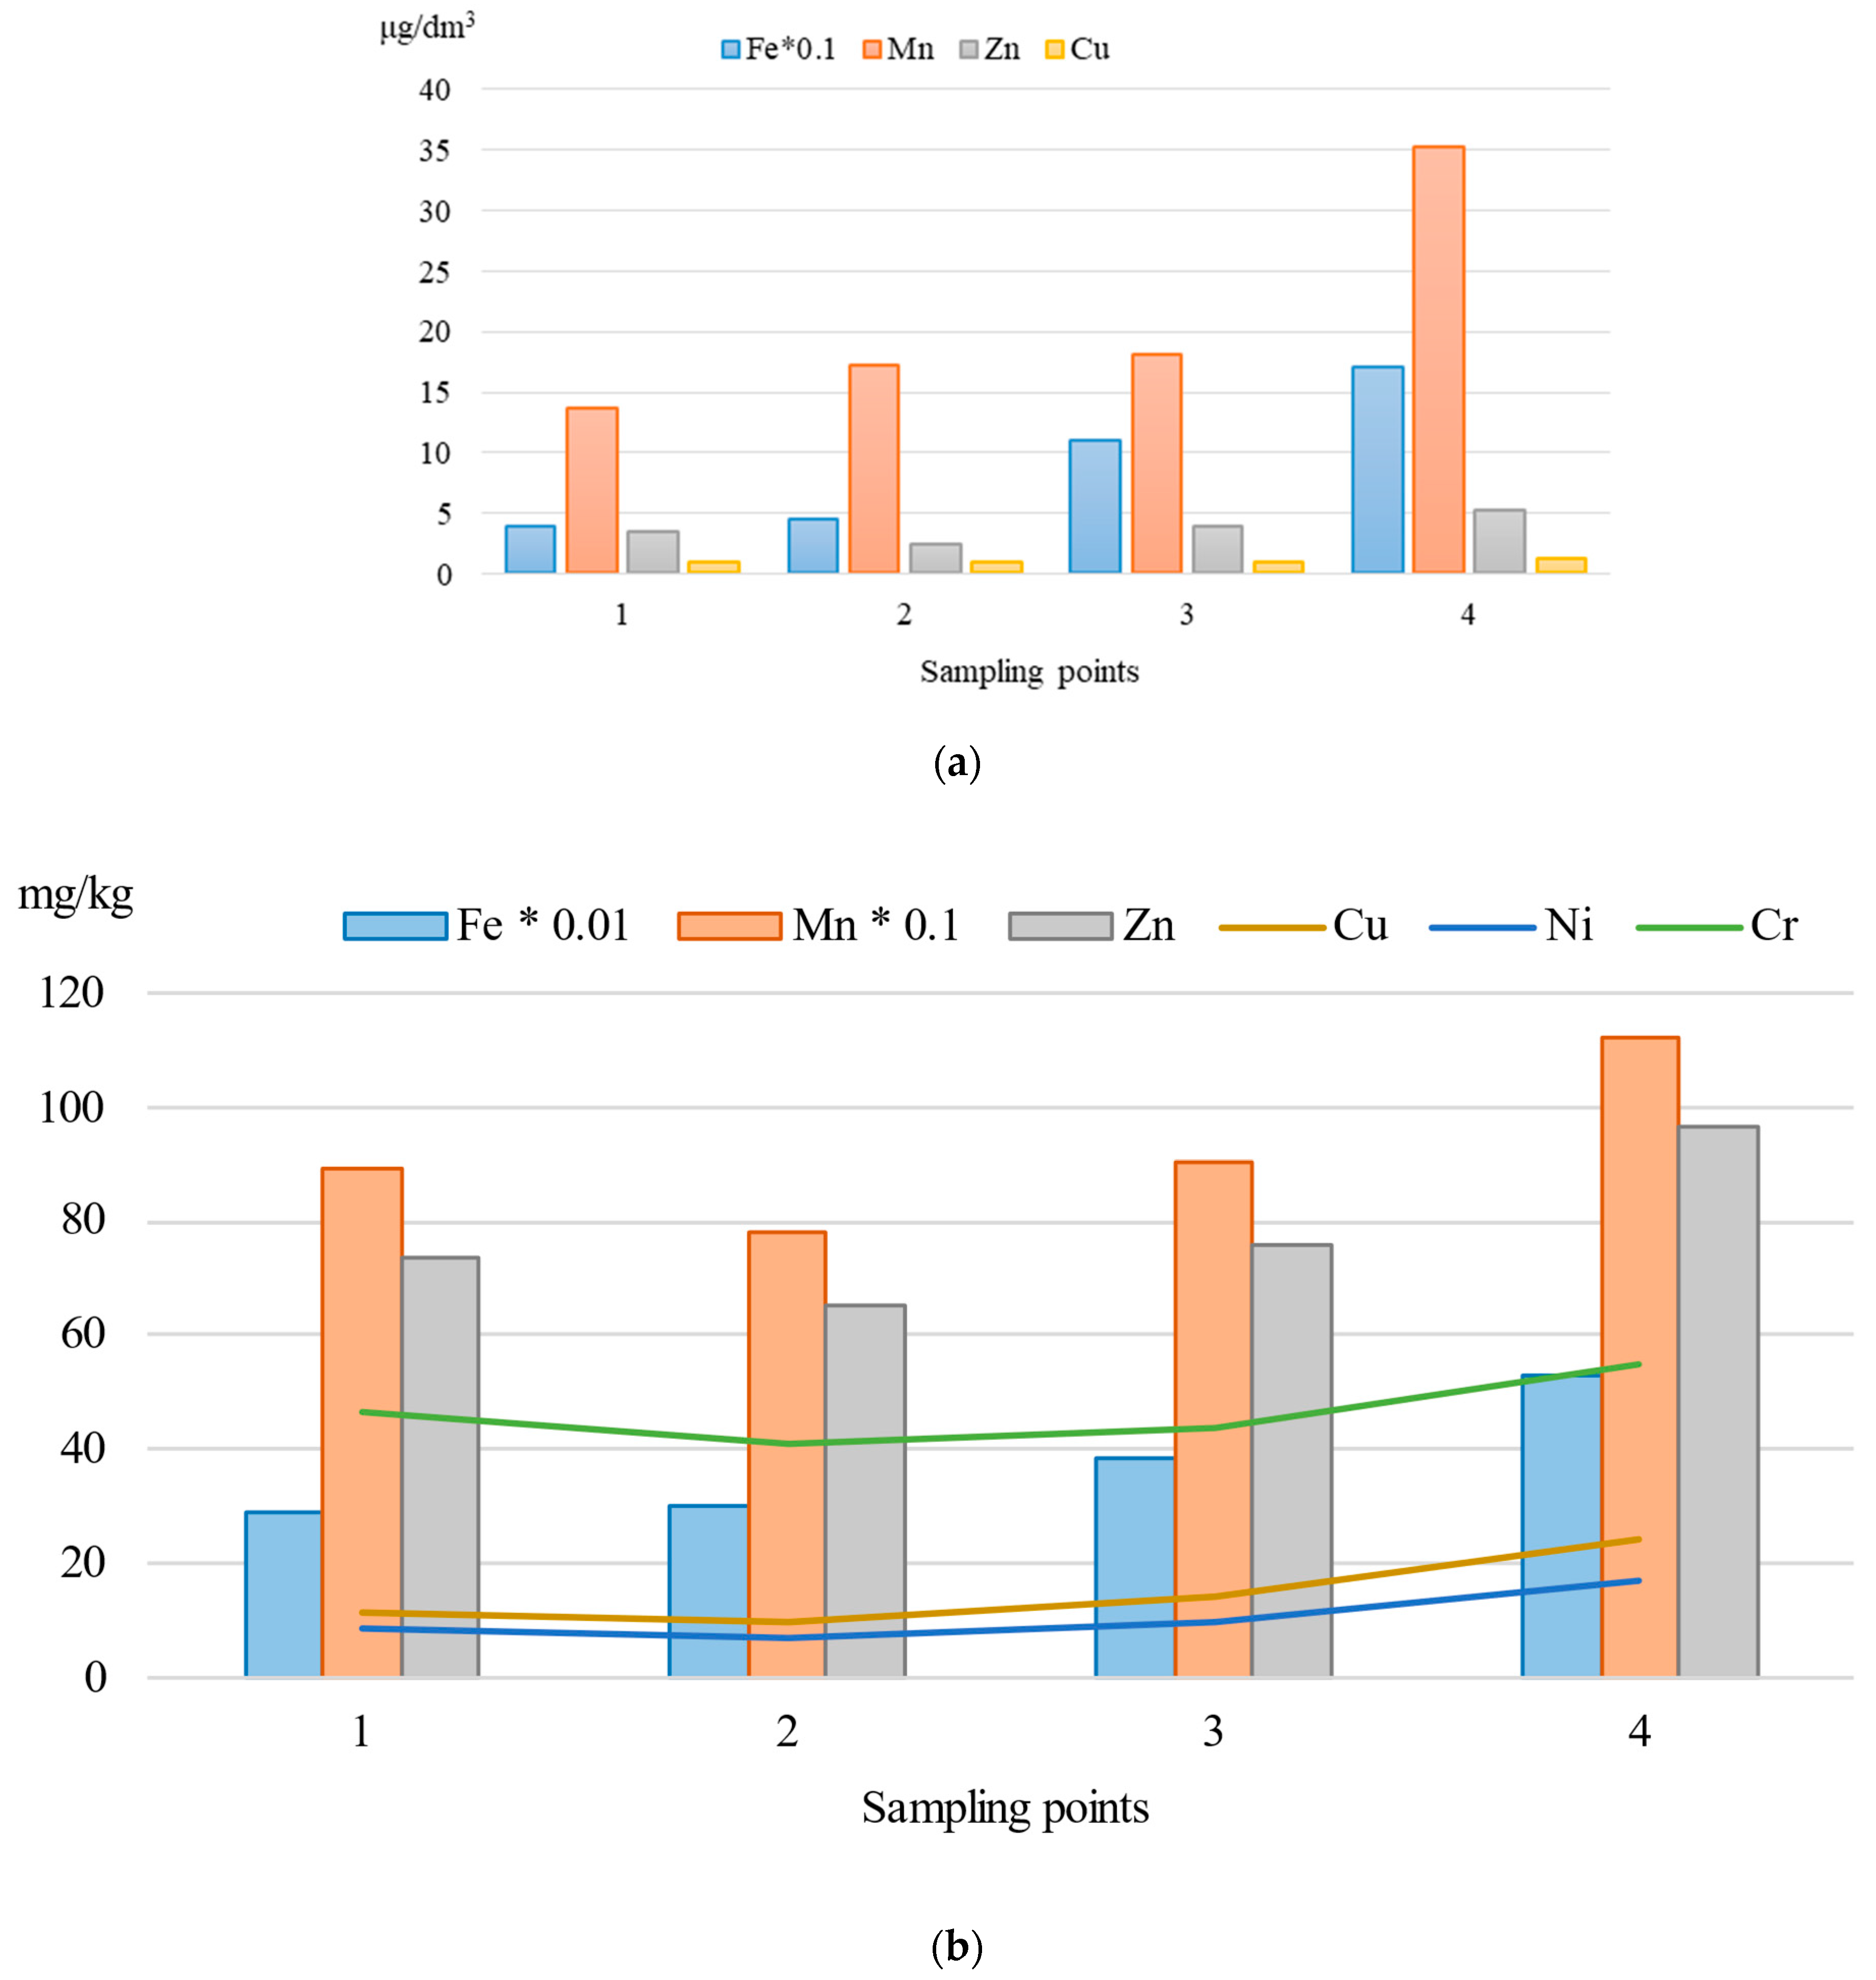
Concentrations of heavy metals (HMs) in the river water and sediments were measured (Table 3). Iron content in surface water varied in a wide range—17–202 µg/dm3. Manganese content in the river water was lower, with highest values in the subglacial period—up to 45 µg/dm3. The maximum zinc content (up to 8 µg/dm3) was also defined in the subglacial period. The mean content of Cu, Ni and Cr was low—1, 1 and 2 µg/dm3, respectively. The content of Pb, Cd and Hg in the water was below the detection limits.
The contents of HMs in sediments were several orders of magnitude higher and were, mg/kg: Fe—29,657–58,277, Mn—732–1179, Zn—56.4–101, Cr 38.5–61.2, Cu—7.8–27.8, Ni—4.6–19.4, Hg—0.039–0.091; Pb and Cd were not detected. In the seasonal aspect, the content of HMs in the sediments changed little; the data along the river flow differed more strongly. The lowest concentrations were observed in the upper reaches (Sampling point 1), the values increased downstream and were maximum at the river mouth (Sampling point 4).
According to previous research [53,54,55], in 2015–2016 (during the extremely low water level), the content of HMs in Barguzin water was as follows: iron (36–130 µg/dm3) and manganese (4–24 µg/dm3), zinc (5–18 µg/dm3), copper (1–18 µg/dm3); in single samples, lead (up to 6 µg/dm3) and chromium (up to 5 µg/dm3) were detected. The content of HMs in sediments was the following: (mg/kg) iron (17,400–22,600), zinc (35.7–84.2), copper (7.2–8.5), lead (2.1–2.8), cadmium (0.5–1.0) [53]. Higher contents of iron and manganese and lower contents of other HMs in water and sediments in the current study in comparison with the previous one may be connected with changes in river water levels. With the beginning of the high-water period (2020–2021) [56], the supply of iron and manganese into the river increased due to the washout with rain floods of the soil cover from adjacent areas; the decrease in the content of other HMs is probably connected with the dilution effect.
Exceedances of the maximum allowable concentrations for fishery reservoirs (MACfr) [57] were observed for iron in 25% of the water samples and for manganese in 44% of the water samples. Relatively high contents of iron and manganese were also defined in sediments, with contamination factors (CF) for these elements ranging from 0.68 to 1.34 and 0.98 to 1.57, respectively. CF > 1 values indicated moderate contamination of sediments by these metals in the Barguzin River. Concentrations of zinc, copper, chromium, nickel, and mercury were lower, with CF values ranging from 0.21 to 0.73, indicating low levels of contamination. Lead and cadmium were not detected in the sediments.
Analysis of the content and spatial distribution of HMs in the Barguzin water and sediments (Figure 2) revealed an increase in metal concentrations downstream, possibly due to inputs from local pollution sources, mainly from populated areas. In addition, there is a high probability of iron and manganese inputs from the extensive swampy areas of the Barguzin depression in the middle reaches of the river because of leaching from the adjacent soil cover by meltwater and rain floods. Mercury was not detected in the water, but its accumulation in the sediments was observed. Previous studies have reported mercury accumulation in aquatic plants of the Barguzin River in amounts ranging 0.015–0.162 mg/kg d.w. [58]. The measured mercury levels in the sediments were slightly higher than the background levels for this region [35], which could be attributed to the long history (over 100 years) of gold mining activities upstream of the Barguzin River, involving the use of mercury and cyanides, as well as the accumulation of large quantities of mercury-containing wastes [34].

3.2. Fish Biometrics

The studied fish species biometric data are shown in Table 4. The Fulton Condition Factor (K) reflects the fish health status, with higher values indicating better condition. This parameter can be affected by following factors: food availability, parasitic infections and physiological factors [41,46,47,59]. The Fulton condition factor of studied fish ranged from 0.55 to 2.22. The maximum value of the K was defined for crucian carp (Kmean = 2.22), followed by that of common carp (Kmean = 1.51) and perch (Kmean = 1.42). The average values of the K for roach and bream were 1.38 and 1.12, respectively. If the Fulton Condition Factor is higher than one, it means that the fish in the studied population are in good health [45]. The minimal value of the factor was, for northern pike, 0.55, probably because of the specific body shape of northern pike (elongated body and head). Similar results were obtained for northern pike with a length of more than 400 mm from the Vizelj channel (Serbia) (0.51 to 0.75) [60]. According to the calculated values of the condition factor, the health of the Barguzin River fish was not affected by the excess of Fe and Mn in the water and sediments.

3.3. Heavy Metal Content in Fish Tissues

The levels of nine HMs (Fe, Mn, Zn, Cu, Pb, Ni, Cr, Cd, Hg) were determined in liver, kidney, spleen, heart, gonads, gills, scales, and muscle of the major Barguzin commercial fish species, including bream, common carp, roach, perch, crucian carp, and northern pike (Figure 3 and Supplementary Table S1). Table 5 shows the levels of HMs in the muscle tissue of Barguzin fish and the maximum allowable concentrations (MACs) for HMs in food specified by the SanPiN of Russia, WHO, FAO, MAFF, and the EU regulations. The concentration of mercury in all samples was below the detection limit (0.015 mg/kg).
Among the elements studied, Fe, Cu, Zn, Mn, Ni, and Cr are essential for the proper human body functioning, although they can become toxic at high concentrations. Elements such as Pb, Hg, and Cd are toxic even at low concentrations, which can be achieved through a contaminated environment [61,62]. Fish accumulate metals through adsorption from water and ingestion through their diet.
The degree of metal accumulation and its distribution patterns in hydrobionts are largely determined by organ-specific metabolic rates and the biological role of the elements. Although the distribution of HMs in fish organs and tissues is specific to each sample, some common patterns can be observed. For example, regardless of species, biological specialization, and other factors, iron and zinc dominate the elemental concentrations in fish organs and tissues (Figure 3).
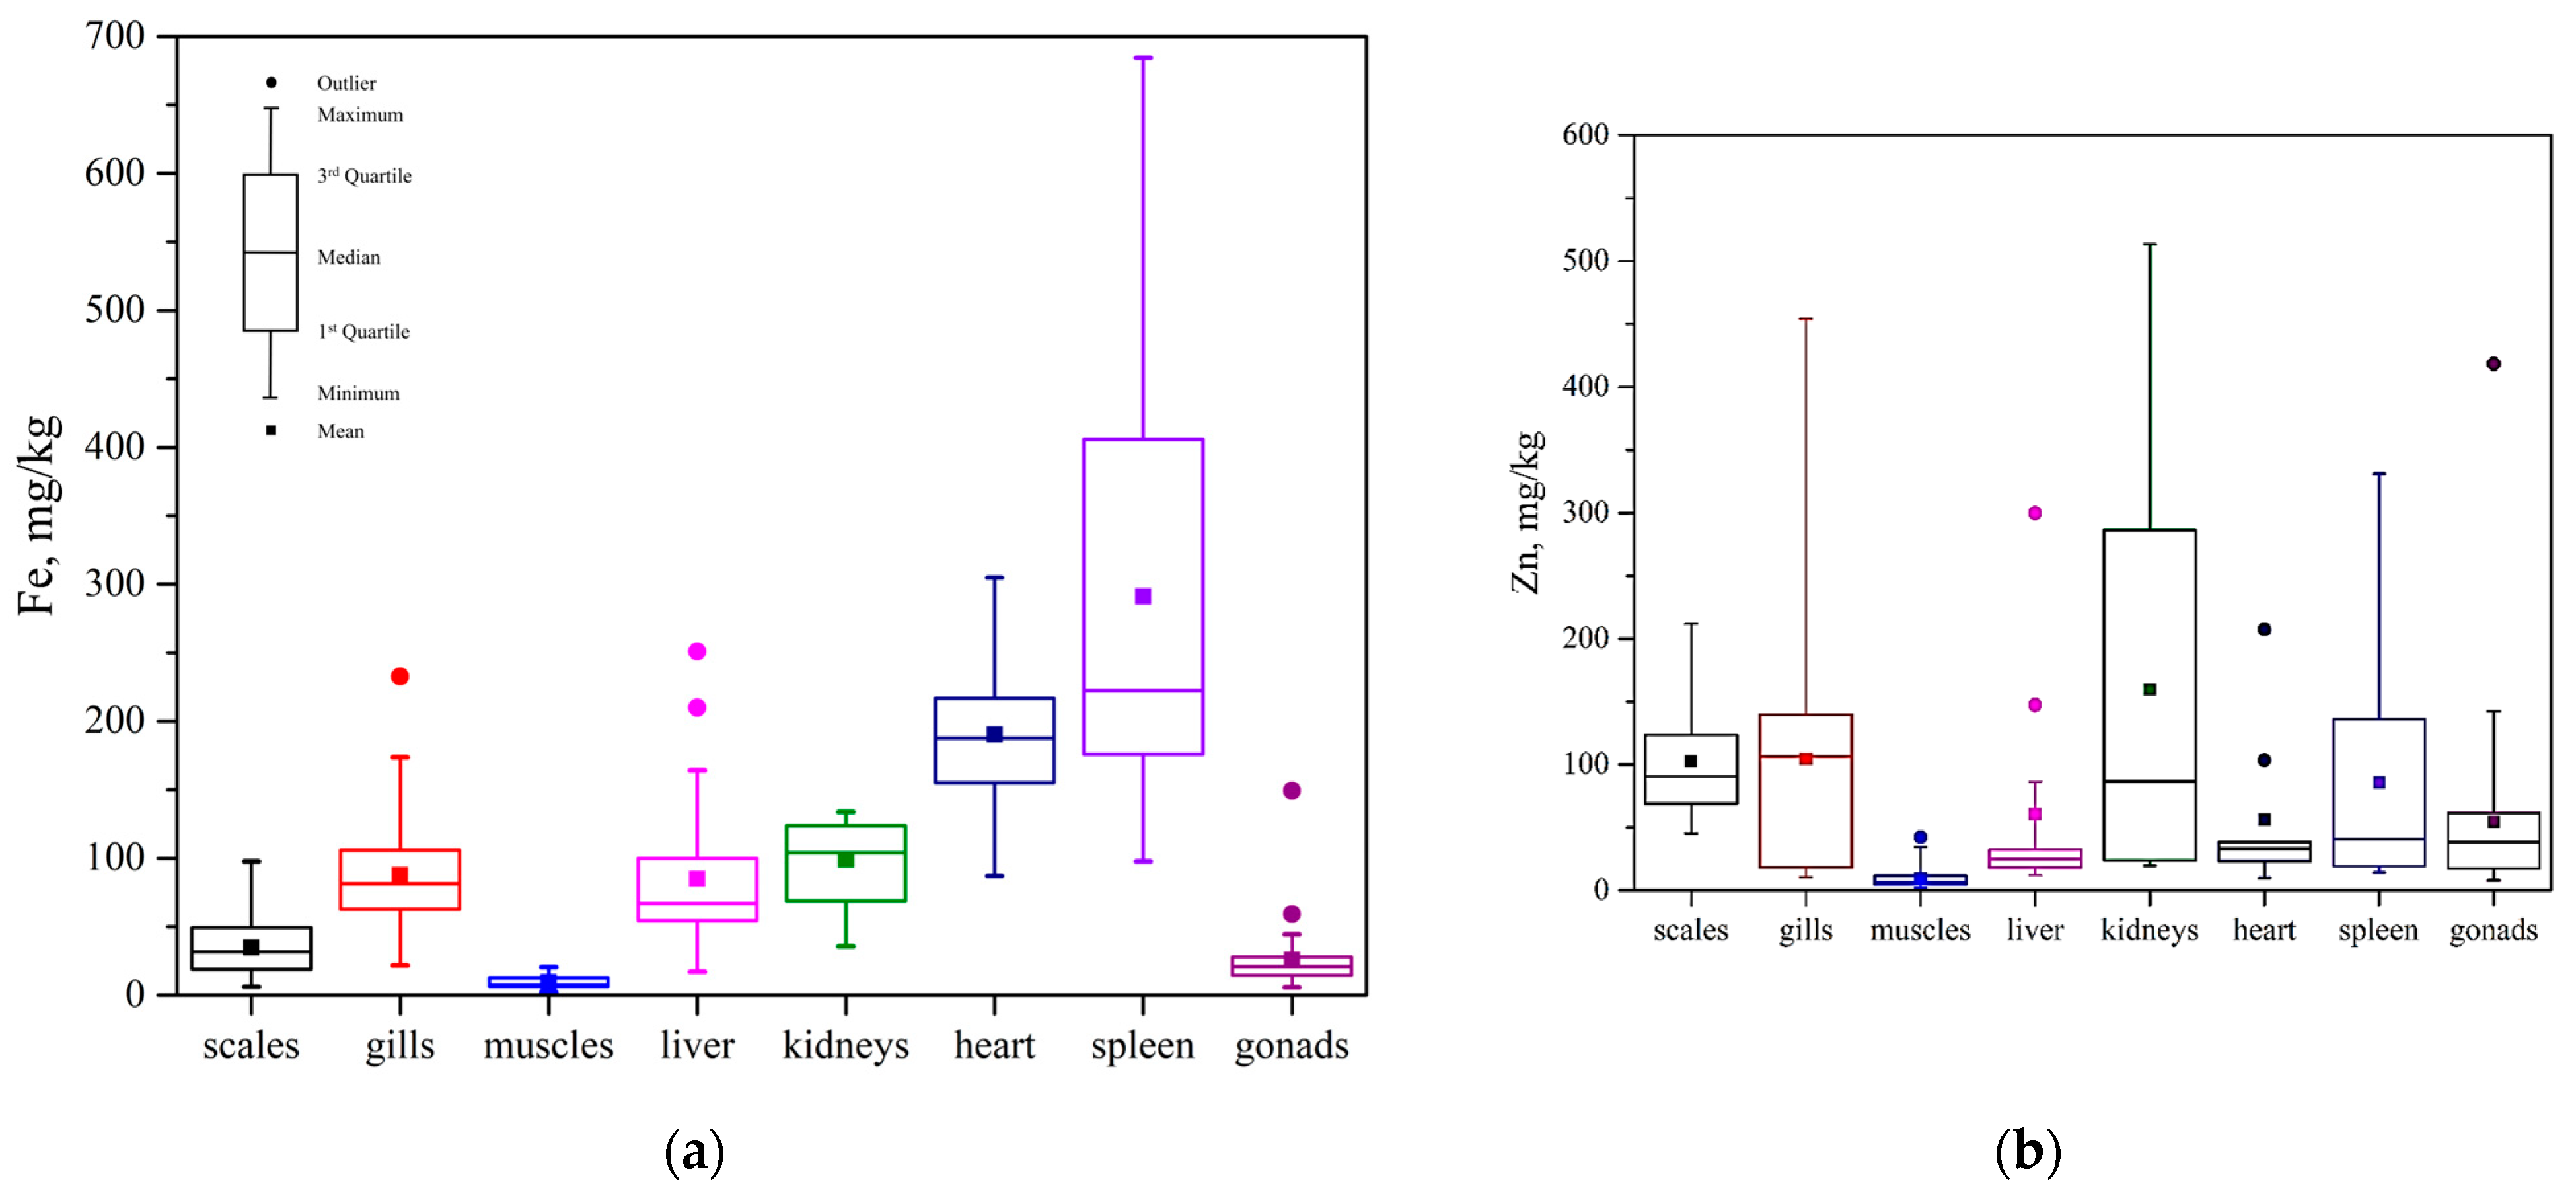
For a detailed analysis of the ability to accumulate each heavy metal in a specific organ or tissue, we constructed boxplots with the content of heavy metal in the organs of all analyzed fish (Figure 4, Figure 5 and Figure 6). The highest levels of iron and zinc were found in the hematopoietic organs of the fish species studied (Figure 4). This is attributed to their essential role in hematopoiesis, tissue respiration, hemoglobin synthesis and other critical processes. Iron is essential for the formation of hemoglobin, myoglobin, ferritin, hemosiderin, and numerous enzymes, and it also has a vital role in brain functioning [63,64]. Zinc plays an important role in enzymes and cofactors. This trace element is crucial for many biological functions and protects against the toxic effects of cadmium and lead [65,66,67].
Average iron concentrations decreased in the following order: spleen > heart > kidneys > gills > liver > scales > gonads > muscles, while zinc concentrations decreased in the following order: kidneys > gills > spleen > scales > gonads > heart > liver > muscles.
Table 5. Heavy metal (HM) content in muscle tissues of Barguzin fish ( m i n m a x m e a n ± S D ), mg/kg w.w.
Fish SpeciesFeMnZnCuPbCdNiCr
Northern pike12.69 − 15.72
14.31 ± 1.19
0.61 − 2.68
1.22 ± 0.75
2.62 − 5.43
3.95 ± 1.06
n.d. − 1.07
0.37 ± 0.13
n.d.n.d.n.d.n.d.
Perch5.83 − 8.44
6.67 ± 1.07
0.56 − 0.87
0.75 ± 0.12
4.52 − 5.81
5.23 ± 0.54
n.d. − 0.07
0.03 ± 0.00
n.d.n.d.n.d.0.08 − 0.14
0.10 ± 0.04
Roach6.0 − 18.19
10.75 ± 4.05
0.33 − 4.34
1.36 ± 1.23
4.05 − 16.44
7.87 ± 3.09
n.d. − 0.62
0.46 ± 0.41
n.d. − 0.29
0.09 ± 0.06
n.d. − 0.20
0.06 ± 0.02
n.d. − 0.27
0.09 ± 0.04
n.d. − 0.14
0.09 ± 0.02
Bream2.20 − 8.77
6.44 ± 2.21
0.18 − 1.45
0.91 ± 0.45
2.15 − 5.13
3.74 ± 1.08
n.d. − 0.32
0.16 ± 0.05
n.d.n.d.n.d.n.d. − 0.15
0.08 ± 0.07
Common carp3.77 − 9.76
6.51 ± 2.36
0.21 − 1.20
0.68 ± 0.33
6.26 − 42.21
18.86 ± 15.62
n.d. − 0.76
0.27 ± 0.19
n.d.n.d. − 0.03
0.01 ± 0.00
n.d.n.d. − 0.14
0.13 ± 0.03
Crucian carp5.25 − 20.37
9.64 ± 4.53
0.06 − 1.24
0.60 ± 0.31
9.57 − 17.11
12.98 ± 2.55
n.d. − 0.35
0.12 ± 0.11
n.d.n.d. − 0.16
0.05 ± 0.02
n.d. − 0.30
0.16 ± 0.08
n.d. − 0.15
0.12 ± 0.03
Tolerable and permissible levels of HMs in the fish muscles, mg/kg w.w.
Russian Regulations [21]10.20.5
USEPA, 1983 [68]48012048
MAFF, 2000 [69]502020.2
WHO, 2000 [70]1091300.50.5300.15
FAO, 2000 [29]1800.5303020.555
EC Regulation, 2006 [71]0.30.1
Notes: n.d.—not detected or below detection limit; “–”—maximum concentrations are not specified.
The Fe content in the muscle tissue of the studied fish varied widely, ranging from 2.20 to 20.37 mg/kg, while the zinc content changed from 2.15 mg/kg to 42.21 mg/kg, with the minimum values found in bream and the maximum in common carp (Table 5). Mean Fe concentrations in the muscle (6.44–14.3 mg/kg) were generally similar to the data reported in the literature (Supplementary Table S2). The mean concentrations of iron (6.44–14.31 mg/kg) and zinc (3.74–18.86 mg/kg) in the fish muscle tissue were below the internationally established MACs.
Hence, eating these fish does not result in any metal toxicity risks for humans [29,68,69,70]. However, zinc concentrations in 28% of the common carp muscle samples slightly exceeded the MACs established by FAO [29].
Analysis of manganese and chromium in the investigated fish samples revealed a tendency for significant accumulation in the scales (Figure 5), likely due to uptake from the external environment, i.e., water and sediments. For example, the manganese content in the Barguzin water ranged from 0.002 to 0.045 mg/L, with exceedances of the MACs in some sampling sites, possibly due to regional geochemical peculiarities. The mean chromium concentrations in the water and sediments of the Barguzin River in 2022 were 0.002 mg/L and 47.6 mg/kg, respectively.
Manganese content in the internal organs, including those of the reproductive system, was slightly higher (Figure 5a) than in the muscle tissue, which can be attributed to its vital role in organisms. Manganese plays an important role in bone formation, is found in many enzymes and is necessary for carbohydrate, protein, and cholesterol metabolism in animals and plants. The deficiency of this essential trace metal can result in severe skeletal and reproductive abnormalities [45,59,72].
The average manganese content in the fish muscle from the Barguzin River ranged from 0.60 to 1.36 mg/kg (Table 5), which is close to its content in fish from the Ob River (Western Siberia) and higher than in fish from other regions (Supplementary Table S2). However, the manganese content in individual samples was uneven, with 80% of the fish muscle samples, regardless of species, exceeding the acceptable limits set by FAO and WHO (in 27% of samples) [29,70]. Chromium was detected in 71% of the muscle samples with a concentration of up to 0.15 mg/kg, within the WHO (0.15 mg/kg) [70] and USEPA (8 mg/kg) [68] standards. The average chromium content in fish muscle ranged from trace amounts to 0.15 mg/kg.
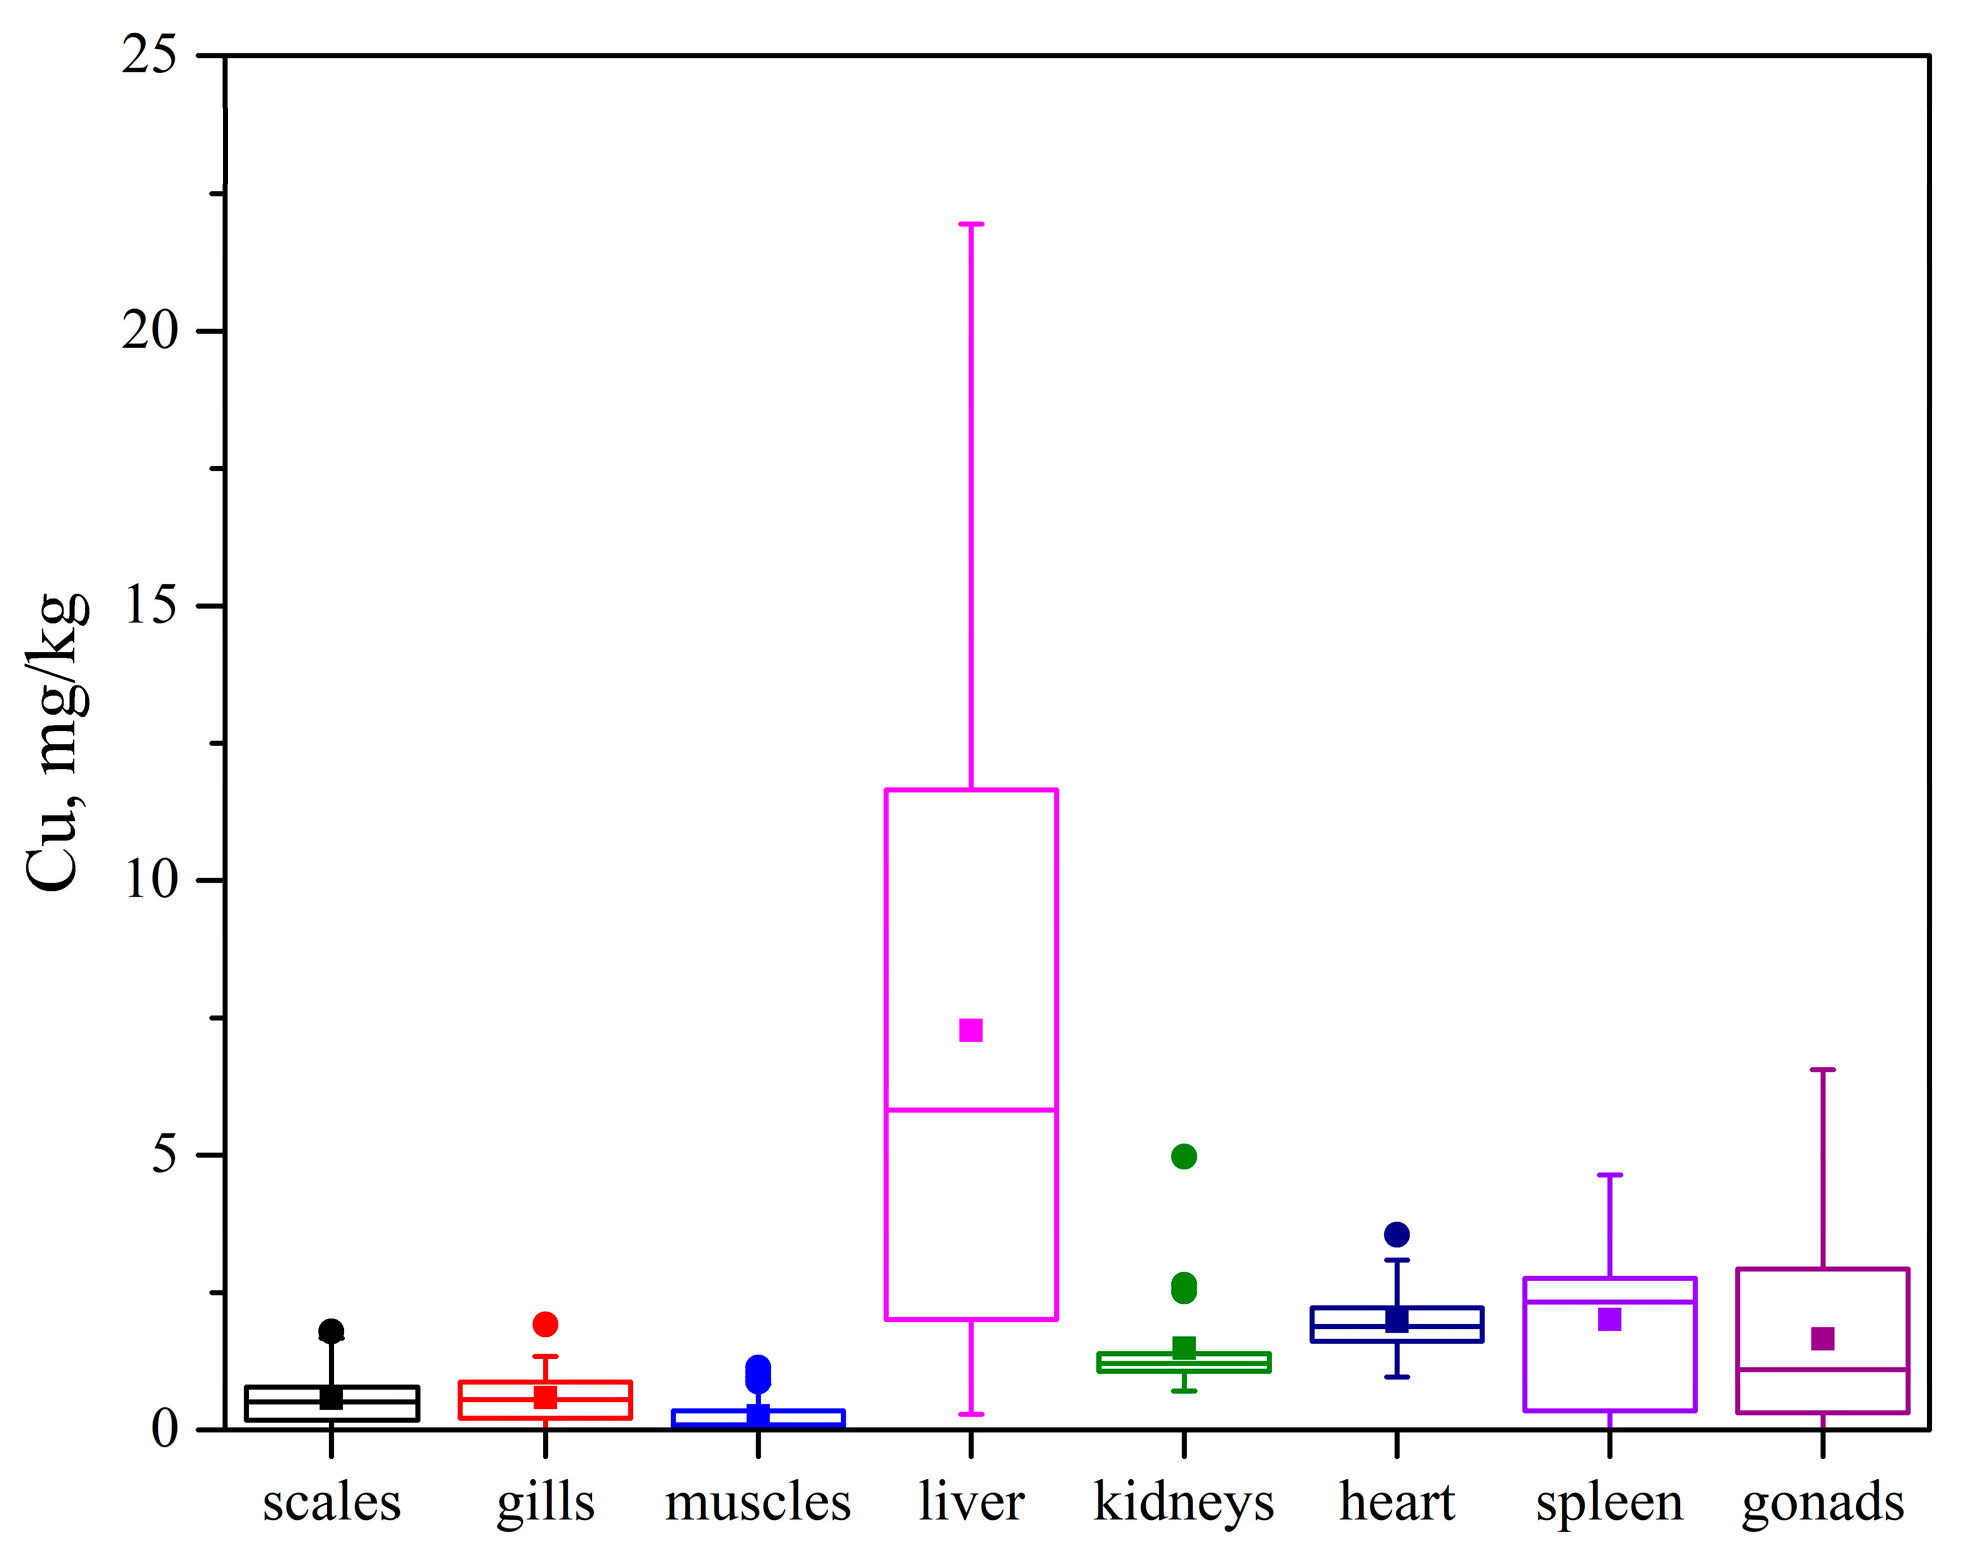
In this study, copper was detected in 88% of all fish samples. The highest concentrations were found in fish livers (up to 21.95 mg/kg in common carp) (Figure 6), with a mean range of 0.93–13.06 mg/kg. High copper content and preferential accumulation in the liver are characteristic of fish from different ecological groups [73,74,75]. Copper is an important component of several enzymes and is essential in hemoglobin synthesis and bone strength. However, excessive copper intake can cause kidney and liver damage [45,65,66,72,76,77]. Notably, the average level of copper in fish muscle tissue (0.03–0.46 mg/kg) was found to be below acceptable limits [29,68,69,70], indicating no significant risk associated with human consumption of fish.
Living organisms require low concentrations of nickel, but its elevated levels can be carcinogenic [70]. Nickel concentrations in the studied fish muscle were insignificant, ranging from trace amounts to 0.30 mg/kg, which is below the standards established by Russian and international organizations [21,29,68,69,70,71]. Nickel was detected in only 22% of the examined fish organ and tissue samples, and no specific distribution pattern within the fish body was identified.
The biological role of lead in the human body remains unclear, although its elevated concentrations have been associated with the risk of liver and kidney damage, various oncological diseases, and neurological disorders in children [78,79,80,81]. In this study, lead was found in a few samples (7% of the total organ and tissue samples analyzed). In the muscle tissues of the Barguzin River fish, lead was detected only in perch tissues, and its levels were below all established MACs [21,29,68,69,70,71].
Cadmium has no proved biological activity in the human body. Its toxic effects are usually associated with the consumption of contaminated food rather than drinking water. It is known that cadmium ions can form complexes with metallothionein proteins, which reduces its toxicity [66,80,82]. In our study, Cd was found in the tissues of perch, common carp and crucian carp, only in 10% of the samples, with concentrations reaching 0.20 mg/kg, and the average levels of cadmium in these fish were 0.01–0.06 mg/kg. The MACs of cadmium established by WHO and FAO are 0.5 mg/kg [70], the Russian SanPiN, MAFF—0.2 mg/kg [21,69], and EU—0.1 mg/kg [71]. Accordingly, the average values of Cd in the studied fish muscle tissue were below all the established limits [21,29,68,69,70,71].
Mercury is known as a carcinogenic metal. Its strong biomagnification tendency causes it to accumulate in higher-order organisms [35,38]. In its methylated form, it acts as a neurotoxin and can cause various serious health problems [83,84,85,86]. The content of mercury in all organs and tissues of the investigated fish from the Barguzin River was below the detection limit (0.015 mg/kg), which is significantly lower than the established MACs.
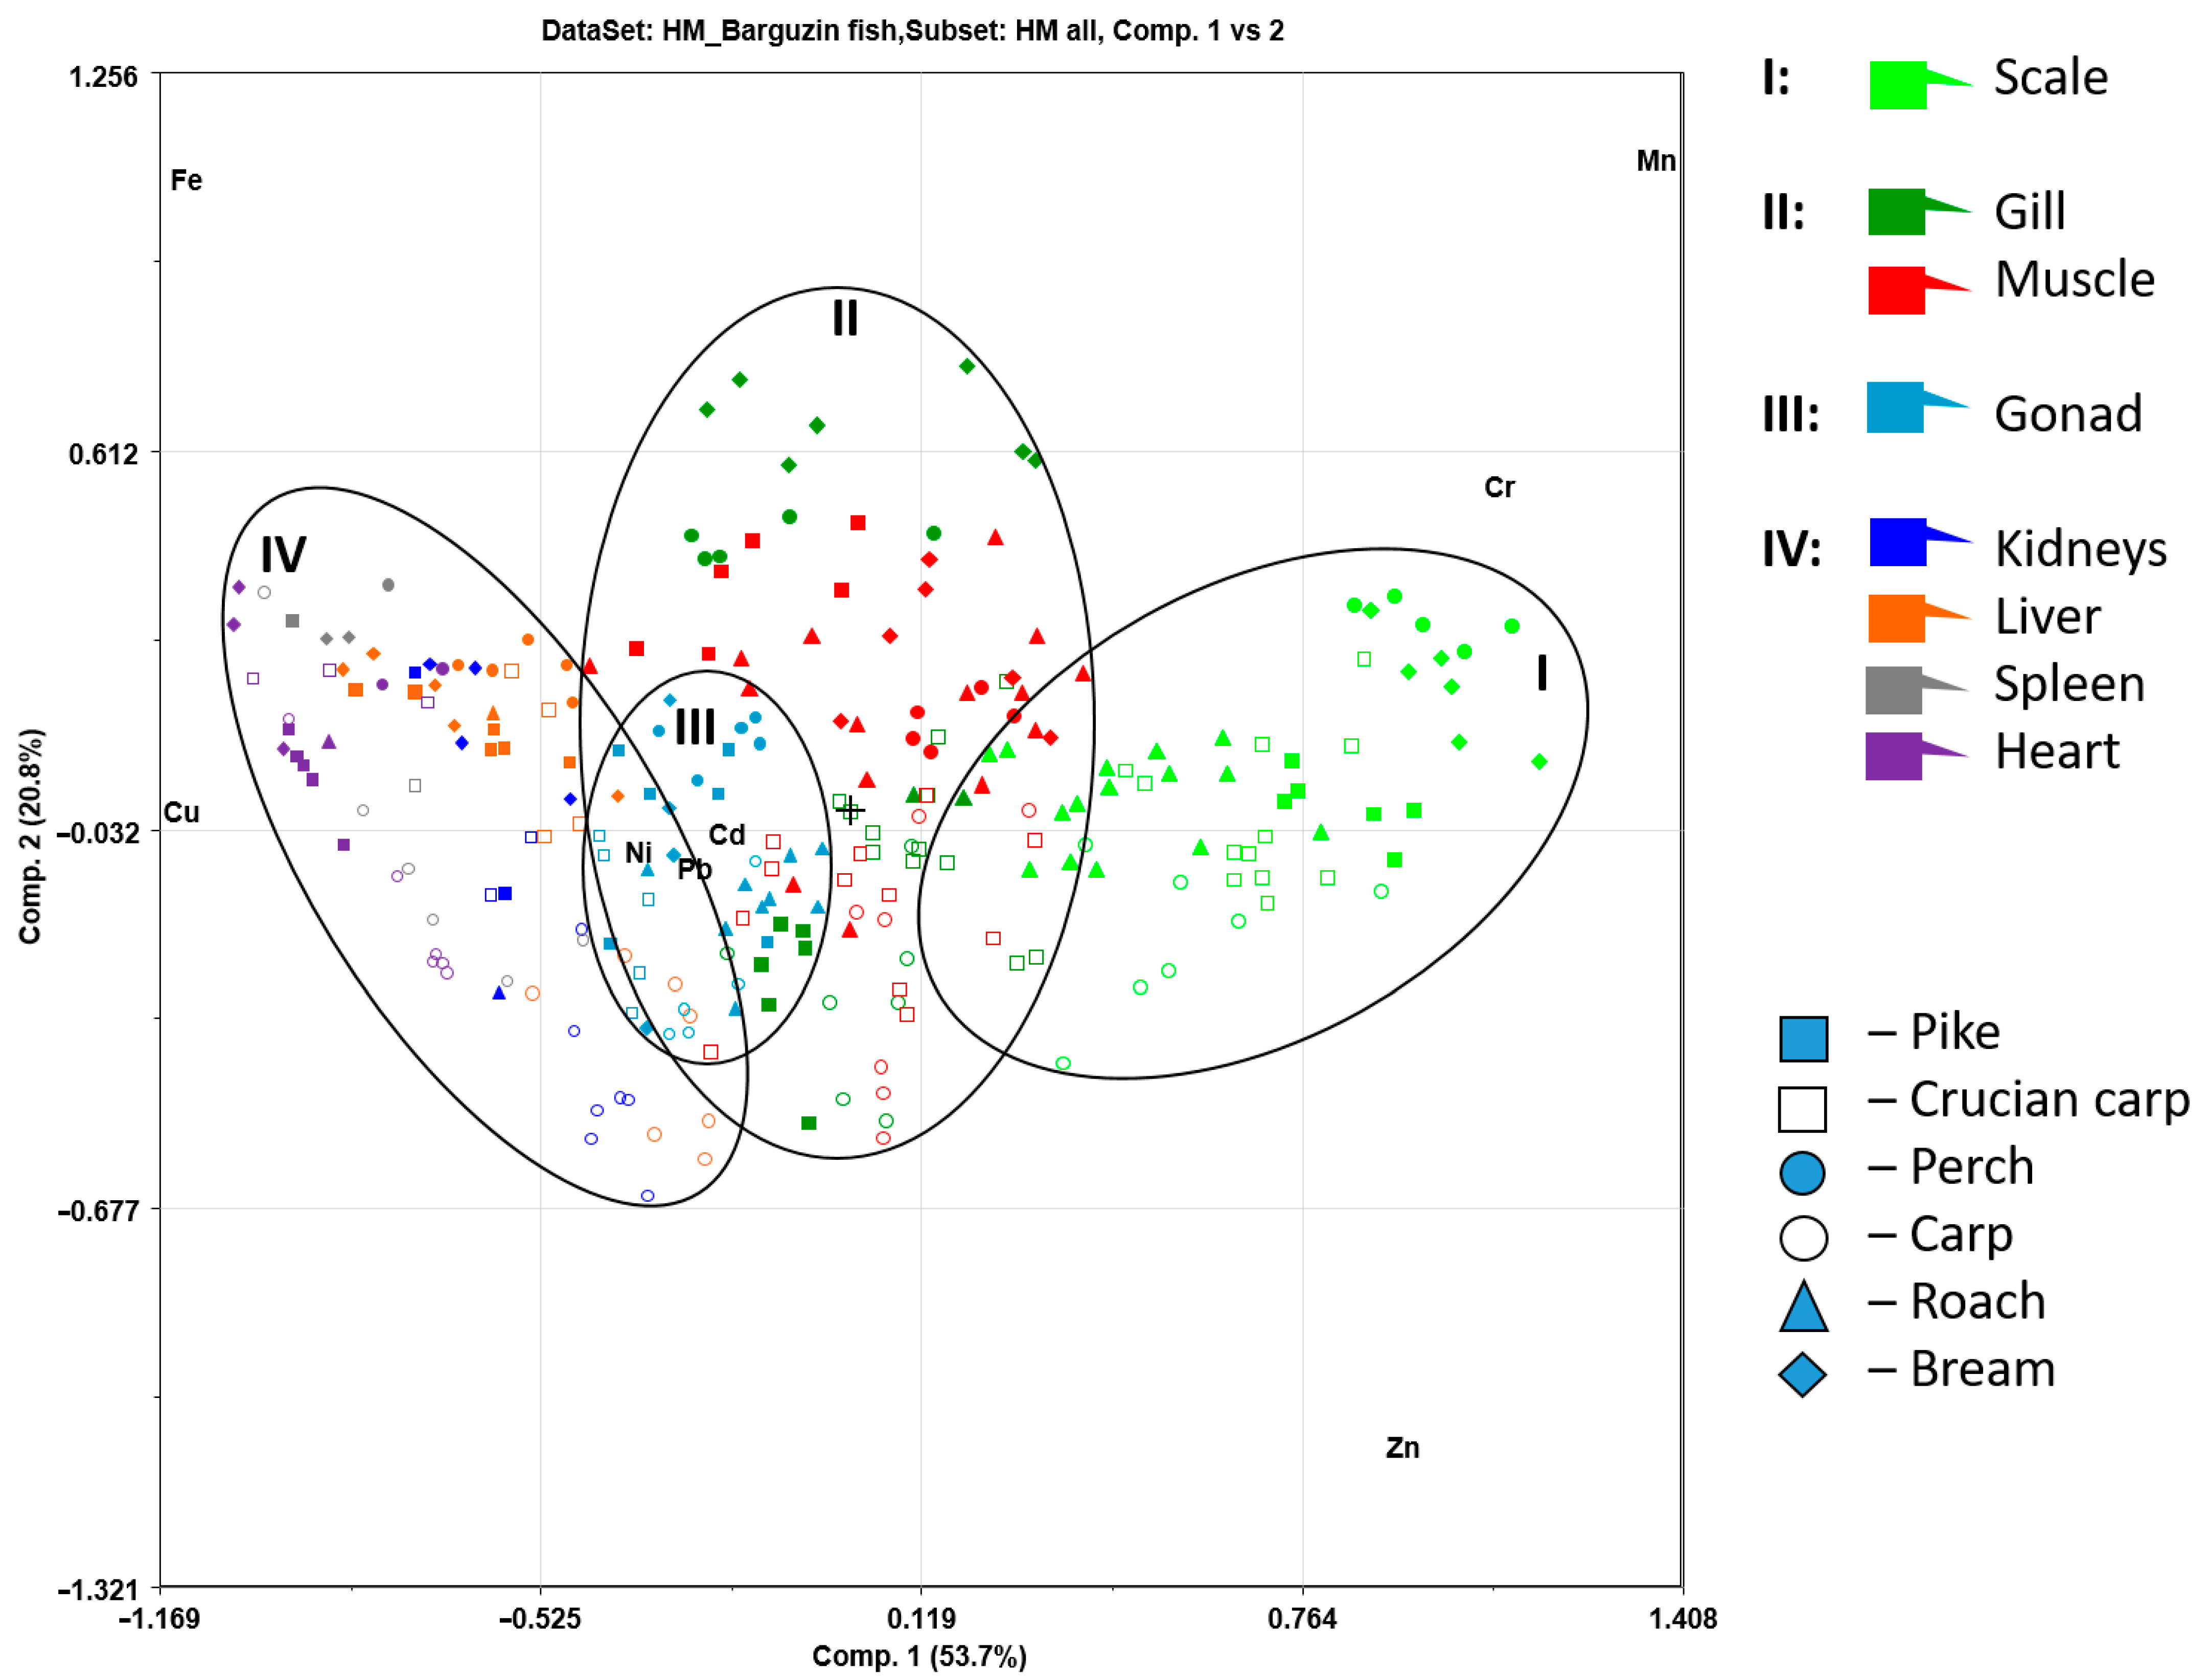
The HMs content data in the studied fish samples were processed using the Principal Component Analysis (PCA) method for data visualization [49,50,51,52]. Figure 7 shows the PCA plot for the content of eight HMs in the tissues of crucian carp, perch, northern pike, common carp, roach, and bream. The distribution of HMs in the organs and tissues of fish, as described earlier, is highly uneven due to the peculiarities of metal uptake, excretion, as well as the structure and functions of the tissues themselves. A significant proportion of inorganic metal compounds enter the fish organism through the diet. Through gills, scales, and skin, organometallic compounds and soluble dissociating salts penetrate [19].
PCA of the fish tissue samples revealed distinct clusters based on tissue type. The fish scale samples (Group I) were located on the right side of the graph, mainly due to their manganese and chromium content. The samples of reproductive organs (Group III) clustered in a small locus to the left of the graph, while the muscle tissue and gill samples (Group II) were positioned in the center with a wide dispersion. Overall, the content of the investigated elements in the organs of the reproductive system was similar to that in the fish muscle (Figure 3). The highest accumulation of iron and zinc occurred in the hematopoietic organs (Group IV) and gills of the investigated fishes, surpassing other organs. Meanwhile, the accumulation of copper was more pronounced in the liver.
PCA revealed that different organs and tissues of fish have distinct capacities for the accumulation of HMs. It is probable that this is caused by differences in organ metabolic activity and function, as well as changes in environmental contamination [87,88]. Metal concentrations in tissues of different fish species may be related to metabolic peculiarities, age and size of the fish, as well as their habitat and food source [89,90]. As PCA indicated, the distribution of metals in the investigated samples of different fish species from the Barguzin River is influenced more by the specificity of organs and tissues rather than by the fish species.
Since metals do not degrade in natural environments, information on metal concentrations in tissues of commercial fish, especially in muscle tissue, is important for assessing the quality of fish raw materials and protecting public health. The obtained results on the content of HMs in fish muscle tissues (Table 5) demonstrated that the values of Fe, Zn, Cu, Ni, Cd, Pb, Cr, and Hg in the tissues of the Barguzin fish were generally low and the MACs established in Russia and worldwide were not exceeded [21,29,68,69,70,71].
On the other hand, the elevated content of Mn in the Barguzin River (probably influenced by the regional geochemical background) led to its accumulation in fish tissues. Thus, in some fish muscle samples, Mn levels exceeded the MACs established by international organizations (Table 3).
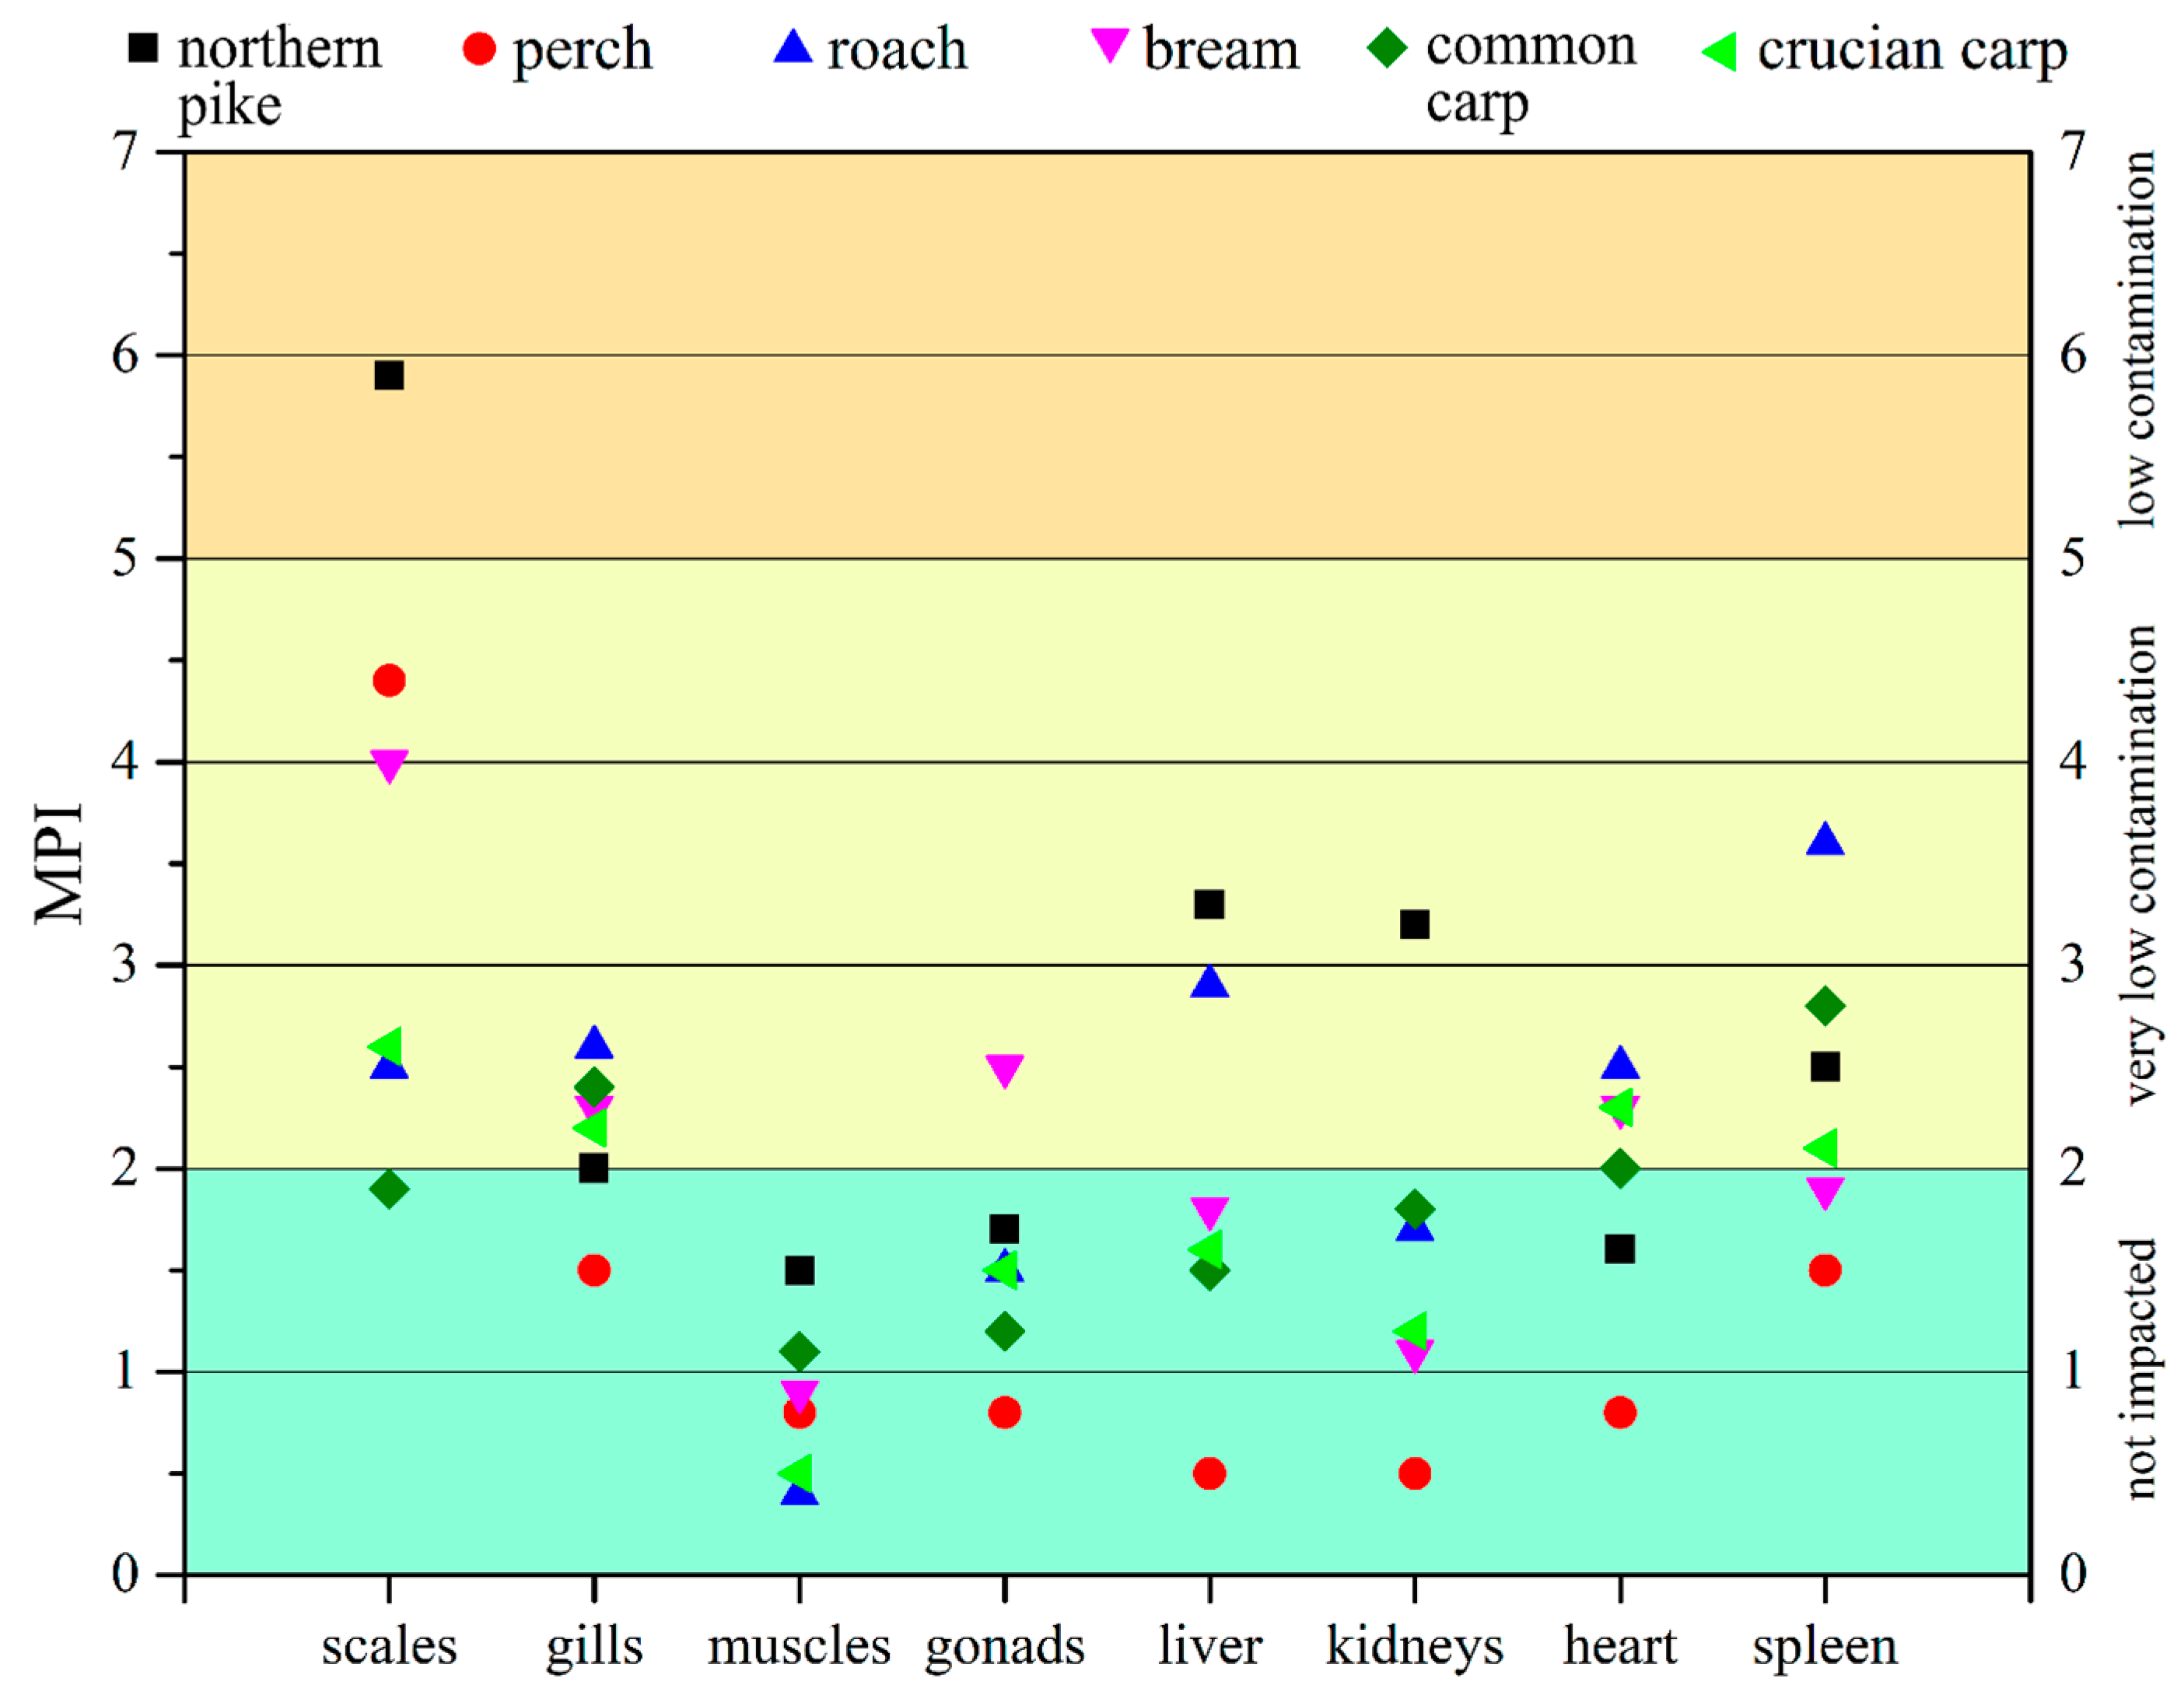
The Metal Pollution Index (MPI) was determined according to Equation (2) to assess the overall HMs accumulation in different tissues (Figure 8). The MPI for the nine HMs in the studied fish organs and tissues were as follows: gill—1.5–2.6, scale—1.9–5.9, gonad—0.8–2.5, liver—0.5–3.3, kidney—0.5–3.2, heart—0.8–2.5, spleen—1.5–3.6, and muscle—0.4–1.5. The MPI values in tissues between 5 and 10 indicate low levels of contamination, 2–5—very low levels of contamination, and MPI < 2 indicates no contamination [91].
Thus, based on the MPI values, the degree of HM contamination in fish from the Barguzin River is low or absent. The obtained results show that each organ/tissue has a different ability for HMs accumulation, with higher accumulation observed in scales and lower in muscle tissue. The greatest variation in contamination index among fish species is observed in scales and liver, which may be connected with differences in habitat and feeding habits among fish species. However, no significant species-specific HM accumulation patterns were found in fish tissues and organs.

3.4. Human Health Risk Assessment

To assess the potential risk, target hazard quotients (THQ) were calculated for each element and for the muscle tissue of all fish examined. In addition, a hazard index (HI) incorporating all individual THQ values was defined for each fish species (Table 6).
We found that none of the individual THQ, both for each fish species studied and for each element, exceeded one. This indicated that the consumption of the studied fish did not pose an excessive non-carcinogenic risk. The HI, which takes into account the combined effect of the intake of several potentially toxic elements, also did not exceed one and ranged from 0.050 to 0.223 (Table 6).

4. Conclusions

In this study, we investigated the levels of nine HMs in organs and tissues of six commercially important fish species, bream Abramis brama, roach Rutilus rutilus, crucian carp Carassius carassius, common carp Cyprinus carpio, perch Perca fluviatilis and northern pike Esox lucius, as well as in water and sediments from the Barguzin River (Cisbaikalia, Russia). The distribution of HMs in fish organs and tissues was unequal and was determined by both their physiological functions and routes of entry. Thus, iron and zinc accumulated in higher quantities in the hematopoietic organs, manganese and chromium in the scales, and copper in the liver. Nickel, cadmium and lead were found in single samples of the studied fish internal organs. Mercury was not detected in any fish samples. The calculated fish condition factor (K) showed good health status of fish from the Barguzin River. It was found that the concentrations of Fe, Zn, Cu, Ni, Cd, Pb, Cr and Hg in the muscle tissue of fish from the Barguzin River did not exceed the MACs established in Russia and worldwide. The samples from the Barguzin River showed high levels of Mn in the water and sediments, resulting in some muscle tissue samples having average Mn levels 2–3 times higher than MACs set by international organizations. The potential risk to humans from fish consumption was assessed. The calculation of MPI for fish organs and tissues indicated low and very low levels of contamination. None of HI and THQs exceeded one, indicating that consumption of the analyzed fish species from the Barguzin River does not pose an excessive risk of non-carcinogenic health effects. Therefore, the data obtained on the concentration of nine metals in the major commercially important fishes of the Barguzin River indicate a low level of tissue and organ contamination with HMs and no health risk associated with their consumption as food.

Supplementary Materials

The following supporting information can be downloaded at https://www.mdpi.com/article/10.3390/w15213710/s1, Table S1. Heavy metal content in organs and tissues of fish from the Barguzin River ( m i n m a x m e a n ± S D ), mg/kg w.w.; Table S2. Metal content in tissues of freshwater fish, mg/kg w.w. Refs. [92,93,94,95,96,97,98,99,100] are cited in Supplementary Materials.

Author Contributions

Conceptualization, S.V.B. and L.D.R.; methodology, S.V.B.; software, E.P.N.; validation, V.G.S. and T.Z.B.; formal analysis, E.P.N.; sampling, sample preparation, HM analysis, V.G.S. and E.P.N.; investigation, T.Z.B.; resources, V.V.T.; data curation, S.V.B. and V.G.S.; writing—original draft preparation, S.V.B.; writing—review and editing, S.V.Z.; visualization, S.V.B.; supervision, V.V.T. and S.D.; project administration, V.V.T.; funding ac-quisition, S.D. All authors have read and agreed to the published version of the manuscript.

Funding

This research was carried out within the framework of Technology Fundamental Re-sources Investigation Program: 2022FY101904 and the state assignment to Baikal Institute of Nature Management SB RAS (AAAA-A21-121011890027-0), using the resources of the Research Equipment Sharing Center of BINM SB RAS.

Data Availability Statement

Not applicable.

Conflicts of Interest

The authors declare no conflict of interest.

References

  1. Lin, L.; Yang, H.; Xu, X. Effects of Water Pollution on Human Health and Disease Heterogeneity: A Review. Front. Environ. Sci. 2022, 10, e880246. [Google Scholar] [CrossRef]
  2. Sheikhzadeh, H.; Hamidian, A.H. Bioaccumulation of heavy metals in fish species of Iran: A review. Environ. Geochem. Health 2021, 43, 3749–3869. [Google Scholar] [CrossRef] [PubMed]
  3. Bashir, I.; Lone, F.A.; Bhat, R.A.; Mir, S.A.; Dar, Z.A.; Dar, S.A. Concerns and Threats of Contamination on Aquatic Ecosystems. In Bioremediation and Biotechnology: Sustainable Approaches to Pollution Degradation; Hakeem, K.R., Bhat, R.A., Qadri, H., Eds.; Springer International Publishing: Cham, Switzerland, 2020; pp. 1–26. [Google Scholar] [CrossRef]
  4. Hama Aziz, K.H.; Mustafa, F.S.; Omer, K.M.; Hama, S.; Hamarawf, R.F.; Rahman, K.O. Heavy metal pollution in the aquatic environment: Efficient and low-cost removal approaches to eliminate their toxicity: A review. RSC Adv. 2023, 13, 17595–17610. [Google Scholar] [CrossRef]
  5. Niu, Y.; Chen, F.; Li, Y.; Ren, B. Trends and Sources of Heavy Metal Pollution in Global River and Lake Sediments from 1970 to 2018. In Reviews of Environmental Contamination and Toxicology; de Voogt, P., Ed.; Springer: Cham, Switzerland, 2020; Volume 257. [Google Scholar] [CrossRef]
  6. Singh, V.; Singh, N.; Rai, S.N.; Kumar, A.; Singh, A.K.; Singh, M.P.; Sahoo, A.; Shekhar, S.; Vamanu, E.; Mishra, V. Heavy Metal Contamination in the Aquatic Ecosystem: Toxicity and Its Remediation Using Eco-Friendly Approaches. Toxics 2023, 11, 147. [Google Scholar] [CrossRef] [PubMed]
  7. Briffa, J.; Sinagra, E.; Blundell, R. Heavy metal pollution in the environment and their toxicological effects on humans. Heliyon 2020, 6, e04691. [Google Scholar] [CrossRef]
  8. Pujari, M.; Kapoor, D. Heavy metals in the ecosystem: Sources and their effects. In Heavy Metals in the Environment; Elsevier: Amsterdam, The Netherlands, 2021; pp. 1–7. [Google Scholar] [CrossRef]
  9. Talib Jawad, S.; Shihab, A.F.; Al-Taher, Q.M. Heavy metal concentrations in water, sediments, Cladophora and two fish species from Al-Masab Alamm River, Al-Nassiriya, Iraq. Casp. J. Environ. Sci. 2022, 20, 805–812. [Google Scholar] [CrossRef]
  10. Łuczyńska, J.; Pietrzak-Fiećko, R.; Purkiewicz, A.; Łuczyński, M.J. Assessment of Fish Quality Based on the Content of Heavy Metals. Int. J. Environ. Res. Public Health 2022, 19, 2307. [Google Scholar] [CrossRef] [PubMed]
  11. Authman, M.M.N.; Zaki, M.S.; Khallaf, E.A.; Abbas, H.H. Use of Fish asBio-indicator of the Effects of Heavy Metals Pollution. J. Aquac. Res. Dev. 2015, 6, 328. [Google Scholar] [CrossRef]
  12. Levin, J.C.; Woodford, D.J.; Snow, G.C. Evaluating the effectiveness of freshwater fishes as bio-indicators for urban impacts in the Crocodile (West) catchment, South Africa. Water SA 2019, 45, 477–486. [Google Scholar] [CrossRef]
  13. Komov, V.T.; Stepanova, I.K.; Gremyachikh, V.A. Mercury content in muscles of fish from water bodies of northwest Russia: Causes of intensive accumulation and assessment of negative effect on human health status. Curr. Probl. Aquat. Toxicol. 2004, 99–123. [Google Scholar]
  14. Golovanova, I.L. Effects of heavy metals on physiological and biochemical status of fishes and aquatic invertebrates. Inland Water Biol. 2008, 1, 93–101. [Google Scholar] [CrossRef]
  15. Shahjahan, M.; Taslima, K.; Shadiqur, R.M.; Al-Emran, M.; Alam, S.I.; Faggio, C. Effects of heavy metals on fish physiology—A review. Chemosphere 2022, 300, 134519. [Google Scholar] [CrossRef] [PubMed]
  16. Popov, P.A.; Androsova, N.V. Indication of the ecological state of Siberian water bodies by the content of heavy metals in fish. Geogr. Nat. Resour. 2008, 3, 36–41. [Google Scholar]
  17. Moiseenko, T.I. Water Ecotoxicology. Theoretical and Applied Aspects; Nauka: Moscow, Russia, 2009; p. 400. [Google Scholar]
  18. Kim, I.N.; Shtanko, T.I. Mercury content in fish products (Literature review). Hyg. Sanit. 2009, 1, 38–42. [Google Scholar]
  19. Rudneva, N.A. Heavy Metals and Trace Elements in Hydrobionts of the Baikal Region; Buryat Scientific Center Press: Ulan-Ude, Russia, 2001; p. 134. [Google Scholar]
  20. Bakhshalizadeh, S.; Liyafoyi, A.R.; Fazio, F.; Mora-Medina, R.; Ayala-Soldado, N. Health risk assessment of heavy metal concentration in muscle of Chelon auratus and Chelon saliens from the southern Caspian Sea. Environ. Geochem. Health 2023, 45, 3377–3385. [Google Scholar] [CrossRef] [PubMed]
  21. Pishchevaya Promyshlennost. Sanitary Rules and Norms SanPiN 2.3.2.560-96 “Hygienic Requirements for the Quality and Safety of Food Raw Materials and Food Products”, Adopted 24 Oct 1996; Pishchevaya Promyshlennost: Moscow, Russia, 1996; p. 202. [Google Scholar]
  22. Kawser Ahmed, M.; Baki, M.A.; Kundu, G.K.; Saiful Islam, M.; Monirul Islam, M.; Muzammel Hossain, M. Human health risks from heavy metals in fish of Buriganga river, Bangladesh. SpringerPlus 2016, 5, 1697. [Google Scholar] [CrossRef] [PubMed]
  23. Ali, M.M.; Ali, M.L.; Bhuyan, M.S.; Islam, M.S.; Rahman, M.Z.; Alam, M.W.; Das, M.; Mustary, S.; Islam, M.N. Spatiotemporal variation and toxicity of trace metals in commercially important fish of the tidal Pasur River in Bangladesh. Environ. Sci. Pollut. Res. Int. 2022, 29, 40131–40145. [Google Scholar] [CrossRef]
  24. Wang, J.; Shan, Q.; Liang, X.; Guan, F.; Zhang, Z.; Huang, H.; Fang, H. Levels and human health risk assessments of heavy metals in fish tissue obtained from the agricultural heritage rice-fish-farming system in China. J. Hazard. Mater. 2020, 386, 121627. [Google Scholar] [CrossRef]
  25. Saleem, M.; Iqbal, J.; Shi, Z.; Garrett, S.H.; Shah, M.H. Distribution and Bioaccumulation of Essential and Toxic Metals in Tissues of Thaila (Catla catla) from a Natural Lake, Pakistan and Its Possible Health Impact on Consumers. J. Mar. Sci. Eng. 2022, 10, 933. [Google Scholar] [CrossRef]
  26. Kayode, J.B. Risk Assessment of Trace Metal Intake through Consumption of Four Fish Species from Upper Region of Barrier Lagoon Coast Waters, Southwest, Nigeria. J. Environ. Pollut. Hum. Health 2021, 9, 16–21. [Google Scholar] [CrossRef]
  27. Fu, Z.; Xi, S. The effects of heavy metals on human metabolism. Toxicol. Mech. Methods 2020, 30, 167–176. [Google Scholar] [CrossRef]
  28. Nyarko, E.; Boateng, C.M.; Asamoah, O.; Edusei, M.O.; Mahu, E. Potential human health risks associated with ingestion of heavy metals through fish consumption in the Gulf of Guinea. Toxicol. Rep. 2023, 10, 117–123. [Google Scholar] [CrossRef] [PubMed]
  29. FAO. Compilation of Legal Limits for Hazardous Substances in Fish and Fishery Products. Fisheries Circular. No. 764. Available online: https://www.fao.org/inland-fisheries/topics/detail/en/c/1150083/ (accessed on 3 September 2023).
  30. Drukker, V.V.; Sorokovikova, L.M.; Sinyukovich, V.N.; Potemkina, T.G.; Nikulina, I.G.; Molozhavaya, O.A.; Korovyakova, I.V. Water quality of the Barguzin River in modern conditions. Geogr. Nat. Resour. 1997, 4, 72–78. [Google Scholar]
  31. Dzyuba, A.A.; Tulokhonov, A.K.; Abidueva, T.I.; Kulagina, N.V.; Chernykh, L.A. Paleogeographic aspects of the formation of saline lakes in the Barguzin depression. Geogr. Nat. Resour. 1999, 2, 66–73. [Google Scholar]
  32. Chernousenkov, G.I.; Pankova, E.I.; Kalinina, N.V.; Ubugunova, V.I.; Rukhovich, D.I.; Ubugunov, V.L.; Tsyrempilov, E.G. Saline soils of the Barguzin depression. Soil Sci. 2017, 6, 652–671. [Google Scholar] [CrossRef]
  33. Sinyukovich, V.N.; Shiretorova, V.G.; Tomberg, I.V.; Sorokovikova, L.M.; Radnaeva, L.D.; Tulokhonov, A.K. Formation of the Ion Composition of the Barguzin River Waters (Lake Baikal Basin) under the Conditions of Saline Landscapes. Dokl. Earth Sci. 2020, 495, 858–861. [Google Scholar] [CrossRef]
  34. Tselyuk, D.I.; Tselyuk, I.N. Technogenic environmental heritage gold mining industry of Eastern Siberia. Explor. Prot. Subsoil 2019, 12, 48–58. [Google Scholar]
  35. Laperdina, T.G. Estimation of mercury and other heavy metal contamination in traditional gold-mining areas of Transbaikalia. Geochem. Explor. Environ. Anal. 2002, 2, 219–223. [Google Scholar] [CrossRef]
  36. U.S. EPA. Microwave Assisted Acid Digestion of Siliceous and Organically Based Matrices. Available online: https://www.epa.gov/sites/default/files/2015-12/documents/3052.pdf (accessed on 6 September 2023).
  37. Bazarzhapov, T.Z.; Shiretorova, V.G.; Radnaeva, L.D.; Nikitina, E.P.; Bazarsadueva, S.V.; Shirapova, G.S.; Dong, S.; Li, Z.; Liu, S.; Wang, P. Distribution of Heavy Metals in Water and Bottom Sediments in the Basin of Lake Gusinoe (Russia): Ecological Risk Assessment. Water 2023, 15, 3385. [Google Scholar] [CrossRef]
  38. Tyutyunnik, O.A.; Getsina, M.L.; Toropchenova, E.S.; Kubrakova, I.V. Microwave preparation of natural samples to the determination of mercury and other toxic elements by atomic absorption spectrometry. J. Anal. Chem. 2013, 68, 377–385. [Google Scholar] [CrossRef]
  39. Dybem, B. Field sampling and preparation subsamples of aquatic organism for analysis metals and organochlorides. FAO Fisher. Tech. 1983, 212, 1–13. [Google Scholar]
  40. Förstner, U. Metal concentrations in freshwater sediments—Natural background and cultural effects. In Interactions between Sediments and Fresh Water, Proceedings of the International Symposium, Amsterdam, The Netherlands, 6–10 September 1976; Springer: Dordrecht, The Netherlands, 1977; pp. 94–103. [Google Scholar]
  41. Hakanson, L. An ecological risk index for aquatic pollution control. A sedimentological approach. Water Res. 1980, 14, 975–1001. [Google Scholar] [CrossRef]
  42. Usero, J.; González-Regalado, E.; Gracia, I. Trace metals in the bivalve molluscs Ruditapes decussatus and Ruditapes philippinarum from the atlantic coast of Southern Spain. Environ. Int. 1997, 23, 291–298. [Google Scholar] [CrossRef]
  43. Abdel-Khalek, A.A.; Elhaddad, E.; Mamdouh, S.; Marie, M.A.S. Assessment of metal pollution around sabal drainage in River Nile and its impacts on bioaccumulation level, metals correlation and human risk hazard using Oreochromis niloticus as a bioindicator. Turk. J. Fish. Aquat. Sci. 2016, 16, 227–239. [Google Scholar] [CrossRef]
  44. Łuczyńska, J.; Paszczyk, B.; Łuczyński, M.J. Fish as a bioindicator of heavy metals pollution in aquatic ecosystem of Pluszne Lake, Poland, and risk assessment for consumer’s health. Ecotoxicol. Environ. Saf. 2018, 153, 60–67. [Google Scholar] [CrossRef]
  45. Datta, S.N.; Kaur, V.I.; Dhawan, A.; Jassal, G. Estimation of length-weight relationship and condition factor of spotted snakehead Channa punctata (Bloch) under different feeding regimes. SpringerPlus 2013, 2, 436. [Google Scholar] [CrossRef] [PubMed]
  46. Ahmed, E.O.; Ali, M.E.; Aziz, A.A.; Rafi, E.M.K. Length-weight relationships and condition factors of five freshwater fish species in Roseires reservoir, Sudan. Eur. J. Phys. Agric. Sci. 2017, 5, 26–33. [Google Scholar]
  47. Gyimah, E.; Akoto, O.; Mensah, J.K.; Bortey-Sam, N. Bioaccumulation factors and multivariate analysis of heavy metals of three edible fish species from the Barekese reservoir in Kumasi, Ghana. Environ. Monit. Assess. 2018, 190, 553. [Google Scholar] [CrossRef]
  48. U.S. EPA. Regional Screening Level (RSL) Summary Table. 2017. Available online: https://www.epa.gov/risk/regional-screening-levels-rsls-generic-tables (accessed on 5 September 2023).
  49. MR 2.3.1.2432-08; Norms of Physiological Needs for Energy and Nutrients for Various Groups of the Population of the Russian Federation (Approved by the Federal Service for Supervision of Consumer Rights Protection and Human Well-Being on July 22, 2021). Chief State Sanitary Physician of the Russian Federation: Moscow, Russia, 2021.
  50. Kowalski, B.R.; Bender, C.F. Pattern recognition. Powerful approach to interpreting chemical data. J. Am. Chem. Soc. 1972, 94, 5632–5639. [Google Scholar] [CrossRef]
  51. Zinoviev, A.Y. Visualization of Multidimensional Data; KSTU Press: Krasnoyarsk, Russia, 2000; p. 180. [Google Scholar]
  52. Esbensen, K. Multivariate Data Analysis; Rodionova, O.E., Ed.; IPSP RAS Press: Chernogolovka, Russia, 2005; p. 160. [Google Scholar]
  53. Urbazaeva, S.D.; Pavlov, I.A.; Bazarsadueva, S.V.; Shiretorova, V.G.; Radnaeva, L.D. Content of heavy metals in water and bottom sediments of the Barguzin river in modern conditions. Nauchnoe Obozr. 2016, 5, 114–121. [Google Scholar]
  54. Bazarzhapov, T.Z.; Shiretorova, V.G.; Radnaeva, L.D.; Suocheng, D.; Tulokhonov, A.K. Chemical composition of surface water in the main tributaries of Lake Baikal—The Selenga and the Barguzin Rivers. IOP Conf. Ser. Earth Environ. Sci. 2019, 320, 012020. [Google Scholar] [CrossRef]
  55. Gagarinova, O.V.; Belozertseva, I.A.; Vorobyeva, I.B.; Vlasova, N.V.; Emelyanova, N.V.; Sorokovoi, A.A. Anthropogenic Transformations in the Mouth Area of Tributaries as Factors of Negative Impact on Lake Baikal. Water 2021, 13, 1295. [Google Scholar] [CrossRef]
  56. Ministry of Natural Resources and Ecology of the Russian Federation. State and Protection of the Environment of the Russian Federation in 2021. Report. 2022. Available online: https://www.mnr.gov.ru/docs/gosudarstvennyy_doklad_o_sostoyanii_i_ob_okhrane_okruzhayushchey_sredy_rossiyskoy_federatsii_v_2021_/ (accessed on 10 October 2023).
  57. MAC. GOST 17.1.2.04-77 Nature Protection. Hydrosphere. Indices of State and Requlation for Valuation Survey of Tisnery Waters. Available online: https://gost.ruscable.ru/Index/33/33538.htm (accessed on 6 September 2023).
  58. Shiretorova, V.G.; Zhigzhitzhapova, S.V.; Dylenova, E.P.; Radnaeva, L.D. Accumulation of heavy metals in aquatic vegetation of the Barguzin River. In Proceedings of the Actual Problems of Ecology and Environmental Management: Cooperation for Sustainable Development and Environmental Safety (APEEM 2020), Moscow, Russia, 23–25 April 2020; pp. 1–4. [Google Scholar]
  59. Iqbal, J.; Shah, M.H. Study of seasonal variations and health risk assessment of heavy metals in Cyprinus carpio from Rawal Lake, Pakistan. Environ. Monit. Assess. 2014, 186, 2025–2037. [Google Scholar] [CrossRef] [PubMed]
  60. Nikolić, D.; Skorić, S.; Janković, S.; Hegediš, A.; Djikanović, V. Age-specific accumulation of toxic metal(loid)s in northern pike (Esox lucius) juveniles. Environ. Monit. Assess. 2021, 193, 229. [Google Scholar] [CrossRef] [PubMed]
  61. Carvalho, M.L.; Santiago, S.; Nunes, M.L. Assessment of the essential element and heavy metal content of edible fish muscle. Anal. Bioanal. Chem. 2005, 382, 426–432. [Google Scholar] [CrossRef] [PubMed]
  62. Yılmaz, A.B.; Sangün, M.K.; Yağlıoğlu, D.; Turan, C. Metals (major, essential to non-essential) composition of the different tissues of three demersal fish species from İskenderun Bay, Turkey. Food Chem. 2010, 123, 410–415. [Google Scholar] [CrossRef]
  63. Erdoğrul, Ö.; Erbilir, F. Heavy Metal and Trace Elements in Various Fish Samples from Sır Dam Lake, Kahramanmaraş, Turkey. Environ. Monit. Assess. 2007, 130, 373–379. [Google Scholar] [CrossRef]
  64. Edelstein, S.; Sharlin, J. Life Cycle Nutrition: An Evidence-Based Approach; Jones and Bartlett Publishers: Sudbury, MA, USA, 2009; p. 517. [Google Scholar]
  65. Yap, C.K.; Al-Mutairi, K.A. Copper and Zinc Levels in Commercial Marine Fish from Setiu, East Coast of Peninsular Malaysia. Toxics 2022, 10, 52. [Google Scholar] [CrossRef]
  66. Arulkumar, A.; Paramasivam, S.; Rajaram, R. Toxic heavy metals in commercially important food fishes collected from Palk Bay, Southeastern India. Mar. Pollut. Bull. 2017, 119, 454–459. [Google Scholar] [CrossRef]
  67. França, S.; Vinagre, C.; Caçador, I.; Cabral, H.N. Heavy metal concentrations in sediment, benthic invertebrates and fish in three salt marsh areas subjected to different pollution loads in the Tagus Estuary (Portugal). Mar. Pollut. Bull. 2005, 50, 998–1003. [Google Scholar] [CrossRef]
  68. U.S. EPA. 600/4-79-020 Methods for Chemical Analysis of Water and Wastes. Available online: https://www.wbdg.org/ffc/epa/criteria/epa-600-4-79-020 (accessed on 3 September 2023).
  69. CEFAS (MAFF). Aquatic Environment Monitoring Report No. 51 “Monitoring and Surveillance of Non-Radioactive Contaminants in the Aquatic Environment and Activities Regulating the Disposal of Wastes at Sea, 1995 and 1996”. Available online: https://www.cefas.co.uk/publications/aquatic/aemr51.pdf (accessed on 3 September 2023).
  70. WHO. Guidelines for Drinking-Water Quality. Vol. 2, Health Criteria and Other Supporting Information, 2nd ed. Available online: https://apps.who.int/iris/handle/10665/38551 (accessed on 3 September 2023).
  71. European Commission. Regulation (EC) No 1881/2006 of 19 December 2006 setting maximum levels for certain contaminants in foodstuffs. Off. J. Eur. Union 2006, 364, 5–24. [Google Scholar]
  72. Anandkumar, A.; Nagarajan, R.; Prabakaran, K.; Rajaram, R. Trace metal dynamics and risk assessment in the commercially important marine shrimp species collected from the Miri coast, Sarawak, East Malaysia. Reg. Stud. Mar. Sci. 2017, 16, 79–88. [Google Scholar] [CrossRef]
  73. Glazunova, I.A. Content and peculiarities of heavy metals distribution in organs and tissues of fish of the Upper Ob. Izv. Altai State Univ. 2007, 3, 20–22. [Google Scholar]
  74. Vaganov, A.S. Comparative characterization of heavy metal content in commercial fish species of the Kuibyshev reservoir. Izv. Altai State Univ. 2011, 13, 143–146. [Google Scholar]
  75. Zubkova, V.M.; Rozumnaya, L.A.; Bolotov, V.P. Heavy metal content in tissues and organs of different fish species of the Volgograd reservoir. Bull. Astrakhan State Tech. Univ. Ser. Fish. 2016, 4, 93–98. [Google Scholar]
  76. Sivaperumal, P.; Sankar, T.V.; Viswanathan Nair, P.G. Heavy metal concentrations in fish, shellfish and fish products from internal markets of India vis-a-vis international standards. Food Chem. 2007, 102, 612–620. [Google Scholar] [CrossRef]
  77. Sengil, I.A.; Ozacar, M.; Türkmenler, H. Kinetic and isotherm studies of Cu(II) biosorption onto valonia tannin resin. J. Hazard. Mater. 2009, 162, 1046–1052. [Google Scholar] [CrossRef] [PubMed]
  78. Eisler, R. Nickel Hazards to Fish, Wildlife, and Invertebrates: A Synoptic Review; US Department of the Interior, US Geological Survey, Patuxent Wildlife Research Center: Prince George’s County, MD, USA, 1998; p. 86.
  79. García-Lestón, J.; Méndez, J.; Pásaro, E.; Laffon, B. Genotoxic effects of lead: An updated review. Environ. Int. 2010, 36, 623–636. [Google Scholar] [CrossRef]
  80. Azizullah, A.; Khattak, M.N.; Richter, P.; Häder, D.P. Water pollution in Pakistan and its impact on public health—A review. Environ. Int. 2011, 37, 479–497. [Google Scholar] [CrossRef]
  81. Rahman, M.S.; Molla, A.H.; Saha, N.; Rahman, A. Study on heavy metals levels and its risk assessment in some edible fishes from Bangshi River, Savar, Dhaka, Bangladesh. Food Chem. 2012, 134, 1847–1854. [Google Scholar] [CrossRef]
  82. Velusamy, A.; Satheesh Kumar, P.; Ram, A.; Chinnadurai, S. Bioaccumulation of heavy metals in commercially important marine fishes from Mumbai Harbor, India. Mar. Pollut. Bull. 2014, 81, 218–224. [Google Scholar] [CrossRef] [PubMed]
  83. Vieira, T.C.; Rodrigues, A.P.d.C.; Amaral, P.M.G.; de Oliveira, D.F.C.; Gonçalves, R.A.; Rodrigues e Silva, C.; Vasques, R.O.; Malm, O.; Silva-Filho, E.V.; Godoy, J.M.d.O.; et al. Evaluation of the bioaccumulation kinetics of toxic metals in fish (A. brasiliensis) and its application on monitoring of coastal ecosystems. Mar. Pollut. Bull. 2020, 151, 110830. [Google Scholar] [CrossRef] [PubMed]
  84. Gumpu, M.B.; Sethuraman, S.; Krishnan, U.M.; Rayappan, J.B.B. A review on detection of heavy metal ions in water—An electrochemical approach. Sens. Actuators B Chem. 2015, 213, 515–533. [Google Scholar] [CrossRef]
  85. Julia, L.B.; Zoltan, S.; Pamela, A.R. Occurrence and Mobility of Mercury in Groundwater, Ch. 5. In Current Perspectives in Contaminant Hydrology and Water Resources Sustainability; Paul, M.B., Ed.; IntechOpen: Rijeka, Croatia, 2013; pp. 117–149. [Google Scholar]
  86. Ullah, A.; Maksud, M.A.; Khan, S.R.; Lutfa, L.N.; Quraishi, S.B. Dietary intake of heavy metals from eight highly consumed species of cultured fish and possible human health risk implications in Bangladesh. Toxicol. Rep. 2017, 4, 574–579. [Google Scholar] [CrossRef] [PubMed]
  87. Sadeghirad, M.; Amini Ranjbar, G.; Jooshideh, H.; Arshad, U. Heavy metal concentrations in the selected tissues of the Persian sturgeon, Acipencer persicus, from the southern coast of the Caspian Sea. Iran. J. Fish. Sci. 2009, 8, 175–184. [Google Scholar] [CrossRef]
  88. Salamat, N.; Khalifi, K.; Movahedinia, A. Health Concerns Related to Consumption of Fish from Anzali Wetland. Clean Soil Air Water 2016, 44, 115–123. [Google Scholar] [CrossRef]
  89. Kucuksezgin, F.; Gonul, L.T.; Tasel, D. Total and inorganic arsenic levels in some marine organisms from Izmir Bay (Eastern Aegean Sea): A risk assessment. Chemosphere 2014, 112, 311–316. [Google Scholar] [CrossRef]
  90. El-Moselhy, K.M.; Othman, A.I.; Abd El-Azem, H.; El-Metwally, M.E.A. Bioaccumulation of heavy metals in some tissues of fish in the Red Sea, Egypt. Egypt. J. Basic Appl. Sci. 2014, 1, 97–105. [Google Scholar] [CrossRef]
  91. Jamil, T.; Lias, K.; Norsila, D.; Syafinaz, N.S. Assessment of Heavy Metal Contamination in Squid (Loligo spp.) Tissues of Kedah-Perlis Waters, Malaysia. Malays. J. Anal. Sci. 2014, 18, 195–203. [Google Scholar]
  92. Zhang, J.; Zhu, L.; Li, F.; Liu, C.; Yang, Z.; Qiu, Z.; Xiao, M. Heavy metals and metalloid distribution in different organs and health risk assessment for edible tissues of fish captured from Honghu Lake. Oncotarget 2017, 8, 101672–101685. [Google Scholar] [CrossRef]
  93. Pintaeva, E.T.; Bazarsadueva, S.V.; Radnaeva, L.D.; Petrov, E.A.; Smirnova, O.G. Content and character of metal accumulation in fish of the Kichera River (a tributary of Lake Baikal). Contemp. Probl. Ecol. 2011, 4, 64–68. [Google Scholar] [CrossRef]
  94. Matveeva, A.Y.; Kutlin, N.G.; Kardapoltseva, D.G.; Mullagalieva, A.T. Influence of anthropogenic load on accumulation of heavy metals in organs and tissues of commercial fishes. Environ. Manag. 2018, 2, 132–136. [Google Scholar]
  95. Farkas, A.; Salánki, J.; Specziár, A. Relation Between Growth and the Heavy Metal Concentration in Organs of Bream Abramis brama L. Populating Lake Balaton. Arch. Environ. Contam. Toxicol. 2002, 43, 236–243. [Google Scholar] [CrossRef] [PubMed]
  96. Janicki, B.; Stanek, M. Distribution of heavy metals in the meat, gills and liver of common bream (Abramis brama L.) caught from Żnińskie Duże Lake (in Poland). J. Elem. 2015, 21, 1141–1150. [Google Scholar] [CrossRef]
  97. Stanek, M.; Dąbrowski, J.; Janicki, B.; Roślewska, A.; Strzelecka, A. Impact of fish species on levels of lead accumulation in the meat of common bream (Abramis brama L.), white bream (Blicca bjoerkna L.) and common bleak (Alburnus alburnus L.) from the Vistula River (Poland). J. Cent. Eur. Agric. 2015, 16, 62–71. [Google Scholar] [CrossRef]
  98. Spodniewska, A.; Barski, D. Concentration of some metals in the muscles of fish from selected lakes of Warmia and Mazury region (Poland). Acta Vet. Brno 2013, 82, 67–71. [Google Scholar] [CrossRef]
  99. Brázová, T.; Torres, J.; Eira, C.; Hanzelová, V.; Miklisová, D.; Šalamún, P. Perch and Its Parasites as Heavy Metal Biomonitors in a Freshwater Environment: The Case Study of the Ružín Water Reservoir, Slovakia. Sensors 2012, 12, 3068–3081. [Google Scholar] [CrossRef]
  100. Popov, P.A.; Androsova, N.V. Heavy metal content in muscle tissue of fish from the water bodies of the Ob river basin. Bull. Tomsk. State Univ. Ser. Biol. 2014, 4, 108–122. [Google Scholar]
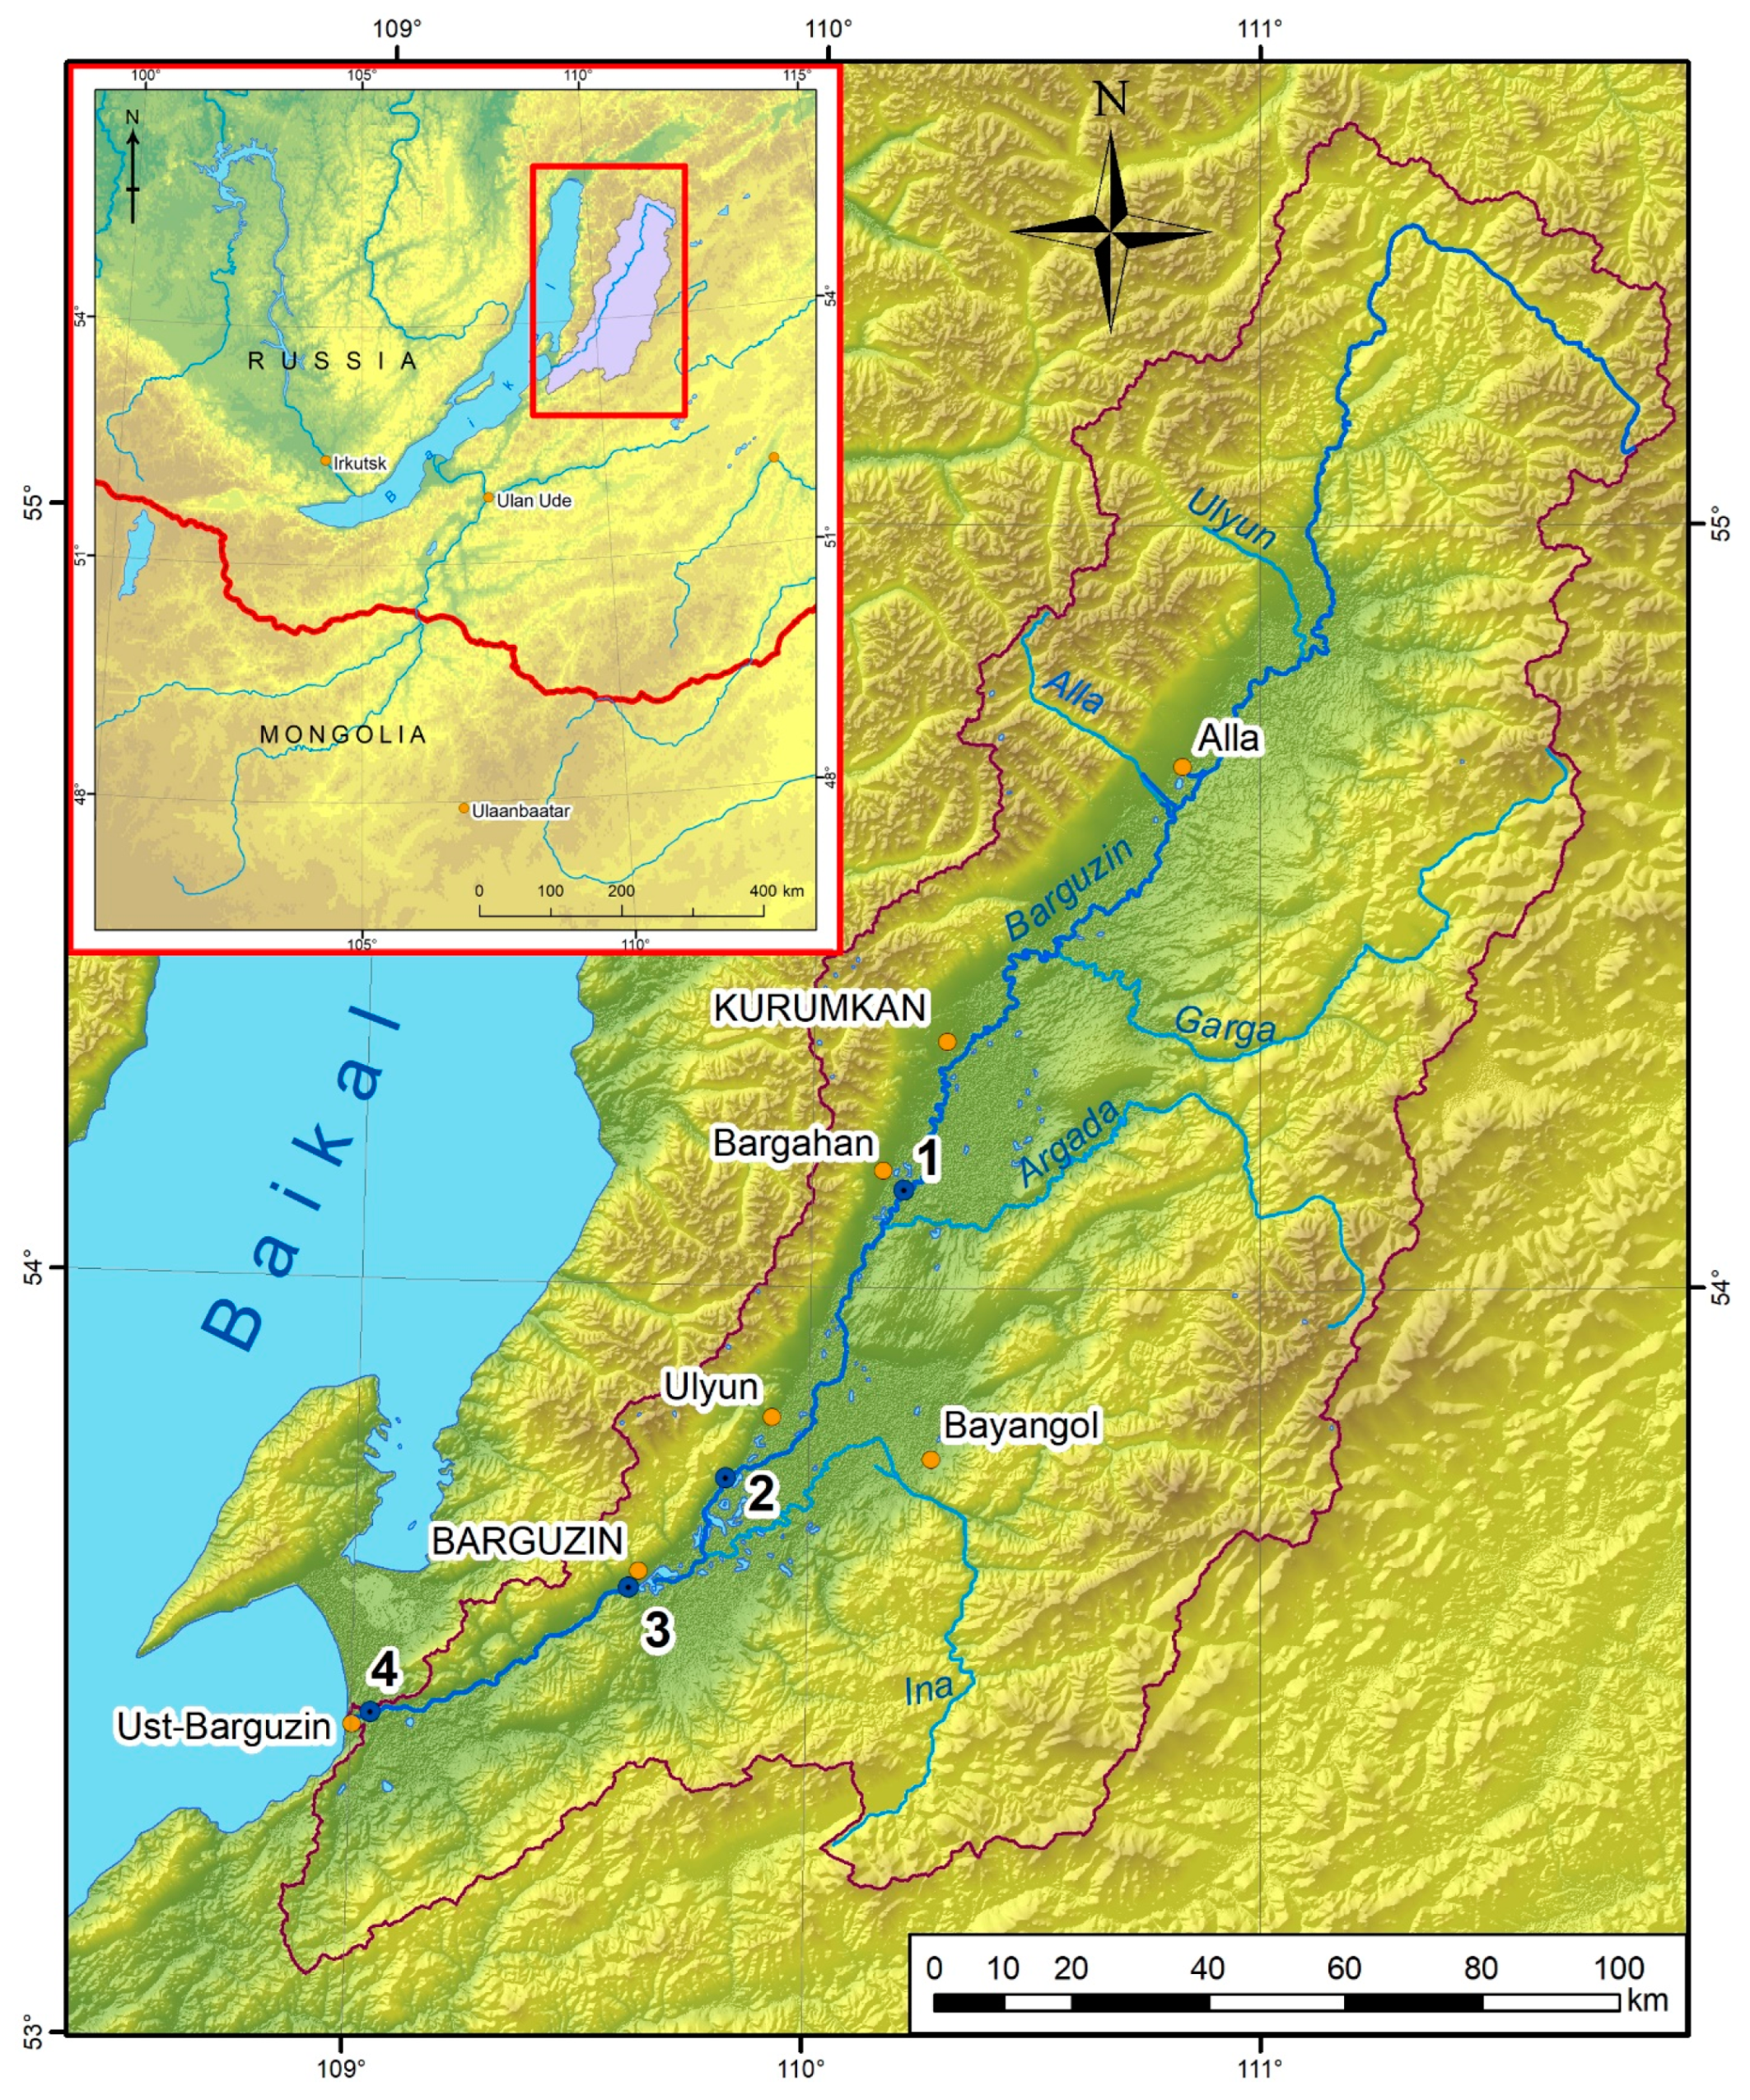
Figure 1. Sampling sites of water, sediments (points 1–4), and fish (points 2–4) in the Barguzin River (Eastern Cisbaikalia).
Water 15 03710 g001
Figure 2. Average content and spatial distribution of HMs in water (a) and sediments (b) of the Barguzin River.
Water 15 03710 g002
Figure 3. Mean heavy metal contents in organs and tissues of Barguzin fish (Fe, Mn, Zn—in column bars of the histogram, other metals—in additional data rows).
Water 15 03710 g003
Figure 4. Levels of (a) iron and (b) zinc in organs and tissues of fish from the Barguzin River.
Water 15 03710 g004
Figure 5. Levels of manganese (a) and chromium (b) in organs and tissues of the Barguzin River fish.
Water 15 03710 g005
Figure 6. Levels of copper content in organs and tissues of the Barguzin River fish.
Water 15 03710 g006
Figure 7. Distribution of fish organs and tissues by HM content (PCA plot).
Water 15 03710 g007
Figure 8. MPI values for organs and tissues of fish from the Barguzin River.
Water 15 03710 g008
Table 1. List of sampling stations.
Station NumberLocation
154°07′37.3″ N 110°12′21.0″ E
253°44′43.8″ N 109°48′53.0″ E
353°36′7.4″ N 109°36′20.0″ E
453°25′20.6″ N 109°1′14.8″ E
Table 2. Results of analysis of standard reference materials (mg/kg d.w.).
ElementDetermining Threshold *Certified BIL-2Measured BIL-2Recovery %Certified ERM®-BB422Measured ERM®-BB422Recovery %
Fe0.437,70034,100929.49.398.6
Mn0.1929885960.3680.35997.5
Zn0.1646510216.016.2101.3
Cu0.0051817941.671.6196.4
Ni0.009312697
Cr0.002158160101
Pb0.004141393
Hg0.0150.6010.56393.6
Notes: * Values for Fe, Mn, Zn—AAS coupled with a flame atomizer; for Cu, Ni, Cr, Pb—AAS coupled with a graphite furnace; for Hg—AAS coupled with a cold vapor generator.
Table 3. The concentrations of HMs in Barguzin water and sediments.
MetalSurface Water, µg/dm3Sediments, mg/kg d.w.CF
MinMaxMeanMACfrMinMaxMeanClark
Fe172027410029,65758,27739,92843,5000.92
Mn2.145181073211799317501.24
Zn1.08.24.11056.410179.81100.73
Cu0.92.11.11.07.827.816.3430.38
Cr1.13.02.12038.561.247.6960.50
Nin.d. *1.21.0104.619.411.7550.21
Hgn.d.n.d.n.d.0.010.0390.0910.0720.300.24
Note: * n.d.—not detected.
Table 4. Biometrics of the fish from the Barguzin River.
Fish SpeciesWeight (g) (W)Total Length (cm) (L)Fish Condition Factor (g/cm3) (K)
MinMaxMeanMinMaxMeanMinMaxMean
Roach26975912.019.516.11.181.601.38
Bream312674.555030.539.036.41.051.231.12
Crucian carp220565.533722.029.024.52.072.412.22
Common carp5482224130931.056.043.01.221.841.51
Perch26763637226.534.029.31.301.621.42
Northern pike 34468754840.050.546.10.480.620.55
Table 6. Target hazard quotient and Hazard index values for muscle tissues of the Barguzin River fish.
MetalRfD *THQ
Northern PikePerchRoachBreamCommon CarpCrucian Carp
Fe7 × 10−10.0200.0090.0150.0090.0090.013
Mn1.4 × 10−10.0080.0050.0090.0060.0050.004
Zn3 × 10−10.0130.0170.0250.0120.0610.042
Cu4 × 10−20.0090.0010.0110.0040.0050.003
Pb2 × 10−3– **0.029
Cd1 × 10−30.0190.0040.019
Ni2 × 10−20.0020.004
Cr3 × 10−30.0450.1130.0580.0420.084
HI0.0500.0770.2230.0930.1220.169
Notes: * Reference doses of HMs, RfD according to USEPA data [48]; ** not detected.
Disclaimer/Publisher’s Note: The statements, opinions and data contained in all publications are solely those of the individual author(s) and contributor(s) and not of MDPI and/or the editor(s). MDPI and/or the editor(s) disclaim responsibility for any injury to people or property resulting from any ideas, methods, instructions or products referred to in the content.